Article

The Response of Alpine Permafrost to Decadal Human Disturbance in the Context of Climate Warming

1
Northwest Institute of Plateau Biology, Chinese Academy of Sciences, Xining 810000, China
2
Institute of Eco-Environment and Resources, Chinese Academy of Sciences, Lanzhou 730000, China
3
University of Chinese Academy of Sciences, Beijing 101408, China
4
Institute for Ecological Research and Pollution Control of Plateau Lakes, Yunan University, Kunming 650500, China
5
Key Laboratory of Eco-hydrology of Inland River Basin, Northwest Institute of Eco-Environment and Resources, Chinese Academy of Sciences, Lanzhou 730000, China
*
Author to whom correspondence should be addressed.
Remote Sens. 2025, 17(20), 3482; https://doi.org/10.3390/rs17203482
Submission received: 12 August 2025 / Revised: 9 October 2025 / Accepted: 13 October 2025 / Published: 19 October 2025

Highlights

What are the main findings?
  • Permafrost in the Muri area responded to human disturbance without significant spatial expansion during 2000–2024.
  • The semi-arid climate, rough terrain, thin root zone and gappy vertical structure underneath were the major factors.
What are the implications of the main findings?
  • Annual ALT estimated from 2000 to 2024 filled the data gap of high-resolution ALT in the Muri area.
  • Knowledge was provided for a better understanding of alpine permafrost development.

Abstract

Alpine permafrost plays a vital role in regional hydrology and ecology. Alpine permafrost is highly sensitive to climate change and human disturbance. The Muri area, which is located in the headwaters of the Datong River, northeast of the Tibetan Plateau, has undergone decadal mining, and the permafrost stability there has attracted substantial concerns. In order to decipher how and to what extent the permafrost in the Muri area has responded to the decadal mining in the context of climate change, daily MODIS land surface temperatures (LSTs) acquired during 2000–2024 were downscaled to 30 m × 30 m. The active layer thickness (ALT)–ground thaw index (DDT) coefficient was derived from in situ ALT measurements. An annual ALT of 30 m × 30 m spatial resolution was subsequently estimated from the downscaled LST for the Muri area using the Stefan equation. Validation of the LST and ALT showed that the root of mean squared error (RMSE) and the mean absolute error (MAE) of the downscaled LST were 3.64 °C and −0.1 °C, respectively. The RMSE and MAE of the ALT estimated in this study were 0.5 m and −0.25 m, respectively. Spatiotemporal analysis of the downscaled LST and ALT found that (1) during 2000–2024, the downscaled LST and estimated ALT delineated the spatial extent and time of human disturbance to permafrost in the Muri area; (2) human disturbance (i.e., mining and replantation) caused ALT increase without significant spatial expansion; and (3) the semi-arid climate, rough terrain, thin root zone and gappy vertical structure beneath were the major controlling factors of ALT variations. ALT, estimated in this study with a high resolution and accuracy, filled the data gaps of this kind for the Muri area. The ALT variations depicted in this study provide references for understanding alpine permafrost evolution in other areas that have been subject to human disturbance and climate change.

1. Introduction

Alpine permafrost, which is largely present at the headwaters of many large rivers of the world, plays a vital role in regional hydrology [1,2,3,4], closely intersects with local ecology and affects regional ecology [5,6,7]. However, climate change and increasingly intensive human activities (e.g., mining and replantation) in recent decades have largely altered the global and regional heat fluxes and thermal conditions of permafrost [8,9]. These changes have further affected local permafrost stability, hydrological processes and carbon stock [2,10,11,12]. Therefore, in the context of warming permafrost, understanding how and to what extent alpine permafrost has responded to human disturbance is critical for maintaining sustainable regional hydrology and ecology.
ALT, the maximum thickness of thawed soil/ground above permafrost in a year, is a major index of permafrost stability. ALT is the cumulative result of heat transmitting from the air/sun towards permafrost over a year [13]. Various endeavors have been devoted to obtaining ALT. In situ measurements of permafrost thermal conditions in a borehole or the maximum thawing depths of an evacuated pit have been important and long-used ALT acquisition approaches. However, the remote location and vast distribution of permafrost and the hostile working environments of permafrost areas (i.e., high elevation and low temperature) limited in situ ALT measurements to local point-like sites of relatively easy access. For example, ALT data was collected much more along the Qinghai–Tibet railway/highway than in any other area of the Tibetan Plateau [14,15,16,17]. Embedding observed or simulated air temperature or ground temperature into analytical models like the Stefan equation and numerical systems like GIPL2 can yield a spatially distributed ALT [11,18,19,20,21,22]. However, numeric models like GIPL2 require many variables, which are often unavailable for permafrost areas due to their remote locations. In contrast, analytical models like the Stefan equation require few variables and are relatively easy to implement [18]. Therefore, considering human activities are often at the scale of a few kilometers or even smaller, ground thermal data of a high spatiotemporal resolution is key to investigating the impact of human disturbance on alpine permafrost when using the Stefan equation.
Remote-sensing missions designed with thermal bands (e.g., MODIS and AVHRR) can capture land surface thermal conditions and have provided substantial reliable LST data. These data have been widely used to investigate spatiotemporal variations in permafrost in many areas [22,23,24]. ALTs were also estimated from remotely sensed LSTs according to the Stefan equation and its variants [25,26]. However, the coarse resolution of these remotely sensed LSTs for ALT estimates has limited the permafrost investigation to large regions like the entire Tibetan Plateau and the Arctic Circle [26].
Spatial downscaling uses the variables–dependent variable relationship constructed to derive high-resolution data from the one of a coarse resolution, with the assistance of variables of high resolution. This approach has proven effective for deriving high-resolution data like soil moisture and LST [27,28]. Recently, machine learning algorithms (e.g., random forest), which express the variables–dependent variable relation in a series of model sets based on numerous statistical samples of variables–dependent variable pairs, have improved the accuracy of spatial downscaling [29,30,31]. Therefore, downscaling remotely sensed LSTs of coarse resolution has high potential for supporting high-resolution ALT estimation and investigating the permafrost response to human disturbance.
The Muri area is located in the headwater area of the Datong River, which is a major tributary of the Yellow River. The Muri area is vastly covered by alpine permafrost. Since 2005, the area has undergone intensive mining and replantation. Given the vital role of Datong River in regional water supply, the permafrost stability in the Muri area has attracted enormous attention. Therefore, this study targeted the response of alpine permafrost in the Muri area to human disturbance in the context of climate change. The daily MODIS LST of 1 km × 1 km spatial resolution acquired during 2000–2024 was downscaled to 30 m × 30 m using a random forest algorithm. Based on the downscaled LST, ALT covering the Muri area was estimated with the spatial resolution of 30 m × 30 m for 2002–2024. The spatiotemporal response of permafrost to human disturbance was investigated in terms of LST and ALT. The output of this study was expected to support a better understanding of the alpine permafrost variations under the combined effect of decadal human disturbance and climate change.

2. Materials and Methods

2.1. Study Area

The Muri area is located in the headwater area of the Datong River, a tributary of the Yellow River originating from northeast of the Tibetan Plateau (Figure 1B). In the Muri area, air temperature (Tair) and precipitation (P) are synchronized with pronounced seasonality. Tair and P in the Muri area exhibit their respective monthly maxima of 5 °C and 128 mm in August (Figure 1A). The Muri area is characterized by a vast alpine meadow and permafrost underneath (Figure 1C). Thus, it serves as a critical water reserve for the Yellow River and a vital ecological zone for northern China. Due to the cold and semi-arid climate, the alpine meadow and soil in the study area develop very slowly. Therefore, the soil layer has remained very thin, and both permafrost and alpine meadow in the Muri area are vulnerable to climate change and human disturbance. However, since the 2000s, the Muri area has undergone intensive and uncontrolled mining for coal, mostly in the two areas named Juhugeng (JHG) and Jiangcang (JC) (Figure 1D,E). The long-term uncontrolled mining formed multiple pits of approximately 1 km × 2 km size and up to 300 m deep, and waste dump heaps of similar sizes (Figure 1D,E). Meanwhile, extensive construction, paving and coal piling have also taken place. Since 2014, when mining was abolished, a series of intensive replanting actions have been conducted. Therefore, the permafrost stability, water supply sustainability and ecological vulnerability of the Muri area have attracted increasing attention and concerns, considering the intensive human disturbance and the changing climate.

2.2. Data

2.2.1. MODIS LST and Normalized Difference in Vegetation Index (NDVI)

A MODIS/Aqua Land Surface Temperature 5-Min L2 Swath 1 km Version 6.1 product (i.e., MOD11 L2 and MYD11 L2) covered the study area daily from 2000-01-01 to 2024-12-31. Each MOD11 L2 and MYD L2 dataset contained the LST, quality control assessment, LST errors, emissivity at bands 31 and 32, zenith angle of the pixel view, observation time and the geographic coordinates for every five scan lines and samples [32]. The spatial resolution of this data was 1 km × 1 km at the equator.
MODIS09GQ (i.e., MOD09GQ and MYD09GQ) and MODIS09GA (i.e., MOD09GA and MYD09GA) expressed real-time land surface reflectance at the spatial resolutions of 250 m × 250 m and 1 km × 1 km, respectively. The 250 m Reflectance Band Quality delivered in each set of MODIS09GQ data indicated the quality of land surface reflectance of each band in the data on the instrumental level. The reflectance data state delivered in each MODIS09GA indicated the cloud coverage and snow/ice presence at the spatial resolution of 1 km × 1 km. In this study, MODIS 09GQ and MODIS 09GA in Collection 6.1 were used to derive a daily NDVI for the study area. In total, 17,132 scenes of MODIS 09GQ products and 17,385 scenes of MODIS 09GA products were obtained to cover the study area from 2000-01-01 to 2024-12-31.

2.2.2. Landsat

Images in the Landsat Level-2 Collection 2 were used to provide the LST and derive the NDVI for the study area from 2000 to 2024. The LSTs from Landsat Level-2 Collection 2 were derived using the Single Channel Landsat Surface Temperature Algorithm from the TOA thermal band image acquired by TM and ETM+ at the wavelength of 10.40–12.5 μm (i.e., Band 6) and by OLI at the wavelength of 10.60–11.19 μm (i.e., Band 10) [33,34]. In total, 485 datasets were acquired by Landsat 5, 7, 8 and 9 at the path/row of 134/34 from 2000-01-01 to 2024-12-31 covering the study area. The QA_PIXEL file in each Landsat dataset indicated the pixel-wise surface reflectance quality of the corresponding dataset. The LST_QA file in each Landsat dataset indicated the pixel-wise error in the corresponding LST product.

2.2.3. DEMs

Two DEM products were used in this study, namely, TanDEM-X 30 m Edited DEM and SRTM DEM 1 arc-seconds. The two were used to derive the 3D features in the mine area (i.e., mine pits and waste dump heaps) and to assist in downscaling MODIS NDVI and MODIS LST.
SRTM DEM was obtained in the SRTM mission from the SAR image pairs acquired with two C-band (wavelength of 5.6 cm) SAR sensors mounted on a mast of 60 m in February 2000 [35]. The SRTM DEM 1 arc-second covers 60°N–55°S of the Earth. The spatial resolution of this DEM was equivalent to 30 m at the equator. The absolute vertical accuracy of SRTM DEM was 20 m [36].
TanDEM-X 30 m Edited DEM was a global DEM product upscaled from TanDEM-X global DEM 12 m, which was derived from the SAR images acquired in the bistatic mode with the spatial baseline of 200–1000 m during 2011–2016 [37]. TanDEM-X 30 m Edited DEM was delivered at the spatial resolution equivalent to 30 m at the equator, and its absolute and relative vertical accuracy were 10 m and 2 m, respectively [38].

2.2.4. In Situ Data

During 2009–2016, ALT were measured in situ at 33 sites distributed at different locations of the study area [39,40,41]. Most of these in situ ALT measurements were taken near the roads along the river channels. The land cover at those in situ ALT measurements was mostly alpine steppe (Figure S1). Each of the ALT measurements was taken by a series of thermometers distributed along a vertical profile in individual pits or by measuring the frozen depths of the evacuated outcrops. These ALTs measured in situ ranged from 0.9 to 2.5 m. For further details on these measurements, refer to [39,40,41].
In addition, Tair and P were observed daily in JHG from 2016 to 2022.

2.3. Method

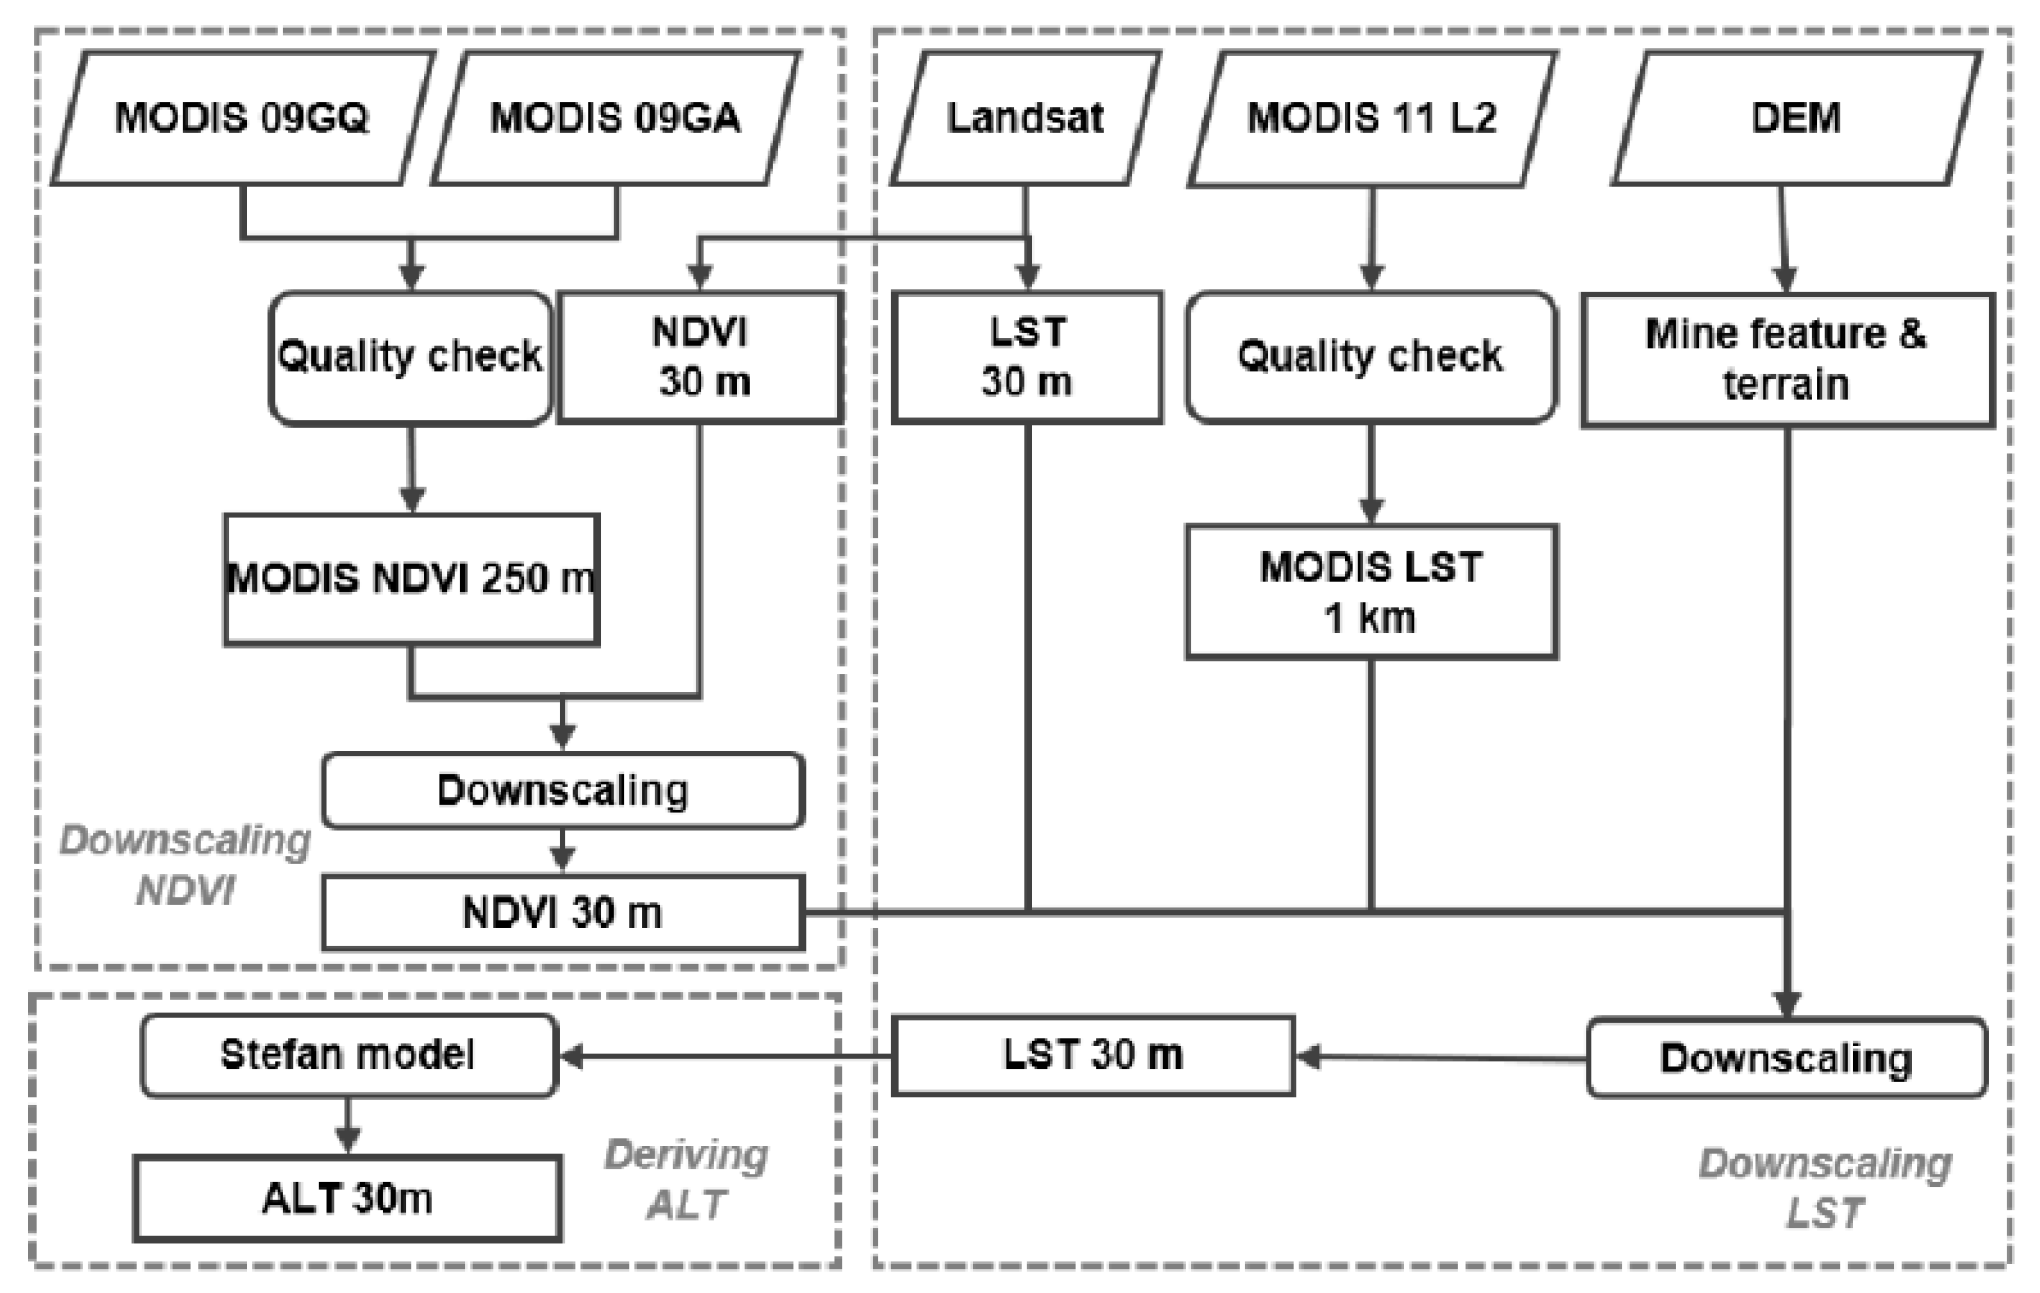
The data processing in this study consisted of MODIS NDVI downscaling, MODIS LST downscaling and ALT derivation (Figure 2).

2.3.1. Preprocessing MODIS and Landsat Data

According to [32], MODIS LST and LST error, which were initially delivered in digital number, were scaled to Kelvin with the coefficients of 0.0001 and 0.02. On each MODIS LST swath, only the pixels whose LST errors were smaller than 2 Kelvin were regarded valid. Subsequently, the LST products acquired by the two satellites Terra and Aqua (i.e., MOD11 L2 and MYD11 L2) during 10:00–14:00 were aggregated daily as the daytime LST. Meanwhile, MOD11 L2 and MYD11 L2 data acquired during 22:00–02:00 were aggregated daily as the nighttime LST. Subsequently, the daily diurnal LST differences were derived by subtracting the nighttime LST from the daytime LST.
A daily NDVI of spatial resolution 250 m × 250 m was derived from band 1 (620–670 nm) and band 2 (841–876 nm) of MODIS09GQ. Prior to the NDVI derivation, the pixels affected by cloud were masked off the MODIS09GQ bands 1 and 2 with the quality flag delivered in the corresponding MODIS09GA product. During the NDVI derivation, only the MODIS09GQ pixels that were labeled as the highest quality in both band 1 and band 2 and were indicated as no cloud/cloud shadow and no snow/ice in the corresponding MODIS09GA product were used.
Landsat LST products re initially delivered in digital numbers were converted to degrees Celsius (°C) according to [33]. In this study, only the Landsat LST pixels with no cloud coverage and whose errors were less than 2 °C were used. The NDVI of spatial resolution 30 m × 30 m was also calculated from the NIR band and the red band of each Landsat image.

2.3.2. Downscaling MODIS NDVI and LST

Random forest is a proven robust machine learning algorithm, and it has often been used to downscale data of coarse resolution [30,42,43]. A random forest model contains a number of trees (Ntree), with each of the trees further splitting at the nodes to a number of leaves (Mtry) [44]. Each tree expresses the relationship between Mtry independent variables (e.g., Landsat LST) and the dependent variable (i.e., MODIS LST) in the form of nodes and leaves in a subset of training samples. Each tree in a random forest model is built independently based on a bootstrapped subset of randomly selected training samples [44]. The forest construction ends when the number of trees grows to a user-defined threshold, i.e., Ntree [45].
The preliminary 3D features (i.e., mine pits and waste dump heaps) were derived by subtracting SRTM DEM 1 arc-second from TanDEM-X Edited 30 m DEM, to assist the downscaling of MODIS LST and MODIS NDVI. Prior to the 3D feature derivation, the geoid model EMG 1986, which was obtained from NASA’s Crustal Dynamics Data Information System (https://cddis.nasa.gov/926/egm96/egm96.html) (accessed on 12 October 2025), was resampled to SRTM DEM 1 arc-second and subtracted from the latter. Among the preliminary 3D features derived above, only those that were larger than 10 pixels and whose absolute height was larger than 10 m were regarded valid and used.
Truth data were extensively collected on the 3D features and in areas of varying distance from the 3D features for downscaling of MODIS NDVI and MODIS LST. Overall, 1188 sites were determined for truth data collection, covering lakes, mine pits of different depths, waste dump heaps of different heights, areas replanted at different times, river plains and channels in different reaches and undisturbed meadow.
The NDVI and local terrain are proven key variables that determine LST variation [46]. There were remarkable seasonal and multi-year variations in the NDVI and LST in the Muri area. Therefore, MODIS LST downscaling used the Julian day of the year (DOY), year (YY), MODIS NDVI, SRTM DEM 1 arc-second, aspect, slope and heights of the 3D features. Slope and aspect were derived from the SRTM DEM 1 arc-second. In order to ensure the largest overlapping between MODIS NDVI and MODIS LST, MODIS LST downscaling used the 7-day NDVI aggregate with each day matching the targeted MODIS LST in the middle. Prior to MODIS LST downscaling, the MODIS NDVI was downscaled to 30 m × 30 m using a random forest model constructed based on the Landsat NDVI and the MODIS NDVI, SRMT DEM, 3D features, DOY and YY.
The size of the truth dataset for MODIS LST downscaling was 1,188,134, and the size of the truth dataset for MODIS NDVI downscaling was 1,172,160. For the downscaling of MODIS LST and MODIS NDVI, 2/3 of their own respective truth dataset was used to train the respective downscaling models, and the remaining 1/3 was used to validate the corresponding models. Both random forest models contained 150 trees (Ntree = 150) of the leaf size of three (Mtry = 3). In addition, the importance of each variable in the random forest models was also derived. The importance of a variable Xm was determined by the mean decrease in accuracy (MDA) of the random forest model, with this variable Xm permuted from the training samples [45]. Therefore, the importance of the variable Xm in a random forest model indicated its contributions/relevance to the model. For each variable, the importance was derived independently.

2.3.3. Deriving ALT

In this study, ALT was estimated according to the Stefan equation. The Stefan equation requires parameters such as thermal conductivity of the soil, soil bulk density and soil water content [47] (Equation (1)). The ground thaw index (DDTs), which is the major parameter required in the Stefan equation, can be derived from remote sensing or in situ measurement of the local thermal condition. Therefore, the Stefan equation has been widely used for ALT estimates over the Northern Hemisphere [19,48] and Tibetan Plateau [18].
A L T = 2 k t D D T s ρ b w l
where k t is the ground thermal conductivity in a thawed state (unit: W/(m °C)); ρ b is the soil bulk density (unit: g/cm3); w is the soil water content by weight; l is the latent heat of fusion (unit: J/kg); and D D T s is the sum of daily temperature above zero in a year (unit: °C).
Reference [49] further simplified the Stefan equation into Equation (2). The simplified Stefan equation was used to calculate the ALT at various spatial resolutions and temporal scales, and it has been proven effective [11,26,50].
A L T = E I D D T s
where coefficient E I wraps all soil properties in Equation (1). In this study, EI was derived by combining the ALT measured in situ and the co-located D D T s . D D T s was calculated from the daily mean LST according to Equation (3).
D D T s = i = 0 n T ,           n 1 , 365   & T > 0
The ALT was derived both for the MODIS LST and the downscaled LST using the Stefan equation. Cloud coverage can cause spatial gaps in individual daily MODIS LST, which could be further passed onto the downscaled LST. Therefore, prior to the ALT derivation, these spatial gaps were filled. To do so, a gapped pixel in the MODIS LST of an individual day was attributed with the average of the MODIS LST at this pixel from the seven neighboring days, three before and three after the targeted day. Subsequently, the daily mean LST of each pixel was obtained by subtracting ½ of the monthly mean diurnal LST difference at this pixel LST from the targeted daily daytime LST pixel. Daily mean LSTs were derived both for the downscaled LST and MODIS LST.

2.3.4. Determining ALT-DDT Coefficient

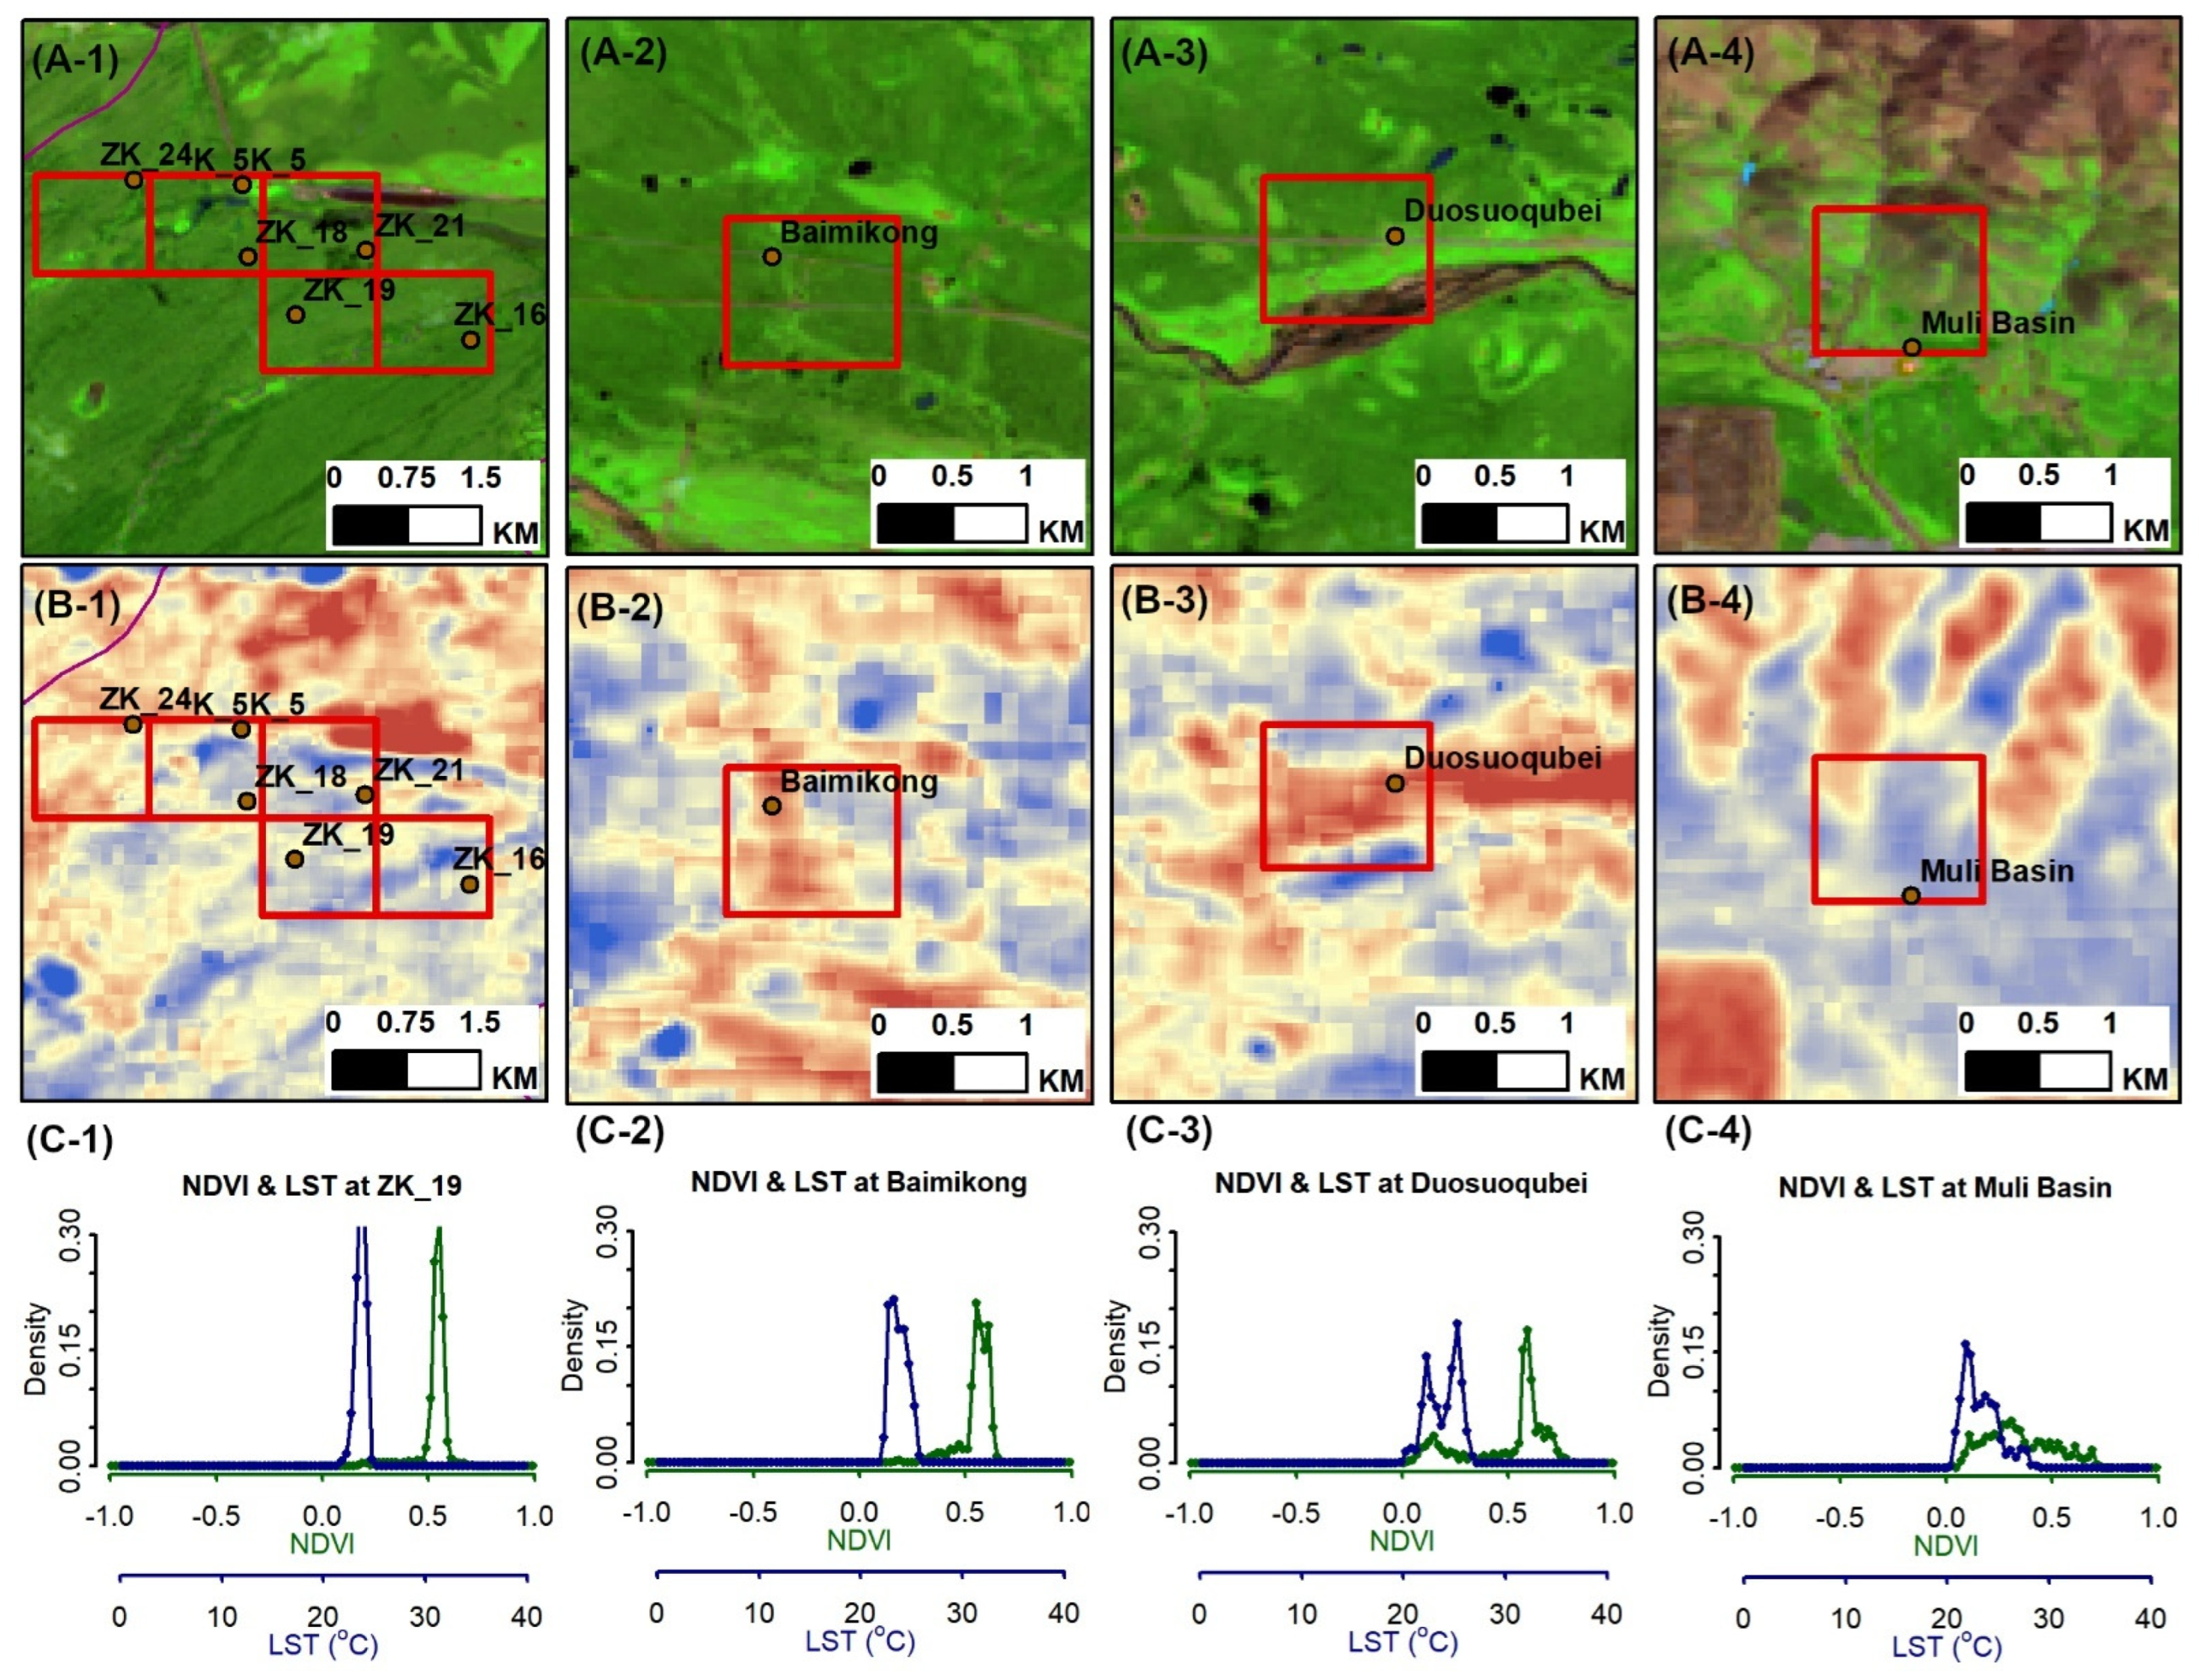
Among all the available in situ ALT measurements, only these that met the following criteria were used to determine the DDT-ALT coefficient (i.e., EI in Equation (2)): (1) the ALT measurement was conducted on the natural alpine steppe, not on degraded steppe (Figure 3(A-1,A-2)); (2) the ALT measurement was taken in a locally homogeneous area. Specifically, in the windows for homogeneity determination for the targeted in situ measurement, NDVI and LST captured by Landsat 8 satellite on the day 2022-07-05 showed minimum standard deviation and a normal distribution. This was to eliminate any distortion to the local ALT by nearby rivers or ponds/lakes (Figure 3(C-1,C-2)). The day 2022-07-05 was selected as it was a typical summer day after decadal climate warming and human disturbance, and vegetation, LST and their spatial heterogeneity were expected to reach maxima (Figure 3). In addition, this image was one with the smallest cloud coverage, and nearly all in situ measurements were free of cloud coverage (Figure 3(A-1–A-4)). The windows for homogeneity determination were inherited from MODIS LST pixels overlapping with these in situ measurements, and their sizes were equivalent to the MODIS LST pixel size, i.e., 1 km × 1 km.
Out of the 33 in situ ALT measurements, only 12 met the aforementioned criteria. Typical examples were those in Figure 3(A-1,B-1,C-1,A-2,B-2,C-2). Typical examples of the ALT measures that did not meet the criteria were the remaining two in Figure 3. The ALT measurements that did not meet aforementioned criteria were often measured in areas of heterogenous thermal conditions and land cover, such as near river channels. Those ALT measurements were used to validate the ALT estimated from LST in this study.
The ALT-DDT coefficients derived with each in situ ALT measurement were averaged over the entire study area and further used to derive the ALT from MODIS LST and the downscaled LST for the study area from 2000 to 2024.
Errors in the ALT estimated from LST were further calculated based on the quality of the ALT–DDT coefficient (i.e., EI) and that of the LST used (i.e., MODIS LST and the downscaled LST) according to Equation (4).
E A L T ,   i = N i E L S T ,   i 1 p L S T ,   i N i E E I ,       i ( 1 p E I , i )
where E A L T ,   i is the error of the ALT calculated for individual pixel i according to Equation (4); N i is the number of days when LST is above zero at the pixel i in each year; and E L S T , i is the error of the LST at pixel i . For MODIS LST, E L S T , i was delivered together with the LST product. For the downscaled LST, E L S T , i was determined by LST downscaling as RMSE; p L S T ,   i is the confidence level of E L S T ,   i , whose value is 0.05 according to the definition of RMSE; E E I , i is the RMSE of EI, derived by combining in situ ALT measurements and DDT of a corresponding resolution, e.g., 30 m; a n d   p E I , i is the confidence level of E E I , i , derived in the same manner as p L S T , i .

3. Results

3.1. Quality of Downscaling Models

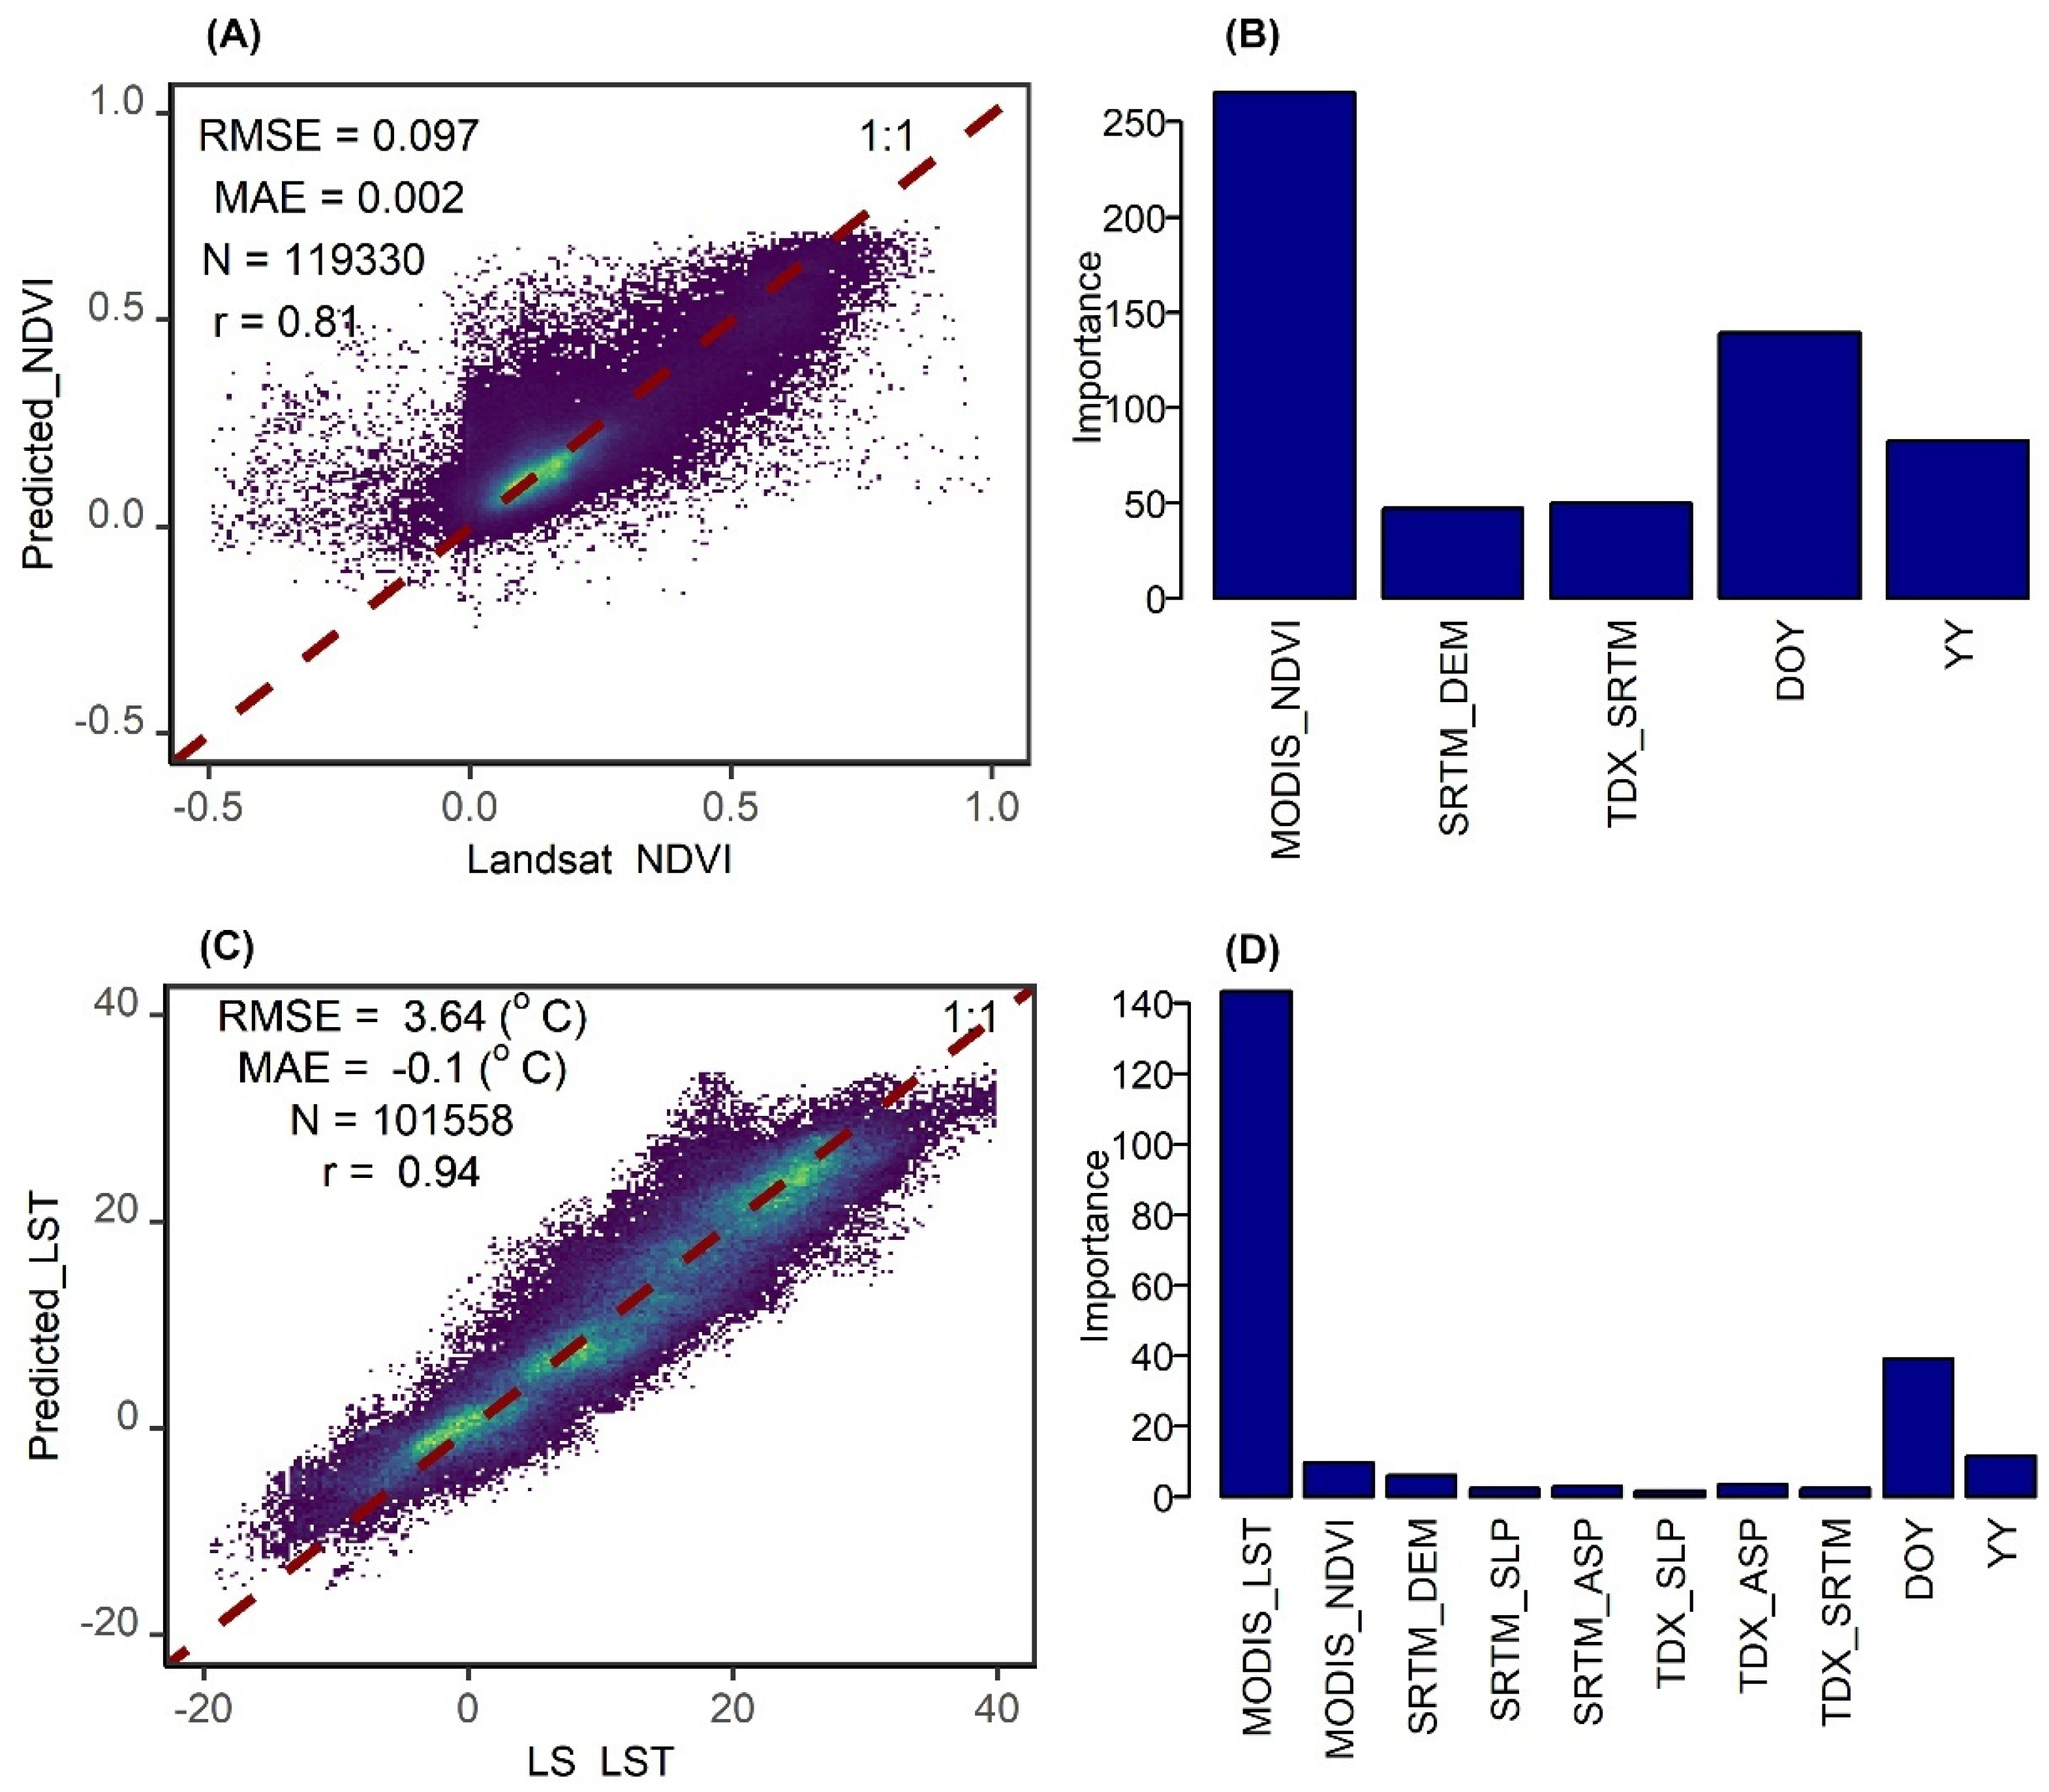
Cross-validation of the downscaled NDVI yielded an RMSE and MAE of 0.097 and 0.002 °C, respectively. Both Landsat NDVI and the downscaled LST were closely distributed along the 1:1 line, and their values were mostly between 0.0 and 0.8 (Figure 4A). MODIS NDVI and DOY were the most important variables in the random forest model for NDVI downscaling (Figure 4B).
Cross-validation of the downscaled LST yielded an RMSE of 3.64 °C and MAE of −0.1 °C, respectively (Figure 4C). LST in the Muri area ranged between −20 °C and 40 °C. Both Landsat LST and the downscaled LST were closely distributed along the 1:1 line (Figure 4A). The nine variables exhibited varying importance in the random forest model for MODIS LST downscaling, with MODIS LST, DOY, YY and NDVI showing much higher importance than elevation, slope and aspect (Figure 4D).

3.2. Comparison of Landsat LST, MODIS LST and Downscaled LST

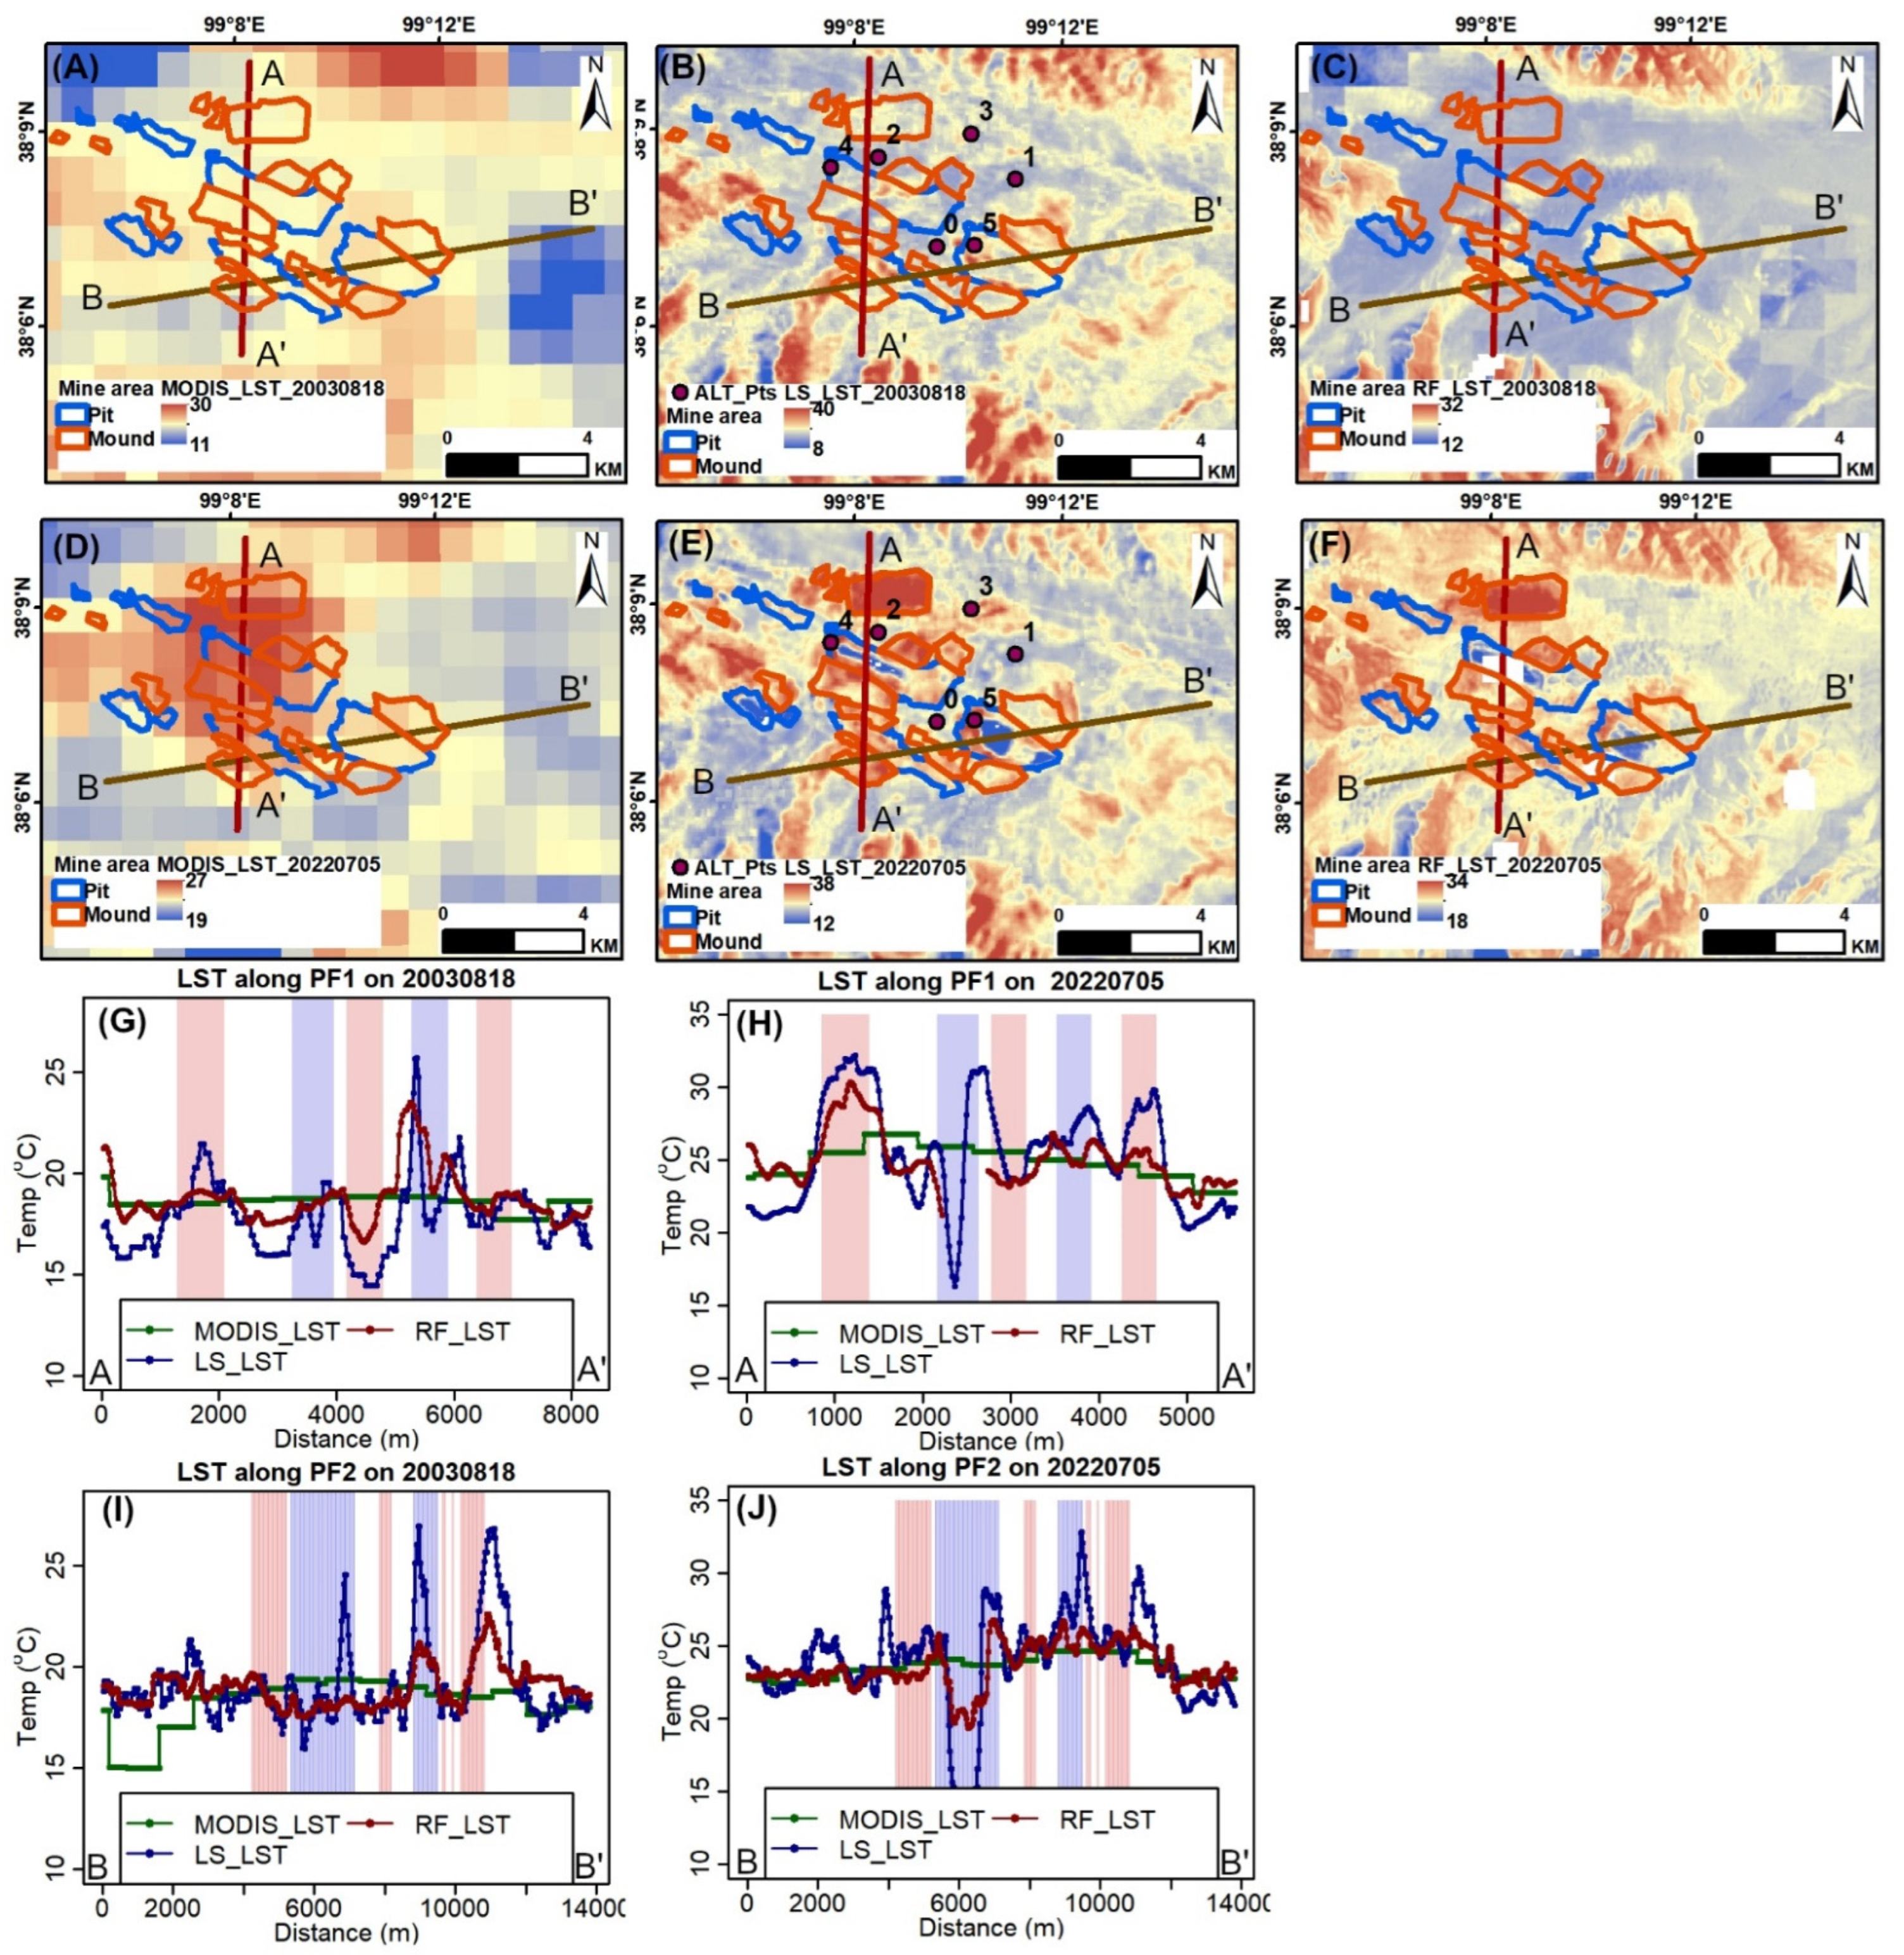
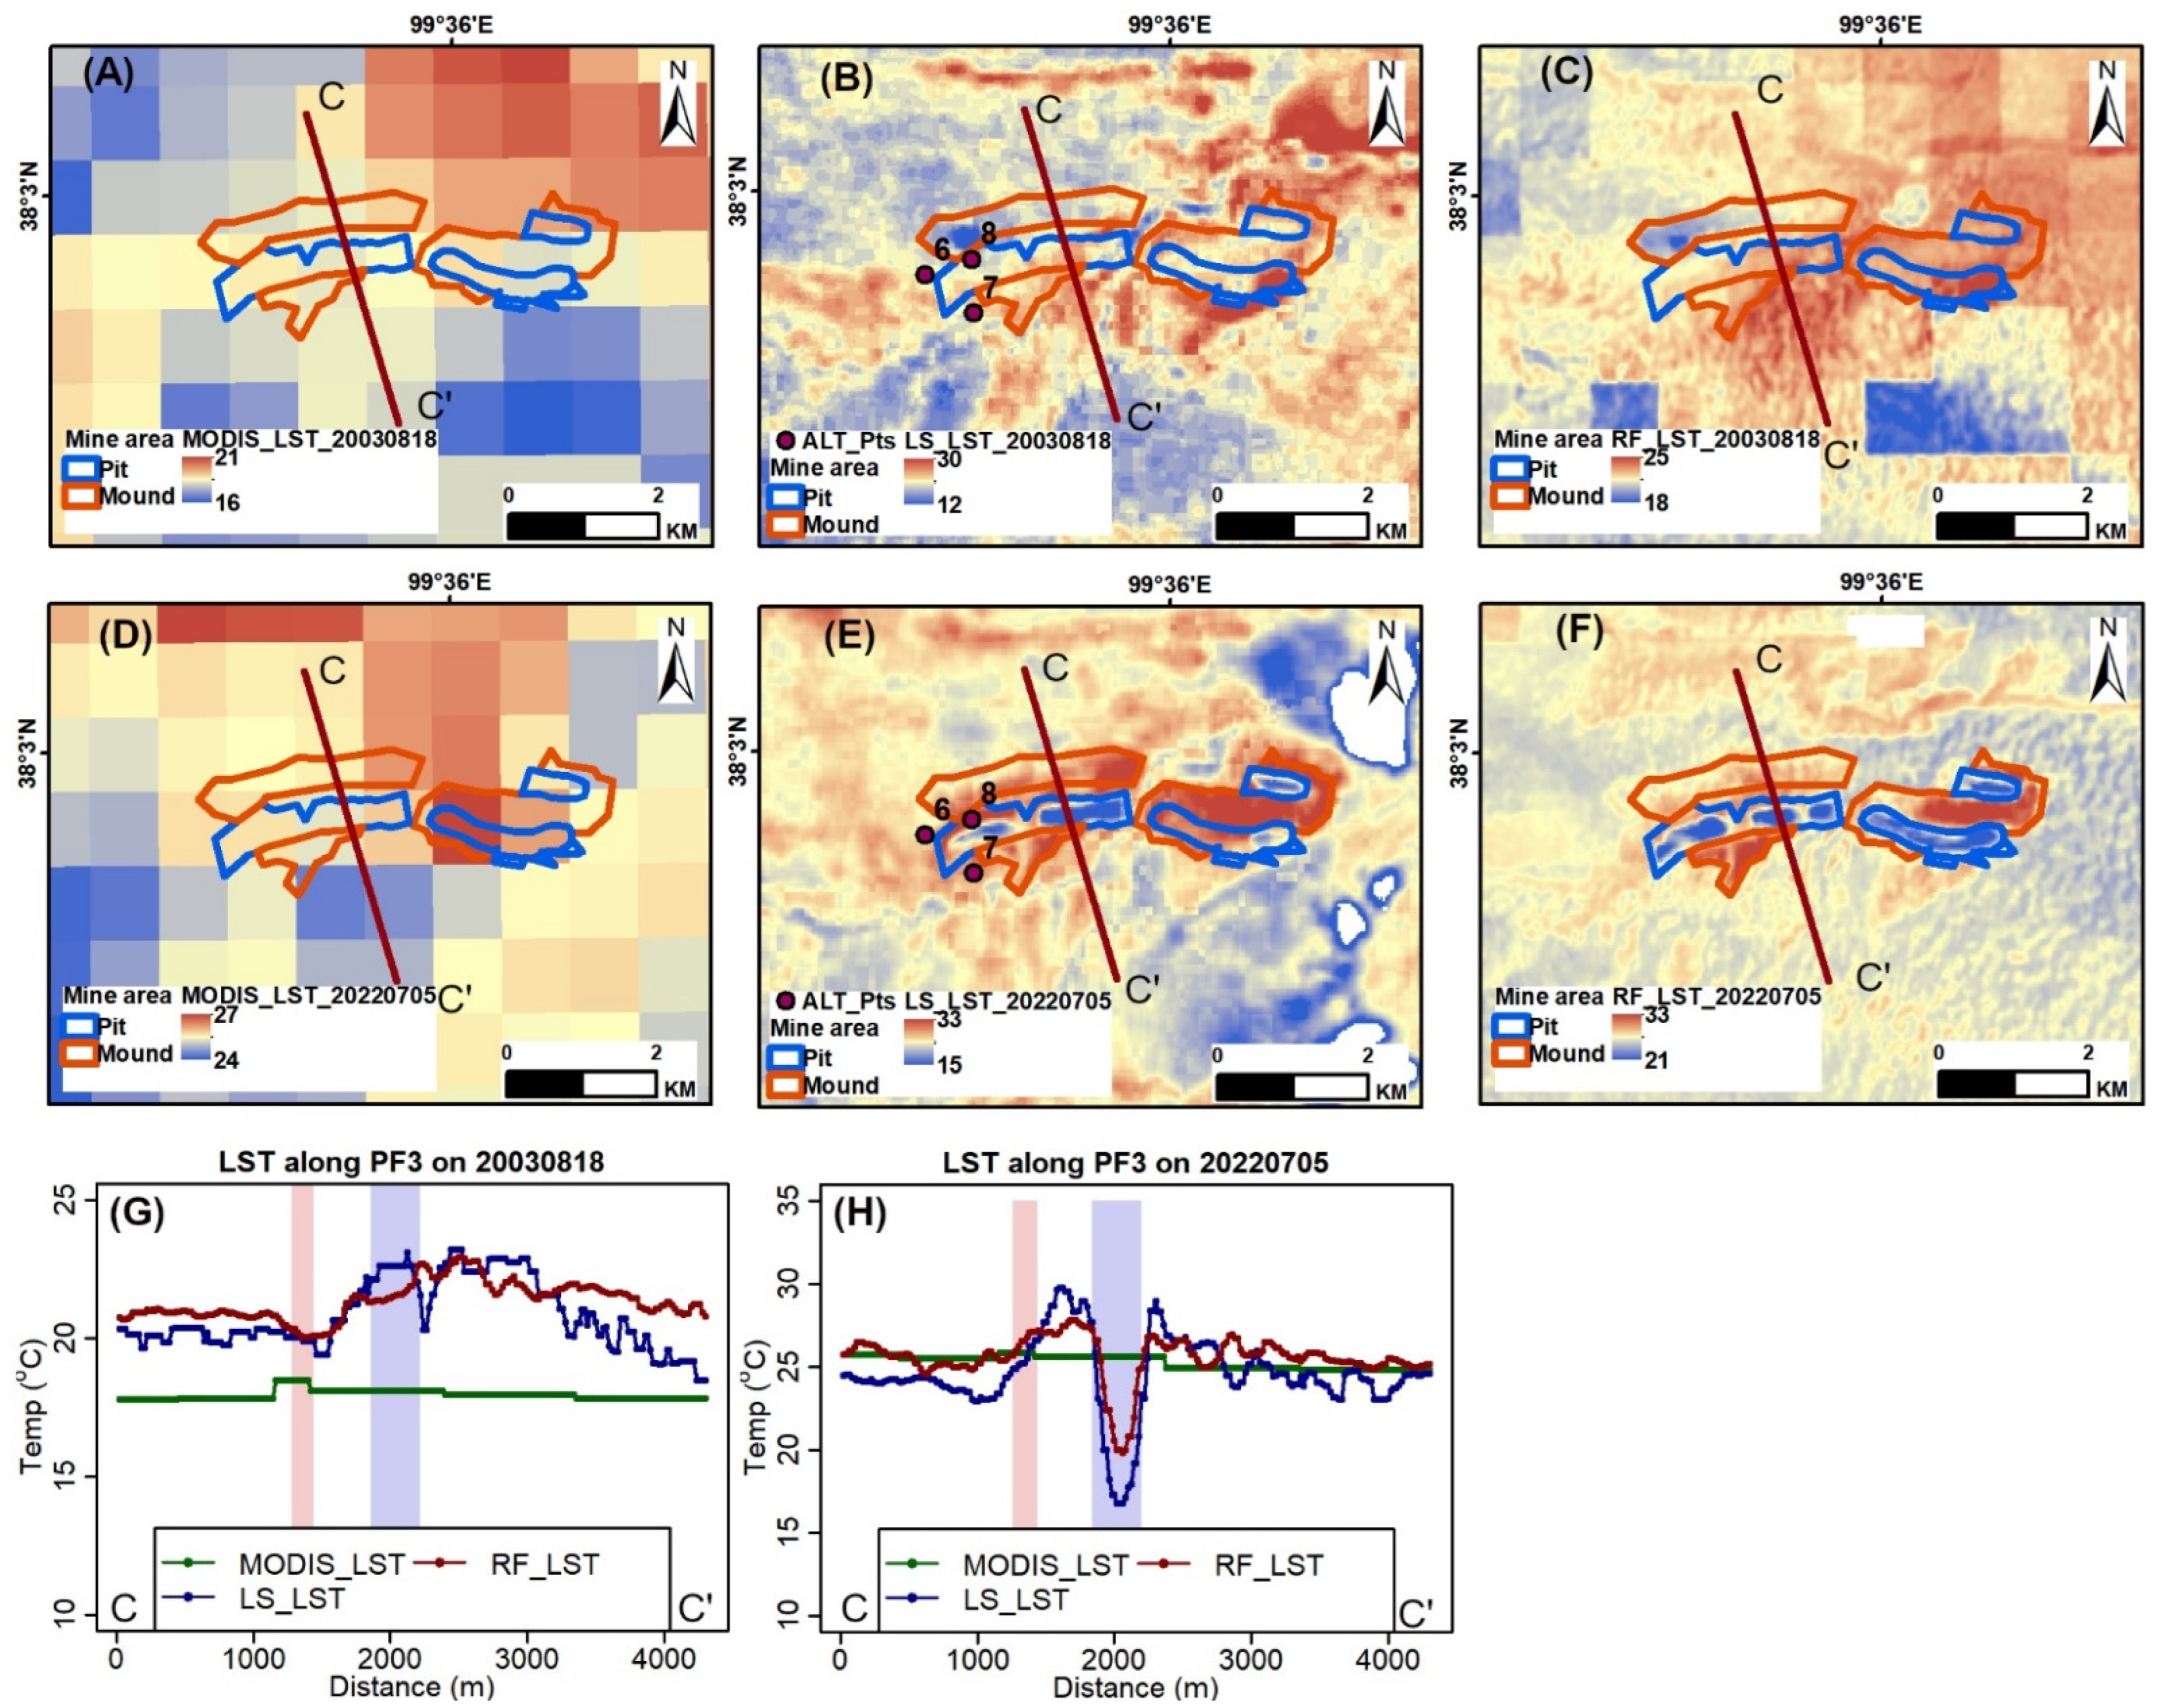
In the Muri area, the ground thermal condition and its spatial variation reach maxima usually in summer. Therefore, the two days 2003-08-18 and 2022-07-05 were selected as the time before and after the extensive human disturbance. Landsat LST, MODIS LST and the downscaled LST on these two days were compared as part of the quality check of the LST downscaling. Differences between MODIS LST, Landsat LST and the downscaled LST in the JHG mine were evident (Figure 5). MODIS LST exhibited a rather homogenous LST for the Muri area, while the downscaled LST depicted the spatially varying thermal conditions on local natural and mine features, such as mine pits (Figure 5). Along the profiles AA’ and BB’, Landsat LST and the downscaled LST aligned well with each other and both depicted LST variations as the topography changed. In contrast, MODIS LST exhibited rather flat LST features (Figure 5).
In addition, a comparison of LST 2003-08-18 and 2022-07-05 exhibited that decadal mining significantly varied the spatial distribution of LST in the JHG mine. Specifically, after mining, the LST on the waste dump heap rose and the LST in the mine pit lowered (Figure 5B,C,E,F). This phenomenon was evident in Landsat and the downscaled LST, but not on MODIS LST (Figure 5A,D).
The three LST products exhibited similar characteristics in the JC mine to that in the JHG mine. MODIS LST exhibited a rather homogenous thermal condition, and the downscaled LST and Landsat depicted much more remarkable heterogeneity. Along the profile CC’, the downscaled LST and Landsat depicted more details in local thermal condition variations than MODIS LST, especially around the mine pit and waste dump heap (Figure 6).

3.3. ALT-DDT Coefficient and Quality of the Estimated ALT

3.3.1. ALT-DDT Coefficient

The DDT-ALT coefficients from the 12 sites of in situ measurements during 2009–2016 were all around 0.04 (Table 1). The mean and standard deviation of the DDT-ALT coefficients for MODIS LST were 0.041 m/°C and 0.006 m/°C, respectively. For the downscaled LST, they were 0.039 m/°C and 0.005 m/°C, respectively. No significant spatial pattern was visible in the DDT-ALT coefficients.

3.3.2. Accuracy of the Estimated ALT

In situ ALT measurements that did not contribute to ALT-DDT coefficient derivation (i.e., Section 2.3.4) were used to cross-validate the ALT estimated, respectively, from MODIS LST and the downscaled LST. The RMSE and MAE of the ALT estimated from MODIS LST were 0.53 m and −0.3 m, respectively. The RMSE and MAE of the ALT estimated from the downscaled LST were 0.5 m and −0.25 m, respectively (Figure 7). Overall, the accuracies of the ALT estimated from the two LST products were of the same order.
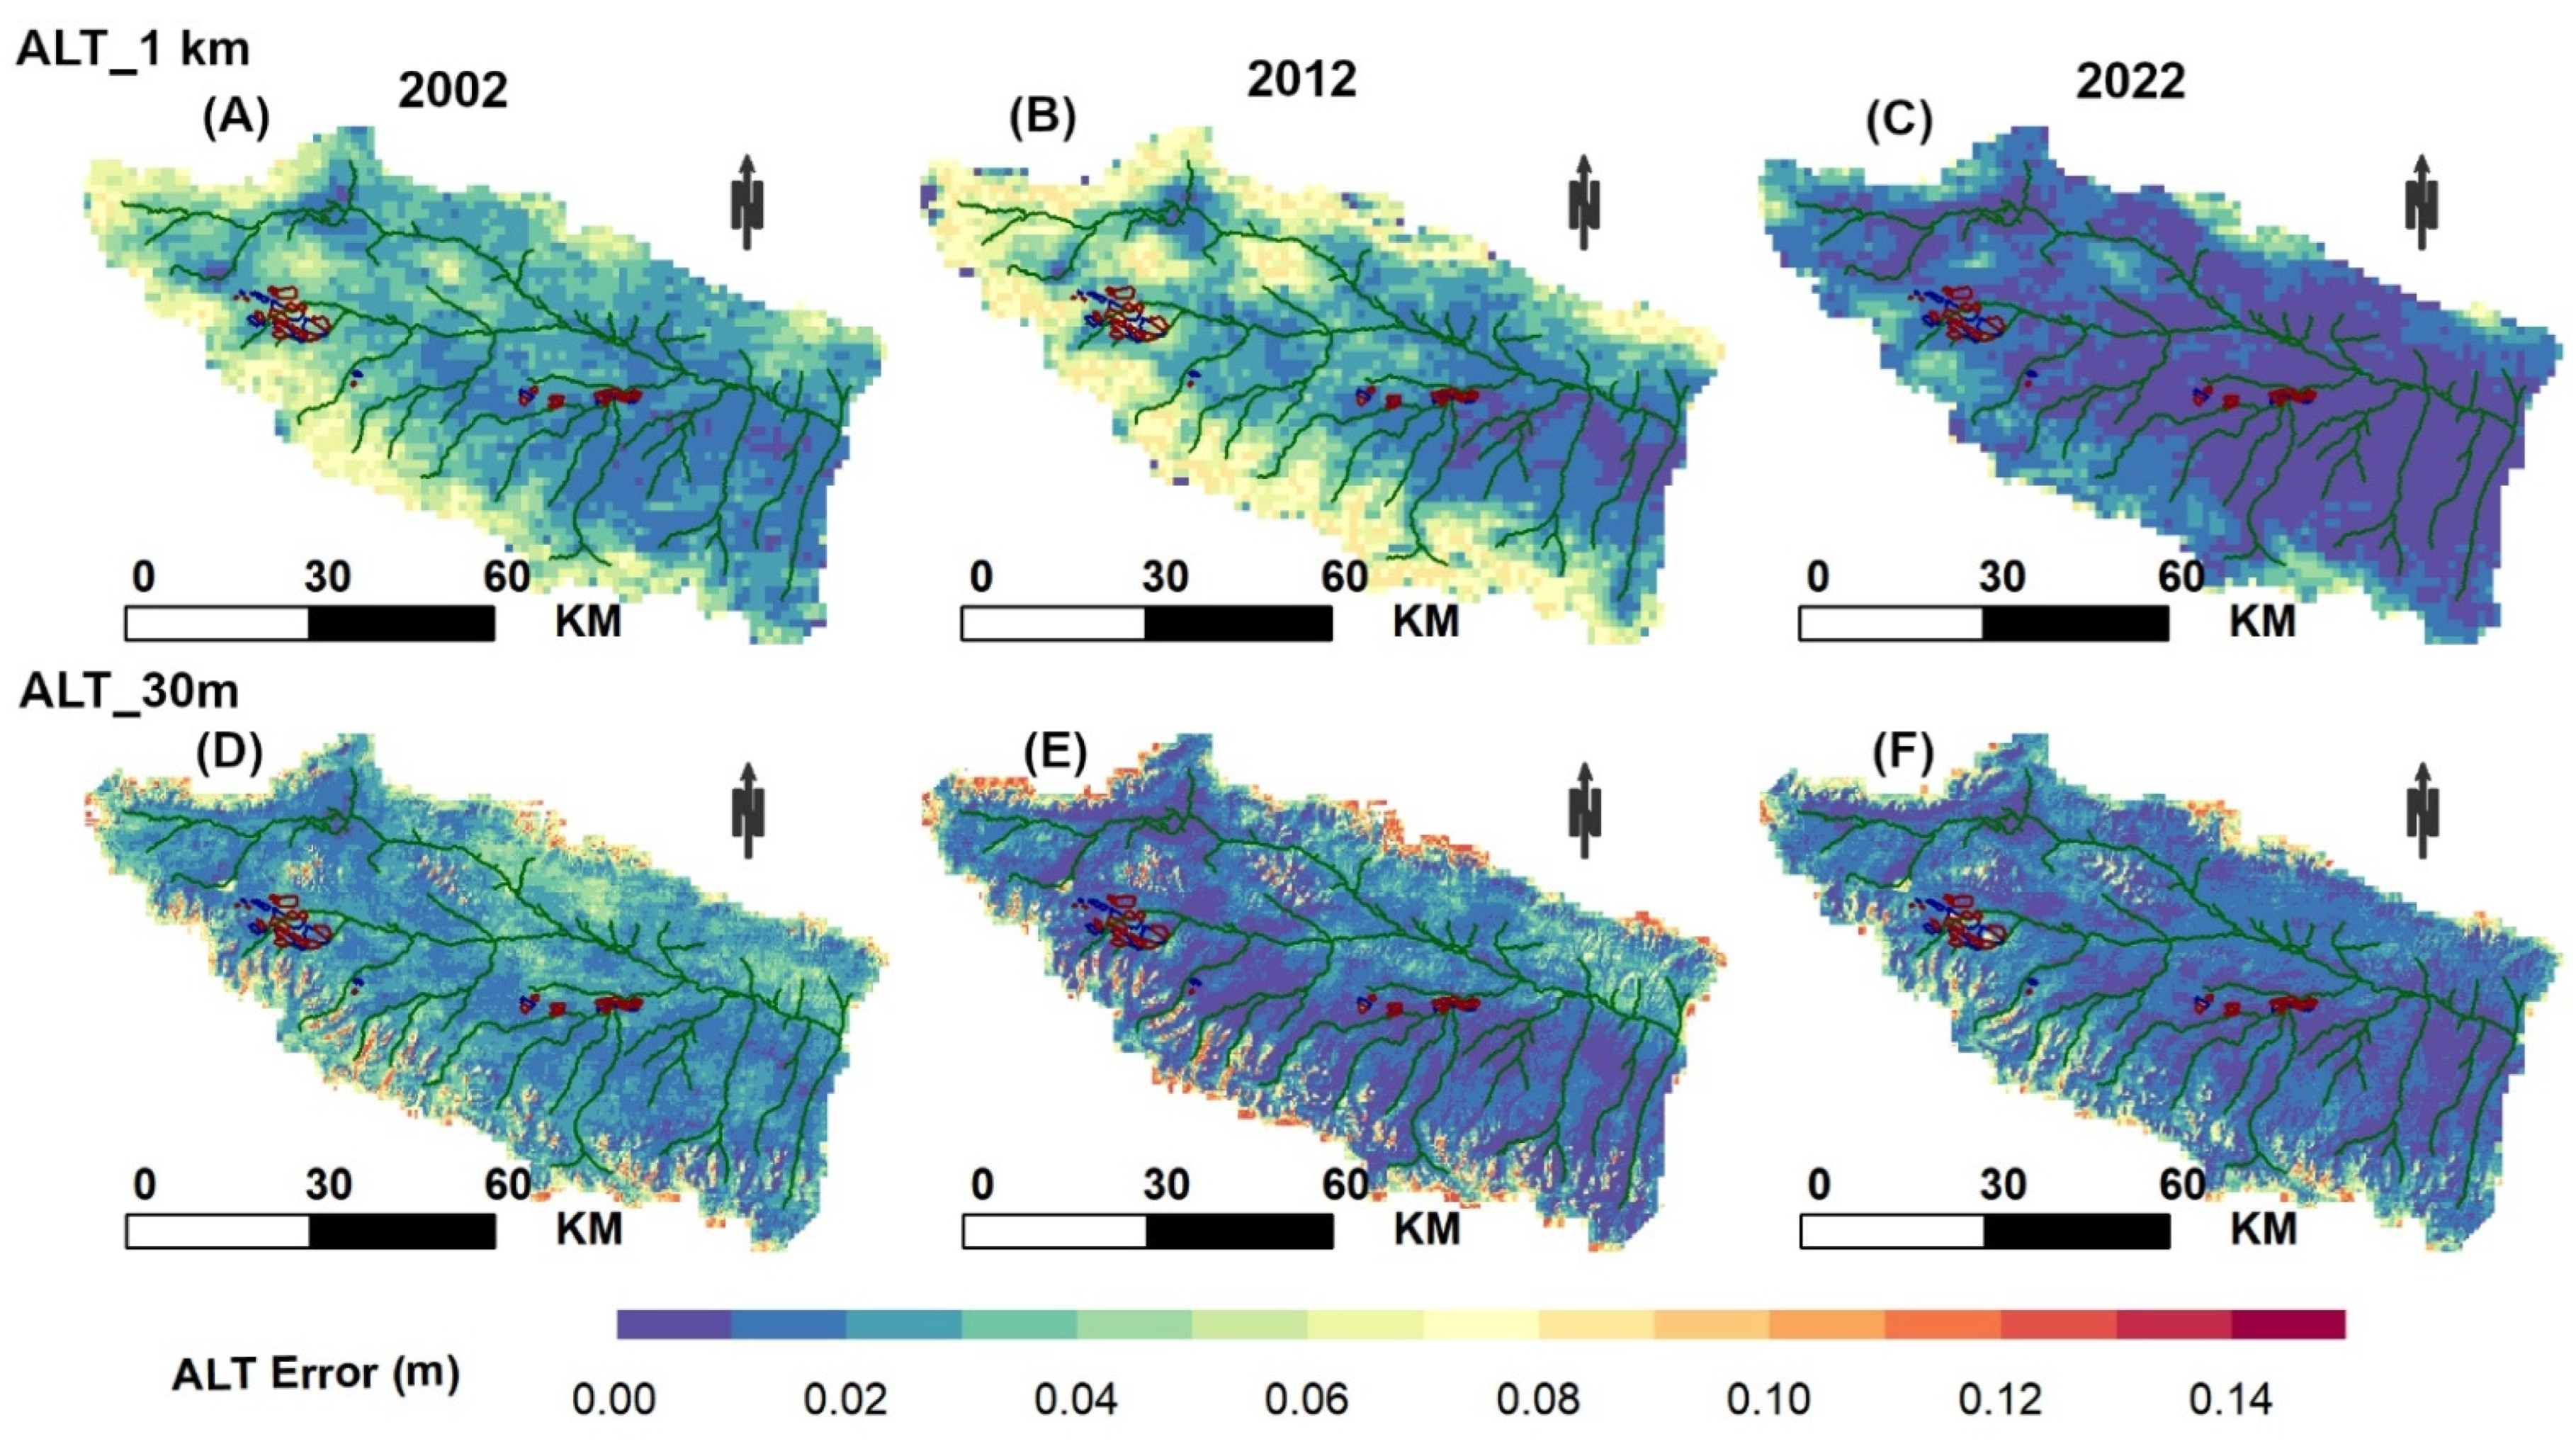
In the typical years of 2002, 2012 and 2022, the errors in both the ALTs derived from MODIS LST and the downscaled LST were in the range of 0.0–0.12 m. ALT error maps from the two LST products exhibited similar patterns (Figure 8). Specifically, ALT errors near the watershed edge were generally large, with values up to 0.14 m, and low at areas of gentle terrains like river plains, with their values down to 0.0 m (Figure 8). In areas of rough terrains, ALT errors from MODIS LST were 0.04–0.06 m smaller than that from the downscaled LST.

3.4. Comparison of the ALT Estimated from MODIS LST and the Downscaled LST

3.4.1. Spatial Distribution of ALT in Typical Years

ALTs in the Muri area were in the range of 0.5–1.2 m in 2002 and 2012 and 0.8–1.8 m in 2022, and this was the case for both ALTs estimated from MODIS LST and from the downscaled LST (Figure 9A–F). Moreover, the ALT in JC was larger overall than that in JHG from both ALTs (Figure 9G–R). However, the ALT estimated from the downscaled LST showed more detailed spatial variations than that from MODIS LST, for example, around the mine pit/waste heap and the mountainous areas beyond the mine area (Figure 9J–L). In addition, the ALT on the sunny slope was larger than that on the shady slope. In JC, the ALTs along the river network were 0.2 m larger than that at elevated areas (Figure 9P–R). These phenomena were not visible in the ALT estimated from MODIS LST (Figure 9).

3.4.2. Temporal Changes in NDVI, LST and ALT Along Typical Profiles

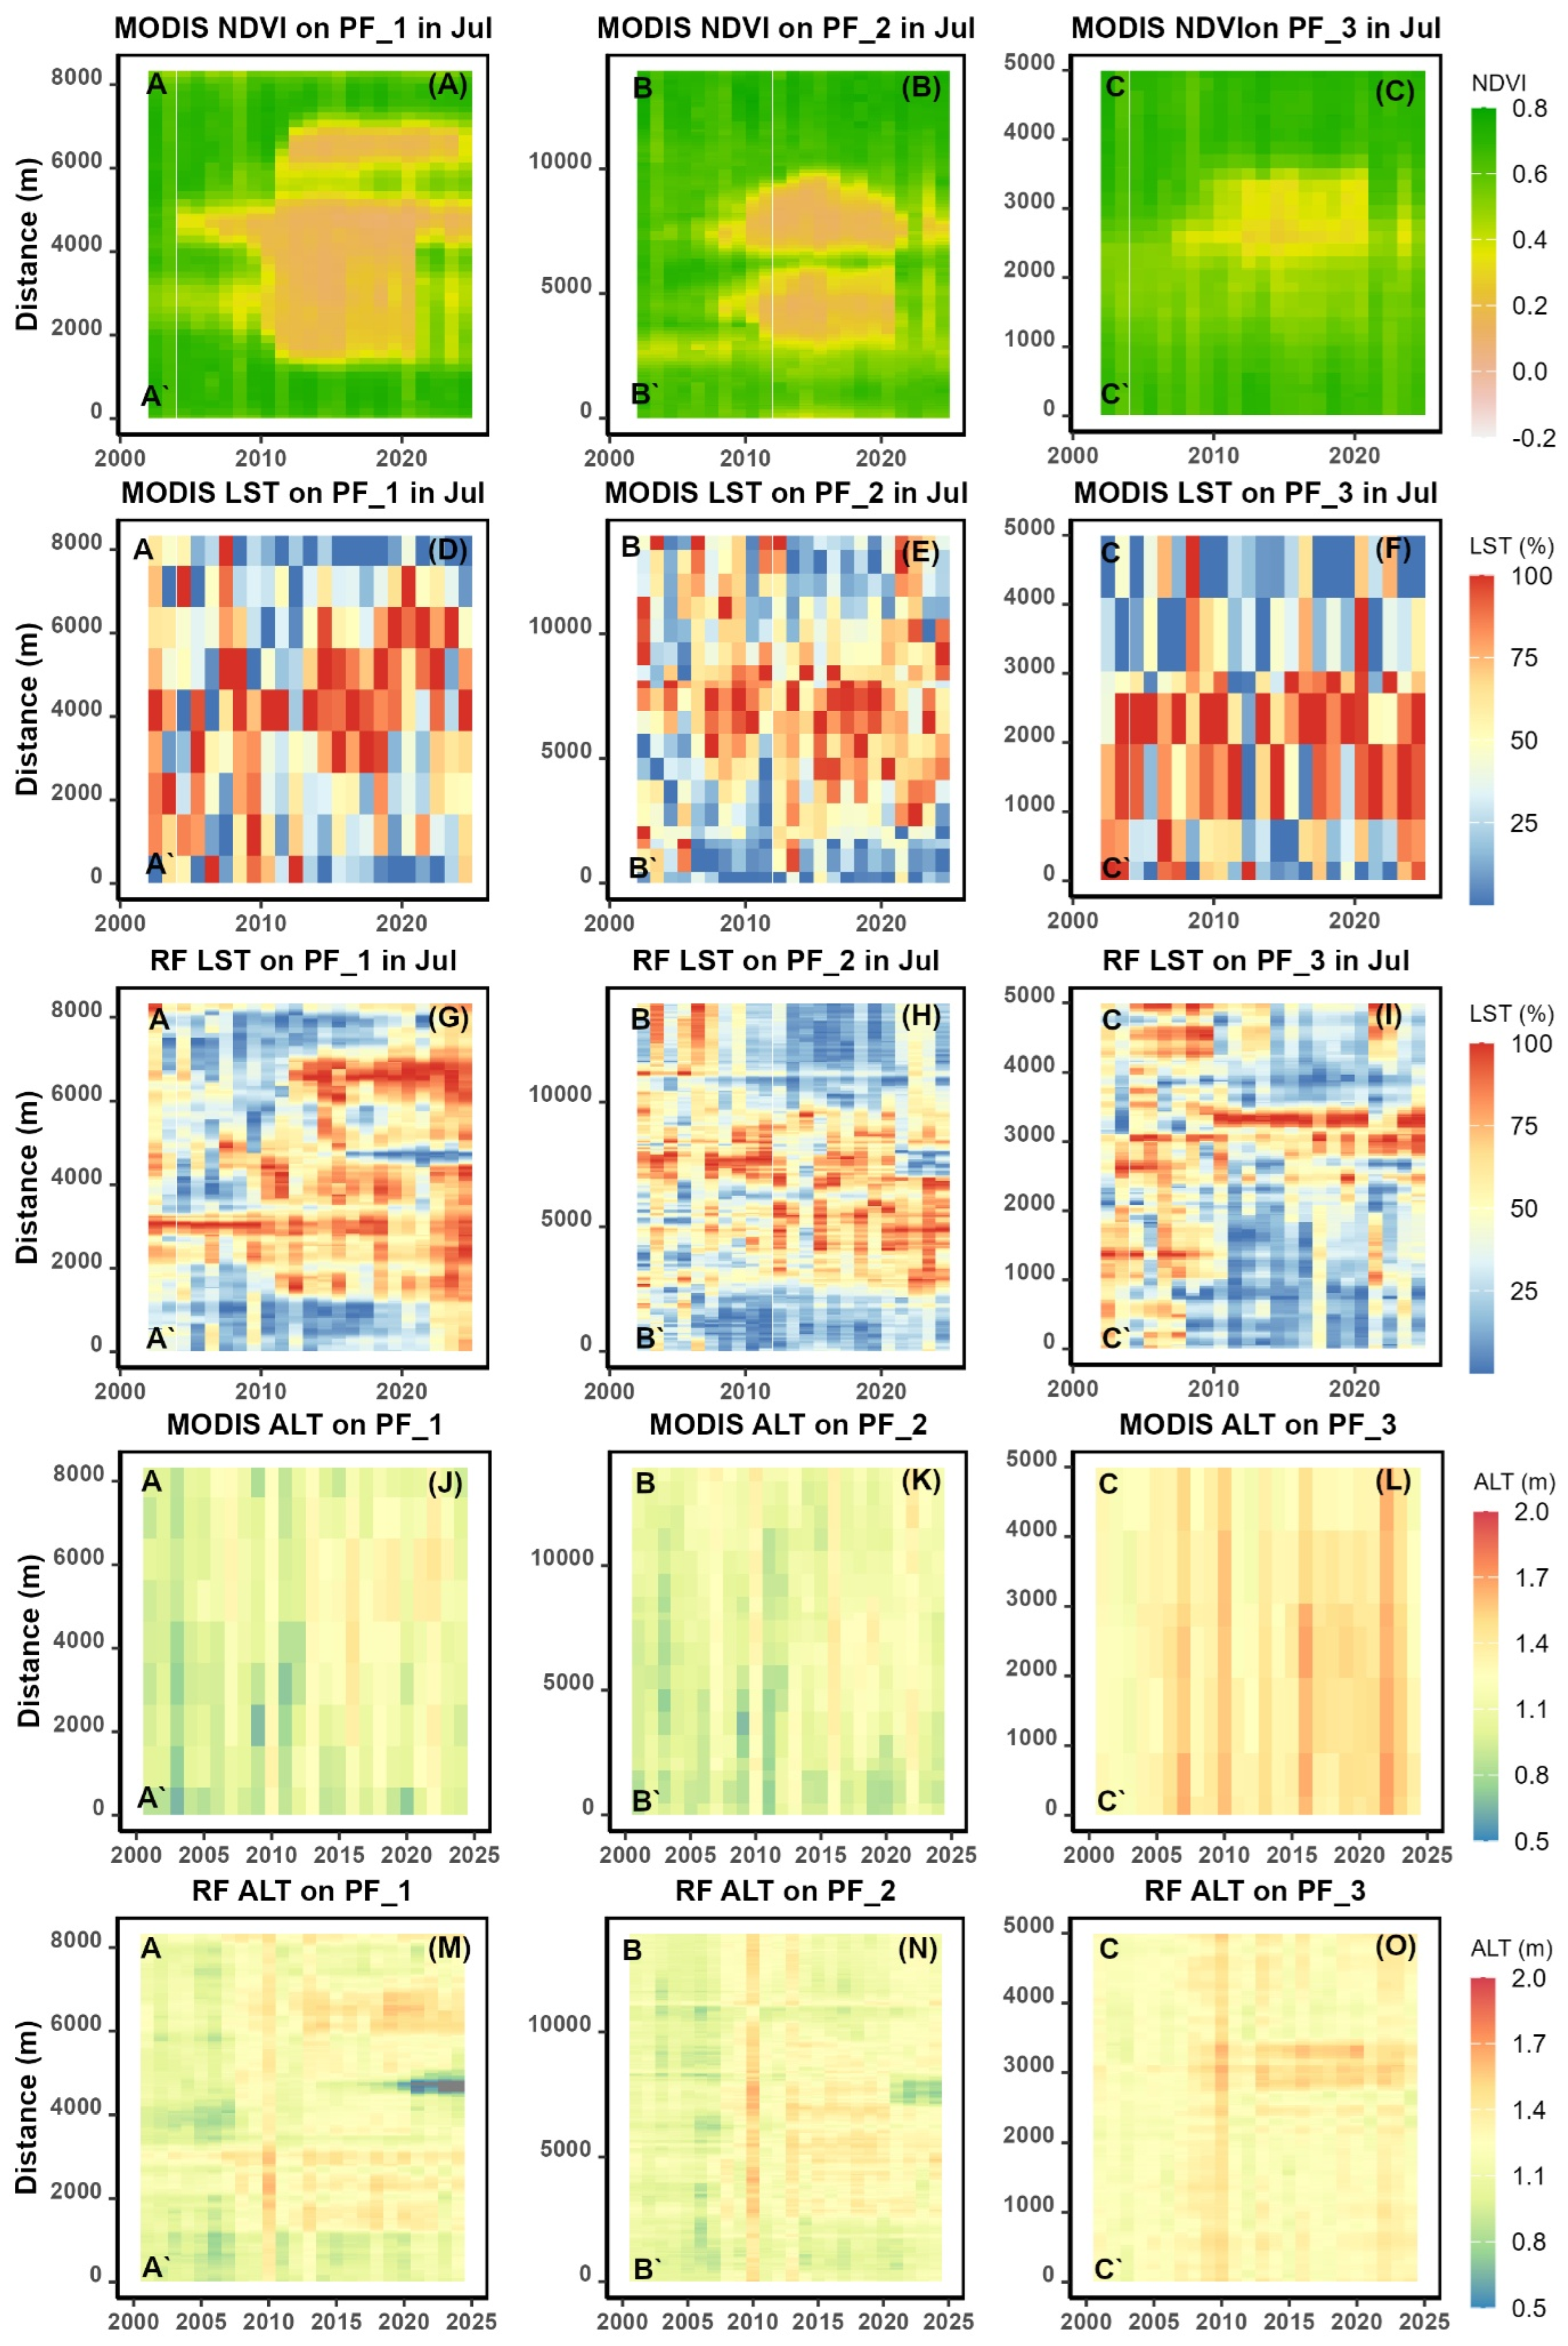
Along the three profiles AA’, BB’ and CC’ (Figure 5 and Figure 6), the area mined during 2005–2010 was present as zones of low NDVI, and the expansion of mined area during 2011–2020 co-occurred with expansion of the low-NDVI zone. Replantation during 2021–2024 was present as NDVI recovery in previously low-NDVI areas (Figure 10A–C). Unmined areas exhibited a continuous and stable high NDVI during 2000–2024 (Figure 10A–C). Most of the mined areas were replanted by 2024 (Figure 10A–C).
Along the three profiles, the mined areas exhibited clusters of high MODIS LST anomalies. In contrast, the mined areas exhibited detailed LST variations on the downscaled LST and aligned with NDVI variations, especially during 2010–2024, when mining was intensive (Figure 10A–C,M–O). In addition, the presence of water in the mine pits during 2020–2024 enlarged the range of the downscaled LST along the three profiles and minimized the relative spatial variation in LST. This phenomenon was less significant on MODIS LST than on the downscaled LST (Figure 10D–I). No significant spatial high-LST expansion beyond the mined areas was visible on MODIS LST or on the downscaled LST (Figure 10D–I).
Along the three profiles, the response of ALT to mining and replantation during 2000–2024 was intuitive and aligned closely with LST variations (Figure 10J–O). Similar to LST, the ALT from the downscaled LST exhibited more details than that from MODIS LST (Figure 10J–O). No significant spatial expansion beyond the mined areas was visible in ALTs of either LST. However, ALTs of both spatial resolutions showed significant and similar inter-annual differences. For example, ALTs in 2010, 2016 and 2022 were approximately 0.3 m larger than those in other years (Figure 10J–O).

3.5. Multi-Year and Seasonal Changes in ALT and LST at Typical Site

Typical sites in the Muri area with varying degrees of human disturbance are indicated in Figure 5B,E and Figure 6B,E. Overall, the ALT and LST at those sites inherited nearly every change direction from local Tair, but with remarkably greater amplitudes (Figure 11). At sites of mild or no human disturbance (e.g., P_0 and P_1 outside of mine area), no significant NDVI fluctuation was notable, and the ALT showed slight increases (Figure 11A,C). For example, the ALT at P_1 increased from 0.8 m in 2000 to 0.9 m in 2024 (Figure 11A), and the ALT at P_3 from 0.8 m in 2000 to 1.1 m in 2024 (Figure 11E). At the sites of intensive human disturbance (i.e., P_4 and P_8 at mine pits), the NDVI exhibited remarkable changes, and the ALT fluctuated with significantly increased amplitudes (Figure 11E,G). Overall, the ALT at all these sites in the Muri area increased from 2000 to 2024, especially in the human-disturbed areas.
A comparison of the years of high LSTs (i.e., 2010, 2013, 2019 and 2022) to the time before mining (i.e., 2000–2005) showed that, in warm years, the LST in Muri mostly increased in May, June, August and September (Figure 11B,D,F,H,J). The LST in these months rose up to 10 °C. But in July, when P reached its annual maximum (Figure 1), the LST barely exhibited changes (Figure 11B,D,F,H,J).

4. Discussion

4.1. Reliability of ALT Estimated from the Downscaled LST

Efforts were devoted to ensuring the quality of the ALT estimated in this study: (1) micro-topography (i.e., elevation, aspect and slope), vegetation condition (NDVI) and seasonality (i.e., DOY), which were vital for the spatiotemporal variations in LST [51], were included in MODIS LST downscaling (Figure 4), which aided in depicting the spatiotemporal variations in LST and ALT; (2) spatially distributed diurnal LST differences were removed from the daily LST before ALT estimation (Section 2.3.3); and (3) the Stefan equation, a proven robust and widely used approach for ALT estimation [19,48,52], was adopted to estimate the ALT from the downscaled LST.
The quality of the ALT estimated from the downscaled LST was demonstrated in three aspects: (1) the RMSE and MAE of the random forest model for MODIS LST downscaling were 3.64 °C and −0.1 °C, respectively (Figure 4); (2) the RMSE and MAE of the ALT estimated from the downscaled LST were 0.5 m and −0.25 m, respectively (Figure 7) (meanwhile, the range of the ALT estimated from the downscaled LST was from 0.5 m to 2 m (Figure 9 and Figure 10), which aligned with previously estimated or modeled ALTs for the Muri area [51]); and (3) the spatiotemporal variations in the downscaled LST and the ALT estimated from this product exhibited detailed spatial patterns matching with human disturbance (i.e., mining or replantation) and topography (Figure 5 and Figure 6). In particular, the terrain effect on the ALT estimated from the downscaled LST was more prominent than on the ALT estimated from MODIS LST.
ALT errors on the error maps were overall smaller than RMSEs from the cross-validation with in situ measurements (Figure 7 and Figure 8). That was probably because error maps expressed ALT uncertainty pixel-wise based on the aggregated local thermal condition. In contrast, cross-validation with in situ measurements was essentially comparing the point-wise in situ ALT measurements to the pixel-wise ALT, which aggregated the nearby thermal condition. In addition, in situ ALT measurements for cross-validation were those that did not pass the homogeneity check in Section 2.3.4 (Figure 3), namely, taken next to a river channel or lake border, and likely were some extreme values in the ALT pixel coverage. Therefore, linking these point-wise in situ measurements to the pixel-wise ALT could yield a larger discrepancy than ATL error directly estimated pixel-wise. Both ALT error maps and the RMSE were reliable for the quality check of the ALT estimated in this study, but on a regional scale, ALT error maps are likely more applicable than the RMSE from cross-validation.
In addition, the downscaled LST and the ALT derived from this LST exhibited some pronounced terrain-related patterns in the mountainous area beyond mined areas, which were not notable on MODIS LST and the ALT derived from this data (Figure 9). The possible reason behind this phenomenon was the size differences between the terrain features and the pixels of the two LST products. The sizes of the terrain features in the mountainous areas were in the same order of MODIS LST pixels, or even smaller than the latter. While MODIS LST captured the thermal condition of those features and exhibited it as 1 km × 1 km aggregates, the downscaled LST depicted the thermal condition and its spatial variation at the spatial resolution of 30 m × 30 m, and it could distinguish the thermal condition on a shady slope from that on a sunny slope. These capabilities of the two LSTs were passed onto the ALT yielded from them. In addition, this phenomenon was only pronounced in the mountainous areas of steep slopes, and not at the mine areas where gentle slopes exist. Therefore, the MODIS LST downscaling effectively depicted details of local thermal conditions of the study area without significantly exaggerating the topographic effects on the LST.
The constant EI may have introduced uncertainties into the ALT estimated in this study, as EI is related to soil properties (e.g., soil water content, soil porosity), which are spatially heterogenous and vary as the climate changes [53]. However, measuring soil properties on a regional scale is costly and infeasible. Furthermore, EI was estimated in this study to combine soil density, thermal conductivity and soil moisture (Equation (1)) at each in situ ALT measurement point (Table 1). The RMSEs of EI for the two LST products were 0.005–0.006 °C/m, accounting for 12%–15% of the corresponding mean EI, indicating that EI in the study area did not vary significantly. This was likely due to the relatively homogenous land cover, climate and soil types in the Muri area (Figure 1). In addition, cross-validation of ALT maps with in situ measurements yielded a high accuracy of RMSE 0.53 m (Figure 7 and Figure 8), and ALT error maps ranged between 0.0 m and 0.12 m. These results demonstrated the reasonability of this study’s ALT estimate. Therefore, the contribution of a constant EI to error in the ALT in the Muri area was minimum, and the spatial distribution of the ALT estimated in this study remained valid. Still, future efforts at extensive in situ ALT measurements will be largely appreciated by ALT mapping relying on the ALT-DDT coefficient, i.e., EI.

4.2. Driving Forces of Alpine Permafrost Variations

From 2000 to 2024, the ALT in the Muri area overall increased by 0.2–0.4 m (Figure 9, Figure 10 and Figure 11). The response of ALT in the Muri area to human disturbance (i.e., mining and replantation) was prompt but only in the area to have undergone intensive mining and/or replantation (Figure 9 and Figure 10). Increasing ALT and LST showed no significant spatial expansion beyond the disturbed area (Figure 9, Figure 10 and Figure 11).
Tair, land cover, LST and soil moisture were the major factors determining the ALT in the Muri area and its spatiotemporal variations [9,13,14,54,55]. Land cover directly receives heat from air and downwards solar radiation, which is further transmitted downwards to the active layer beneath. Soil moisture in the active layer determines the proportions of water and air in the active layer and the speed and amount of heat transmitted to permafrost further underneath. In the Muri area, the climate is semi-arid, the terrain is rough (Figure 1) and land cover is mainly alpine steppe of a thin but dense root zone. These characteristics have led to rapid surface runoff and poor seepage, rendering the root zone moisture high but the soil moisture beneath low, with gravel gaps filled mostly with heatproof air. Therefore, the ALT in the Muri area overall remained low during 2000–2024.
As Tair in the Muri area gently rose during 2000–2024 (Figure 11), the vertical structure of undisturbed ground remained. Due to the wet and dense root zone, the increased heat above land cover propagated very slowly downwards through the steppe. As a result, the ALT in the undisturbed areas exhibited a slow increase as Tair increased (Figure 11A,C). In contrast, mining and mining-related activities like waste piling or construction severely destroyed the dense root zone, exposed the gravel layer and largely changed the local vertical structure, despite replantation later partially recovering the root zone. These vertical structural changes and the missing wet and dense root zone enabled direct and fast heat exchange between the hot air above ground and the previous covered cool ground gaps, allowing more heat to be transmitted to permafrost. The downward heat transmission was particularly strong in warm years, especially in May and September, when the vegetation is relative inactive, precipitation remains little and the ground remains dry (Figure 11). Meanwhile, the absence of a dense root zone may have enhanced the infiltration of precipitation and surface runoff, which further increased the water content in the gravel gaps and the heat transmission to permafrost, due the larger heat conductivity and capacity of water than air. As a result, the ALT in human-disturbed areas fluctuated more significantly than in undisturbed areas, especially in warm years (Figure 11E,G). However, as mining and replantation only interfered with local soil structure and affected local heat transmission paths and amounts, ALT fluctuation was localized, without significant expansion (Figure 11E,G). This agreed with the finding that the ALT is dependent on local eco-hydro-geomorphic factors [24].

4.3. Significance of Study

Compared to previous studies using air temperature to estimate regional ALT, this study used the remotely sensed LST to estimate the regional ALT distribution. The remotely sensed LST used in this study served as an intuitive index of the permafrost thermal condition and eliminated the impact of an annual difference between air temperature and LST in the Tibetan Plateau, which was found to be in the range of 2.4–4.3 °C with seasonal variability [56]. Furthermore, the remotely sensed MODIS LST was downscaled to provide an LST of high temporal and spatial resolution and high accuracy (Figure 4 and Figure 10). The downscaled LST revealed the detailed spatiotemporal variations in the thermal condition in the Muri area and further supported the estimation of an ALT of a high spatial resolution and accuracy (Figure 5 and Figure 10).
Moreover, compared to the sparsely distributed in situ measurements of ALTs from individual years [57], the ALT estimated from the downscaled LST in this study expressed the ALT with a continuous distribution both spatially and temporally. The ALT estimated in this study was first of this kind for the Muri area in terms of spatial resolution and accuracy.
Furthermore, in the context of warming permafrost on the Tibetan Plateau [11,18,58], the findings on the permafrost response to human disturbance in this study can potentially support a better understanding of the alpine permafrost stability and regional hydrological sustainability in the northeastern Tibetan Plateau.

5. Conclusions and Outlook

The Muri area has undergone decades of intensive mining and replantation, and the stability of local alpine permafrost has raised substantial concerns. Considering the small size of its mining features, MODIS LST was downscaled using random forest algorithms. The high-resolution ALT was subsequently estimated based on the downscaled LST, and its spatiotemporal variations during 2000–2024 were analyzed. We found that (1) the downscaled LST effectively exhibited the spatial and temporal effect of human disturbances in the permafrost in the Muri area; (2) the response of permafrost to human disturbance in the Muri area was localized and showed no spatial expansion; and (3) the semi-arid climate, rough terrain, thin root zone and gappy vertical structure beneath were the major controlling factors of permafrost variation. The ALT maps produced in this study filled the data gaps of high-resolution ALT data in the Muri area. The response of the LST and ALT to human disturbance in the Muri area provides a reference for understanding alpine permafrost evolution. In the future, utilizing real-time soil properties (e.g., soil moisture and thermal conductivity) of a high spatial resolution could further improve the accuracy of ALT estimation.

Supplementary Materials

The following supporting information can be downloaded at: https://www.mdpi.com/article/10.3390/rs17203482/s1, Figure S1: Spatial distribution of in situ ALT measurements in the study area.

Author Contributions

Conceptualization, S.Z.; methodology S.Z.; validation, S.Z., J.C., L.H. and X.L.; C.W.; investigation, S.Z. and J.C.; data curation, S.Z. and J.C.; writing—original draft preparation, S.Z.; writing—review and editing, S.Z., H.Z. and Q.F.; visualization, S.Z.; project administration, S.Z. and J.C.; funding acquisition, S.Z., J.C. and Q.F. All authors have read and agreed to the published version of the manuscript.

Funding

The research was funded by the Ministry of Science and Technology of the People’s Republic of China (grant number 2022YFF1302602), Chinese Academy of Sciences (grant number E2290112) and Kunlun Elit Programme of Qinghai Province. The APC was funded by the National Key R&D Program of China (grant number 2022YFF1302602).

Data Availability Statement

The ALT estimated from the downscaled LST can be downloaded from the National Cryosphere Desert Data Center (https://www.ncdc.ac.cn) (accessed on 12 October 2025) as the “Active layer thickness of 30 m in the headwater area of the Datong River 2000–2024”.

Acknowledgments

Landsat images were from the USGS’s Earth Explorer Engine (https://earthexplorer.usgs.gov/) (last accessed 12 October 2025). MODIS LST (i.e., MOD11_L2 and MYD11_L2), MODIS reflectivity data (i.e., MOD09GQ and MYD09GQ) and MODIS reflectivity quality data (i.e., MOD09GA and MYD09GA) were from NASA Earth Data platform (https://www.earthdata.nasa.gov/) (last accessed 12 October 2025). The SRTM DEM 1 arc second and TanDEM-X Edited 30 m DEM were, respectively, downloaded from the USGS’s Earth Explorer Engine (https://earthexplorer.usgs.gov/) (last accessed 12 October 2025) and DLR (https://www.dlr.de/de) (last accessed 12 October 2025).

Conflicts of Interest

The authors declare no conflicts of interest.

References

  1. Iwata, H.; Harazono, Y.; Ueyama, M. The Role of Permafrost in Water Exchange of a Black Spruce Forest in Interior Alaska. Agric. For. Meteorol. 2012, 161, 107–115. [Google Scholar] [CrossRef]
  2. Gao, Z.; Niu, F.; Lin, Z. Effects of Permafrost Degradation on Thermokarst Lake Hydrochemistry in the Qinghai-Tibet Plateau, China. Hydrol. Process. 2020, 34, 5659–5673. [Google Scholar] [CrossRef]
  3. Sjöberg, Y.; Jan, A.; Painter, S.L.; Coon, E.T.; Carey, M.P.; O’Donnell, J.A.; Koch, J.C. Permafrost Promotes Shallow Groundwater Flow and Warmer Headwater Streams. Water Resour. Res. 2020, 57, e2020WR027463. [Google Scholar] [CrossRef]
  4. Jin, X.; Jin, H.; Luo, D.; Sheng, Y.; Wu, Q.; Wu, J.; Wang, W.; Huang, S.; Li, X.; Liang, S.; et al. Impacts of Permafrost Degradation on Hydrology and Vegetation in the Source Area of the Yellow River on Northeastern Qinghai-Tibet Plateau, Southwest China. Front. Earth Sci. 2022, 10, 845824. [Google Scholar] [CrossRef]
  5. Wang, G.; Li, Y.; Wang, Y.; Wu, Q. Effects of Permafrost Thawing on Vegetation and Soil Carbon Pool Losses on the Qinghai-Tibet Plateau, China. Geoderma 2008, 143, 143–152. [Google Scholar] [CrossRef]
  6. Chen, X.; Jeong, S. Asymmetric Impacts of Surface Thaw Onset Change on Seasonal Vegetation Growth in Arctic Permafrost. Glob. Ecol. Biogeogr. 2024, 33, 131–140. [Google Scholar] [CrossRef]
  7. Jin, X.Y.; Jin, H.J.; Iwahana, G.; Marchenko, S.S.; Luo, D.L.; Li, X.Y.; Liang, S.H. Impacts of Climate-Induced Permafrost Degradation on Vegetation: A Review. Adv. Clim. Change Res. 2021, 12, 29–47. [Google Scholar] [CrossRef]
  8. Biskaborn, B.K.; Smith, S.L.; Noetzli, J.; Matthes, H.; Vieira, G.; Streletskiy, D.A.; Schoeneich, P.; Romanovsky, V.E.; Lewkowicz, A.G.; Abramov, A.; et al. Permafrost Is Warming at a Global Scale. Nat. Commun. 2019, 10, 264. [Google Scholar] [CrossRef]
  9. Smith, S.L.; O’Neill, H.B.; Isaksen, K.; Noetzli, J.; Romanovsky, V.E. The Changing Thermal State of Permafrost. Nat. Rev. Earth Environ. 2022, 3, 10–23. [Google Scholar] [CrossRef]
  10. Luo, D.; Jin, H.; Bense, V.F.; Jin, X.; Li, X. Hydrothermal Processes of Near-Surface Warm Permafrost in Response to Strong Precipitation Events in the Headwater Area of the Yellow River, Tibetan Plateau. Geoderma 2020, 376, 114531. [Google Scholar] [CrossRef]
  11. Peng, X.; Zhang, T.; Frauenfeld, O.W.; Wang, K.; Cao, B.; Zhong, X.; Su, H.; Mu, C. Response of Seasonal Soil Freeze Depth to Climate Change across China. Cryosphere 2017, 11, 1059–1073. [Google Scholar] [CrossRef]
  12. Turetsky, M.R.; Jones, M.C.; Walter Anthony, K.; Olefeldt, D.; Schuur, E.A.G.; Koven, C.; Mcguire, A.D.; Grosse, G. Permafrost Collapse Is Accelerating Carbon Release. Nature 2019, 569, 32–34. [Google Scholar] [CrossRef] [PubMed]
  13. Dobiński, W. Permafrost Active Layer. Earth Sci. Rev. 2020, 208, 103301. [Google Scholar] [CrossRef]
  14. Wu, Q.; Zhang, T. Changes in Active Layer Thickness over the Qinghai-Tibetan Plateau from 1995 to 2007. J. Geophys. Res. Atmos. 2010, 115, D09107. [Google Scholar] [CrossRef]
  15. Ran, Y.; Li, X.; Cheng, G.; Nan, Z.; Che, J.; Sheng, Y.; Wu, Q.; Jin, H.; Luo, D.; Tang, Z.; et al. Mapping the Permafrost Stability on the Tibetan Plateau for 2005–2015. Sci. China Earth Sci. 2021, 64, 62–79. [Google Scholar] [CrossRef]
  16. Yang, M.; Nelson, F.E.; Shiklomanov, N.I.; Guo, D.; Wan, G. Permafrost Degradation and Its Environmental Effects on the Tibetan Plateau: A Review of Recent Research. Earth Sci. Rev. 2010, 103, 31–44. [Google Scholar] [CrossRef]
  17. Wu, Q.; Hou, Y.; Yun, H.; Liu, Y. Changes in Active-Layer Thickness and near-Surface Permafrost between 2002 and 2012 in Alpine Ecosystems, Qinghai-Xizang (Tibet) Plateau, China. Glob. Planet. Change 2015, 124, 149–155. [Google Scholar] [CrossRef]
  18. Xu, X.; Wu, Q. Active Layer Thickness Variation on the Qinghai-Tibetan Plateau Historical and Projected Trends. J. Geophys. Res. Atmos. 2021, 126, e2021JD034841. [Google Scholar] [CrossRef]
  19. Li, C.; Wei, Y.; Liu, Y.; Li, L.; Peng, L.; Chen, J.; Liu, L.; Dou, T.; Wu, X. Active Layer Thickness in the Northern Hemisphere: Changes from 2000 to 2018 and Future Simulations. J. Geophys. Res. Atmos. 2022, 127, e2022JD036785. [Google Scholar] [CrossRef]
  20. Pang, Q.; Cheng, G.; Li, S.; Zhang, W. Active Layer Thickness Calculation over the Qinghai-Tibet Plateau. Cold Reg. Sci. Technol. 2009, 57, 23–28. [Google Scholar] [CrossRef]
  21. Qin, Y.; Wu, T.; Zhao, L.; Wu, X.; Li, R.; Xie, C.; Pang, Q.; Hu, G.; Qiao, Y.; Zhao, G.; et al. Numerical Modeling of the Active Layer Thickness and Permafrost Thermal State Across Qinghai-Tibetan Plateau. J. Geophys. Res. Atmos. 2017, 122, 604–611. [Google Scholar] [CrossRef]
  22. Zheng, G.; Yang, Y.; Yang, D.; Dafflon, B.; Yi, Y.; Zhang, S.; Chen, D.; Gao, B.; Wang, T.; Shi, R.; et al. Remote Sensing Spatiotemporal Patterns of Frozen Soil and the Environmental Controls over the Tibetan Plateau during 2002–2016. Remote Sens. Environ. 2020, 247, 111927. [Google Scholar] [CrossRef]
  23. Zhang, C.; Douglas, T.A.; Anderson, J.E. Modeling and Mapping Permafrost Active Layer Thickness Using Field Measurements and Remote Sensing Techniques. Int. J. Appl. Earth Obs. Geoinf. 2021, 102, 102455. [Google Scholar] [CrossRef]
  24. Gangodagamage, C.; Rowland, J.C.; Hubbard, S.S.; Brumby, S.P.; Liljedahl, A.K.; Wainwright, H.; Wilson, C.J.; Altmann, G.L.; Dafflon, B.; Peterson, J.; et al. Extrapolating Active Layer Thickness Measurements across Arctic Polygonal Terrain Using LiDAR and NDVI Data Sets. Water Resour. Res. 2014, 50, 6339–6357. [Google Scholar] [CrossRef] [PubMed]
  25. Wang, G.; Niu, S.; Yan, D.; Liang, S.; Su, Y.; Wang, W.; Yin, T.; Sun, X.; Wan, L. Simulation of Active Layer Thickness Based on Multi-Source Remote Sensing Data and Integrated Machine Learning Models: A Case Study of the Qinghai-Tibet Plateau. Remote Sens. 2025, 17, 2006. [Google Scholar] [CrossRef]
  26. Shen, T.; Jiang, P.; Ju, Q.; Yu, Z.; Chen, X.; Lin, H.; Zhang, Y. Changes in Permafrost Spatial Distribution and Active Layer Thickness from 1980 to 2020 on the Tibet Plateau. Sci. Total Environ. 2023, 859, 160381. [Google Scholar] [CrossRef]
  27. Peng, J.; Loew, A.; Merlin, O.; Verhoest, N.E.C. A Review of Spatial Downscaling of Satellite Remotely Sensed Soil Moisture. Rev. Geophys. 2017, 55, 341–366. [Google Scholar] [CrossRef]
  28. Xu, S.; Wu, C.; Wang, L.; Gonsamo, A.; Shen, Y.; Niu, Z. A New Satellite-Based Monthly Precipitation Downscaling Algorithm with Non-Stationary Relationship between Precipitation and Land Surface Characteristics. Remote Sens. Environ. 2015, 162, 119–140. [Google Scholar] [CrossRef]
  29. Wang, F.; Tian, D.; Lowe, L.; Kalin, L.; Lehrter, J. Deep Learning for Daily Precipitation and Temperature Downscaling. Water Resour. Res. 2021, 57, e2020WR029308. [Google Scholar] [CrossRef]
  30. Zhao, W.; Sánchez, N.; Lu, H.; Li, A. A Spatial Downscaling Approach for the SMAP Passive Surface Soil Moisture Product Using Random Forest Regression. J. Hydrol. 2018, 563, 1009–1024. [Google Scholar] [CrossRef]
  31. Srivastava, P.K.; Han, D.; Ramirez, M.R.; Islam, T. Machine Learning Techniques for Downscaling SMOS Satellite Soil Moisture Using MODIS Land Surface Temperature for Hydrological Application. Water Resour. Manag. 2013, 27, 3127–3144. [Google Scholar] [CrossRef]
  32. Wan, Z. Collection-6 MODIS Land Surface Temperature Products Users’ Guide; ERI, University of California: Santa Barbara, CA, USA, 2006. [Google Scholar]
  33. Sayler, K.; Glynn, T.A. Landsat 8-9 Collection 2(C2) Level 2 Science Product(L2SP) Guide; Department of the Interior U.S. Geological Survey: EROS Sioux Falls, SD, USA, 2022.
  34. Sayler, K.; Zanter, K. Landsat 4-7 Level 2 Science Product (L2SP) Guide; Department of the Interior U.S. Geological Survey: Sioux Falls, SD, USA, 2021.
  35. Werner, M. Shuttle Radar Topography Mission (SRTM) Mission Overview. Frequenz 2001, 55, 75–79. [Google Scholar] [CrossRef]
  36. Ludwig, R.; Schneider, P. Validation of Digital Elevation Models from SRTM X-SAR for Applications in Hydrologic Modeling. ISPRS J. Photogramm. Remote Sens. 2006, 60, 339–358. [Google Scholar] [CrossRef]
  37. Krieger, G.; Moreira, A.; Fiedler, H.; Hajnsek, I.; Werner, M.; Younis, M.; Zink, M. TanDEM-X: A Satellite Formation for High-Resolution SAR Interferometry. IEEE Trans. Geosci. Remote Sens. 2007, 45, 3317–3341. [Google Scholar] [CrossRef]
  38. Gonzalez, C.; Luis, J.; Bello, B.; Zink, M. TanDEM-X 30m Edited DEM Product Description; Microwaves and Radar Institute: Oberpfaffenhofen, Germany, 2023. [Google Scholar]
  39. Wang, Z. Study on the Evolution Mechanism of Regional Groundwater Circulation Under the Condition of Plateau Permafrost Degradation; Chinese Academy of Geological Sciences: Beijing, China, 2020. [Google Scholar]
  40. Li, J.; Sheng, Y.; Chen, J.; Zhang, B.; Wu, J.; Zhang, X. Characteristics of Ground Temperatures and Influencing Factors of Permafrost Development and Distribution in the Source Region of Datong River. Prog. Geogr. 2011, 30, 827–836. [Google Scholar]
  41. Zhang, B.; Sheng, Y.; Chen, J.; Li, J. In-Situ Test Study on the Cooling Effect of Two-Phase Closed Thermosyphon in Marshy Permafrost Regions along the Chaidaer-Muli Railway, Qinghai Province, China. Cold Reg. Sci. Technol. 2011, 65, 456–464. [Google Scholar] [CrossRef]
  42. Liu, X.; Guanter, L.; Liu, L.; Damm, A.; Malenovský, Z.; Rascher, U.; Peng, D.; Du, S.; Gastellu-Etchegorry, J.P. Downscaling of Solar-Induced Chlorophyll Fluorescence from Canopy Level to Photosystem Level Using a Random Forest Model. Remote Sens. Environ. 2018, 231, 110772. [Google Scholar] [CrossRef]
  43. He, X.; Chaney, N.W.; Schleiss, M.; Sheffield, U. Spatial Downscaling of Precipitation Using Adaptable Random Forests. Water Resour. Res. 2016, 5, 8217–8237. [Google Scholar] [CrossRef]
  44. Breiman, L. Bagging Predictions. Mach. Learn. 1996, 24, 123–140. [Google Scholar] [CrossRef]
  45. Breiman, L. Random Forest; University of California Berkeley: Berkeley, CA, USA, 2001. [Google Scholar]
  46. Luo, Y.; Yang, Y.; Yang, D.; Zhang, S. Quantifying the Impact of Vegetation Changes on Global Terrestrial Runoff Using the Budyko Framework. J. Hydrol. 2020, 590, 125389. [Google Scholar] [CrossRef]
  47. Nelson, F.E.; Outcalt, S.I. A Computational Method for Prediction and Regionalization of Permafrost. Arct. Alp. Res. 1987, 19, 279–288. [Google Scholar] [CrossRef]
  48. Peng, X.; Zhang, T.; Frauenfeld, O.W.; Wang, K.; Luo, D.; Cao, B.; Su, H.; Jin, H.; Wu, Q. Spatiotemporal Changes in Active Layer Thickness under Contemporary and Projected Climate in the Northern Hemisphere. J. Clim. 2018, 31, 251–266. [Google Scholar] [CrossRef]
  49. Frauenfeld, O.W.; Zhang, T. An Observational 71-Year History of Seasonally Frozen Ground Changes in the Eurasian High Latitudes. Environ. Res. Lett. 2011, 6, 044024. [Google Scholar] [CrossRef]
  50. Peng, X.; Zhang, T.; Cao, B.; Wang, Q.; Wang, K.; Shao, W.; Guo, H. Changes in Freezing-Thawing Index and Soil Freeze Depth over the Heihe River Basin, Western China. Arctic Antarct. Alp. Res. 2016, 48, 161–176. [Google Scholar] [CrossRef]
  51. Luo, D.; Liua, L.; Jin, H.; Wang, X.; Chen, F. Characteristics of Ground Surface Temperature at Chalaping in the Source Area of the Yellow River, Northeastern Tibetan Plateau. Agric. For. Meteorol. 2020, 281, 107819. [Google Scholar] [CrossRef]
  52. Heggem, E.S.F.; Etzelmu¨ller, B.; Anarmaa, S.; Sharkhuu, N.; Goulden, C.E.; Nandinsetseg, B. Spatial Distribution of Ground Surface Temperatures and Active Layer Depths in the Hovsgol Area, Northern Mongolia. Permafr. Periglac. Process. 2006, 17, 357–369. [Google Scholar] [CrossRef]
  53. Fang, X.; Luo, S.; Lyu, S.; Cheng, C.; Li, Z.; Zhang, S. Numerical Modeling of the Responses of Soil Temperature and Soil Moisture to Climate Change over the Tibetan Plateau, 1961–2010. Int. J. Climatol. 2021, 41, 4134–4150. [Google Scholar] [CrossRef]
  54. Duman, T.; Huang, C.W.; Litvak, M.E. Recent Land Cover Changes in the Southwestern US Lead to an Increase in Surface Temperature. Agric. For. Meteorol. 2021, 297, 108246. [Google Scholar] [CrossRef]
  55. Feng, Y.; Sihai, L.; Xingxing, K.; Guangjun, W.; Xu-Sheng, W.; Pan, W.; Li, W.; Wu, Q. Effect of Climate and Thaw Depth on Alpine Vegetation Variations at Different Permafrost Degrading Stages in the Tibetan Plateau, China. Arctic Antarct. Alp. Res. 2019, 51, 155–172. [Google Scholar] [CrossRef]
  56. Luo, D.; Jin, H.; Lü, L.; Zhou, J. Spatiotemporal Changes in Extreme Ground Surface Temperatures and the Relationship with Air Temperatures in the Three-River Source Regions during 1980–2013. Theor. Appl. Climatol. 2016, 123, 885–897. [Google Scholar] [CrossRef]
  57. You, Y.; Guo, L.; Yu, Q.; Wang, X.; Pan, X.; Wu, Q.; Wang, D.; Wang, G. Spatial Variability and Influential Factors of Active Layer Thickness and Permafrost Temperature Change on the Qinghai-Tibet Plateau from 2012 to 2018. Agric. For. Meteorol. 2022, 318, 108913. [Google Scholar] [CrossRef]
  58. Shen, T.; Jiang, P.; Ju, Q.; Zhao, J.; Chen, X.; Lin, H.; Yang, B.; Tan, C.; Zhang, Y.; Fu, X.; et al. Permafrost on the Tibetan Plateau Is Degrading: Historical and Projected Trends. J. Hydrol. 2024, 628, 130501. [Google Scholar] [CrossRef]
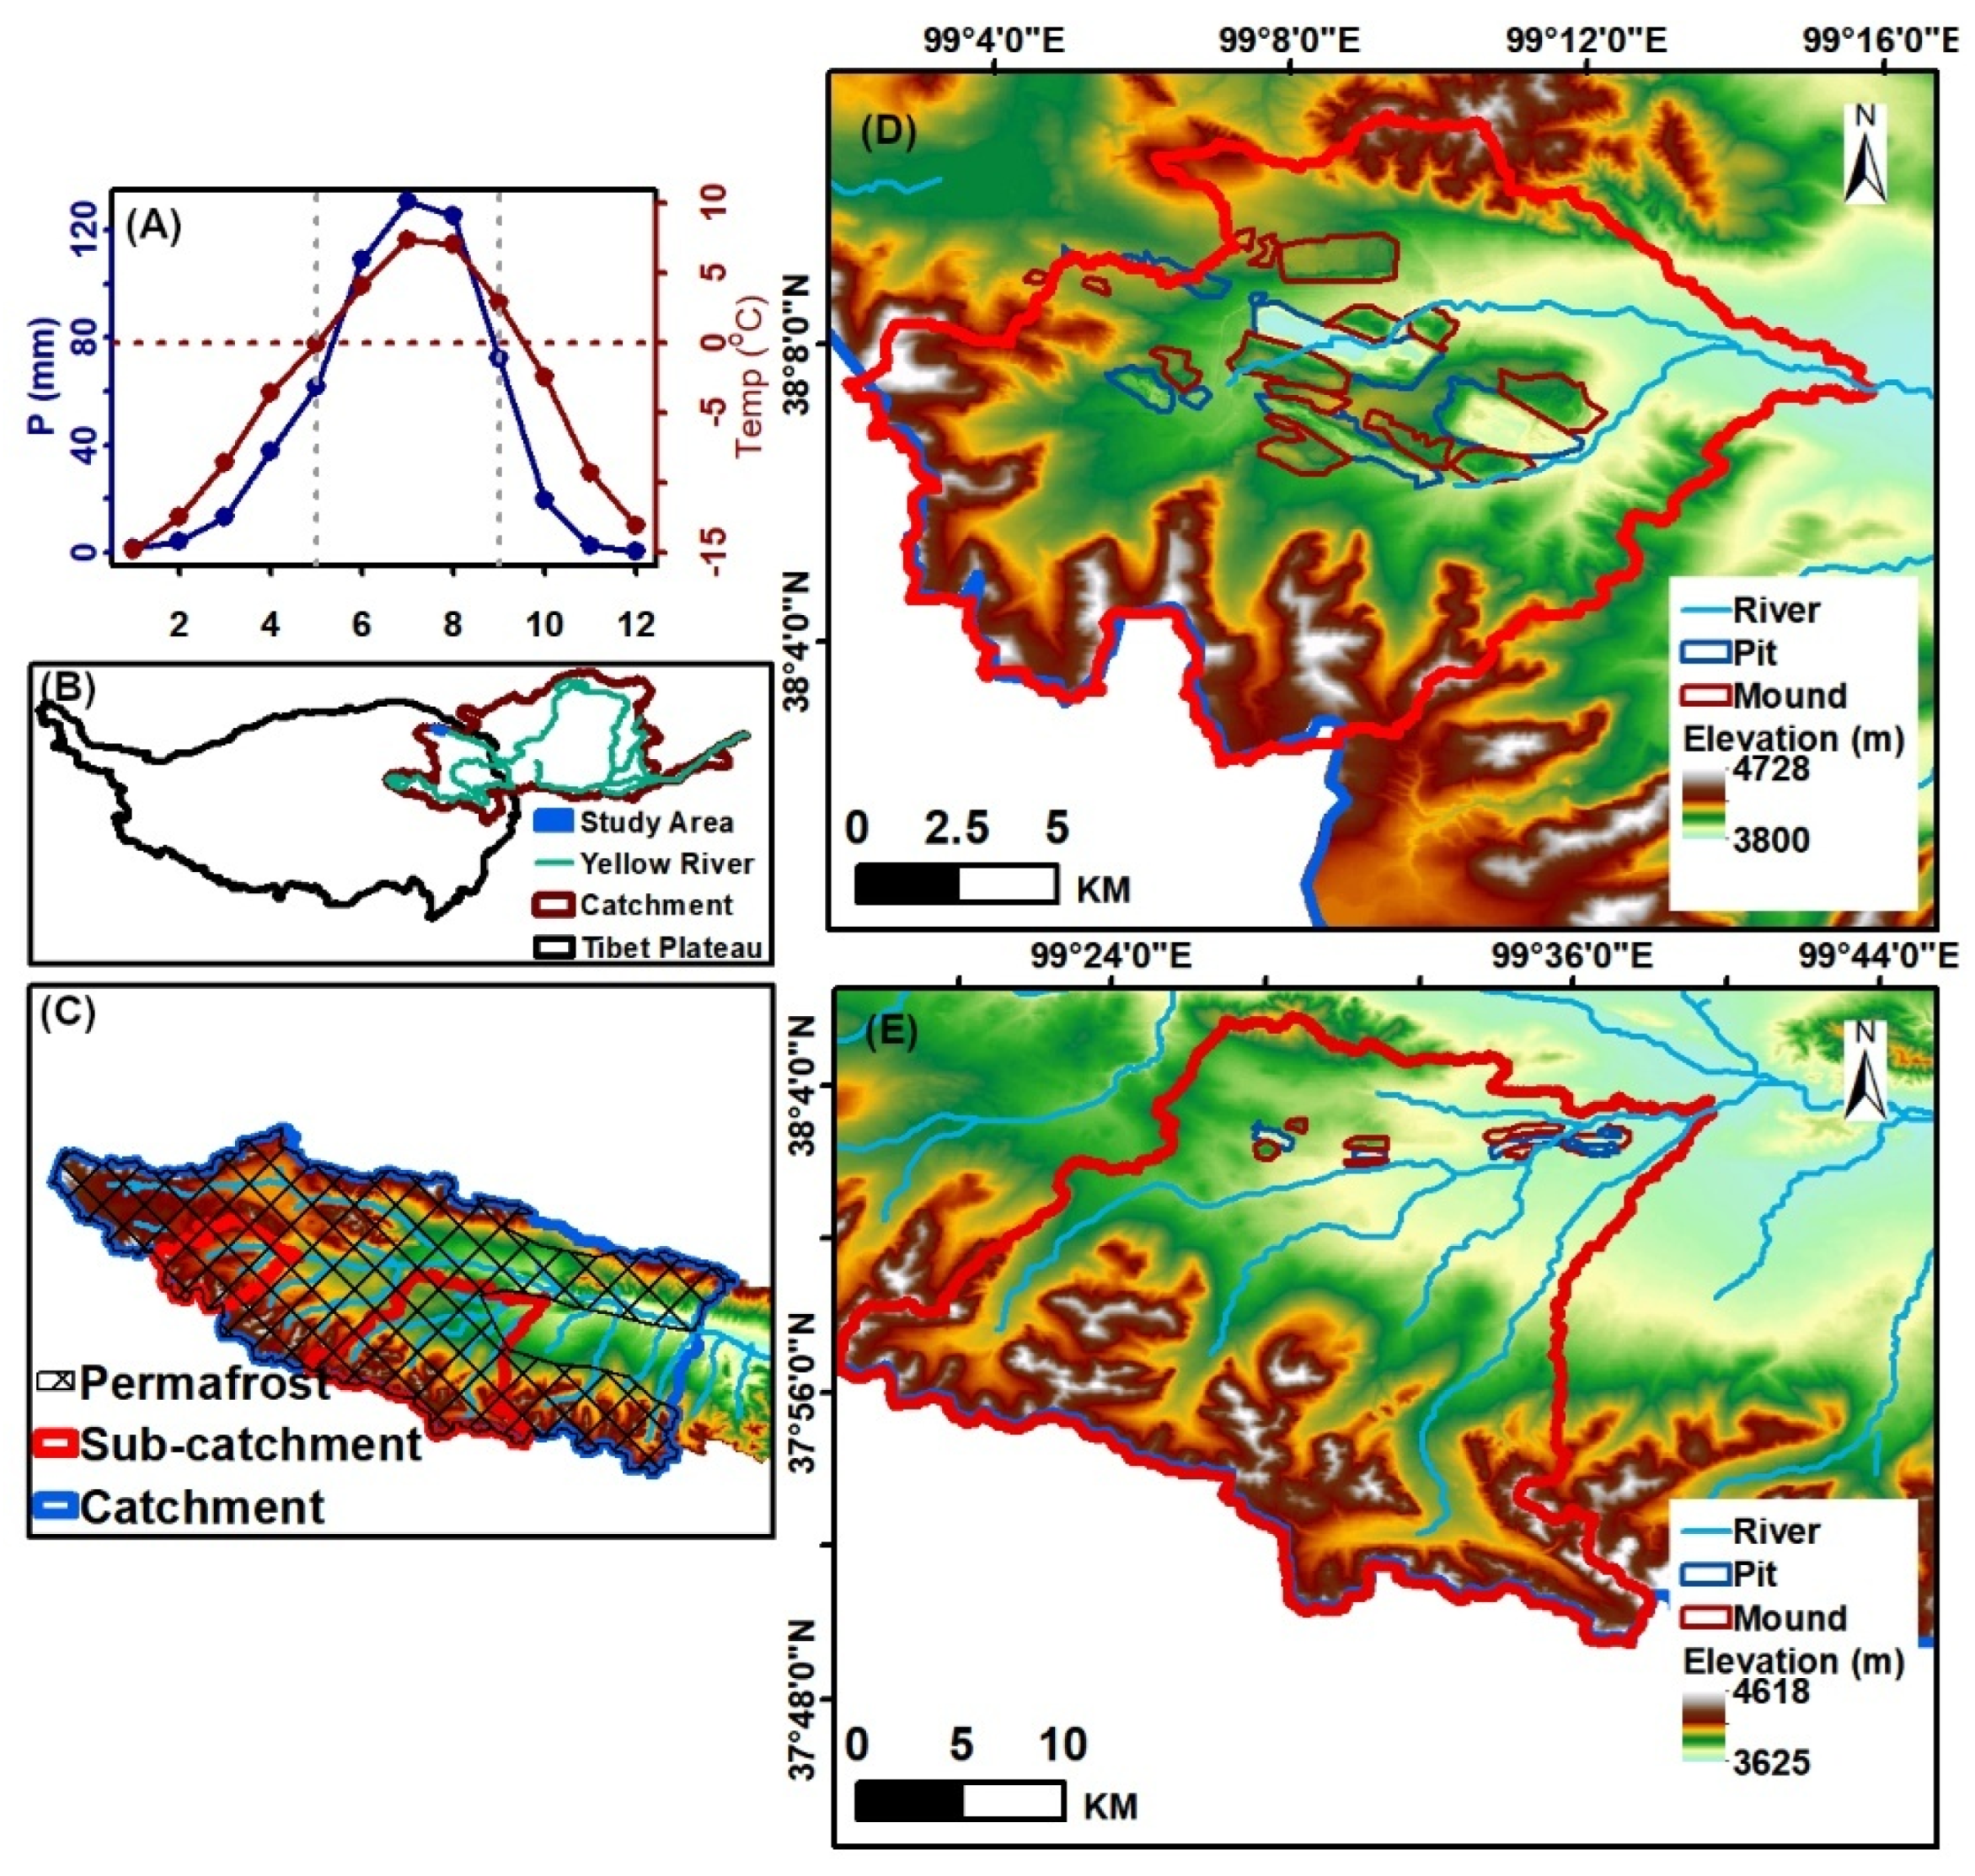
Figure 1. Location and terrain of the study area. The elevation is based on the TanDEM-X 30 m Edited DEM. (A) Seasonal distribution of monthly mean Tair and monthly P in the Muri area; (B) location of the Muri area in the Tibetan Plateau and the catchment of the Yellow River; (C) location of the two mining areas (JHG and JC) and permafrost coverage in the study area; (D) elevation and drainage network in the JHG mining area; (E) elevation and drainage network in the JC mining area.
Remotesensing 17 03482 g001
Figure 2. Workflow of this study.
Remotesensing 17 03482 g002
Figure 3. Land cover and LST on 2022-07-05 around typical in situ ALT measurements in Muri area. (A-1A-4) views of the land adjacent to the typical in situ ALT measurements on 2022-07-05; (B-1B-4) LST in the area adjacent to the typical in situ ALT measurements on 2022-07-05; (C-1C-4) histograms of LST and NDVI on 2022-07-05 in the windows for homogeneity determination for corresponding in situ. The red boxes in (A-1B-4) indicate the windows for homogeneity determination for individual in situ ALT measurements. The purple lines in (A-1,C-1) indicate the river section in the bounds of the area.
Remotesensing 17 03482 g003
Figure 4. Quality of random forest models used for downscaling MODIS NDVI and MODIS LST and the variables’ importance in the two models. (A) Quality of random forest model for MODIS NDVI downscaling; (B) variables’ importance in the random forest model for MODIS NDVI downscaling; (C) quality of random forest model for MODIS LST downscaling; (D) variables’ importance in the random forest model for MODIS LST downscaling. The importance indicates the mean accuracy decrease in the Gini index.
Remotesensing 17 03482 g004
Figure 5. Differences between MODIS LST, Landsat LST and the downscaled LST in JHG before (2003-08-18) and after mining (2022-07-05). (AC) Spatial distribution of the three LSTs in JHG on August 18th, 2003; (DF) spatial distribution of the three LSTs on 2022-07-05; (G) differences between the three LST products on 2003-08-18 along the profile AA’; (H) differences between the three LST products on 2022-07-05 along the profile AA’; (I) differences between the three LST products on 2003-08-18 along the profile BB’; (J) differences between the three LST products on 2022-07-05 along the profile BB’. Red shed indicates mine waste heap and blue shed indicates mine pits.
Remotesensing 17 03482 g005
Figure 6. Differences between MODIS LST, Landsat and the downscaled LST in JC before (2003-08-18) and after mining (2022-07-05). (AC) Spatial distribution of the three LST products in JC on 2003-08-18; (DF) spatial distribution of the three LST products on 2022-07-05; (G) differences between the three LST products on 2003-08-18 along the profile CC’; (H) differences between the three LST products on 2022-07-05 along the profile CC’. Red shed indicates mine waste heap, and blue shed indicates mine pits.
Remotesensing 17 03482 g006
Figure 7. Quality of ALT estimated in this study.
Remotesensing 17 03482 g007
Figure 8. Maps of errors in ALT estimated in this study. (AC) Error in the ALT estimated from MODIS LST in the years 2002, 2012 and 2022; (DF) error in the ALT estimated from the downscaled LST in the years 2002, 2012 and 2022. The green lines indicate the drainage network, the red polygons indicate the waste dump heaps and the blue polygons indicate the mine pits.
Remotesensing 17 03482 g008
Figure 9. ALT estimated for the Muri area in 2002, 2012 and 2022. (AC) ALT estimated from MODIS LST for the Muri area in 2002, 2012 and 2022; (DF) ALT estimated from the downscaled LST for the Muri area in 2002, 2012 and 2022; (GI) ALT estimated from MODIS LST for the JHG mine in 2002, 2012 and 2022; (JL) ALT estimated from the downscaled LST for the JHG mine in 2002, 2012 and 2022; (MO) ALT estimated from MODIS LST for the JC mine in 2002, 2012 and 2022; (PR) ALT estimated from the downscaled LST for the JC mine in 2002, 2012 and 2022. The green lines indicate the drainage network, the red polygons indicate the waste dump heaps and the blue polygons indicate the mine pits.
Remotesensing 17 03482 g009
Figure 10. Spatiotemporal variations in NDVI, MODIS LST and the downscaled LST and ALTs along the profiles indicated in Figure 5 and Figure 6. (AC) Spatiotemporal variations in July NDVI along the three profiles indicated in Figure 5 and Figure 6; (DF) spatiotemporal variations in MODIS LST in July along the three profiles indicated in Figure 5 and Figure 6; (GI) spatiotemporal variations in the downscaled LST in July along the three profiles indicated in Figure 5 and Figure 6; (JL) spatiotemporal variations in the ALT estimated from MODIS LST along the three profiles indicated in Figure 5 and Figure 6; (MO) spatiotemporal variations in ALT estimated from the downscaled LST along the three profiles indicated in Figure 5 and Figure 6. Monthly LST in July were normalized along each profile.
Remotesensing 17 03482 g010
Figure 11. Annual mean LST, annual mean Tair, NDVI in July, LST and ALT during 2001–2023 at typical sites in Muri indicated in Figure 3B,E and Figure 4B,E. (A,C,E,G,I) Annual mean LST, annual mean Tair, NDVI in July, LST and ALT during 2001–2023 at typical sites in Muri; (B,D,F,H,J) monthly LST difference between warm years and mean of 200-2005 at typical sites in the Muri area. Grey sheds in left panel indicated time period of human disturbance, and in right panel, they indicate the time when monthly mean LST was above zero during 2000–2024.
Remotesensing 17 03482 g011
Table 1. DDT-ALT coefficients (R) derived from in situ ALT measurements.
Borehole IDLonLatYearALT (m)NDVI *LST *DDT 30 m (°C)DDT 1 km (°C) R 30   m R 1   k m
MeanSDMeanSD
Baimikong99.2620338.1403720101.20.560.0623.730.81172812250.0290.034
Sainuoranghe99.4658438.1030920091.20.610.1124.291.2612487830.0340.043
ZK_899.864038.0291020091.50.700.0827.210.89117310600.0440.046
ZK_1699.678638.0212420091.50.520.0723.650.68161013250.0370.041
ZK_1899.6478138.0358920092.00.550.1023.870.78171114310.0480.053
ZK_1999.2670838.1411220081.50.530.0523.650.47160014690.0370.039
ZK_2399.6626638.0235220081.30.560.0924.942.23 **11879790.0350.042
ZK_2499.6582838.0288520081.00.560.0424.760.58148113460.0390.041
Q_099.553037.890220161.10.600.1122.221.44 **108010450.0370.032
Q_299.583037.963220161.40.610.0324.3360.89101611920.0440.041
Q_599.6738838.0958720161.40.570.0526.680.90128513960.0390.037
Q_699.6705638.0859220161.60.60.0826.150.73133312610.0440.045
*: NDVI and LST were obtained from the image acquired by Landsat-8 OLI on 2022-07-05. **: Partially covered by clouds.
Disclaimer/Publisher’s Note: The statements, opinions and data contained in all publications are solely those of the individual author(s) and contributor(s) and not of MDPI and/or the editor(s). MDPI and/or the editor(s) disclaim responsibility for any injury to people or property resulting from any ideas, methods, instructions or products referred to in the content.