1. Introduction
Water vapour (WV) plays a fundamental role in the CBL by influencing thermodynamic processes, facilitating cloud initiation and formation mechanisms, releasing latent heat as a result of condensation, and ultimately contributing to precipitation [
1]. Understanding water vapour dynamics in the CBL is crucial for an in-depth comprehension of weather patterns, climate dynamics, and the overall functioning of the Earth’s atmosphere. The release of latent heat during water condensation processes within clouds provides an important energy source for the CBL. This release further enhances convective processes, contributing to air vertical motion, the formation of eddies, cloud development, and the redistribution of heat within the atmosphere. In the present work, measurements of the latent heat flux (
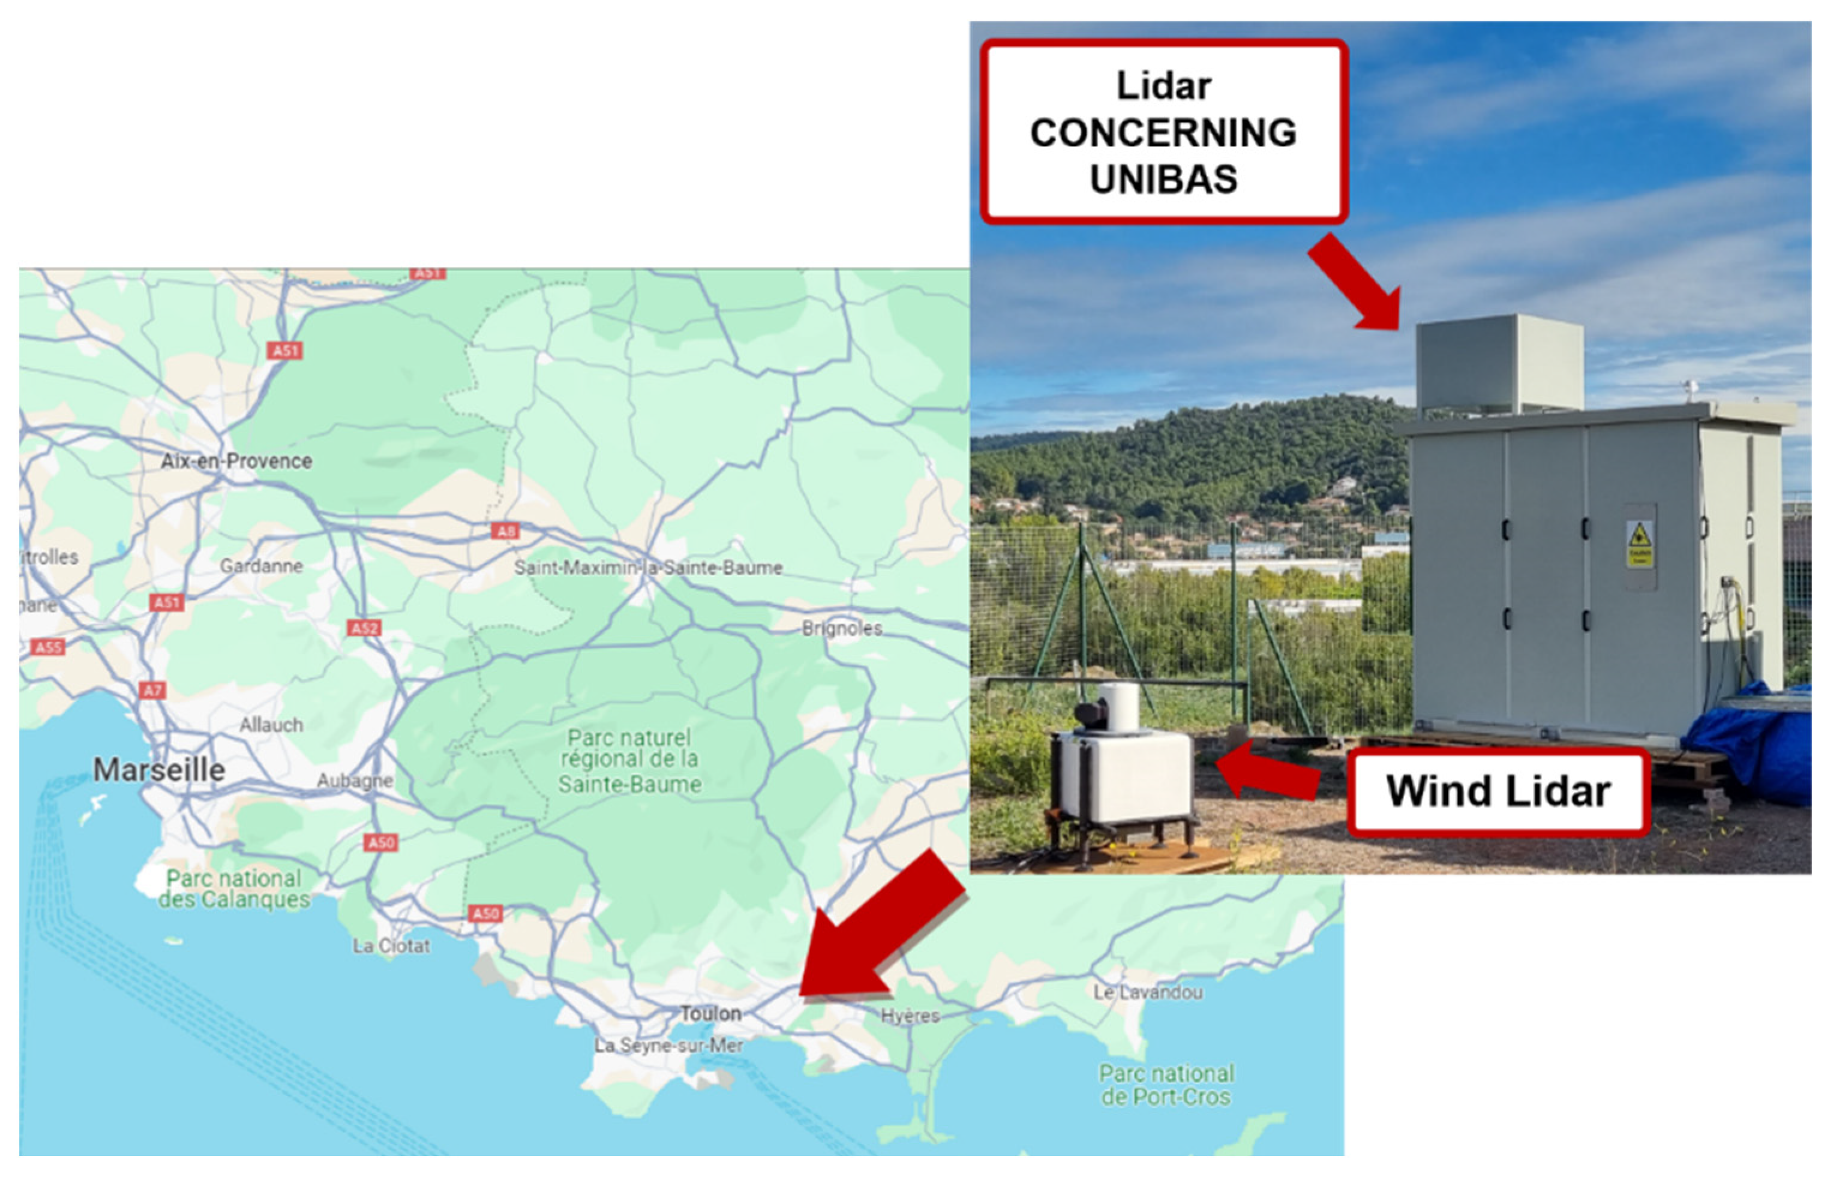
L(z)) are obtained through the combined use of two lidars: a commercial wind lidar (Halo Photonics Line XR) and the research thermodynamics Raman lidar CONCERNING (COmpact RamaN lidar for Atmospheric CO
2 and ThERmodyNamic ProfilING, see
Figure 1).
These systems were deployed in southern France at the University of Toulon (Toulon-La Garde, Lat.: 43.14°N, Lon.: 6.01°E, Elev.: 65 m) during the period from September 2022 to January 2023 in the frame of the
WaLiNeAs campaign. This campaign was conceived with the aim of improving the forecasting capability of heavy precipitation events (HPEs), with a specific focus on those taking place in the Mediterranean basin, and specifically over southeastern France [
2]. The aim was to obtain improved forecasting capabilities based on assimilation into physically based mesoscale forecasting models of accurate, high space and time-resolution water vapour profile measurements carried out by a network of eight autonomously operational water vapour Raman lidars covering a large geographical area in southern France and eastern Spain.
Among the mesoscale models involved in the project was the kilometre-grid-size mesoscale model AROME-France (French Application of Research to Operations at Mesoscale), on which a four-dimensional ensemble–variational assimilation approach with 15 min updates was implemented. The proposed water vapour Raman lidar network was designed with the goal of effectively capturing the most relevant water vapour sources and transport patterns known to contribute to the generation of HPEs in southern France. As part of the WaLiNeAs initiative, the water vapour Raman lidar CONCERNING operated continuously over the four-month period, providing accurate, high vertical and time resolution atmospheric water vapour profile measurements.
A wind lidar was operated in the proximity of the Raman lidar (~10 m apart), providing measurements of the horizontal and vertical wind components. The combined operation of a water vapour Raman lidar and a Doppler wind lidar provides an effective and comprehensive data set to characterise the exchange of energy and moisture at the land–atmosphere interface and related feedback mechanisms. The combined use of these two lidars allows for complete lidar-based measurements of the sensible (
H(z)) and latent (
L(z)) heat flux profiles, which are of paramount importance to study the exchange of heat and moisture between the Earth’s surface and the atmosphere (among others, [
3]).
Measurements of
H(z) and
L(z) may also be used to verify the different similarity relationships associated with the latent heat flux [
4,
5]. These authors, summarising and deriving the current state of the proposed similarity relationships for the latent heat flux, with a special emphasis on convective boundary layer processes, showed that a number of similarity relationships can be effectively demonstrated through the availability of high-resolution lidar measurements, primarily focusing on water vapour variance. Further opportunities to verify similarity relationships based on the availability of lidar data in different locations and atmospheric conditions result from the availability of the present dataset.
In the present work, we illustrate three different examples of latent heat flux profile measurements. The reported results were obtained from simultaneous and co-located profile measurements of the water vapour mixing ratio, carried out by the thermodynamic lidar CONCERNING based on the application of the roto-vibrational Raman lidar technique; and vertical wind speed, carried out by a Doppler wind lidar. Latent heat flux profiles were calculated using the eddy covariance method, with the water vapour flux Q(z) being the covariance between the vertical velocity fluctuations (w′) and the water vapour mixing ratio fluctuations (q′) time series.
In this study, vertical profiles of latent heat flux and turbulent kinetic energy are computed using lidar data at the full 10 s time resolution over 30 min cloud-free intervals. The selected periods—31 October, 28 November, and 8 December 2022—were all characterised by clear-sky conditions, with the only exception of 8 December 2022 when clear conditions are however present within the ABL and throughout most part of the free troposphere. For consistency, the same time window (11:45–12:15 UTC) was used on each day.
The results reveal that, in all selected cases, latent heat flux L(z) is found to increase with increasing TKE(z) at any altitude, with L(z) and TKE(z) being highly correlated. The correlation appears even more marked when peak values of L(z) and TKE(z) are considered. Larger values of both L(z) and TKE(z) are found to anticipate more intense precipitation events, thus identifying L(z) and TKE(z) as effective convection precursor variables, with their values increasing with the increasing intensity of the following precipitation events.
This paper is structured as follows.
Section 2 describes the instruments involved (the Raman lidar CONCERNING lidar is described in
Section 2.1 and the Doppler wind lidar in
Section 2.2) and briefly illustrates the methodologies used for the determination of the main turbulent variables (water vapour/latent heat flux and turbulent kinetic energy calculations in
Section 2.3). The results are presented in
Section 3, and the conclusions and future activities are illustrated in
Section 4.
2. Materials and Methods
The thermodynamics Raman lidar CONCERNING and a commercial wind lidar from Halo Photonics were deployed at the University of Toulon in Toulon-La Garde, close to each other (distance: ~10 m), and simultaneously operated for the purpose of providing simultaneous and co-located measurements of atmospheric thermodynamic and dynamic properties. The technical specifications, performance, and operational modes of this two-lidar system are illustrated in detail in the following two subsections.
2.1. The Thermodynamic Lidar CONCERNING
The Raman lidar system CONCERNING was developed by the Lidar Group of the University of Basilicata, in close collaboration with the Institute of Marine Sciences of the Italian National Research Council and the University of Rome “Sapienza”.
The major feature of this system is represented by its ability to perform high-resolution (i.e., 10 s and 3.75 m) and accurate measurements of atmospheric temperature, water vapour, and CO
2 (with the latter channel not yet available at the time of the present field study) both in the daytime and nighttime, based on the application of rotational and vibrational Raman lidar techniques in the UV. Profile data are available above the blind region, i.e., above 100 m. Besides temperature, water vapour, and CO
2, CONCERNING also provides profile measurements of the particle backscattering coefficient at 355, 532, and 1064 nm; the particle extinction coefficient at 355 and 532 nm; and particle depolarisation at 355 and 532 nm. However, in the frame of
WaLiNeAs, for eye-safety reasons, the profile measurements of particle optical properties were only carried out at 355 nm. The most relevant instrumental characteristics of the Raman lidar system CONCERNING are summarised in
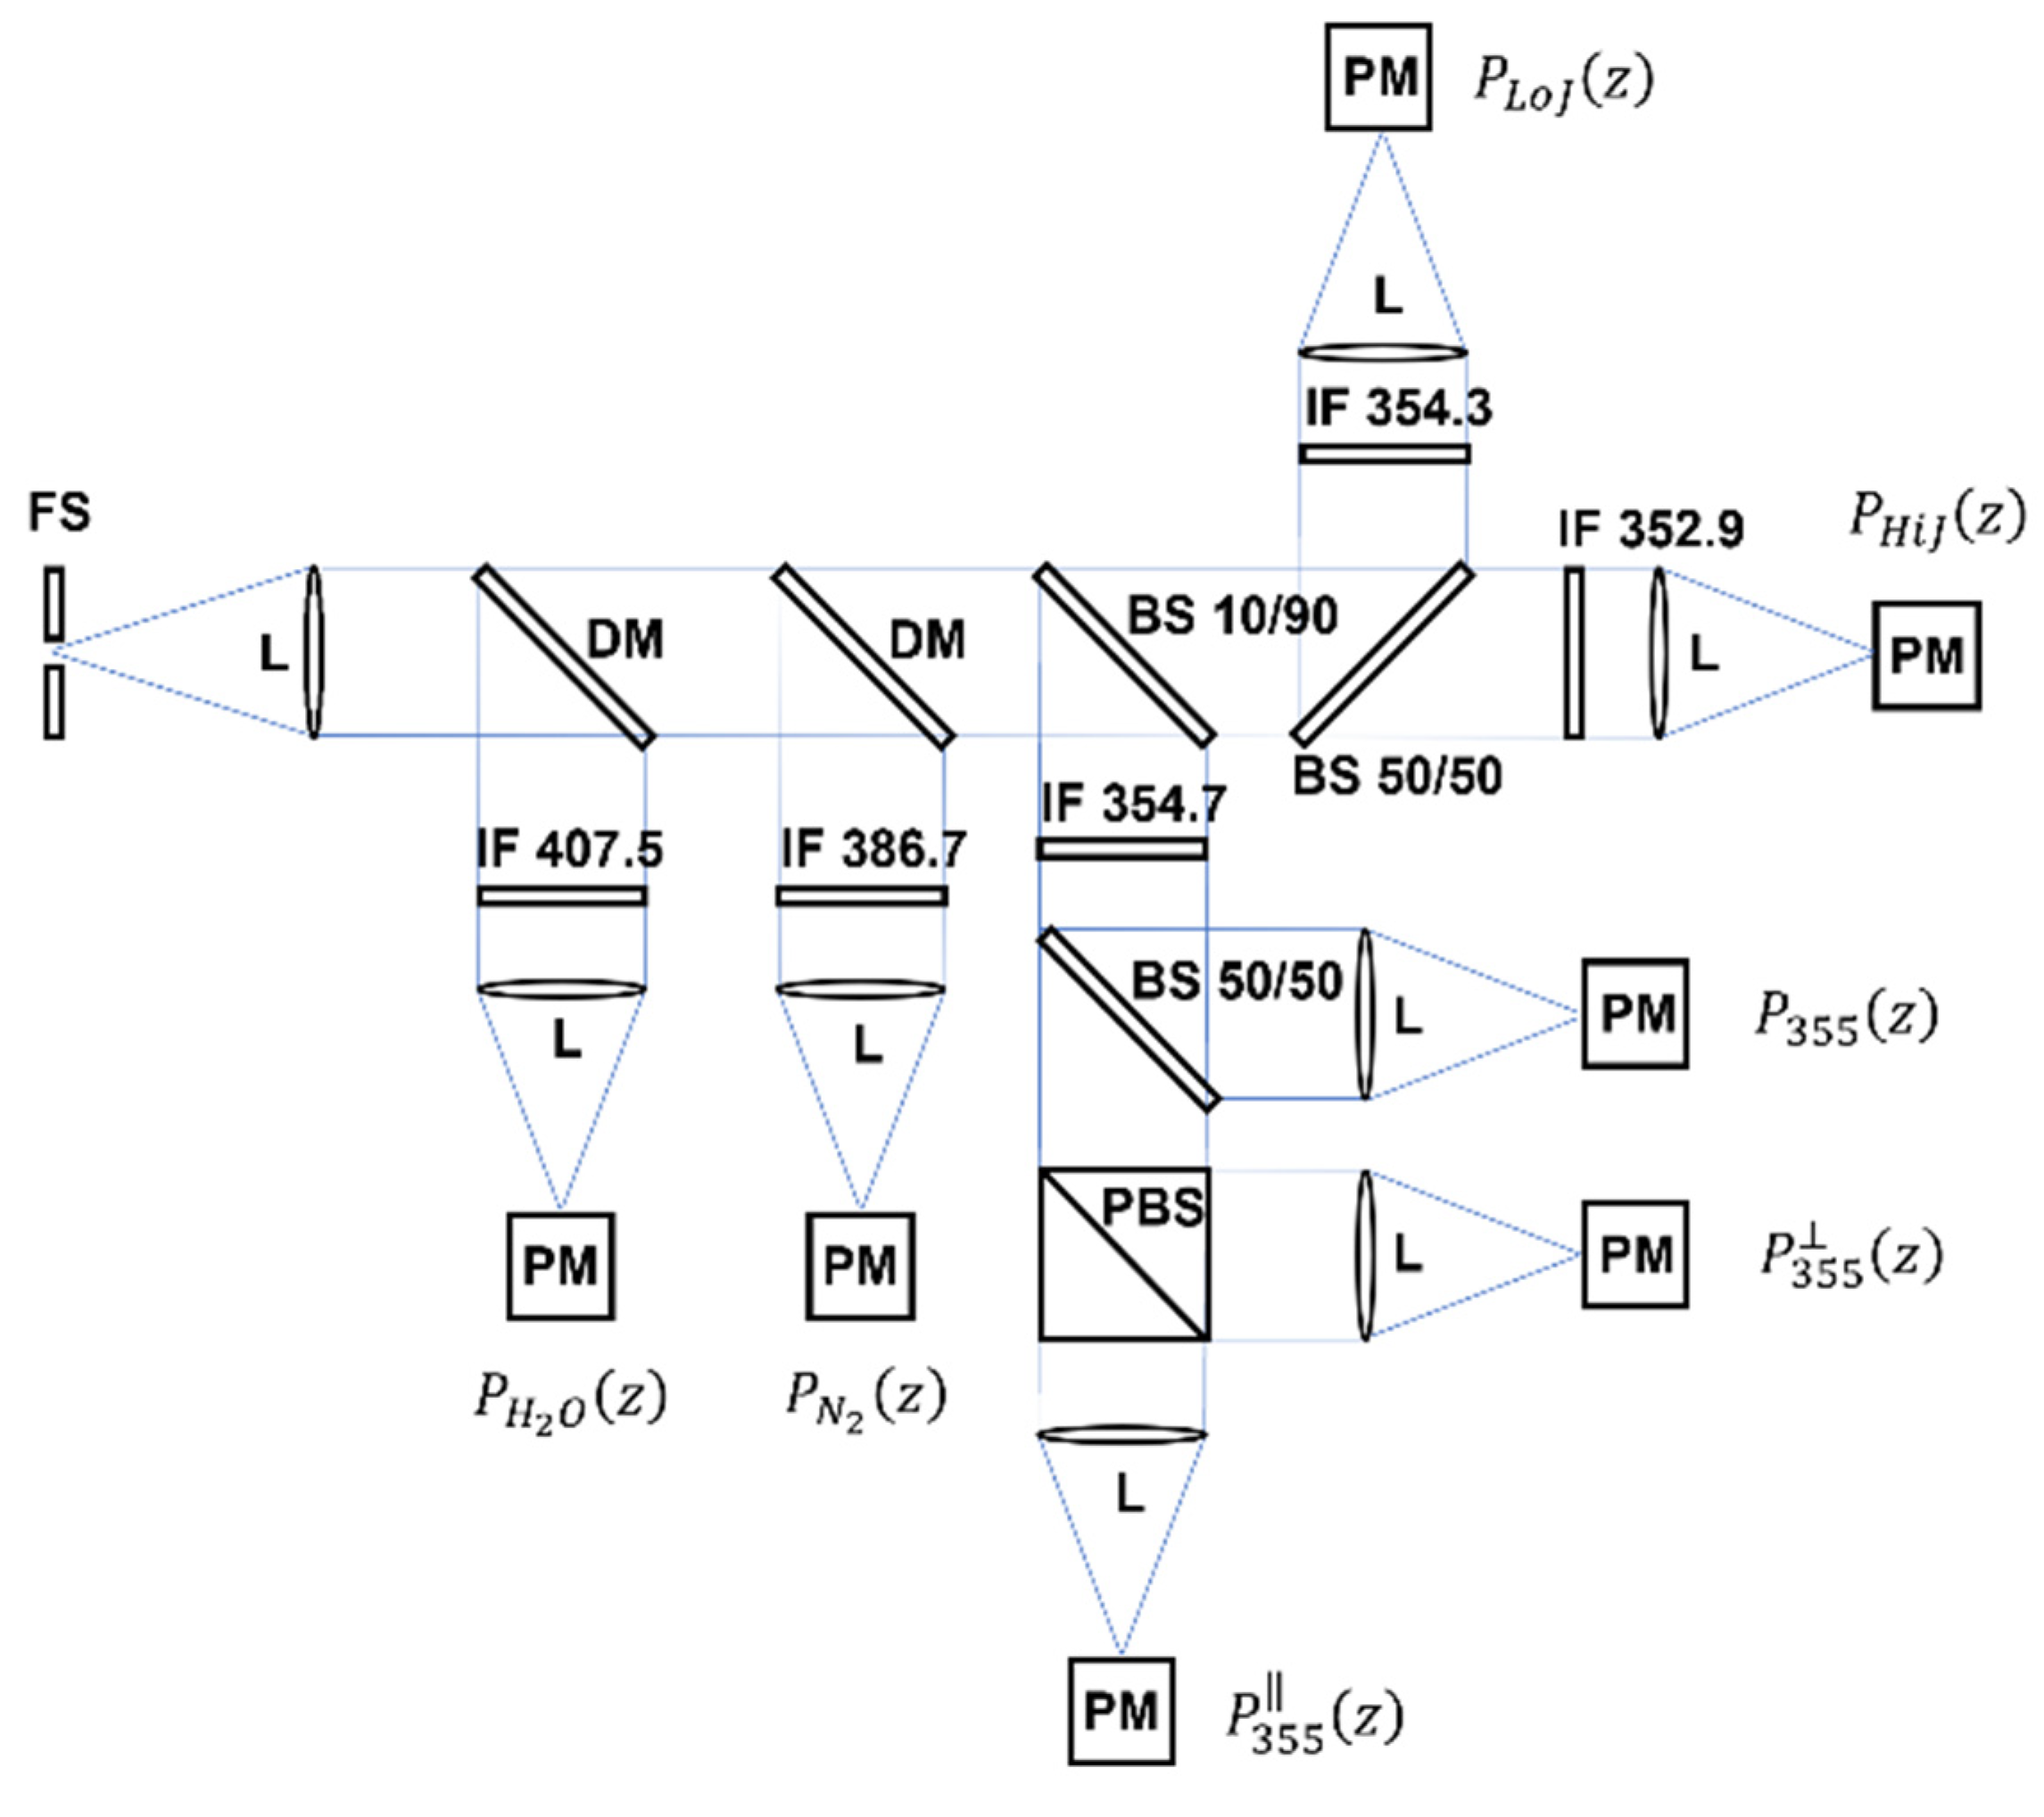
Table 1. A block diagram of the optical configuration of the Raman lidar receiver at the time of operation in the frame of the
WaLiNeAs field campaign is illustrated in
Figure 2.
Raman lidar measurements of the water vapour mixing ratio profile have been extensively reported in the literature [
6,
7,
8].
The approach used to measure the vertical profiles of the water vapour mixing ratio relies on the use of the water vapour and molecular nitrogen roto-vibrational Raman lidar signals
and
, respectively. More specifically, the vertical profile of the water vapour mixing ratio is obtained through the following equation:
where
K is a calibration constant, and
is the differential atmospheric transmission term accounting for the different atmospheric transmissions by molecules and aerosols at the Raman-shifted wavelengths
and
throughout the altitude interval from the lidar station altitude to the scattering volume at level
z.The calibration coefficient
K in Expression (1) can be determined through a calibration procedure based on the comparison between simultaneous and co-located water vapour mixing ratio profiles measured by the lidar and an independent humidity sensor. The approach is described in detail in [
9,
10].
For the purpose of calibrating the Raman lidar system CONCERNING in the frame of WaLiNeAs, two radiosonde launching stations were considered: one located in the proximity of the lidar site (~20 km south-east) and one located at a distance of ~150 km. The first location is “Ile du Levant”. This is a military facility located on the small island of Levant; radiosondes launched from this site had a discontinuous schedule, with 8 radiosondes launched during the three-month period of operation of CONCERNING in the frame of WaLiNeAs.
The second radiosonde launching facility is represented by the WMO official upper-air station of Nîmes-Courbessac (43.86°N, 4.40°E, 60 m, station ID: 07645). The large distance between the Nîmes-Courbessac station and the lidar station makes the use of radiosondes launched from this latter location sub-optimal for lidar calibration purposes. Nevertheless, in conditions of the high horizontal water vapour homogeneity or in case of air masses travelling along the direction connecting the radiosonde and the lidar stations, radiosondes from this station become a precious additional source of information in support of the lidar calibration procedure.
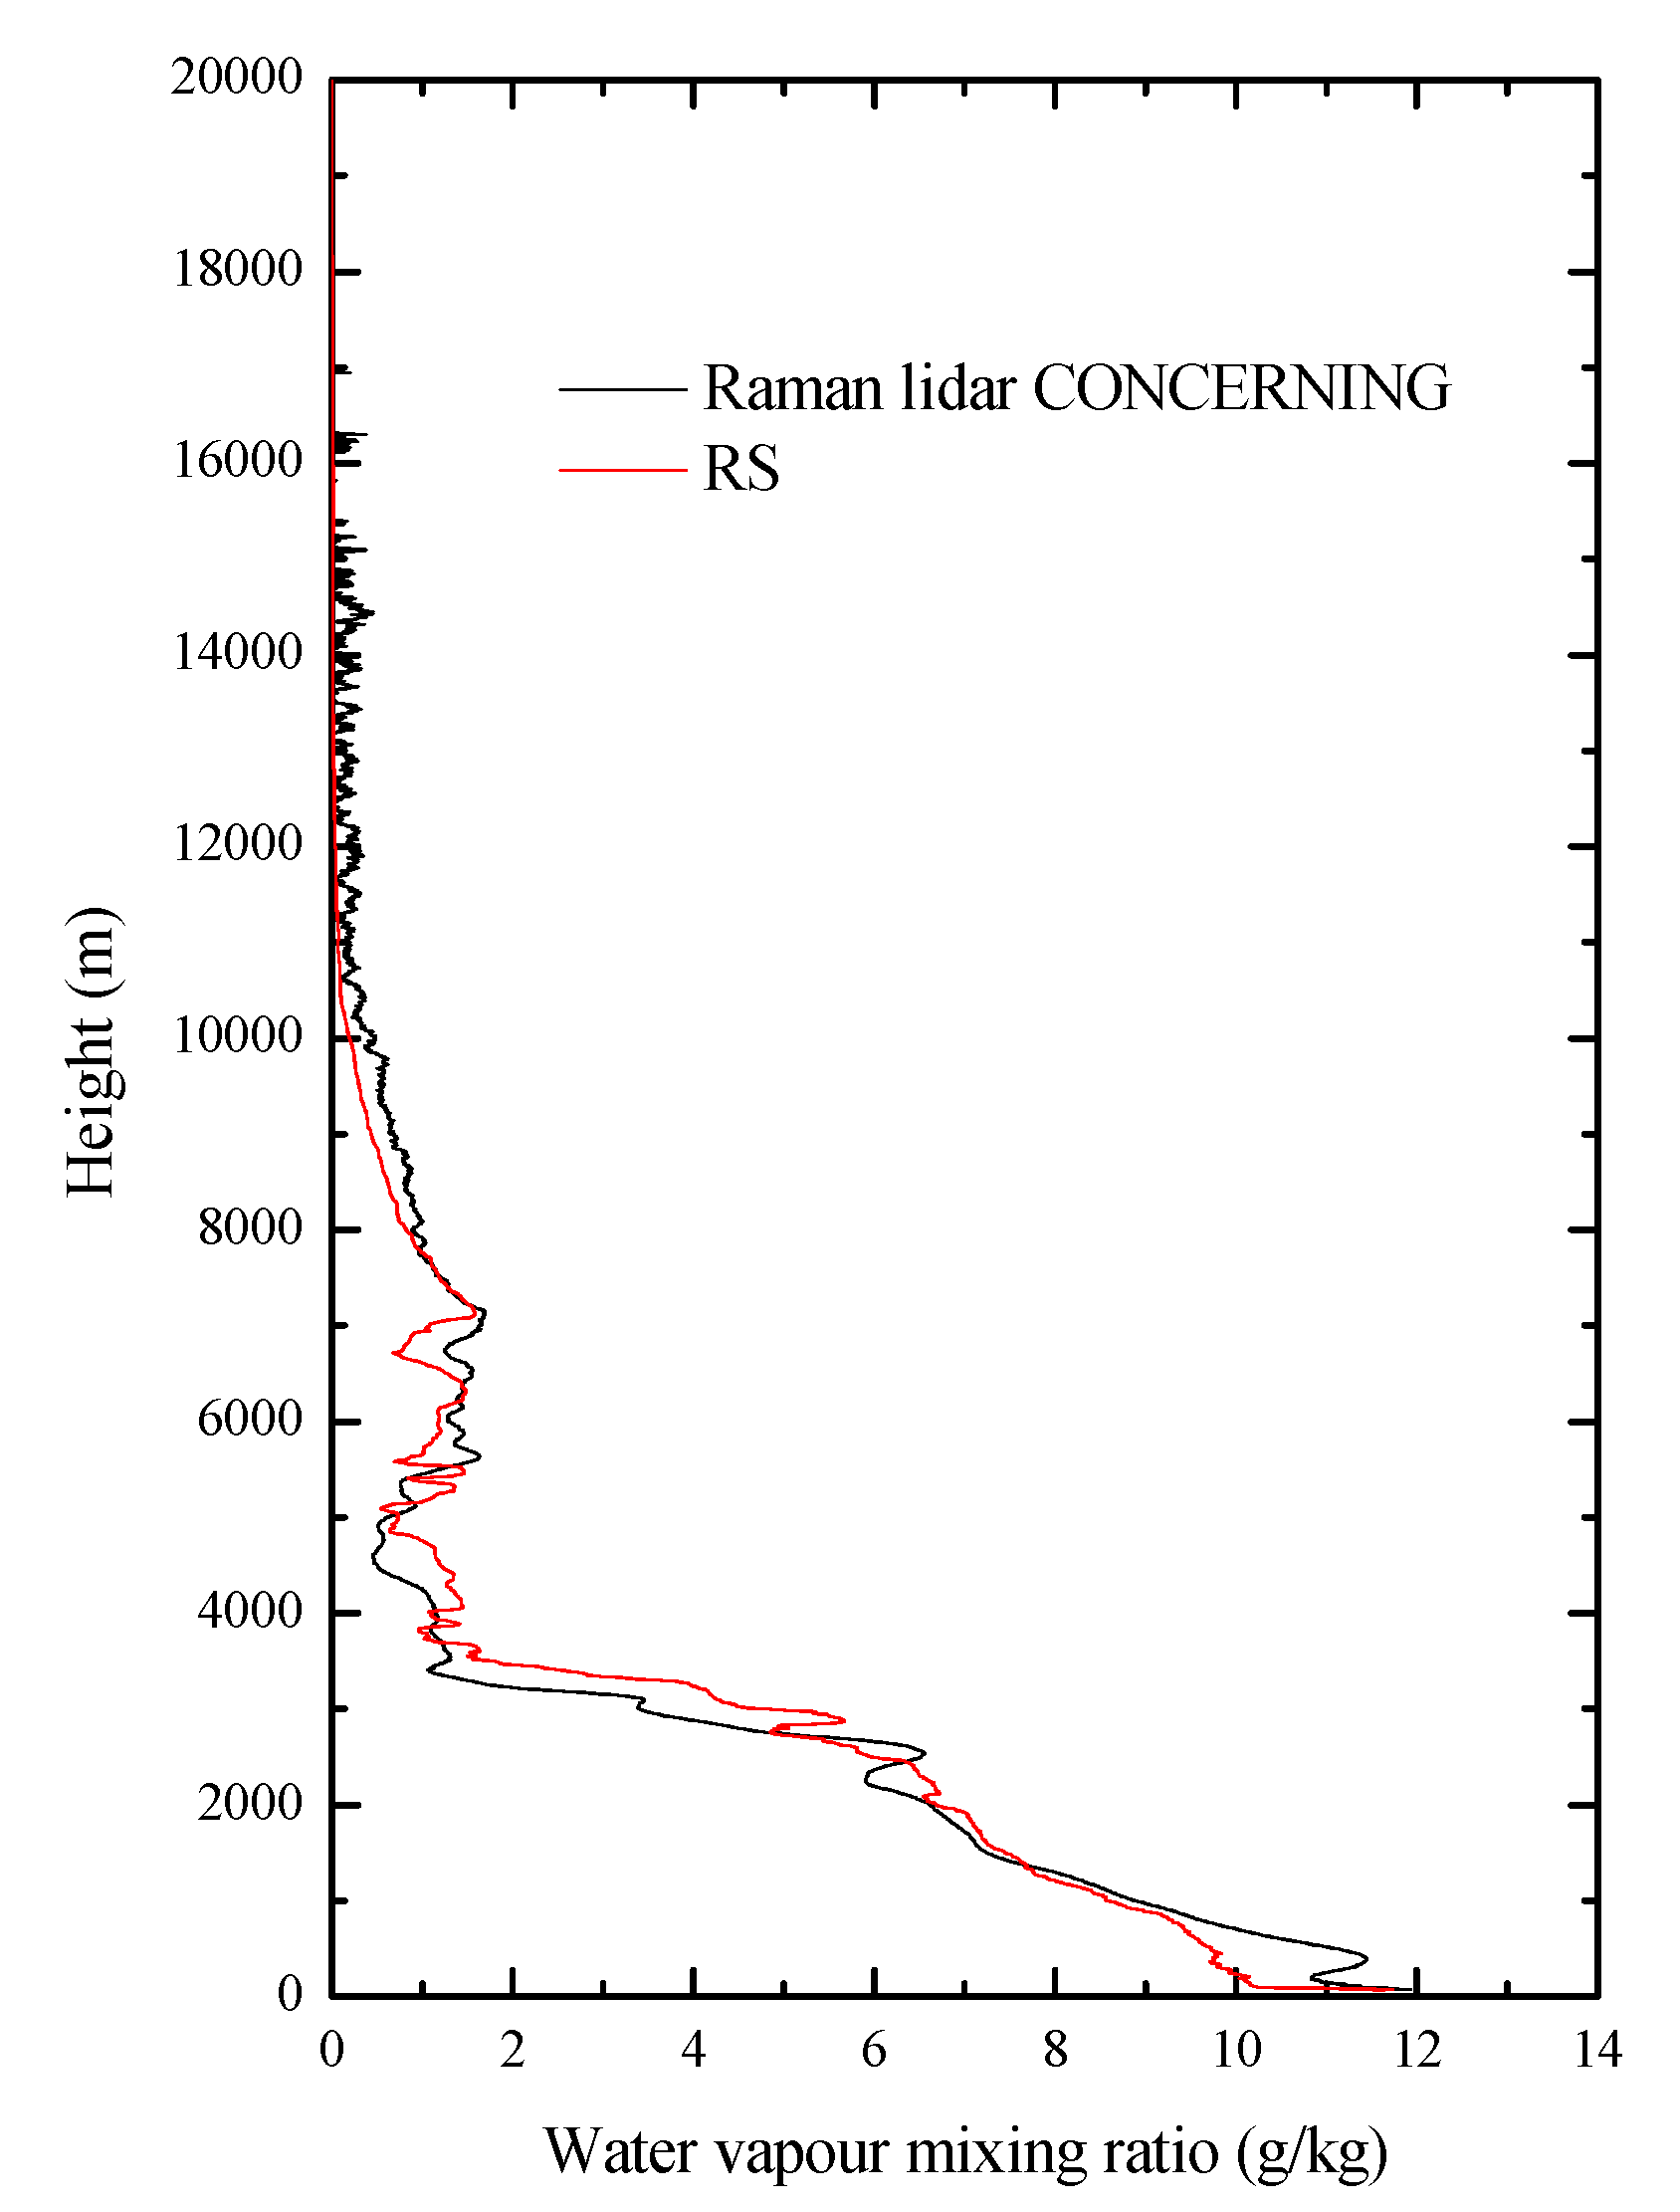
As an example,
Figure 3 illustrates the water vapour mixing ratio profile as measured by CONCERNING over the time interval 01:30–02:00 UTC on 2 October 2022, together with the corresponding profile measured by the radiosonde launched at 00:00 UTC on 2 October 2022 from the station of Nîmes-Courbessac.
The high agreement found between the two profiles supports the hypothesis that the same air masses transited over the radiosonde launching station and the lidar station at different times. Back-trajectory analysis from the NOAA Lagrangian ensemble back-trajectory model HYSPLIT confirm that air masses ending at a height of 2, 4, and 6 km in Toulon at 01:00 UTC on 2 October 2022 had passed over Nîmes-Courbessac approximately 1.5 h earlier. Data from all radiosondes launched from Ile du Levant and from 10 radiosondes launched from Nîmes-Courbessac, were included in the set of radiosondes considered for the determination of the calibration coefficient K. The latter were selected among those fulfilling the above-mentioned requirements in terms of water vapour homogeneity and advection of the same air masses travelling along the direction connecting the radiosonde and the lidar stations.
A total of 18 radiosondes were used to calibrate the lidar water vapour measurements. The comparison between the lidar and the radiosondes was carried out in a vertical region with an extent of 1 km located above the boundary layer to minimise the air mass differences related to the physical distance between the regions probed by the lidar and the radiosonde. The final calibration coefficient K was found to be 41 ± 3 g kg−1. This value was found to be within 2% of the value determined in Potenza before the field deployment, proving further confidence on the good stability of CONCERNING.
2.2. Wind Lidar
A Doppler wind lidar from the CNR-IMAA (National Research Council of Italy—Institute of Methodologies for Environmental Analysis, Potenza, Italy) Atmospheric Observatory (CIAO) was operated at the University of Toulon during the measurement campaign. The system, manufactured by Halo Photonics (model: Stream Line XR), relies on a laser source emitting near-infrared pulses at 1.5 μm, with a single-pulse energy of 100 μJ, a pulse duration of 0.2 μs, and a repetition frequency of 10 kHz. The lidar, with full upper hemisphere scanning capability, is equipped with a heterodyne receiver, measuring range-resolved elastic backscattered echoes from atmospheric particles (aerosols, clouds, fog, and precipitation) and particles’ radial velocity (parallel to the laser beam), with these quantities being derived from the Doppler-shifted backscattered radiation. Lidar measurements have a raw range and temporal resolution of Δ
r = 30 m and Δ
t = 1 s, respectively. Profile data are available above the blind region, i.e., above 90 m. The technical specifications of the Doppler lidar are reported in
Table 2.
The system was continuously operated throughout the duration of the measurement campaign, mainly in zenith pointing configuration, but velocity–azimuth display (VAD) scans were also carried out every 2 min. These periodic scans did not lead to a corresponding lack of information on vertical wind as, in fact, particle radial velocity measurements carried out during these time windows can be processed for retrieving both horizontal and vertical wind components.
In this regard, it should be noted that during WaLiNeAs, the scanning procedure considered 6 off-zenith beam pointing directions, with a constant elevation angle of ε = 75° and with equally spaced azimuth angles 60° apart starting from north, with a temporal integration along each direction of 3 s (average over 30,000 single-pulse echoes) and with a full scan duration of about 30 s.
Assuming suspended atmospheric particles as wind tracers, profiles of vertical wind w (updraft and downdraft) are computed by averaging radial velocity profiles measured in a zenith-pointing configuration over a time interval of 10 s, with vertical resolution of 30 m. Moreover, the vertical profiles of the three-dimensional wind vector components u (zonal wind), v (meridional wind), and w (vertical wind) are retrieved from radial velocity profiles measured for each VAD scan, with a temporal resolution of about 2.5 min and a vertical resolution of Δz = Δr sin (ε) = Δr cos (φ) ≈ 29 m, where φ = 90° − ε is the zenith angle of VAD scans.
The computation is performed assuming wind field horizontal homogeneity and stationarity during each scan and by solving the linear system:
where
v = (u, v, w)
T is the three-dimensional wind vector,
Vr = (V
r1, V
r2, V
r3, … V
r6)
T is the vector of the radial velocities measured during the VAD scan, and
with
αi (i = 1, 2, … 6) azimuth angles of VAD scans (α
1 = 0°, α
2 = 60°, …. α
6 = 300°). The symbol T in the system of Equation (2) is meant to represent the transpose operator. The system of Equation (2) is over-determined and is solved using the least squares algorithm described in [
11], where the wind vector is obtained by the following equation:
where
A+ is the Moore–Penrose pseudoinverse of
A.
2.3. Data Processing and Flux Calculation
By definition, sensible heat flux represents the transfer of heat from the Earth’s surface to the atmosphere associated with the temperature difference between the two [
12]. Latent heat flux represents the transfer of heat from the Earth’s surface to the atmosphere due to the evaporation of water [
13]; consequently, it quantifies the amount of energy transferred into the atmosphere as a result of water evaporation. The measurement unit for both quantities is Wm
−2. Although water vapour is a relatively minor atmospheric constituent, it has primary importance in defining energy exchanges. In fact, it stores and transports energy in the form of latent heat, which is released into the atmosphere when it condenses.
Consequently, the vertical flows of water vapour molecules in the atmosphere can be related to vertical energy flows or, more precisely, to vertical flows of latent heat. Since the latent heat of water is quite constant with temperature, these flows depend on the water vapour content and the vertical component of the atmospheric wind speed. If, therefore, measurements of these two quantities are carried out, it is possible to calculate the latent heat flow through a convolutional process and therefore obtain an estimate of the energy that can potentially be released into the atmosphere when the water vapour condenses cooling adiabatically. Vertical latent heat fluxes constitute a primary aspect of the water cycle in the Earth–environment system, and can be used as a dynamic predictive index of intense precipitation. The greater the latent heat flow (i.e., the greater the relative humidity contained within upward currents), the greater the energy that is potentially released into the atmosphere and the probability that even intense precipitation phenomena will occur.
Eddy covariance (EC) is a technique widely used to measure turbulent fluxes of heat, water vapour, and trace gases between the Earth’s surface and the atmosphere and, in particular, in the CBL, and can ultimately be used to measure sensible and latent heat fluxes. It can be applied to continuous measurements of a wide range of turbulent variables, with high accuracy and with minimal impact on the ecosystems when relying on high-resolution active remote sensing systems like lidars. The EC method is based on the principle that the covariance between vertical wind speed fluctuations (
w′) and fluctuations in the concentration of the gas—in our case, water vapour fluctuations (
q′)—is proportional to the flux of the gas [
14,
15].
The latent heat flux profile L(z), measured in Wm−2, is directly connected to the water vapour flux, measured in g kg−1 ms−1, and can be calculated as the product of Q(z) and the latent heat of vaporisation of water λ (L(z) = λ·Q(z)).
In the present work, the EC approach is applied to high-temporal-resolution lidar profiles of vertical wind speed and water vapour mixing ratio. For the purposes of the present research, data processing makes use of the time-series of high-resolution data profiles (e.g., 10 s) over an extended time interval. Values of the integral scale for water vapour and vertical wind fluctuations within the ABL are typically in the range of 70–150 s [
16,
17]. These values are much larger than the temporal resolution of the present measurements (10 s), which ensures that the temporal resolution considered for the lidar measurements is sufficiently high to resolve turbulent processes down to the inertial subrange and, consequently, the relevant turbulent fluctuations.
In order to obtain flux estimates characterised by a reasonably small statistical uncertainty, we considered an integration time interval of 1800 s and a vertical resolution of 30 m. Three case studies (31 October, 28 November, and 8 December 2022) were selected, considering as selection criteria the presence of clear sky conditions (with the only exception of 8 December 2022 when clear conditions are however present within the ABL and throughout most part of the free troposphere) and the availability of both vertical wind and water vapour mixing ratio profile measurements over a long-enough time interval covering the pre-convective and convective phases and the precipitation events. A quality control check was applied to the data to identify and remove outliers or erroneous measurements. Additionally, water vapour and wind data measured by the thermodynamic Raman lidar and Doppler lidar, respectively, were despiked i.e., assuming a Gaussian distribution, histograms of the data at each height were calculated for the selected period, and then all data outside 4 standard deviations from the median were removed.
The flux is obtained as the covariance product (
cov) of vertical velocity and water vapour mixing ratio fluctuations <
w′·
q′> in a given time or space domain, under the hypothesis that turbulence remains quasi-stationary and spatially uniform over time [
18]:
with the error described by propagation error:
where
w′
(z) and
q′
(z) represent, respectively, the wind velocity and water vapour fluctuation computed every ten seconds (
N = 180) and
σ(z) representing the standard deviation. A linear fit detrending algorithm has been applied to the time series of water vapour (
q′) and vertical wind (
w′) fluctuations. In general, turbulence induced by buoyant eddies within the CBL results in an efficient vertical transport of humidity, either upwards or downwards, contingent upon the location of water vapour sources and sinks. In the specific cases we considered in this paper, the humidity transport within the CBL is oriented upwards, originating from surface evaporation, moving towards cloud condensation; the humidity is then entrained into the drier free troposphere as it sinks, with this phenomenon being also revealed within the flux profiles reported in the next section.
Turbulent kinetic energy (TKE) represents the energy associated with turbulent motion in a fluid. It plays a key role in turbulence modelling and in the study of atmospheric dynamics. It quantifies the kinetic energy due to turbulence within a fluid. TKE, measured in J kg−1, is a crucial variable to characterise the distribution of kinetic energy within turbulent flows and determine how energy is transported and dissipated in these flows. It is often computed as the product of the fluctuations of the different velocity components and is directly related to Reynolds stress tensor (representing the transfer of momentum).
TKE may be quantified from the wind lidar data alone, based on the use of the measurements of the different wind speed components. Specifically, the vertical profiles of the turbulent kinetic energy are calculated from the vertical profiles of wind vector components
u,
v, and
w, using the following equation:
with
σu,
σv, and
σw being the standard deviations of
u, v, and
w, respectively.
For the purpose of this research, measurements of the atmospheric boundary layer height (ABLH) were also considered. These measurements are based on the application of the traditional lidar approach originally reported in [
19]. Specifically, we considered the so-called “derivative approach”, which has been used for decades within the lidar community [
20,
21].
This approach identifies the ABLH as the altitude above the surface at which a first significant gradient of the range-corrected elastic signal is located. As already mentioned above, the Raman lidar system CONCERNING is capable of collecting elastic backscatter echoes at 355, 532, and 1064 nm. However, in the frame of WaLiNeAs, for eye-safety reasons, only elastic backscatter measurements at 355 are available. Consequently, the above approach for the determination of the ABLH is applied to the range-corrected elastic signals at 355 nm (RCS355(z) = [P355(z) − Pbgd]⸳z2), where P355(z) represent the signal power at a wavelength of 355 nm, Pbgd is the signal background, and z is the altitude expressed in m.
2.4. Era5 Reanalysis Dataset
The ERA5 is the latest climate reanalysis produced by ECMWF, providing hourly data on regular latitude–longitude grids at a 0.25° × 0.25° resolution, with atmospheric parameters on 37 pressure levels. ERA5 is publicly available through the Copernicus Climate Data Store (CDS,
https://cds.climate.copernicus.eu (accessed on 15 May 2024)).
The dataset used here is a re-gridded subset of the full ERA5 dataset on native resolution. The present entry is “ERA5 hourly data on single levels from 1940 to present”. A description of the dataset is provided in
Table 3 [
22].
3. Results
The case studies selected for the present research (31 October, 28 November, and 8 December 2022) were particularly suited to study latent heat fluxes as they included periods of weak/intense convective activity followed by precipitation events.
Specifically, on 31 October 2022, the Toulon area (Provence–Alpes–Côte d’Azur region) in southern France experienced dynamic weather conditions influenced by intense convective activity, which represents a frequent phenomenon during the autumn season when warm, moist air masses over the Mediterranean interact with cooler air aloft, resulting in significant vertical wind shear and enhancing turbulence within convective zones. The weather was marked by intense thunderstorms and heavy rainfall. These conditions were likely driven by a Mediterranean low-pressure system combined with warm, moist air masses transported from the Mediterranean Sea.
The convergence of maritime air with colder upper-level air created instability, favouring the development of convective cells capable of producing heavy thunderstorms and intense lightning. Orographic effects from the nearby mountains of the Alpes–de-Haute–Provence and the Maritime Alps might have intensified turbulence in specific areas, especially as moist air was lifted over elevated terrain. The atmosphere was highly unstable, as evidenced by the presence of steep lapse rates, this instability being triggered by warm sea surface temperatures, which provided the necessary heat and moisture to fuel convection. Lifted Index (LI) and CAPE (Convective Available Potential Energy) values likely indicated moderate to high instability, supporting robust updraft within thunderstorm cells. Downdrafts and outflow boundaries generated by storms could have contributed to localised turbulent mixing near the surface, particularly during storm downdraft surges.
A different weather situation occurred on 28 November 2022, with weather conditions in the Toulon area being those typical of the late autumn season, characterised by moderate temperatures and some rain, but with no severe thunderstorm events being reported in the area. The maximum temperature was around 10–12 °C during the day, and patchy rain events were observed throughout the day, suggesting moist and relatively unstable atmospheric conditions leading to weak convective activity, most likely driven by the temperature gradient between cooler air masses and warmer surfaces.
These conditions were accompanied by a moderate level of cloud cover and occasional breaks. With a mixed presence of rain and clouds, vertical air movements were present, but were insufficient to trigger significant storms or deep convection. Given the patchy rain and the relatively calm wind speeds in the region, turbulence was likely mild, mostly confined to near-surface layers or areas of localised rain. These conditions are well aligned with late November’s typical weather in the Toulon area, where moderate rainfall and cooler temperatures dominate the seasonal pattern.
The thermodynamic environment on 8 December 2022 was characterised by cool and humid air conditions, typical of the early winter season, with surface temperatures in the range of 6–12 °C. As a result of the low surface temperatures and reduced solar heating, atmospheric conditions were moderately stable, turbulent activity was light, and the potential for convection was limited. Stratiform clouds were present at the lidar site, with a cloud base around 3 km until 09:00 UTC and between 1 and 2 km afterwards. Stratiform precipitation was observed in the afternoon. Embedded convective processes were likely taking place within the stratiform clouds. The presence of moderate winds (15–16 km/h), with variable direction and speed, may have enhanced the potential for localised turbulent conditions, leading to moderate additional precipitation.
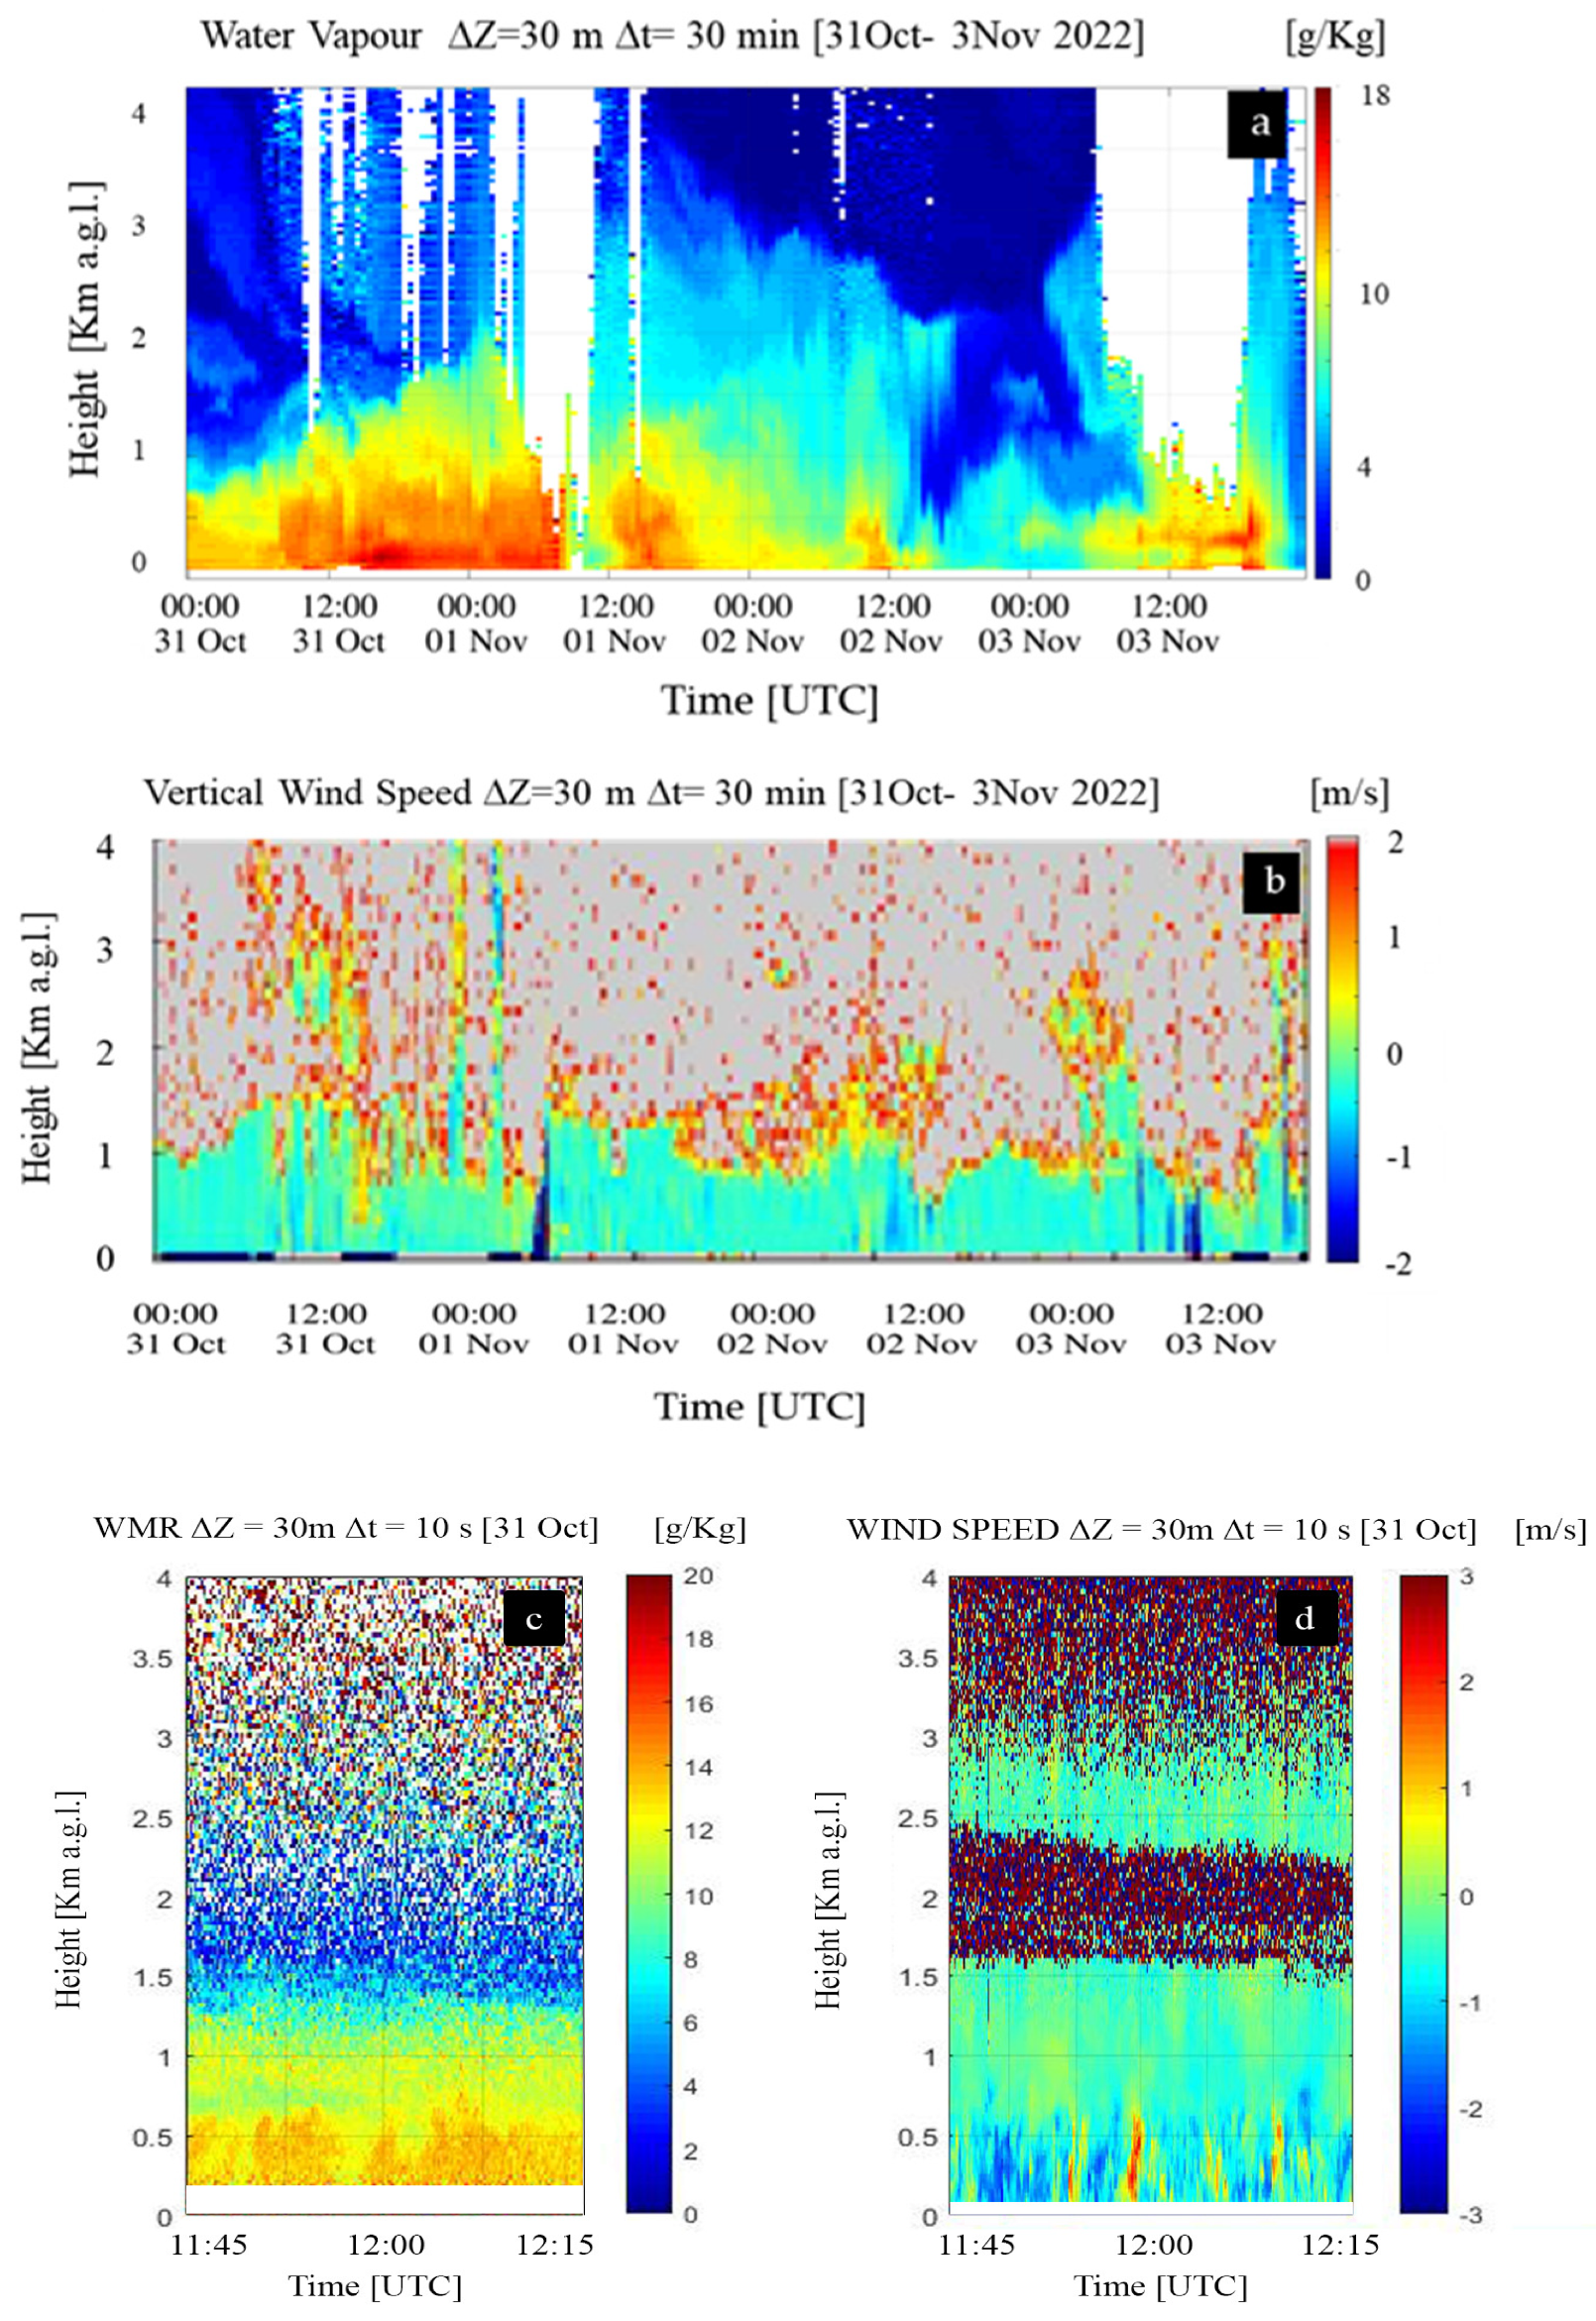
Focusing on the first case study on 31 October 2022,
Figure 4 illustrates a time–height cross-section representing the evolution of the water vapour mixing ratio (g/kg) over the time interval 31 October–3 November 2022 (panel “a”) and the vertical wind speed (m/s) (panel “b”), while in panels “c” and “d”, we can see the water vapor and wind speed represented in high resolution (10 s) necessary to determine the parameter
L(z).
The water vapour mixing ratio cross-section is based on consecutive vertical profiles, each integrated over a 30 min time interval, while the vertical wind speed cross-section is based on 15 s consecutive profiles, both with a vertical resolution of 30 m.
Figure 4a clearly highlights the large variability in the water vapour mixing ratio within the CBL associated with the presence of intense updrafts and downdrafts. At the time of the flux measurements (11:45–12:15 UTC on 31 October 2022), the largest variability is observed in the interfacial layer as a result of the penetration of the warm humid air rising from the ground and the entrainment of cool dry air from the free troposphere.
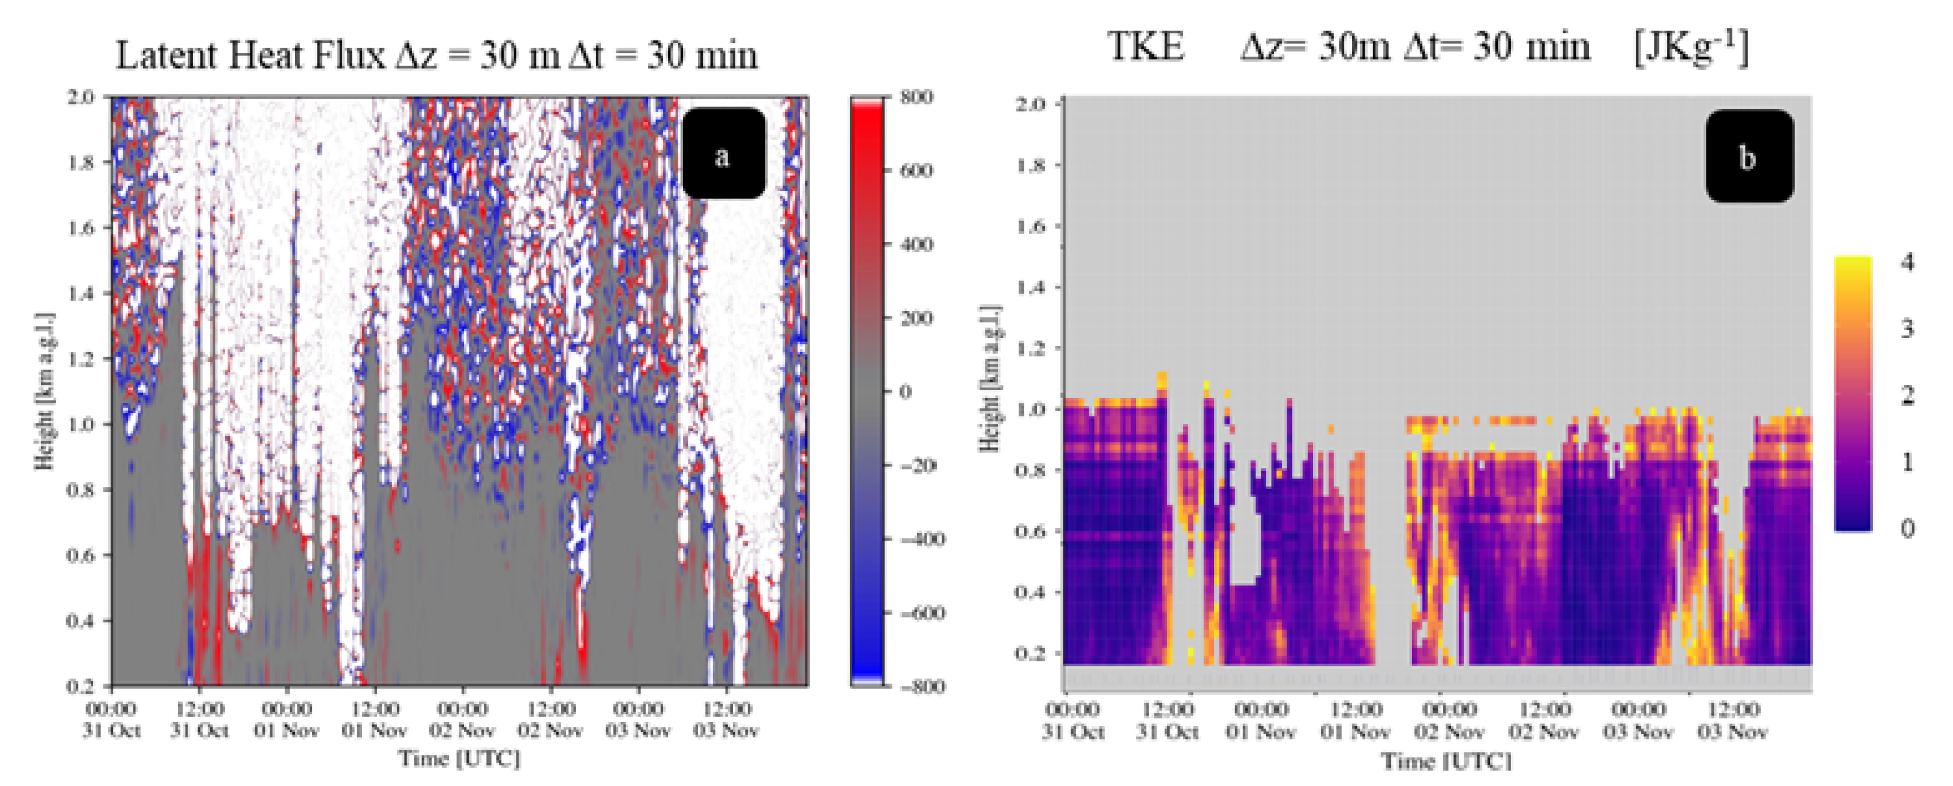
Figure 5a illustrates the time–height cross-section of the latent heat flux for the same time interval considered in
Figure 4. To generate this map, a sequence of consecutive half-hour latent heat flux profiles was considered. Each of these profiles was obtained based on the application of the approach illustrated in
Section 2.3. Specifically, we considered high space (30 m) and temporal (10 s) resolution profiles of vertical velocity and water vapour mixing ratio fluctuations and computed the covariance between these profiles, integrating over consecutive half-hour time intervals (1800 s).
Figure 5a reveals a large variability in
L(z), with smaller values (around 100 Wm
−2) in the lower portion of the CBL and much larger values (in excess of 500 Wm
−2) in the upper portion of the CBL—that is, in the region where the atmosphere is more thermodynamically active and where updrafts and downdrafts and the corresponding exchanges in latent heat associated with cloud formation processes and precipitation events are more marked.
Figure 5b illustrates the time–height cross-section of the turbulent kinetic energy over the same time interval considered in
Figure 5a. To generate this map, a sequence of consecutive half-hour turbulent kinetic energy profiles was considered. Each of these profiles was obtained based on the application of the approach illustrated in
Section 2.3.
Figure 5a,b clearly reveals the build-up of the conditions necessary for strong convection, with increasing values of both quantities after 12:00 UTC.
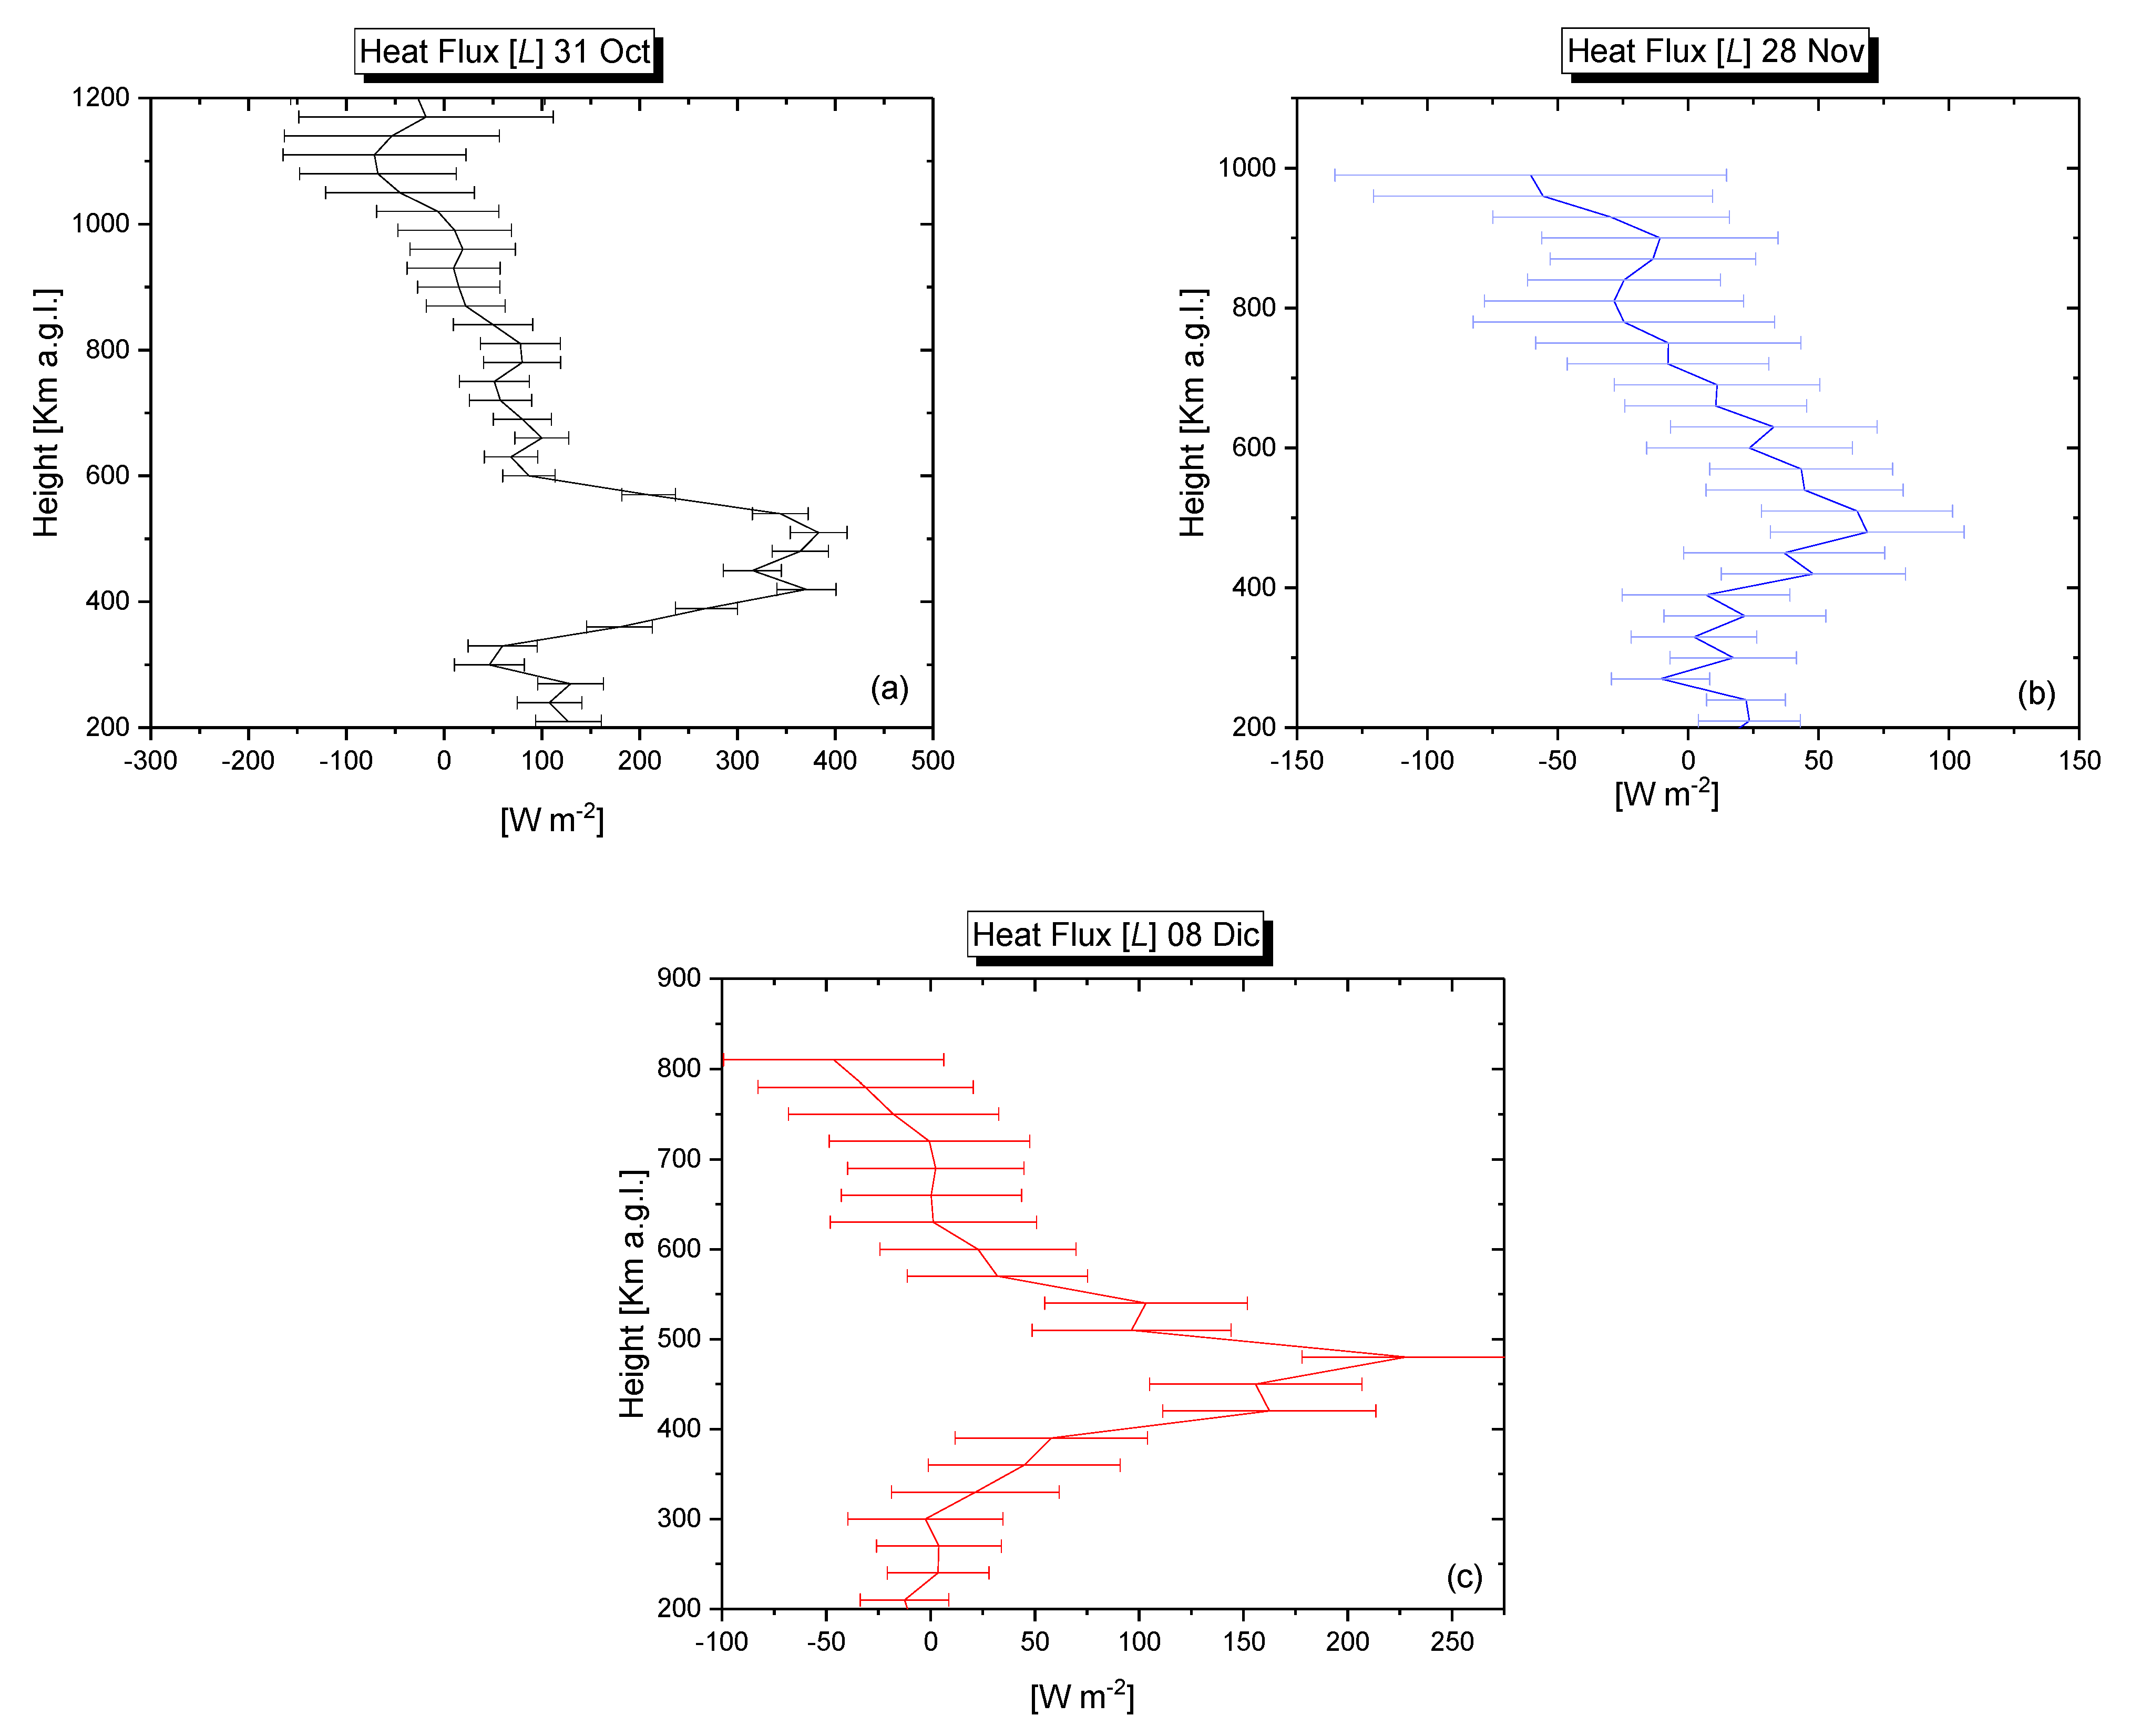
Figure 6 illustrates the latent heat flux profiles for the three selected case studies on 31 October, 28 November, and 8 December 2022. The profiles in the figure are reported together with corresponding error bars. This representation enables the uncertainty, primarily statistical, affecting these measurements to be illustrated.
All three profiles are characterised by values increasing with altitude up to approx. 500 m, with peak values of 380, 70, and 220 Wm
−2 on 31 October, 28 November, and 8 December 2022, respectively. Above this altitude, latent heat flux values are found to decrease with a steep negative gradient up to approx. 600 m and more gradually above this altitude, returning to zero at an altitude of approx. 1000 m on 31 October 2022 and at an altitude of approx. 800 m on 28 November and 8 December 2022, i.e., just above the top of the CBL (
Table 3). This altitude trend testifies to the occurrence of upward humidity transport, drying out the mid and lower CBL by the entrainment of dry air from above. Latent heat flux values fluctuating around zero are found at the top of the boundary layer, most probably associated with the statistical uncertainty affecting the water vapour and wind lidar fluctuation profile measurements in this altitude region.
Values at an altitude of 200 m, the minimum altitude for which lidar data are available, are around 120 Wm−2 on 31 October 2022, i.e., during the strongest convective event, while these values are almost zero for the other two days, characterised by weak convective activity. It is to be specified that data are also available below 200 m, but are not considered here because they are characterised by high statistical uncertainty as a result of the limited superimposition between the laser beam and the lidar receiver field of view.
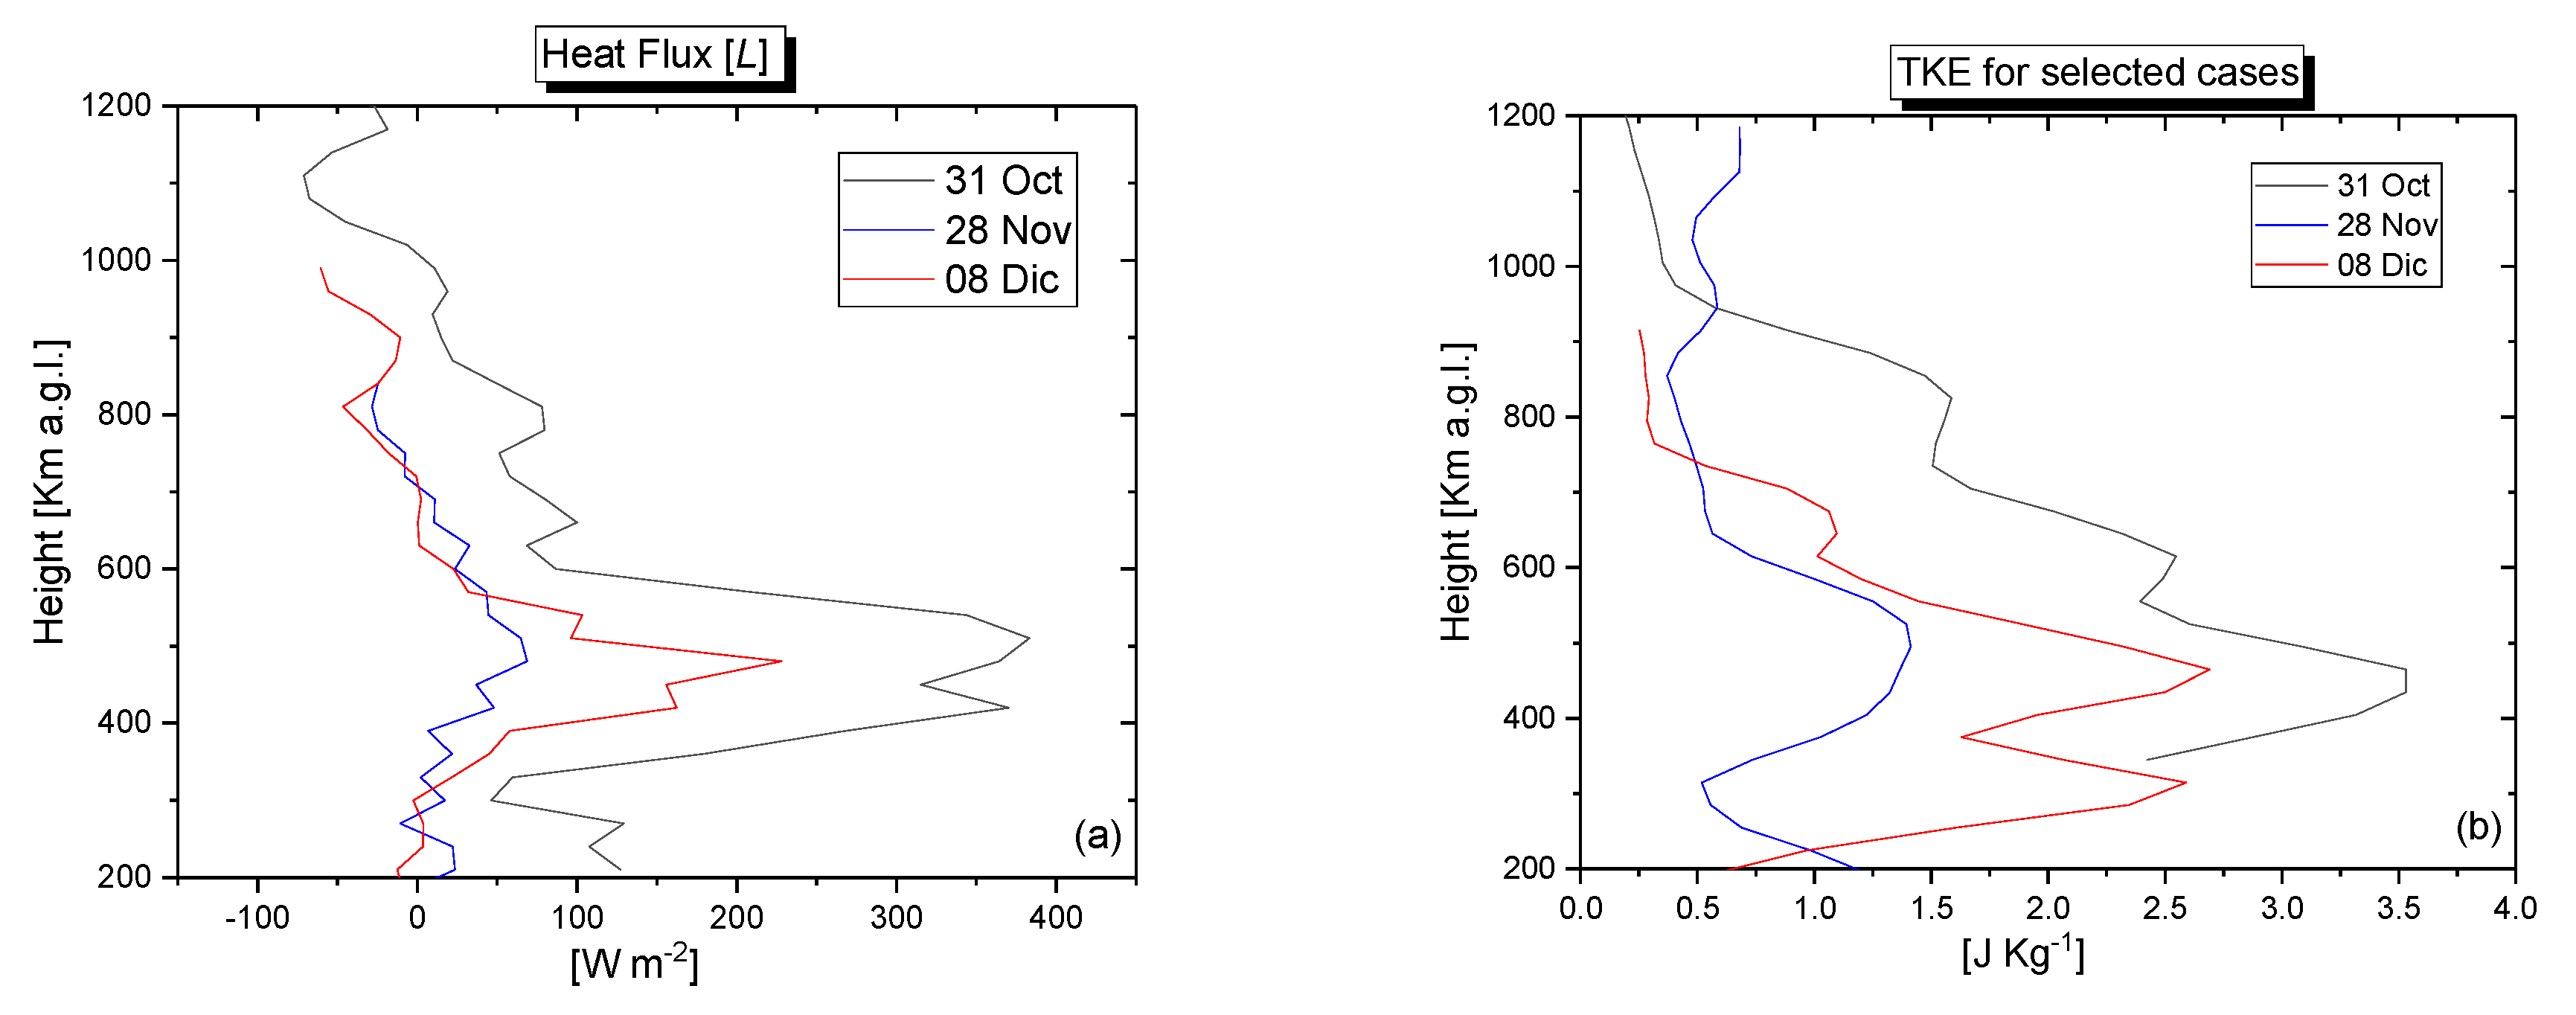
The latent heat flux profiles for the three selected case studies are also illustrated in a single plot in
Figure 7a, while
Figure 7b illustrates the corresponding
TKE profiles.
TKE profiles are characterised by an increasing trend with altitude similar to the one found for the latent heat flux, with values increasing with altitude up to approx. 500 m, with peak values of 3.6, 1.4, and 2.75 J kg
−1 on 31 October, 28 November, and 8 December 2022, respectively. Above this altitude, the
TKE values are found to decrease with a steep negative gradient up to approx. 600 m and more gradually above this altitude. Peak values for
L(z) and
TKE are found in the upper portion of the CBL, with the CBL height (for more details, see [
23,
24,
25]) being 900, 700, and 750 m on 31 October, 28 November, and 8 December 2022, respectively (see
Table 4). The maximum value of
L and
TKE in the upper part of the CBL is most likely due to the fact that the largest variability in these quantities is expected to be at the interfacial layer, below the CBL top and the entrainment region, as a result of the penetration of warm humid air rising from the ground and the entrainment of cool dry air from the free troposphere.
The above results can also be correlated with the total precipitation, expressed in mm, in the 10–12 h period following the convective events.
Table 4 compares the maximum value of
TKE in the CBL for the three selected case studies with the amount of precipitation in the region in the following 10–12 h. Precipitation data were taken from the fifth generation of ECMWF’s reanalyses (ERA5 hourly data on single levels, available from 1940 to the present). Precipitation values refer to the grid bin including the lidar station (~50 km of horizontal resolution). When comparing the point measurements of lidar vs. analysis data with a size grid of 50 km, the representativeness error affecting lidar measurements of convection-related phenomena has to be kept in mind; this has been estimated to not exceed 10–20% for all reported case studies.
The results in the table reveal that precipitation amount values are correlated with the maximum value of TKE(z) and L(z) found in the CBL during the pre-convective regime preceding the precipitation event. In general, higher maximum values of TKE and latent heat flux are associated with more intense precipitation events shortly thereafter.
4. Discussion
Data suggest that the convective boundary layer (CBL) dynamics play a crucial role in determining the magnitude of latent heat flux (
L) and turbulent kinetic energy (
TKE), which, in turn, influence the type and intensity of convection. While measurements of sensible heat flux (
H(z)) are outside of the scope of this paper, some considerations on their expected impact on the characterisation of the thermodynamic environment are underlined here. For the intense precipitation event (31 Oct.–2 Nov.), we expect
H to be relatively small compared to
L, given the high moisture content and latent heat release. This suggests a low Bowen ratio, indicating that latent heat flux dominates. For the light precipitation event (28 Nov.), we expect
H to be relatively higher than
L, given the drier conditions. This suggests a moderate to high Bowen ratio, indicating that sensible heat flux might be comparable to or dominate latent heat flux. For the moderate precipitation event (8 Dec.–9 Dec.), we expect
H to be slightly smaller than
L. This suggests a moderate Bowen ratio, indicating a balance between sensible and latent heat fluxes. Results supporting these speculations were reported in [
26].
Summarising the key observational results, it is possible to identify an intense precipitation event (31 Oct.–2 Nov.) characterised by high L (380 ± 34 W/m2) and TKE (3.6 J/kg) values, suggesting the presence of strong surface heating and moisture flux and leading to intense convection and heavy precipitation (45–50 mm). In this case, the CBL height is relatively high (900 m), suggesting a well-developed mixed layer that allows for a conspicuous vertical growth of clouds. It is then possible to identify a light precipitation event (28 Nov), characterised by low L (70 ± 12 W/m2) and TKE (1.4 J/kg) values, indicating weak surface heating and moisture flux and resulting in light precipitation (15–18 mm). In this case, the CBL height is lower (700 m), suggesting a less developed mixed layer that limits vertical cloud growth. Finally, it is possible to identify a moderate precipitation event (8 Dec–9 Dec) characterised by moderate L (220 ± 20 W/m2) and TKE (2.75 J/kg) values, indicating a moderate surface heating and moisture flux and leading to moderate precipitation (25–30 mm). In this final case, the CBL height is intermediate (750 m), suggesting a moderately developed mixed layer that allows for some vertical cloud growth. The lessons learnt from the reported measurements about the relationships between CBL dynamics and convection are as follows: (i) higher L and TKE values are associated with more intense convection and heavier precipitation; this is because L drives the moisture flux, while TKE indicates the strength of turbulent mixing, both of which are essential for cloud growth. (ii) A higher CBL height allows for the stronger vertical growth of clouds, leading to more intense precipitation, while a lower CBL height limits vertical cloud growth, resulting in lighter precipitation. (iii) Surface heating and moisture flux, as indicated by L values, play a crucial role in determining the type and intensity of convection.
5. Conclusions
This paper reports daytime latent heat flux profile measurements in the convective boundary layer obtained from the combined use of a wind lidar and a thermodynamic lidar based on the application of the eddy covariance method. Vertical profiles of the latent heat flux are determined as the covariance between the vertical profiles of the water vapour mixing ratio and vertical wind fluctuations. The computation of fluxes using the eddy covariance method entails the collection of high-frequency lidar measurements and the use of advanced data processing tools to derive the turbulent fluxes of interest.
Latent heat flux (L) and turbulent kinetic energy (TKE) profiles are calculated in the frame of this research effort considering lidar measurements collected over time intervals of 30 min in cloud-free conditions; this interval is covered with approximately 180 consecutive profiles, with each one integrated over 10 s.
This temporal resolution is much higher than the integral scale for water vapour fluctuations within the CBL, with the latter having typical values in the range of 70–150 s. Thus, the temporal resolution considered for the lidar measurements is sufficiently high to resolve turbulent processes down to the inertial subrange and, consequently, to allow the major part of the turbulent fluctuations to be resolved.
The analysis focused on three selected case studies (i.e., 31 October, 28 November, and 8 December 2022) characterised by different atmospheric stability conditions and, consequently, a different potential for the occurrence of convective activity, all of them being followed by precipitation events. In all three cases, both latent heat flux and TKE profiles are found to increase with altitude, with peak values of L and TKE being reached at an altitude of approx. 500 m. Above the peaking altitude both latent heat flux and TKE are found to decrease, with a steeper negative gradient up to approx. 600 m and more gradually above this altitude, returning to zero just above the top of the CBL. In all cases, the values of both L(z) and TKE(z) were found to be correlated with the amplitude of the following precipitation events.
The determination of flux and turbulent moment profiles demonstrated in this research may allow the definition/verification of possible similarity relationships between gradients, variances, and fluxes, and ultimately may lead to an improvement of turbulence parameterisations in mesoscale modeling as well as the verification of large-eddy simulations.
