1. Introduction
As a large number of satellites enter space, space security is facing increasingly serious challenges. Effectively detecting, identifying, and classifying non-cooperative in-orbit satellite targets has become an urgent task [
1,
2]. To enhance space situational awareness, it is essential to perform ultra-long-range, high-resolution imaging of on-orbit satellites and further infer their types and specific applications, thereby enabling real-time monitoring of non-cooperative targets [
3,
4,
5].
Inverse synthetic aperture ladar (ISAL) imaging combines laser technology with synthetic aperture technology to achieve high-resolution imaging of non-cooperative targets. This is achieved by emitting a signal with a large time width and bandwidth, while utilizing motion compensation algorithms. Compared with optical imaging, ISAL offers advantages such as all-weather, long-range, and ultra-diffraction-limited imaging. Compared with inverse synthetic aperture radar (ISAR), ISAL operates at a shorter wavelength, which allows for shorter coherence accumulation times [
6,
7,
8]. Using this technology in space can realize high-resolution imaging of non-cooperative in-orbit satellite targets in a short time, thereby gaining the initiative in space defense and offense.
In recent years, lasers with wavelengths of 1550 nm and 1064 nm have often been used in ISAL experiments [
9,
10,
11,
12]. Due to its shorter operating wavelength, ISAL is highly sensitive to target rotation. Specifically, non-uniform rotation of the target will introduce high-order space-variant phase errors into the echo signal along both the range and azimuth directions. If these space-variant phases are not properly compensated, the scatterers at different positions on the target will experience varying degrees of defocusing. In such cases, traditional autofocus algorithms, such as the Phase Gradient Autofocus (PGA) and Minimum Entropy Autofocus (MEA), which compensate phase errors uniformly, become ineffective. Therefore, accurate compensation of high-order space-variant phase errors induced by the non-uniform rotation of targets is essential.
To address this problem, there are currently three methods available: the system PRF adjustment method, the time–frequency transformation method, and the matched Fourier Transform (MFT) method.
The basic principle of the system PRF adjustment method is to achieve uniform angular sampling of the target’s scatterers by adjusting the time interval between radar transmission pulses. C. C. Chen et al. first proposed this idea and devised a method for dynamically adjusting the pulse repetition frequency (PRF) so that the target rotates by the same angle with respect to the radar between two neighboring echoes [
13]. However, this method requires prior knowledge of the target’s rotation parameters, making it difficult to implement.
The basic principle of the time–frequency transformation method is to use a time–frequency analysis algorithm to extract the instantaneous frequency information of the target’s scatterers instead of the traditional Fourier transform. Among them, researchers such as V. C. Chen, Bao Zheng, and Ruan Hang have proposed approaches including joint time–frequency analysis [
14], adaptive chirplet algorithms [
15], and the Radon–Wigner transform [
16] to achieve azimuth focusing of non-uniform rotation targets. However, due to the limitation of cross-terms in the time–frequency analysis algorithm, the resolution of the scatterers is usually reduced.
The basic principle of the MFT method is to adjust the phase terms of the Fourier transform according to the target’s motion, so as to better match the echo signal and achieve more accurate focusing. Among them, researchers such as Yin Zhiping [
17] and Fu Yaowen [
18] simplified the non-uniform rotation of the target into a uniformly accelerated rotation model, and established corresponding echo expressions. Based on this, they proposed the MFT algorithm, which estimates the rotation parameters through a search method. However, the high computational complexity of this method limits its suitability for real-time applications. To further improve the phase compensation accuracy, Sheng Jialian et al. [
19,
20] introduced the Gauss–Newton optimization algorithm to replace the traditional search method, significantly accelerating the parameter estimation process. In addition, they considered the effect of non-uniform rotation in the range direction as well as the impact of range center deviation, thereby improving the accuracy of phase compensation. However, this method still relies on a uniformly accelerated rotation model and only compensates for second-order space-variant phase errors, leaving higher-order components unaddressed. As a result, its compensation accuracy remains limited. Moreover, although the Gauss–Newton method improves computational efficiency compared to search-based approaches, it lacks global optimization capability and is only effective when good initial values are available.
Other methods that do not require parameter estimation include adaptive sparse imaging and deep learning methods. Adaptive sparse imaging is based on compressed sensing theory, where imaging is performed directly on the echo data using a sparse constraint, without explicitly estimating motion parameters. Although it can effectively recover main scatterers, the imaging result tends to be point-cloud-like, making it difficult to retain fine details. Additionally, it performs poorly under low signal-to-noise ratios, has high computational complexity, and is not suitable for real-time imaging. Deep learning methods are divided into two categories: pure data-driven methods (such as convolutional neural networks and U-Net), which are fast but rely on large amounts of training data, and hybrid model-data-driven methods (such as ISTA-Net, ADMM-Net), which reduce the reliance on data and improve convergence speed, but are slower in inference and still perform poorly under low signal-to-noise ratios.
Despite the advantages of these methods, they still face significant limitations, particularly in terms of accuracy and computational efficiency. From the above analysis, it can be seen that existing algorithms fail to account for the effects of third-order and higher-order space-variant phase errors. Moreover, rotational parameter estimation methods, such as the Gauss–Newton algorithm, are highly dependent on initial values and are prone to getting trapped in local optima. Therefore, the existing algorithms have room for improvement in both compensation accuracy and computational efficiency.
To address these issues, this paper first derives a precise echo signal model for the higher-order non-uniform rotation of the target and analyzes the effects of rotation parameters and range center deviation on imaging. Then, a high-resolution ISAL imaging algorithm for spaceborne non-uniformly rotating targets based on MFT and a genetic algorithm is proposed. The MFT is used for the accurate compensation of the high-order space-variant phase, while the genetic algorithm is employed for the accurate estimation of the rotation parameters and the range center deviation. And the image scaled is completed on this basis. Compared with existing algorithms, the proposed algorithm achieves higher compensation accuracy. Finally, results from both simulations and real data experiments validate the effectiveness of the proposed method.
The rest of the article is organized as follows: In
Section 2, the signal model of non-uniformly rotating targets is established, and the effects of rotation parameters and range center deviation on imaging are analyzed. In
Section 3, the non-uniform rotation compensation algorithm and rotation parameter estimation algorithm are presented. The results of simulated and real data experiments are provided in
Section 4. Finally,
Section 5 concludes the article.
2. Echo Signal Modeling and Theoretical Analysis of Parameter Effects on Imaging
In ISAL, after translational motion compensation, the motion of the target relative to the ladar can be equivalent to a turntable model. Assume that the target makes non-uniform rotation with a rotation velocity
:
where
represents the initial rotational velocity,
represents the rotational acceleration, and
represents the rotational jerk.
represents the slow time,
represents the pulse repetition frequency, and
represents the
transmitted pulse.
The distance from the
p-th scatterer on the target to ladar can be represented as:
where
represents the distance from the ladar to the center of the turntable.
and
represent the horizontal and vertical coordinates of the
p-th scatterer, respectively.
,
,
,
.
Assume that the ladar transmits a Linear Frequency Modulation (LFM) signal. After dechirp receiving and range-compressed, the signal can be expressed as:
where
and
represent the pixel position of
.
P represents the total number of scatterers.
represents the signal amplitude of the
p-th scatterer.
represents the wavelength.
,
,
represents the reference distance for dechirp receiving.
,
represents the minimum range resolution unit, and
represents the total number of samples along the range direction.
represents the coordinate of the equivalent turntable center after translational motion compensation,
is referred to as the range center deviation in this paper.
- B.
Theoretical Analysis of the Effects of Rotation Parameters on Imaging
In (3), the first exponential phase can be ignored since it is a constant phase and has no effect on azimuth compression. The second exponential phase in (3) includes the first-order phase, second-order phase, and higher-order phases of related to , where determine the azimuth focusing position of scatterer p, , , and influence the azimuth focusing effect of scatterer p, meaning that the second-order and higher-order phase errors introduced by the target’s non-uniform rotation are all related to and they are space-variant. Therefore, the traditional unified phase compensation algorithm is no longer applicable. Similarly, the third exponential phase is also a space-variant phase of related to and it cannot be compensated by the traditional unified phase compensation algorithm.
From the above analysis, it can be seen that the target’s non-uniform rotation will introduce space-variant phases in both azimuth and range directions. The farther the scatterer is from the turntable center, the more pronounced the defocusing effect becomes. And by comparing the second and third exponential phases, it can be seen that has a significant impact on the range focusing effect, while has a significant impact on the azimuth focusing effect.
- C.
Theoretical Analysis of the Effects of Range Center Deviation on Imaging
According to (3), the space-variant phase in the range direction is related to the range center deviation , so when compensating for the space-variant phase along the range direction, must also be considered. The following analysis discusses the estimated rotational parameter values obtained without considering .
First, the space-variant phase in the range direction is organized as:
Neglecting
, (4) will be viewed as:
At this point, the corresponding rotation parameter estimates values are as follows:
From (6), it can be seen that when is neglected, the estimated rotation parameter deviates from the true value, and the deviation coefficient is related to .
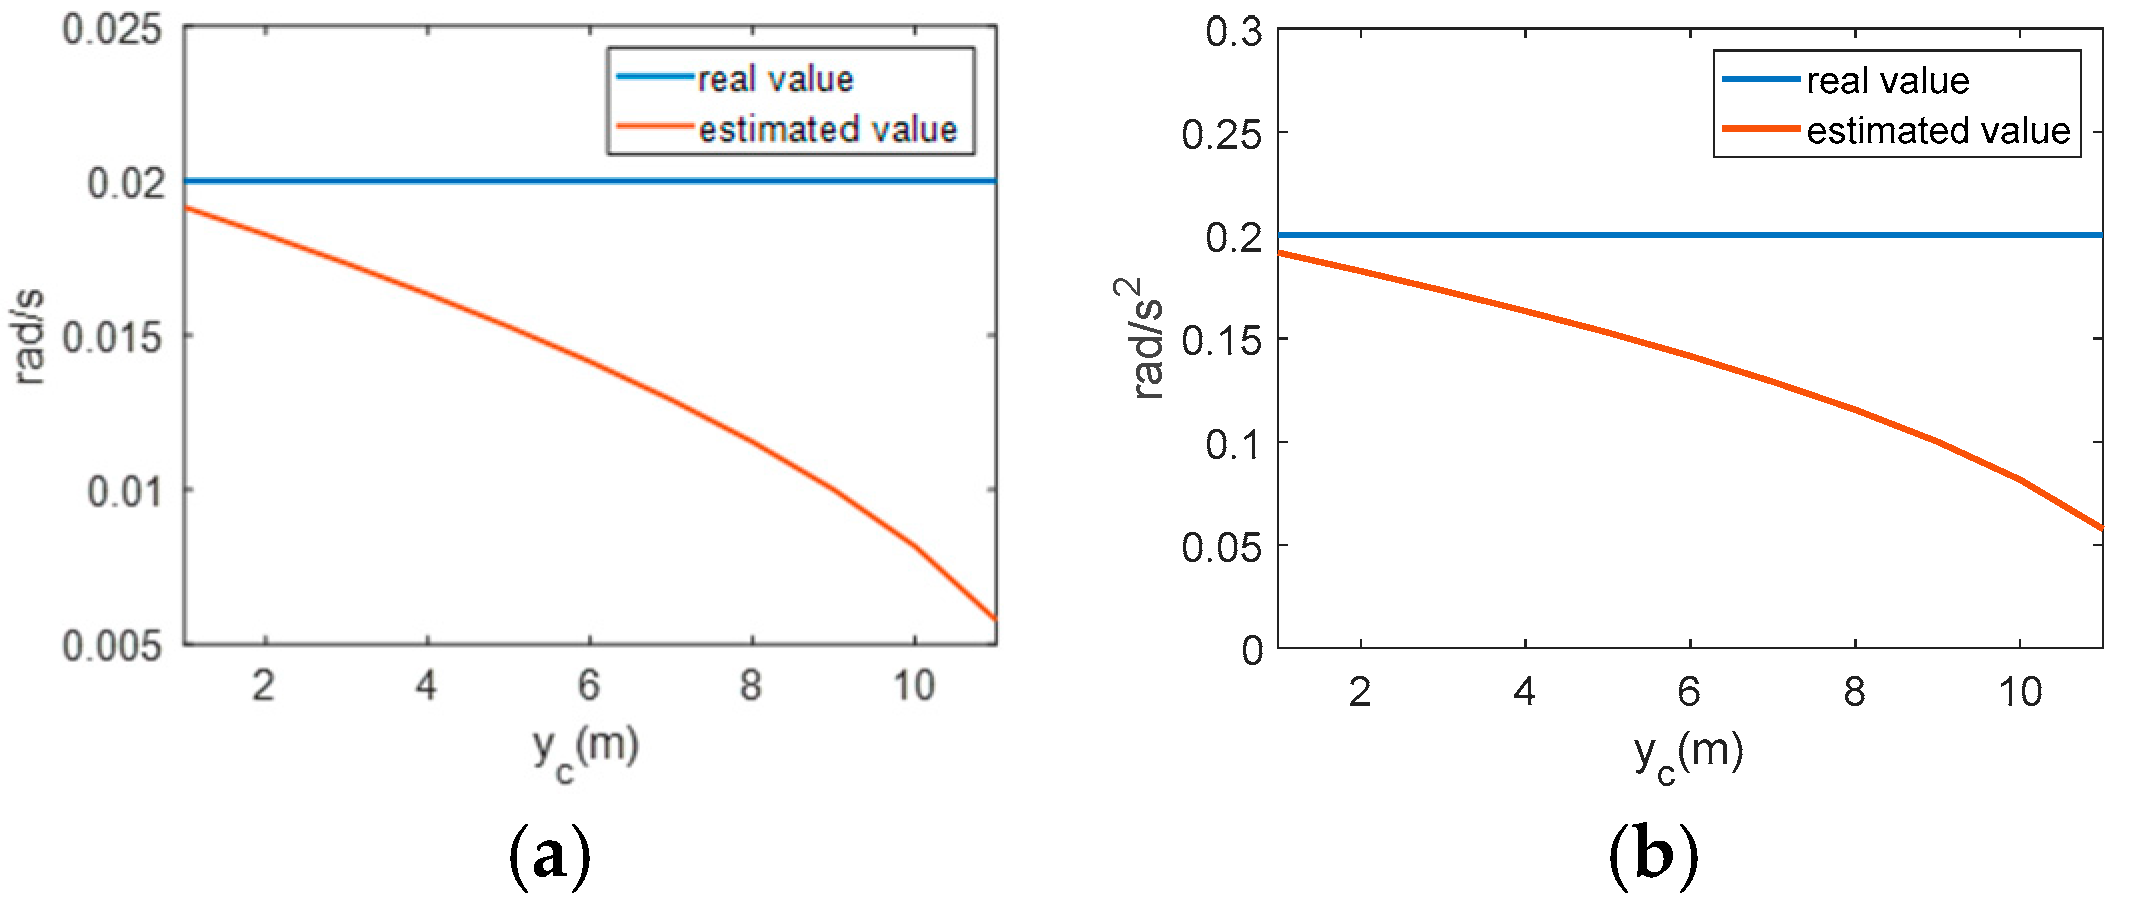
Setting the true values of the rotational parameters as
,
,
Figure 1 gives the curves of the estimated values of
and
as
varies, with the horizontal coordinates of
.
From
Figure 1, it can be seen that
has a significant influence on the estimation of the rotation parameters. If
is not considered during the range compensation, the estimated values of
,
and
will be differ from the actual values, which will affect the image scaling results and the final compensation accuracy. Therefore,
needs to be considered when compensating for the space-variant phase along the range direction.
3. Non-Uniform Rotation Compensation and Rotation Parameter Estimation Algorithms
According to the above, the target’s non-uniform rotation will introduce two-dimensional space-variant phases in the echo signal, causing the degree of defocusing of the scatterer on the target to rely on its location. Therefore, traditional algorithms that can only compensate for fixed error phases, such as the Phase Gradient Autofocus (PGA) algorithm and the Minimum Entropy Algorithm (MEA) algorithm, are no longer applicable.
To solve this problem, a high-resolution ISAL imaging algorithm for spaceborne non-uniformly rotating targets based on matched Fourier transform and genetic algorithm is proposed in this paper. First, we present a non-uniform rotation compensation algorithm, where the time-domain high-order phase compensation algorithm and the matched Fourier transform algorithm are used to compensate for the space-variant phases along the range and azimuth directions, respectively. Then, to improve the accuracy of the algorithm, we use a genetic algorithm based on the minimum entropy criterion to estimate the rotational parameters and range center deviation. By combining the proposed non-uniform rotation compensation algorithm with the genetic algorithm, we achieve precise compensation of the echo signal. Finally, a 2D image scaling calibration method is proposed, incorporating the rotational parameters and system parameters.
The detailed non-uniform rotation compensation algorithm, genetic algorithm, and ISAL image scaling algorithm are presented below.
According to (3), when the target makes a non-uniform rotation, the high-order space-variant phase will be introduced into the echo phase along both the range and azimuth direction. As a result, the farther the scatterer is from the turntable center, the greater the phase change over the entire synthetic aperture time. Therefore, before performing ISAL imaging on the target, it is necessary to compensate for second-order and higher-order phases. The compensation algorithm proposed in this paper is as follows: (1) Perform time-domain high-order phase compensation on along the range direction to obtain the range-compensated signal. (2) Apply a matched Fourier transform to the range-compensated signal along the azimuth direction.
First, construct the range compensation function
h:
After multiplying (3) by (7), we can obtain:
Then, by performing the MFT along the azimuth direction on (8), we can obtain:
where
is a polynomial of
. Substituting (8) into (9), we can obtain:
The Equation (10) shows that when , and , the focusing effect of all scatterers are the best.
The above is the non-uniform rotation compensation algorithm. To demonstrate that the proposed algorithm can accurately compensate for the space-variant phases introduced by non-uniform rotation, the simulation results of the point target are presented below.
Set the coordinates of scatterers p1, p2, and p3 within the same range cell to (−12 m, 12 m), (0 m, 12 m), and (12 m, 12 m), respectively, and set the rotational parameters to , , .
Figure 2a–c show the azimuth profiles of the three scatterers
p1,
p2, and
p3, respectively. The green curve denotes the result without phase compensation, the blue curve denotes the result after 1-D compensation, where only the azimuth high-order phase errors are compensated, and the red curve denotes the result after 2-D compensation, where both range and azimuth high-order phase errors are compensated simultaneously. Additionally, by comparing the green curves in
Figure 2a,c and
Figure 2b, it can be seen that the azimuth focusing is significantly impacted by
, and the scatterer farther away from the turntable center cannot be focused without higher-order space-variant phase compensation.
Figure 3 shows the azimuth profiles of the three scatterers without compensation, with second-order phase compensation, and with third-order phase compensation. Where the green curve represents the profile without compensation, the purple curve represents the profile after second-order compensation, and the black curve represents the profile after third-order compensation. By comparing the black and purple curves in the three images, it can be seen that the third-order compensation is better than the second-order compensation, indicating that higher-order compensation can improve the focusing performance of scatterers. Therefore, to achieve high-resolution imaging, higher-order compensation of the echo is necessary.
- B.
Genetic Algorithm for Estimating Rotation Parameters
The compensation algorithm proposed in this paper has been described above. According to (7) and (9), the algorithm requires constructing a compensation function based on the rotational parameters and . Therefore, before performing the compensation, the rotational parameters and must first be estimated.
There are two main methods for estimating rotational parameters based on imaging quality: the search method and the optimization algorithms. The search method directly searches for the rotation parameters within a given range, assuming that the parameters corresponding to the best imaging quality are the estimated values. This method is simple but computationally intensive. Subsequently, some researchers have proposed optimization algorithms to estimate rotational parameters, with the Gauss–Newton method being the most commonly used.
While more efficient than the search method, the Gauss–Newton method lacks global search capability and can easily fall into local optima, making it suitable only for cases with good initial values. To address this limitation, this paper employs a genetic algorithm for rotation parameter estimation. Unlike the Gauss–Newton method, the genetic algorithm does not rely on initial values and avoids local optima. The implementation process for estimating rotation parameters using the genetic algorithm is outlined below.
The principle of using a genetic algorithm to estimate the rotation parameters and is to take the image entropy value as the optimization function, which obtain the estimation of and by iteratively minimizing the image entropy. For simplicity, and are combined into a vector . The main procedure of the genetic algorithm for estimating is outlined below.
(1) Define the image entropy
For image
, the entropy value is given by the following:
where
represents the amplitude value of the pixel located at position
in the image, and
is the total number of pixels in the image. The lower the entropy value, the better the focus effect of the image.
(2) Set the image entropy value as the optimization function
By setting the image entropy as the optimization function, the objective function of the genetic algorithm can be defined as:
where
represents the imaging result after compensation using
, and
represents the entropy value of the corresponding compensated image.
(3) Estimate using the genetic algorithm
The process of estimating using a genetic algorithm is as follows:
Initialize Population: Randomly generate the initial population, which consists of a set of initial parameters. The number of individuals in the population is typically 2–10 times the number of parameters.
Fitness Calculation: For each set of rotation parameters, calculate the entropy of the corresponding compensated image as the fitness value.
Selection, Crossover, and Mutation: Based on the fitness values, select the superior individuals for crossover and mutation to generate the next generation of the population.
Repeat Iterations: Repeat the process until the rotation parameters corresponding to the minimum entropy stabilize.
(4) Obtain the estimated values of
When the image entropy reaches its minimum and stabilizes, the estimated rotation parameters can be obtained as:
- C.
ISAL Image Scaling Algorithm
ISAL image scaling includes range scaling and azimuth scaling. The range scaling is determined by the system parameters, while the azimuth scaling is primarily calculated based on the . In the following, the formulas of the minimum resolution units of the image obtained by the RD imaging algorithm are defined in both the range and azimuth directions. Then, the scaling method is given.
(1) Range scaling
Taking the Fourier transform of the dechirp received signal, the frequency range of the image’s range axis is with the unit in Hertz, where represents the sampling frequency. Since the minimum resolution cell along the range direction is , where c is the speed of light, the value of is the scaling result of the image along the range direction with the unit of meters.
(2) Azimuth scaling
Taking the Fourier transform of the range-compressed signal along the azimuth direction, the frequency range of the image’s azimuth axis is with the unit in Hertz, where Nan represents the number of sampling points along the azimuth direction. If the estimated rotation speed is , the minimum resolution cell along the azimuth direction is , where represents the wavelength. Therefore, is the scaling result of the image along the azimuth direction with the unit of meters. After image scaling, the target size can be directly obtained from the image.
4. Results and Discussion
Next, to verify the effectiveness of the proposed algorithm, the processing results obtained from both simulated and real data are presented. The real data is from a turntable; no envelope alignment of the echo signal is required, so we assume yc = 0 and do not estimate this parameter. However, when envelope alignment is necessary and the equivalent turntable center cannot be determined, yc must be estimated.
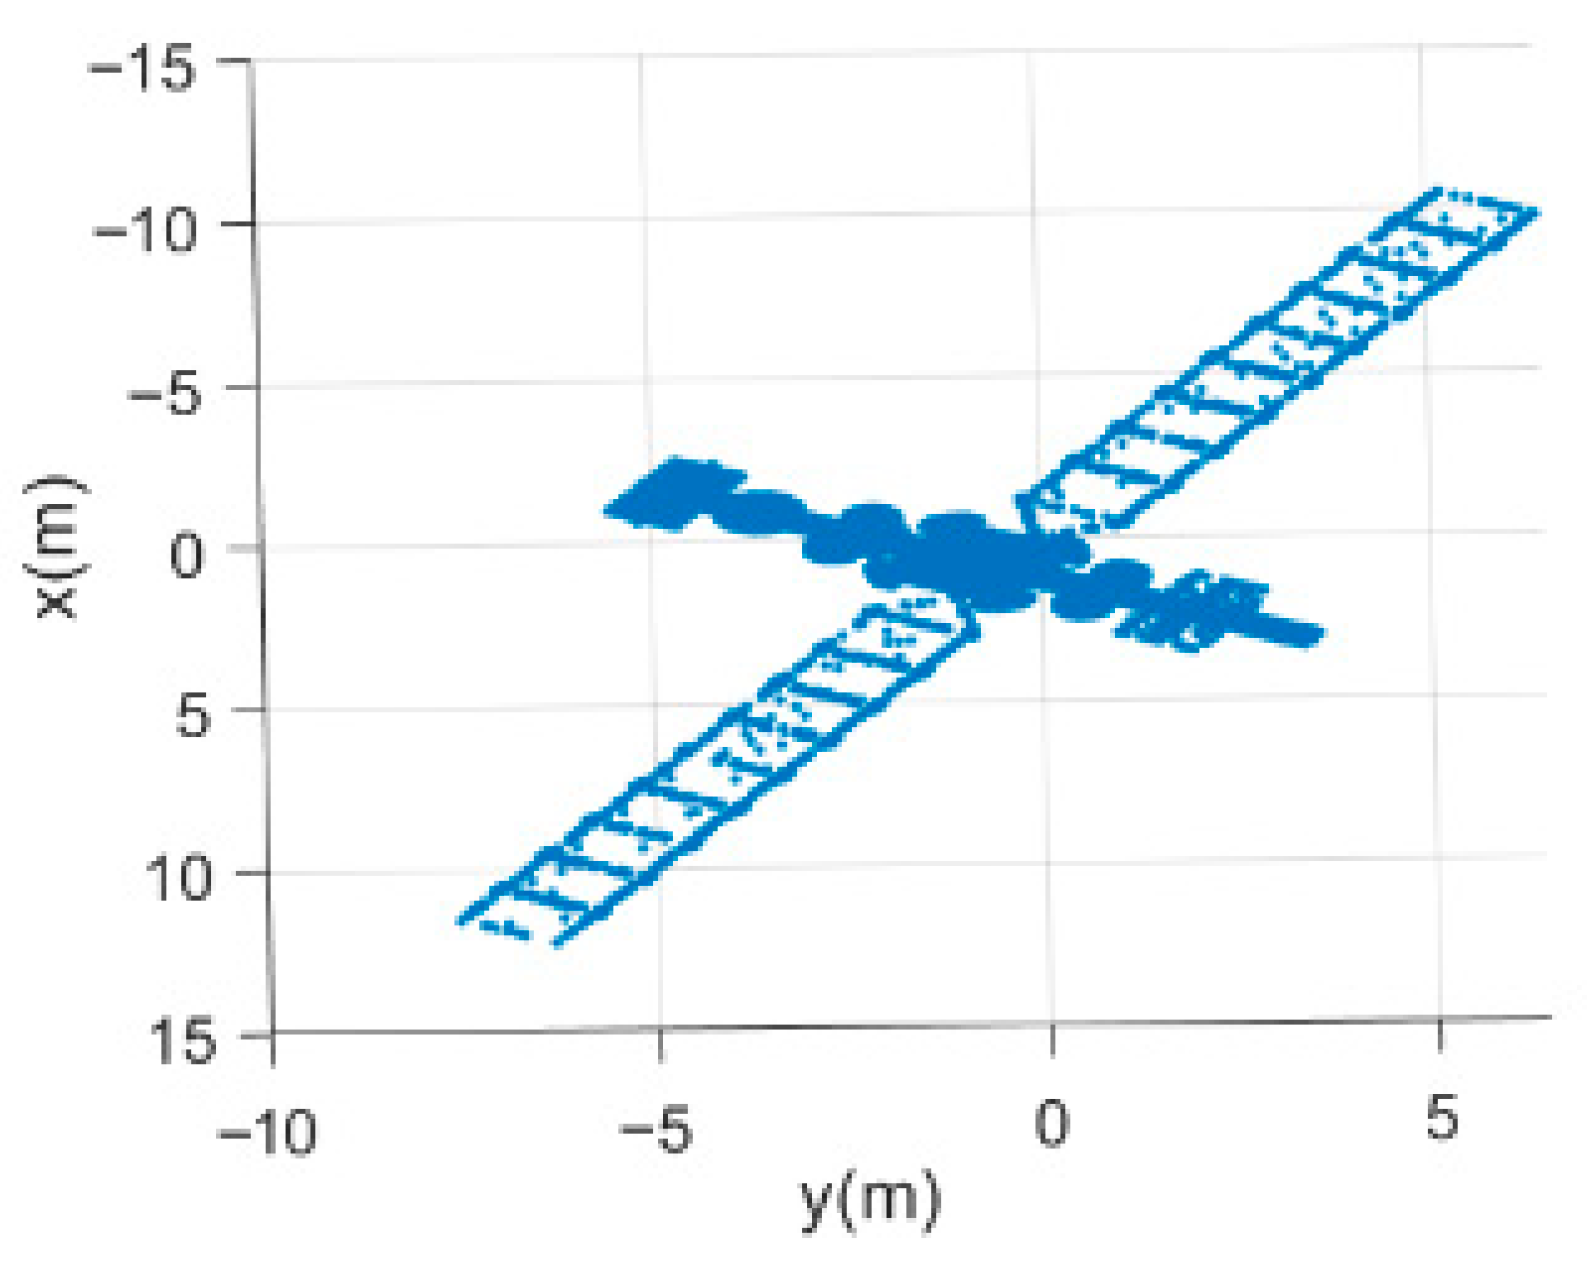
The simulated 3D satellite model is shown in
Figure 4. The target was constructed in SolidWorks 2022 with a central bus, two solar panels, and several appendages, forming a typical multi-component structure. The model was subsequently processed in MeshLab for mesh simplification and point-cloud conversion to obtain the scatterers’ distribution. During echo simulation, random perturbations were added to the phase of each scatterer to emulate scattering-property uncertainties, thereby enhancing the realism and robustness of the simulated data.
Assume the ladar transmits an LFM signal with the parameters given in
Table 1. During echo generation, the initial range between the satellite and the ladar is 100 km, with the satellite rotating around the center scatterer at the rotational velocity of 2 mrad/s, rotational acceleration of 0.2 rad/s
2, and the rotational jerk of 20 rad/s
3.
(1) Compensation Results of the Proposed Algorithm
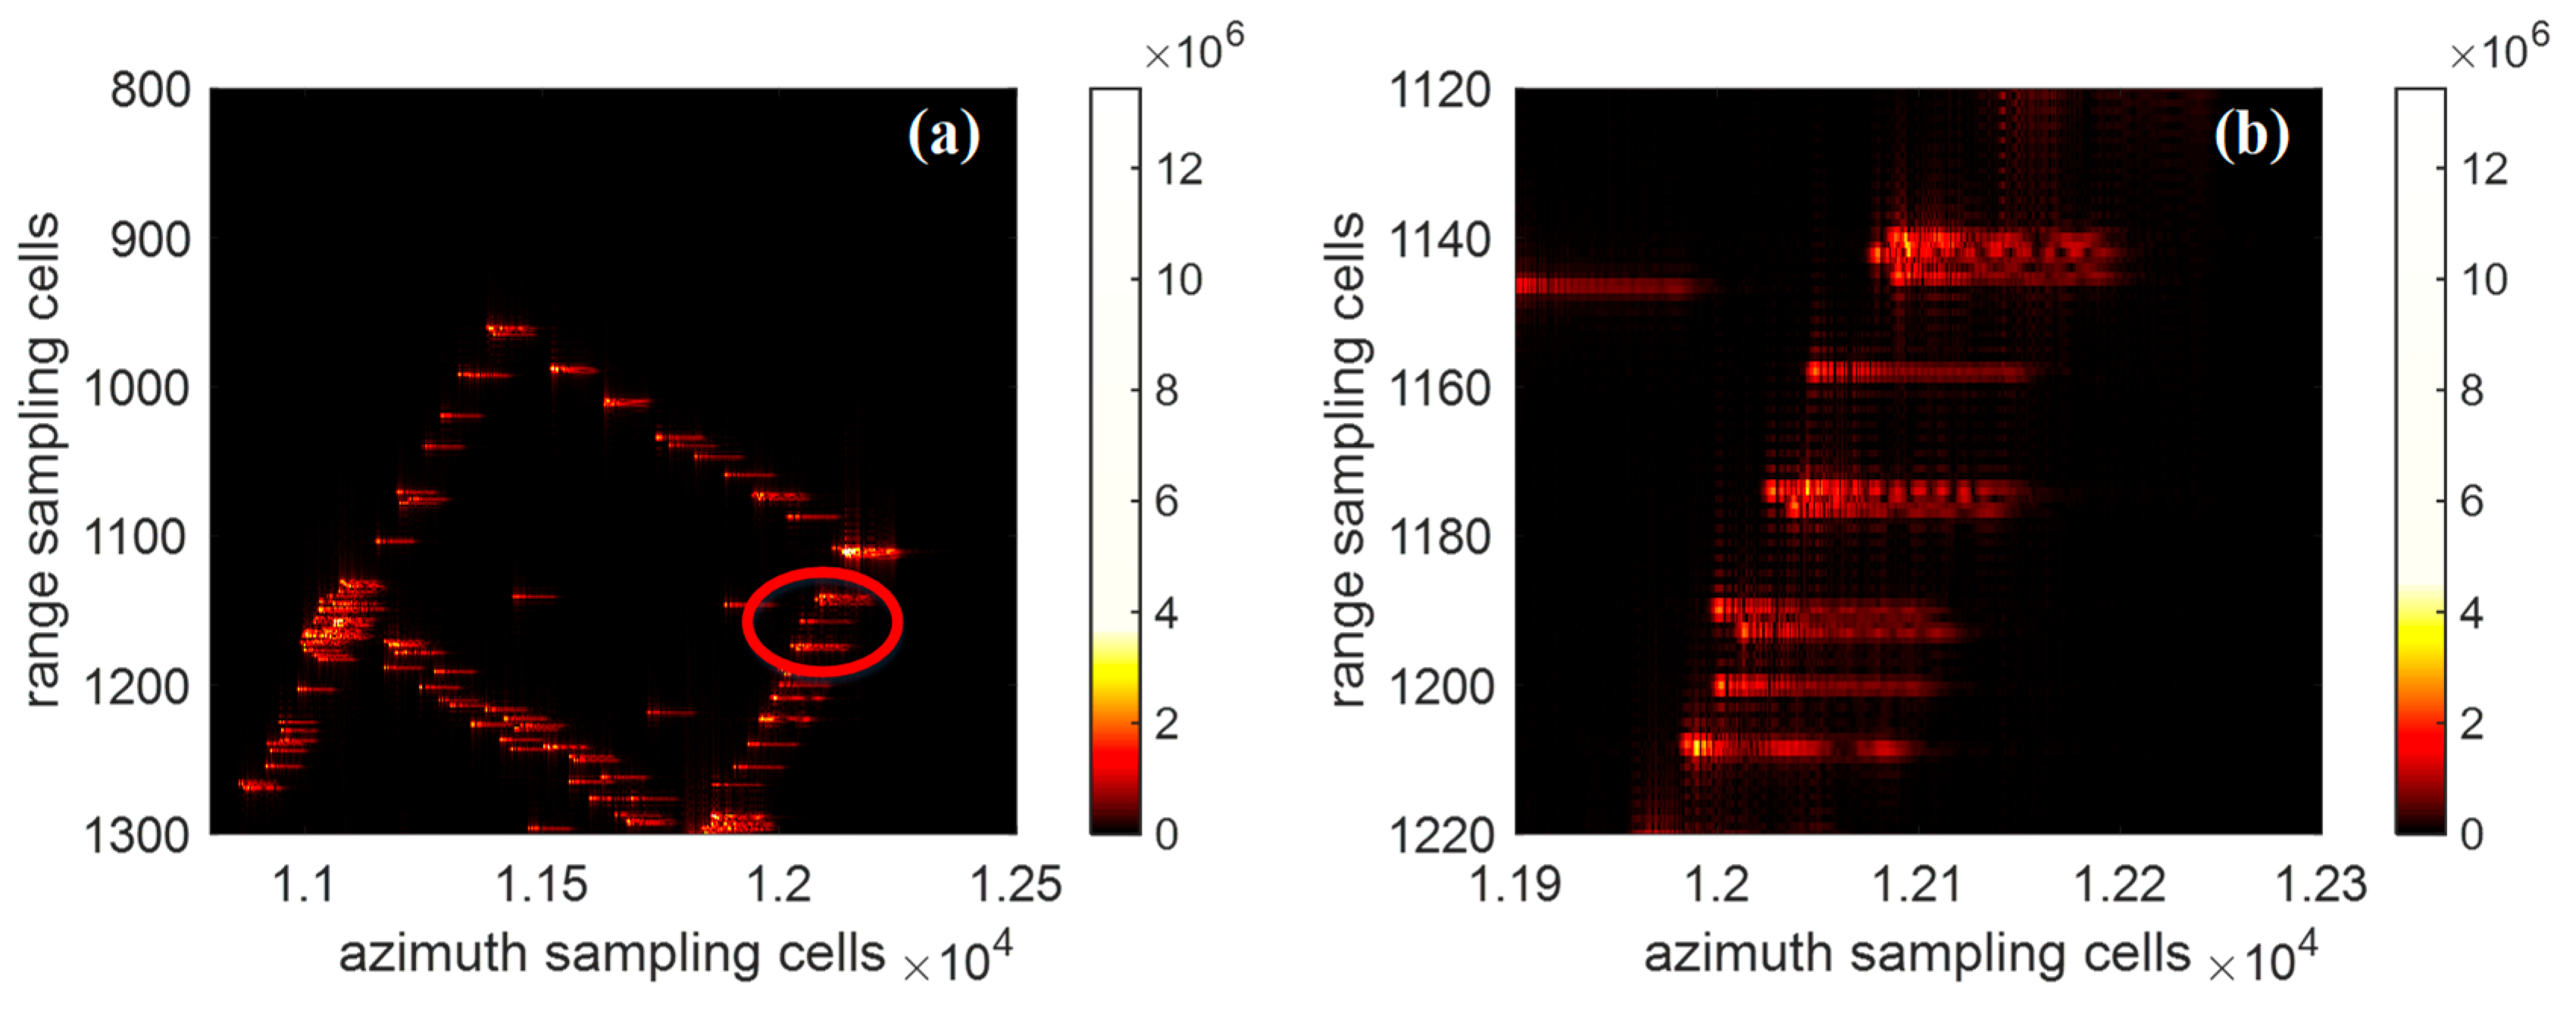
Figure 5a shows the imaging result of the satellite without compensation.
Figure 5b,c are the partial enlargement of the red ellipse region A and region B in
Figure 5a, respectively. From
Figure 5b,c, it can be seen that the scatterers are severely defocused, particularly the edge scatterers.
The algorithm for imaging uniformly rotating targets presented in literature [
15] is referred to as the ACL algorithm. Its basic principle is inspired by the CLEAN algorithm, where the modulation frequencies of all scattering points are sequentially searched and matched, and the radar echo is decomposed into a series of chirplet atoms. In this way, the algorithm can accommodate non-uniform or even complex maneuvering target motions and achieve effective focusing of scattering points. However, since the echo has an inherently sparse representation in the chirplet dictionary, and the number of scattering centers of the target is limited, the imaging results usually exhibit a sparse point-like distribution. Moreover, scatterers with relatively low amplitudes are likely to be ignored, making it difficult to obtain a clear and complete target contour.
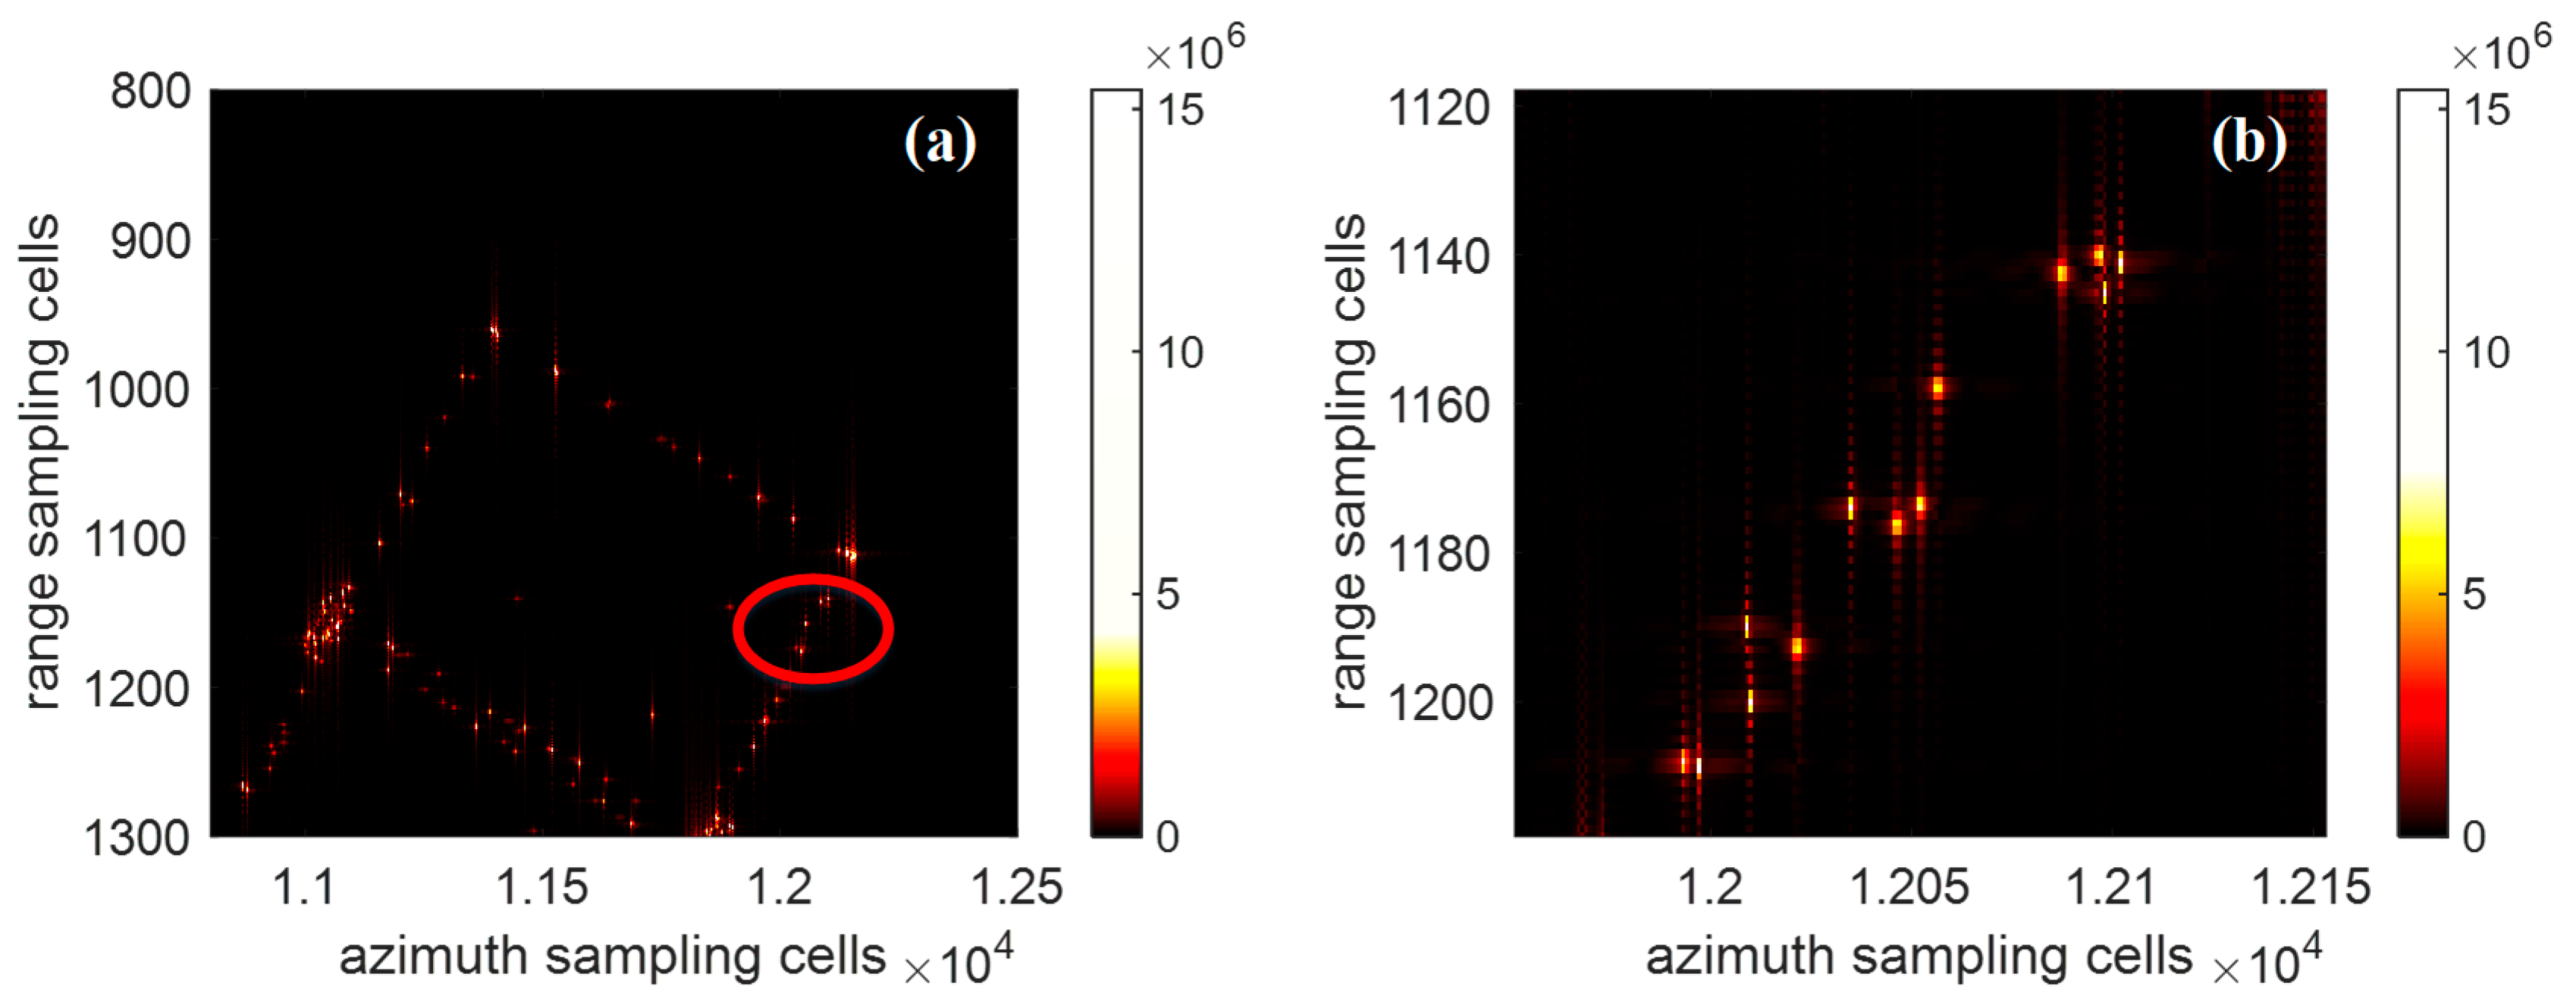
Figure 6a is the imaging result by using the ACL algorithm,
Figure 6b,c are the partial enlargement of red ellipse region A1 and A2 in
Figure 6a, respectively. A comparison between
Figure 5b and
Figure 6b reveals that certain detailed contours of the target in part 2 are neglected.
The second-order space-variant phase compensation algorithm in the literature [
19], referred to as the SM algorithm, simplifies the echo of non-uniformly rotating targets into a second-order space-variant and compensates it only along the azimuth direction.
Figure 7a shows the imaging result of the satellite using the SM algorithm, and
Figure 7b,c are the partial enlargement of the red ellipse region A1 and A2 in
Figure 7a, respectively. Compared to
Figure 5, the focusing effect of scatterers in
Figure 7 has improved, but the defocusing effect is still evident.
Figure 8 shows the imaging result of the satellite using the proposed algorithm, along with its partial enlargement, where all the scatterers are well focused. The rotation parameters were estimated using the genetic algorithm, with the search range set between 0.9 and 1.1 times the true value of the rotation parameters. The estimated results from the genetic algorithm are 0.0202, 10.002, and 999.6835, respectively. In this paper, MATLAB R2022a’s built-in genetic algorithm function ga is used to solve for the rotation parameters.
By comparing
Figure 5,
Figure 7, and
Figure 8, it can be seen that when the target rotates non-uniformly relative to the ladar, resulting in a two-dimensional space-variant phase in the echo, the lack of compensation or compensation limited to the second-order space-variant phase along the azimuth direction still results in image defocusing. By comparing
Figure 7 and
Figure 8, it can be observed that, due to the inherently sparse representation, the imaging results usually exhibit a sparse point-like distribution, and scatterers with relatively low amplitudes tend to be ignored. In contrast, the proposed algorithm performs two-dimensional high-order space-variant phase compensation. After applying the proposed algorithm, the scatterers achieved excellent imaging results.
Figure 9 shows the scaled result of the satellite with the proposed algorithm and its partial enlargement, which is consistent with the simulation.
(2) Compensation Results from Different Rotation Parameter Estimation Algorithms
The commonly used rotation parameter estimation algorithm is the Gauss–Newton method. However, this algorithm is prone to falling into the local extreme points and is highly dependent on the initial value. In contrast, the genetic algorithm can effectively avoid this problem. To validate this, this subsection presents the rotation parameter estimates obtained using both the Gauss–Newton method and the genetic algorithm, along with their corresponding compensation results.
Set the initial values to
× 0.9,
and
× 1.1, the estimation results obtained using the Gauss–Newton method are shown in
Table 2. When the initial value is
× 0.9, the estimated values of
,
and
all deviated significantly from the true values. When the initial value is
× 1.1,
is close to the true value, but
and
deviated significantly. When the initial value is
, the estimated rotation parameters are close to the true values. These results demonstrate that the choice of initial value has a significant impact on the estimation accuracy when using the Gauss–Newton method.
Figure 10,
Figure 11 and
Figure 12 show the local imaging results and their partial enlargements after compensation using the three different rotation parameter estimates, respectively, where
Figure 10,
Figure 11 and
Figure 12b is the partial enlargement of the red ellipse in
Figure 10,
Figure 11 and
Figure 12a.
Figure 11 is well-focused, while
Figure 10 and
Figure 12 suffer from defocusing. This further demonstrates that the Gauss–Newton method is highly dependent on the initial values. When the initial value is uncertain, the estimated rotation parameters will exhibit significant errors and the algorithm will no longer suitable.
Set the search range to
× 0.9–
× 1.1, and the estimated rotation parameters obtained using the genetic algorithm proposed in this paper are 0.0202, 10.002, and 999.6835. The imaging and scaled results based on these parameters are shown in
Figure 8 and
Figure 9, where the image is well-focused and the scaling is consistent with the simulation.
Set the search ranges to
,
and
, and the estimated rotation parameters obtained using the search algorithm are 0.02, 10, and 1000. The imaging results based on these parameters, also as shown in
Figure 8, demonstrate good focusing performance and are consistent with the simulation.
In terms of computational cost, we first consider the runtime of the search algorithm. For each search iteration, the time taken for one parameter search is 7.4 s. With the specified ranges, the number of parameters searched is 5, 21, and 201, respectively, resulting in a total search time of 156,177 s. In contrast, the optimization time using the Gauss–Newton method is 172 s, while the genetic algorithm takes 1202 s.
From these comparisons, it is evident that the search algorithm takes the longest time, followed by the genetic algorithm, with the Gauss–Newton method taking the shortest time. It should be noted that the time required by the search algorithm is based on adjusting the search range, and in most practical data processing, the parameter ranges are typically larger, thus requiring more search time. In comparison, the Gauss–Newton method has a clear advantage in computational speed, but it is only applicable when the initial guess is close to the optimal solution; otherwise, it may fall into local optima. Although the genetic algorithm takes longer to compute, it has a strong global optimization capability, effectively avoiding local optima and finding the global optimum solution. Therefore, to improve algorithm accuracy, we chose the genetic algorithm for parameter estimation in this paper.
Regarding hardware constraints and processing time, the performance of the genetic algorithm depends on factors such as CPU performance, memory capacity, and storage. For large-scale optimization problems, a multi-core processor and sufficient memory (8 GB or more) are recommended to handle the computational load efficiently. Additionally, using SSD storage can reduce the time spent on read/write operations.
The above results demonstrate that the Gauss–Newton method is only effective when the initial value is close to the true value, as it lacks global search capability and is easy to fall into local extreme points. In contrast, the genetic algorithm does not depend on the initial value, can avoid local optima, and can directly compute the optimal solution in the given search interval. Therefore, in this paper, the genetic algorithm is employed to estimate the rotation parameters.
(3) Compensation Results for Different Signal-to-Noise Ratios
To verify the robustness of the proposed algorithm, this section provides estimated rotational parameters and their corresponding compensated imaging results under various signal-to-noise ratios (SNRs). Gaussian noise is added to the echo signals with SNRs ranging from −10 dB to 5 dB. Through 100 Monte Carlo experiments, the estimated values of
,
and
are shown in
Figure 13a,
Figure 13b, and
Figure 13c, respectively. In these figures, the blue lines represent the estimated rotational parameters, while the red lines denote the true values.
From
Figure 13a–c, it can be observed that as the SNR increases, the estimation errors of
,
and
gradually decrease. To further illustrate the performance of the proposed algorithm under different SNR conditions,
Figure 14,
Figure 15,
Figure 16 and
Figure 17 show the imaging results for SNRs from −10 dB to 5 dB, respectively.
Table 3 provides the corresponding rotational parameter estimates for SNRs from −10 dB to 5 dB. And in order to illustrate the scaling effect of the algorithm,
Table 4 presents the estimated azimuth scaling result of point P (Ps), located at the far-right edge of the satellite, under four different SNR conditions, the errors relative to the true value (6.43 m) Pse and the corresponding error percentage of point P (Psep = Pse/true value). The result from
Table 4 indicates that as the SNR increases, the relative error gradually decreases. Specifically, when the SNR is −10 dB, the corresponding error percentage is 9.18%, while at an SNR of 5 dB, the error percentage is reduced to 1.56%, indicating a relatively small error.
The above results indicate that the proposed algorithm can estimate and compensate for non-uniform rotational parameters even at −10 dB, providing high-resolution imaging results, further validating the robustness of the algorithm.
- B.
Processing Results of the Real Data
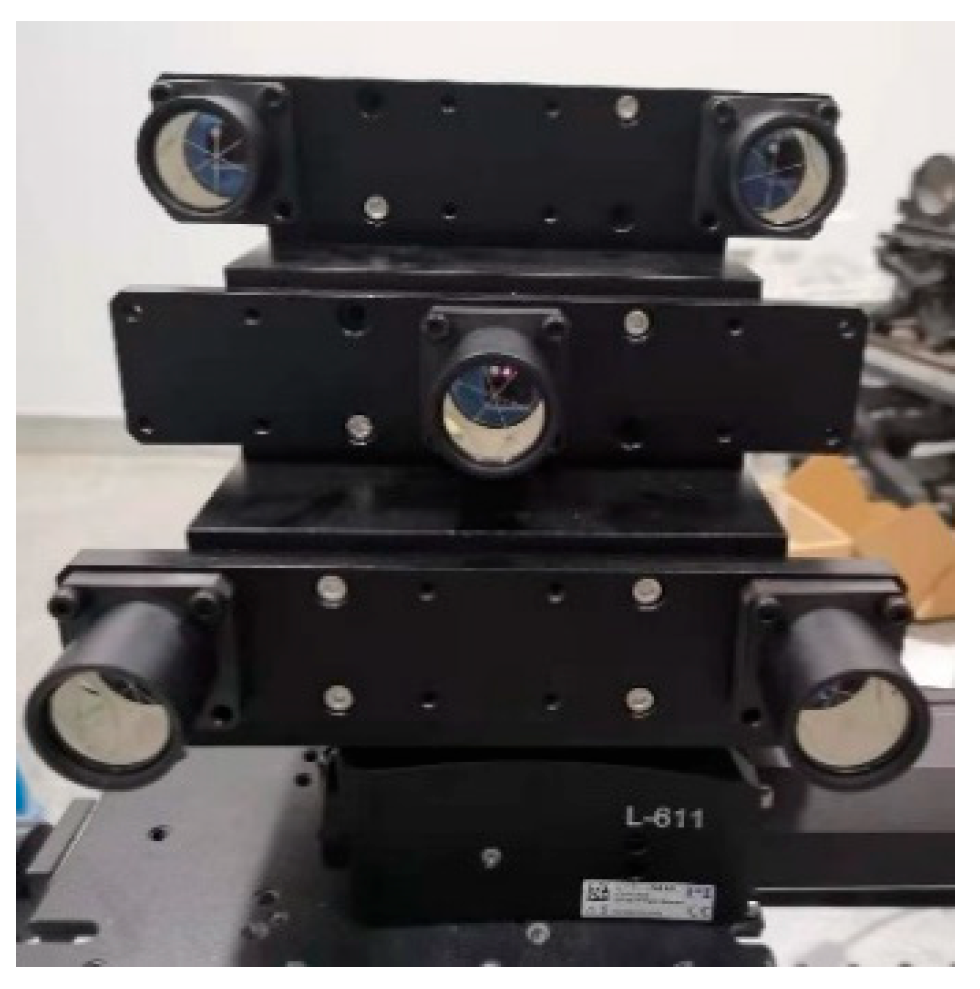
Next, real data is utilized to verify the effectiveness of the proposed algorithm. The imaging targets are five corner cubes, whose optical image is shown in
Figure 18. The corner cubes are placed on the turntable, and the parameters of the ladar and target are shown in
Table 5.
Due to the influence of atmospheric turbulence and other errors on the real data, random phase errors may occur along the azimuth direction. Therefore, before imaging, the MEA is also applied to the real data along the azimuth direction to correct for this error.
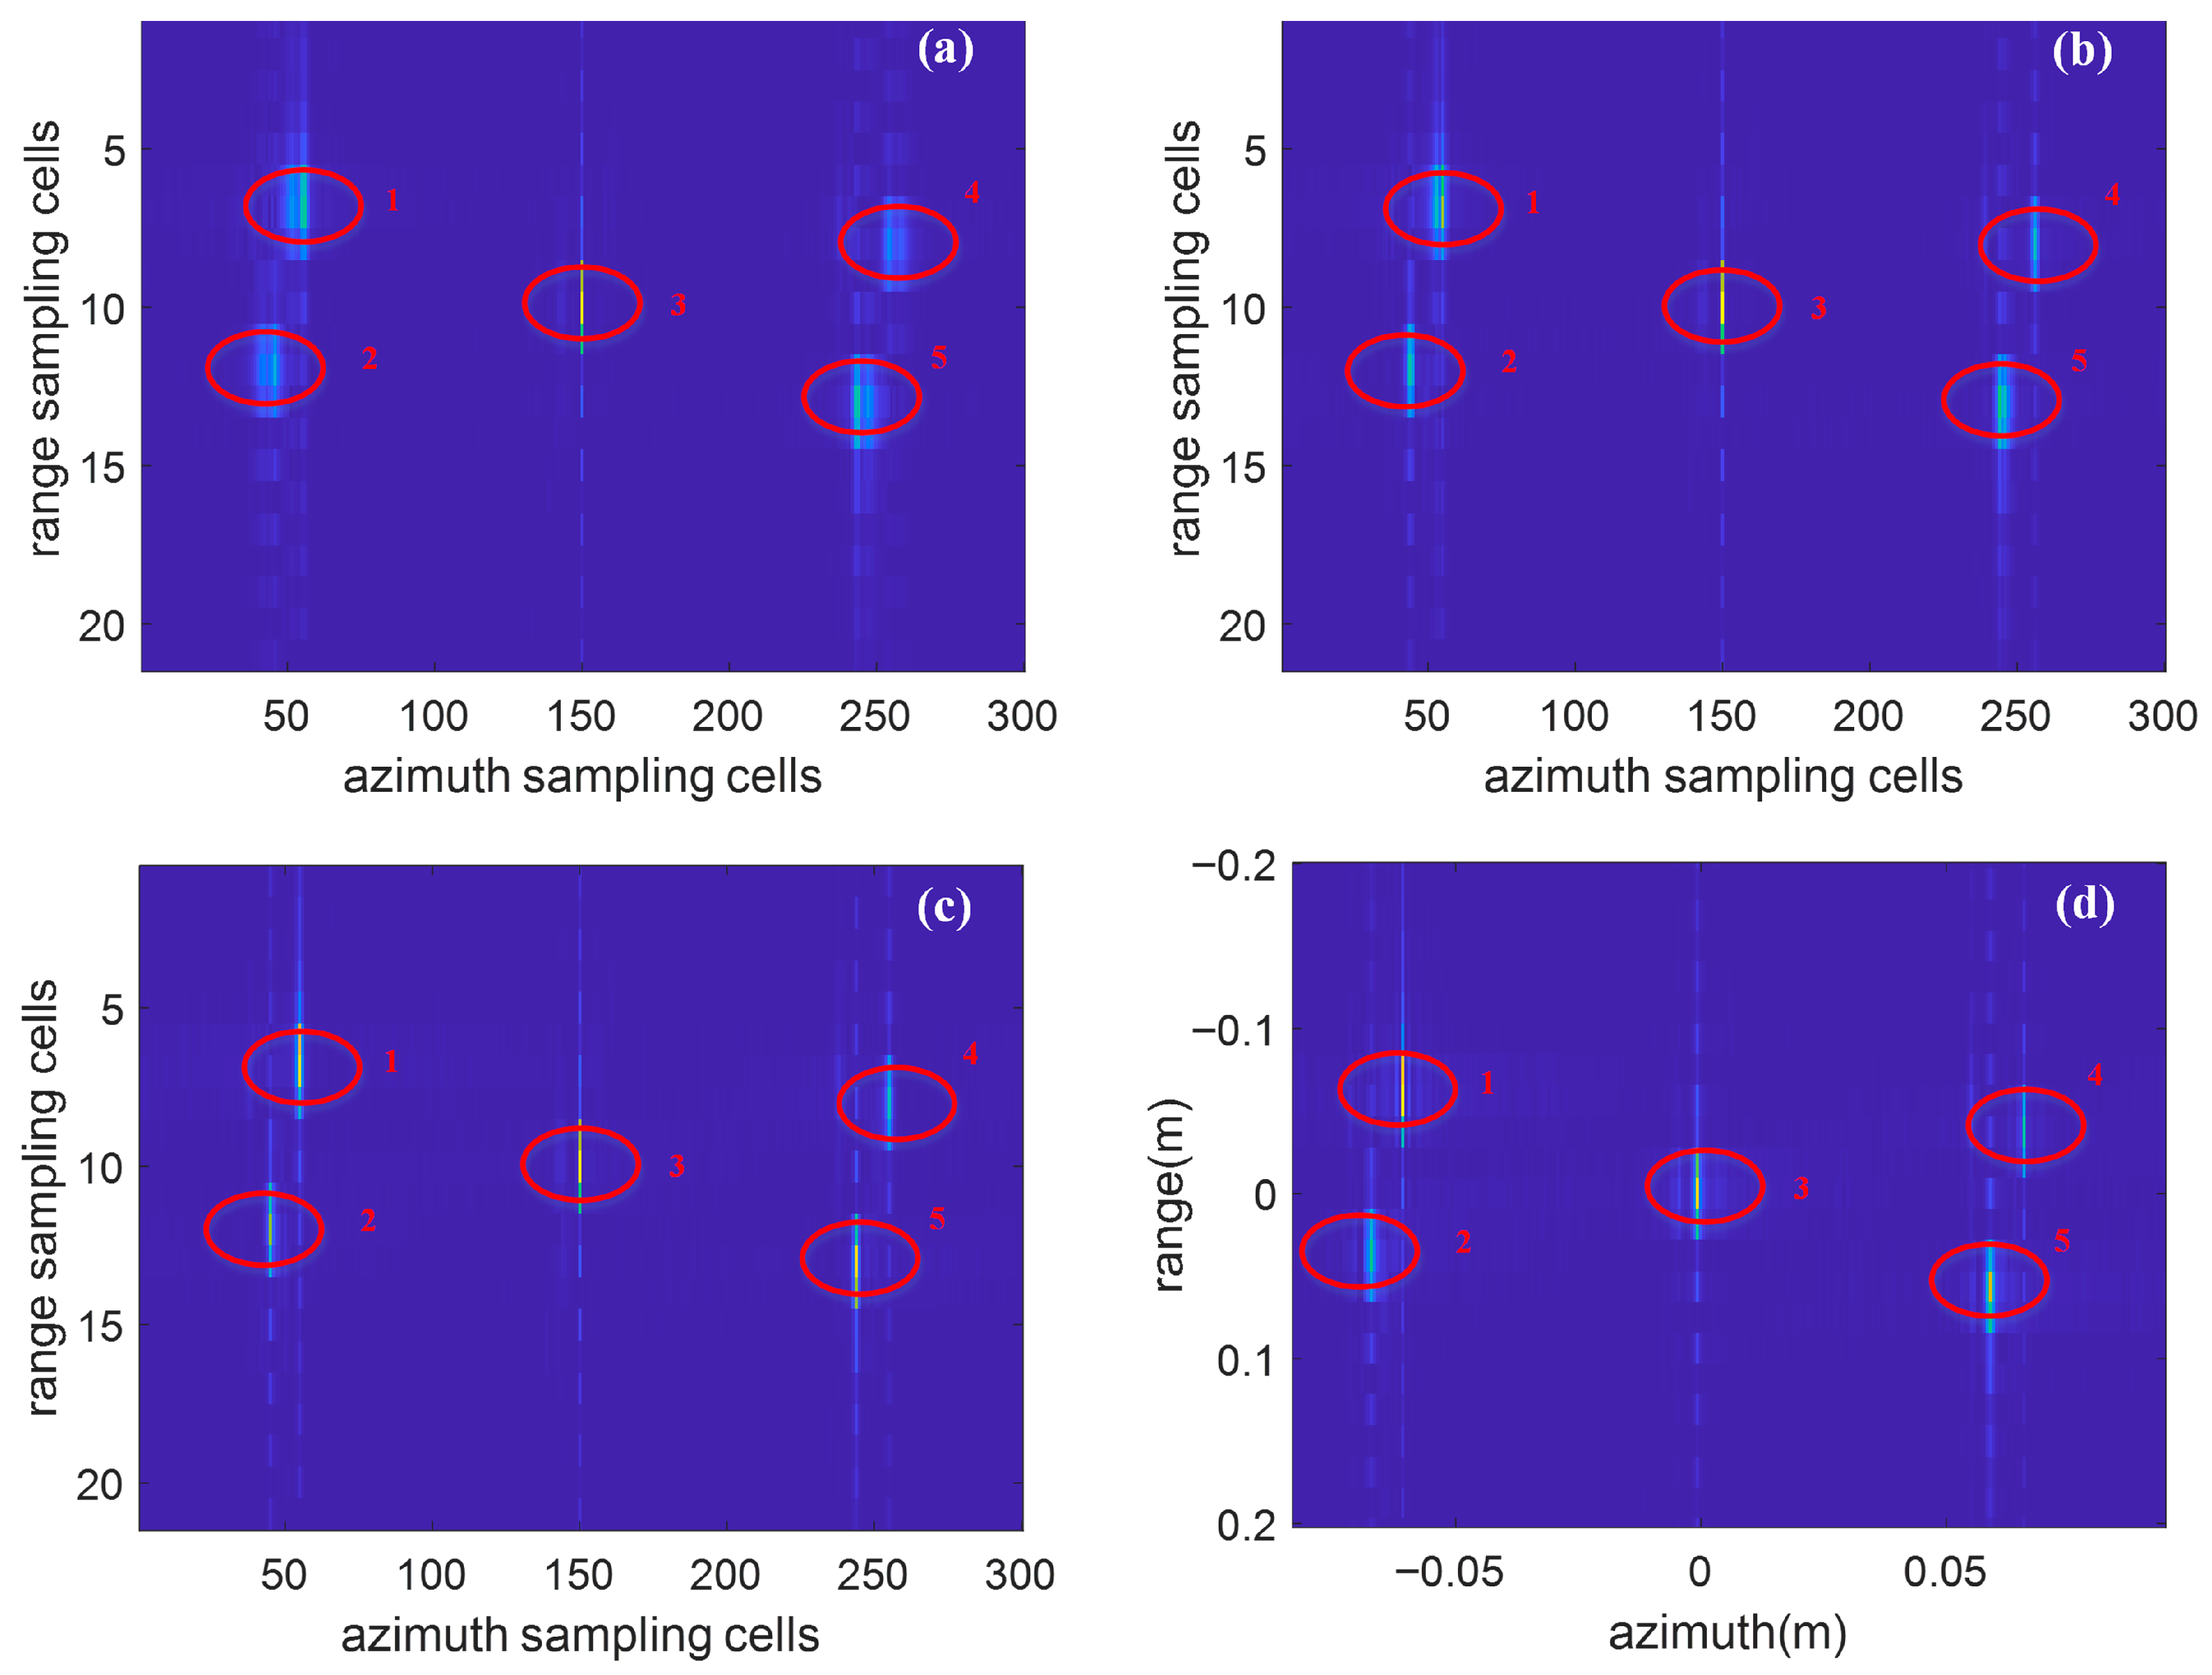
Figure 19a shows the imaging result without compensation, where the sidelobes of edge scatterers are relatively higher than those of the central scatterer.
Figure 19b shows the imaging result with the SM algorithm, in which the Gauss–Newton method was employed to estimate
and
, and only the second-order phase error along the azimuth direction was compensated.
Figure 19c,d show the imaging and scaled results with the proposed algorithm. First, the proposed algorithm is used to compensate for the non-uniform rotation of the echo data. Then, the entropy value of the compensated image is used as the cost function for the genetic algorithm. After optimization by the genetic algorithm, the estimated rotation parameters are
= 0.2040 rad/s,
= 6.1372 and
= 1091, respectively. The actual rotation speed of the turntable was set to 10°/s. The rotation parameters obtained by the search algorithm were
= 0.2 rad/s,
= 6, and
= 1200. The parameters estimated by the genetic algorithm are very close to both the actual settings and the search results, and the imaging performance after compensation using the estimated parameters was significantly improved, demonstrating the accuracy of the genetic algorithm. In addition, the computational time of the genetic algorithm is much shorter than that of the search algorithm. By contrast, the rotation parameters estimated by the Gauss–Newton method,
= 0.14 rad/s,
= 5.998, and
= 1570, deviate more from the true values.
By comparing
Figure 19c to
Figure 19a and
Figure 19b, it can be observed that the imaging result compensated by the proposed algorithm is more clearly, especially at the edges of the target. This demonstrates the effectiveness of the proposed algorithm in compensating for the non-uniform rotation.
To further verify the effectiveness of the proposed algorithm, the entropy and contrast values corresponding to the three imaging results in
Figure 19 are given in
Table 6. From
Table 6, it can be seen that the entropy values of
Figure 19a–c gradually decrease, while the contrast values gradually increase, indicating that the proposed algorithm is effective.
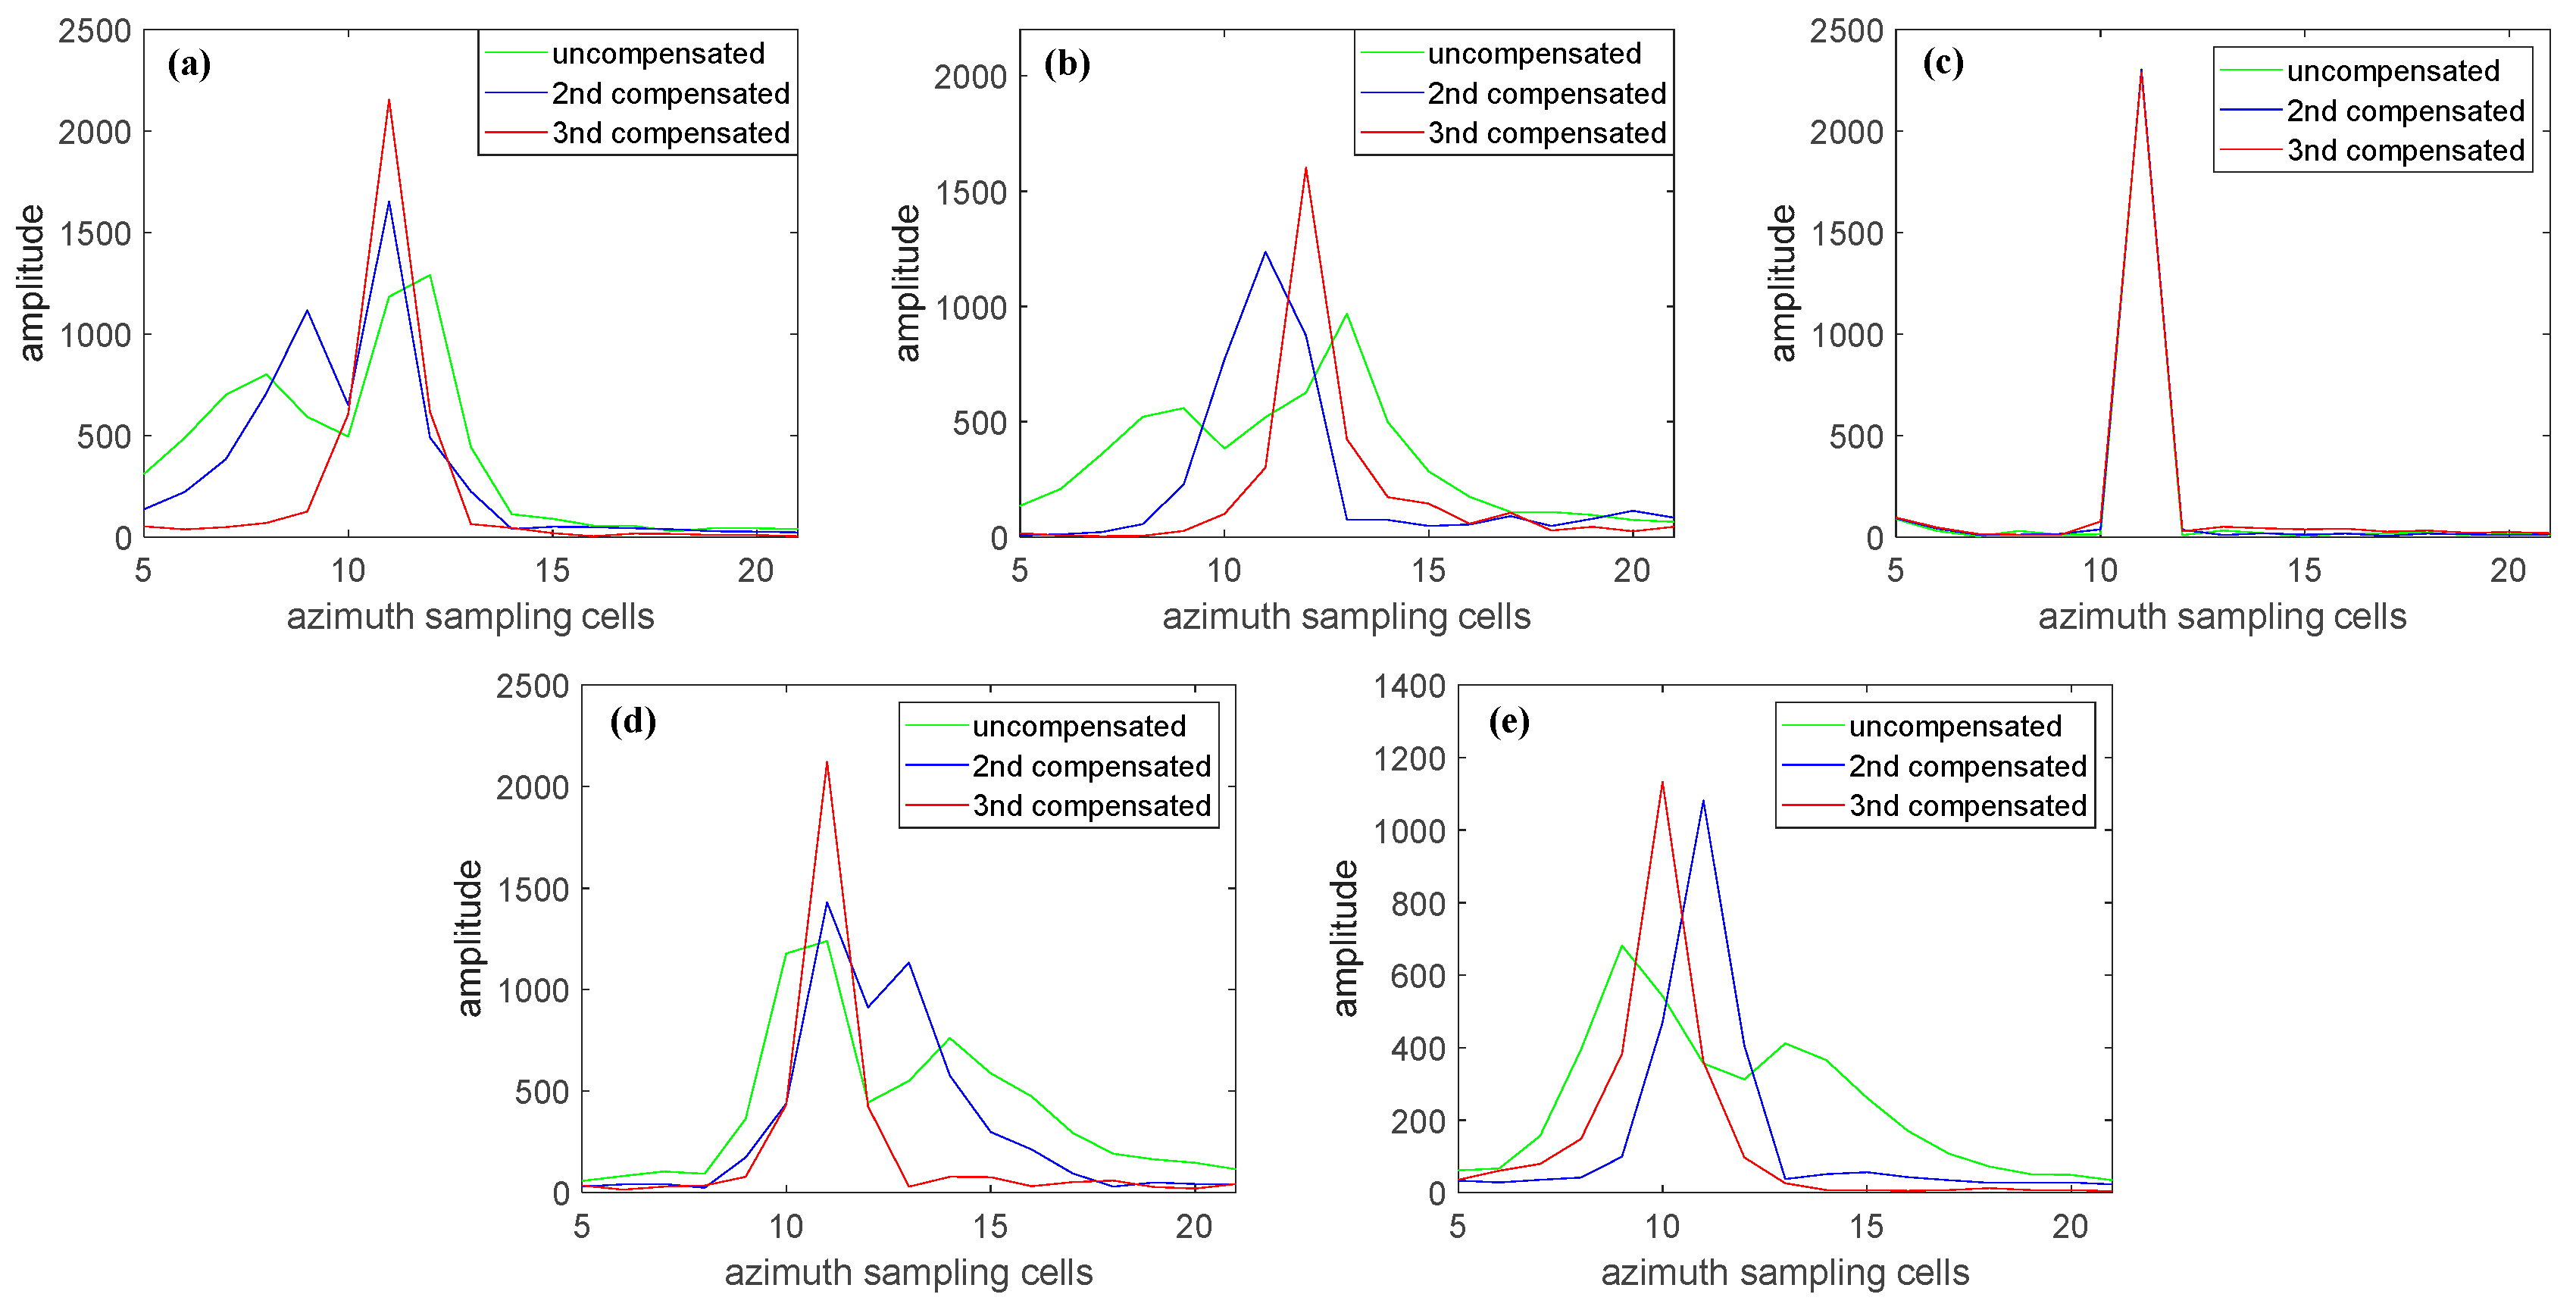
Figure 20 shows the azimuth profiles of the five corner cubes before and after compensation, with
Figure 20a–e corresponding to the azimuth profiles of point targets 1–5 in
Figure 19. The green curve represents the profile without compensation, the blue curve represents the profile after second-order phase compensation (SM algorithm), and the red curve represents the profile after third-order phase compensation (proposed algorithm). By comparing these three curves, it can be seen that after the third-order phase compensation, the main lobe of the point target becomes narrower and the focusing effect improved. This result further verifies the effectiveness of the proposed algorithm.
