Article

Semantic Segmentation of High-Resolution Remote Sensing Images Based on RS3Mamba: An Investigation of the Extraction Algorithm for Rural Compound Utilization Status

1
School of Remote Sensing and Geomatics Engineering, Nanjing University of Information Science and Technology, Nanjing 210044, China
2
School of Geography, Nanjing University of Information Science and Technology, Nanjing 210044, China
*
Author to whom correspondence should be addressed.
Remote Sens. 2025, 17(20), 3443; https://doi.org/10.3390/rs17203443
Submission received: 13 August 2025 / Revised: 9 October 2025 / Accepted: 13 October 2025 / Published: 15 October 2025

Abstract

Highlights

What are the main findings?
  • It is confirmed that high-spatial-resolution remote sensing images can achieve high-precision estimation of rural homestead utilization rate and calculation of vacancy rate via semantic segmentation methods.
  • A high-precision extraction algorithm framework suitable for rural homesteads in regularly shaped areas is proposed.
What is the implication of the main finding?
  • It provides a feasible technical approach for the rapid and accurate acquisition of rural homestead spatial information, breaking through the limitation of low efficiency in traditional manual surveys.
  • The proposed algorithm framework can offer key technical support and data references for rural planning, homestead management, and optimal allocation of land resources.

Abstract

In this study, we utilize Gaofen-2 satellite remote sensing images to optimize and enhance the extraction of feature information from rural compounds, addressing key challenges in high-resolution remote sensing analysis: traditional methods struggle to effectively capture long-distance spatial dependencies for scattered rural compounds. To this end, we implement the RS3Mamba+ deep learning model, which introduces the Mamba state space model (SSM) into its auxiliary branching—leveraging Mamba’s sequence modeling advantage to efficiently capture long-range spatial correlations of rural compounds, a critical capability for analyzing sparse rural buildings. This Mamba-assisted branch, combined with multi-directional selective scanning (SS2D) and the enhanced STEM network framework (replacing single 7 × 7 convolution with two-stage 3 × 3 convolutions to reduce information loss), works synergistically with a ResNet-based main branch for local feature extraction. We further introduce a multiscale attention feature fusion mechanism that optimizes feature extraction and fusion, enhances edge contour extraction accuracy in courtyards, and improves the recognition and differentiation of courtyards from regions with complex textures. The feature information of courtyard utilization status is finally extracted using empirical methods. A typical rural area in Weifang City, Shandong Province, is selected as the experimental sample area. Results show that the extraction accuracy reaches an average intersection over union (mIoU) of 79.64% and a Kappa coefficient of 0.7889, improving the F1 score by at least 8.12% and mIoU by 4.83% compared with models such as DeepLabv3+ and Transformer. The algorithm’s efficacy in mitigating false alarms triggered by shadows and intricate textures is particularly salient, underscoring its potential as a potent instrument for the extraction of rural vacancy rates.

1. Introduction

The rapid development of China’s economy and urbanization rate has led to a significant migration of rural populations to urban areas. This phenomenon, coupled with the aging of the remaining rural population, has resulted in the “hollowing out” [1,2,3] of the countryside, a term used to describe the decline of rural areas as their population and economic activity decreases, which is widespread in most countries [4,5]. This phenomenon not only results in a significant waste of land resources but also presents a substantial impediment to the effective allocation and utilization of rural resources [6,7,8]. As a result, a considerable number of compounds have become vacant or have been abandoned, further exacerbating these issues. The ability to swiftly and precisely ascertain information regarding the utilization of rural compounds is of paramount importance to comprehending regional land reserve resources, ensuring national food security, and effectively implementing the strategy of comprehensive rural revitalization.
The conventional approach to extracting compounds involves manual field surveys [5,9], a method that is both labor-intensive and inefficient. The advent of high-resolution remote sensing [10,11,12] satellite data has led to a marked increase in the utilization of remote sensing technology for the precise identification and extraction of the feature information of rural compounds [13,14,15]. This has been particularly evident in the application of deep learning models such as UNet [16], DeepLab [17], Transformer [18,19,20], and analogous models, which have led to substantial enhancements in the performance of remote sensing semantic segmentation. Wang et al. [21] examined the impact of deep learning technology on traditional village landscape assessment and proposed an analysis framework based on a pixel-level semantic segmentation algorithm and image feature extraction. The physical attributes and spatial features of village landscape images are extracted by convolutional neural networks, combined with image recognition techniques (e.g., HOG, SIFT algorithms), to realize the classification of architectural elements and simulate the value perception logic of both experts and the public. Zhao et al. [22] proposed a model for identifying hollow villages. This model integrates static remote sensing images, village views, and nighttime lighting (NTL) time series data. The extraction of static features from buildings is achieved through the utilization of ResNet18 in conjunction with the attention module, while the analysis of dynamic patterns in human activities within NTL data is facilitated by LSTM-FCN. Experiments demonstrate that NTL data plays a pivotal role in the identification of hollow villages, and remote sensing and view data can complement the specifics of the built environment, thereby providing a cross-scale solution for the monitoring of rural hollowing. In their study, Meng et al. [23] propose an automated classification methodology for rural building features, employing unmanned aerial vehicle (UAV) tilt photography and deep learning algorithms. A convolutional neural network, such as ResNet50, is employed to classify seven indicators, including building function, structure, and age. The recognition accuracy for the number of building layers achieves 99.5%, while the abandoned state demonstrates a recognition accuracy of 95.9%. The study establishes a standardized workflow from image acquisition to classification mapping, and it verifies the efficiency advantage of deep learning in a large-scale survey of rural buildings. This can significantly reduce the labor cost of traditional field surveys. Wang et al. [24] developed a technical framework integrating unmanned aerial vehicles (UAVs), deep learning, and machine learning algorithms to recognize the utilization state of rural compounds. The integrity of farmhouses is recognized by AlexNet (accuracy 94.68%), and the classification of compound residence/vacant/abandoned status is realized by combining with the Adaboost algorithm (accuracy 0.933). The proposed method effectively overcomes the conventional limitations associated with utility data dependence, thereby providing a highly versatile quantitative instrument for the management of intensive rural land.
In recent years, a series of Mamba-based algorithms have been emerging in the field of remote sensing data processing. Specifically, MFMamba [25] is dedicated to multi-modal information fusion for semantic segmentation of remote sensing images, MSFMamba [26] conducts research on multi-scale feature fusion for multi-source remote sensing image classification via state space models, and Semi-Mamba [27] has made progress in the direction of semi-supervised multi-modal feature classification. However, most of these latest Mamba-related studies focus on hyperspectral remote sensing image processing and multi-modal fusion applications. There remains a significant research gap in exploring the applicability of Mamba architectures in high-resolution remote sensing image scenarios—this direction is of crucial significance for high-precision tasks such as fine-grained extraction of rural compounds, which also provides a clear motivation for the innovative exploration of this study.
The existing semantic segmentation algorithms demonstrate efficacy in building extraction scenarios; however, due to the intricate environment of rural compound utilization, differentiating the use of residential compounds spectrally remains challenging. This field exhibits the following deficiencies: first, the low contrast between the rural houses and the background, attributable to the roof material and vegetation cover, can result in the blurring of the target boundary extraction; second, the dispersed distribution of independent houses can impede the Transformer-class model’s capacity to optimize computational efficiency and accuracy; third, there is an absence of specialized labeled datasets for rural residential compounds [28,29,30]. In this study, the authors employ domestic Gaofen-2 high spatial resolution remote sensing images to illustrate a spatial state model replacement for the Transformer for long-range dependency modeling in typical rural areas of Shandong Province. The replacement is based on RS3Mamba’s two-branch framework. Concurrently, a manually annotated dataset is constructed, with the relevant features being extracted to classify the compounds and for target boundary extraction. The fuzzy problem is embedded with morphological operations to adjust the boundary shape, thereby ensuring the effective extraction of feature information regarding rural compound usage.

2. Data Processing and Algorithm Design

2.1. Preprocessing

This study uses the remote sensing image processing software ENVI 5.3 to perform radiometric calibration and atmospheric correction on the multispectral bands of an image and relative radiometric correction on the panchromatic bands. Using the Red/Green/Blue bands for true-color synthesis and the GDAL library function to stretch and reconstruct the multispectral band correction onto the panchromatic bands produces an output true-color image. This image is then batch-cropped synchronously to a size of 512 × 512 pixels for model training.
Due to the high-density, patchy distribution of villages in the target area [31,32], the image is divided into several units. Areas with a concentrated distribution of compounds around the test area are selected to create a training set. The training set is about 100 times larger than the test set to extract the spatial distribution characteristics of unused compounds. To achieve the batch separation of unused courtyards, we analyze fine features with sub-meter Google Earth images. We take the vegetation coverage of courtyards as the core discriminative index and construct a decision rule by combining it with the damage status of buildings. To address the interference of shadows on feature extraction, we manually label non-vacant courtyards.
Figure 1 shows the technical route for data processing and model training.

2.2. Study Area and Data Source

The present study constructed a dataset encompassing the rural areas of Shouguang City, Shandong Province. The training set was constructed by cropping the images to a dimension of 512 × 512 pixels following the preprocessing stage outlined in Section 2.1. Subsequently, the images with a village pixel ratio of less than 5% were eliminated. In light of the geographical significance of the extraction target, the validation set was constituted by randomly selecting 20 villages based on their actual geographical boundaries. The ratio of the area under the curve (AUC) of the training set to the validation set is approximately 9:1. Given the persistent discrepancy between the semantic segmentation results and the rural hollow rate, this study utilizes Mengjia Village in Shouguang City, Shandong Province (see Figure 2), as a case study to demonstrate the practical extraction outcomes and their precision. Located in the middle of Shandong Province (118°36′E, 36°53′45″N), the village has a total area of about 0.4 square kilometers. Due to the exodus of the rural population, unused rural compounds have become increasingly prominent in the test area, generally showing the pattern of “vacant center, expanding periphery,” suggesting that a considerable proportion of residential structures in a state of unoccupancy, encompassing houses and homesteads, are situated within the central areas of hollowed-out villages. These structures persist in a state of unoccupancy, while new residential construction continues to extend beyond the geographical boundaries of these villages.
In this study, we used high-spatial-resolution GF-2 satellite remote sensing images to extract courtyard characteristics. GF-2 is China’s first independently developed civilian optical remote sensing satellite with a spatial resolution better than 1 m. The width of a single camera is 23 km, and a dual-camera combination can reach up to 45 km. It can achieve a ground resolution of 0.81 m for panchromatic and 3.24 m for multispectral imaging. The imaging date for the images selected for this study was 16 October 2023, with less than 10% cloud cover, and the images have been orthorectified.

2.3. Algorithm

The RS3Mamba [33] model is based on the Mamba model and has a two-branch structure, as shown in Figure 3, containing an auxiliary branch and a main branch. The auxiliary branch is based on the VSS block and uses the Mamba model method to create long-range dependencies and provide global information. The main branch uses a convolutional neural network (ResNet) to learn local feature representations. The innovative multi-scale feature fusion module effectively combines global and local features, compensating for the lack of long-range modeling capability in traditional CNNs while avoiding the VSS model’s unstable performance.
This study replaces the ReLU activation function used in lightweight, shallow networks with the SiLU activation function to construct nonlinear target features and alleviate the gradient descent problem in deep networks. The model’s information loss rate is significantly reduced by improving the convolutional layer of the stem network and the MLP layer in Mamba’s auxiliary branch. Additionally, the SS2D module’s weight computation system is updated to create a multiscale attention fusion mechanism that optimizes and improves the model.

2.3.1. Auxiliary Branch Based on Mamba

The auxiliary branching based on the Mamba realizes its functionality primarily through the discrete state-space model of the VSS module in Figure 3. It uses an innovative multilayer perceptron for the VSS module’s self-attentive output and utilizes a stem network to implement downsampling and connect the VSS module’s layers in series.
A state space model (SSM) maps an input sequence to an output sequence through a set of state equations. Mathematically, this process can be expressed as state and output equations using linear ordinary differential equations (ODEs), respectively:
h t = A h t + B x t   y t = C h t
where A  R N × N is the state transfer matrix, B R N × 1 is the projection matrix, C R 1 × N is the projection matrix, h ( t ) denotes the hidden state, and x t ,   y ( t ) represent the input and output sequences, respectively. Parameters A and B are continuous, so they cannot be directly mapped to the mainstream framework and are difficult to realize in digital systems. Therefore, this study discretizes the SSM using zero-order hold [34], transforming the continuous parameters A and B into discrete state and input matrices, A ¯ and B ¯ , respectively:
A ¯ = e A Δ , B ¯ = 0 e A s d s B B   ( w h e n     i s   s m a l l )
In particular, the time scale parameters and projection matrices B and C are dynamically generated by linearly projecting the input feature map x k (linear layer) to adaptively model spatial dependencies in different regions:
, B , C = Linear x k
The discretized equation of state is then obtained as follows:
h k = A ¯ h k 1 + B ¯ x k y k = C h k
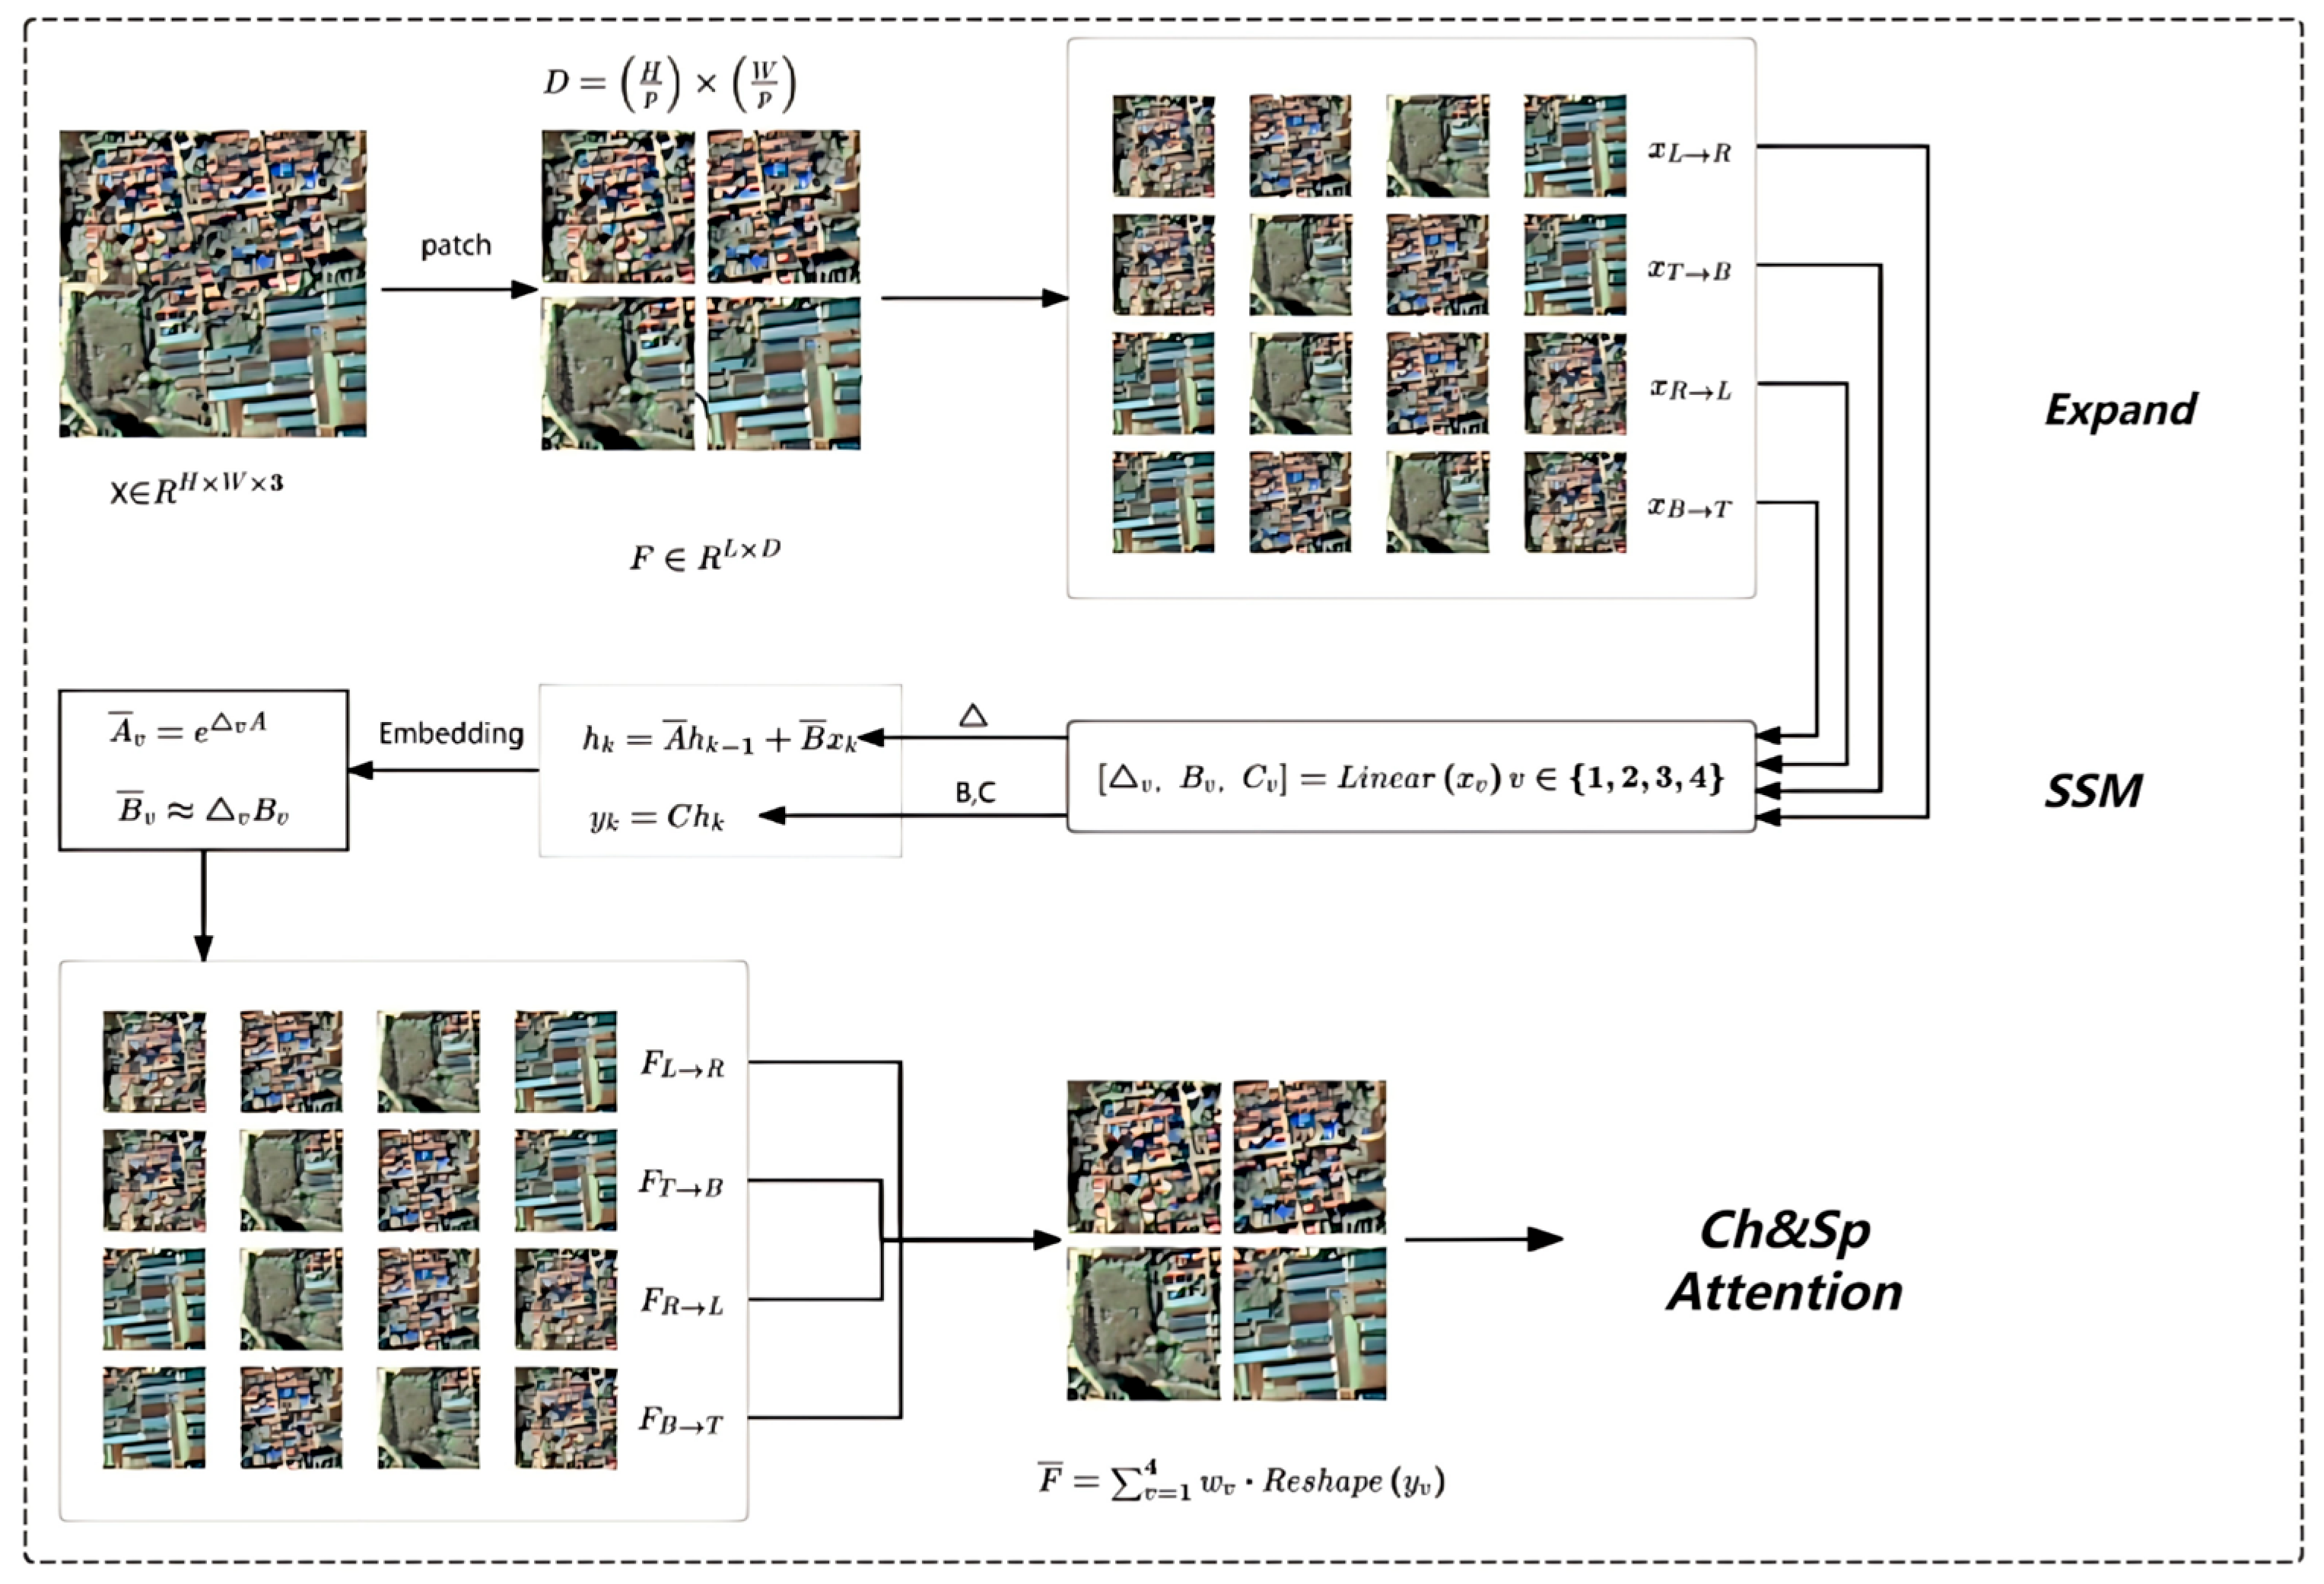
The RSMamba model uses SS2D to capture the spatial global dependence of remote sensing images, as shown in Figure 4. The feature map is expanded into a one-dimensional sequence in four directions and processed separately for SSM:
x v = expand ( x , v ) ,   v 1,2 , 3,4
Perform discrete SSM for each direction v :
x v ¯ = S S M x v = k = 1 L A ¯ v k h k 1 , v + B ¯ v k x v , k
x v R L × D , where L = H × W denotes the sequence length and D is the feature dimension. The outputs from the four directions are then combined into the global feature F via weighted summation: note the sequence length and D is the feature dimension. The outputs from the four directions are then combined into the global feature F via weighted summation.
F = v = 1 4 w v Reshape ( y v )
The final extension yields the following complete equation of state for Mamba. In this equation, A v ¯ ( k ) , B v ¯ ( k ) , C v ( k ) is generated from input x k , v via linear projection to achieve input-dependent global modeling.
h k , v = A ¯ v k h k 1 , v + B ¯ v k x k , v y k , v = C v k h k , v x ¯ = v = 1 4 WeightedSum y 1 : L , v
In accordance with the above state equations, each layer of the VSS module obtains long-range dependencies and is connected to the others through a stem network. This setup efficiently preprocesses and extracts features from remote sensing images through improved convolution, normalization, and activation operations.
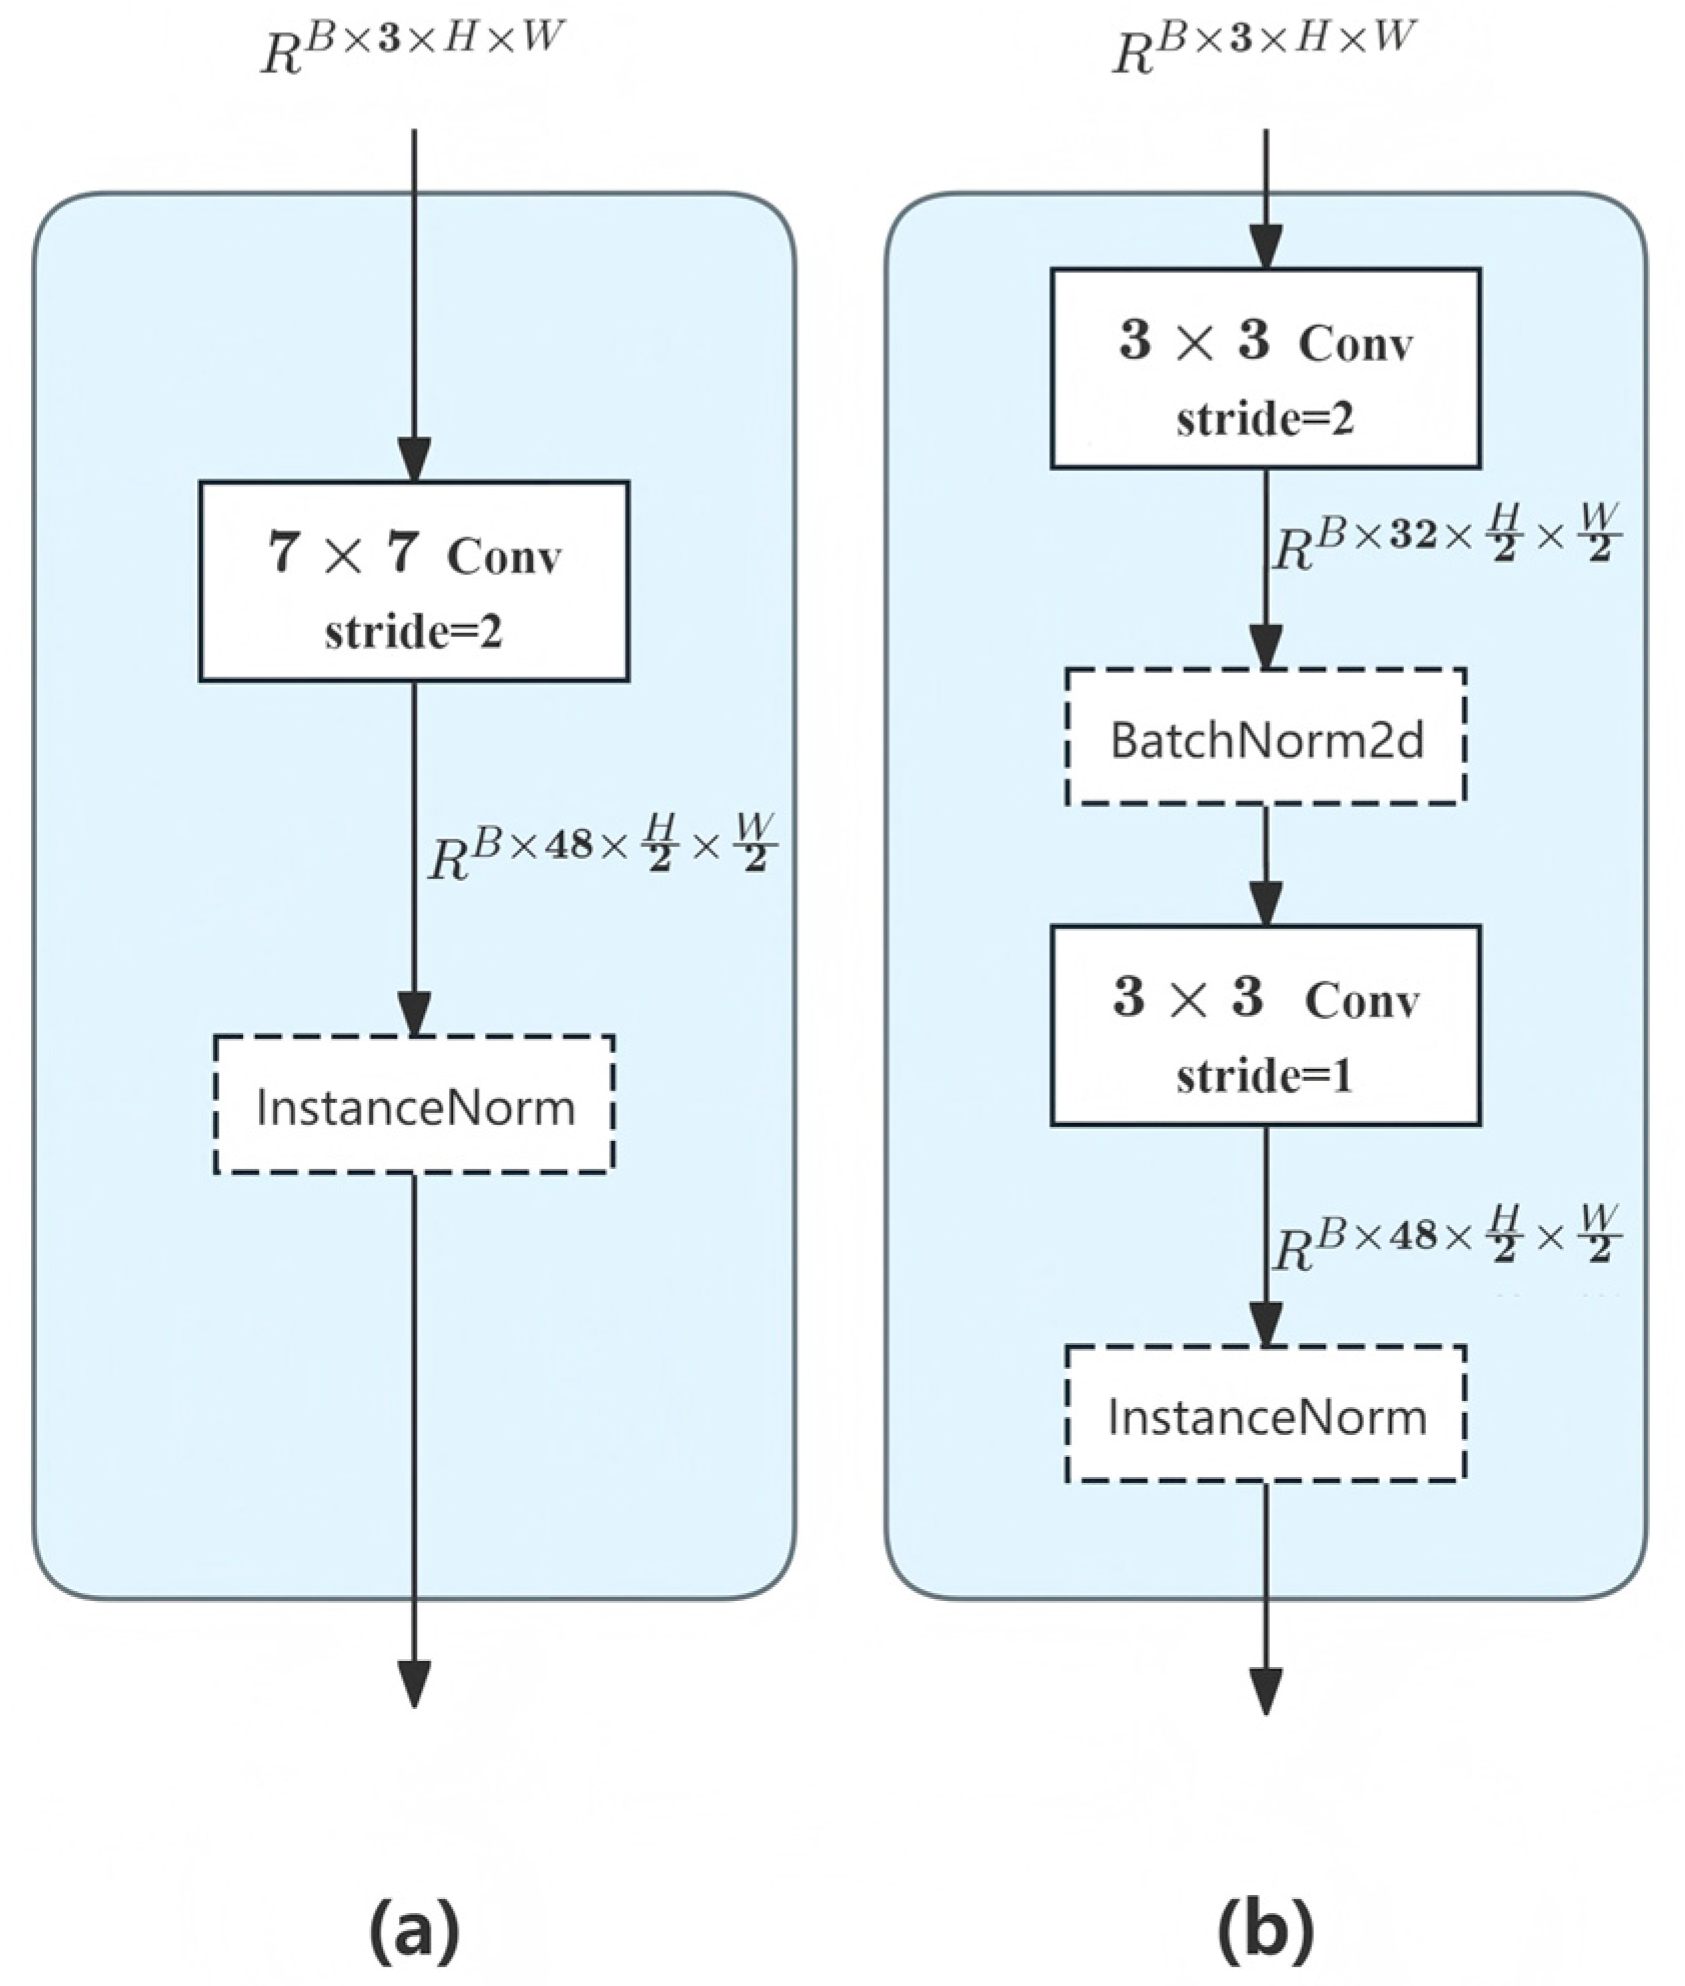
First, this study transforms a single-layer convolution (7 × 7) into a two-layer convolution structure to capture richer image patterns through progressive feature extraction. The first 3 × 3 convolution layer focuses on extracting base edge and texture features. It increases the number of channels from 3 to 32 and uses the BatchNorm normalization function after the first convolution layer. This accelerates model convergence by exploiting batch statistical information. The second 3 × 3 convolution layer further integrates and refines these features. It increases the number of channels to 48, as shown in Figure 5. This provides better-quality input for subsequent modules and significantly reduces information loss.
In the MLP module [35] with self-attentive output after VSS, standard convolution is decomposed into depth convolution and point-by-point convolution using depth-separable convolution. This drastically reduces the number of parameters to about one-ninth of a standard convolution and captures spatially localized information using a 3 × 3 depth convolution combined with a 1 × 1 point-by-point convolution to achieve inter-channel information fusion.

2.3.2. Multiscale Attention Feature Fusion Module

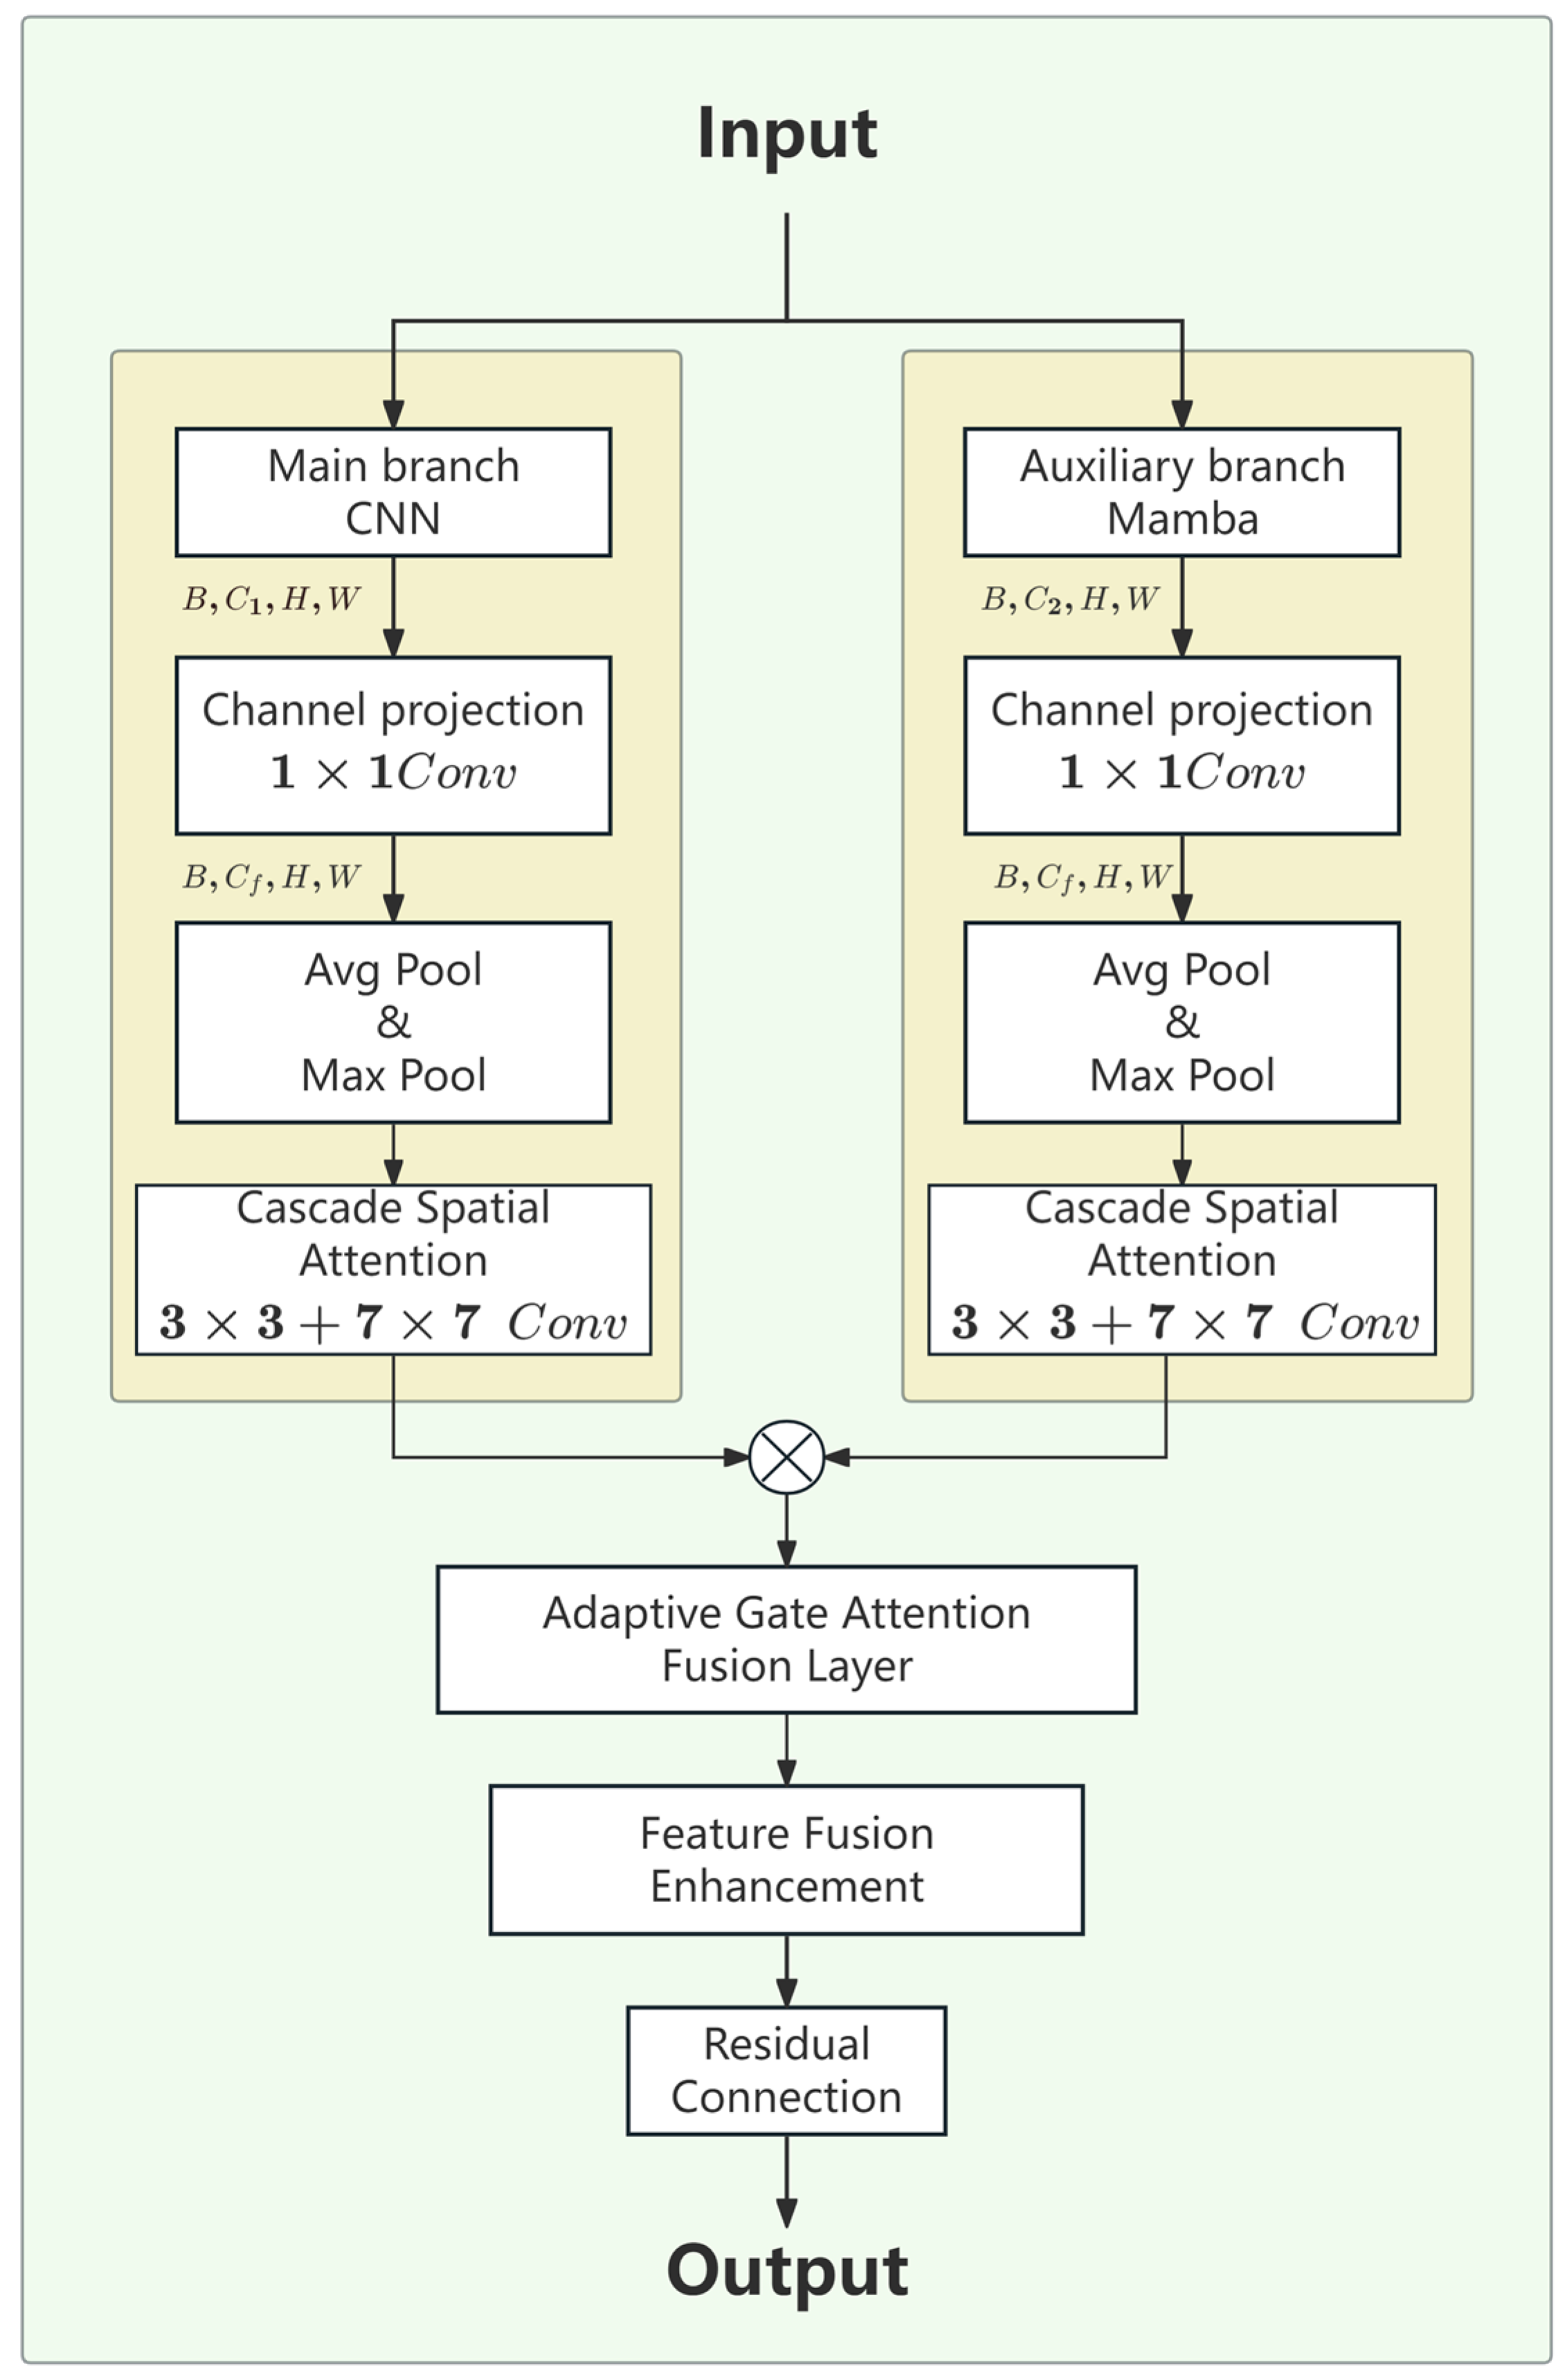
In RS3Mamba+, the feature fusion between its main (CNN-based) and enhanced (Mamba-based) encoding branches is designed to synergize their strengths. As shown in Figure 6, both branches first go through a 1 × 1 Conv channel projection to unify channels to Cf. Then, each undergoes dual-path channel attention (Avg+Max Pool) to emphasize channel importance, followed by cascade spatial attention (3 × 3 + 7 × 7 Conv) for multi-scale spatial dependency capture.
Upon convergence, an Adaptive Gate Attention Fusion Layer generates a context-aware weight matrix for element-wise fusion, suppressing background noise in house boundaries. Post-fusion, feature enhancement and a residual connection refine the output to R B × C f × H × W .
This mechanism integrates CNN’s local feature extraction and Mamba’s long-range dependency modeling via spatial, channel, and gate attention, enabling robust feature integration for remote sensing segmentation.
During the decoder stage, the gate attention mechanism adjusts the fusion ratio of features at different levels nonlinearly through the activation function. Transforming the feature fusion process into a learnable attention allocation problem enhances the model’s ability to discriminate between low-contrast targets (e.g., vegetation-covered vacant houses) in remote sensing images. This approach avoids the dimensionality explosion caused by traditional feature splicing.
During the post-processing stage of prediction, the architecture uses a gating mechanism to filter out meaningless fragmented spots. It then constructs rectangles with variable side lengths to predict the shapes and boundaries of labels. Finally, it creates dynamic filtering rules based on the connected domain area and morphological operations to further improve the spatial consistency of the segmentation results.
The model uses the gate attention mechanism multiple times to dynamically model semantic associations within input sequences via triad mapping of query, key, and value with gating logic. The core idea is to map the input features into three different vector spaces (Q, K, and V). After calculating the similarity between the query and key, we generate attention weights and then weight and sum the value based on these weights to capture long-range dependencies within the sequence. The technical details [36] are as follows:
Specify the image input as X R N × L × D , where N denotes the batch size, L is the sequence length, and D is the feature dimension:
Q = X W Q R N × L × d k                   K = X W K R N × L × d k           V = X W V R N × L × d k          
where W Q , W K , and W V are learnable mapping matrices; d k is the dimension of Q, K, and V; and n u m _ h e a d s denotes the number of branches of parallel computation that are satisfied:
d k = D / n u m _ h e a d s
Backpropagate the gradient through the training data and update the weight matrix so that W Q extracts features related to the current semantic basic unit to be attended to, W K extracts features related to how other basic units are attended to, and W V delivers the actual semantic content. Backpropagation adjusts the different mapping matrices. Calculate the similarity of each basic unit with W Q and all units within, then weight the aggregated W V to obtain the attention weights:
Attention ( Q , K , V ) = Softmax ( Q K T d k ) V
where d k is a scale factor that stabilizes the gradient. For each semantic basic unit in the input X , the Q vector interacts with the K vectors of the other semantic units to determine the attention score. The final output is a weighted sum of the V vectors, where the weights are determined by the attention score.
Ultimately, the gating unit is introduced into the attention mechanism to dynamically adjust the weights. The formula is as follows:
G = σ X W G
G a t e d _ A t t e n t i o n = G · A t t e n t i o n ( Q , K , V )
where G R N × L × 1 , the gating weight is defined, and · denotes element-wise multiplication. This enhances the expression of key semantics by suppressing the attentional response in regions of low relevance. Key technical steps of the model, such as two-branch feature fusion and predictive model post-processing, can be realized on this basis.

2.3.3. Model Enhancement

Together, optimization algorithms for neural networks, loss function design, and predictive post-processing strategies form the core link together to optimize the performance of semantic segmentation models.
(1)
Loss Function
This study introduces the cross-entropy loss function to minimize the relative entropy between the actual and expected outputs. It can accurately measure the difference between the model’s predicted distribution and the true distribution by calculating the KL dispersion of two discrete probability distributions. The function receives the model’s predictions, true labels, and weights as inputs. The mathematical expression for the cross-entropy loss is as follows:
L ( θ ) = H ( p , q ) = x p ( x ) log   q ( x )
The probability of the true distribution is denoted by p ( x ) , and the probability of the model’s predictive distribution is denoted by q ( x ) .
(2)
Optimizer
The optimizer adjusts the model parameters to accelerate convergence based on the gradient calculated by the loss function. After obtaining the loss value, the gradient of the loss with respect to the model parameters is calculated using backpropagation. In this study, the Adam W optimizer [37] updates the loss function parameters according to the gradient descent rule to minimize prediction error in the next iteration. The parameter update formula is as follows:
First, the gradient with weight decay is computed.
g t = g t + λ · θ t 1
Then, the first-order moment estimate is updated accordingly.
m t = β 1 · m t 1 + 1 β 1 · g t
The second-order moment estimates, i.e., the exponential moving average of the gradient squares, are then updated.
v t = β 2 · v t 1 + 1 β 2 · g t 2
The biases of the first- and second-order moment estimates are corrected, respectively.
m t ^ = m t 1 β 1 t
v t ^ = v t 1 β 2 t
The final update parameters are as follows:
θ t = θ t 1 η · m t ^ v t ^ + ϵ
In this model, the parameters are denoted by θ t , the gradient by g t , the time step by t, the learning rate by η , the weight decay coefficient by λ , the exponential decay rate of the moment estimation by β 1 and β 2 , and the numerical stability minor constant by ϵ (set to 10 8 by default).
(3)
Predictive reprocessing
In this study, morphological operations are introduced to assist prediction. First, a connectivity domain analysis is performed on the predicted images, and small targets are removed by setting an area threshold to remove obvious noise. Subsequently, closed operations are used to fill internal holes and connect neighboring fractured regions to restore the complete morphology of the target. Finally, open operations are used to clean up the edge noise and smooth the boundaries to enhance the clarity of the target contour. The gate attention mechanism is further superimposed in the prediction post-processing to construct rectangles with variable side lengths to predict the label shapes and boundaries. The dynamically generated spatial attention weights are used to accurately recognize and suppress the meaningless broken spots. When combined with the connectivity domain area threshold filtering, this mechanism can significantly reduce the occurrence of small-size error prediction and construct dynamic filtering rules based on the connectivity domain area and morphological operations. These rules improve the spatial consistency of the segmentation results and strengthen the connectivity and integrity of the target area. This makes the mechanism especially suitable for fragmented courtyard fine segmentation scenarios.

2.4. Parameter

During the configuration process, this study adjusts the hyperparameters and evaluates the performance of the model in detecting housing utilization in the study area. The present study was conducted within a Linux operating system, utilizing a particular environment that comprised a 1 TB hard disk and a GPU. NVIDIA 4090 (NVIDIA, Santa Clara, CA, USA), CPU—Intel Core i7 13700KF (Intel, Santa Clara, CA, USA), equipped with CUDA, V11.2, boasts 128 GB of RAM. The RS3Mamba+ network was implemented in Python 3.8, while the deep learning framework was PyTorch 2.4.1+cu118. The base learning rate was set to 1 × 10⁻², weight decay was set to 5 × 10⁻⁴, and batch size was set to 10. The total training period is set to 50. The learning rate is tuned by a multi-step learning rate scheduler. The loss function was defined as an amalgamation of cross-entropy loss and an ignore labeling mechanism.

3. Feature Extraction Process and Implementation

3.1. Dataset Labeling

In this study, the rural compound utilization status dataset, shown in Figure 7, is initially constructed through visual interpretation. In the implementation process, we compared the characteristics of vacant houses identified through field surveys and literature reviews [38,39]—such as excessive weed coverage within courtyards, damaged roofs, and collapsed courtyard walls leading to incomplete courtyard structures—with pre-processed standardized videos. A review of the extant field survey experience suggests that the conditions of the vacant houses are complex and lack uniform standards, which makes quantification and training challenging. Consequently, this study identified non-vacant houses—defined as those with distinct courtyard structures and vegetation coverage rates below 50%—to construct a dataset and infer the vacancy rate. The general features of vacant compounds are extracted by manually extracting vacant compounds and combining them with labeled multispectral information. Finally, the data are manually labeled to adjust the scale constraints.
This study utilizes high-resolution image data to analyze visual features such as roof condition, spatial distribution, and vegetation condition to assist in extracting compound use conditions. The non-village portion of the preprocessed GF-2 image (see Figure 3) is filtered, and approximately 14,000 labels are selected to construct a manually labeled dataset. Random cropping is then applied to the image to enhance the diversity of samples and improve the robustness of the model to the target location. Flipping is employed in a seemingly random manner to simulate a mirrored scene. This is undertaken to enhance the model’s invariance to the target direction, improve the utilization of features, and introduce smooth noise through Gaussian fuzzy operations. The purpose of this is to enhance the model’s adaptability to blurred images. The model is enhanced by MixUp and CutMix data, employing linear interpolation to blend different samples and their labels, thereby enhancing the model’s comprehension of inter-class boundaries. Additionally, random cropping and replacement of image regions are utilized to compel the model to prioritize local features.

3.2. Model Performance Evaluation

The performance of RS3Mamba+ on the dataset is evaluated by the F 1 score, the mean intersection and merger ratio ( m I o U ), and the K a p p a coefficient, calculated based on the aggregated confusion matrix. The following calculations have been performed:
P = 1 N k = 1 N T P k T P k + F P k
R = 1 N k = 1 N T P k T P k + F N k
F 1 = 2 × P × R P + R
m I o U = 1 N k = 1 N T P k T P k + F P k + F N k
K a p p a = 1 N k = 1 N P × R P + R 1 1 P × R + P
In this study, T P k , F P k , T N k , and F N k represent true cases, false positive cases, true negative cases, and false negative cases, respectively, for a specific object indexing category k. P , R , F 1 , m I o U , and K a p p a represent the precision rate, the recall rate, the F 1 score, the average intersection and merger ratio, and the K a p p a coefficient, respectively.

3.3. Realization of Results

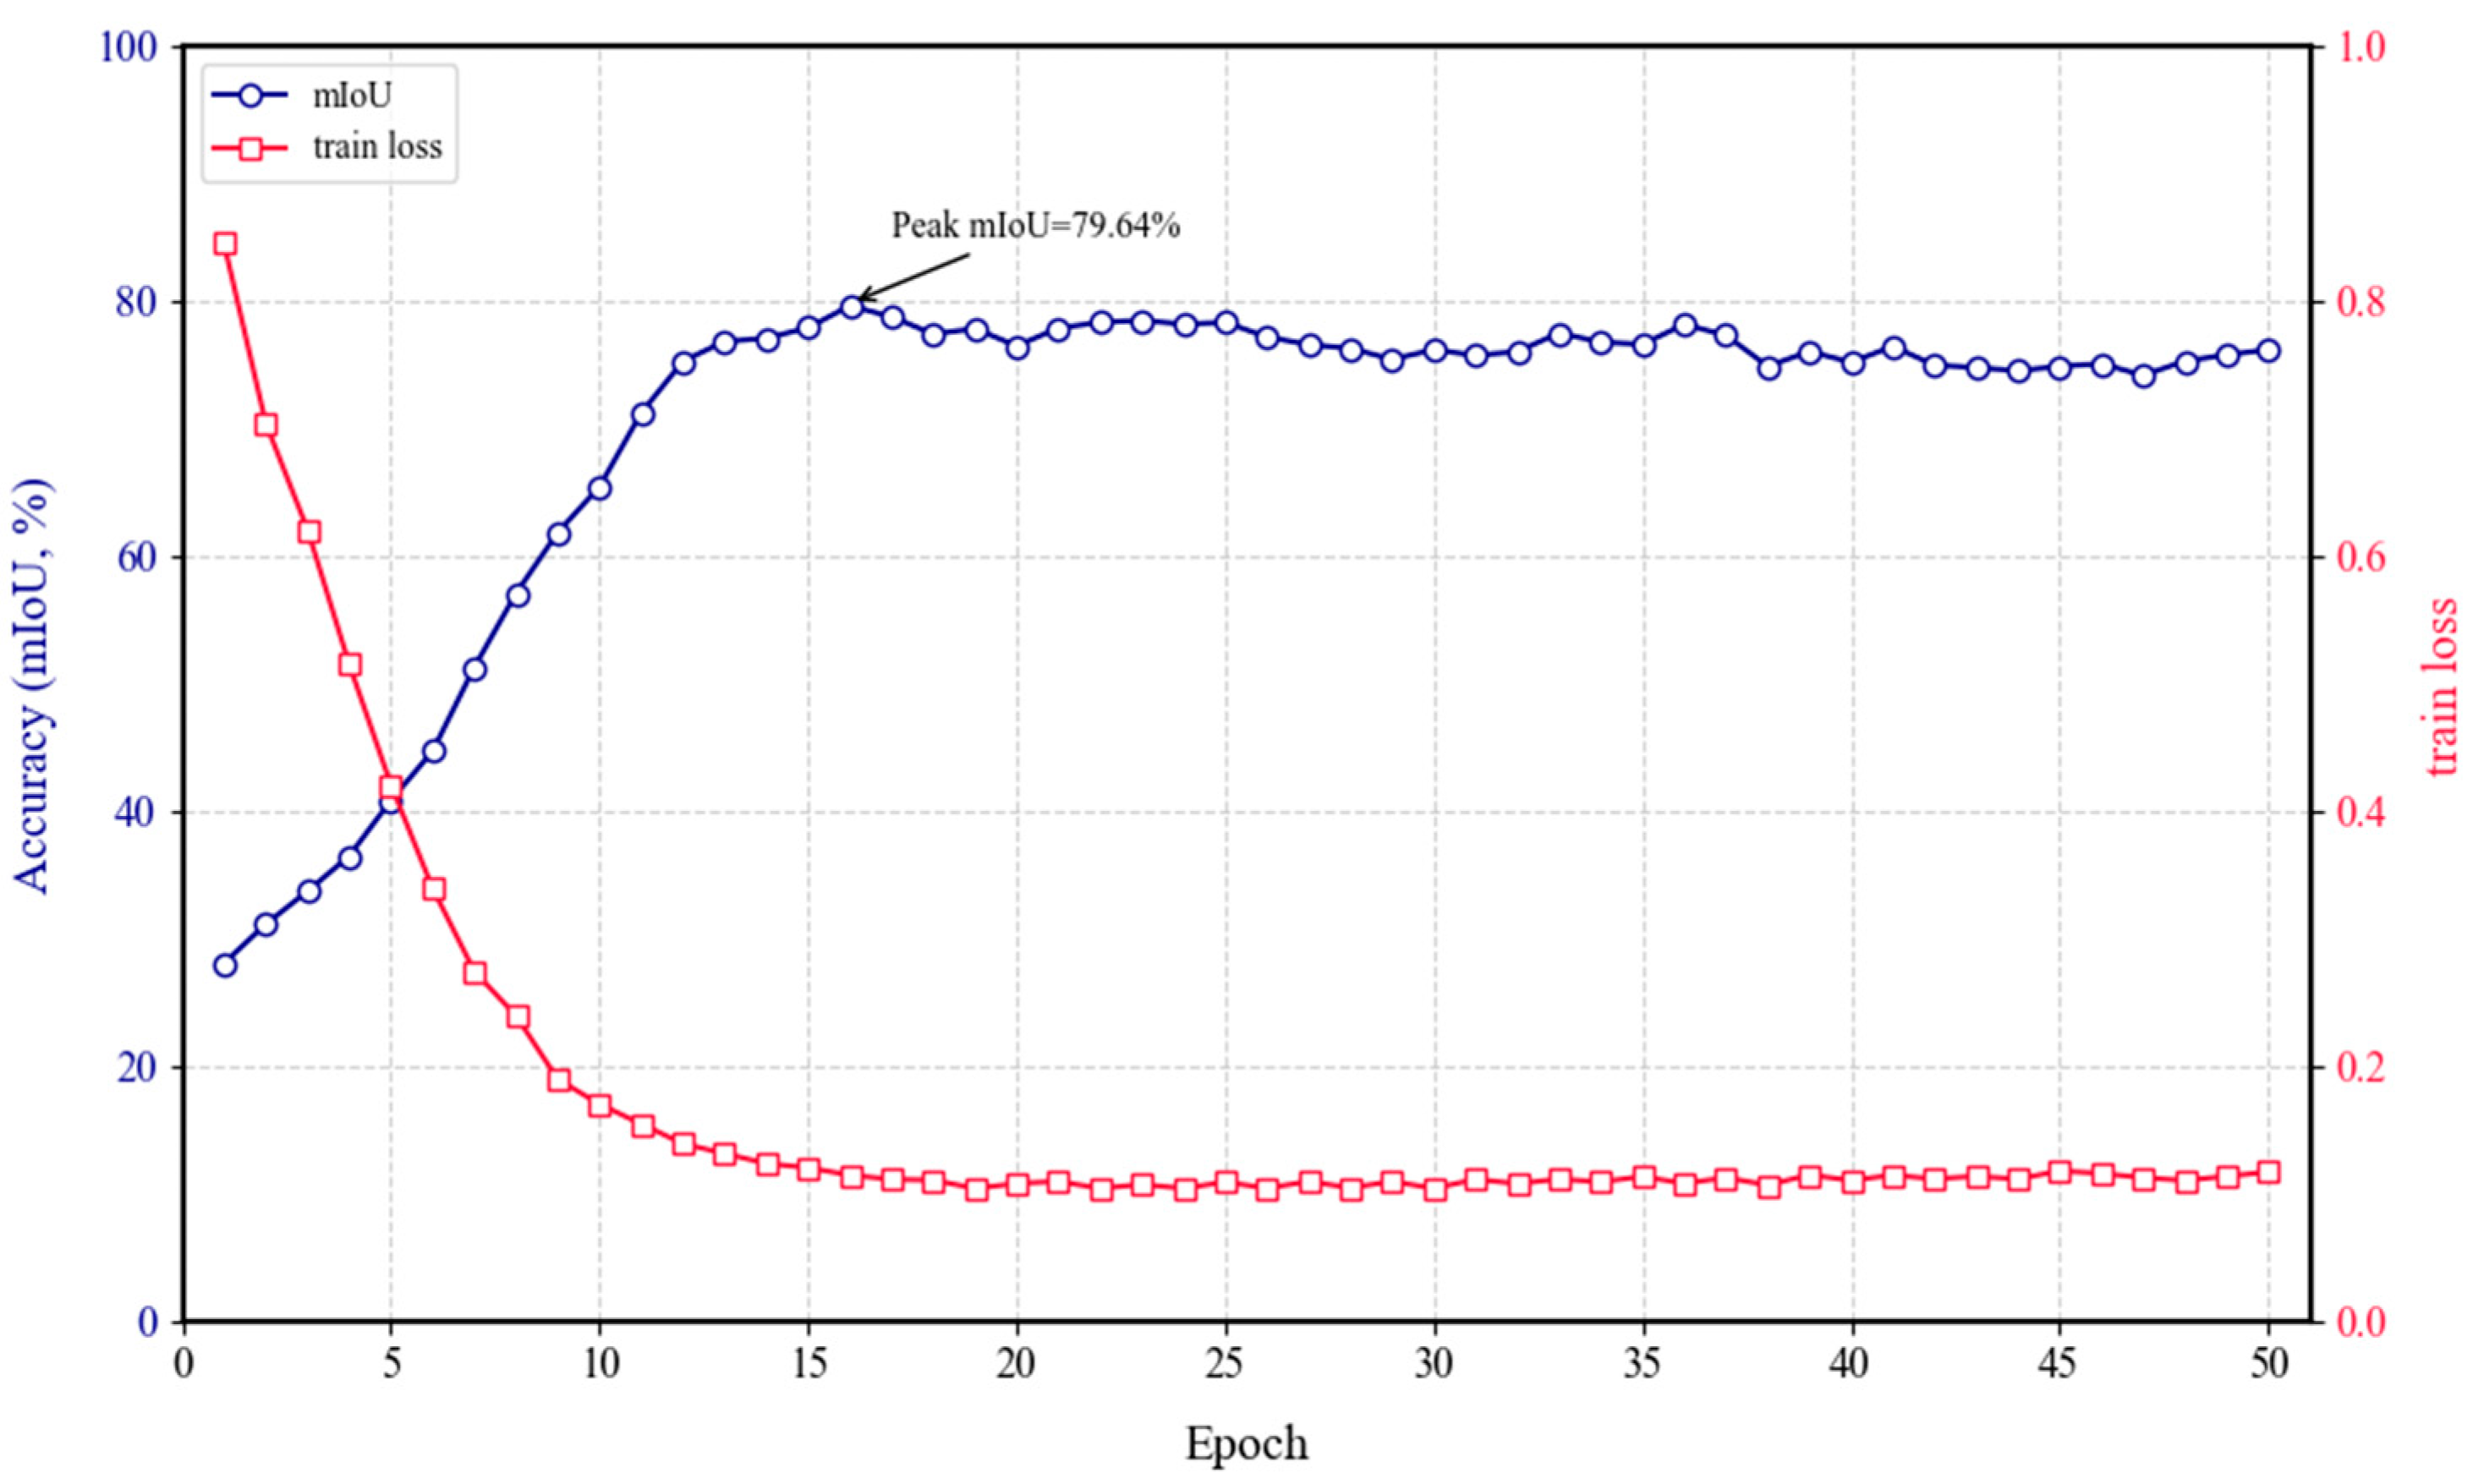
The present study employs the RS3Mamba+ network model to train the manually labeled sample set, as illustrated in Figure 2. Figure 8 presents a trend plot of the number of iterative rounds (epoch) versus the m I o U and loss function during model training. The horizontal axis indicates the number of iterative rounds, while the vertical axes represent the corresponding loss function and performance parameters, respectively. The total number of epochs in the training process is 50, with each epoch comprising 1000 training iterations. These iterations are based on the weights from the previous iteration, and they are performed through multiple rounds of iteration.
The parameter variations in the RS3Mamba+ model, as a whole, reflect the model’s progression from feature learning to overfitting risk exposure. The model commences with a substantial initial loss, rapidly descending below 0.2 within 10 epochs. This observation signifies that the model has been trained with exceptional efficiency. The efficacy of the dual-branch co-training approach is evident in the rapid escalation of the mIoU to its maximum of 79.64% by the 16th epoch, signifying an optimal alignment between the model and the dataset. The primary branch enhances local detail extraction, while the auxiliary branch models long-range dependencies through the SS2D module. This module combines with the attention mechanism to focus on key regions, thereby facilitating rapid feature learning and fusion. This combination demonstrates the robustness of RS3Mamba+.
A comprehensive investigation was conducted to ascertain the courtyard area of Mengjia Village in Weifang City, Shandong Province. This investigation was conducted using ENVI software statistics obtained through high-precision multi-source visual interpretation (see Figure 1). The investigation revealed that the total courtyard area of Mengjia Village is 345,386 m2, of which 140,469 m2 is utilized regularly. The remaining 155,381 m2 has been extracted using deep learning algorithms. Preliminary calculations indicate that the utilization rate of the courtyard in Mengjia Village is 40.67%, while the utilization rate of the courtyard as a result of deep learning extraction is 44.99%. As shown in Table 1, the normalized confusion matrix reveals that the deep learning approach achieves an accuracy of 90.40% in extracting utilised compounds, with an mF1 score of 0.8851, an average mIoU of 79.64%, and a Kappa coefficient of 0.7889.These findings indicate that the deep learning method is highly efficient and is evidently superior to the general statistical method in terms of recognition accuracy.

4. Discussion

4.1. Comparison of Base Algorithm Accuracy

In the comparative experiments, the parameter settings for each model were essentially consistent with those of the RS3Mamba model. The base learning rate was set to 1 × 10⁻², the weight decay was set to 5 × 10⁻⁴, the batch size was set to 10, and the AdamW optimizer was used for parameter updates. The training process was uniformly fixed at 50 epochs, with 1000 iterations per epoch. For the purpose of data augmentation, a variety of techniques were employed, including random cropping, flipping, Gaussian blurring, and a combination of MixUp and CutMix augmentation strategies. Furthermore, all experiments were conducted under identical hardware conditions (NVIDIA RTX 4090 GPU, Intel i7-13700KF CPU, 128 GB RAM) and software stack (Python 3.8 with PyTorch and CUDA 11.2), with the dataset splitting and preprocessing workflow exhibiting complete consistency.
The outcomes of the comparative experiments on the manually labeled dataset are presented in Table 2. The experimental results demonstrate that the RS3Mamba+ model implemented in this study exhibits a significant advantage in extraction accuracy, achieving the optimal mIoU (0.7964) and Kappa coefficient (0.7889). A comparison of the proposed model with the STRD-Net model, which shares the same dual-branch structure and achieved the highest accuracy among the comparison models, reveals that the mF1 and mIoU values were improved by at least 8.12% and 4.83%, respectively. This observation lends further credence to the model’s remarkable capacity to seamlessly integrate global and local feature information, thereby underscoring its efficacy in feature fusion.
In terms of computational cost, Swin-UNet and Transformer achieve basic performance at extremely low computational costs by introducing attention mechanisms or pure Transformer architectures, with correspondingly the shortest inference time—fully demonstrating the efficiency advantages of lightweight models. However, the accuracy data provided in the table are obtained when all comparative models are run for 50 epochs under the same conditions; at this stage, Swin-Unet and Transformer have not actually converged. To ensure a comprehensive comparison, pre-trained weights were introduced into Swin-Unet in this study, and the model was trained for 150 epochs to reach a converged state. Even so, its accuracy still did not surpass that of the proposed RS3Mamba+.
DeepLabv3 and ConvLSR-Net belong to medium-complexity models. While maintaining reasonable computational overhead, they provide more competitive performance. Although the proposed RS3Mamba+ has higher computational complexity than the aforementioned lightweight and medium-complexity models, it effectively models the long-range dependencies in remote sensing images through the state space model (SSM), thus achieving a significant improvement in performance. More importantly, compared with STRD-Net, which has extremely high computational overhead, the proposed method reduces FLOPs by approximately 68.3% while achieving comparable or even better performance. This advantage is directly reflected in inference time: RS3Mamba+ runs much faster than STRD-Net, enabling the application of high-performance remote sensing image segmentation in practical scenarios.
RS3Mamba+ achieves a better balance between model complexity and inference time. It does not excessively sacrifice performance for efficiency like lightweight models, nor does it incur extremely high computational burdens similar to STRD-Net.

4.2. Local Visualization Analysis

As demonstrated in Figure 9, the RS3Mamba+ model exhibits efficacy in the domain of house area extraction. A comparative analysis of the results obtained from the DeepLabv3+, Transformer, and several state-of-the-art (SOTA) models indicates that the RS3Mamba+ model demonstrates the optimal performance with respect to detail capture and boundary definition. The results of the extraction process, illustrated in the initial two columns marked with red boxes, demonstrate the model’s remarkable efficacy in house edge correction, the elimination of broken points, and structural reconstruction. These findings substantiate the model’s capacity to effectively extract rural vacancy rates. The final column presents the removal effect on vacant houses, with red boxes indicating its discriminatory capability, achieving a substantial reduction in misclassification.
In the remote sensing image segmentation experiment for rural vacancy rate extraction, all compared models had performance shortcomings: DeepLabv3+ and STRD-Net showed low accuracy in courtyard and house boundary reconstruction, often with blurred boundaries (e.g., confusion between wall edges and background), and were prone to missing small idle/damaged houses. In complex edge areas such as house-tree shadow overlap and courtyard wall-path junctions, they tended to misclassify house edges as background or merge edges of adjacent houses, leading to segmentation errors. This is because DeepLabv3+’s atrous convolution has a “grid effect” and its ASPP module allocates feature weights inaccurately, while STRD-Net may have shallow feature layers and insufficient low-level spatial-spectral feature fusion, making it difficult to capture deep edges or distinguish spectrally similar targets.
ResNet and Transformers could effectively identify tree structures (ResNet retains textures via residual connections, Transformers distinguish spatial distribution via self-attention) but had weak capabilities in house boundary localization and idle house differentiation, and were prone to misjudging “tree encroachment on house boundaries” in house-tree overlapping areas. This is because ResNet focuses on local features over global context, has poor anti-interference ability and weak response to small targets; Transformers’ self-attention tends to tilt toward trees, and when without boundary loss function guidance, they prioritize global over local features, with high computational demands also affecting boundary modeling accuracy. The Transformer’s visualization results (after convergence at 150 epochs) showed that although its output contained many meaningless speckles, it had higher accuracy in isolated target recognition (e.g., only it effectively recognized the independent target on the left of the third column). However, it struggled to shape targets in dense scenarios and could not fully present courtyard morphology.
ConvLSR-Net, while optimal in courtyard integrity, contour clarity, and IoU/F1 scores, still had false positives (misclassifying debris yards/simple sheds as idle houses) and false negatives (missing damaged/vegetation-covered houses), leading to low vacancy rates and boundary deviations for some houses. This is due to insufficient adaptability of boundary discrimination thresholds (too high causing false negatives, too low causing false positives), and its spatial context module failing to fully consider the structural characteristics of rural courtyards (e.g., house-courtyard layout, spacing rules), making it prone to boundary deviations caused by misjudged spatial relationships in complex scenarios.
As demonstrated by the comparison results, the accurate classification of tree-shaded houses remains a significant challenge due to background noise interference and the paucity of comprehensive modeling of house compounds.
The RS3Mamba+ demonstrates proficiency in recognizing and segmenting dispersed or small-scale buildings, and it is effective in dealing with meaningless fragmented spots, which is a difficult achievement for other models. Furthermore, the model exhibits reduced propensity for misclassifying agricultural areas as residential zones when confronted with intricate backgrounds and noise, thereby demonstrating its efficacy in handling complex data structures. Additionally, it evinces notable robustness in independent house prediction and determination, substantiating its effectiveness and superiority in the task of building refined classification.
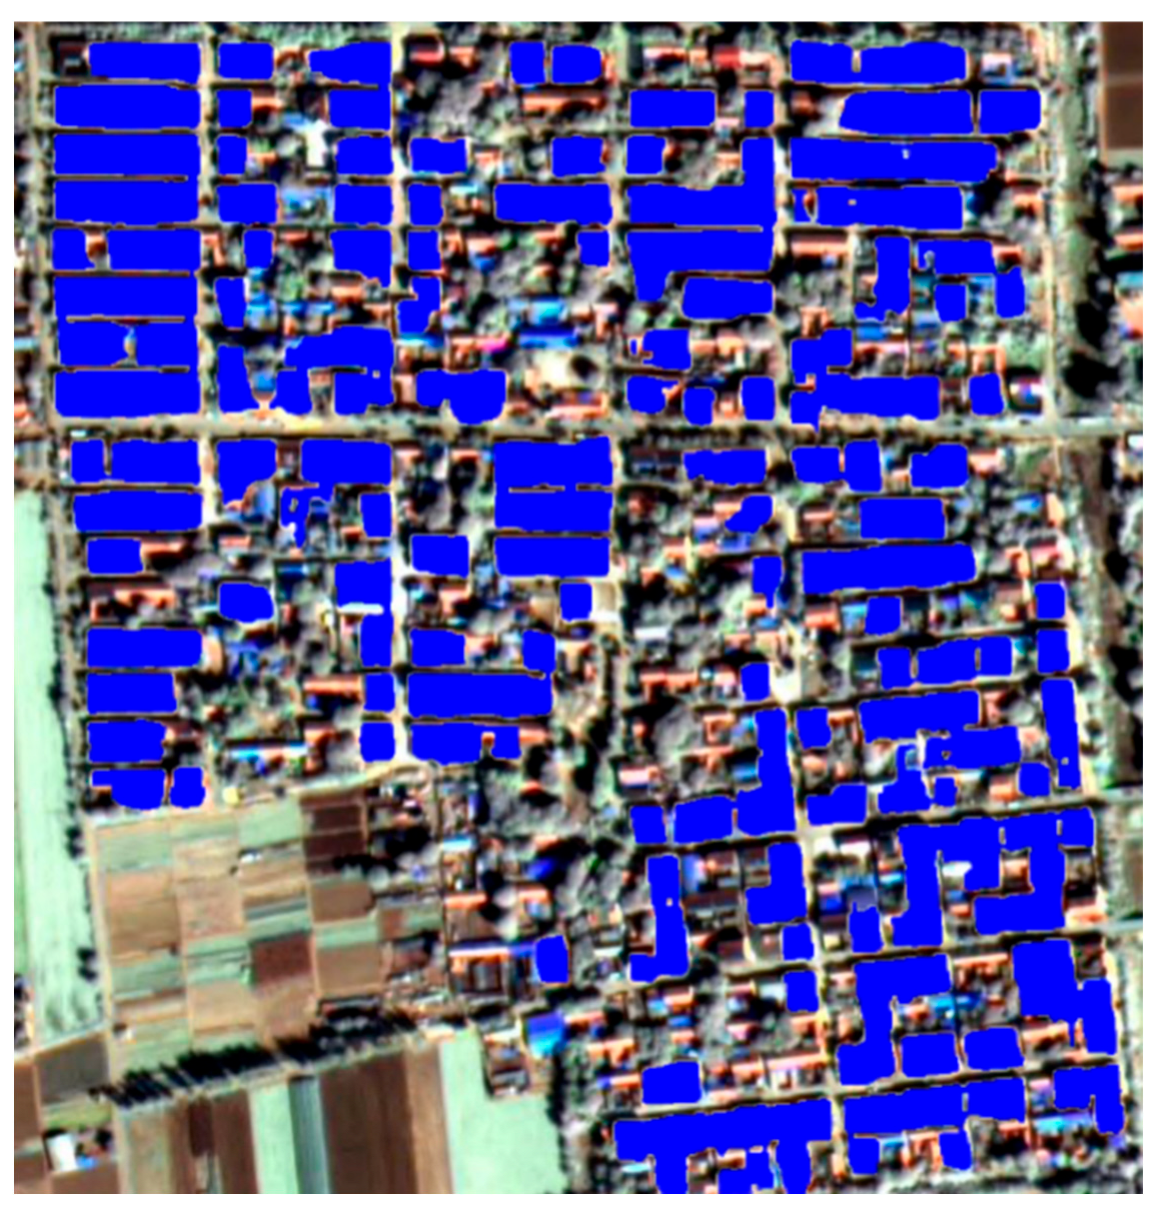
As illustrated in Figure 10, the predicted labels for the building refinement extraction task for remotely sensed imagery are presented. In this figure, the areas designated for buildings are indicated in blue, while the remaining areas encompass farmland, bare soil, and primary roadways within villages that cannot be rejected by cropping. The figure illustrates the distribution of buildings within a complex background, encompassing both dense and sparse regions. It is evident that the delineations of the structures are distinct, and there is an absence of superfluous fragmentation that would compromise the statistical precision. This observation suggests that the RS3Mamba+ prediction results possess a high degree of boundary identification precision and are capable of differentiating between structures and non-structural domains. This capacity is more conducive to subsequent statistical and analytical endeavors in comparison to the boundaries of the remaining single-model network. The RS3Mamba+ model’s efficacy in preserving the continuity and consistency of building areas is indicative of its superior identification capabilities.

4.3. Ablation Experiments

The backbone of this study is ResNet18, which quantifies the enhancement effect of different functional modules on the model, respectively, and Figure 11 shows the experimental results of the ablation experiment, as follows: (b) segmentation using only ResNet18—the segmentation results are fragmented, and there are more misclassifications and meaningless fragmented spots in the building area, which makes it difficult to accurately outline the building; thus, it has a low mIoU (0.6953) and Kappa (0.6851); (c) introducing Mamba-assisted branching on the basis of the backbone: compared with (b), the segmentation effect is improved, the integrity of the building area is enhanced, the misclassification is reduced while the meaningless fragmented spots are significantly eliminated, so the prediction target tends to be regularized, and mIoU and Kappa are enhanced by 8.09% and 8.88%, respectively; and (d) introducing gate processing on the basis of the backbone: focusing on reducing misjudgment and improving the recognition rate of small-sized buildings, we see improvements in mIoU and Kappa of 4.02% and 4%, respectively. The specific parameters of each model for the ablation experiment are shown in Table 3.

5. Conclusions

This study proposes RS3Mamba+, an enhanced semantic segmentation framework built on the State Space Model (SSM). Adopting a two-branch synergistic architecture integrated with a Multi-directional Selective Scanning (SS2D) mechanism, the framework effectively captures the inherent long-range spatial dependencies of remote sensing images while reducing computational complexity. Furthermore, it optimizes feature fusion by incorporating a Gate-Attention mechanism and enhances edge sharpness through morphological post-processing, ultimately achieving an efficient balance between global contextual modeling and local detail preservation.
Experimental results validate the effectiveness of the RS3Mamba+ deep learning extraction method: on Gaofen-2 (GF-2) satellite images, the method achieves a high extraction accuracy of 90.40%, with a mean Intersection over Union (mIoU) of 79.64% and a Kappa coefficient of 0.7889. This performance confirms its practical value in extracting information on the utilization status of rural compounds. However, the model has inherent limitations that require attention: its high recall rate for small buildings is accompanied by occasional false detections, particularly in low-contrast scenarios (e.g., areas prone to interference from vegetation shadows), where the boundary between small structures and background noise becomes ambiguous, significantly increasing the false detection probability. Additionally, constrained by limitations in data acquisition accuracy and workload, this study only used single-temporal remote sensing data to construct a preliminary training set. The core objective of the research was to verify the feasibility of the extraction method rather than pursue fully optimized performance.
Building on the preliminary findings of this study, subsequent research will focus on addressing the aforementioned limitations and expanding the research scope in the following key directions. First, to improve the model’s robustness and accuracy, the scale of the training set will be significantly expanded—not only by increasing the sample size of single-temporal GF-2 data but also by incorporating multi-source data (e.g., hyperspectral images, Synthetic Aperture Radar (SAR) data). This multi-source data fusion is expected to compensate for the shortcomings of single-modal data (e.g., the susceptibility of optical images to weather and shadow interference) and enhance the model’s generalization ability across diverse rural scenarios. Second, to address the false detection issue in low-contrast and vegetation-shadowed areas, targeted improvements will be made to the model architecture: the Gate-Attention mechanism will be optimized to assign higher weights to the edge and texture features of small buildings, and a shadow-removal preprocessing module (e.g., methods based on atmospheric correction or multi-scale illumination adjustment) will be considered for integration to reduce the interference of vegetation shadows on feature extraction.
Looking ahead, the RS3Mamba+ framework will be further explored in more advanced application scenarios and technical iterations. On one hand, it will be combined with Unmanned Aerial Vehicle (UAV) imagery and multi-temporal high-resolution satellite data—UAV imagery can provide finer-grained texture details (e.g., subtle differences in the roof materials of rural houses) to improve the recognition accuracy of small and fragmented structures, while multi-temporal data can support the analysis of dynamic changes in the utilization status of rural compounds (e.g., the conversion process of idle courtyards into functional areas over time). On the other hand, with the development of algorithm lightweighting technologies (e.g., model pruning, knowledge distillation), efforts will be made to compress the RS3Mamba+ framework while ensuring accuracy. The lightweight version will be more suitable for deployment on edge devices (e.g., on-site UAV processing systems), enabling real-time extraction of rural compound information and enhancing the practicality of the method in fieldwork.
In conclusion, RS3Mamba+ provides a highly promising technical approach for extracting information on the utilization status of rural compounds, and future method improvements and research expansions will further enhance its applicability. Ultimately, this research aims to provide evidence-based technical support for rural revitalization-related decisions (e.g., the renovation of idle courtyards, the planning of rural functional zones) and contribute to the sustainable development of regional rural economies and societies.

Author Contributions

Validation, X.F. and S.X.; Formal analysis, X.F. and S.X.; Investigation, S.X.; Resources, X.F., Z.L. and Y.G.; Data curation, Z.L.; Writing—original draft, X.F.; Writing—review & editing, Z.L. and Y.G.; Visualization, X.F.; Supervision, Z.L. and Y.G.; Funding acquisition, Z.L. All authors have read and agreed to the published version of the manuscript.

Funding

This research was funded by The Major Project of High-Resolution Earth Observation System, Grant No. 30-Y60B01-9003-22/23.

Data Availability Statement

The original contributions presented in this study are included in the article. Further inquiries can be directed to the corresponding author.

Conflicts of Interest

The authors declare no conflict of interest.

References

  1. Liu, C.; Xu, M. Characteristics and Influencing Factors on the Hollowing of Traditional Villages—Taking 2645 Villages from the Chinese Traditional Village Catalogue (Batch 5) as an Example. Int. J. Environ. Res. Public Health 2021, 18, 12759. [Google Scholar] [CrossRef]
  2. Smith, G. The Hollow State: Rural Governance in China. China Q. 2010, 203, 601–618. [Google Scholar] [CrossRef]
  3. Liu, Y.; Wang, A.; Hou, J.; Chen, X.; Xia, J. Comprehensive Evaluation of Rural Courtyard Utilization Efficiency: A Case Study in Shandong Province, Eastern China. J. Mt. Sci. 2020, 17, 2280–2295. [Google Scholar] [CrossRef]
  4. Wen, Q.; Li, J.; Ding, J.; Wang, J. Evolutionary Process and Mechanism of Population Hollowing out in Rural Villages in the Farming-Pastoral Ecotone of Northern China: A Case Study of Yanchi County, Ningxia. Land Use Policy 2023, 125, 106506. [Google Scholar] [CrossRef]
  5. Liu, Y.-S.; Liu, Y. Progress and Prospect on the Study of Rural Hollowing in China. Geogr. Res. 2010, 29, 35–42. [Google Scholar]
  6. Carr, P.J.; Kefalas, M.J. Hollowing Out the Middle: The Rural Brain Drain and What It Means for America; Beacon Press: Boston, MA, USA, 2009; ISBN 978-0-8070-4239-7. [Google Scholar]
  7. Guo, B.; Bian, Y.; Pei, L.; Zhu, X.; Zhang, D.; Zhang, W.; Guo, X.; Chen, Q. Identifying Population Hollowing Out Regions and Their Dynamic Characteristics across Central China. Sustainability 2022, 14, 9815. [Google Scholar] [CrossRef]
  8. Liu, Y.; Liu, Y.; Chen, Y.; Long, H. The Process and Driving Forces of Rural Hollowing in China under Rapid Urbanization. J. Geogr. Sci. 2010, 20, 876–888. [Google Scholar] [CrossRef]
  9. Sun, H.; Liu, Y.; Xu, K. Hollow Villages and Rural Restructuring in Major Rural Regions of China: A Case Study of Yucheng City, Shandong Province. Chin. Geogr. Sci. 2011, 21, 354–363. [Google Scholar] [CrossRef]
  10. Chen, Y.; Wang, Y.; Xiong, S.; Lu, X.; Zhu, X.X.; Mou, L. Integrating Detailed Features and Global Contexts for Semantic Segmentation in Ultra-High-Resolution Remote Sensing Images. IEEE Trans. Geosci. Remote Sens. 2024, 62, 1–14. [Google Scholar]
  11. Zeng, Q.; Zhou, J.; Tao, J.; Chen, L.; Niu, X.; Zhang, Y. Multiscale Global Context Network for Semantic Segmentation of High-Resolution Remote Sensing Images. IEEE Trans. Geosci. Remote Sens. 2024, 62, 1–13. [Google Scholar] [CrossRef]
  12. Wu, Z.; Li, J.; Wang, Y.; Hu, Z.; Molinier, M. Self-Attentive Generative Adversarial Network for Cloud Detection in High Resolution Remote Sensing Images. IEEE Geosci. Remote Sens. Lett. 2020, 17, 1792–1796. [Google Scholar] [CrossRef]
  13. Zang, N.; Cao, Y.; Wang, Y.; Huang, B.; Zhang, L.; Mathiopoulos, P.T. Land-Use Mapping for High-Spatial Resolution Remote Sensing Image Via Deep Learning: A Review. IEEE J. Sel. Top. Appl. Earth Obs. Remote Sens. 2021, 14, 5372–5391. [Google Scholar] [CrossRef]
  14. Li, Z. Research on Key Technology for Acquiring Building Information of Hollow Village Based on UAV High Resolution Imagery. Ph.D. Thesis, Southwest Jiaotong University, Chengdu, China, 2018. (In Chinese). [Google Scholar]
  15. Fan, R.; Wang, L.; Feng, R.; Zhu, Y. Attention Based Residual Network for High-Resolution Remote Sensing Imagery Scene Classification. In Proceedings of the IGARSS 2019—2019 IEEE International Geoscience and Remote Sensing Symposium, Yokohama, Japan, 28 July–2 August 2019; IEEE: New York, NY, USA, 2019; pp. 1346–1349. [Google Scholar]
  16. Chiu, W.-T.; Lin, C.-H.; Jhu, C.-L.; Lin, C.; Chen, Y.-C.; Huang, M.-J.; Liu, W.-M. Semantic Segmentation of Lotus Leaves in UAV Aerial Images via U-Net and DeepLab-Based Networks. In Proceedings of the 2020 International Computer Symposium (ICS), Tainan, Taiwan, 17–19 December 2020; IEEE: New York, NY, USA, 2020; pp. 535–540. [Google Scholar]
  17. Qian, Z.; Cao, Y.; Shi, Z.; Qiu, L.; Shi, C. A Semantic Segmentation Method for Remote Sensing Images Based on Deeplab V3. In Proceedings of the 2021 2nd International Conference on Big Data & Artificial Intelligence & Software Engineering (ICBASE), Zhuhai, China, 24–26 September 2021; IEEE: New York, NY, USA, 2021; pp. 396–400. [Google Scholar]
  18. Zhang, R.; Zhang, Q.; Zhang, G. LSRFormer: Efficient Transformer Supply Convolutional Neural Networks with Global Information for Aerial Image Segmentation. IEEE Trans. Geosci. Remote Sens. 2024, 62, 1–13. [Google Scholar] [CrossRef]
  19. Wu, H.; Huang, P.; Zhang, M.; Tang, W.; Yu, X. CMTFNet: CNN and Multiscale Transformer Fusion Network for Remote-Sensing Image Semantic Segmentation. IEEE Trans. Geosci. Remote Sens. 2023, 61, 1–12. [Google Scholar] [CrossRef]
  20. He, X.; Zhou, Y.; Zhao, J.; Zhang, D.; Yao, R.; Xue, Y. Swin Transformer Embedding UNet for Remote Sensing Image Semantic Segmentation. IEEE Trans. Geosci. Remote Sens. 2022, 60, 1–15. [Google Scholar] [CrossRef]
  21. Wang, T.; Chen, J.; Liu, L.; Guo, L. A Review: How Deep Learning Technology Impacts the Evaluation of Traditional Village Landscapes. Buildings 2023, 13, 525. [Google Scholar] [CrossRef]
  22. Zhao, H.; Li, X.; Gu, Y.; Deng, W.; Huang, Y.; Zhou, S. Integrating Time-Series Nighttime Light Data With Static Remote Sensing and Village View Images for Hollow Villages Identification. IEEE J. Sel. Top. Appl. Earth Obs. Remote Sens. 2025, 18, 9151–9165. [Google Scholar] [CrossRef]
  23. Meng, C.; Song, Y.; Ji, J.; Jia, Z.; Zhou, Z.; Gao, P.; Liu, S. Automatic classification of rural building characteristics using deep learning methods on oblique photography. Build. Simul. 2022, 15, 1161–1174. [Google Scholar] [CrossRef]
  24. Wang, M.; Xu, W.; Cao, G.; Liu, T. Identification of Rural Courtyards’ Utilization Status Using Deep Learning and Machine Learning Methods on Unmanned Aerial Vehicle Images in North China. Build. Simul. 2024, 17, 799–818. [Google Scholar] [CrossRef]
  25. Wang, Y.; Cao, L.; Deng, H. MFMamba: A Mamba-Based Multi-Modal Fusion Network for Semantic Segmentation of Remote Sensing Images. Sensors 2024, 24, 7266. [Google Scholar] [CrossRef] [PubMed]
  26. Gao, F.; Jin, X.; Zhou, X.; Dong, J.; Du, Q. MSFMamba: Multiscale Feature Fusion State Space Model for Multisource Remote Sensing Image Classification. IEEE Trans. Geosci. Remote Sens. 2025, 63, 1–16. [Google Scholar] [CrossRef]
  27. Li, Y.; Li, D.; Xie, W.; Ma, J.; He, S.; Fang, L. Semi-Mamba: Mamba-Driven Semi-Supervised Multimodal Remote Sensing Feature Classification. IEEE Trans. Circuits Syst. Video Technol. 2025, 35, 9837–9849. [Google Scholar] [CrossRef]
  28. Zhan, Z.; Zhang, X.; Liu, Y.; Sun, X.; Pang, C.; Zhao, C. Vegetation Land Use/Land Cover Extraction From High-Resolution Satellite Images Based on Adaptive Context Inference. IEEE Access 2020, 8, 21036–21051. [Google Scholar] [CrossRef]
  29. Huang, X.; Liu, H.; Zhang, L. Spatiotemporal Detection and Analysis of Urban Villages in Mega City Regions of China Using High-Resolution Remotely Sensed Imagery. IEEE Trans. Geosci. Remote Sens. 2015, 53, 3639–3657. [Google Scholar] [CrossRef]
  30. Li, Y.; Xu, W.; Chen, H.; Jiang, J.; Li, X. A Novel Framework Based on Mask R-CNN and Histogram Thresholding for Scalable Segmentation of New and Old Rural Buildings. Remote Sens. 2021, 13, 1070. [Google Scholar] [CrossRef]
  31. Liu, Y.; Long, H. Land use transitions and their dynamic mechanism: The case of the Huang-Huai-Hai Plain. J. Geogr. Sci. 2016, 26, 515–530. [Google Scholar] [CrossRef]
  32. Fu, Z.; Yang, Y.; Wang, L.; Zhu, X.; Lv, H.; Qiao, J. Geographical Types and Driving Mechanisms of Rural Hollowing-Out in the Yellow River Basin. Agriculture 2024, 14, 365. [Google Scholar] [CrossRef]
  33. Ma, X.; Zhang, X.; Pun, M.-O. RS3 Mamba: Visual State Space Model for Remote Sensing Image Semantic Segmentation. IEEE Geosci. Remote Sens. Lett. 2024, 21, 1–5. [Google Scholar] [CrossRef]
  34. Chen, K.; Chen, B.; Liu, C.; Li, W.; Zou, Z.; Shi, Z. RSMamba: Remote Sensing Image Classification with State Space Model 2024. IEEE Geosci. Remote Sens. Lett. 2024, 21, 1–5. [Google Scholar]
  35. Shawky, O.A.; Hagag, A.; El-Dahshan, E.-S.A.; Ismail, M.A. Remote Sensing Image Scene Classification Using CNN-MLP with Data Augmentation. Optik 2020, 221, 165356. [Google Scholar] [CrossRef]
  36. Li, B.; Guo, Y.; Yang, J.; Wang, L.; Wang, Y.; An, W. Gated Recurrent Multiattention Network for VHR Remote Sensing Image Classification. IEEE Trans. Geosci. Remote Sens. 2022, 60, 5606113. [Google Scholar] [CrossRef]
  37. Llugsi, R.; El Yacoubi, S.; Fontaine, A.; Lupera, P. Comparison between Adam, AdaMax and Adam W Optimizers to Implement a Weather Forecast Based on Neural Networks for the Andean City of Quito. In Proceedings of the 2021 IEEE Fifth Ecuador Technical Chapters Meeting (ETCM), Cuenca, Ecuador, 12–15 October 2021. [Google Scholar]
  38. Su, H.; Wang, Y.; Zhang, Z.; Dong, W. Characteristics and Influencing Factors of Traditional Village Distribution in China. Land 2022, 11, 1631. [Google Scholar] [CrossRef]
  39. Wang, D.; Zhu, Y.; Zhao, M.; Lv, Q. Multi-Dimensional Hollowing Characteristics of Traditional Villages and Its Influence Mechanism Based on the Micro-Scale: A Case Study of Dongcun Village in Suzhou, China. Land Use Policy 2021, 101, 105146. [Google Scholar] [CrossRef]
  40. Chen, L.-C.; Zhu, Y.; Papandreou, G.; Schroff, F.; Adam, H. Encoder-Decoder with Atrous Separable Convolution for Semantic Image Segmentation; Springer: Berlin/Heidelberg, Germany, 2018; pp. 801–818. [Google Scholar]
  41. Vaswani, A.; Shazeer, N.; Parmar, N.; Uszkoreit, J.; Jones, L.; Gomez, A.N.; Kaiser, Ł.; Polosukhin, I. Attention Is All You Need. In Proceedings of the Advances in Neural Information Processing Systems, Long Beach, CA, USA, 4–9 December 2017; Curran Associates, Inc.: Red Hook, NY, USA, 2017; Volume 30. [Google Scholar]
  42. Yu, M.; He, L.; Shen, Z.; Lv, M. STRD-Net: A Dual-Encoder Semantic Segmentation Network for Urban Green Space Extraction. IEEE Trans. Geosci. Remote Sens. 2024, 62, 1–13. [Google Scholar] [CrossRef]
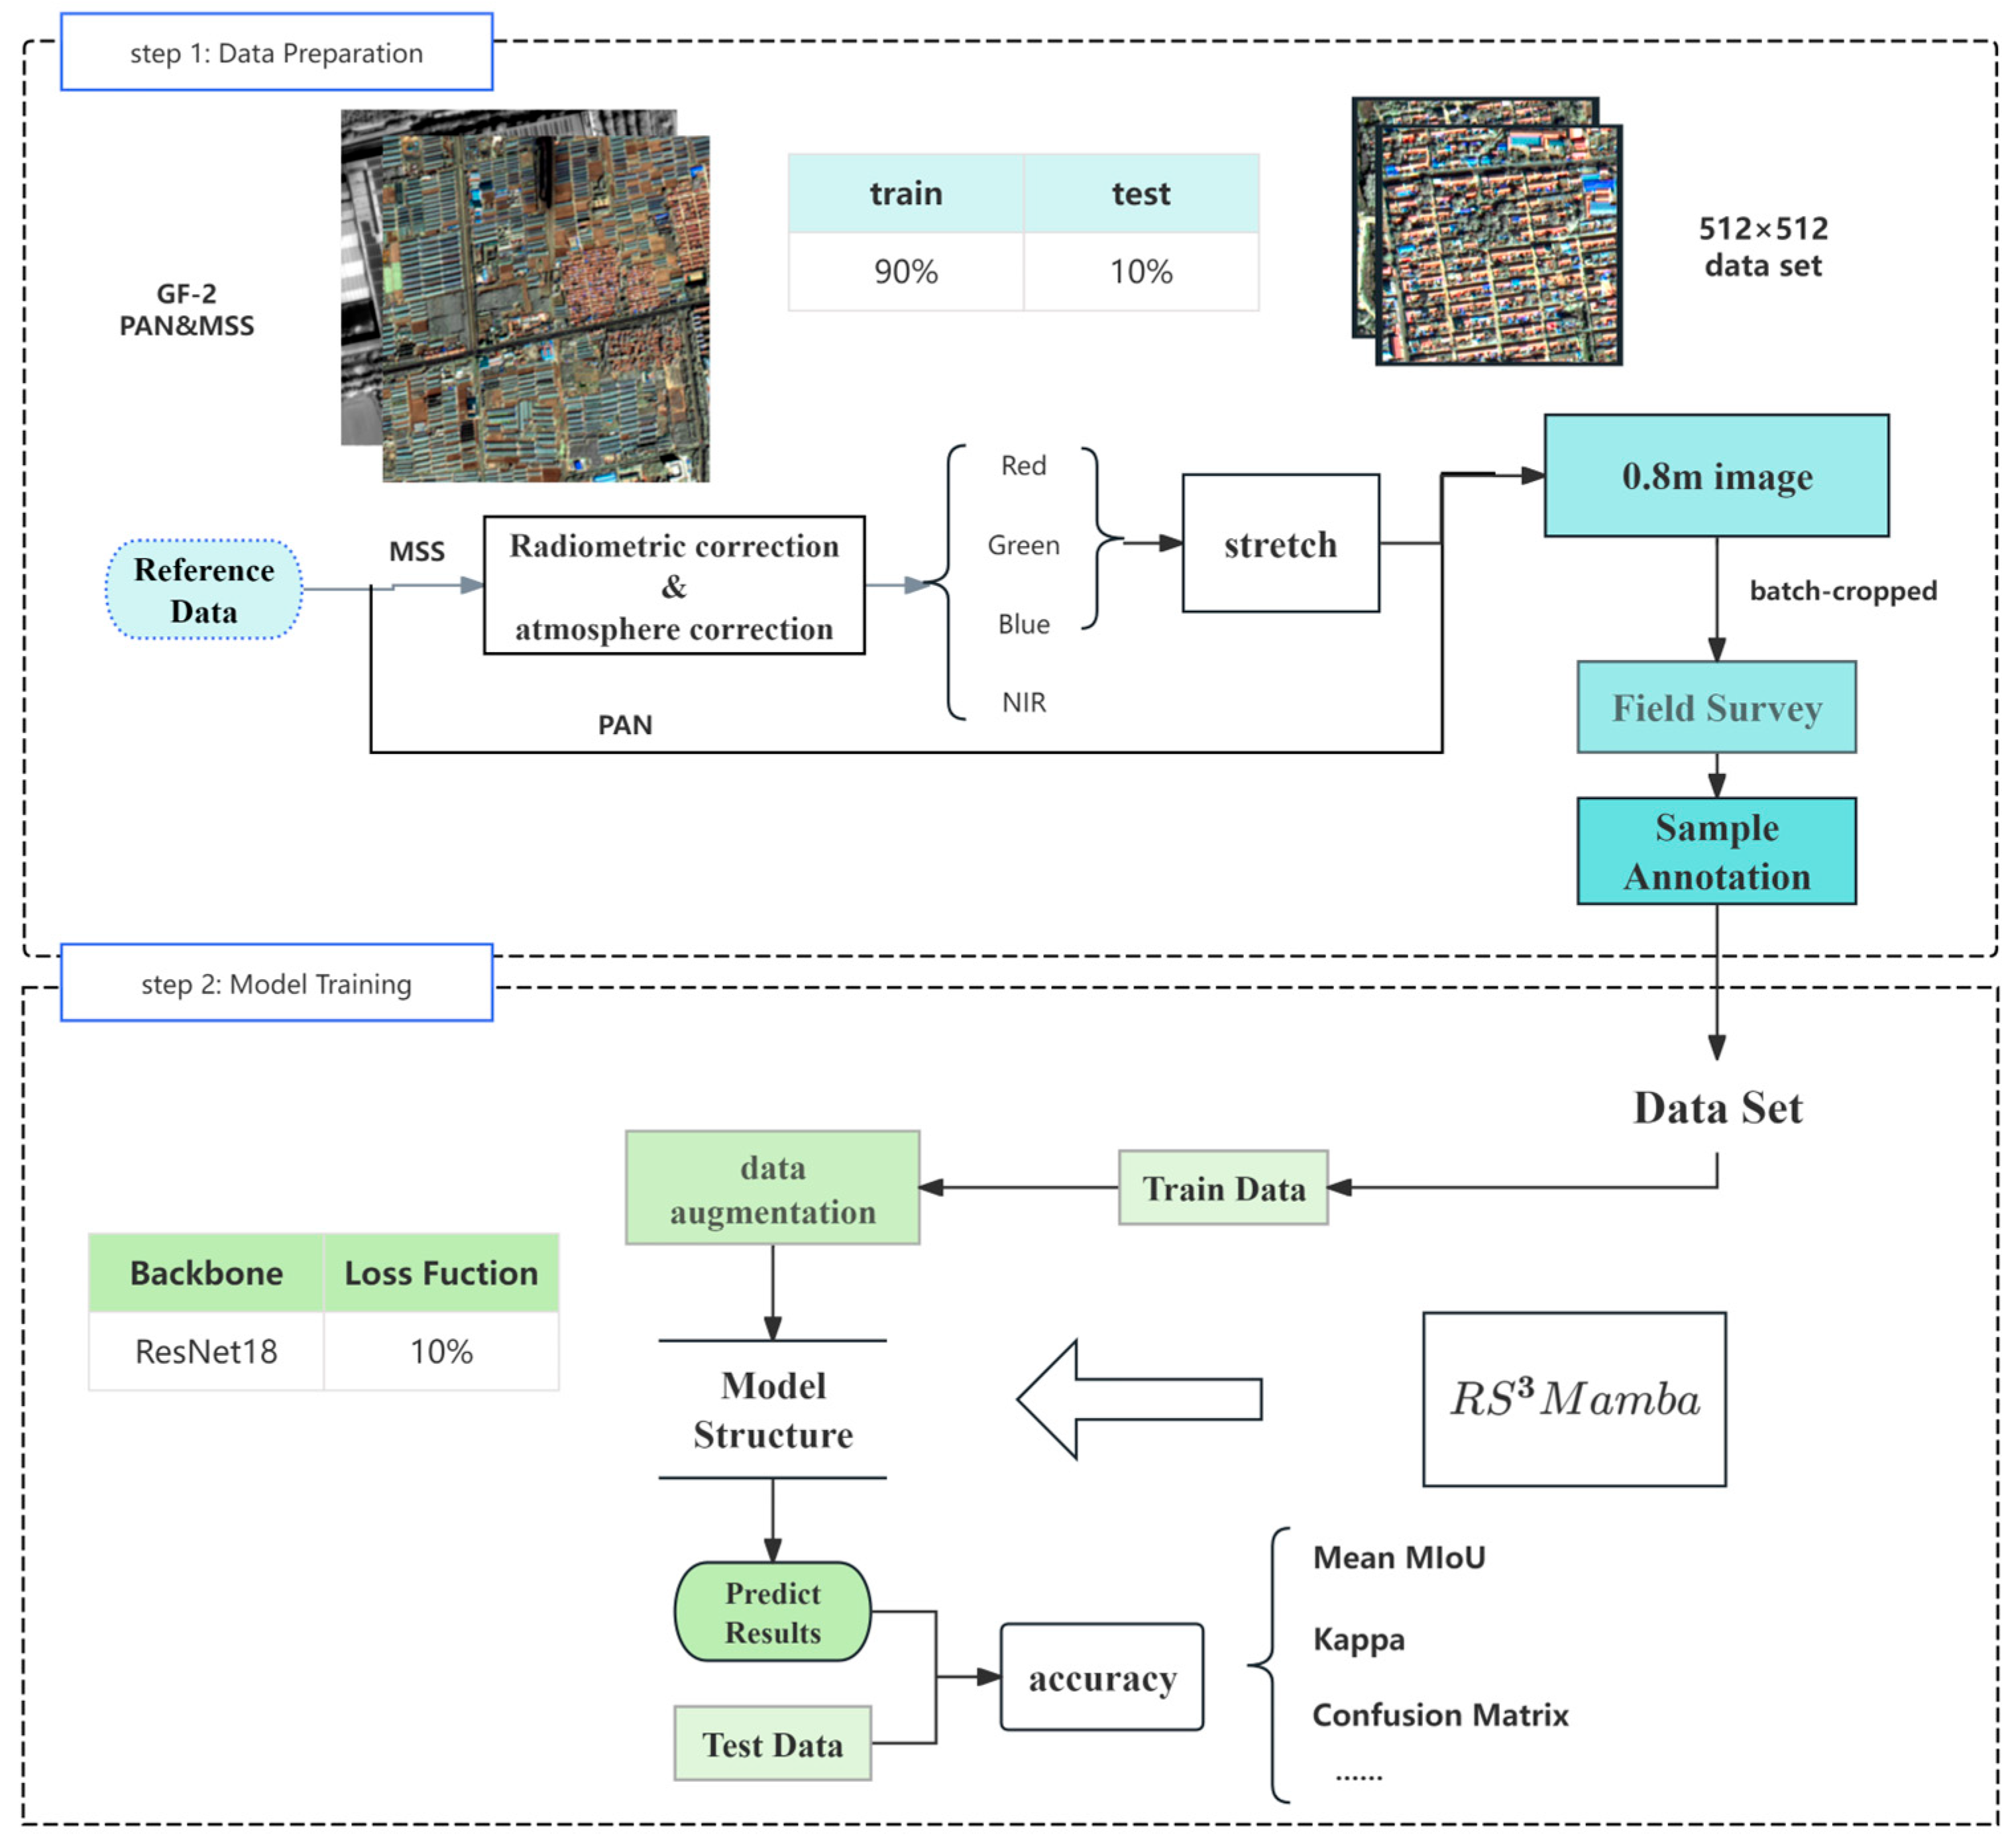
Figure 1. Workflow.
Figure 1. Workflow.
Remotesensing 17 03443 g001
Figure 2. Example of the test sat taken by the GF-2 satellite.
Remotesensing 17 03443 g002
Figure 3. The overall architecture of RS3Mamba [30].
Remotesensing 17 03443 g003
Figure 4. SS2D dependency analysis schematic diagram.
Remotesensing 17 03443 g004
Figure 5. A comparison of the stem network innovation: (a) the original model’s stem network framework; (b) the RS3Mamba+ model’s network framework.
Remotesensing 17 03443 g005
Figure 6. Schematic Diagram of Dual-Branch Fusion and Feature Enhancement Structure.
Remotesensing 17 03443 g006
Figure 7. Example of a cut image and manual labeling.
Remotesensing 17 03443 g007
Figure 8. Trends of loss and accuracy in RS3Mamba+.
Remotesensing 17 03443 g008
Figure 9. Visualization results of different models on the dataset.
Remotesensing 17 03443 g009
Figure 10. Visualization results of RS3Mamba+ on the dataset.
Remotesensing 17 03443 g010
Figure 11. Results of ablation experiments.
Remotesensing 17 03443 g011
Table 1. Normalized confusion matrix (by row) based on RS3Mamba+ in the test set (%).
Predicted Class\True ClassTrue BackgroundTrue BuildingRow Sum
Predicted Background97.1023.43100.00
Predicted Building2.9076.57100.00
Column Sum100.00100.00
Table 2. Segmentation results of different models on the dataset. The accuracy of each category is presented in the format of mF1/IoU (%). The bolded sections represent the results of the model constructed in this paper.
MethodBuildingBackgroundmF1mIoUFLOPs (G)
DeepLabv3 [40]0.6025/0.55510.9083/0.79910.74540.677170.5
SwinT-UNet [20]0.6449/0.54210.9023/0.82430.77360.68325.8
SwinT-Unet (150 epoch)0.7210/0.56360.9655/0.93320.84320.7484-
ConvLSR-Net [18]0.6653/0.56840.9164/0.88240.79090.725435.7047
Transformer [41]0.6605/0.51020.8869/0.84780.77370.67846.21
STRD-Net [42]0.6871/0.60480.9134/0.89140.80030.74811033.85
RS3Mamba+0.8131/0.76260.9772/0.90550.88150.7964327.31
Table 3. Segmentation results of the ablation study of the dataset. The accuracy of each category is presented in the format of mF1/IoU (%). The bolded sections represent the results of the model constructed in this paper.
Model NameBuildingIoUBackgroundIoUmF1mIoUKappa
Backbone0.6260.76460.71240.69530.6851
Backbone + Mamba0.72510.82720.86920.77620.7739
Backbone + Gated-Attention0.67970.79120.81250.73550.7251
RS3Mamba+(Ours)0.76260.90550.88150.79640.7889
Disclaimer/Publisher’s Note: The statements, opinions and data contained in all publications are solely those of the individual author(s) and contributor(s) and not of MDPI and/or the editor(s). MDPI and/or the editor(s) disclaim responsibility for any injury to people or property resulting from any ideas, methods, instructions or products referred to in the content.