Article

Performance of Multi-Antenna GNSS Buoy and Co-Located Mooring Array Deployed Around Qianliyan Islet for Altimetry Satellite Calibration

1
State Key Laboratory of Spatial Datum, Xi’an 710054, China
2
Xi’an Research Institute of Surveying and Mapping, Xi’an 710054, China
3
National Key Laboratory of Intelligent Geospatial Information, Beijing 100029, China
4
National Space Science Center, Chinese Academy of Sciences, Beijing 100190, China
5
First Institute of Oceanography, Ministry of Natural Resources, Qingdao 266061, China
*
Author to whom correspondence should be addressed.
Remote Sens. 2025, 17(20), 3436; https://doi.org/10.3390/rs17203436
Submission received: 18 August 2025 / Revised: 8 October 2025 / Accepted: 13 October 2025 / Published: 15 October 2025

Abstract

Highlights

  • What are the main findings?
  • Validating dual-platform (GNSS buoy + mooring array) calibration for altimetry satellites in the Yellow Sea, achieving 2.76 cm averaged SSH standard deviation during 20-day synchronized observations.
  • Demonstrating adaptive low-pass filtering (0.01 Hz cutoff) effectively suppresses high-frequency SSH noise (≤10 s period) while retaining spectral characteristics critical for calibration accuracy.
  • What is the implication of the main finding?
  • GNSS buoys require correction for attitude variations (±3° under complex seas), necessitating adaptive weighting protocols, whereas mooring arrays better resolve mean SSH trends.
  • Establishing a ground-based calibration protocol that integrates multi-platform observations, advancing coastal altimeter methodologies for operational marine monitoring.

Abstract

To evaluate the prospects of multi-antenna GNSS buoy and mooring array in ocean altimetry satellite calibration, experiments are conducted in the ocean around Qianliyan islet in China’s Yellow Sea. The trials aim to validate the feasibility of establishing an ocean altimetry satellite calibration site while assessing the performance of relevant calibration equipment. Utilizing one multi-antenna GNSS buoy system and one mooring array operating for over 20 days, the experiment incorporates continuous GNSS observation data from Qianliyan islet’s permanent station. Results reveal that high-frequency sea surface height (SSH) signals exhibit periods approaching or below 10 s, with the designed low-pass filter effectively attenuating these high-frequency components. Significant differences emerge in the power spectra of filtered SSH measurements between instruments: high-frequency signals detected by the mooring array demonstrate greater spectral concentration and lower signal intensity than those recorded by the GNSS buoy. Through multi-day synchronized observations, the height datum for mooring array SSH measurements is obtained, revealing average standard deviation of 2.76 cm in filtered SSH differences between platforms—validating both the system design and data processing methodology. This experiment successfully demonstrates the performance of calibration equipment, preliminarily verifies the effectiveness of ground-based calibration data processing techniques, and further confirms the technical viability of establishing an ocean altimetry satellite calibration site around Qianliyan islet.

1. Introduction

Since the 1990s, the accuracy of ocean altimetry satellites has continuously been enhanced, driven by advancements in technologies such as the Global Positioning System, altimeters, and microwave radiometers. Progress in Global Navigation Satellite System (GNSS) measurement technology has improved the precision of satellite precise orbit determination from meter-level to centimeter-level. Altimeter design has also undergone evolution, transitioning from single-frequency to dual-frequency systems, from conventional pulse-limited radar altimeters to Synthetic Aperture Radar (SAR) altimeters [1], and from vertical-looking altimeters to wide-swath altimeters. Similarly, developments in microwave radiometers have enabled tropospheric delay correction accuracy at the centimeter level. Benefiting from this continually improving precision, satellite altimetry has found extensive applications across diverse fields including geodesy, oceanography, glaciology, climate science, atmospheric science, wind and wave studies, biology, and navigation [2,3,4,5,6,7,8]. The Surface Water and Ocean Topography (SWOT) satellite, launched at the end of 2022 and employing a novel interferometric altimetry technique, has demonstrated successful applications of its two-dimensional sea surface height (SSH) measurements globally, particularly in monitoring dynamic surface water resources [9,10,11,12]. Currently, the accuracy of SSH measurements from ocean altimetry satellites has reached or surpassed the 3 cm level [1]. As shown by this progress, the radial orbit determination accuracy for current ocean altimetry satellites has now reached 1 cm (RMS) [13]. Concurrently, the demand for high-precision satellite-derived SSH measurements from application fields such as global sea surface change monitoring and geodesy continuously drives advancements in satellite altimetry technology.
Altimetry satellite calibration is a fundamental prerequisite for the application of satellite altimetry. Throughout the development of satellite altimetry, calibration activities have always been essential. Since the 1990s, a global ground calibration system for altimetry satellites has gradually emerged. This system is primarily represented by calibration sites such as the Harvest Calibration/Validation Facility [14], the Corsica (Sénétosa/Ajaccio) Calibration Site [15,16], the Bass Strait Calibration Site [17,18,19,20], the Crete/Gavdos Calibration Facility [21,22,23,24,25,26], and the Wanshan Calibration Site [27]. Corresponding major equipment deployed at these ground calibration sites includes tide gauge stations (often equipped with GNSS receivers), GNSS buoy/zodiac, and mooring array of sea surface height-measuring instruments.
Different calibration sites employ distinct calibration methodologies. Taking the Harvest facility as an example, its primary infrastructure is the Harvest oil platform. This platform is strategically situated near the ground tracks of altimetry satellites such as the Jason missions [28]. The permanent GNSS station on this platform establishes geodetic height control for collocated tide gauge measurements, enabling direct determination of SSH that serves as reference standard for satellite altimetry. Conversely, the Bass Strait calibration site deploys an offshore mooring array aligned with satellite nadir tracks. This station derives its height datum through time-synchronized observations between GNSS buoy and the mooring infrastructure during dedicated campaigns. The Wanshan Calibration Station in China determines sea surface height primarily through tide gauge measurements, subsequently reducing these values to offshore subsatellite validation points for calibration calculations. The Qianliyan islet of China’s Yellow Sea have also been increasingly utilized in recent years to conduct calibration experiments for ocean altimetry satellites including Jason-2, SARAL/AltiKa, HY-2B, and Jason-3 [23,29,30,31].
While these calibration sites have made significant contributions to altimetry satellite calibration tasks in recent years, establishing new sites requires careful consideration. The Harvest platform is ideally located near the satellite nadir track, but similar fixed platforms are difficult to replicate. The indirect calibration approach using tide gauges as adopted by the Corsica, Crete/Gavdos, and Wanshan sites demands precise regional geoid models and tidal models to unify SSH between nadir points and measurement locations under a common datum. The direct calibration method employing GNSS buoys combined with mooring arrays, used at Bass Strait and Corsica, still presents room for improvement. The Corsica site utilized GNSS buoys as a backup solution, requiring daily repositioning [32]—a labor-intensive and costly procedure. The Bass Strait site employs GNSS buoys to establish height datum for its mooring array. Although buoy models have evolved from MK-III to MK-IV with progressive performance enhancements, issues persist regarding limited deployment durations (e.g., MK-IV deployments of 3–7 days [17]). To obtain high-accuracy height datum for mooring array measurements, buoys require extended endurance to enable precise synchronization with moorings.
Building upon prior research and in consideration of advancing China’s ocean altimetry satellite capabilities, experiments are conducted to establish a calibration site around Qianliyan islet. To meet the long-term operational requirements of ocean altimetry satellite calibration tasks, we plan to adopt a calibration method similar to that of the Bass Strait site, namely the direct calibration approach combining a GNSS buoy with a mooring array. The key innovation lies in redesigning an existing large-scale ocean buoy to develop a multi-antenna SSH measurement system, achieved without substantially increasing manufacturing costs. Leveraging the inherent stability of the buoy structure, this measurement system maintains operational steadiness amidst waves, enabling stable tracking of SSH variations. This system supports unattended operations with continuous deployment capabilities lasting several tens of days or longer. The GNSS buoy is equipped with multiple antennas evenly distributed. The multi-antenna configuration serves dual purposes: enhancing system robustness and providing real-time buoy attitude data for subsequent corrections.
Thus, in the experiment, the deployed calibration system comprised a permanent GNSS station, a newly developed oceanographic mooring array, and a large GNSS buoy retrofitted from an ocean environmental monitoring buoy. During June 2023, this integrated system underwent formal testing. The primary objectives were to thoroughly assess and compare the performance of the mooring array and GNSS buoy, thereby analyzing the feasibility and reliability of these two distinct systems. The findings aim to provide critical references for constructing future satellite altimetry calibration systems. It should be noted that the campaign serves as a proof of concept, establishing a cal/val site for operational altimetry missions would require more than one year of continuous data.
In the following, the brief information of experiment is introduced in Section 2. The methodology of data processing is summarized in Section 3. The main results are presented in Section 4. Section 5 summarizes the main conclusions of this study.

2. Experimental Overview

Qianliyan islet locates in the Yellow Sea of China. The location of Qianliyan islet (represented by the center of the blue circle) and the ground track of the Sentinel-6 (Jason CS) satellite (depicted by the solid line) are illustrated schematically in Figure 1. This islet is located approximately 45 km from the nearest mainland coastline and occupies an area of about 0.16 km2. The surrounding sea area exhibits an average water depth of about 30 m. On this islet there is one observation station, serving as one of the marine observation stations established by China’s State Oceanic Administration (SOA). For many years, this station has consistently operated a tide gauge, a continuously operating Global Navigation Satellite System (GNSS) station, and associated meteorological instrumentation [28]. Specifically, the fixed-type tide gauge utilizes a standard tide well design, which facilitates precise sea level measurements. Additionally, the seabed topography around Qianliyan islet changes very gently, which creates a favorable environment for deploying subsurface oceanographic mooring systems designed to monitor SSH.
In June 2023, a calibration site construction experiment was conducted in the waters adjacent to Qianliyan islet in China’s Yellow Sea. The equipment comprised one multi-antenna GNSS buoy and one mooring array. Following equipment calibration and preparatory work, all instruments deployed at designated positions commenced normal operations on day of year (DOY) 157 and concluded on DOY 179. Concurrently, GNSS data from the continuous reference station on Qianliyan islet—commissioned in 2011—were processed for subsequent analysis, with its GNSS buoy observations utilized for differential resolution of coordinate sequences. Figure 1 displays the instrumentation layout, where the solid black trace denotes the ground tracks of Jason-series satellites, the red circle (BY) marks the position of the multi-antenna GNSS buoy, the yellow pentagram (MA) locates the mooring array, the blue circle (GS) indicates the GNSS reference station, while the white-filled area in the center delineates the land extent of Qianliyan islet.
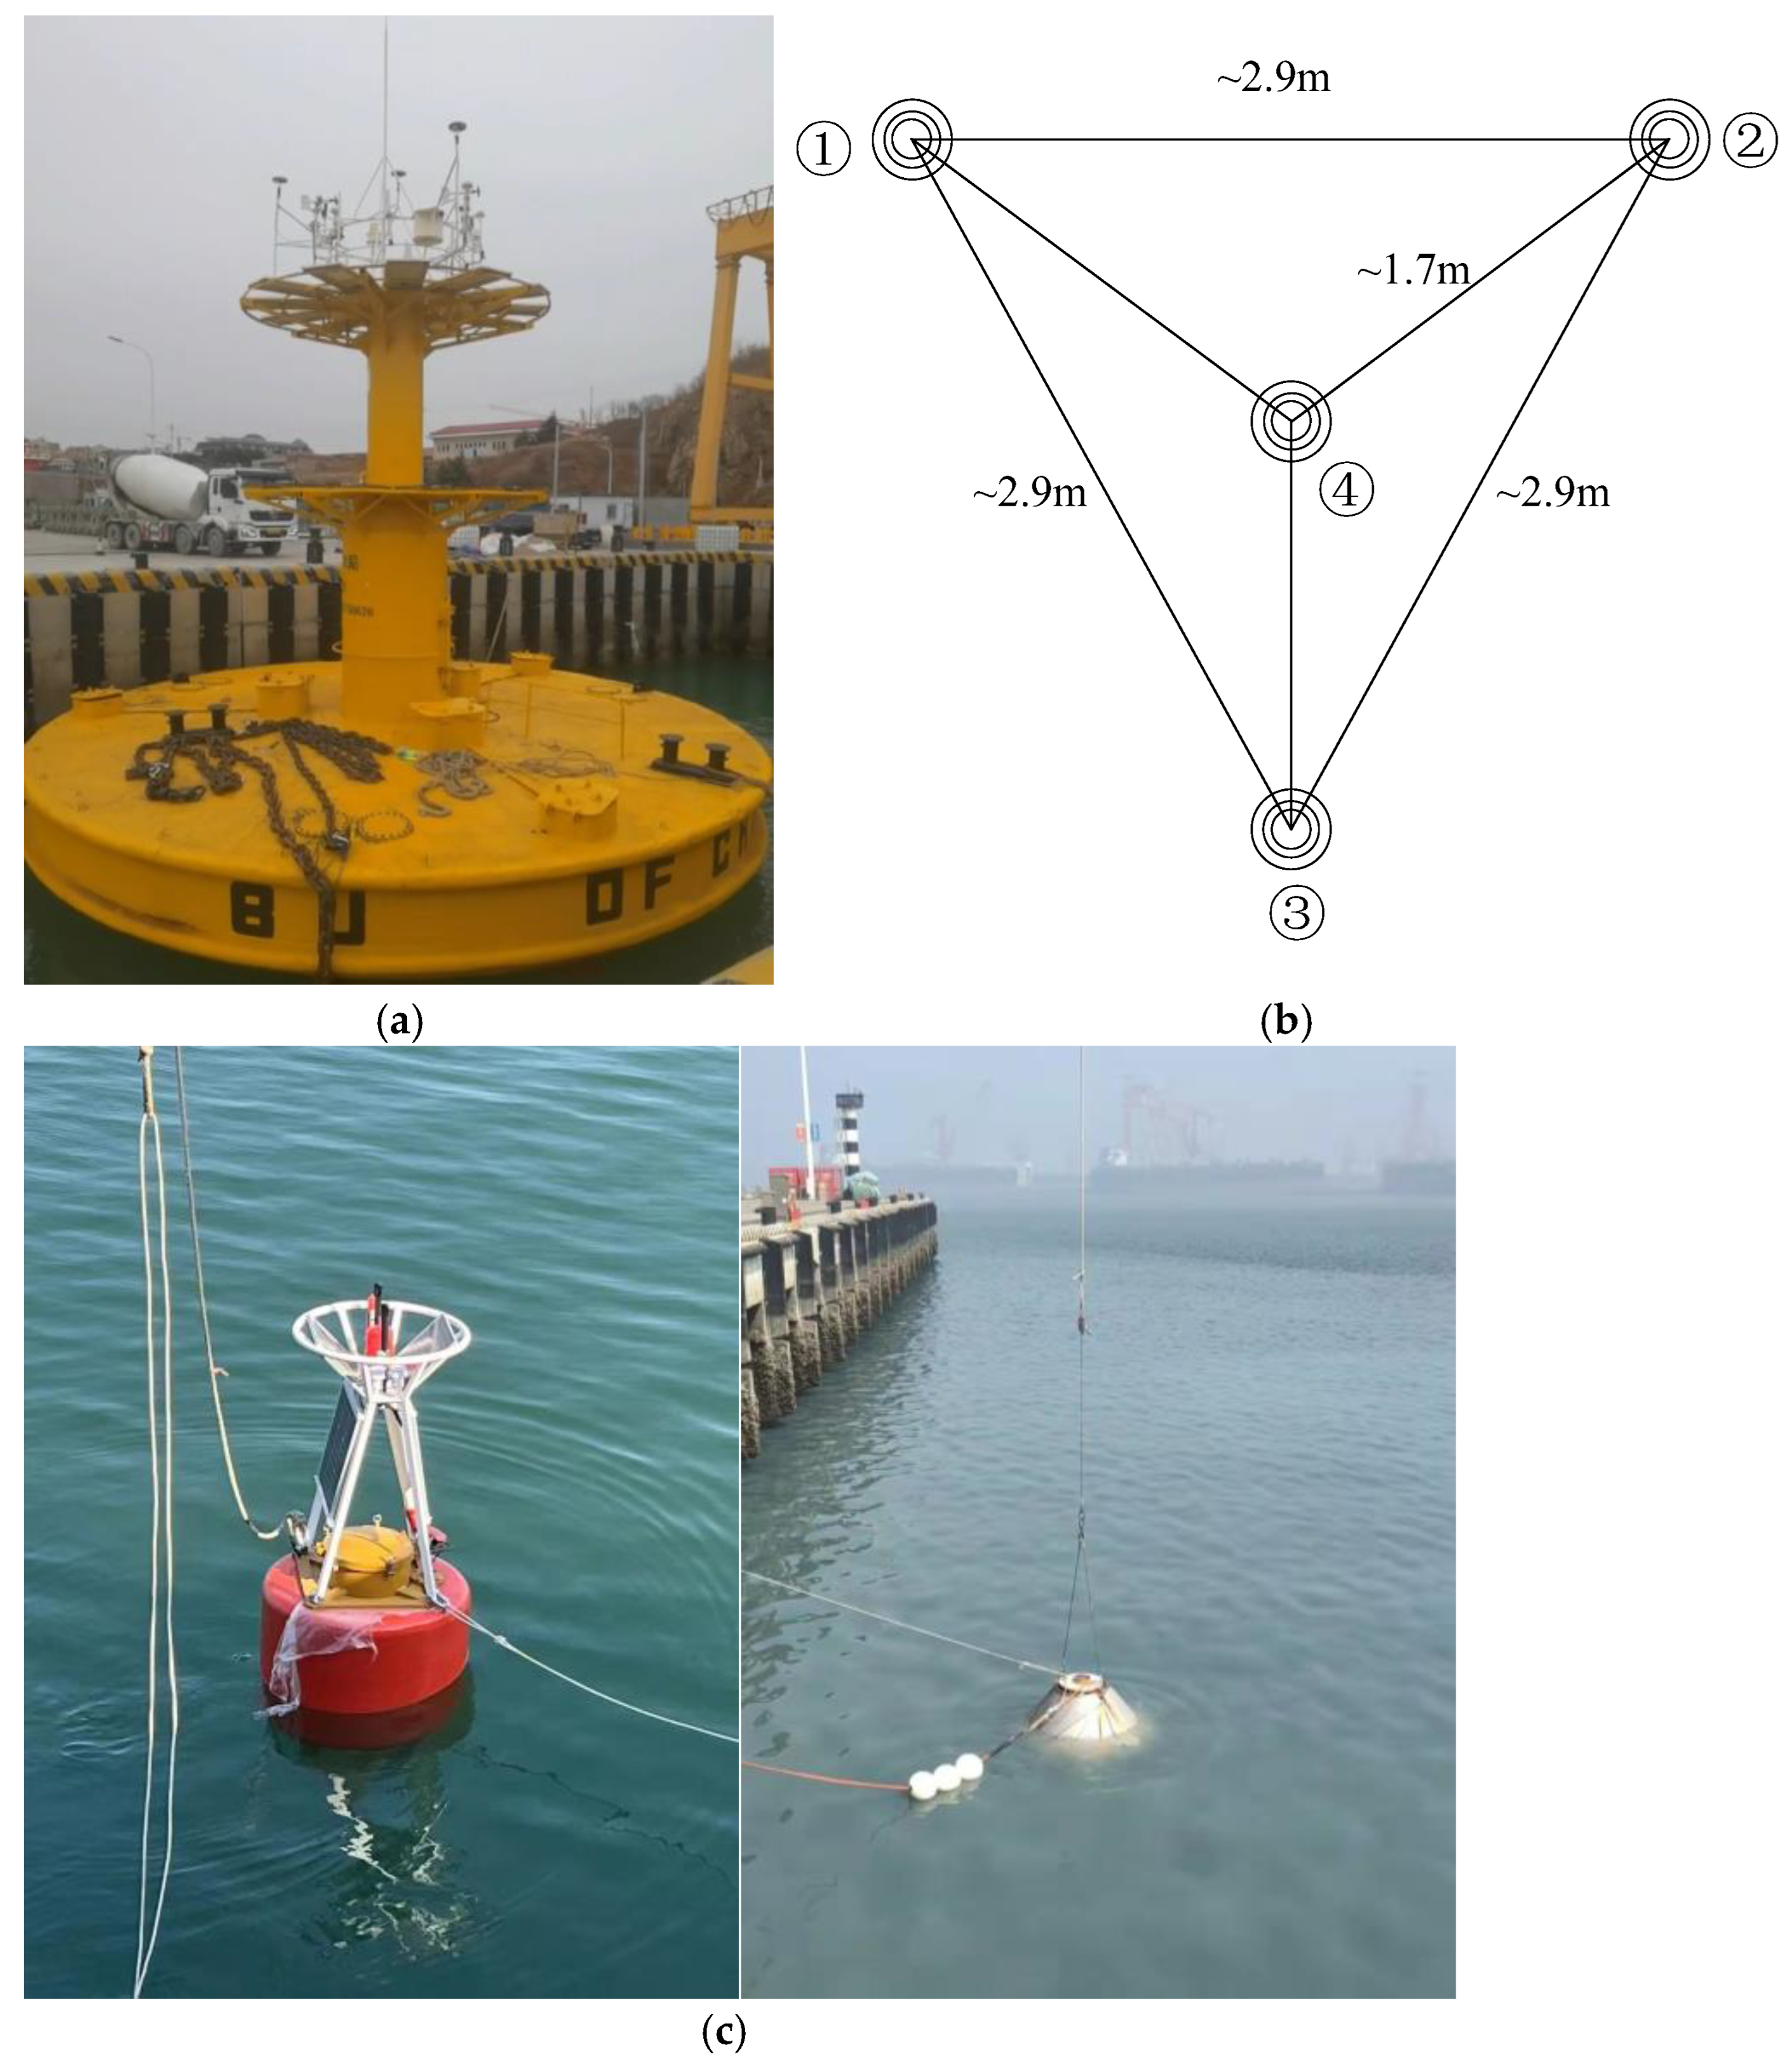
The four-antenna GNSS buoy (Figure 2a) is modified from an operational ocean monitoring platform (diameter bigger than 10 m). The type of receiver is Hi-Target VNet8, and the type of antenna is VEXXI GNSS-804R. Four pressure sensors and corresponding communication facilities are also settled on this platform. This transformation enables precise sea surface height data acquisition. The buoy features enhanced capabilities including the following: resilience to extreme environmental conditions, substantial payload capacity, optimized system operating conditions, tolerance for long-term deployments (>180 consecutive days), and reinforced anti-vandalism protection.
As illustrated in Figure 2b, the four GNSS antennas are positioned atop the buoy platform in a specific geometric configuration: Antennas ① to ④ are coplanar. Actually, the observational data from Antenna ④ are not employed in the subsequent processing steps of this work; its function was solely for backup in the event of system anomalies.
Figure 2c shows the image of the mooring array. This integrated system consists of a seafloor-based measurement subsystem and a surface buoy subsystem, interconnected by a hybrid electro-mechanical cable for simultaneous power delivery and data transmission. The seafloor subsystem acquires parameters including bottom pressure, temperature, and salinity. The bottom pressure sensor is a Paroscientific Digiquatz pressure sensor for high-accuracy pressure sensing, with full scale of 60 m and typical accuracy of 0.01% full scale. Concurrently, the surface buoy subsystem captures sea surface temperature, salinity, position, and sea-level atmospheric pressure.
Both the GNSS buoy and the mooring array are designed with dual data acquisition modes: self-contained logging and scheduled online transmission. Online transmission is achieved via 4G mobile communication. Deployed only a few kilometers offshore from Qianliyan islet, their proximity leverages the existing 4G mobile communication base station on the islet. Consequently, all GNSS and mooring array data are transmitted to shore-based servers through real-time 4G mobile links concurrently with persistent local archiving onboard the buoy system.
The adopted GNSS buoy features a power storage capacity sufficient for 20 days of autonomous operation during prolonged solar unavailability, with system recharging enabled under solar conditions. Its maximum daily solar charging capacity is designed at three times the system’s daily consumption to guarantee year-round uninterrupted observations. During the trial phase, the subsea segment of the mooring array powered by lithium batteries, could continuously work for 180 days, while the surface segment—utilizing a combined setup of solar panels and rechargeable batteries—sustained performance beyond 180 days.

3. Theoretical Methodology

3.1. Method of Processing GNSS Buoy Data

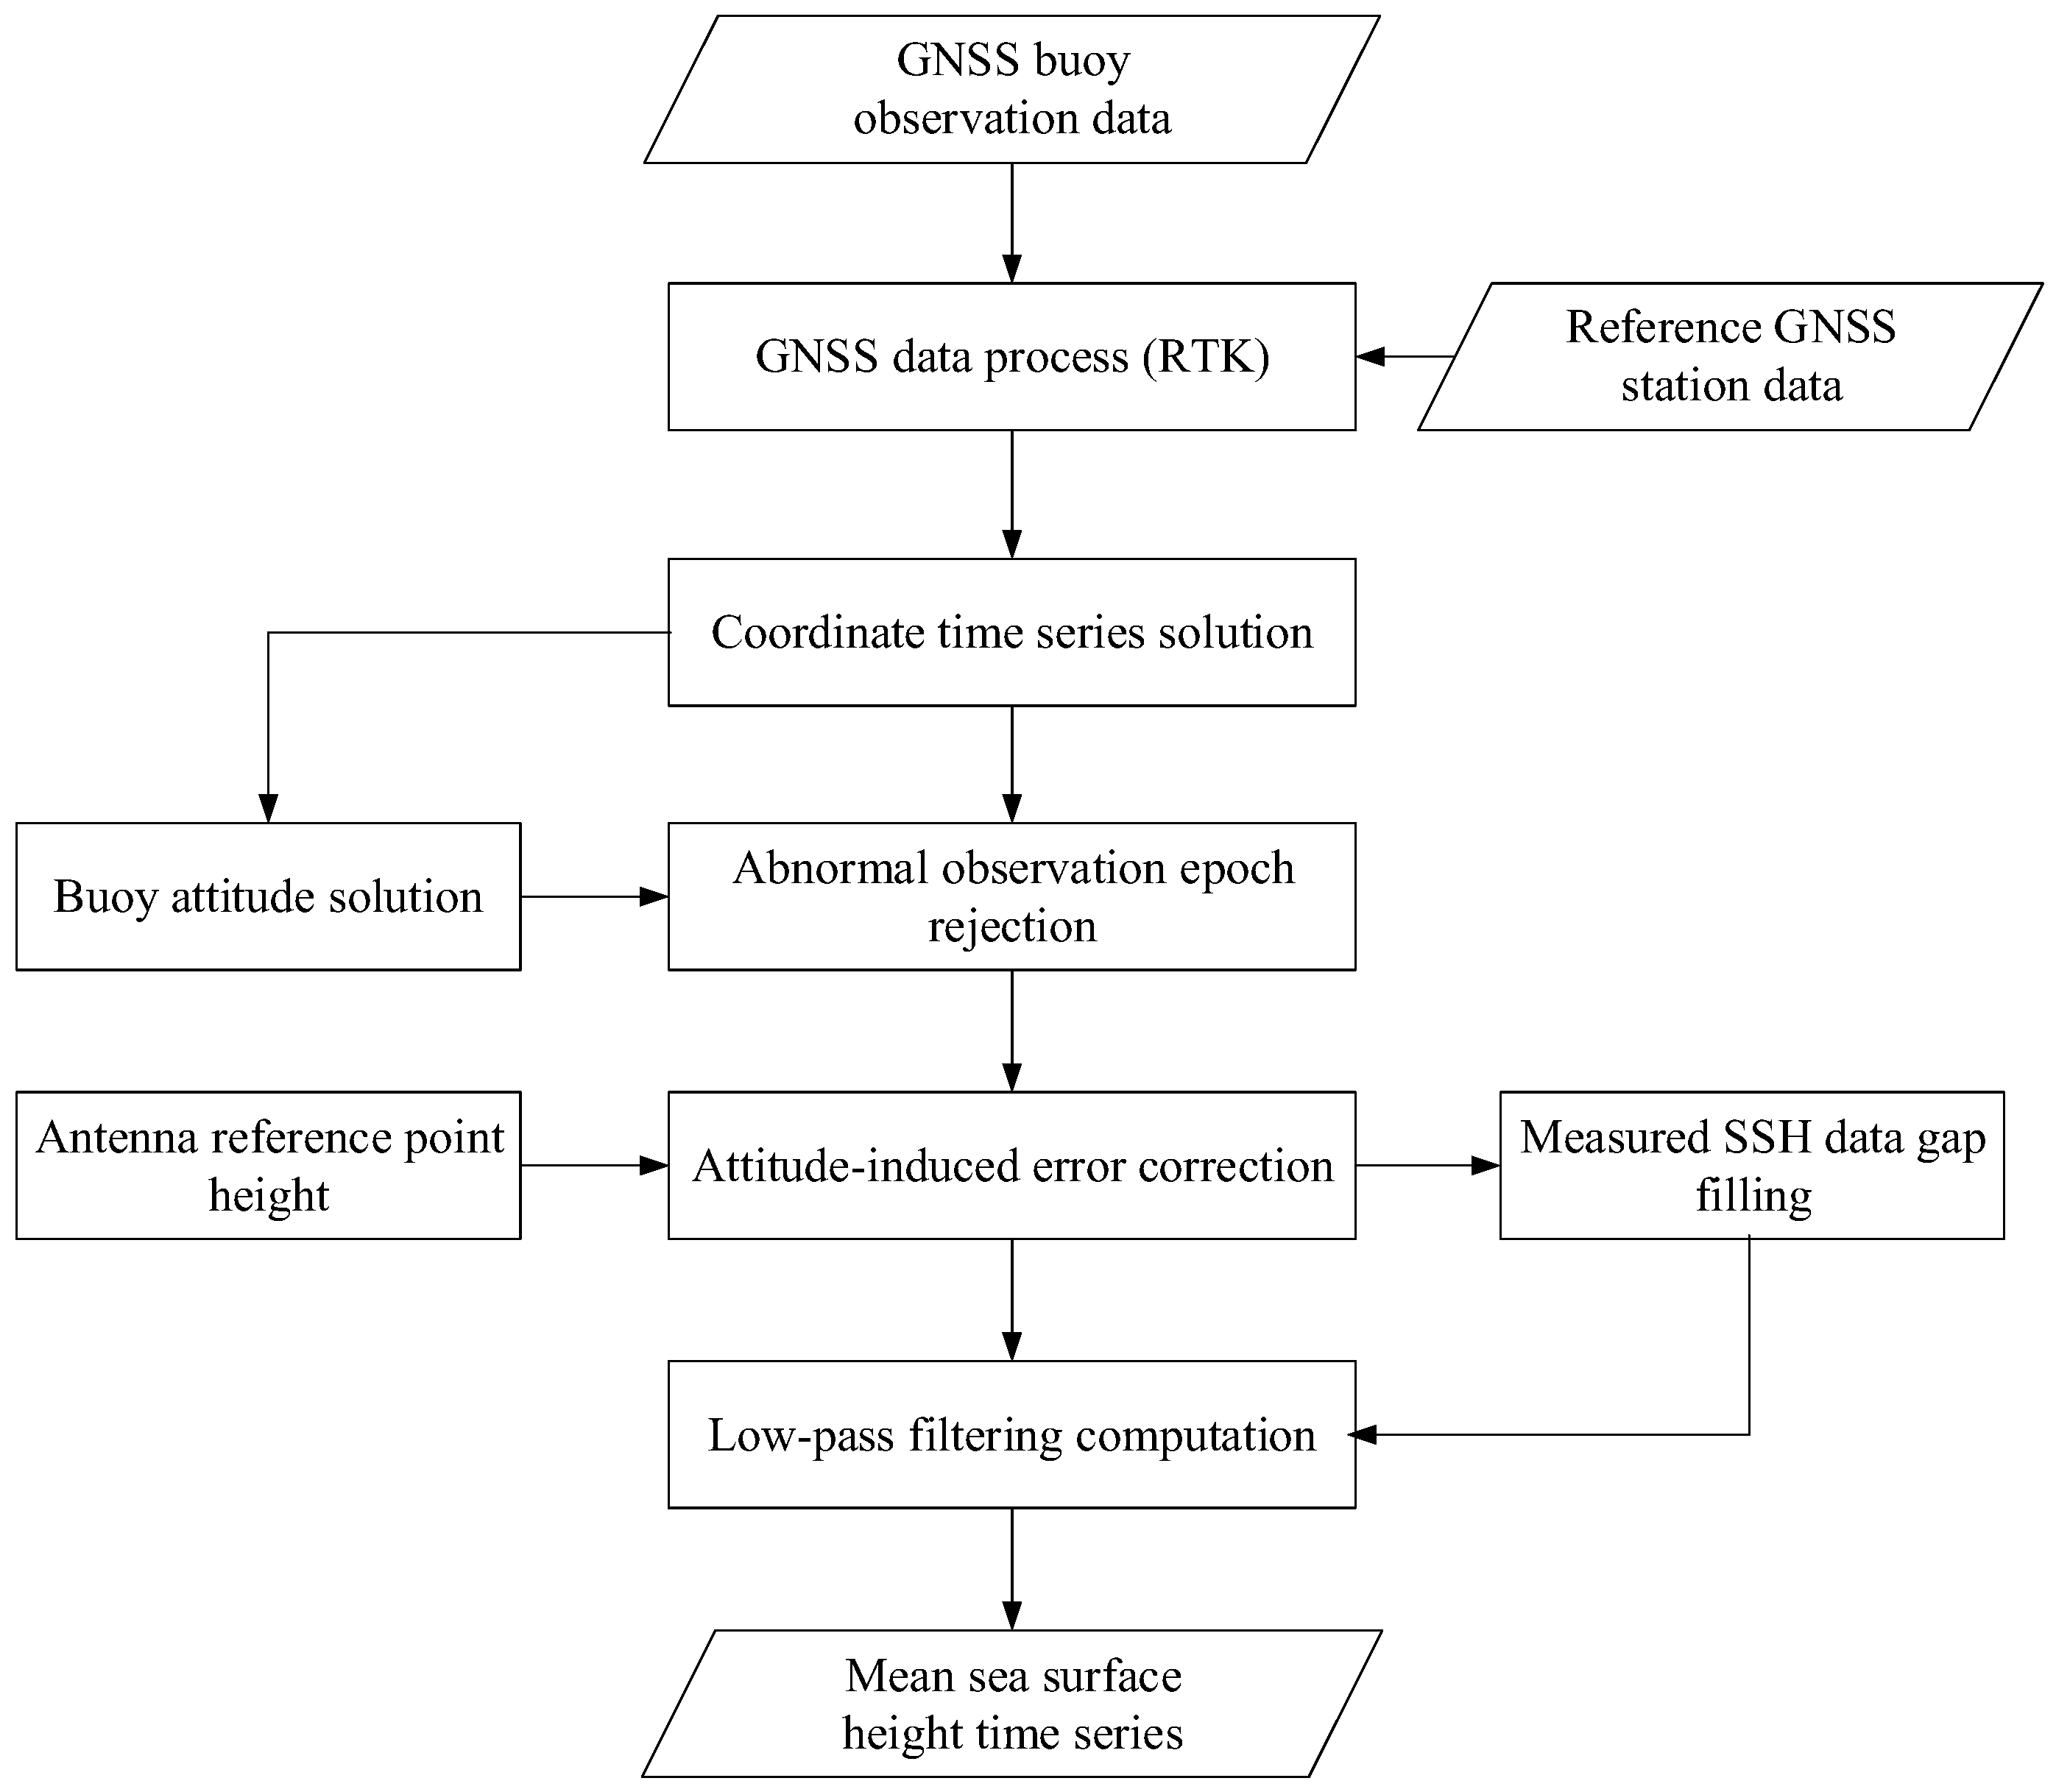
Prior to conducting satellite altimetry calibration using GNSS buoy observational data, preprocessing is essential. This procedure encompasses the determination of GNSS antenna height, computation of buoy attitude, removal of anomalous observation epochs, correction for attitude-induced effects, gap-filling of measured sea surface height data, and filtering operations. The complete workflow is depicted in Figure 3.
The coordinate series of four antenna reference points are computed using the RTK method through observation data of reference GNSS station on Qianliyan islet. As shown in Figure 1, the distance between the GNSS buoy and the reference station does not exceed 5 km, a scenario where the RTK positioning method proves to be an effective solution. For applications in other regions, it is recommended that the distance between the GNSS buoy and the reference station remains within 25 km. Additionally, the potential impact of the reference station’s terrestrial location on spaceborne microwave radiometers must be considered.
The buoy’s horizontal attitude angle is derived by processing multi-antenna signals: positional coordinate sequences are first acquired, the normal vector to the plane formed by three antenna reference points is then calculated, and the final attitude angle is obtained by measuring its angular deviation from the vertical direction.
The reference points of antennas ①, ②, and ③ in Figure 2b are denoted as A, B, and C, respectively, with their geometric centroid designated as point O. Given that the three-dimensional geocentric coordinates of points A, B, and C are (xA, yA, zA), (xB, yB, zB), and (xC, yC, zC), the coordinates of point O (xO, yO, zO) are derived as the arithmetic mean of the corresponding coordinates of A, B, and C, such that
x O = 1 3 ( x A + x B + x C ) y O = 1 3 ( y A + y B + y C ) z O = 1 3 ( z A + z B + z C )
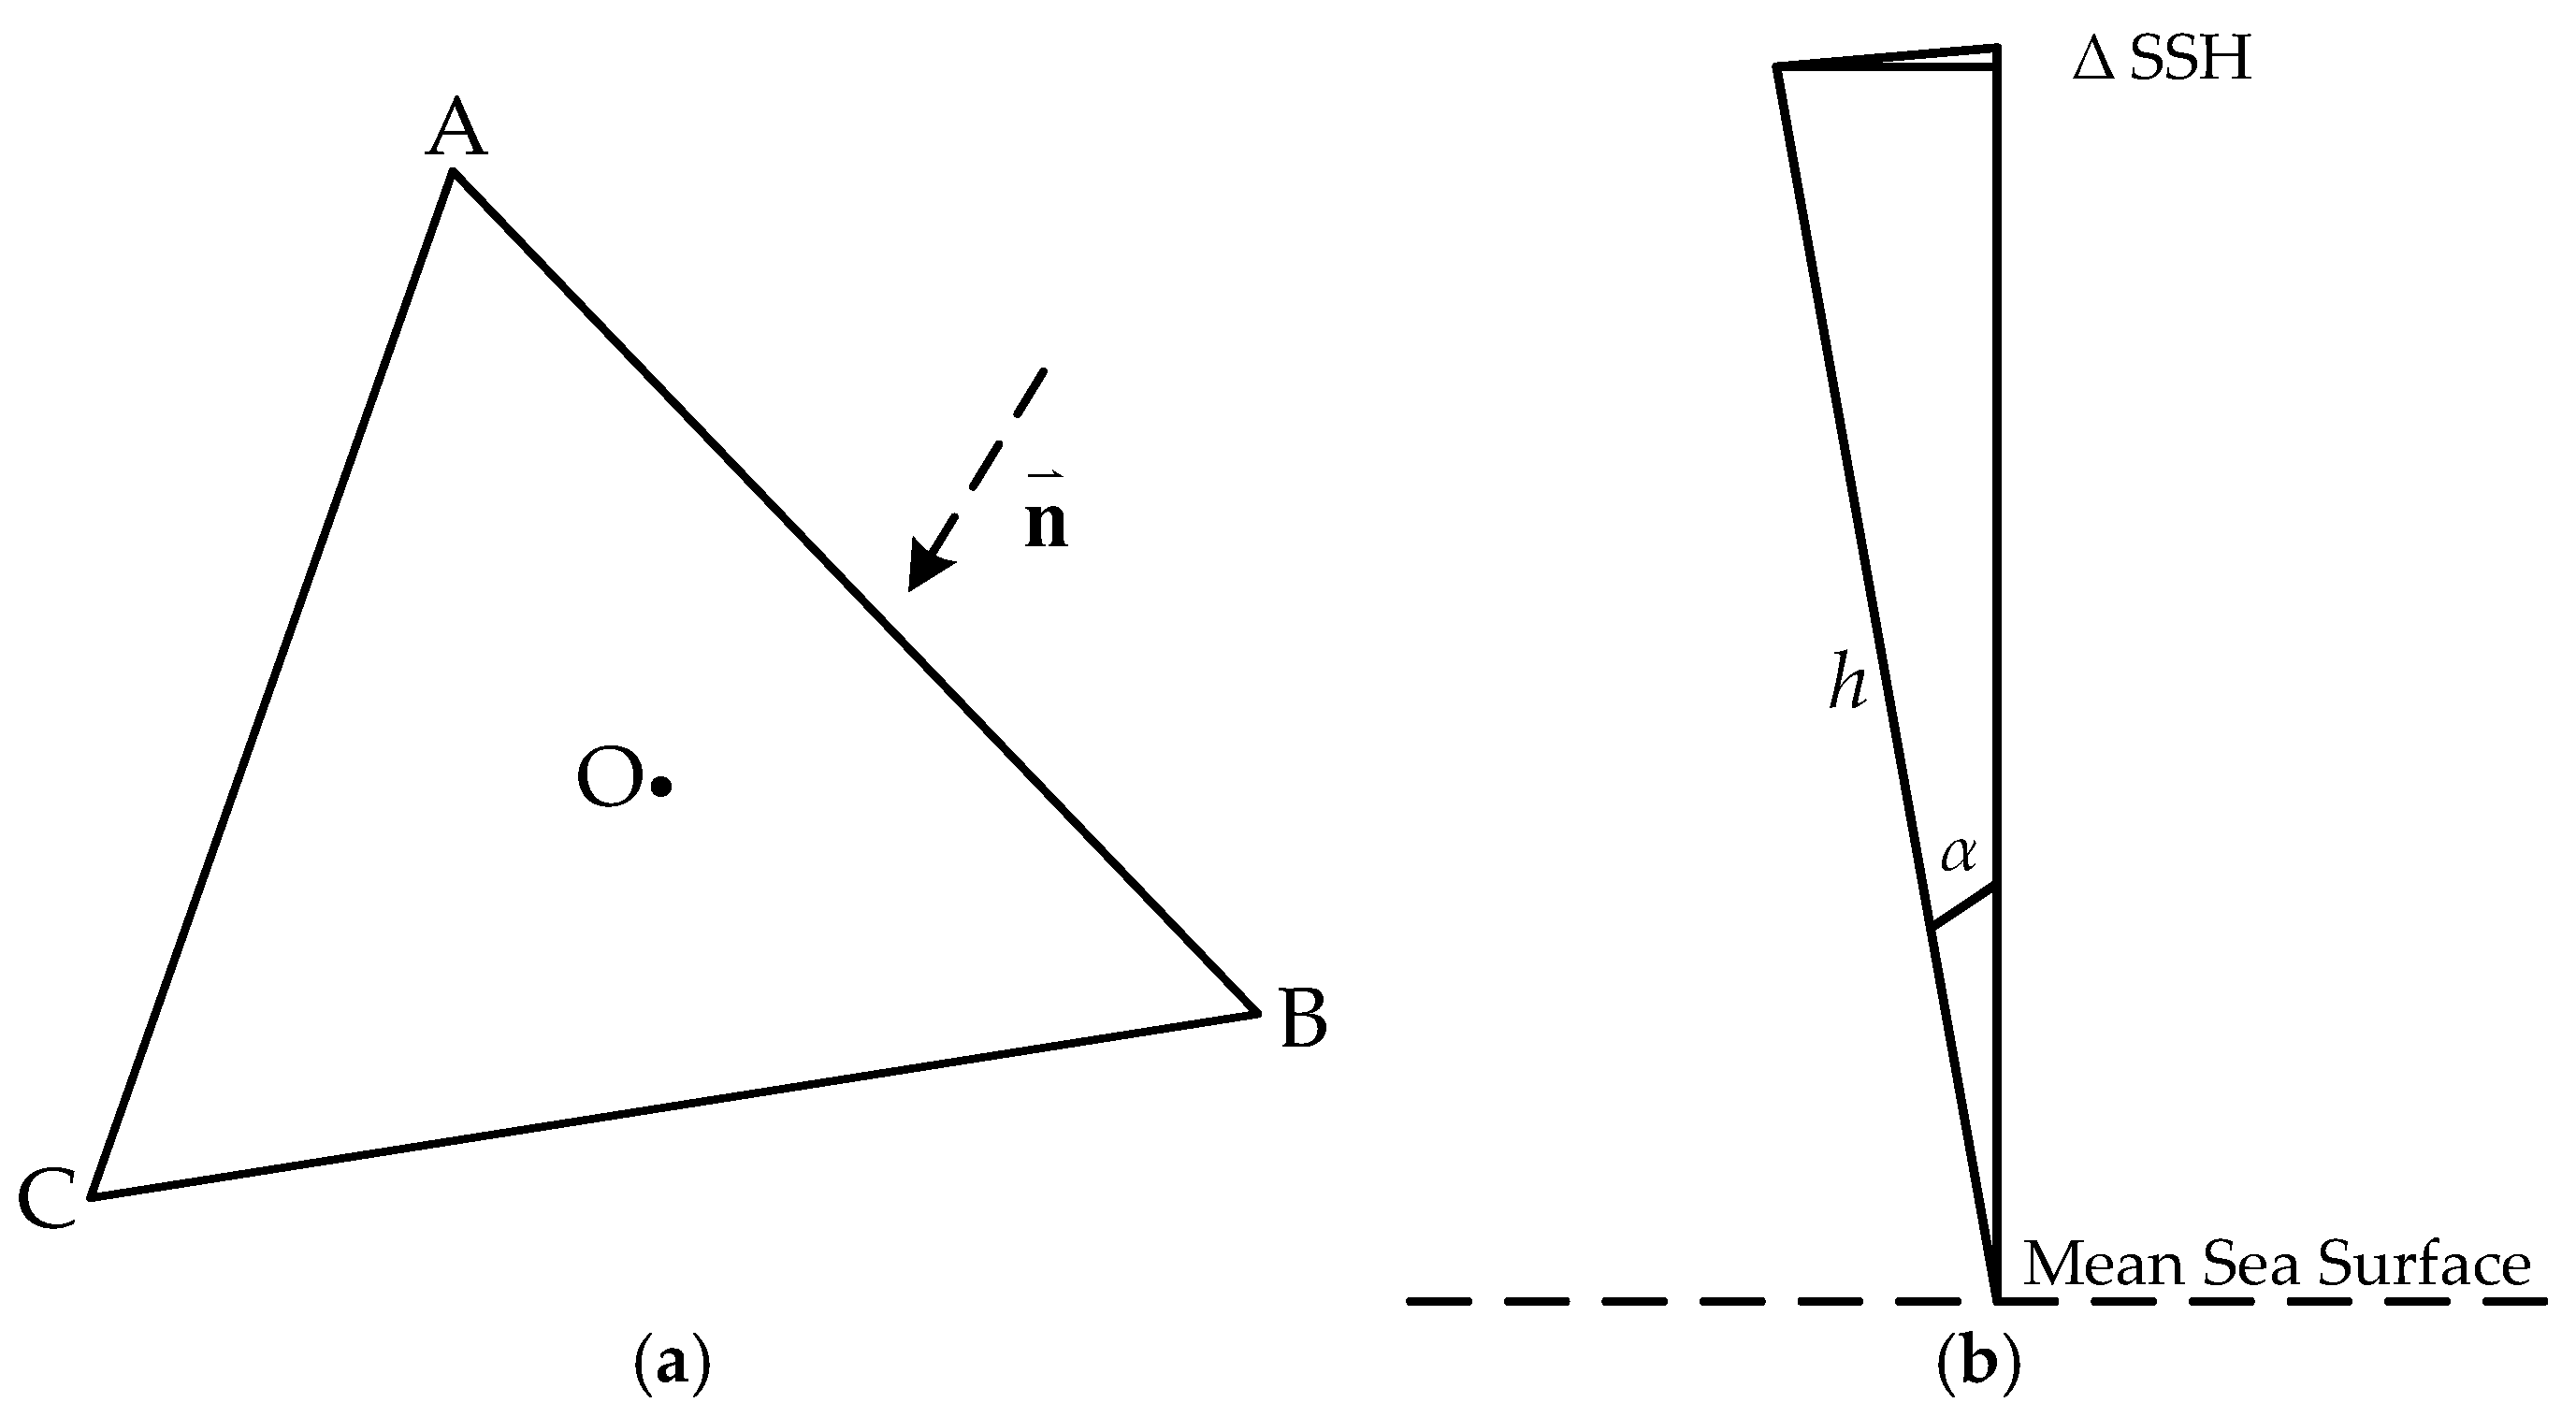
Given that points A, B, and C experience optimal observation conditions, their respective coordinates can be accurately computed at every measurement epoch, ensuring consistent validity of point O’s coordinates throughout the observation period. As shown in Figure 4a, the unit normal vector n of the plane defined by points A, B, and C is oriented toward Earth’s center along the local vertical direction (geocentric radial direction).
B C = x C x B , y C y B , z C z B = ( a 1 , a 2 , a 3 )
BA = x A x B , y A y B , z A z B = ( b 1 , b 2 , b 3 )
The vector product BC × BA can be obtained from Equation (4), i.e.,
BC × BA = ( ( a 2 b 3 a 3 b 2 ) , ( a 3 b 1 a 1 b 3 ) , ( a 1 b 2 a 2 b 1 ) )
The vector product BC × BA is designated as ( c 1 , c 2 , c 3 ) , since n BC × BA , n can be determined through Equation (5),
n = ( n 1 , n 2 , n 3 ) = ( c 1 , c 2 , c 3 ) c 1 2 + c 2 2 + c 3 2
For non-unit vectors, n can be simplified to
n = ( c 1 , c 2 , c 3 )
The angle between plane ABC and the horizontal plane, which is the buoy’s horizontal inclination θ , can be determined through Equation (7):
θ = acos ( c 3 / c 1 2 + c 2 2 + c 3 2 )
During actual measurement operations, alterations in the GNSS buoy’s attitude affect the measured sea surface height. Figure 4b schematically illustrates the computational relationship of sea surface height deviation (ΔSSH) between measured and true sea levels when the attitude angle is α. According to the geometric relationships shown, ΔSSH can be calculated using the following formula:
Δ SSH = h 1 cos α = 2 h sin 2 α / 2
The error in measured SSH due to buoy attitude variation is approximately on the order of: 2 h sin 2 α / 2 , where h is vertical distance between antenna reference point and ocean surface.
Table 1 lists errors in measured SSH induced by buoy attitude variations under different attitude angles when antenna height is 10 m. Based on this relationship, subsequent calculations can reduce SSH errors by determining the GNSS buoy’s attitude angles.
For the low-pass filtering computation in Figure 3, an FIR low-pass filter may be employed. The cutoff frequency of the filter can be configured according to the frequency band of the high-frequency signals requiring attenuation. Based on the approximate main lobe width of the selected window function (a Hamming window in this study), the filter order can be calculated. Due to boundary effects inherent to low-pass filtering, data segments at the beginning and end of the filtered sequence must be discarded. In this work, without compromising computational outcomes, the initial and final 2000 s of filtered observations were removed before subsequent analysis.
The preceding steps outline the procedure for deriving regional mean sea surface height using observational data from the three GNSS buoy antennas. Antenna ④ is positioned along the central axis of the buoy. When data quality from this antenna is satisfactory, its coordinate time series can also be processed through low-pass filtering to obtain a sequence of regional mean sea surface height variations. However, relying solely on Antenna ④ observations does not allow for accurate determination of buoy attitude changes. Consequently, the attitude correction described in Equation (8) cannot be applied, introducing bias into the derived sea surface height, which renders it unsuitable for altimeter calibration. Furthermore, the coordinate time series from the three antennas enable the computation of buoy attitude. Abnormal variations in attitude effectively facilitate the identification of outliers in the observations—a capability not achievable with a single-antenna system.

3.2. Method of Processing Mooring Array Data

The mooring array is equipped with high-precision instruments: a seabed pressure sensor, sea surface barometer, and wet salinity profiler. Measurements from these devices enable computation of seawater depth variations. The depth calculation formula for salinity 35Psu at 0 °C is given by Equation (9) [33]:
z = D / g ¯
In the equation, z represents the calculated depth value in meters (m), g ¯ denotes the mean gravitational acceleration in m/s2 (local gravitational acceleration may be used directly in shallow water regions), and D is computed as follows:
D = C 1 P + C 2 P 2 + C 3 P 3 + C 4 P 4
where coefficients are valued at C1 = 9.72659, C2 = −2.2512 × 10⁻⁵, C3 = 2.279 × 10⁻¹⁰, C4 = −1.82 × 10⁻¹⁵, and P is the pressure measurement in decibars (dbar).
As the present experiment primarily focuses on seawater depth variations rather than absolute depth, and the maximum depth does not exceed 35 m, it will be shown later that the absolute changes in seawater temperature and salinity are minimal. Consequently, the impact of these variations on depth changes is considered negligible. Thus, Equation (9) is adopted for calculating seawater depth variations from the mooring array measurements throughout this experiment.
Simultaneously, in satellite altimetry calibration applications using mooring array to observe SSH, after obtaining depth measurement data, a height datum must be established to convert depth values into SSH measurements. The SSH time series derived from the ocean mooring array inherently lacks a height datum, necessitating GNSS buoy (or GNSS-equipped zodiac) to provide this reference. By comparing concurrently measured SSH values from GNSS buoy with mooring depth measurements (dmooring), the mean difference between these datasets serves as the height datum for dmooring. The calculation process of sea surface height datum measured by the mooring array will be presented in Section 4.2.

4. Results

4.1. GNSS Buoy Data Processing

In the relatively calm waters of a dock channel, a tide gauge is mounted on the sidewall, while a GNSS receiver, serving as a reference station, is positioned on the dock. By conducting synchronized observations with the GNSS buoy, GNSS reference station, and tide gauge, the distance between the GNSS antenna reference point (ARP) on the buoy and the water surface is obtained. The height difference between the tide gauge zero point and the GNSS reference antenna ARP is measured via leveling. The tide gauge observations yield a series of geoid height variations in the water surface, while the synchronous observations enable the derivation of the changes in antenna height of the GNSS buoy. The difference between these two series is calculated and averaged to determine the absolute antenna height of the GNSS buoy, which is 10.40 m.
For the multi-antenna GNSS buoy, the reference point coordinates of each antenna-receiver pair can be independently solved to generate position time series. Statistical analysis (Figure 5a) reveals that the mean horizontal attitude angle of the buoy on DOY 164 was approximately 1.5°. Data points with horizontal attitude angles exceeding 6° or anomalies constituted ~0.06% of all matched measurements. These entries are classified as anomalous observations, which may originate from satellite signal multipath effects, the buoy’s excessive actual tilt, or missing observations due to individual satellite anomalies. Overall, the anomalous values constitute only a small part of the total observations calculated from that day’s data. After removing these outliers, Figure 5b displays the SSH deviation series induced by residual horizontal attitude variations, with Figure 5c presenting the corresponding statistical histogram.
The mean buoy SSH deviation attributed to attitude angles in Figure 5b is 0.48 cm. Evidently, when employing this type of buoy for high-precision SSH measurement under such sea state conditions, SSH correction is mandatory.
The geometric center coordinates of the buoy’s triple antennas are derived from Equation (1). Subsequently, the obtained z O coordinate series undergoes attitude correction by applying 2 h sin 2 ( α / 2 ) .
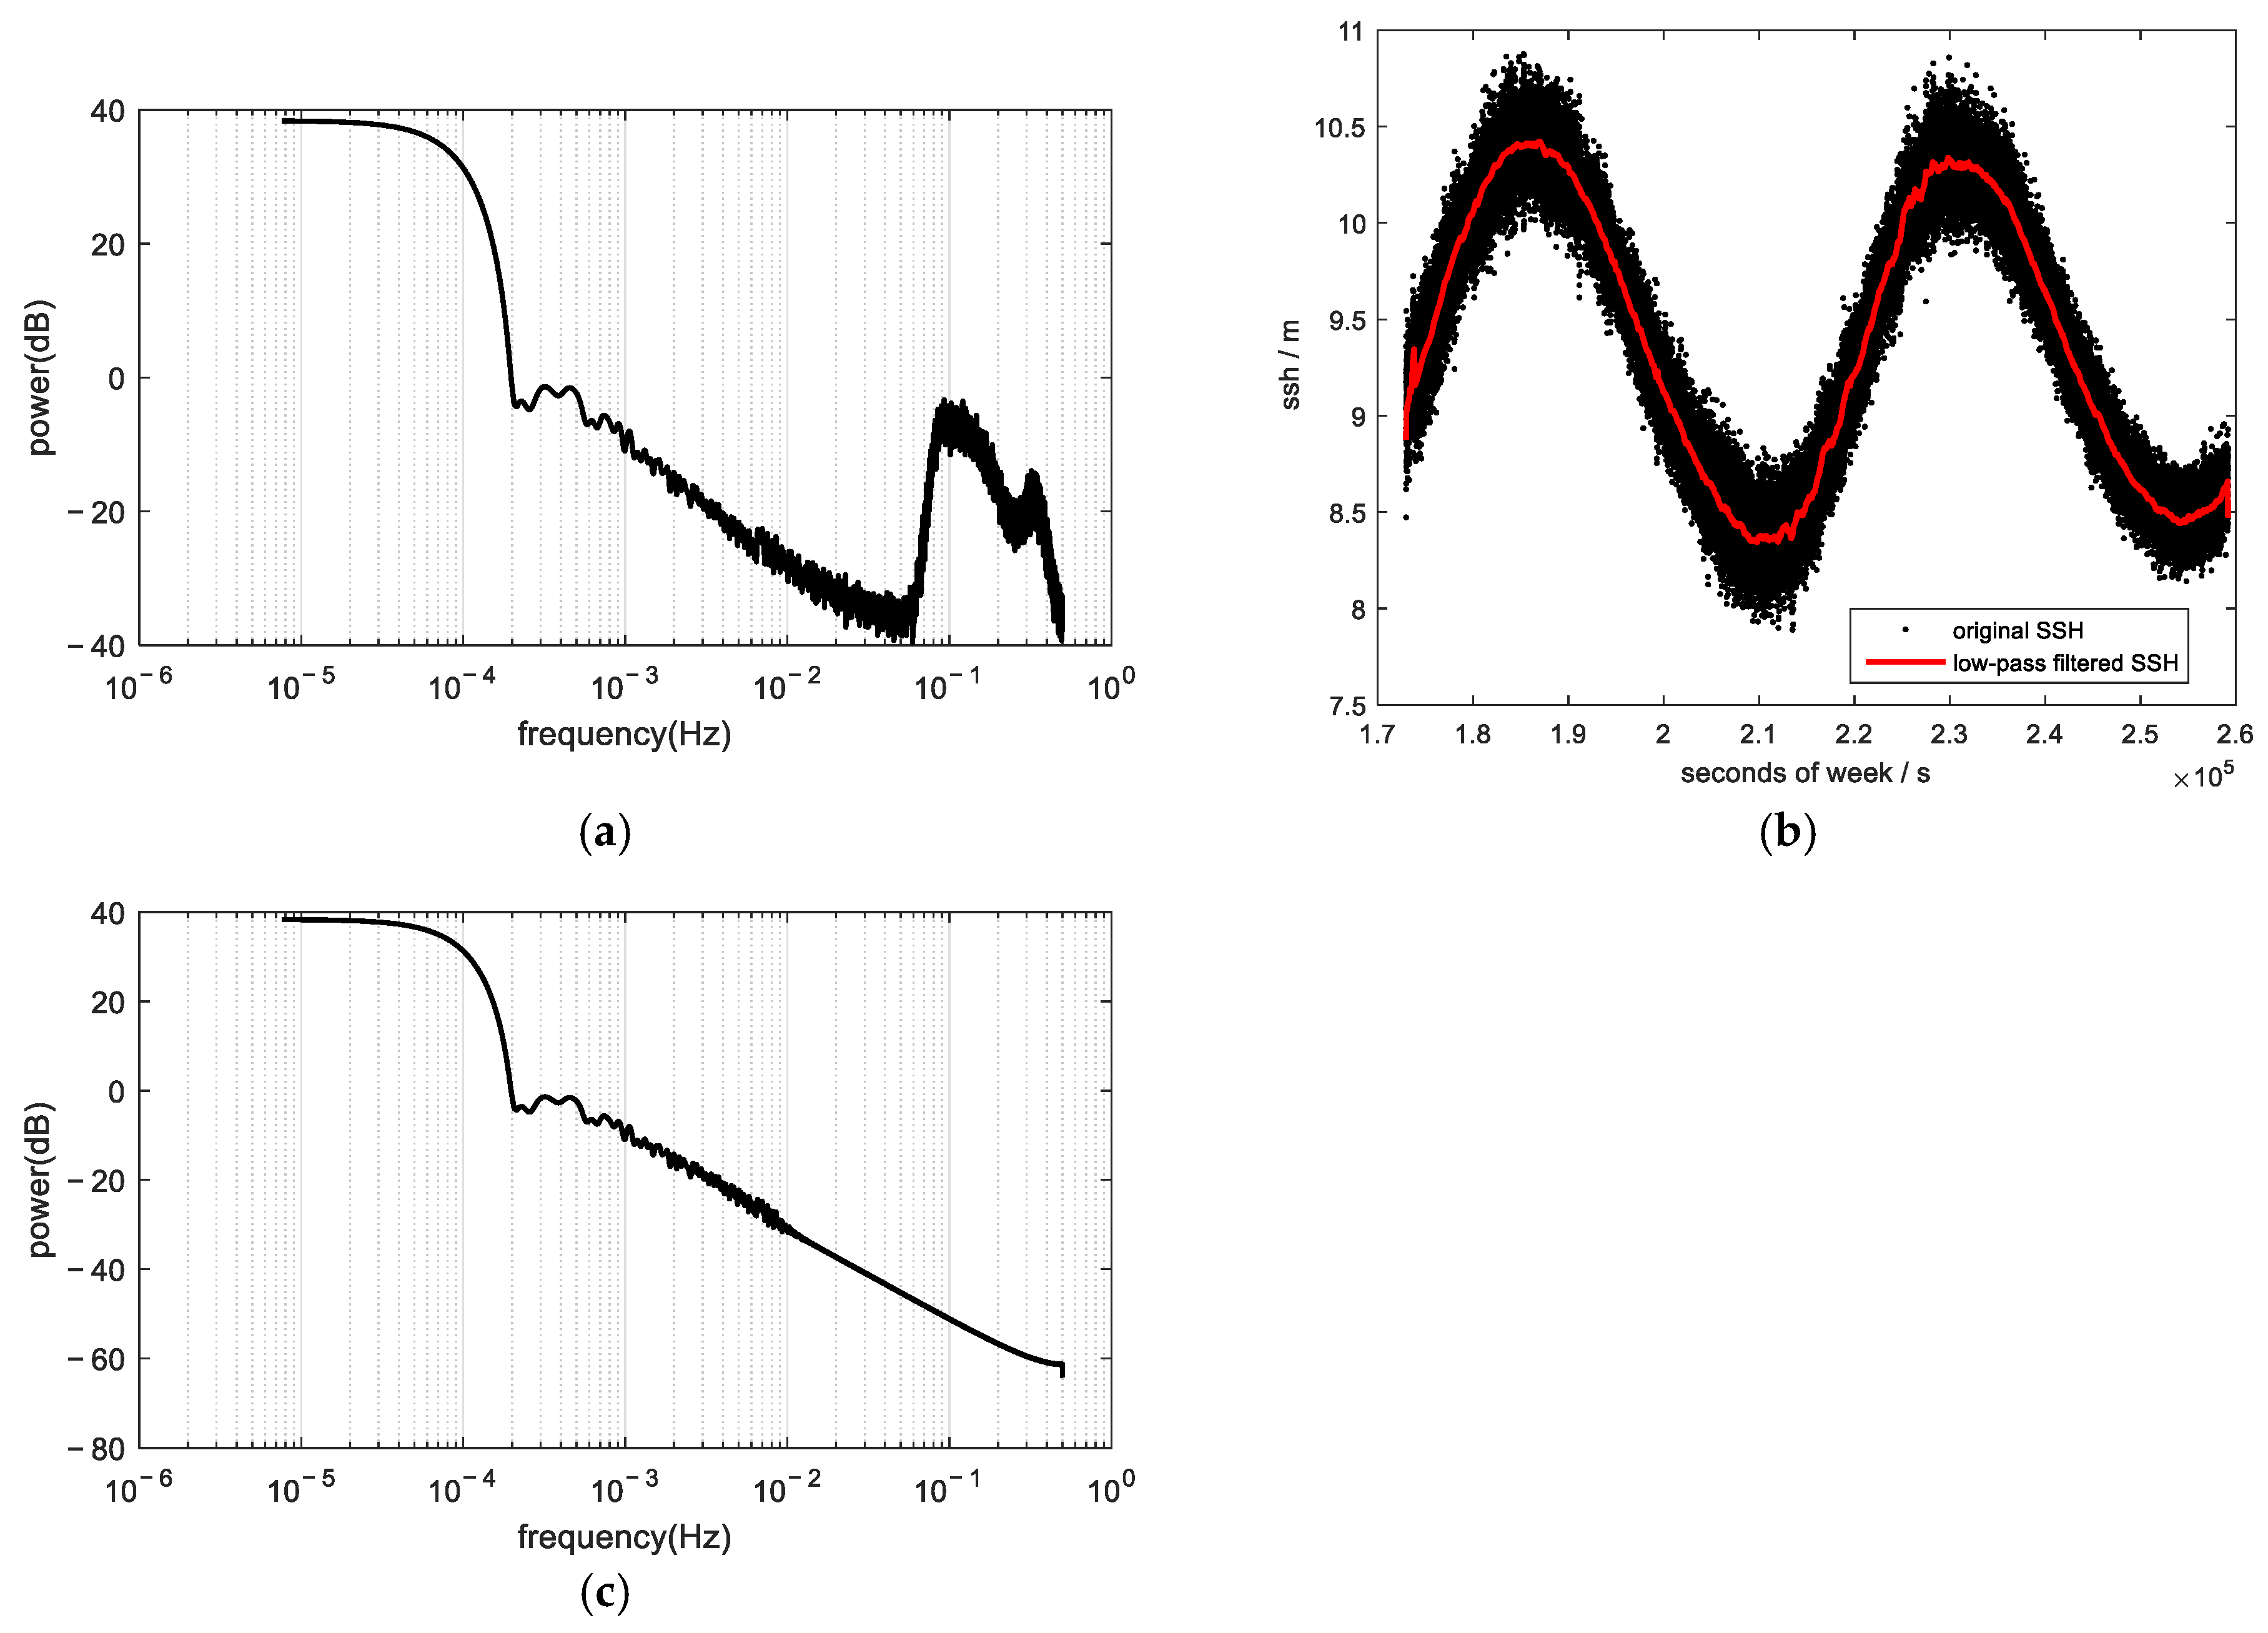
The interpolated SSH time series is subjected to spectral analysis using the Welch method. After removing the daily mean SSH, the resulting power spectrum is shown in Figure 6a.
The primary energy period of wind waves ranges from 4 to 12 s, corresponding to a primary frequency range of 0.083 Hz to 0.25 Hz. The energy distribution among high-frequency signals in the sea surface height variation power spectrum shown in Figure 6a aligns with this pattern. Consequently, the high-frequency signals are considered to represent sea surface undulations induced by wind waves.
In satellite altimeter calibration missions, the satellite measures the mean sea surface height within a specific sub-satellite footprint, while the GNSS buoy measures sea surface height variations at single point. Comparison between these two measurements requires applying low-pass filtering to the GNSS buoy-derived sea surface height to remove the aforementioned high-frequency components for altimeter calibration purposes.
Figure 6a reveals a discernible distinction in spectral characteristics between low-frequency and high-frequency signals in sea surface height observations. An appropriate separation threshold exists near 0.01 Hz, prompting the configuration of the low-pass filter cutoff frequency at this value. In accordance with the properties of the FIR low-pass filter, the filter order is calculated as 200. The filtered mean SSH series (Figure 6b) and its corresponding Welch power spectrum (Figure 6c) demonstrate effective suppression of high-frequency noise. The filtered SSH enables the retrieval of satellite nadir-point heights during overpasses, achieved through linear interpolation of pre- and post-overpass filtered heights.
Figure 7a displays residuals between raw and filtered SSH (representing removed high-frequency components), exhibiting a standard deviation of ~13 cm, with their spectral characteristics in Figure 7b.
The experiment was conducted from DOY 157 to DOY 179, encompassing a 23-day observation period. During this period, receiver ③ experienced data anomalies specifically on DOY 170 and 178. Subsequent analysis was performed on the remaining 21 days with complete valid observations. Analysis revealed periodic sea state variations in the experimental area, prompting the comparative presentation of two representative three-day observation windows: DOY 161–163, reflecting complex sea conditions, and DOY 172–174, representing calmer periods.
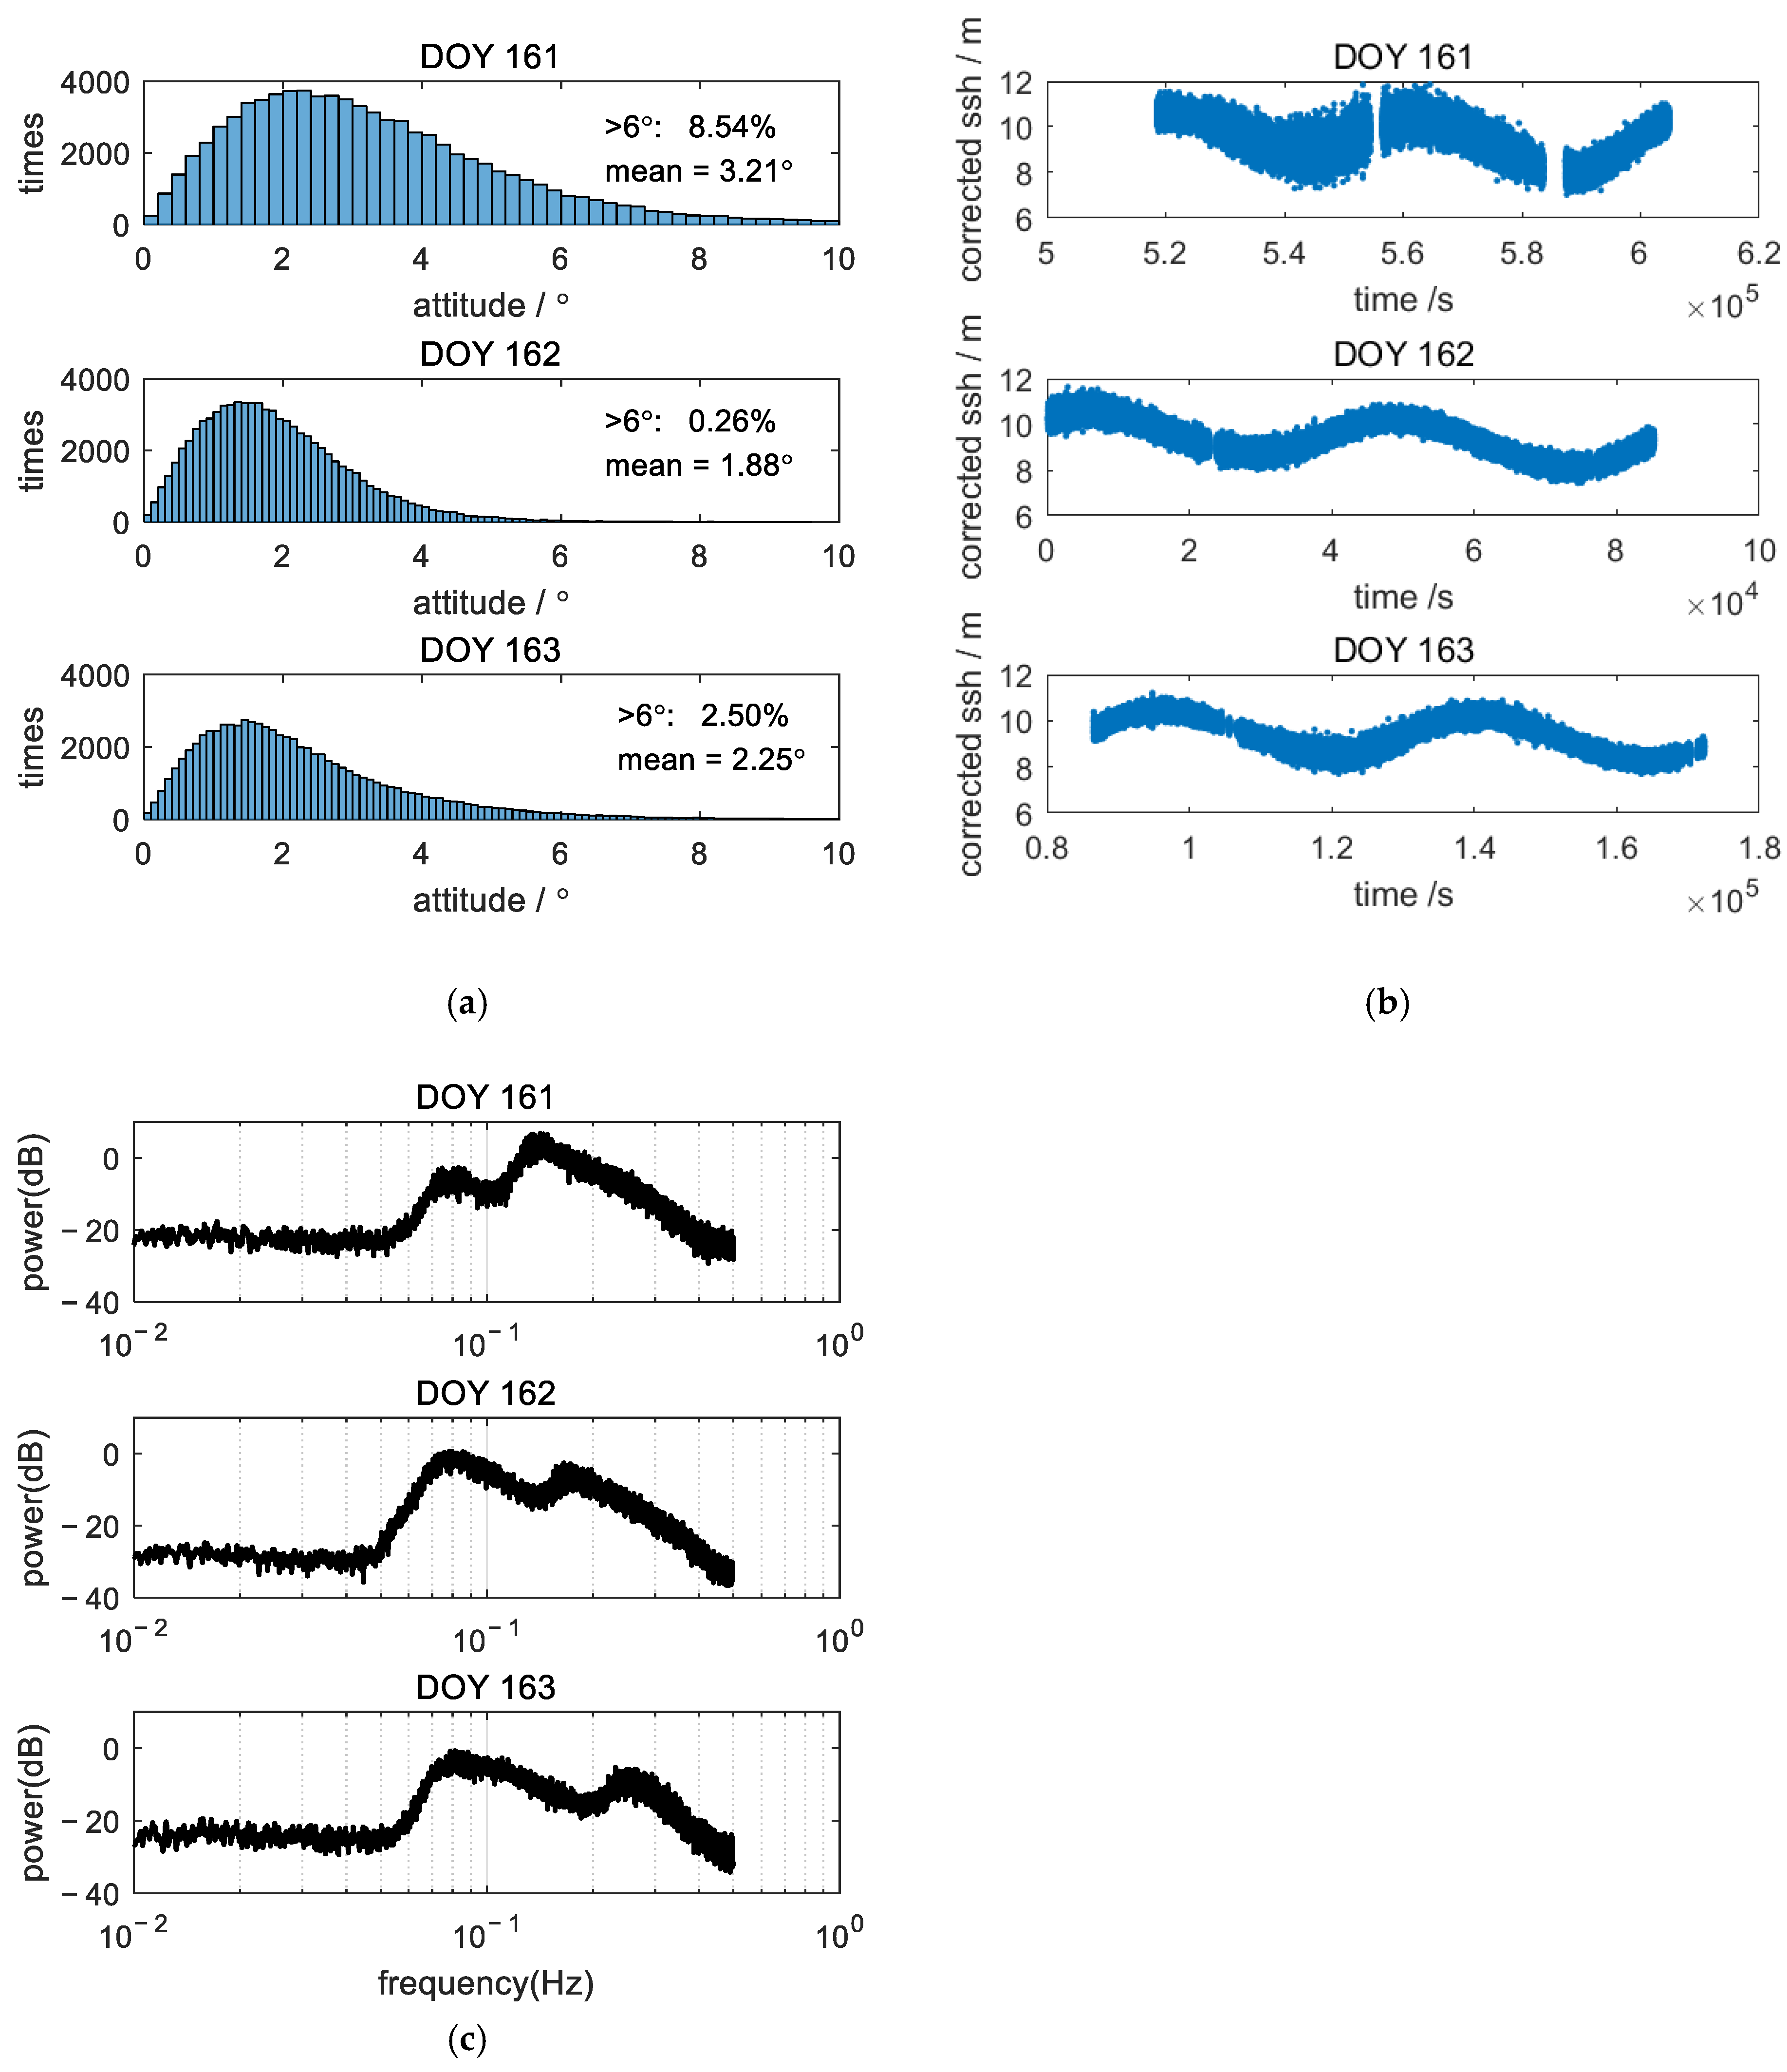
Following the established data processing protocol, Figure 8a displays attitude angle histograms for DOY 161–163 while Figure 8b presents corresponding attitude-corrected SSH measurements.
Analysis of Figure 8a indicates significantly greater buoy attitude variability on DOY 161 compared to DOY 162 and 163. Within the illustrated datasets, the proportions of attitude angles exceeding 6° were 8.54%, 0.26%, and 2.5%, respectively, across these three days. When excluding invalid attitude data and instances exceeding 10°, the mean attitude angles calculated as 3.21°, 1.88°, and 2.25°. Figure 8b corroborates these observations, demonstrating substantially larger amplitude deviations in buoy-measured SSH relative to the mean height on DOY 161.
The application of the prescribed low-pass filtering to the SSH time series generated power spectra of the removed high-frequency components shown in Figure 8c.
As illustrated by Figure 8c, the residual high-frequency spectra of sea surface height signals after low-pass filtering exhibit subtle variations across the three selected days. The signal intensity at 0.08 Hz central frequency shows minimal differences between all three days. However, on DOY 161, spectral energy at the 0.15 Hz central frequency demonstrates significantly higher amplitude. Conversely, during the subsequent two days, high-frequency components exceeding 0.1 Hz are markedly attenuated relative to the 0.08 Hz signals, exhibiting over 60% weaker power spectral density above this threshold frequency.
Buoy attitude histograms for DOY 172–174 and the corresponding attitude-corrected SSH measurements are presented in Figure 9a and Figure 9b, respectively.
Analysis of Figure 9a reveals exceptionally stable buoy attitudes on DOY 173, indicative of calm sea conditions. The proportions of attitude angles exceeding 6° during this three-day period were 0.09%, 0.06%, and 1.57%, respectively. When excluding invalid measurements and angles >10°, mean attitude angles were calculated at 1.46°, 0.87°, and 2.04°. As illustrated in Figure 9b, SSH variability on DOY 173 exhibited minimal amplitude excursions relative to the mean height, signifying a phased extreme in sea state tranquility. A gradual increase in SSH variability emerged on DOY 174, demonstrating the transitional shift from calm to complex sea conditions.
A comparison of Figure 8b and Figure 9b reveals a pronounced distinction in buoy-measured SSH between calm and complex sea states. The amplitude of SSH fluctuations around the mean level is significantly smaller under calm conditions than during complex sea states. The power spectra of the high-frequency components filtered from the SSH time series using the predefined low-pass filtering thresholds are presented in Figure 9c.
Contrasting Figure 9c with Figure 8c reveals significant spectral divergence: while Figure 8c exhibits high-frequency SSH energy approaching 0 dB, Figure 9c demonstrates substantial attenuation well below 0 dB. Notably on DOY 172–173, the peak high-frequency signals register below −10 dB. As shown in Figure 9c, the emergence of pronounced 0.15 Hz spectral energy on DOY 174 indicates increasing wind-wave activity. Distinct spectral band distribution patterns are observed between the figures: Figure 8c (complex sea state) displays significant high-frequency energy below 0.1 Hz, whereas Figure 9c shows high-frequency SSH components predominantly above 0.1 Hz.
Previous sectional analyses deliberately segregated three-day observation data under “complex” versus “calm” sea states to characterize buoy-measured SSH signatures. Herein, we conduct an integrated analysis of the entire experimental period (excluding DOY 170 and 178 due to instrument malfunctions).
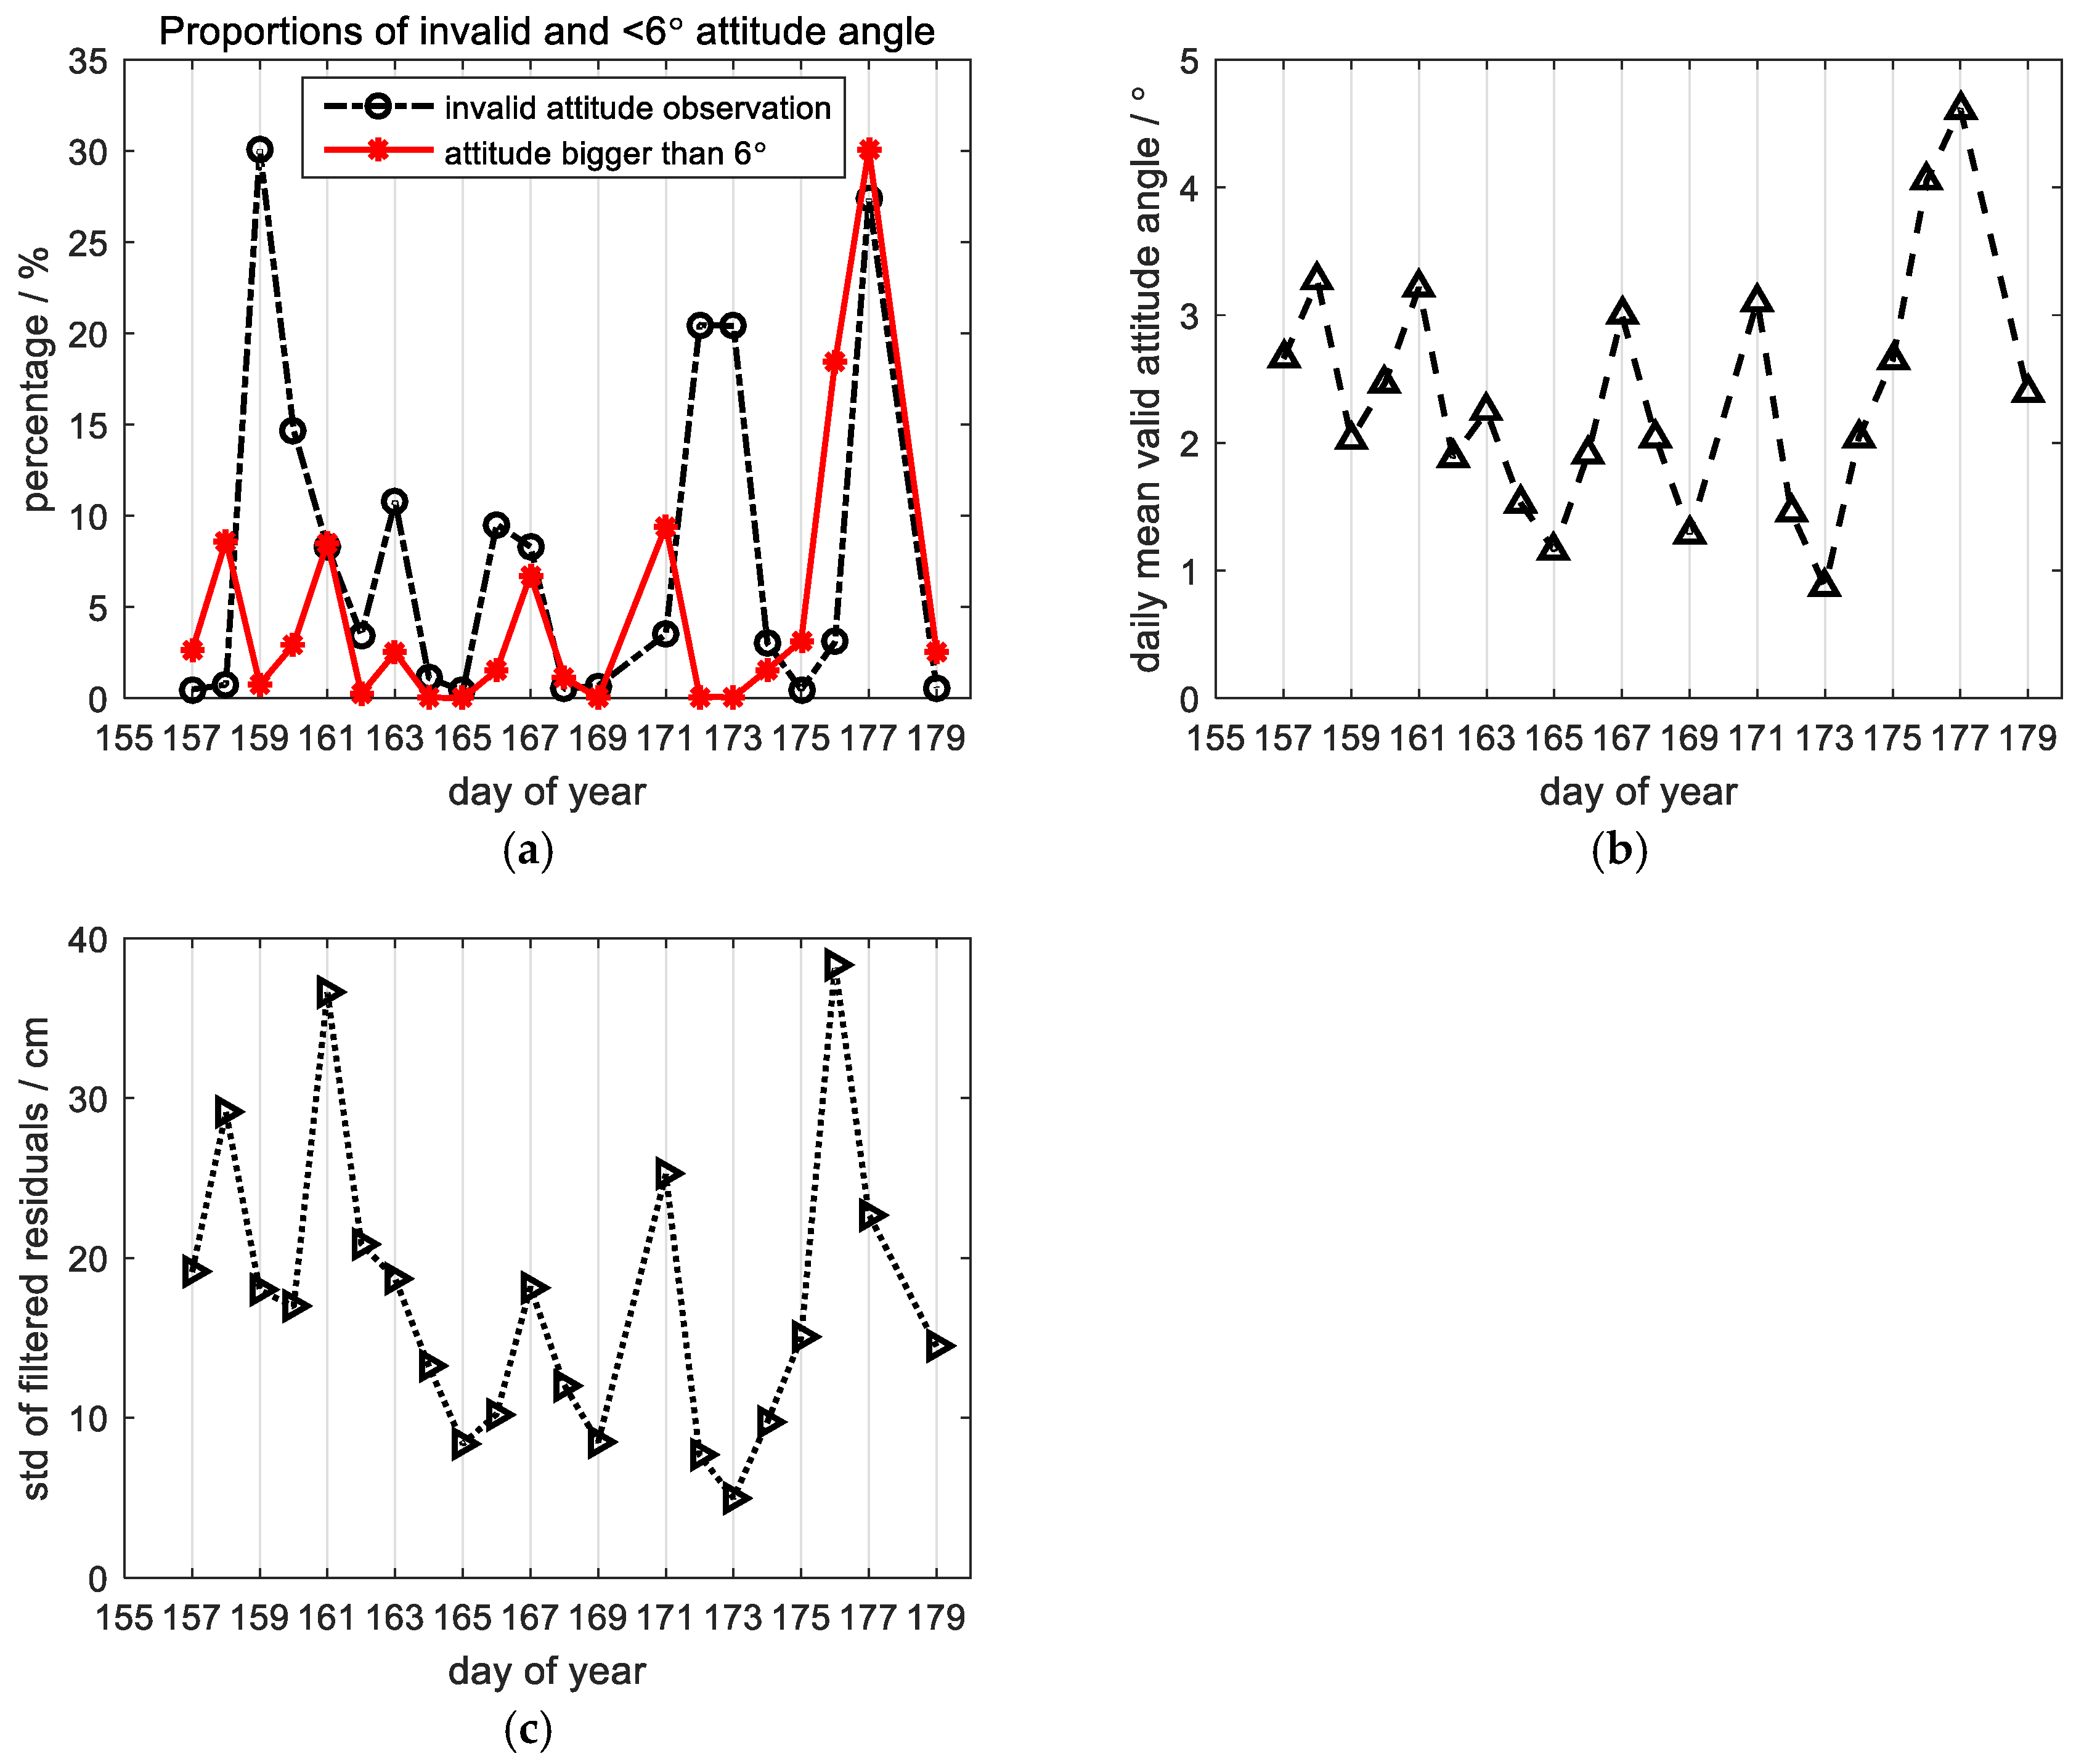
Figure 10a displays the daily time series of two data validity metrics during the experimental period: (1) the invalid attitude proportion, defined as the percentage of observations rejected due to either system-invalid measurements (e.g., loss of satellite lock, kinematic solution failure) or attitude angles exceeding 10°, and (2) the >6° attitude proportion, representing the percentage of observations with tilt angles greater than 6° within the subset of valid observations (attitude angles ≤10°). Figure 10b presents the daily mean valid attitude angle time series, calculated from those valid sub-10° observations. Figure 10c further shows the temporal evolution of the daily averaged standard deviation of the filtering residuals across the measurement campaign.
In Figure 10a, the daily proportion of invalid attitude angles primarily reflects data observation quality. Missing observations stem from two sources: complex sea states and instrument malfunctions. Figure 10b demonstrates that the mean valid attitude angles exhibit inverse correlation with the proportion of >6° attitude angles in Figure 10a: a decrease in large-angle occurrences (>6°) corresponds to reduced mean attitude values. Figure 10c reveals highly synchronized trends between daily averaged filtering residual standard deviations and mean valid attitude angles. This pattern evidences the coherent impact of wind-wave dynamics on both buoy attitude disturbances and sea surface height variations. Welch power spectra of GNSS-measured sea surface height residuals (pre- vs. post-low-pass-filtering) during the experimental period are presented in Figure 11.

4.2. Mooring Array Data Processing

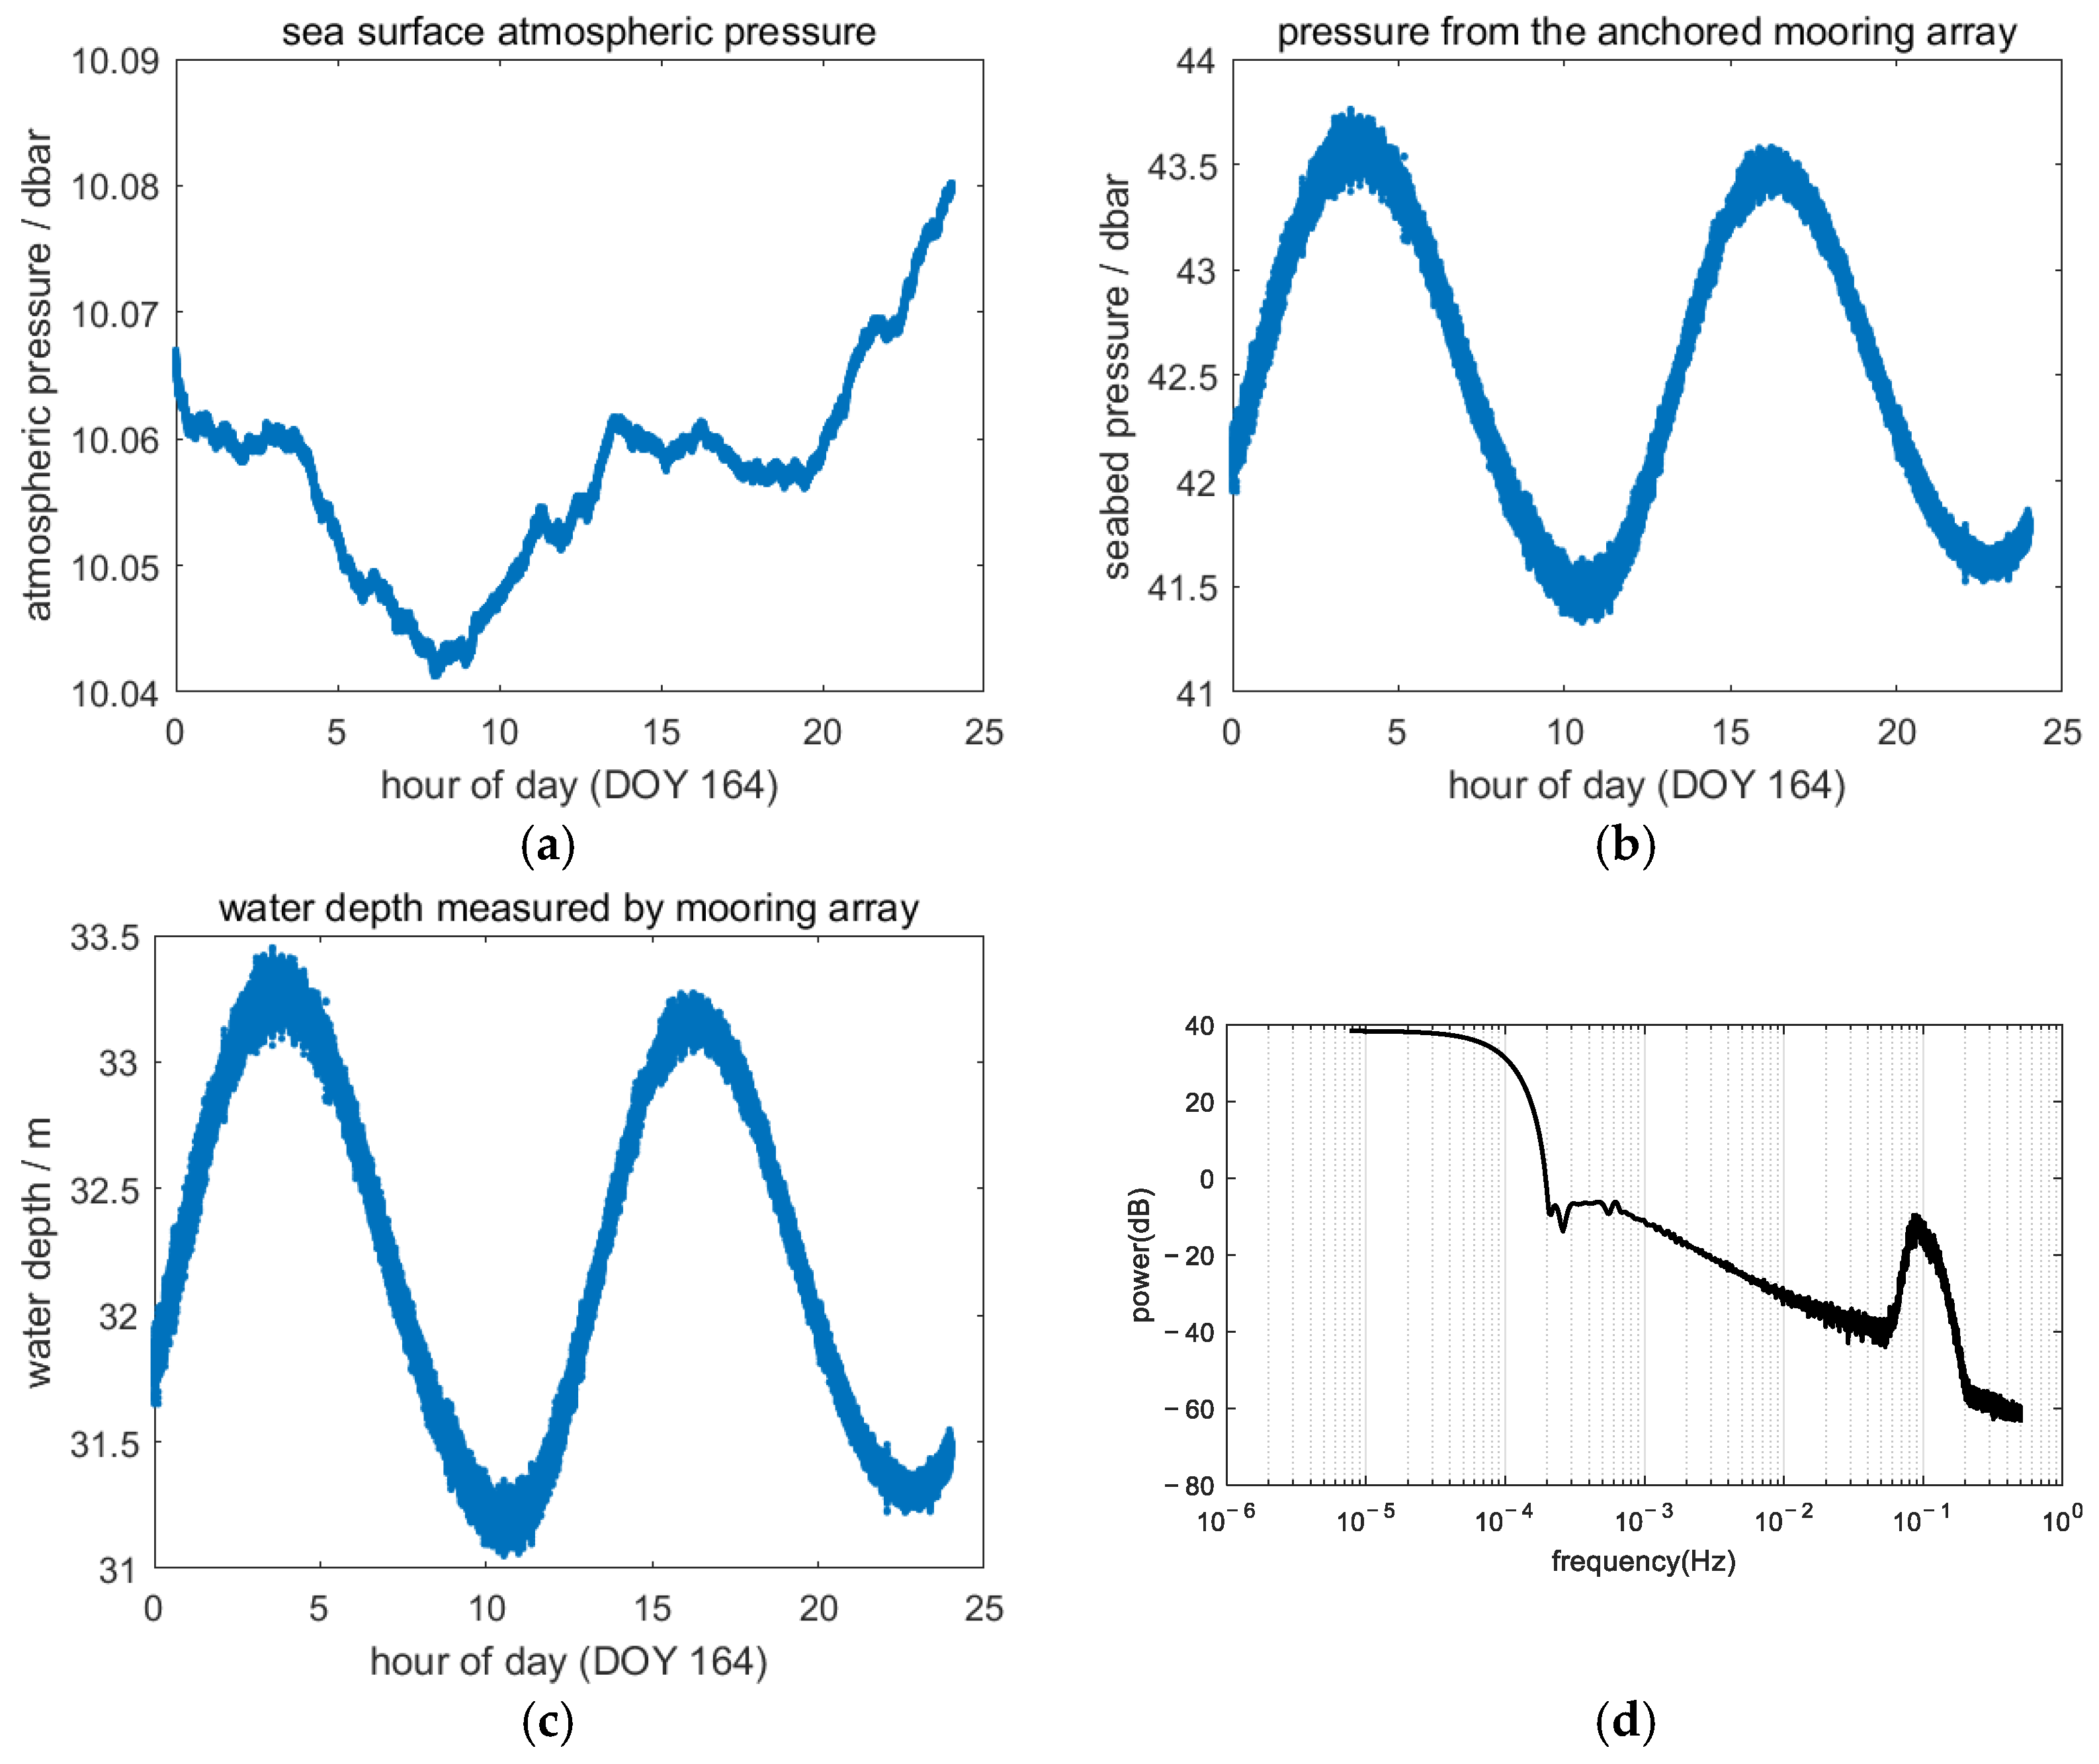
Taking DOY 164 as an example, the anchored mooring array provides concurrent time series measurements of sea-level atmospheric pressure and seabed pressure, as shown in Figure 12a and Figure 12b, respectively.
The water depth variation series derived from the differential pressure (seabed pressure minus atmospheric pressure) is presented in Figure 12c. This figure demonstrates that maximum water depth changes in the observation area did not exceed 2.5 m on this day.
Figure 12a reveals that sea-level atmospheric pressure in the experimental area, exhibited minimal variation, with a maximum amplitude of approximately 0.04 dbar. Figure 12b shows that seabed pressure displayed a bimodal change pattern throughout the day, reaching maximum variations exceeding 2 dbar.
Power spectral analysis was performed on the mooring-measured depth variations shown in Figure 12c. The resulting power spectrum after removing the temporal mean of the depth measurements is presented in Figure 12d.
Cross-examination of the power spectra for water depth variations measured concurrently by two approaches (Figure 12d vs. Figure 6a) reveals significant consistency between GNSS buoy-derived sea-surface height anomalies and mooring-measured depth variations. Both techniques resolve strong signals near 0.1 Hz, suggesting prominent surface gravity waves with approximately 10 s periods during the observational period. Moreover, the GNSS buoy detects surface signals exceeding 0.2 Hz, whereas pressure sensors at the seabed exhibit substantially attenuated responses above 0.2 Hz. This indicates high-frequency surface waves experience hydrodynamic attenuation through the water column. Figure 6b demonstrates that high-frequency sea-surface fluctuations recorded by the buoy range up to ~1 m in amplitude, while mooring-measured depth variations in Figure 12c show reduced amplitudes of ~0.5 m.
Given that the spectral coherence between low-frequency components of the mooring data and the GNSS record, consistent low-pass filtering parameters were applied to both datasets. The filter cutoff frequency was set to 0.01 Hz with filter order optimized to predefined design specifications. Figure 13a displays residuals between raw and filtered depth, with the Welch power spectra in Figure 13b.
Contrasting Figure 13a with Figure 7a shows that the amplitude of high-frequency variations in sea-surface height measured by the mooring array is significantly smaller than that of the GNSS buoy. Comparison between Figure 7b and Figure 13b more distinctly reveals the disparity in sea-surface height variation signals measured at the seabed versus the surface. Specifically, GNSS buoy measurements of sea-surface height contain signals around 0.5 Hz, corresponding to high-frequency surface waves, whereas moored-array measurements of sea-surface height lack signals in this frequency range.
Solely from Figure 7a and Figure 13a, it is evident that the amplitude of water depth variation signals near 0.1 Hz gradually decreased that day, reflecting diminishing amplitudes of long-period swells and a gradual calming of sea conditions. This phenomenon is not observable in Figure 7a, where GNSS buoy measurements of sea-surface height variations near 0.1 Hz are masked by higher-amplitude high-frequency signals. Consequently, seabed-deployed sensors provide clearer insights into the evolution of mean change in sea surface height.
Based on single-day measurements from the mooring array and buoy, the procedure for calculating the height datum of the mooring array measurements is illustrated in Figure 14.
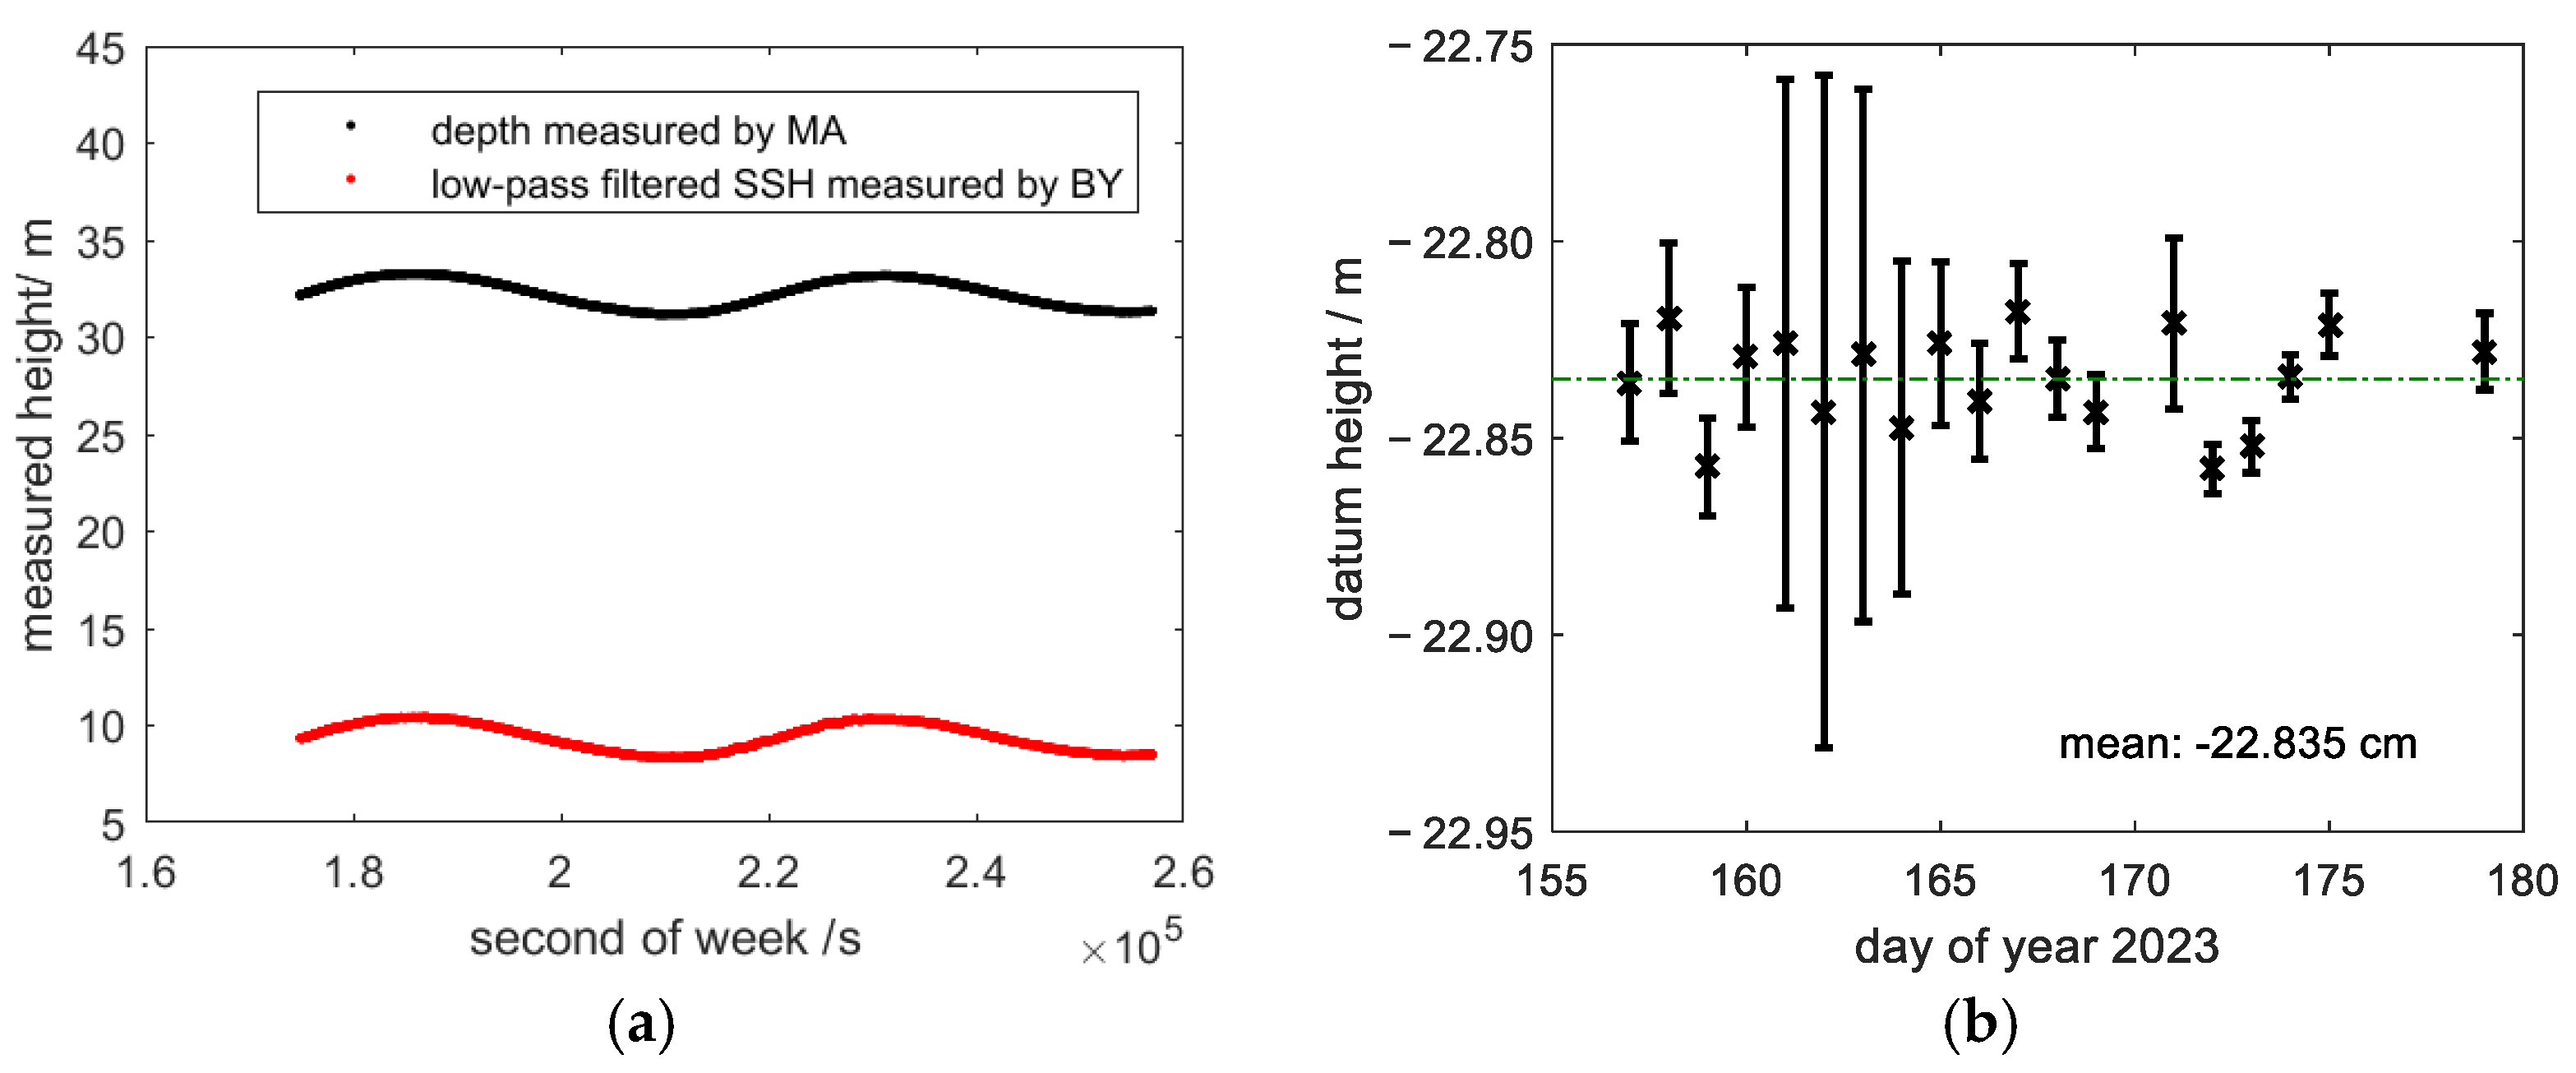
By temporally aligning the raw depth measurements from the mooring array with the low-pass-filtered mean sea-surface height values obtained from the GNSS buoy (as shown in Figure 6b), and subsequently excluding the initial 2000 s and final 2000 s of the synchronized time series to mitigate boundary effects introduced by the buoy’s low-pass filtering process (shown in Figure 15a), the seabed height datum was determined to be −22.847 m—establishing the precise geodetic elevation of the mooring array’s depth measurement zero-reference point within the specified reference frame.
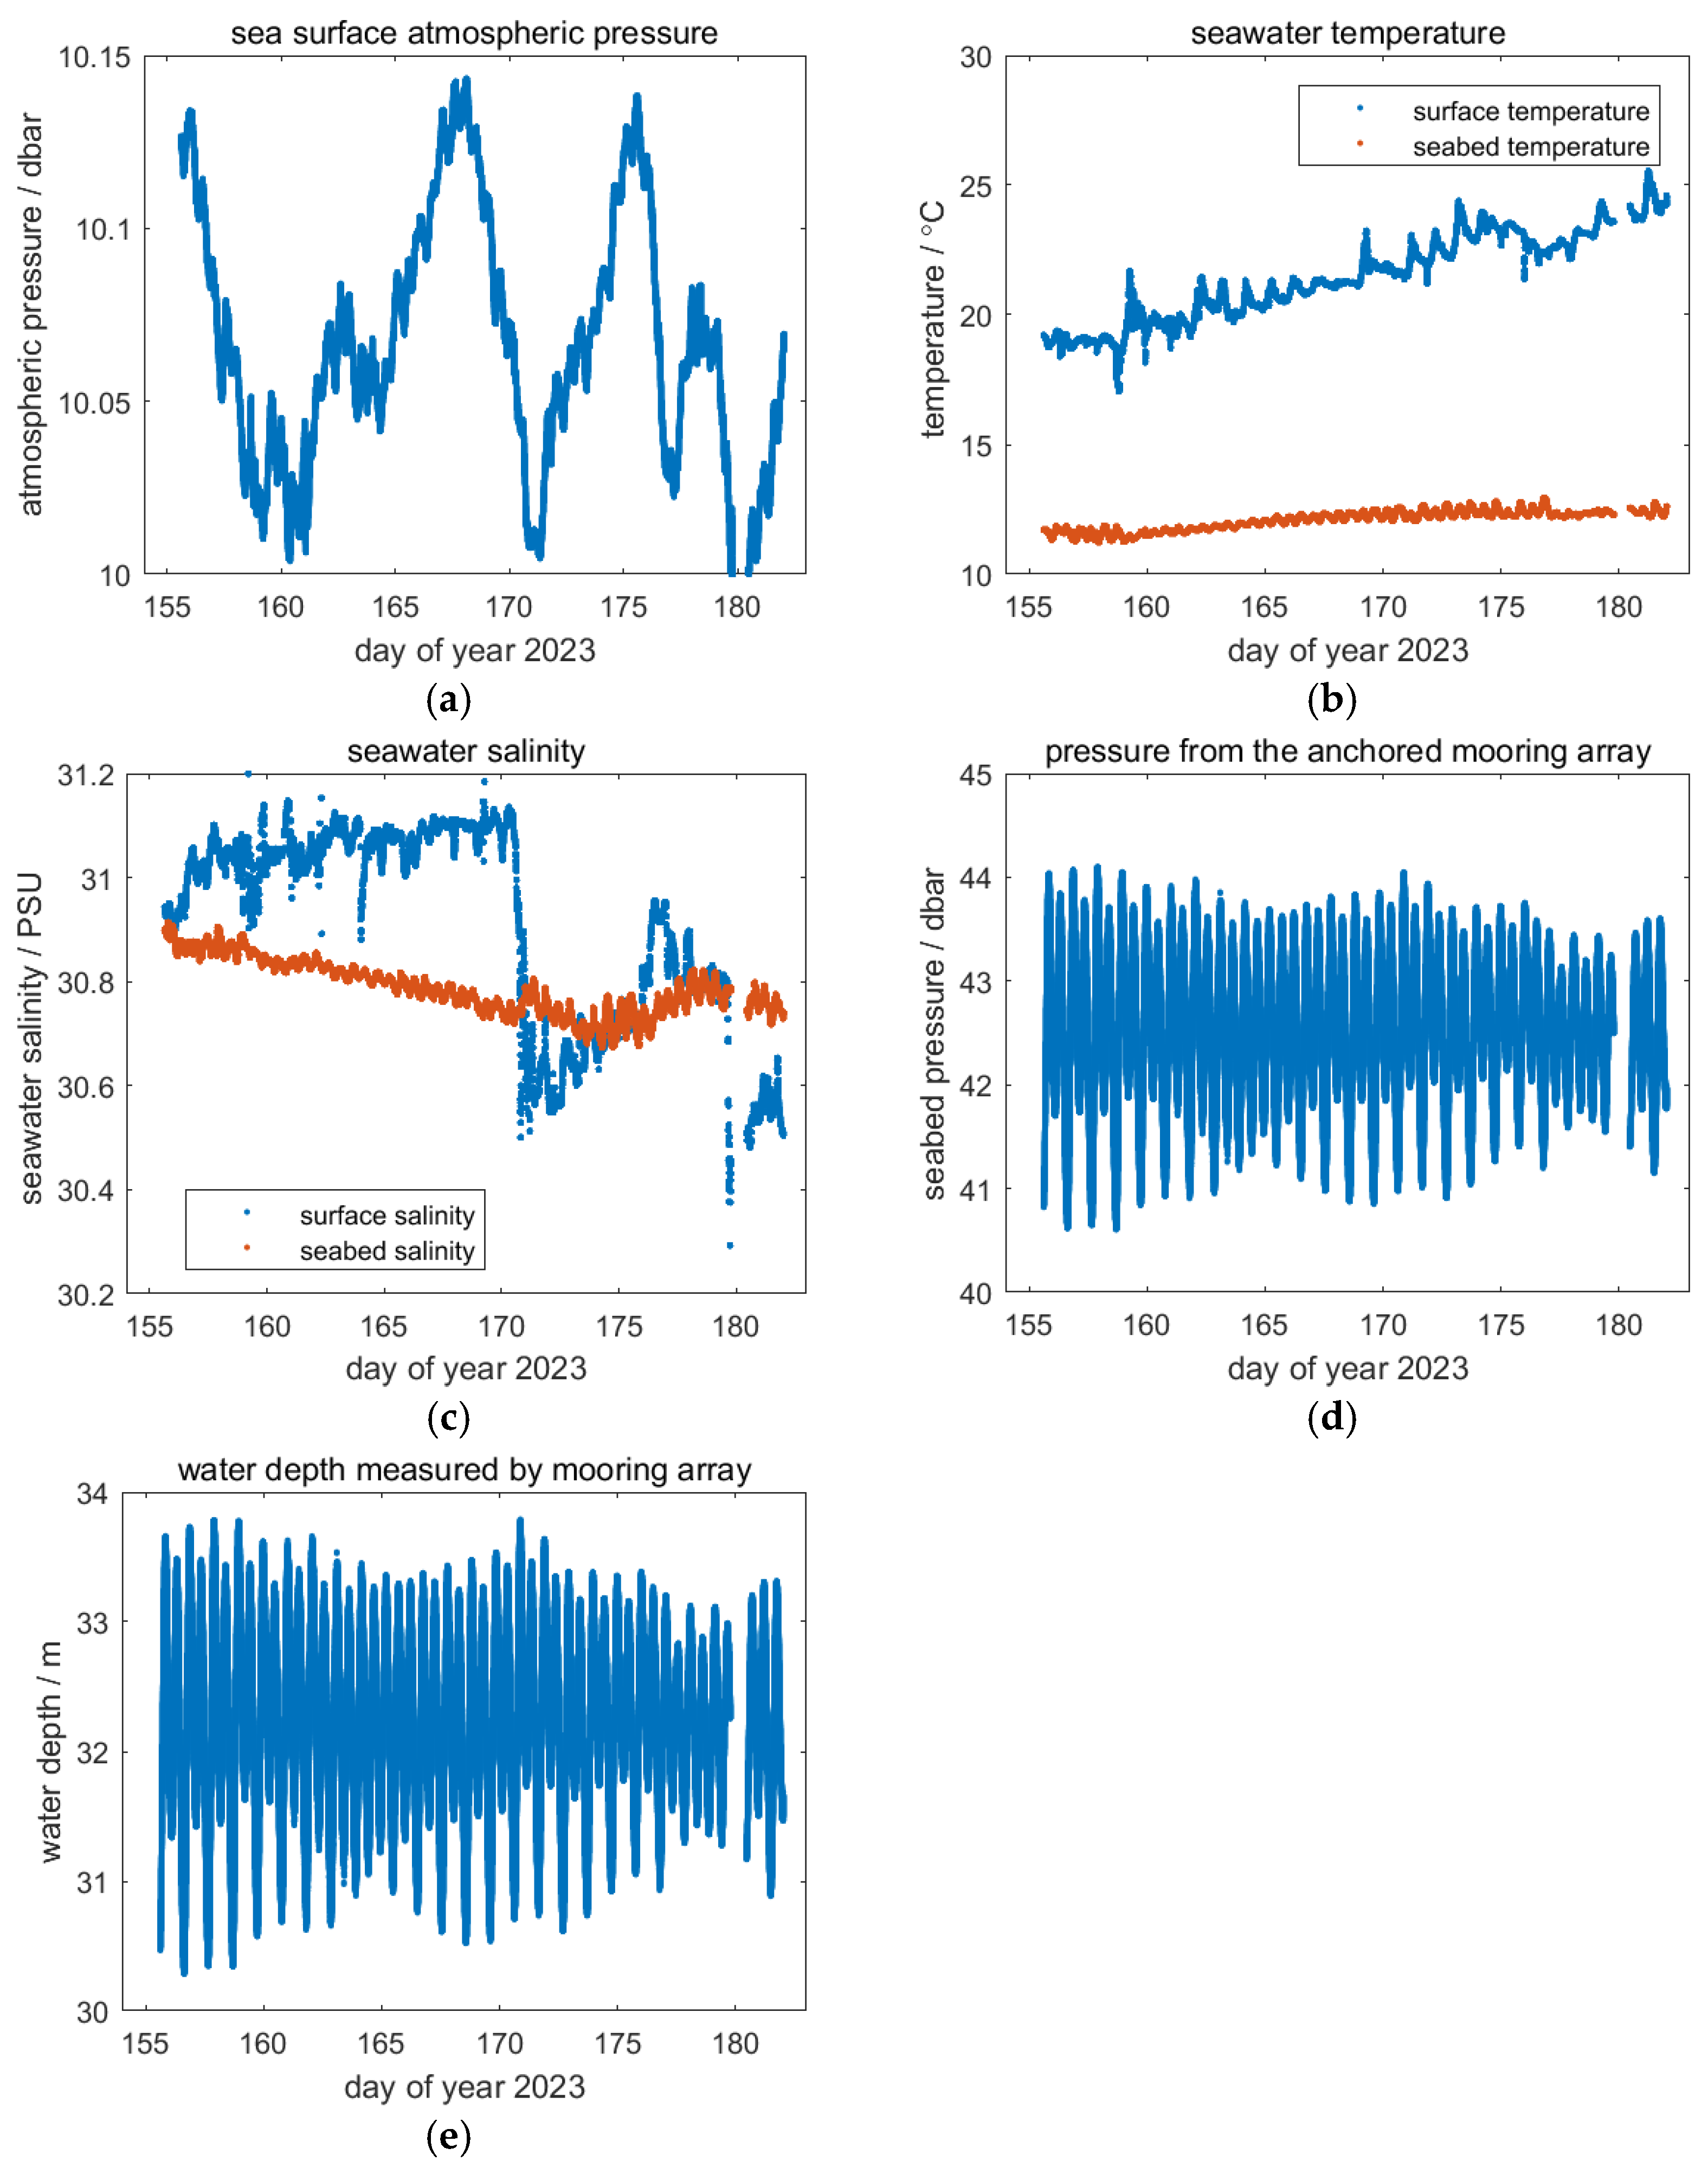
Observation data from the mooring array were primarily continuous, with sporadic seabed measurement failures due to equipment malfunctions. Ocean surface pressure, sea surface/seabed temperatures, sea surface/seabed salinities, seabed pressure, and sea depth measured by the mooring array during DOY 155 to DOY 182 are illustrated in Figure 16.
Figure 16a reveals that atmospheric pressure at sea surface exhibited relatively low-frequency variations during 28 days of continuous observation, with fluctuation amplitudes confined within 0.15 dbar (15 mbar). Figure 16b demonstrates comparatively minor temperature variations in seafloor waters at ~30 m depth. Over the monitoring period, near-bottom temperatures displayed a gradual warming trend not exceeding 1 °C, while sea surface temperatures showed a more substantial increase of approximately 4 °C. Figure 16c documents divergent salinity behaviors: bottom-layer salinity remained stable, whereas surface salinity underwent two abrupt declines. Temporally, these sharp salinity reductions appear correlated with sea surface pressure anomalies, likely attributable to rainfall events.
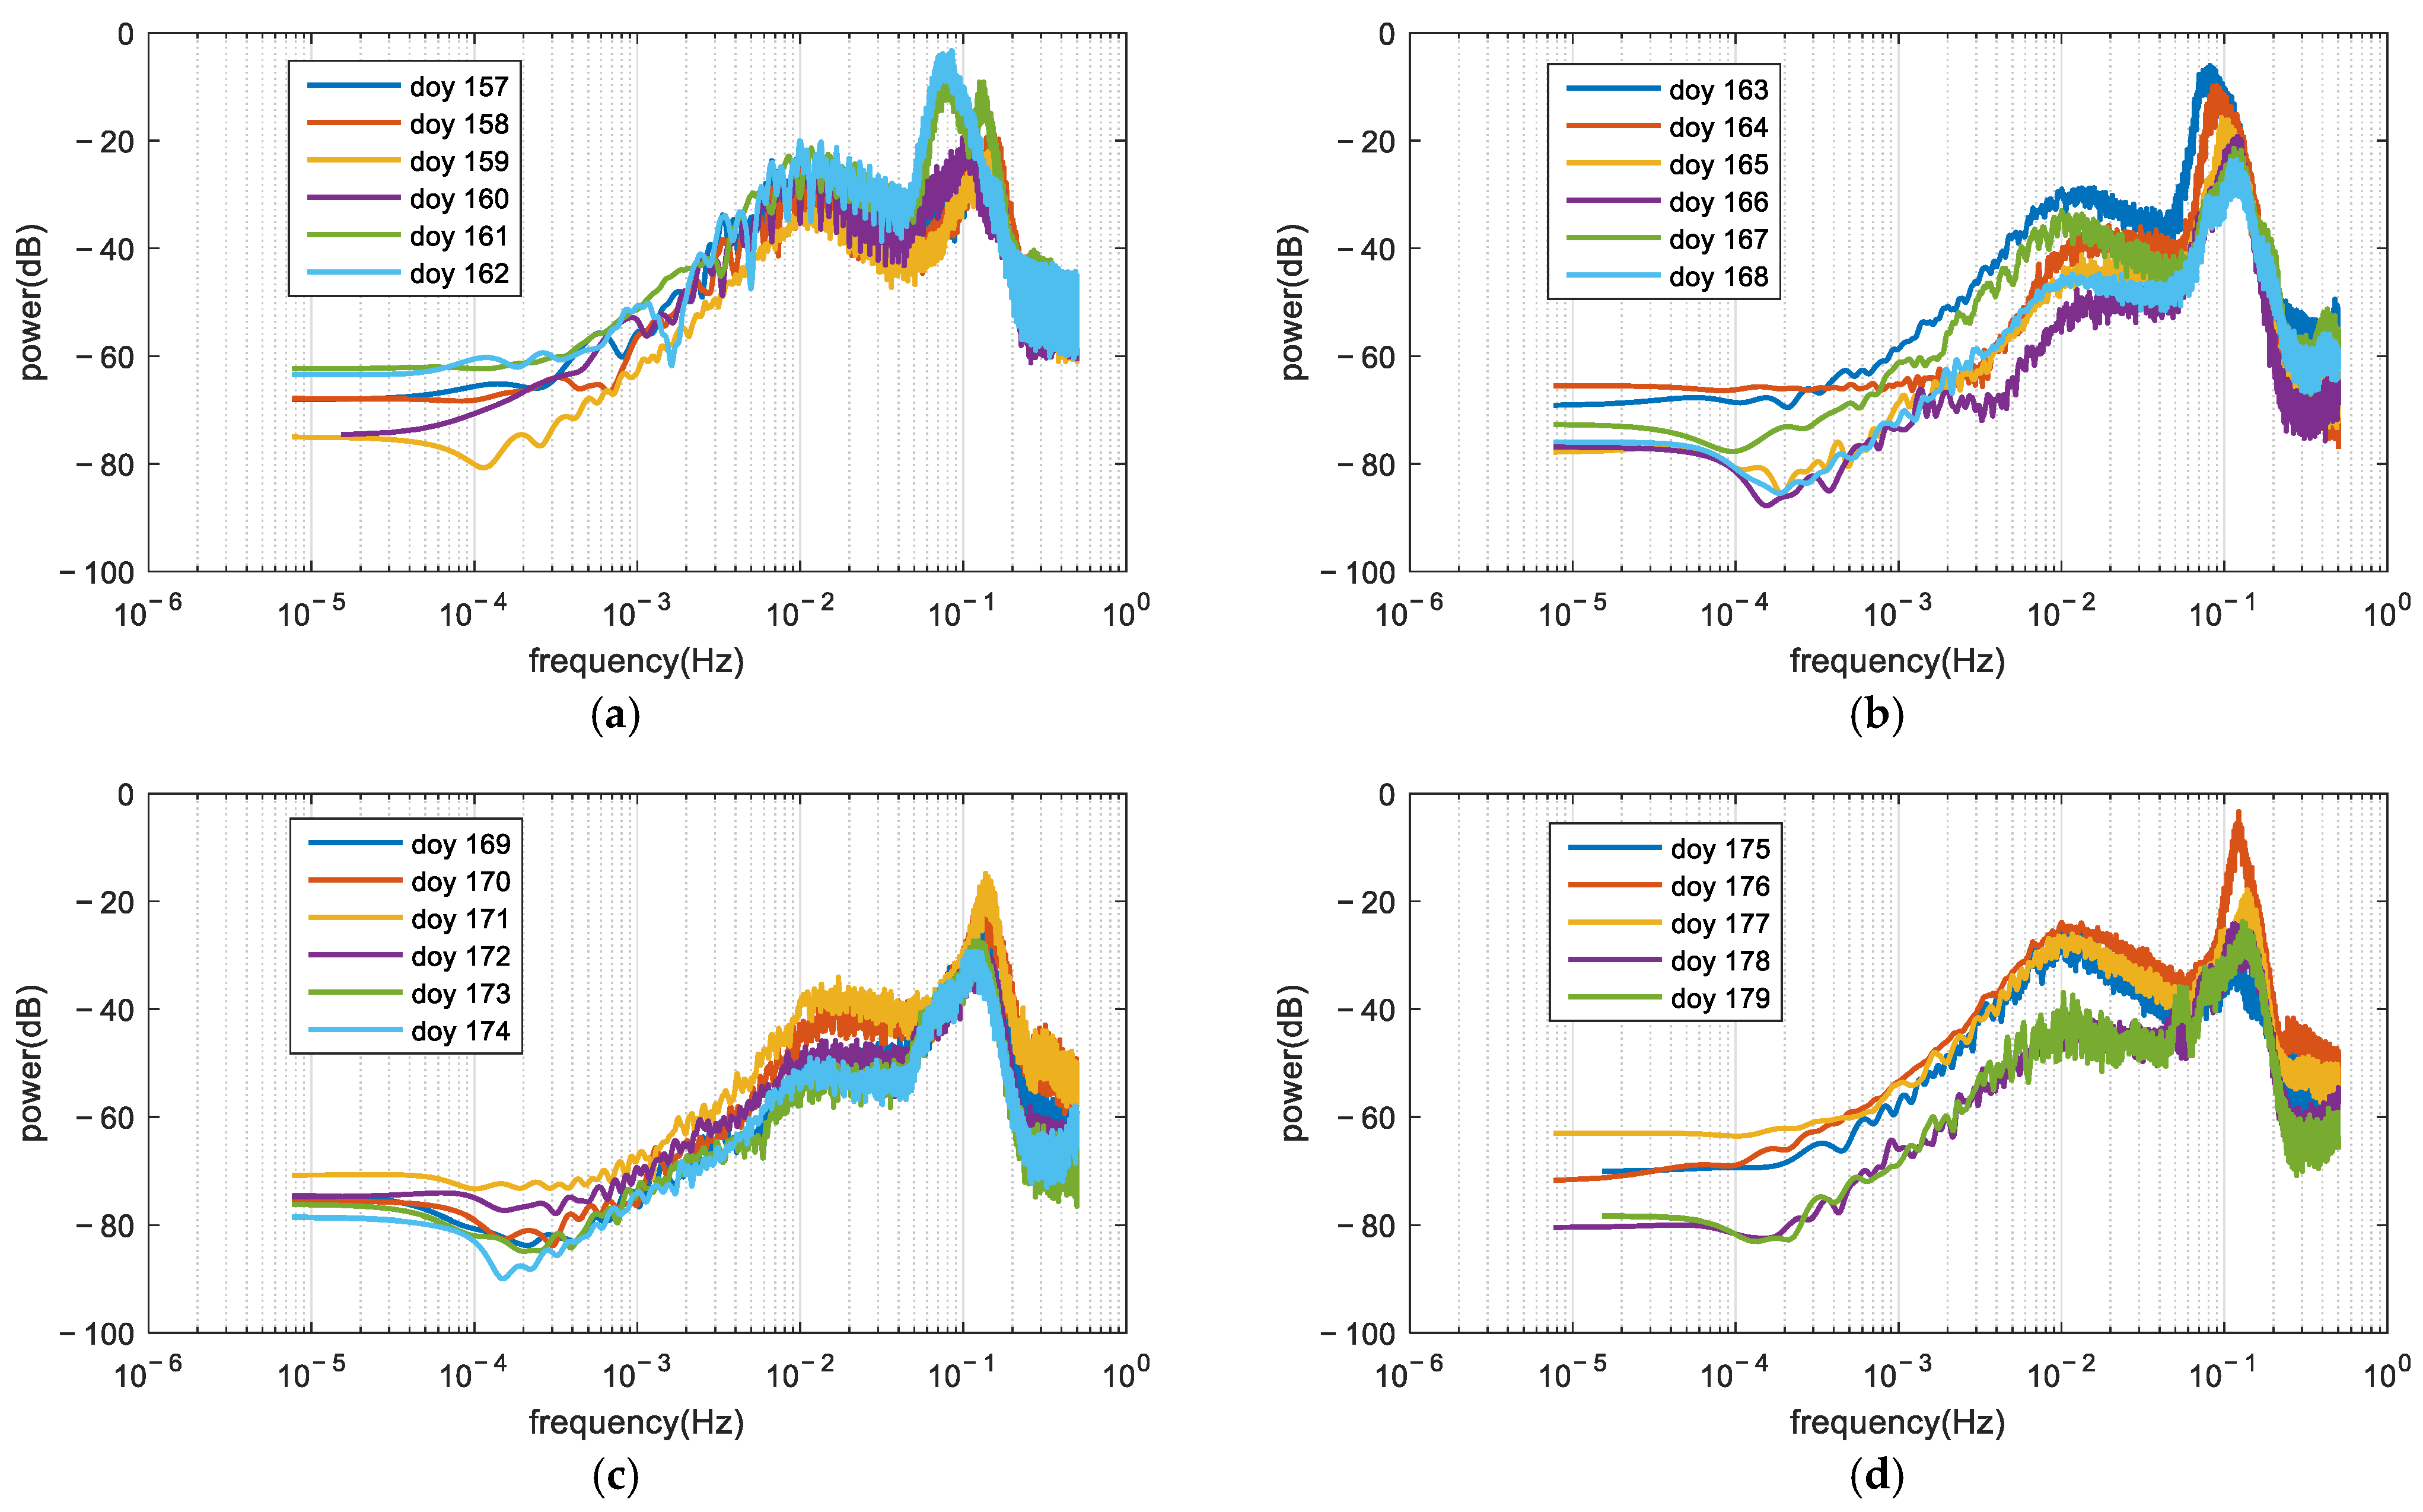
Through the processing of above observations, the Welch power spectrum of the residual series derived from mooring array sea-surface height measurements before and after low-pass filtering is shown in Figure 17. Comparison between Figure 11 and Figure 17 shows the distinction of high-frequency SSH signals measured by GNSS buoy and mooring array.
Comparative analysis between Figure 11 and Figure 17 demonstrates discernible differences in the power spectra of high-frequency sea surface height signals captured by the mooring array versus GNSS buoys. This divergence manifests both in the characteristic distribution intervals during specific periods referenced in prior analysis and the notably concentrated spectral distribution of mooring array measurements, exemplified by the pronounced spectral peak near 0.1 Hz in Figure 17. Furthermore, as previously documented, the mooring array registers substantially weaker energy intensity in high-frequency signal bands compared to GNSS buoy observations.
Through the comparison of synchronous observations from mooring array and GNSS buoy, the seabed height datum calculated from each day is shown in Figure 15b. The cross symbol ‘X’ in the diagram denotes the daily computed datum value for the mooring array, with the corresponding error bars representing the standard deviation of residuals from depth measurements before and after filtering. These values collectively serve as indicators of the sea state conditions observed by the mooring array during the measurement period. Through the calculation of mean value of height datum of each day, the final height datum is −22.835 m, shown as the green line in Figure 15b.

4.3. Consistency Analysis of Synchronous Sea Surface Height Measurements Between GNSS Buoy and Mooring Array

Using observational data of DOY 164, raw depth measurements from the mooring array after datum unification and its low-pass filtered values were compared with low-pass filtered GNSS buoy SSH measurements, presented in Figure 18b. Considering the edge effects from low-pass filtering GNSS-derived SSH, data from the first and last 2000 s of each day were excluded.
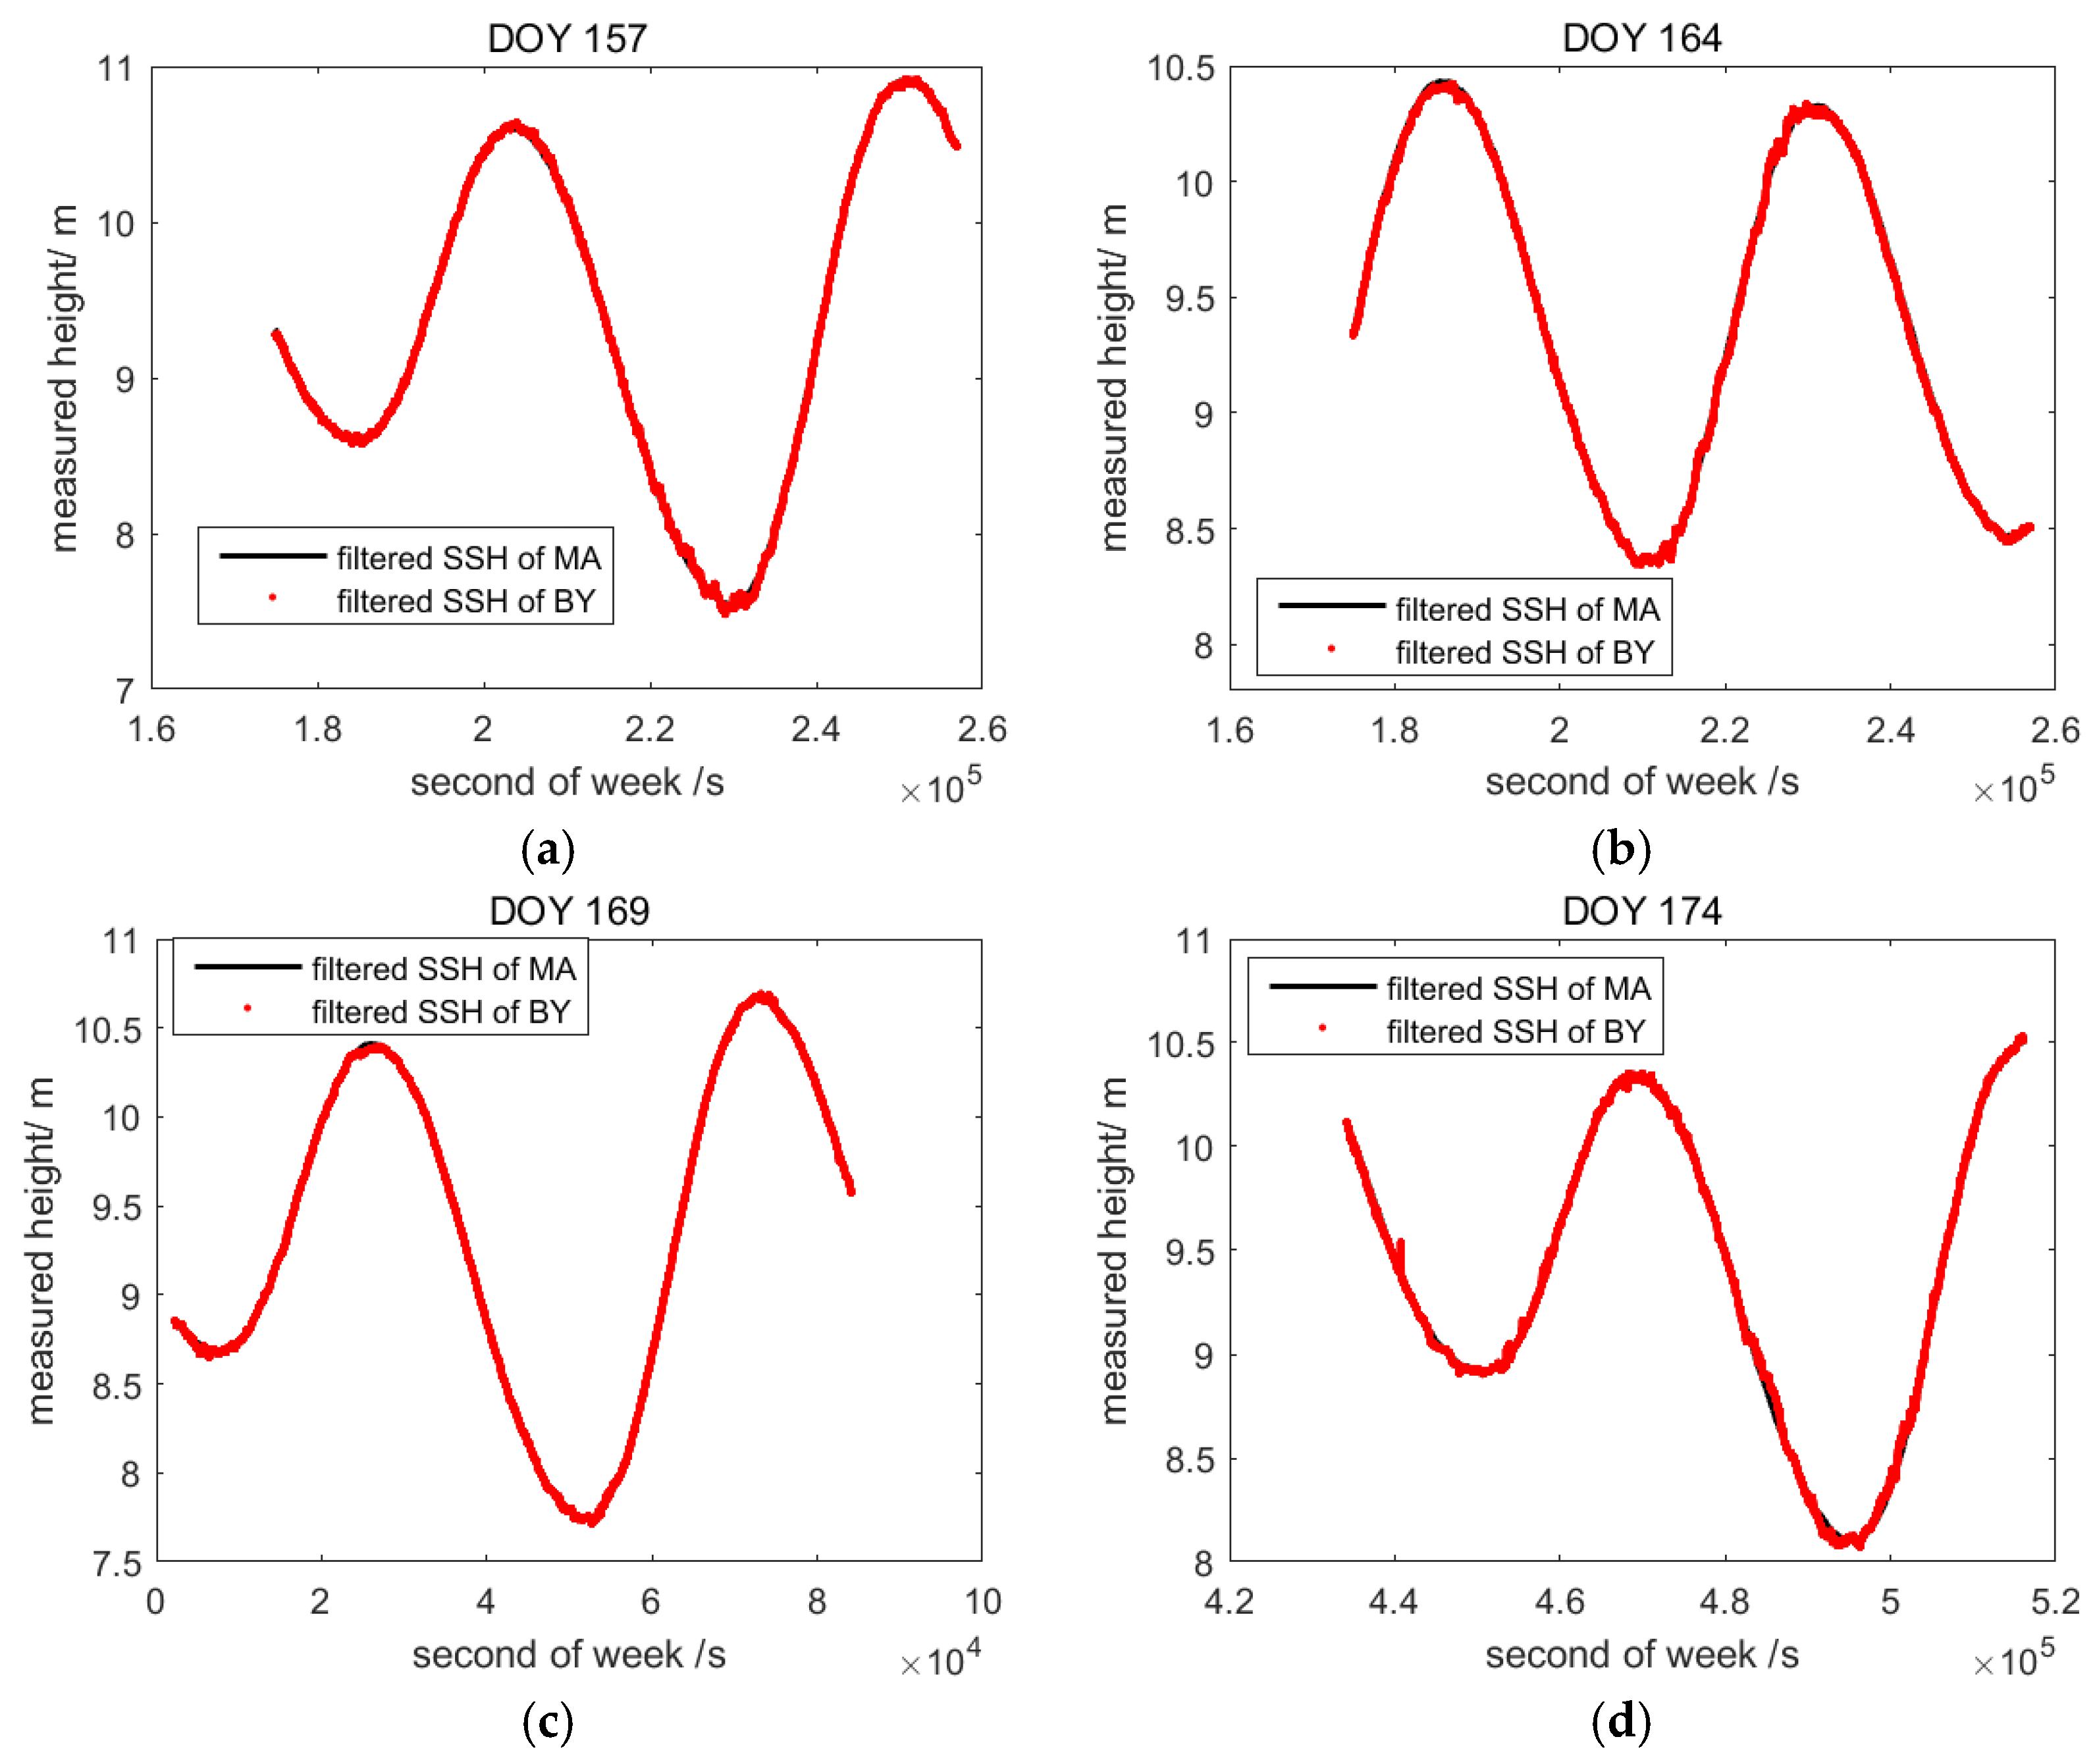
Figure 18b reveals a strong agreement between mooring array and GNSS buoy SSH measurements, indicating that both systems provide generally valid SSH data. By examining the detailed variations in Figure 18b, it is observed that the low-pass filtered time series from both platforms exhibit tight coupling. The deviation series between them is presented in Figure 19b, with a standard deviation of approximately 1.96 cm.
In the application of altimetry satellite calibration, the mean sea surface height measure by in situ instruments is used to compare with altimetry sea surface height. As so, the low-pass filtered SSH observed by GNSS buoy and mooring array are mainly compared with each other.
Given the sea-state complexity and seafloor bathymetry variations, the observed ~2 cm standard deviation in SSH differences is deemed physically realistic and meets satellite altimeter calibration requirements. This measurement consistency validates the data quality from both platforms.
The low-pass filtered SSH measurements from mooring array and GNSS buoy of DOY 157, 169, and 174 are shown in Figure 18a,c,d, while the differential value is shown in Figure 19a,c,d. Figure 19e displays the time series of daily mean value and standard deviations of differential low-pass filtered SSH during the experimental period. The range of daily standard deviations is 1.15 cm to 3.91 cm, while the mean value of these standard deviations is 2.76 cm. It is noteworthy that the standard deviations of the differential series obtained in this study are specific to the experimental sea area. Should the equipment be deployed in a different location, the discrepancy between the observations from the mooring array and the GNSS buoy would likely vary due to differences in sea state conditions and the specific observational environment.
Owing to its comparatively simpler error sources for random sea surface height measurements and near-immunity to sea state variations, the mooring array’s observational errors exhibit white noise characteristics. Consequently, the discrepancies in sea surface height measurements between GNSS buoys and the mooring array presented in Figure 19 primarily reflect the measurement errors inherent to the GNSS buoy system.
As shown in Figure 18 and Figure 19, the observations of mooring array could better reflect the variation in mean sea surface height. Observations from the GNSS buoy are less effective at capturing the mean SSH variation compared to the precision of the mooring array, due to processing limitations or observation quality. This discrepancy is mainly evident in the variation in low-pass filtered SSH. The stability of these two structures is demonstrated, and the effectiveness of these two designs is confirmed by the consistency of synchronous SSH measurements.

4.4. Error Budget

Based on the aforementioned experimental findings, an error budget analysis is conducted for sea surface height measurements obtained from both instruments. Following the error budget work established in reference [34], measurement errors are categorized into two primary classes: fixed (systematic) and variable (quasi-random). The error budget analysis presented herein specifically addresses the local-area mean sea surface height—which serves as the reference for satellite altimetry calibration using in situ measurements—as different from instantaneous sea surface heights measured by the two systems. The comprehensive error budgets for mean sea surface height acquired by dual instruments are summarized in Table 2.
The GNSS buoy exhibits a systematic error of approximately 11 mm in measuring the mean sea surface height, with a random error of 24 mm. For the mooring array, the sea depth measurement (depthM) carries a random error of 9 mm, while its height datum (DatumM) transferred from the GNSS buoy retains the same 11 mm systematic uncertainty. Through synchronized GNSS buoy and mooring array observations accounting for sea-state variability—where 6-hourly synchronized measurements constitute independent observational units—the random error of DatumM is reduced to ~3 mm via 84 repeated observations over 21 days. Consequently, the total error in the mean sea surface height (SSHM) measured by the mooring array synthesizes depthM and DatumM uncertainties, yielding projected systematic and random errors of 11 mm and 9 mm, respectively.
Given their shared height datum, the mean sea surface height measurements obtained from the mooring array and GNSS buoy systems demonstrate negligible systematic deviation. Consequently, the observed discrepancy between these two mean sea surface height datasets is exclusively attributable to statistically independent random errors. As quantified in Table 2, the uncertainty of differential mean sea surface height is derived as the root-sum-square value of the random errors for SSHBuoy and SSHM, calculated as sqrt(242 + 92) = 25.6 mm. This result demonstrates strong agreement with the experimental mean standard deviation of 27.6 mm (2.76 cm), validating the theoretical error synthesis model within acceptable geophysical uncertainty thresholds.
As shown in Table 2, the integrated calibration system comprising the GNSS buoy and mooring array configuration adequately supports the requirements for calibrating SSH measurements from ocean altimetry satellites. Notably, sea surface height measurements from the mooring array achieve a random error of 9 mm per single satellite pass, validating its precision for calibration operations.

5. Discussion

Ocean altimetry satellite calibration sites employ different instruments and methodologies, each presenting distinct technological challenges. Calibration tasks like those at the Harvest calibration site require ideally situated offshore fixed structures, while indirect calibration relying primarily on coastal tide gauges necessitates the development of high-precision regional geoid and tide models. The direct calibration method, using GNSS buoys or mooring arrays deployed at satellite ground track, demands highly accurate GNSS buoy systems.
This study focuses exclusively on direct methodologies for altimetry satellite calibration, conducting experimental research with GNSS buoys and mooring arrays. The adopted technical approach parallels that of the Bass calibration site, though it employs distinct GNSS buoy specifications as the primary differing factor. Furthermore, the selected experimental region demonstrates unique geographical attributes—the permanently operating Qianliyan GNSS reference station resides merely several kilometers from the GNSS buoy deployment points, far closer than the 20+ kilometer separation between coastal GNSS stations and buoy locations utilized at Bass Strait calibration site.
Within the integrated calibration strategy employing both GNSS buoys and mooring arrays, GNSS buoys assume critical importance by simultaneously determining sea surface height while providing elevation references for the mooring arrays. Historical deployments reveal operational constraints: GNSS zodiac utilized at the Corsica calibration site required daily repositioning through towing, while GNSS buoy deployed at Bass Strait still demonstrated limited deployment durations, typically 3–7 days. For optimal satellite altimetry calibration, next-generation GNSS buoys must deliver high-precision sea surface height measurement capabilities, extended operational endurance, and enhanced stability.
In this study, the multi-antenna GNSS buoy design retrofits existing large-scale ocean monitoring buoys, achieving extended operational endurance and high-accuracy sea surface height measurement capabilities without significantly increasing manufacturing costs. Compared to traditional GNSS buoys, the platform demonstrates superior attitude stability in identical sea states due to substantially reduced angular displacements afforded by its larger hull. This structural resilience confers critical advantages: enhanced observational continuity, mitigation of cycle slips/loss-of-lock anomalies caused by attitude variations, and improved robustness through multi-receiver redundancy that enables error identification and elimination of individual antenna inaccuracies.
Experimental results demonstrate that when employing combined GNSS buoy and mooring array calibration systems, primary reliance should be placed on mooring array data. This prioritization stems from critical performance differentials: under conditions of heightened data dispersion between buoy and array measurements, mooring arrays maintain nearly unaffected measurement performance despite sea state fluctuations, whereas GNSS buoys exhibit amplified errors due to exacerbated multipath effects and attitude inaccuracies during severe sea conditions. Nonetheless, the GNSS buoy’s role in providing the fundamental height datum for the mooring array remains an indispensable functional element within this integrated configuration.
Based on the error budget analysis in Section 4.4 and considering the collaborative mode between the GNSS buoy and the mooring array, the primary contribution of the GNSS buoy should be to provide the height datum for the mooring array, while the main calibration work can be accomplished by the mooring array itself. After the GNSS buoy and the mooring array complete synchronized observations to determine the latter’s height datum, the GNSS buoy can be retrieved. A synchronized observation period of at least 30 days is recommended. Subsequent satellite calibration can then be performed relying solely on the mooring array. This approach avoids potential issues associated with long-term GNSS buoy deployment, such as biofouling on the submerged surfaces. In this scenario, the primary challenge becomes the endurance of the mooring array. Increasing the mooring array’s endurance from the current 180 days to 360 days or longer is one viable solution. Alternatively, employing two sets of mooring arrays to successively continue the calibration mission can be considered. To ensure a unified height datum between the successive arrays, this can be achieved through a synchronized observation period of no less than 30 days between the outgoing and incoming arrays. Another option is to redeploy a GNSS buoy during the deployment period of the second mooring array, combined with the observations from that second array.
Future research should prioritize comprehensive testing of mooring array depth measurement stability. Notably, prolonged thermohaline variations in seawater may significantly affect sea surface height estimates—an impact that has been inadequately assessed in current experiments due to limited observational durations. Should progressive drift exist within array measurements over decadal scales, extended monitoring will be imperative to quantify its magnitude. Therefore, we recommend the following key improvement: integrating multi-layer thermosalinograph sensors at various depth horizons on the mooring array would significantly refine depth change calculations derived from hydrostatic pressure observations.
A secondary enhancement opportunity involves reducing the buoy’s antenna configuration to three units deployed in a triangular array with maximized baseline lengths. Given that GNSS-derived sea surface height errors induced by buoy attitude variations correlate with antenna reference point height, positioning the antennas at lower elevations can further diminish residual measurement errors after attitude correction, thereby improving sea surface height determination accuracy. Furthermore, integrating inertial sensor-based attitude determination systems would augment the platform’s motion monitoring capabilities.

6. Conclusions

To evaluate the practical effectiveness of multi-antenna GNSS buoy and mooring array for satellite altimeter calibration, experiments were conducted around Qianliyan islet of the Yellow Sea, China, in June 2023. Analysis was performed to demonstrate the feasibility of using both devices for calibrating ocean-observing satellite altimeters under varying sea conditions.
First, by processing the observation data from each device during the trial period, the consistency in SSH measurements between the GNSS buoy and the mooring array was compared. Considering the characteristics of the buoy and mooring array, this study designed and employed two different observation data processing workflows.
The results revealed different characteristics under calm and complex sea conditions. Under calm conditions, the daily average buoy attitude angle could be less than 1°, whereas under complex sea conditions, the daily average buoy attitude angle could exceed 3°. SSH measurement errors influenced by buoy attitude variations must be corrected for the requirements of centimeter-level ocean-observing satellite altimeter calibration. Through the spectral analysis of the SSH measurements from both devices, it was found that the dominant period of high-frequency SSH signals measured by the GNSS buoy and the mooring array was close to or less than 10 s. Therefore, the cutoff frequency of the FIR low-pass filter was set to 0.01 Hz, effectively filtering out the high-frequency components of the SSH variations. The power spectrum of the filtered-out signal portion displayed differences in SSH variations under different sea conditions.
Furthermore, through multi-day synchronous SSH observations by the mooring array and the GNSS buoy, the height datum for SSH variations measured by the mooring array was established. Synchronized analysis of the filtered SSH measurements from the mooring array and the GNSS buoy showed that the average standard deviation between their measurement results was approximately 2.76 cm, with their consistency indicating the effectiveness of the system design and data processing scheme. The combination of the two devices can be effectively applied to the calibration of ocean-observing satellite altimeters. While the 2.76 cm consistency is encouraging, longer tests under diverse sea states are required before generalizing these error levels.
However, the instantaneous SSH difference between the two devices could reach several centimeters. These results indicate that the mooring array could better reflect the variations in mean SSH, while the GNSS buoy was not able to reflect the variations in mean SSH with the accuracy of the mooring array throughout all periods. This is primarily manifested in the difference changes in the low-pass filtered SSH sequences measured by both devices. Considering that the mooring array measures SSH relatively more accurately, when both devices are used simultaneously for calibration work, relatively higher weighting should be assigned to the calibration results from the mooring array, with approximately 75% weight given to the mooring array and the remainder to the GNSS buoy. It is also recommended that the proposed GNSS buoy system not be used under complex sea conditions (such as when significant wave heights exceed 4 m).

Author Contributions

Conceptualization, B.G. and Z.S.; methodology, B.G. and Z.S.; software, Z.Z., X.L., and M.O.; validation, L.H. and Z.H.; formal analysis, H.H., Z.Z., and J.M.; investigation, Z.H. and X.X.; resources, B.G.; data curation, Z.Z. and X.L.; writing—original draft preparation, B.G. and H.H.; writing—review and editing, B.G., H.H., and Z.S.; visualization, B.G., M.Z., and L.Y.; supervision, Z.S.; project administration, Z.S.; funding acquisition, Z.S. All authors have read and agreed to the published version of the manuscript.

Funding

This research was funded by National Natural Science Foundation of China (grant number 42174001 and 42204002) and Open fund of State Key Laboratory of Spatial Datum (SKLGIE2023-ZZ-5; SKLGIE2024-ZZ-3). The APC was funded by SKLGIE2024-ZZ-3.

Data Availability Statement

The raw data supporting the conclusions of this article will be made available by the authors on request.

Acknowledgments

Authors acknowledge the support of the State Key Laboratory of Spatial Datum, Xi’an Research Institute of Surveying and Mapping, National Key Laboratory of Intelligent Geospatial Information, National Space Science Center of Chinese Academy of Sciences, and First Institute of Oceanography of Ministry of Natural Resources.

Conflicts of Interest

The authors declare no conflicts of interest.

References

  1. Donlon, C.J.; Cullen, R.; Giulicchi, L.; Vuilleumier, P.; Francis, C.R.; Kuschnerus, M.; Simpson, W.; Bouridah, A.; Caleno, M.; Bertoni, R.; et al. The Copernicus Sentinel-6 mission: Enhanced continuity of satellite sea level measurements from space. Remote Sens. Environ. 2021, 258, 112395. [Google Scholar] [CrossRef]
  2. Abdalla, S.; Kolahchi, A.A.; Ablain, M.; Adusumilli, S.; Bhowmick, S.A.; Alou-Font, E.; Amarouche, L.; Andersen, O.B.; Antich, H.; Aouf, L.; et al. Altimetry for the future: Building on 25 years of progress. Adv. Space Res. 2021, 68, 319–363. [Google Scholar] [CrossRef]
  3. Verron, J.; Bonnefond, P.; Andersen, O.; Ardhuin, F.; Bergé-Nguyen, M.; Bhowmick, S.; Blumstein, D.; Boy, F.; Brodeau, L.; Crétaux, J.-F.; et al. The SARAL/AltiKa mission: A step forward to the future of altimetry. Adv. Space Res. 2021, 68, 808–828. [Google Scholar] [CrossRef]
  4. Sandwell, D.T.; Harper, H.; Tozer, B.; Smith, W.H. Gravity field recovery from geodetic altimeter missions. Adv. Space Res. 2021, 68, 1059–1072. [Google Scholar] [CrossRef]
  5. Zhu, C.; Guo, J.; Gao, J.; Liu, X.; Hwang, C.; Yu, S.; Yuan, J.; Ji, B.; Guan, B. Marine gravity determined frommulti-satellite GM/ERM altimeter data over the South China Sea: SCSGA V1.0. J. Geod. 2020, 94, 50. [Google Scholar] [CrossRef]
  6. Sandwell, D.T.; Müller, R.D.; Smith, W.H.F.; Garcia, E.; Francis, R. New global marine gravity model from CryoSat-2 and Jason-1 reveals buried tectonic structure. Science 2014, 346, 65–67. [Google Scholar] [CrossRef] [PubMed]
  7. Tozer, B.; Sandwell, D.T.; Smith, W.H.F.; Olson, C.; Beale, J.R.; Wessel, P. Global Bathymetry and Topography at 15 Arc Sec: SRTM15+. Earth Space Sci. 2019, 6, 1847–1864. [Google Scholar] [CrossRef]
  8. Marks, K.M.; Smith, W.H.F. A method of stacking AltiKa repeat cycle data that may reveal 75,000+ possible small seamounts. Earth Space Sci. 2018, 5, 964–969. [Google Scholar] [CrossRef]
  9. Yu, D.; Deng, X.; Andersen, O.B.; Zhu, H.; Luo, J. A new method for determining geoid gradient components from SWOT wide-swath data for marine gravity field. J. Geod. 2025, 99, 29. [Google Scholar] [CrossRef]
  10. Zhang, Z.; Miao, M.; Qiu, B.; Tian, J.; Jing, Z.; Chen, G.; Chen, Z.; Zhao, W. Submesoscale Eddies Detected by SWOT and Moored Observations in the Northwestern Pacific. Geophys. Res. Lett. 2024, 51, e2024GL110000. [Google Scholar] [CrossRef]
  11. Das, P.; Hossain, F. Multi-satellite tracking of surface water storage change in the era of Surface Water and Ocean Topography (SWOT) satellite mission. Earth Space Sci. 2025, 12, e2024EA004178. [Google Scholar] [CrossRef]
  12. Kacimi, S.; Jaruwatanadilok, S.; Kwok, R. SWOT observations over sea ice: A first look. Geophys. Res. Lett. 2025, 52, e2025GL116079. [Google Scholar] [CrossRef]
  13. Rudenko, S.; Dettmering, D.; Zeitlhöfler, J.; Alkahal, R.; Upadhyay, D.; Bloßfeld, M. Radial Orbit Errors of Contemporary Altimetry Satellite Orbits. Surv. Geophys. 2023, 44, 705–737. [Google Scholar] [CrossRef]
  14. Haines, B.; Desai, S.D.; Kubitschek, D.; Leben, R.R. A brief history of the Harvest experiment: 1989–2019. Adv. Space Res. 2021, 68, 1161–1170. [Google Scholar] [CrossRef]
  15. Bonnefond, P.; Exertier, P.; Laurain, O.; Guinle, T.; Féménias, P. Corsica: A 20-Yr Multi-Mission Absolute Altimeter Calibration Site. Adv. Space Res. 2021, 68, 1171–1186. [Google Scholar] [CrossRef]
  16. Bonnefond, P.; Laurain, O.; Exertier, P.; Boy, F.; Guinle, T.; Picot, N.; Labroue, S.; Raynal, M.; Donlon, C.; Féménias, P.; et al. Calibrating the SAR SSH of Sentinel-3A and CryoSat-2 over the Corsica Facilities. Remote Sens. 2018, 10, 92–103. [Google Scholar] [CrossRef]
  17. Zhou, B.; Watson, C.; Legresy, B.; King, M.A.; Beardsley, J. Ongoing Development of the Bass Strait GNSS/INS Buoy System for Altimetry Validation in Preparation for SWOT. Remote Sens. 2023, 15, 287. [Google Scholar] [CrossRef]
  18. Zhou, B.; Watson, C.; Legresy, B.; King, M.A.; Beardsley, J.; Deane, A. GNSS/INS-Equipped Buoys for Altimetry Validation: Lessons Learnt and New Directions from the Bass Strait Validation Facility. Remote Sens. 2020, 12, 3001. [Google Scholar] [CrossRef]
  19. Watson, C.; Legresy, B.; King, M. Altimeter absolute bias estimates from Bass Strait, Australia. In Proceedings of the Ocean Surface Topography Science Team Meeting 2016, La Rochelle, France, 1–4 November 2016; Available online: https://meetings.aviso.altimetry.fr/fileadmin/user_upload/tx_ausyclsseminar/files/CVL_01_OSTST2016_Absolute_Bias_Watson_et_al_14h00.pdf (accessed on 10 August 2025).
  20. Watson, C.; White, N.; Church, J.; Burgette, R.; Tregoning, P.; Coleman, R. Absolute Calibration in Bass Strait, Australia: TOPEX, Jason-1 and OSTM/Jason-2. Mar. Geod. 2011, 34, 242–260. [Google Scholar] [CrossRef]
  21. Mertikas, S.P.; Donlon, C.; Kokolakis, C.; Piretzidis, D.; Cullen, R.; Féménias, P.; Fornari, M.; Frantzis, X.; Tripolitsiotis, A.; Bouffard, J.; et al. The ESA Permanent Facility for Altimetry Calibration in Crete: Advanced Services and the Latest Cal/Val Results. Remote Sens. 2024, 16, 223. [Google Scholar] [CrossRef]
  22. Vergos, G.S.; Tziavos, I.N.; Mertikas, S.; Piretzidis, D.; Frantzis, X.; Donlon, C. Local Gravity and Geoid Improvements around the Gavdos Satellite Altimetry Cal/Val Site. Remote Sens. 2024, 16, 3243. [Google Scholar]
  23. Mertikas, S.P.; Lin, M.; Piretzidis, D.; Kokolakis, C.; Donlon, C.; Ma, C.; Zhang, Y.; Jia, Y.; Mu, B.; Frantzis, X.; et al. Absolute Calibration of the Chinese HY-2B Altimetric Mission with Fiducial Reference Measurement Standards. Remote Sens. 2023, 15, 1393. [Google Scholar] [CrossRef]
  24. Mertikas, S.P.; Donlon, C.; Matsakis, D.; Mavrocordatos, C.; Altamimi, Z.; Kokolakis, C.; Tripolitsiotis, A. Fiducial reference systems for time and coordinates in satellite altimetry. Adv. Space Res. 2021, 68, 1140–1160. [Google Scholar] [CrossRef]
  25. Mertikas, S.; Tripolitsiotis, A.; Donlon, C.; Mavrocordatos, C.; Féménias, P.; Borde, F.; Frantzis, X.; Kokolakis, C.; Guinle, T.; Vergos, G.; et al. The ESA Permanent Facility for Altimetry Calibration: Monitoring Performance of Radar Altimeters for Sentinel-3A, Sentinel-3B and Jason-3 Using Transponder and Sea-Surface Calibrations with FRM Standards. Remote Sens. 2020, 12, 2642. [Google Scholar]
  26. Mertikas, S.P.; Donlon, C.; Féménias, P.; Mavrocordatos, C.; Galanakis, D.; Tripolitsiotis, A.; Frantzis, X.; Tziavos, I.N.; Vergos, G.; Guinle, T. Fifteen Years of Cal/Val Service to Reference Altimetry Missions: Calibration of Satellite Altimetry at the Permanent facilities in Gavdos and Crete, Greece. Remote Sens. 2018, 10, 1557–1596. [Google Scholar]
  27. Zhai, W.; Zhu, J.; Fan, X.; Yan, L.; Chen, C.; Tian, Z. Preliminary calibration results for Jason-3 and Sentinel-3 altimeters in the Wanshan Islands. J. Oceanol. Limnol. 2020, 39, 458–471. [Google Scholar]
  28. Andersen, O.B.; Zhang, S.; Sandwell, D.T.; Dibarboure, G.; Smith, W.H.; Abulaitijiang, A. The Unique Role of the Jason Geodetic Missions for high Resolution Gravity Field and Mean Sea Surface Modelling. Remote Sens. 2021, 13, 646. [Google Scholar] [CrossRef]
  29. Yang, L.; Xu, Y.; Lin, M.; Ma, C.; Mertikas, S.P.; Hu, W.; Wang, Z.; Mu, B.; Zhou, X. Monitoring the Performance of HY-2B and Jason-2/3 Sea Surface Height via the China Altimetry Calibration Cooperation Plan. IEEE Trans. Geosci. Remote Sens. 2022, 60, 1–13. [Google Scholar] [CrossRef]
  30. Yang, L.; Xu, Y.; Zhou, X.; Zhu, L.; Jiang, Q.; Sun, H.; Chen, G.; Wang, P.; Mertikas, S.P.; Fu, Y.; et al. Calibration of an Airborne Interferometric Radar Altimeter over the Qingdao Coast Sea, China. Remote Sens. 2020, 12, 1651. [Google Scholar]
  31. Yang, L.; Zhou, X.; Mertikas, S.P.; Zhu, L.; Yang, L.; Lei, N. First calibration results of Jason-2 and SARAL/AltiKa satellite altimeters from the Qianli Yan permanent Cal/Val facilities, China. Adv. Space Res. 2017, 59, 2831–2842. [Google Scholar]
  32. Bonnefond, P.; Exertier, P.; Laurain, O.; Guillot, A.; Picot, N.; Cancet, M.; Lyard, F. SARAL/AltiKa Absolute Calibration from the Multi-Mission Corsica Facilities. Mar. Geod. 2015, 38 (Suppl. 1), 171–192. [Google Scholar]
  33. Fofonoff, N.P. Algorithms for Computations of Fundamental Properties of Seawater; Unesco technical papers in marine science; UNESCO: Paris, France, 1983. [Google Scholar]
  34. Watson, C.; White, N.; Coleman, R.; Church, J.; Morgan, P.; Govind, R. TOPEX/Poseidon and Jason-1: Absolute calibration in bass strait, Australia. Mar. Geod. 2004, 27, 107–131. [Google Scholar]
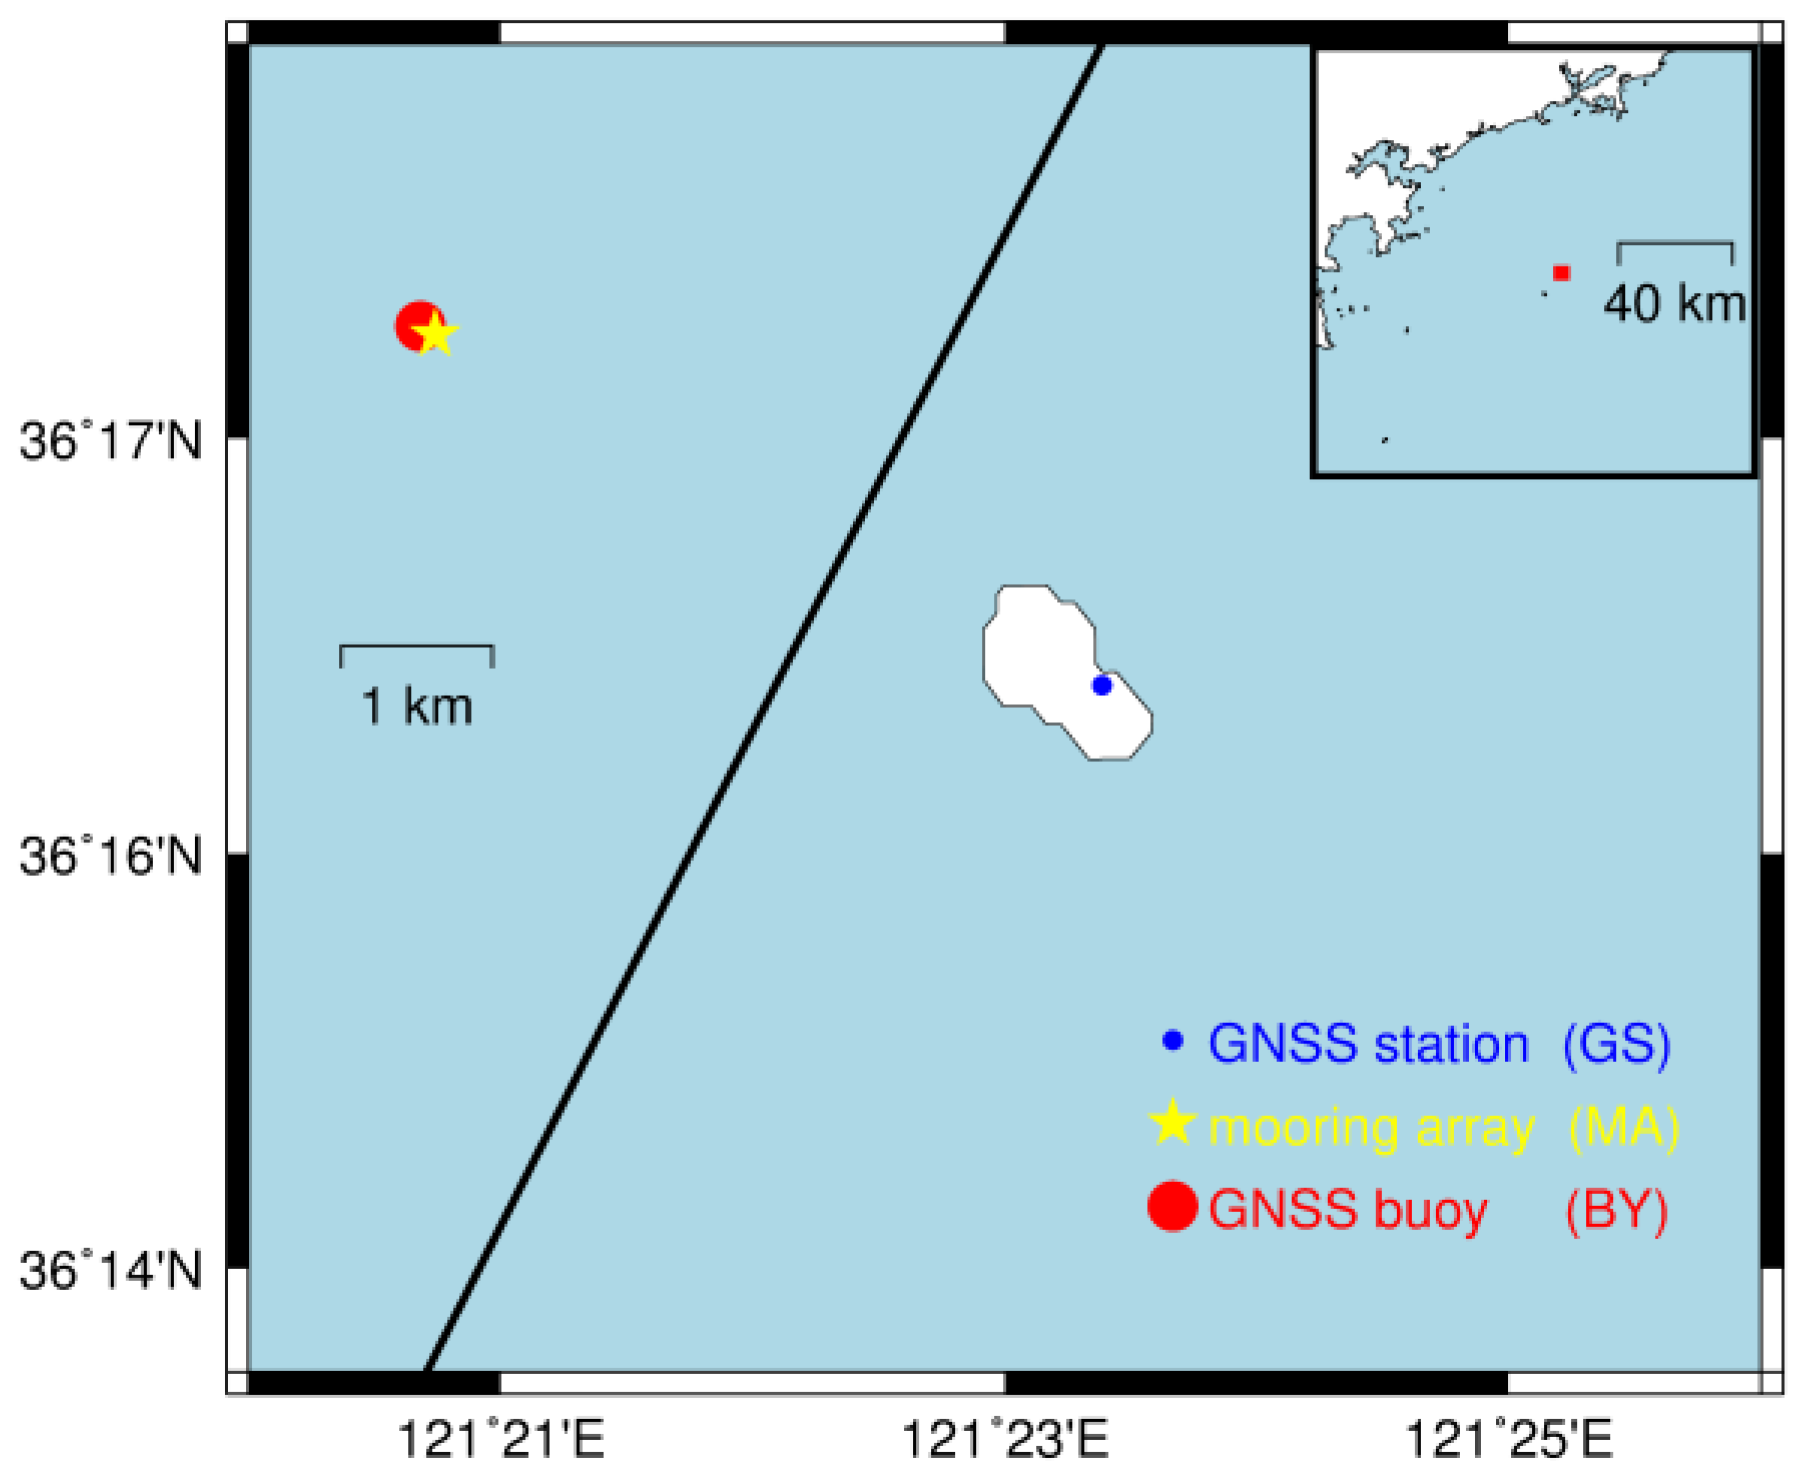
Figure 1. Map of Qianliyan islet location and instrumentation distribution. The red dot in the inserted upright map shows our research zone located in China’s Yellow Sea.
Remotesensing 17 03436 g001
Figure 2. (a) Overall view of GNSS buoy; (b) top-view layout of GNSS buoy antenna positions; (c) physical structure of mooring array.
Remotesensing 17 03436 g002
Figure 3. Flowchart of GNSS buoy observation data preprocessing.
Remotesensing 17 03436 g003
Figure 4. (a) Positional relationship of antenna plane and its normal vector; (b) buoy attitude-dependent errors in measured SSH.
Remotesensing 17 03436 g004
Figure 5. Statistics on DOY 164. (a) Statistical histogram of horizontal attitude angles for the large buoy during a single day. (b) SSH error induced by horizontal attitude variations. (c) Statistical histogram of SSH measurement deviations induced by horizontal attitude.
Remotesensing 17 03436 g005
Figure 6. (a) Welch power spectrum of interpolated SSH sequence. (b) Mean SSH sequence after low-pass filtering. (c) Welch power spectrum of mean SSH sequence after low-pass filtering (all on DOY 164).
Remotesensing 17 03436 g006
Figure 7. (a) Residuals of GNSS buoy-measured SSH before and after low-pass filtering. (b) Welch power spectrum of residuals of GNSS buoy-measured SSH before and after low-pass filtering (DOY 164).
Remotesensing 17 03436 g007
Figure 8. Statistics from DOY 161 to 163. (a) Histogram of attitude angles; (b) attitude-impact-corrected SSH measurements; (c) power spectrum of filtered SSH residuals (high-frequency component).
Remotesensing 17 03436 g008
Figure 9. Statistics from DOY 172 to 174. (a) Histogram of attitude angles; (b) attitude-impact-corrected SSH measurements; (c) power spectrum of filtered SSH residuals (high-frequency component).
Remotesensing 17 03436 g009
Figure 10. (a) Proportions of invalid and <6° attitude angles; (b) time series of daily mean valid attitude angles; (c) time series of daily averaged standard deviations of filtered residuals during the experimental period.
Remotesensing 17 03436 g010
Figure 11. Welch power spectrum of GNSS buoy measured SSH residuals after low-pass filtering during the experimental period. (a) DOY 157 to 163; (b) DOY 164 to 171; (c) DOY 172 to 179.
Remotesensing 17 03436 g011
Figure 12. Measurements from the mooring array (DOY 164). (a) Sea surface atmospheric pressure; (b) seabed pressure; (c) depth; (d) Welch power spectrum of water depth series.
Remotesensing 17 03436 g012
Figure 13. (a) Residuals of sea-surface height measurements from the mooring array before and after low-pass filtering; (b) Welch power spectrum of the residual series derived from mooring array sea-surface height measurements before and after low-pass filtering.
Remotesensing 17 03436 g013
Figure 14. Flowchart for reference value calculation using the mooring array method on a single day.
Remotesensing 17 03436 g014
Figure 15. (a) Depth measured by mooring array versus low-pass filtered SSH measured by GNSS buoy on DOY 164. (b) Computed datum height from mooring array from DOY 157 to 179, the green line shows the mean value.
Remotesensing 17 03436 g015
Figure 16. Measurements of the mooring array. (a) Atmospheric pressure at sea level; (b) seawater temperature; (c) seawater salinity; (d) seabed pressure; (e) sea depth.
Remotesensing 17 03436 g016
Figure 17. Welch power spectrum of mooring array measured SSH residuals after low-pass filtering during the experimental period. (a) DOY 157 to 162; (b) DOY 163 to 168; (c) DOY 169 to 174; (d) DOY 175 to 179.
Remotesensing 17 03436 g017
Figure 18. Low-pass filtered sea surface height measurements from the mooring array versus GNSS buoy observations on DOY (a) 157, (b) 164, (c) 169, (d) 174.
Remotesensing 17 03436 g018
Figure 19. Differential low-pass filtered SSH between mooring array and GNSS buoy on DOY (a) 157, (b) 164, (c) 169, (d) 174. (e) Time series of daily mean value and standard deviations of differential low-pass filtered SSH during the experimental period.
Remotesensing 17 03436 g019
Table 1. Correspondence table between measured SSH errors and attitude angles.
Antenna Height (m)Attitude Angle (deg)Measured SSH Error (cm)
10 m10.15
1.50.34
20.69
31.37
42.44
53.81
65.49
77.45
89.73
Table 2. Comparative error budget of mean sea surface height for both instruments.
Error Budget (*)FixedVariable
GNSS Buoy SSH (SSHBuoy)
  • Reference station solution
1010
  • Kinematic solution
15
  • Antenna height and PCV
5
  • Dynamic height (**)
15
  • residual attitude induced error
5
  (a) SSHBuoy Total:11 mm24 mm
Mooring depth (depthM)
  • Pressure sensor
4
  • Dynamic height (**)
5
  • Atmospheric pressure
2
  • Temperature and salinity variation
6
  (b) depthM Total:0 mm9 mm
Mooring datum (DatumM)
  • SSHBuoy (from (a) above)
1124
  • depthM (from (b) above)
09
  (c) DatumM Total: (***)11 mm3 mm
Mooring SSH (SSHM)
  • depthM (from (b) above)
09
  • DatumM (from (c) above)
113
  SSHM Total:11 mm9 mm
* The error budget pertains to the mean sea surface height measured by both instruments, different from the instantaneous sea surface height. ** The deviation of low-passed sea surface height as opposed to the mean sea surface height. *** Through the synchronized observations of 21 days, variable uncertainty of mooring datum could be calculated as sqrt[(SSH2Buoy(variable) + depth2M(variable))/84] = sqrt[(242 + 92)/84].
Disclaimer/Publisher’s Note: The statements, opinions and data contained in all publications are solely those of the individual author(s) and contributor(s) and not of MDPI and/or the editor(s). MDPI and/or the editor(s) disclaim responsibility for any injury to people or property resulting from any ideas, methods, instructions or products referred to in the content.