Article

Reconstructing Global Chlorophyll-a Concentration for the COCTS Aboard Chinese Ocean Color Satellites via the DINEOF Method

1
State Key Laboratory of Satellite Ocean Environment Dynamics, National Satellite Ocean Application Service, Beijing 100081, China
2
Key Laboratory of Space Ocean Remote Sensing and Applications, Ministry of Natural Resources, Beijing 100081, China
3
National Marine Environmental Forecasting Center, Ministry of Natural Resources, Beijing 100081, China
*
Author to whom correspondence should be addressed.
Remote Sens. 2025, 17(20), 3433; https://doi.org/10.3390/rs17203433
Submission received: 9 August 2025 / Revised: 26 September 2025 / Accepted: 3 October 2025 / Published: 15 October 2025

Abstract

Highlights

What are the main findings?
  • Multi-sensor synergy significantly enhances chlorophyll-a concentration coverage, improving from 10.45 to 26.1% (single-sensor) to 55.4% (10-sensor integration).
  • China’s HY-1C/D/E satellites, equipped with Chinese Ocean Color and Temperature Scanner (COCTS), enable global ocean color monitoring, and DINEOF reconstruction the chlorophyll-a concentration data gaps with a 27% mean error.
What is the implication of the main finding?
  • The DINEOF-based reconstruction method enables COCTS to generate daily global-scale data outputs and effectively capture spatiotemporal patterns in ecologically sensitive regions.
  • This study demonstrates significant potential to directly contribute to advancing China’s operational ocean color monitoring systems.

Abstract

The chlorophyll-a (Chl-a) concentration, a critical parameter for characterizing marine primary productivity and ecological health, plays a vital role in providing ecological environment monitoring and climate change assessment while serving as a core retrieval product in ocean color remote sensing. Currently, more than ten ocean color satellites operate globally, including China’s HY-1C, HY-1D and HY-1E satellites. However, significant spatial data gaps exist in Chl-a concentration retrieval from satellites because of cloud cover, sun-glint, and limitation of sensor swath. This study aimed to systematically enhance the spatiotemporal integrity of ocean monitoring data through multisource data merging and reconstruction techniques. We integrated Chl-a concentration datasets from four major sensor types—Moderate Resolution Imaging Spectroradiometer (MODIS), Visible Infrared Imaging Radiometer Suite (VIIRS), Ocean and Land Color Instrument (OLCI), and Chinese Ocean Color and Temperature Scanner (COCTS)—and quantitatively evaluated their global coverage performance under different payload combinations. The key findings revealed that single-sensor 4-day continuous observation achieved effective coverage levels ranging from only 10.45–26.1%, while multi-sensor merging substantially increased coverage, namely, homogeneous payload merging provided 25.7% coverage for two MODIS satellites, 41.1% coverage for three VIIRS satellites, 24.8% coverage for two OLCI satellites, and 37.1% coverage for three COCTS satellites, with 10-payload merging increasing the coverage rate to 55.4%. Employing the Data Interpolating Empirical Orthogonal Functions (DINEOFS) algorithm, we successfully reconstructed data for China’s ocean color satellites. Validation against VIIRS reconstructions indicated high consistency (a mean relative error of 26% and a linear correlation coefficient of 0.93), whereas self-verification yielded a mean relative error of 27% and a linear correlation coefficient of 0.90. Case studies in Chinese offshore and adjacent waters, waters east of Mindanao Island and north of New Guinea, demonstrated the successful reconstruction of spatiotemporal Chl-a dynamics. The results demonstrated that China’s HY-1C, HY-1D, and HY-1E satellites enable daily global-scale Chl-a reconstruction.

1. Introduction

Chlorophyll-a (Chl-a) is the primary photosynthetic pigment in phytoplankton, making it an essential indicator for evaluating oceanic biological activity, ecosystem stability, and biogeochemical carbon fluxes [1,2,3]. The Chl-a concentration provides a dual function in marine ecosystems: this parameter reflects the standing stock of phytoplankton while simultaneously capturing physiological adaptations manifested through pigment dynamics, including both light-mediated photoacclimation processes and nutrient-induced metabolic shifts [4]. The fluctuation of Chl-a levels exerts a direct influence on the marine carbon sequestration capacity [2,3,5].
Long-term satellite-derived observations can reveal the spatial–temporal variability in Chl-a concentration at the global scale [6,7,8,9]. Satellite ocean color remote sensing has revolutionized large-scale Chl-a monitoring since the pioneering coastal zone color scanner (CZCS) deployment in 1978 [10]. Ocean color satellites currently in orbit achieve daily scale observations of global Chl-a concentration through sensors such as the Moderate Resolution Imaging Spectroradiometer (MODIS) onboard the Aqua and Terra satellites; the Visible Infrared Imaging Radiometer Suite (VIIRS) onboard Suomi National Polar-orbiting Partnership (NPP) satellites, i.e., JPSS-1 (NOAA-20) and JPSS-2 (NOAA-21); the Ocean and Land Color Instrument (OLCI) onboard the Sentinel-3A and Sentinel-3B satellites, and the Chinese Ocean Color and Temperature Scanner (COCTS) on the HY-1C and HY-1D satellites. Hyperspectral advancements, exemplified by the Plankton, Aerosol, Cloud, and Ocean Ecosystem (PACE) mission, launched in February 2024, also aim to resolve complex optical properties through 5 nm spectral resolution data and provide continuous observations of Chl-a concentration [11]. China’s new-generation ocean color observation satellite (HY-1E, also designated HY-3A), launched on 16 November 2023, has increased the observational resolution to 500 m via its second-generation COCTS (COCTS2) payload. However, persistent data gaps caused by notable sun-glint, cloud cover, large zenith angles, thick aerosol layers, stray light, sensor limitations (such as narrow swath widths), low-light conditions at high latitudes, and atmospheric interference hinder the generation of spatially and temporally continuous Chl-a concentration products [12,13,14]. For example, the daily effective ocean color data coverage rate of a single VIIRS satellite sensor is approximately 30% [12]. Multi-satellite data merging can increase coverage [13]. For example, the European Space Agency (ESA) Ocean Color Climate Change Initiative (OC-CCI) merges multi-sensor data to reduce uncertainties and coverage [15]. Reconstructing missing satellite-derived Chl-a concentration provides the foundation for ecological monitoring, advancing marine research, climate studies, and environmental management.
Machine learning and data interpolation have been employed to reconstruct global ocean Chl-a concentration [12,13,14,16,17,18,19,20]. While machine learning excels at capturing nonlinear spatiotemporal relationships, it requires extensive labeled data and computational resources. In comparison, the data interpolating empirical orthogonal functions (DINEOFS) method is suitable for stable long-term temporal variations and has served as a core methodology for gap-filling in orbital observation datasets of ocean color, sea surface temperature (SST) and sea surface wind fields in global oceans [12,13,20,21,22,23,24]. This approach has even been used in the reconstruction of high-resolution ocean color data [25,26]. For example, this methodology has been employed to reconstruct ocean color products from a single VIIRS instrument on Suomi NPP [12], dual-sensor of VIIRS on Suomi NPP and NOAA-20 [13], multi-sensor of VIIRS on Suomi NPP and NOAA-20, and OLCI on the Sentinel-3A/B [20]. Reconstruction data can be applied in ocean response monitoring [27]. These studies have demonstrated the applicability of the DINEOF for the operational reconstruction of satellite-derived observations. The ocean color science team at the Center for Satellite Applications and Research (STAR) of the National Oceanic and Atmospheric Administration (NOAA)/National Environmental Satellite, Data, and Information Service (NESDIS) provides VIIRS three-sensor merged and gap-filled daily global Chl-a product (https://www.star.nesdis.noaa.gov/socd/mecb/color/) (accessed on 25 May 2025).
Existing reconstruction and merging methodologies (e.g., DINEOF, machine learning) show constrained cross-sensor applicability and insufficient incorporation of Chinese satellite observations. Standardized operational products (e.g., ESA’s OC-CCI datasets) still lack comprehensive inclusion of China’s ocean color satellite observations. The future research should establish globally harmonized data products incorporating Chinese satellite contributions. China has already launched five ocean color satellites, three of which are currently in orbit and provide ocean color and SST products [28,29,30,31,32]. In this study, we aim to address the current research gap in evaluating the reconstruction capabilities of China’s ocean color satellite data. By employing the DINEOF method, we focus on the observational capacity of Chl-a concentration measurements from China’s ocean color satellites, and a comprehensive quality assessment of reconstructed data. In Section 2, we outline the satellite data used, Chl-a concentration data bias correction methods, data merging techniques, and DINEOF reconstruction principles. In Section 3, we present merged Chl-a concentration from multiple satellite platforms, with comprehensive assessments of both spatial coverage and reconstruction accuracy, and validate the application effectiveness through an oceanographic case study. In Section 4, a discussion and conclusions are provided.

2. Materials and Methods

2.1. Satellite-Derived Chlorophyll-a Concentration

Satellite-derived data used in this study include daily Chl-a concentration from multiple sensors aboard ocean color satellites, including Level-3A daily products of COCTS/COCTS2 on the HY-1C, HY-1D, and HY-1E; VIIRS daily products from the Suomi NPP, JPSS-1 (NOAA-20), and JPSS-2 (NOAA-21); MODIS daily products from the Terra and Aqua satellites; and OLCI daily products from the Sentinel-3A and Sentinel-3B satellites. All daily products include both 4 and 9 km gridded resolutions. Liu and Wang conducted reconstruction studies of VIIRS and OLCI Chl-a concentration products [12,13,20]. This study focuses on data reconstruction analysis of Chl-a concentration from Chinese ocean color satellites to evaluate the quality of both the original satellite-derived Chl-a concentration and the corresponding reconstruction results.
Both HY-1C and HY-1D satellites, which entered orbit on 7 September 2018 and 11 June 2020, respectively, were equipped with COCTS instruments. The COCTS multispectral imaging spectrometer deploys ten spectral bands—eight in visible/near-infrared and two in thermal infrared—specifically engineered for concurrent global ocean color and SST monitoring. The instrument achieves 1.1 km spatial resolution at nadir viewing geometry and provides daily global gridded products at resolutions of 4 and 9 km [28,29,30]. The HY-1E satellite, which entered orbit on 16 November 2023, represents China’s new-generation ocean color observation satellite. It carries a 2nd-generation Chinese Ocean Color and Temperature Scanner (COCTS2), a programmable medium-resolution imaging spectrometer (PMRIS), a 2nd-generation coastal zone imager (CZI2), and an automatic identification system (AIS). These instruments enhance the spatial resolution, spectral resolution, and detectable spectral ranges for ocean color observations in China. The COCTS2 instrument demonstrates exceptional observational capabilities with a observational swath of 3 000 km, achieving 500-m pixel resolution at nadir. Its 18-channel spectral configuration covers wavelengths spanning from 360 nm in the ultraviolet to 12.0 μm in the thermal infrared, including key bands at 360 nm, 385 nm, 412 nm, 443 nm, 490 nm, 520 nm, 565 nm, 620 nm, 665 nm, 681 nm, 705 nm, 745 nm, 865 nm, 1245 nm, 1640 nm, 3.7 μm, 10.8 μm, and 12.0 μm. This indicates that the instrument includes two ultraviolet bands, eleven visible/near-infrared bands, two shortwave infrared bands, one longwave infrared band and two longwave infrared bands.
Compared with the COCTS on the HY-1C (COCTS-H1C) and HY-1D (COCTS-H1D), the COCTS2 acquires global ocean color and SST data with higher resolution and enhanced spectral information. The daily global gridded Chl-a concentration product includes 2-, 4-, and 9 km resolutions. To ensure consistency with the data from COCTS-H1C and COCTS-H1D, the 4 km and 9 km products of the COCTS2 aboard the HY-1E (COCTS-H1E) satellite were exclusively employed in this study.
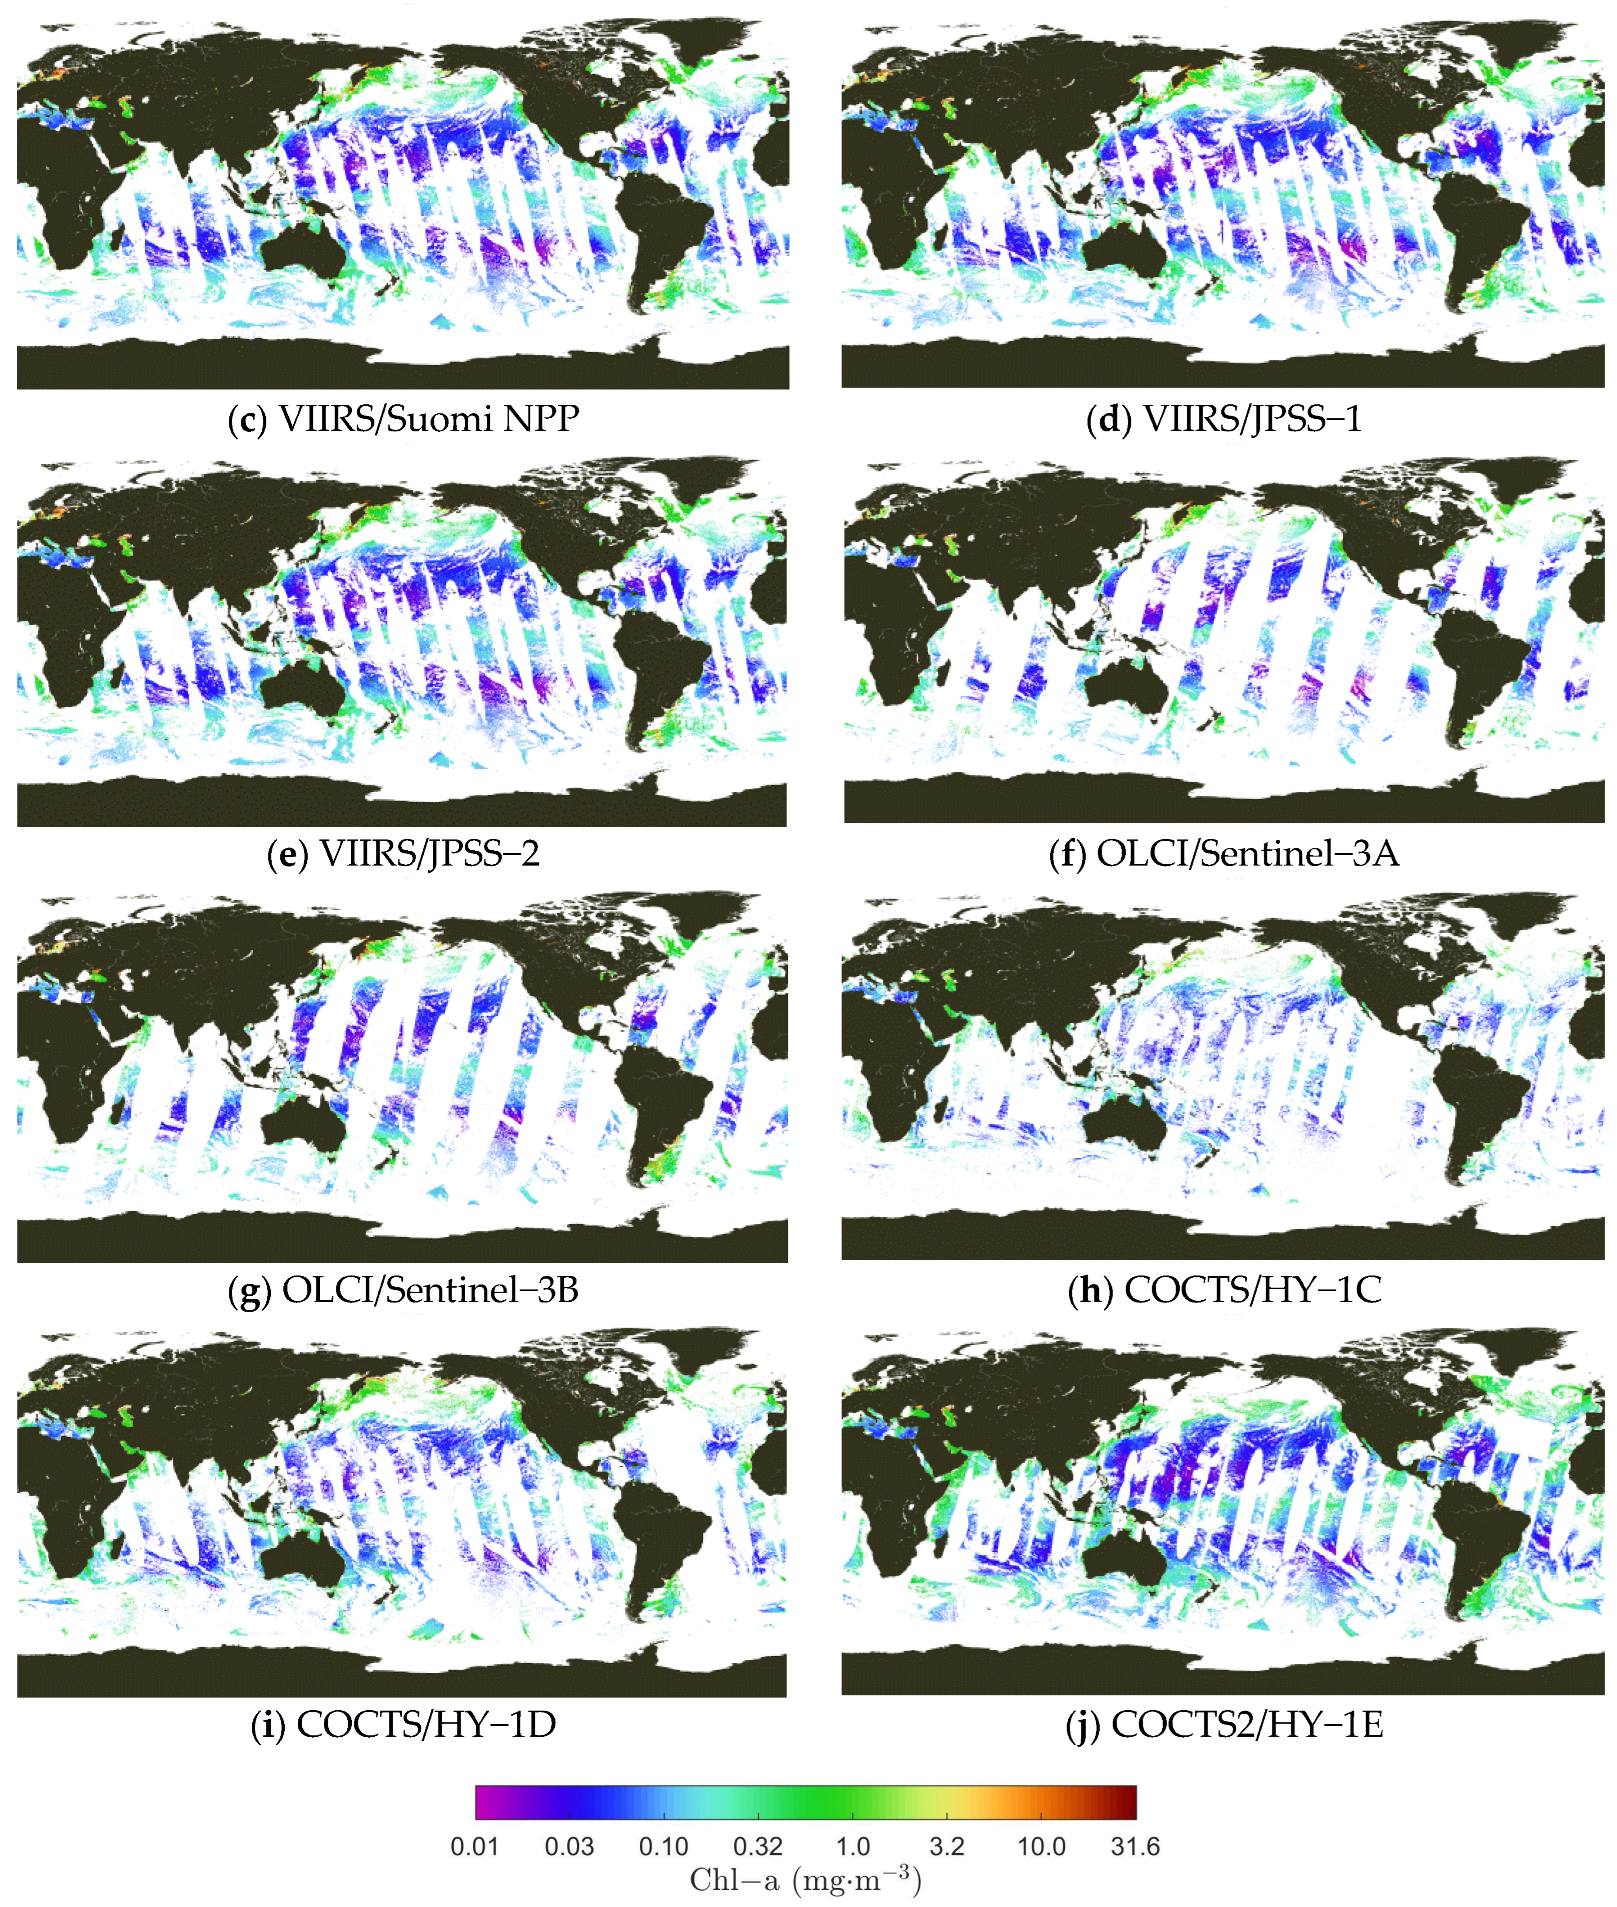
Multisource satellite-derived Chl-a concentration from September to October 2024 was analyzed in this study. Figure 1 shows the Chl-a concentration distributions from various sensors aboard multiple satellites for 6 October 2024. The observation times of the data shown in Figure 1 are as follows: Figure 1a,f,g,j were acquired at local time 10:30 ± 30 min, while Figure 1b–e,i were acquired at local time 13:30 ± 30 min. The observation times may vary, but all were acquired around noon on the same day, with a maximum time difference of no more than 3 h. Therefore, they can be considered as observations within the same time window for that day.
As indicated by the global Chl-a concentration distributions from various satellites shown in Figure 1, significant data gaps exist in all satellite-derived Chl-a concentrations due to certain constraints, including sensor swath width limitations, cloud cover, sun-glint effects, and low solar illumination levels at high latitudes. However, the spatial distribution and extent of these data gaps vary across satellites, resulting from differences in individual satellite characteristics such as the swath width and observation timing.

2.2. Correcting and Merging Chlorophyll-a Concentration from Multiple Sensors

The Chl-a concentration products from different satellite sensors exhibit inherent discrepancies due to variations in both the spectral band configurations and the retrieval algorithms employed [33,34,35]. Table 1 lists the Chl-a concentration retrieval algorithms and corresponding spectral bands used for satellite sensors. Consequently, bias correction of individual satellite data must be implemented prior to multi-sensor Chl-a data merging. This critical preprocessing step enables observational value harmonization across heterogeneous data [36]. Figure 2 presents the time series of global average Chl-a concentration from the 10 sensors utilized in this study for October 2024. The figure demonstrates that the observed Chl-a concentrations from these sensors are generally consistent, yet certain deviations exist, which is precisely why bias correction is necessary.
The bias between two sources of satellite-derived Chl-a concentration can be quantified as follows:
b = 1 N i = 1 N l o g 10 ( y i ) l o g 10 ( x i )
where  x i  denotes the observational value at point  i  from the reference sensor,  y i  denotes the observational value from the target sensor requiring correction, and  N  denotes the complete count of observational data points.  l o g 10  denotes the base-10 logarithm operation. In fact, all Chl-a concentration merging and reconstruction processes in this study are performed on the base-10 logarithmic values of the original measurements. In this study, we designated the MODIS/Aqua (MODIS-A), VIIRS/Suomi NPP (VIIRS-SNPP), and OLCI/Sentinel-3A (OLCI-S3A) as reference sensors for bias correction and data merging processing involving multiple satellites for MODIS, VIIRS, and OLCI data, respectively, whereas we selected the COCTS2 as the reference sensor when processing COCTS/HY-1C (COCTS-H1C) and COCTS/HY-1D (COCTS-H1C) observations along with HY-1E/COCTS2 data and employed MODIS-A as the universal reference for merging all sensor data. Figure 3 shows a comparative scatter plot of daily Chl-a products from COCTS-H1E and MODIS-A on 6 October 2024 (corresponding to Figure 1j and Figure 1b, respectively, where the value of  b  is 0.08, the unit of  10 b  is mg·m−3, the relative error is 30%, and the linear correlation coefficient is 0.87. This plot indicates statistically negligible differences when either COCTS-H1E or MODIS-A is chosen as the reference platform.
Multi-satellite Chl-a concentration data merging was implemented via a weighted averaging approach, with the following data merging process [38]:
z i = i = 1 n s θ i w i x i i = 1 n s θ i w i
where  z i  denotes the merged Chl-a concentration value,  n s  denotes the total number of sensors participating in the merging process,  x i  denotes the bias-corrected Chl-a concentration value for each sensor, with  l o g 10 x i = l o g 10 y i b θ i  denotes the indicator function for sensor data availability, with a value of 1 if data from the sensor exist in the merging source and 0 otherwise, and  w i  denotes the weighting coefficient for each sensor in the merging process, with all weights uniformly assigned a value of 1.

2.3. Reconstruction Method: DINEOF

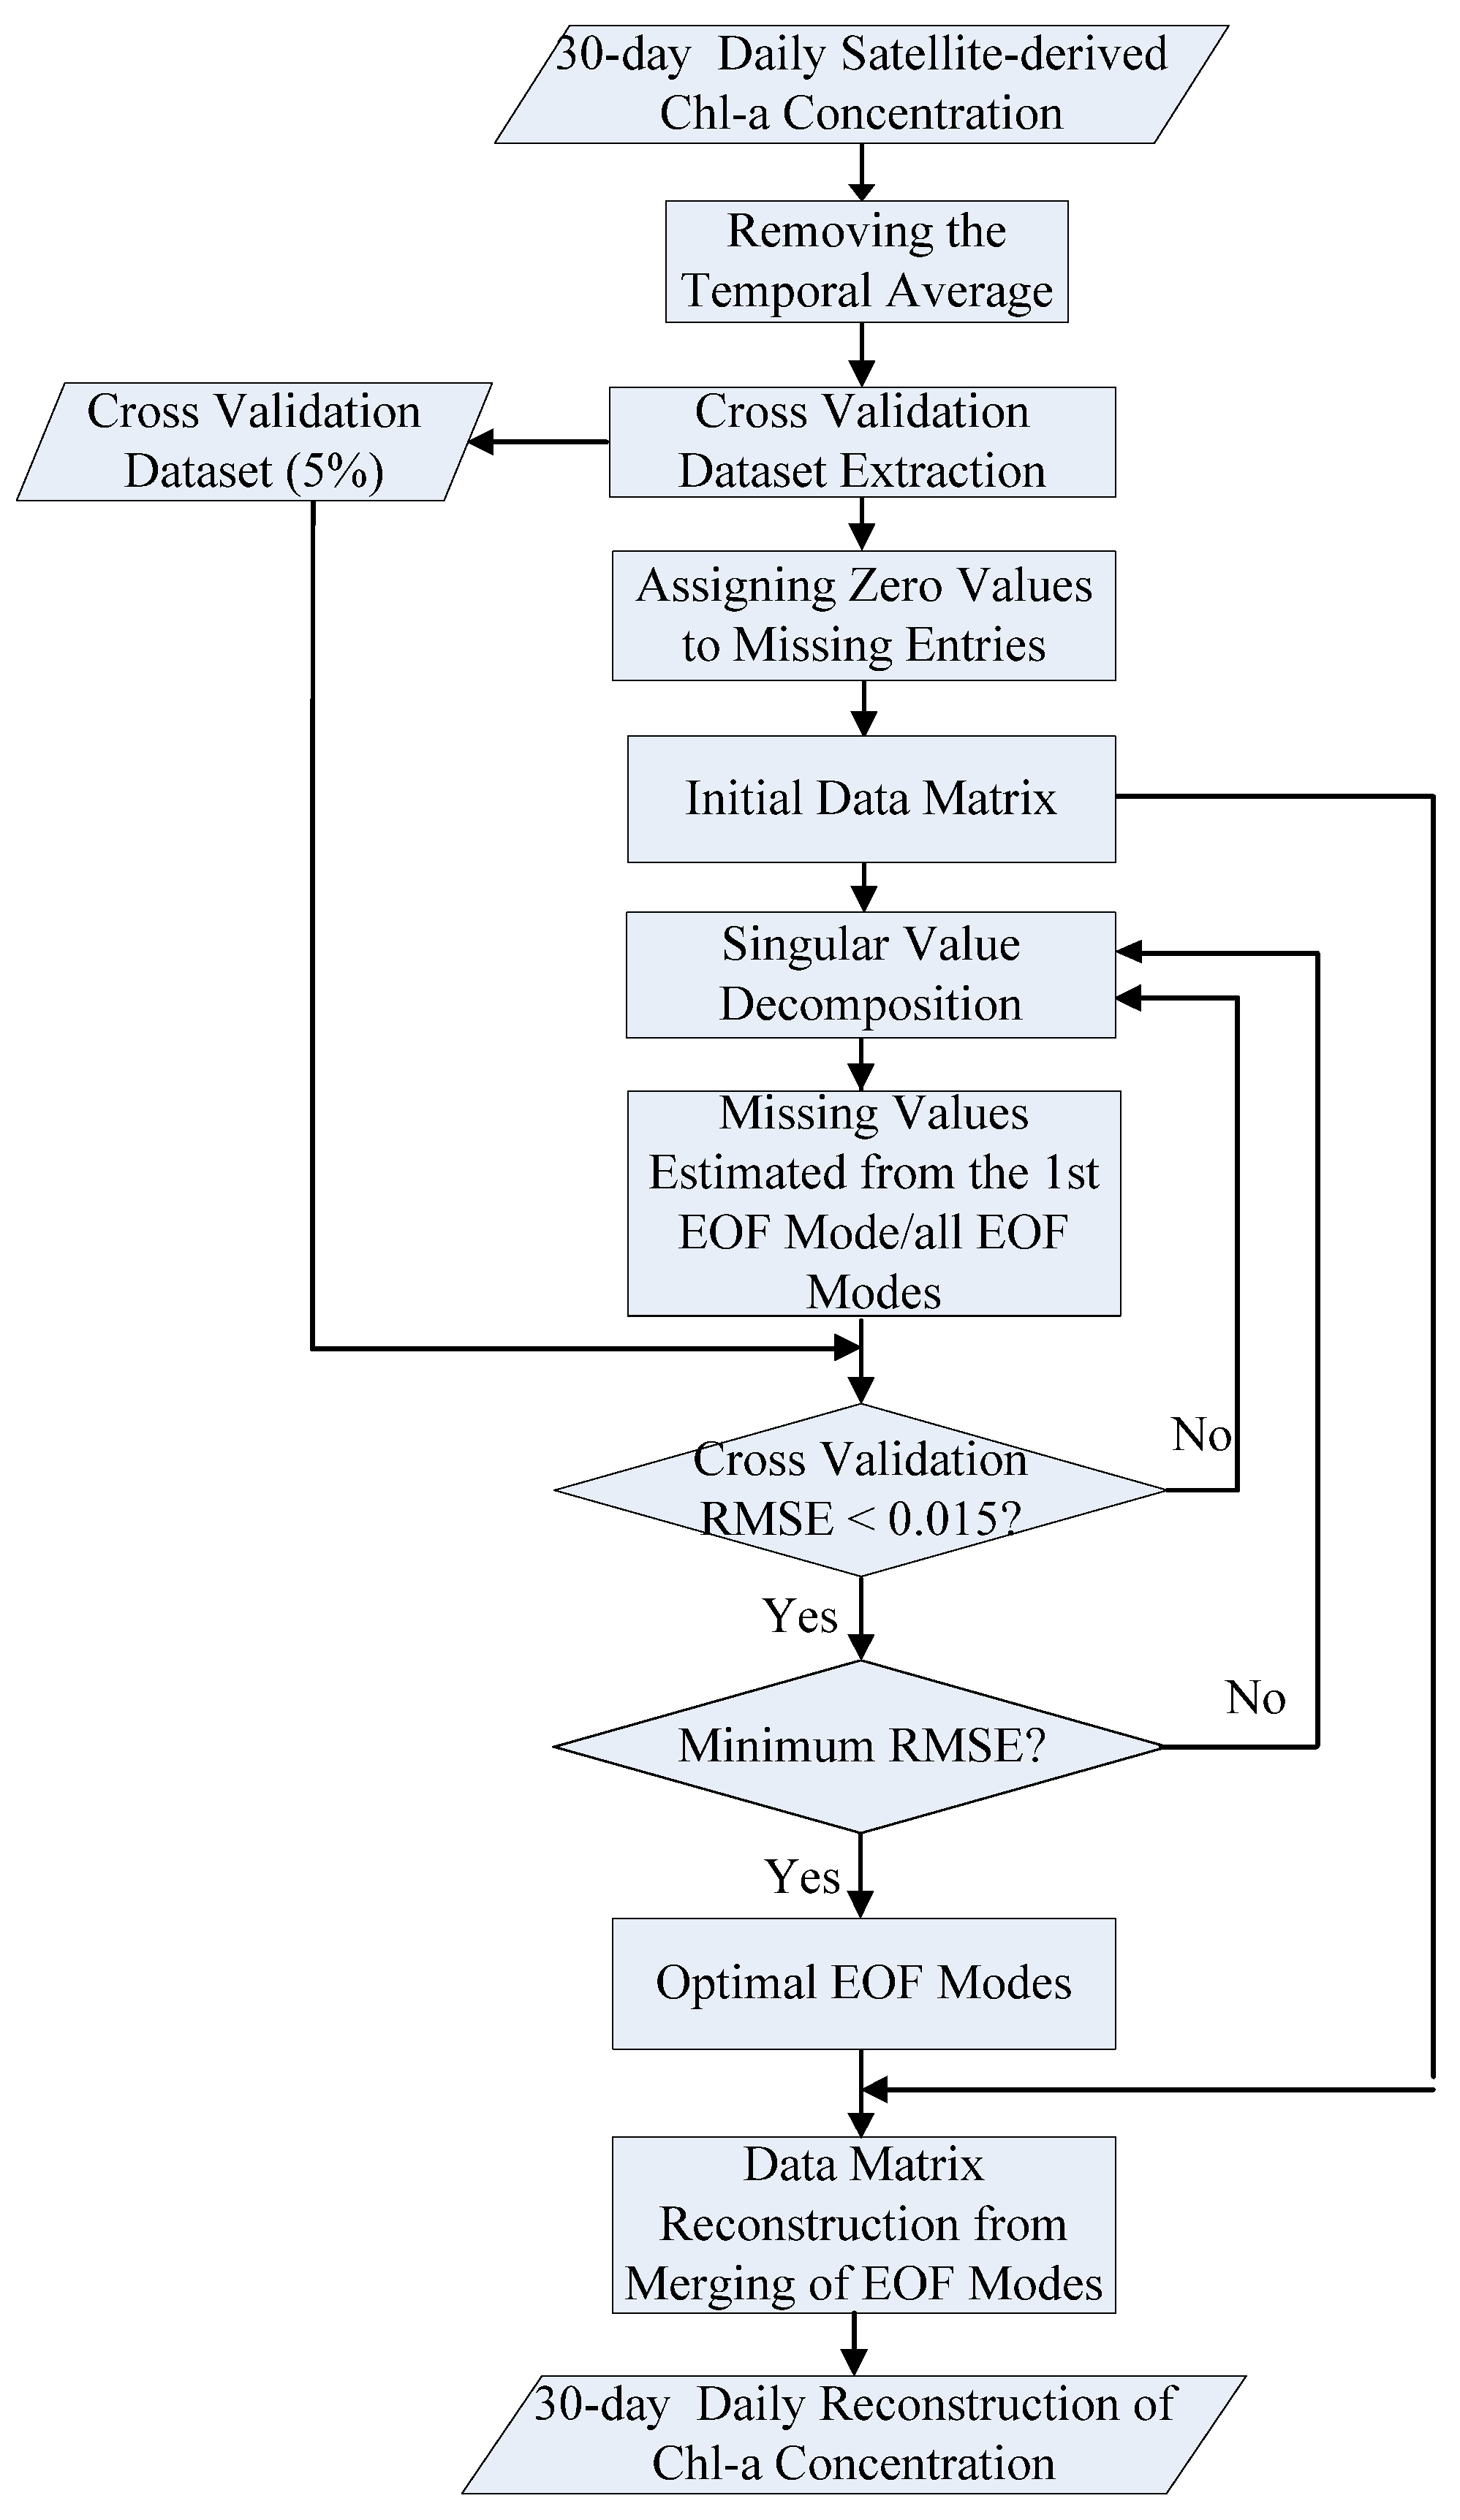
The method of DINEOF is designed to fill spatial and temporal data gaps by utilizing the EOF technique. The necessary parameters are derived autonomously from the data without requiring prior information on the dataset. The DINEOF method is characterized by high accuracy and computational efficiency. The core concept of this approach involves first deriving initial data by removing the temporal average from the complete dataset and assigning zero values to missing entries. Subsequently, Singular Value Decomposition (SVD) is applied. The missing values are then estimated using the spatial and temporal patterns derived from the first EOF mode. In each iteration, the reconstructed values from the prior step are used as initial estimates for filling the gaps in the next cycle. The first EOF mode undergoes iterative recalibration until reaching convergence. Subsequently, this process is iteratively repeated with numerous EOF modes until convergence is attained. After each iteration step, the ideal quantity of EOF modes for retention is determined through cross-validation analysis, aiming to reduce the validation error to its minimum [12,39,40,41].
In the study, the DINEOF method is employed for data reconstruction, with the input data of the base-10 logarithm of the Chl-a concentration- l o g 10 z i , where    z i  denotes the multi-satellite merged Chl-a concentration value as defined in Equation (2). To verify result consistency, the study employs a 30-day multi-sensor merged dataset with 4 km spatial and daily temporal resolution parameters. The configuration parameters for the DINEOF method are as follows: a cross-validation data proportion of 5%, a maximum iteration count of 50, and a convergence threshold for root mean square error (RMSE) set at 0.025. The computational framework of DINEOF for Chl-a concentration reconstruction is schematically illustrated in Figure 4.

3. Results

3.1. Merged Results and Their Coverage

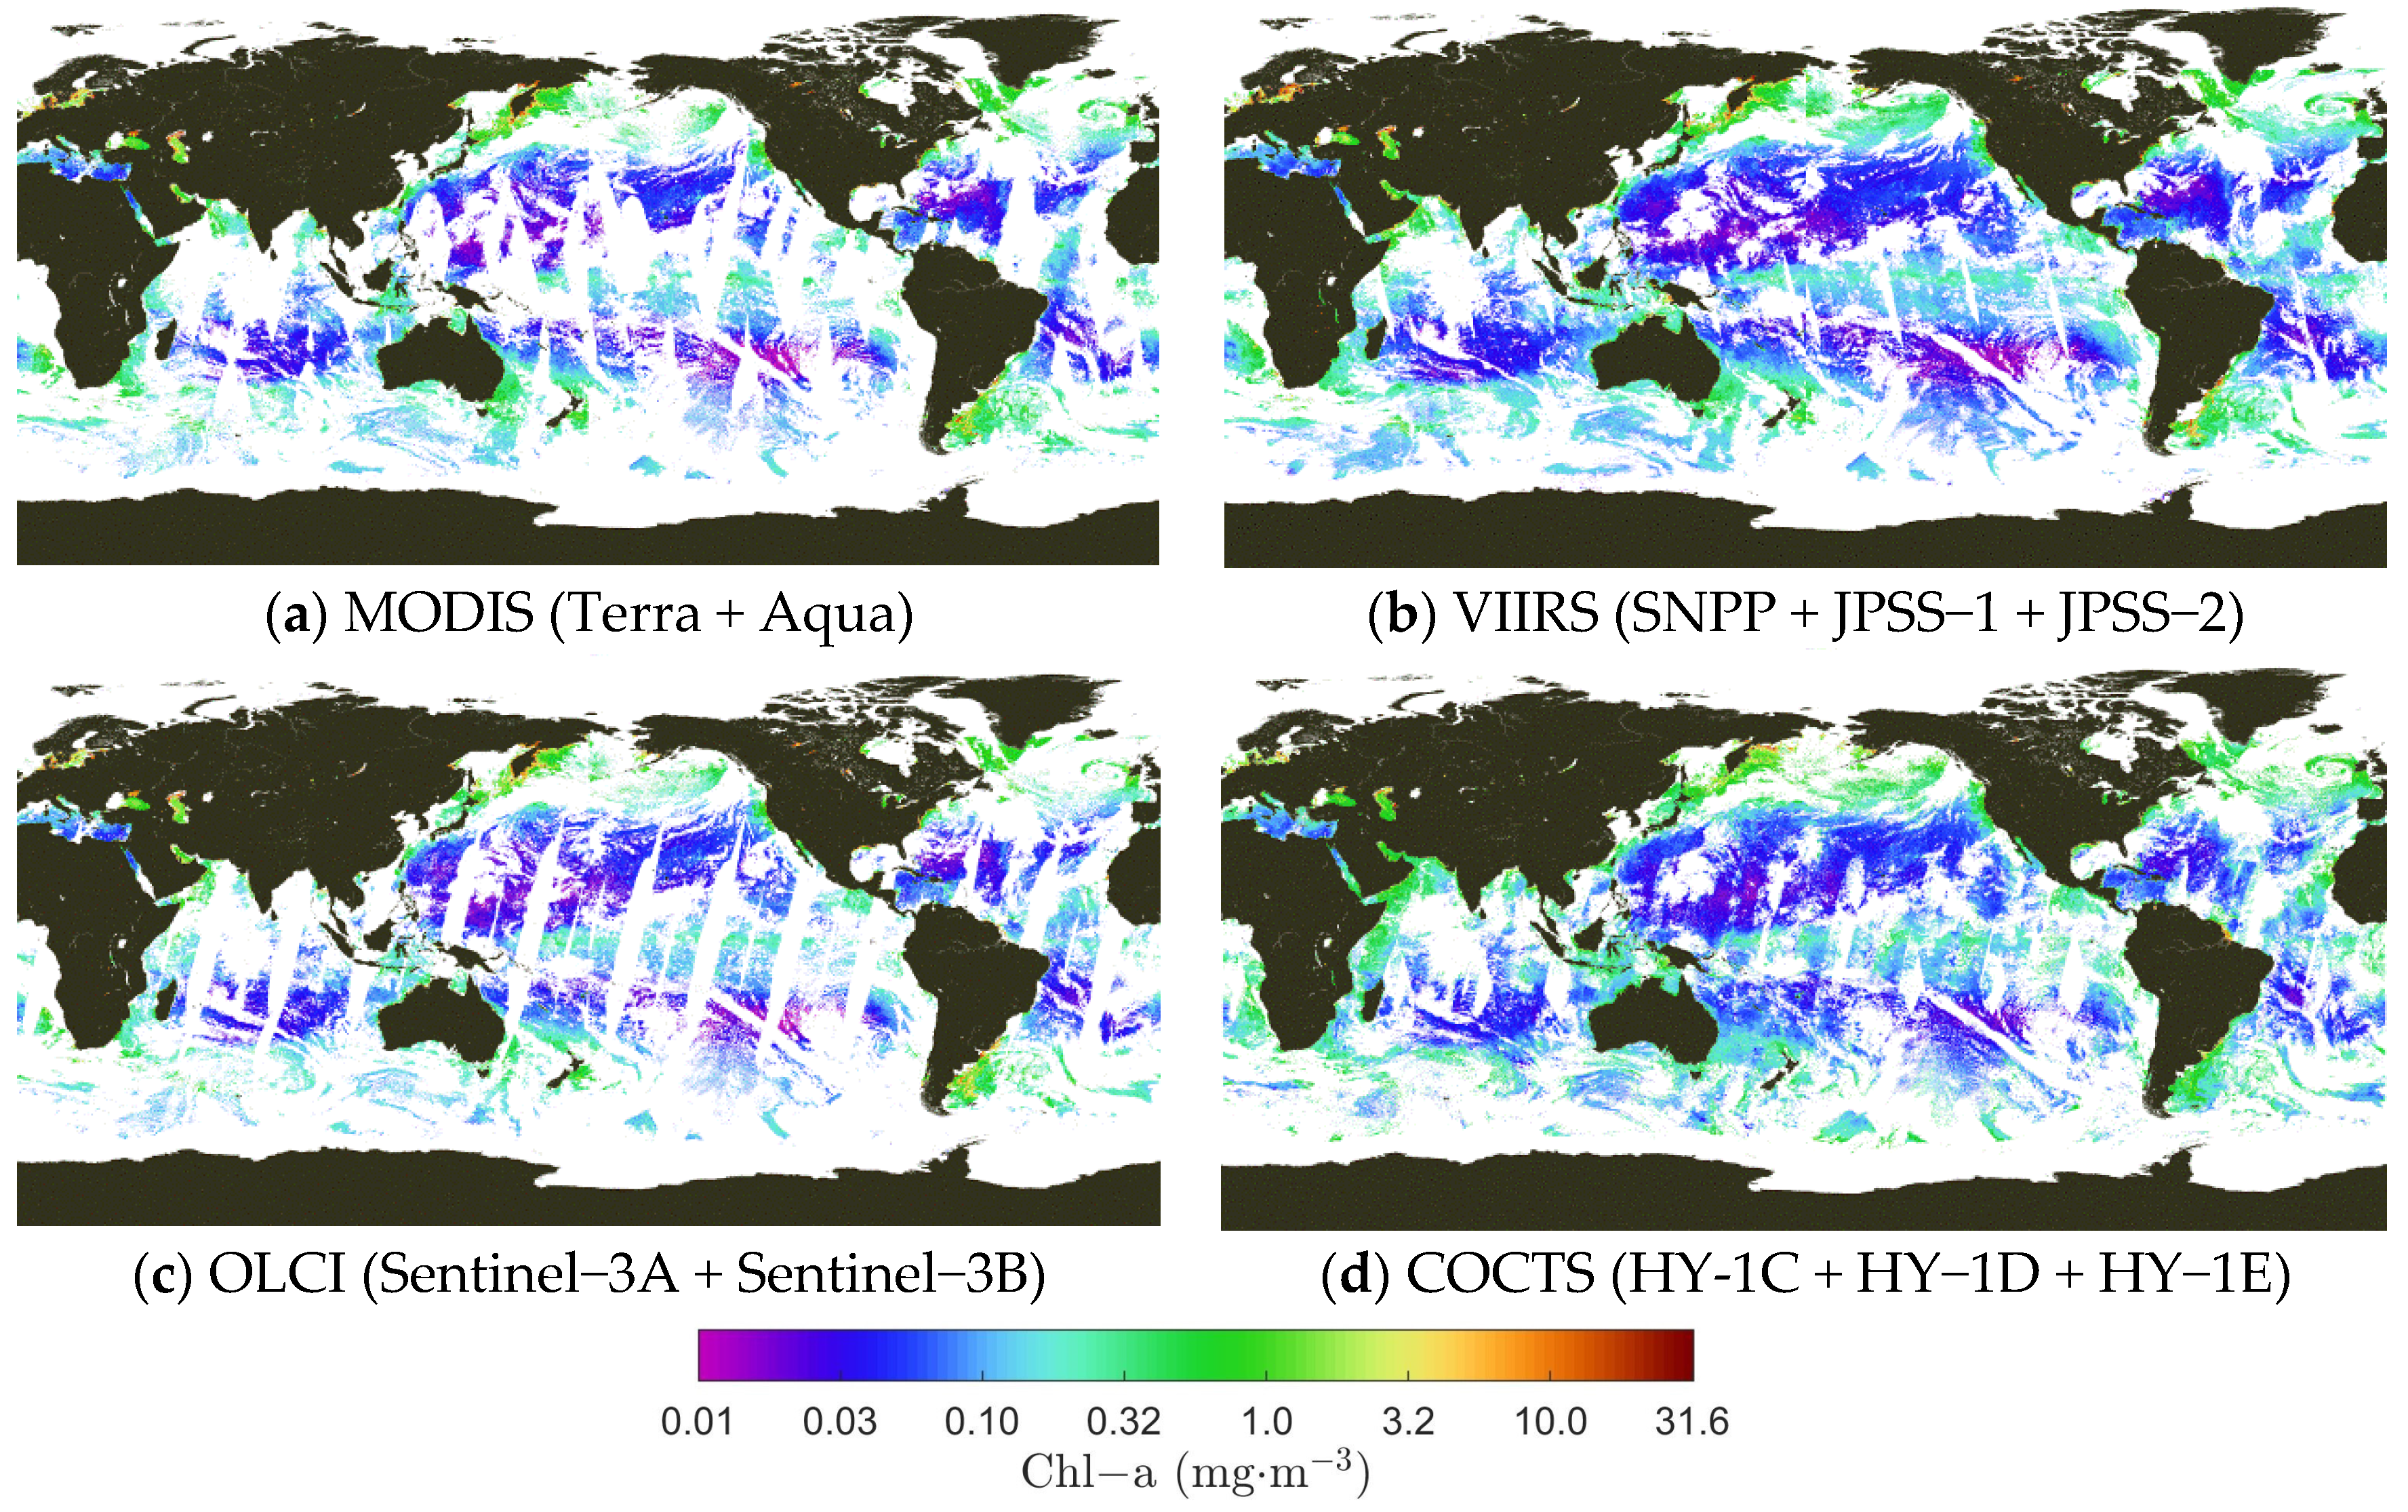
The Chl-a concentration from the MODIS, VIIRS, OLCI, and COCTS (including COCTS-2) were merged to derive the integrated Chl-a concentration distributions for each type of satellite sensor. Figure 5a–d show the merged results for 6 October 2024. A comparison of Figure 5 and Figure 1 reveals a significantly greater spatial coverage rate for the multi-satellite merged Chl-a product than for the single-sensor data, respectively. An analysis of the subfigures of Figure 5 indicates consistent distribution characteristics and quantitative patterns across the merged results for the different types of sensors. Merging and incorporating data from three satellites (Figure 5b,d) provides higher coverage rates than merging and incorporating data from only two satellites (Figure 5a,c). Nevertheless, substantial data gaps persist across all merged distribution maps.
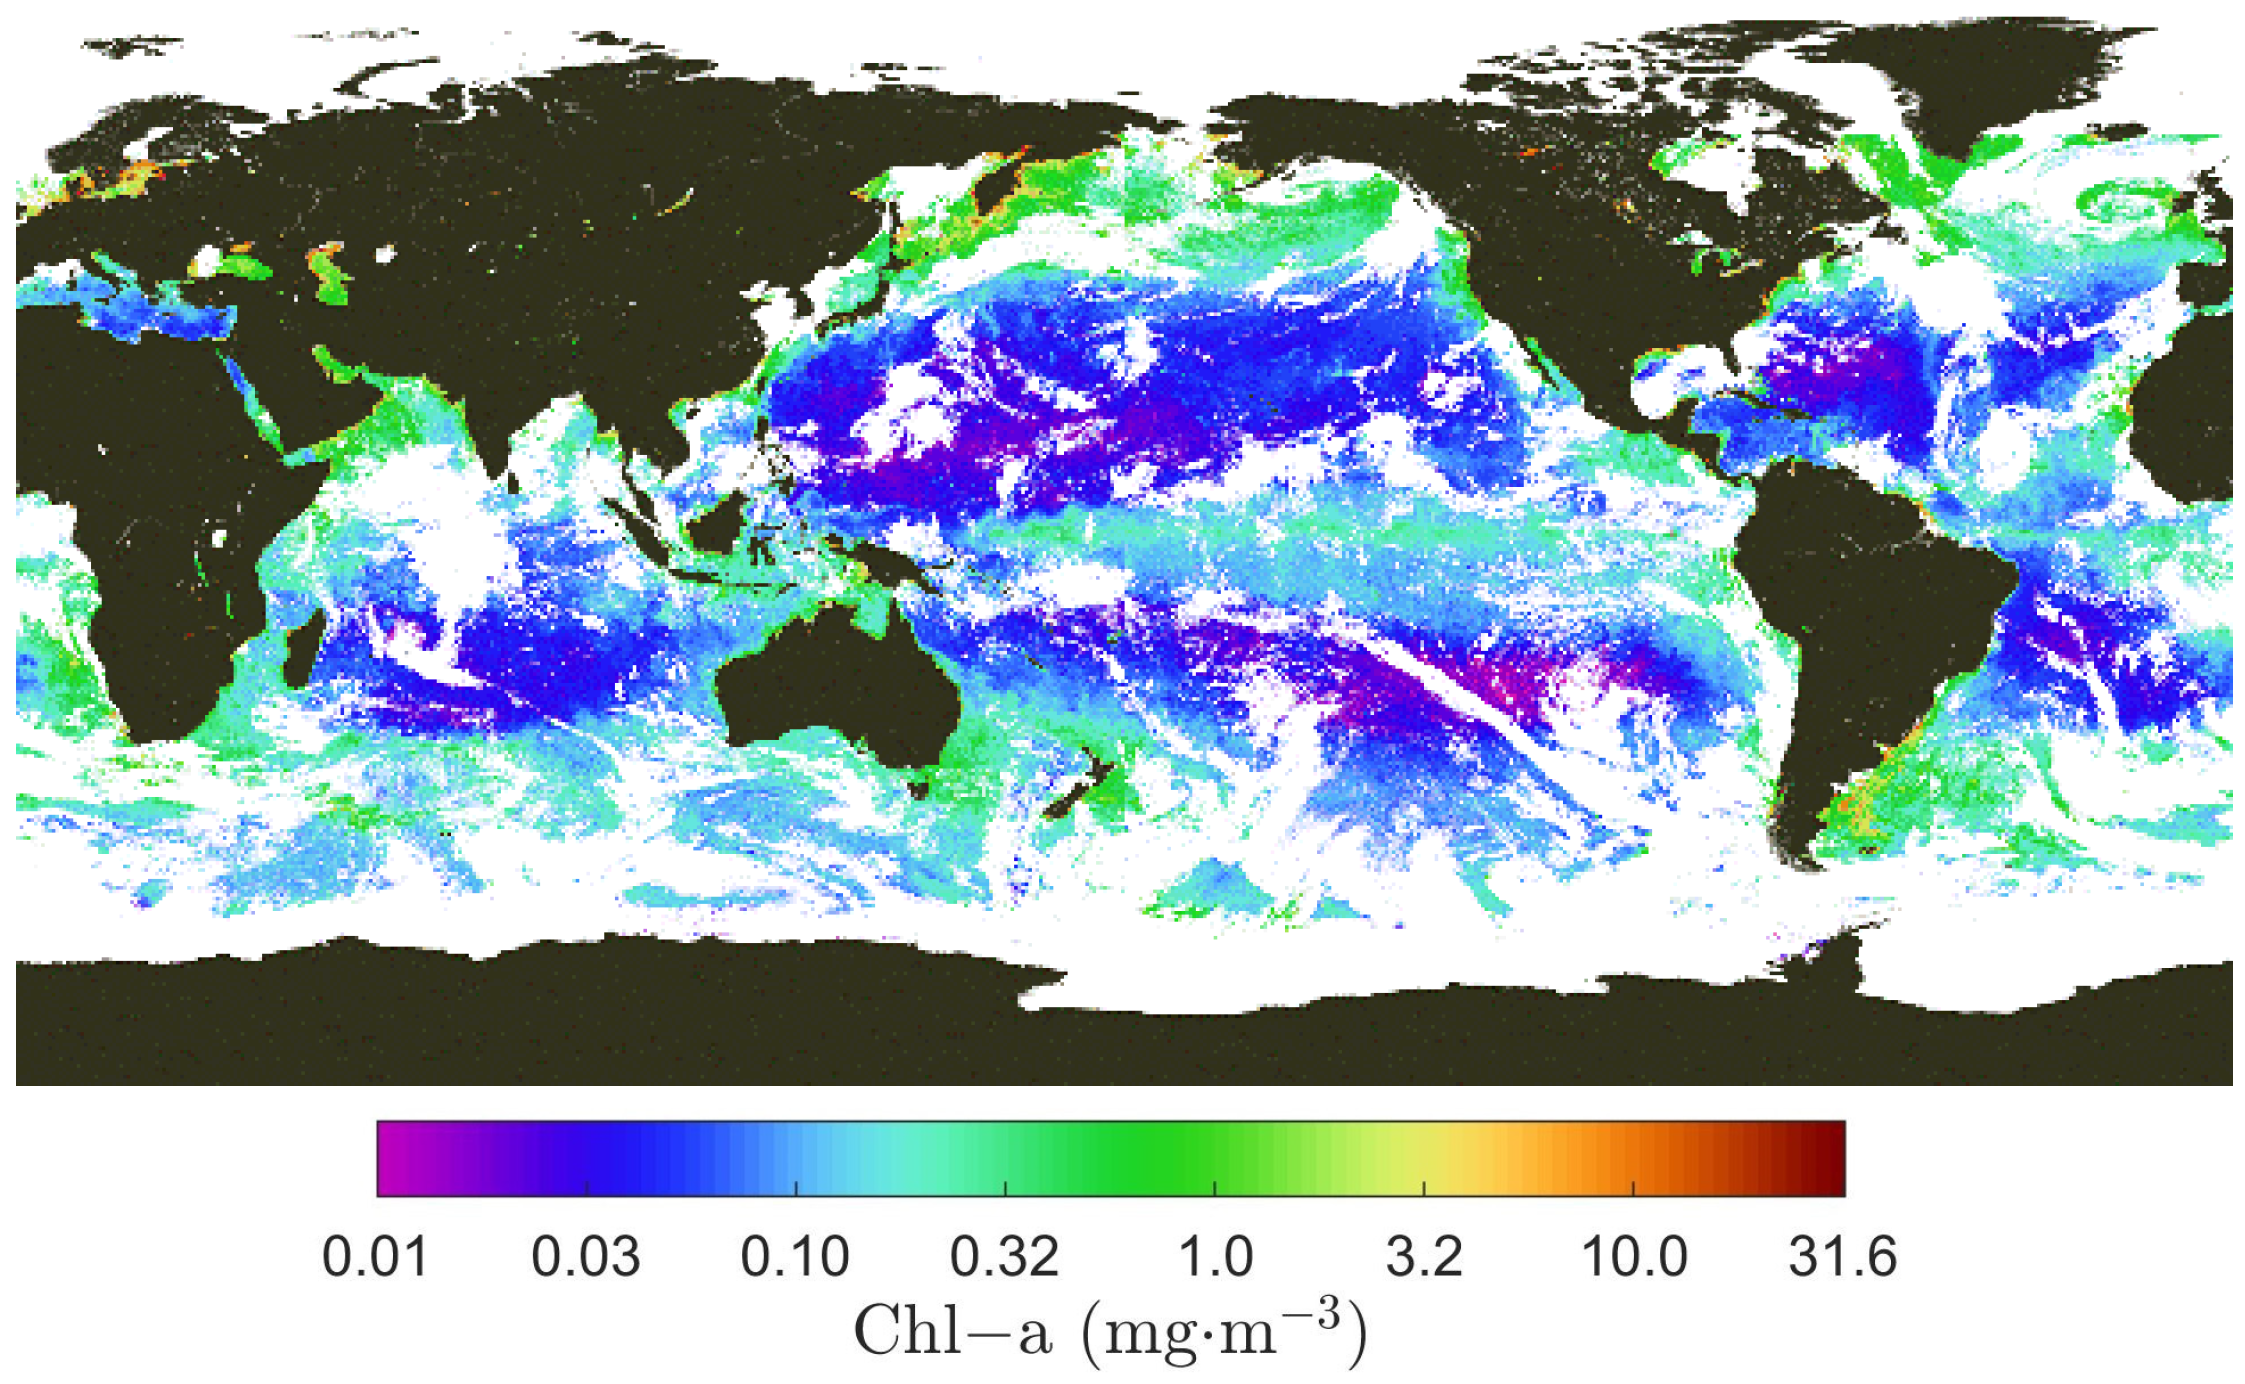
The Chl-a concentration from the ten satellite-based sensors referenced above was merged to generate an integrated product representing all satellite observations, as shown in Figure 6. The results demonstrated an increase in the coverage rate of the Chl-a concentration compared with that of previous multi-sensor integrations. The remaining data gaps primarily occurred in cloud-covered areas and high-latitude regions, whereas observational voids caused by sensor-specific limitations—such as swath width constraints and sun-glint effects—were substantially reduced.
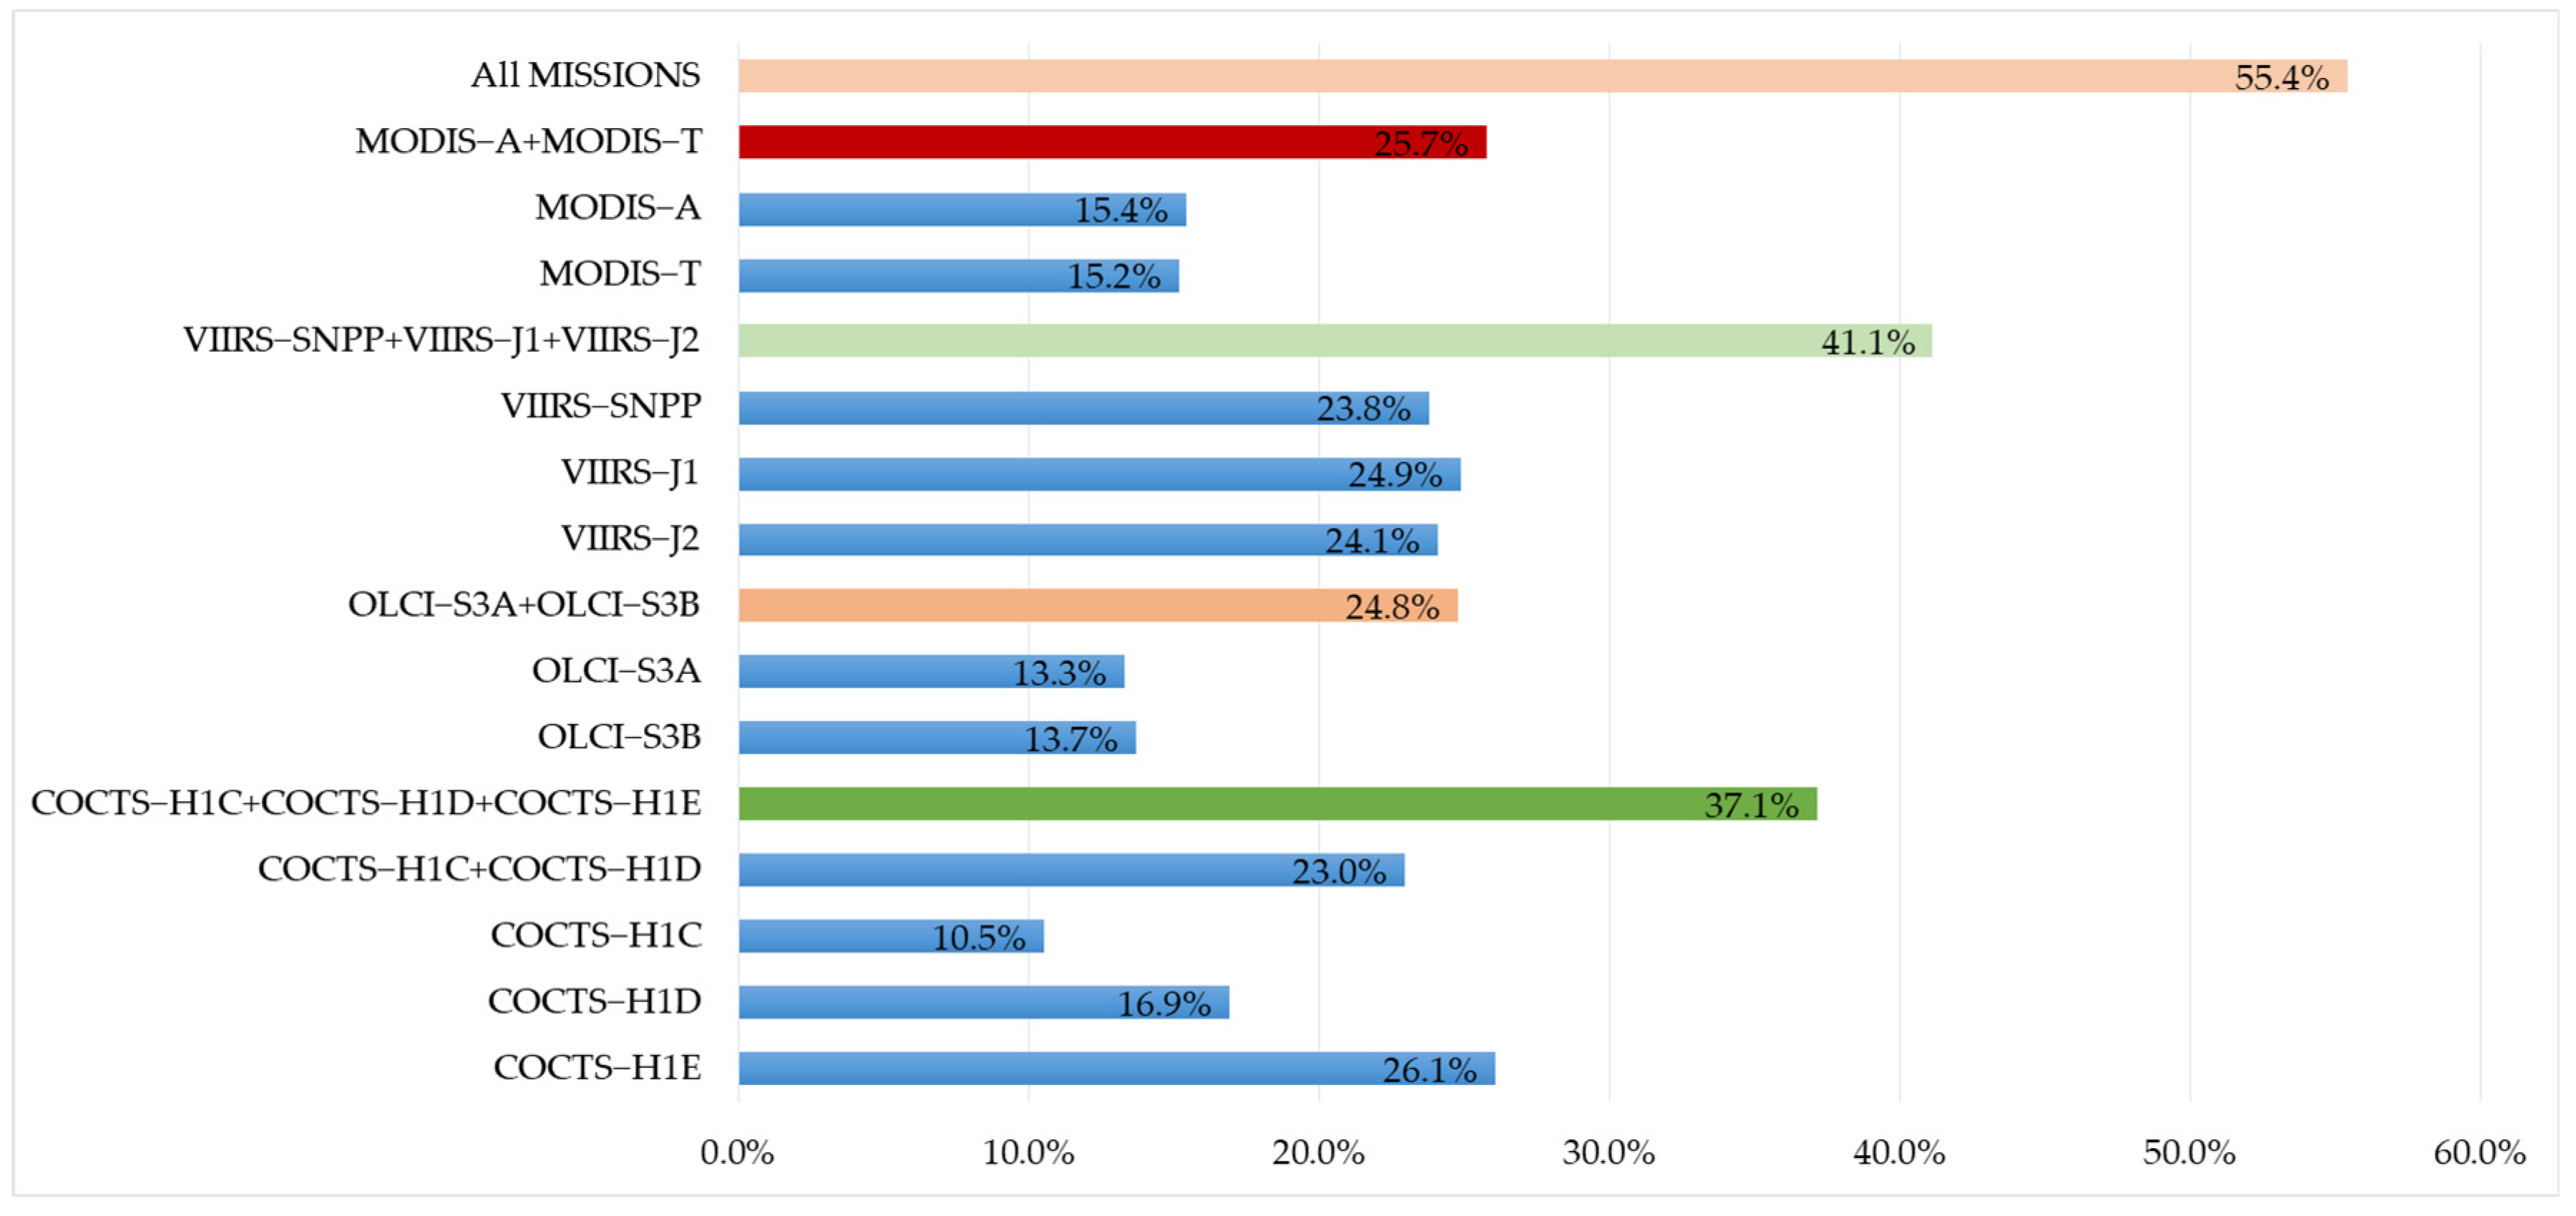
The spatial coverage of daily global Chl-a concentration measurements collected by ten satellite-based sensors was analyzed. To reduce errors caused by random factors, the average daily data coverage of a 4 km grid from 6 October to 8 October 2024, was analyzed, with a statistical area of 65°S~65°N. The coverage statistics of the Chl-a concentration from the ten single sensors and the merged results from two MODIS sensors, three VIIRS sensors, two OLCI sensors, three COCTS sensors, and all ten sensors are shown in Figure 7.
The coverage rates of the tri-sensor merged Chl-a concentration reached 41.1% (VIIRS) and 37.1% (COCTS). With respect to two-sensor merging, the coverage rate reached 25.7% (MODIS) and 24.8% (OLCI). Among the single sensors, the COCTS2 exhibited the highest coverage rate, at 26.1%. The results shown in Figure 7 confirm that multi-sensor merging significantly enhances the effective data coverage rate, with the coverage rate increasing proportionally to the number of sensors integrated. For individual sensors, both the swath width and spatial resolution critically influence the coverage performance. Large swath widths are correlated with higher coverage rates, as exemplified by the 1270 km swath of the OLCI, which yields a relatively low coverage (13.3% for Sentinel-3A and 13.7% for Sentinel-3B). Similarly, a higher spatial resolution increases coverage by enabling the retrieval of valid observations in partially cloud-contaminated regions through resolution-enhanced cloud-free subpixel detection. When binning methods are applied for Chl-a concentration downscaling [42], grid cells containing valid subpixel retrievals are registered as fully observed. This resolution principle explains why the HY-1E COCTS2 sensor (as shown in Figure 7) achieved the highest coverage (26.1%) among the three COCTS sensors. Its native 500 m resolution Chl-a product substantially outperforms the 1.1 km resolution data from the HY-1C and HY-1D COCTS sensors.
As shown in Figure 7, the three COCTS merged dataset achieves 37.1% coverage, significantly higher than the 23.8% coverage for a single sensor of VIIRS-SNPP. The study in Liu and Wang (2018) showed that the single sensor of VIIRS-SNPP can be used for Chl-a concentration reconstruction via DINEOF [12]. So the coverage three COCTS merged dataset is sufficient to support reliable DINEOF reconstruction in this study.

3.2. Evaluation of the Reconstruction Results and Their Accuracy

To address spatial data gaps, the DINEOF reconstruction method is primarily employed as an interpolation solution. Consequently, higher data coverage rates directly enhance both the efficiency and accuracy of the reconstruction process. To optimize the results, incorporating as much satellite remote sensing data as possible as inputs is advisable. However, the satellites mentioned above are operated by diverse nations or organizations, leading to variability in the timeliness of data acquisition during operational product generation. To ensure timely delivery of data products, a subset of available data sources may be selected on the basis of accessibility. We used the merged Chl-a concentration from three COCTS sensors aboard China’s ocean color satellites as inputs to evaluate the quality of the reconstructed Chl-a concentration. For comparative assessment, concurrent Chl-a concentration merged from three VIIRS sensors were also employed as inputs, and the resulting reconstructions were systematically compared with the COCTS-based outputs.
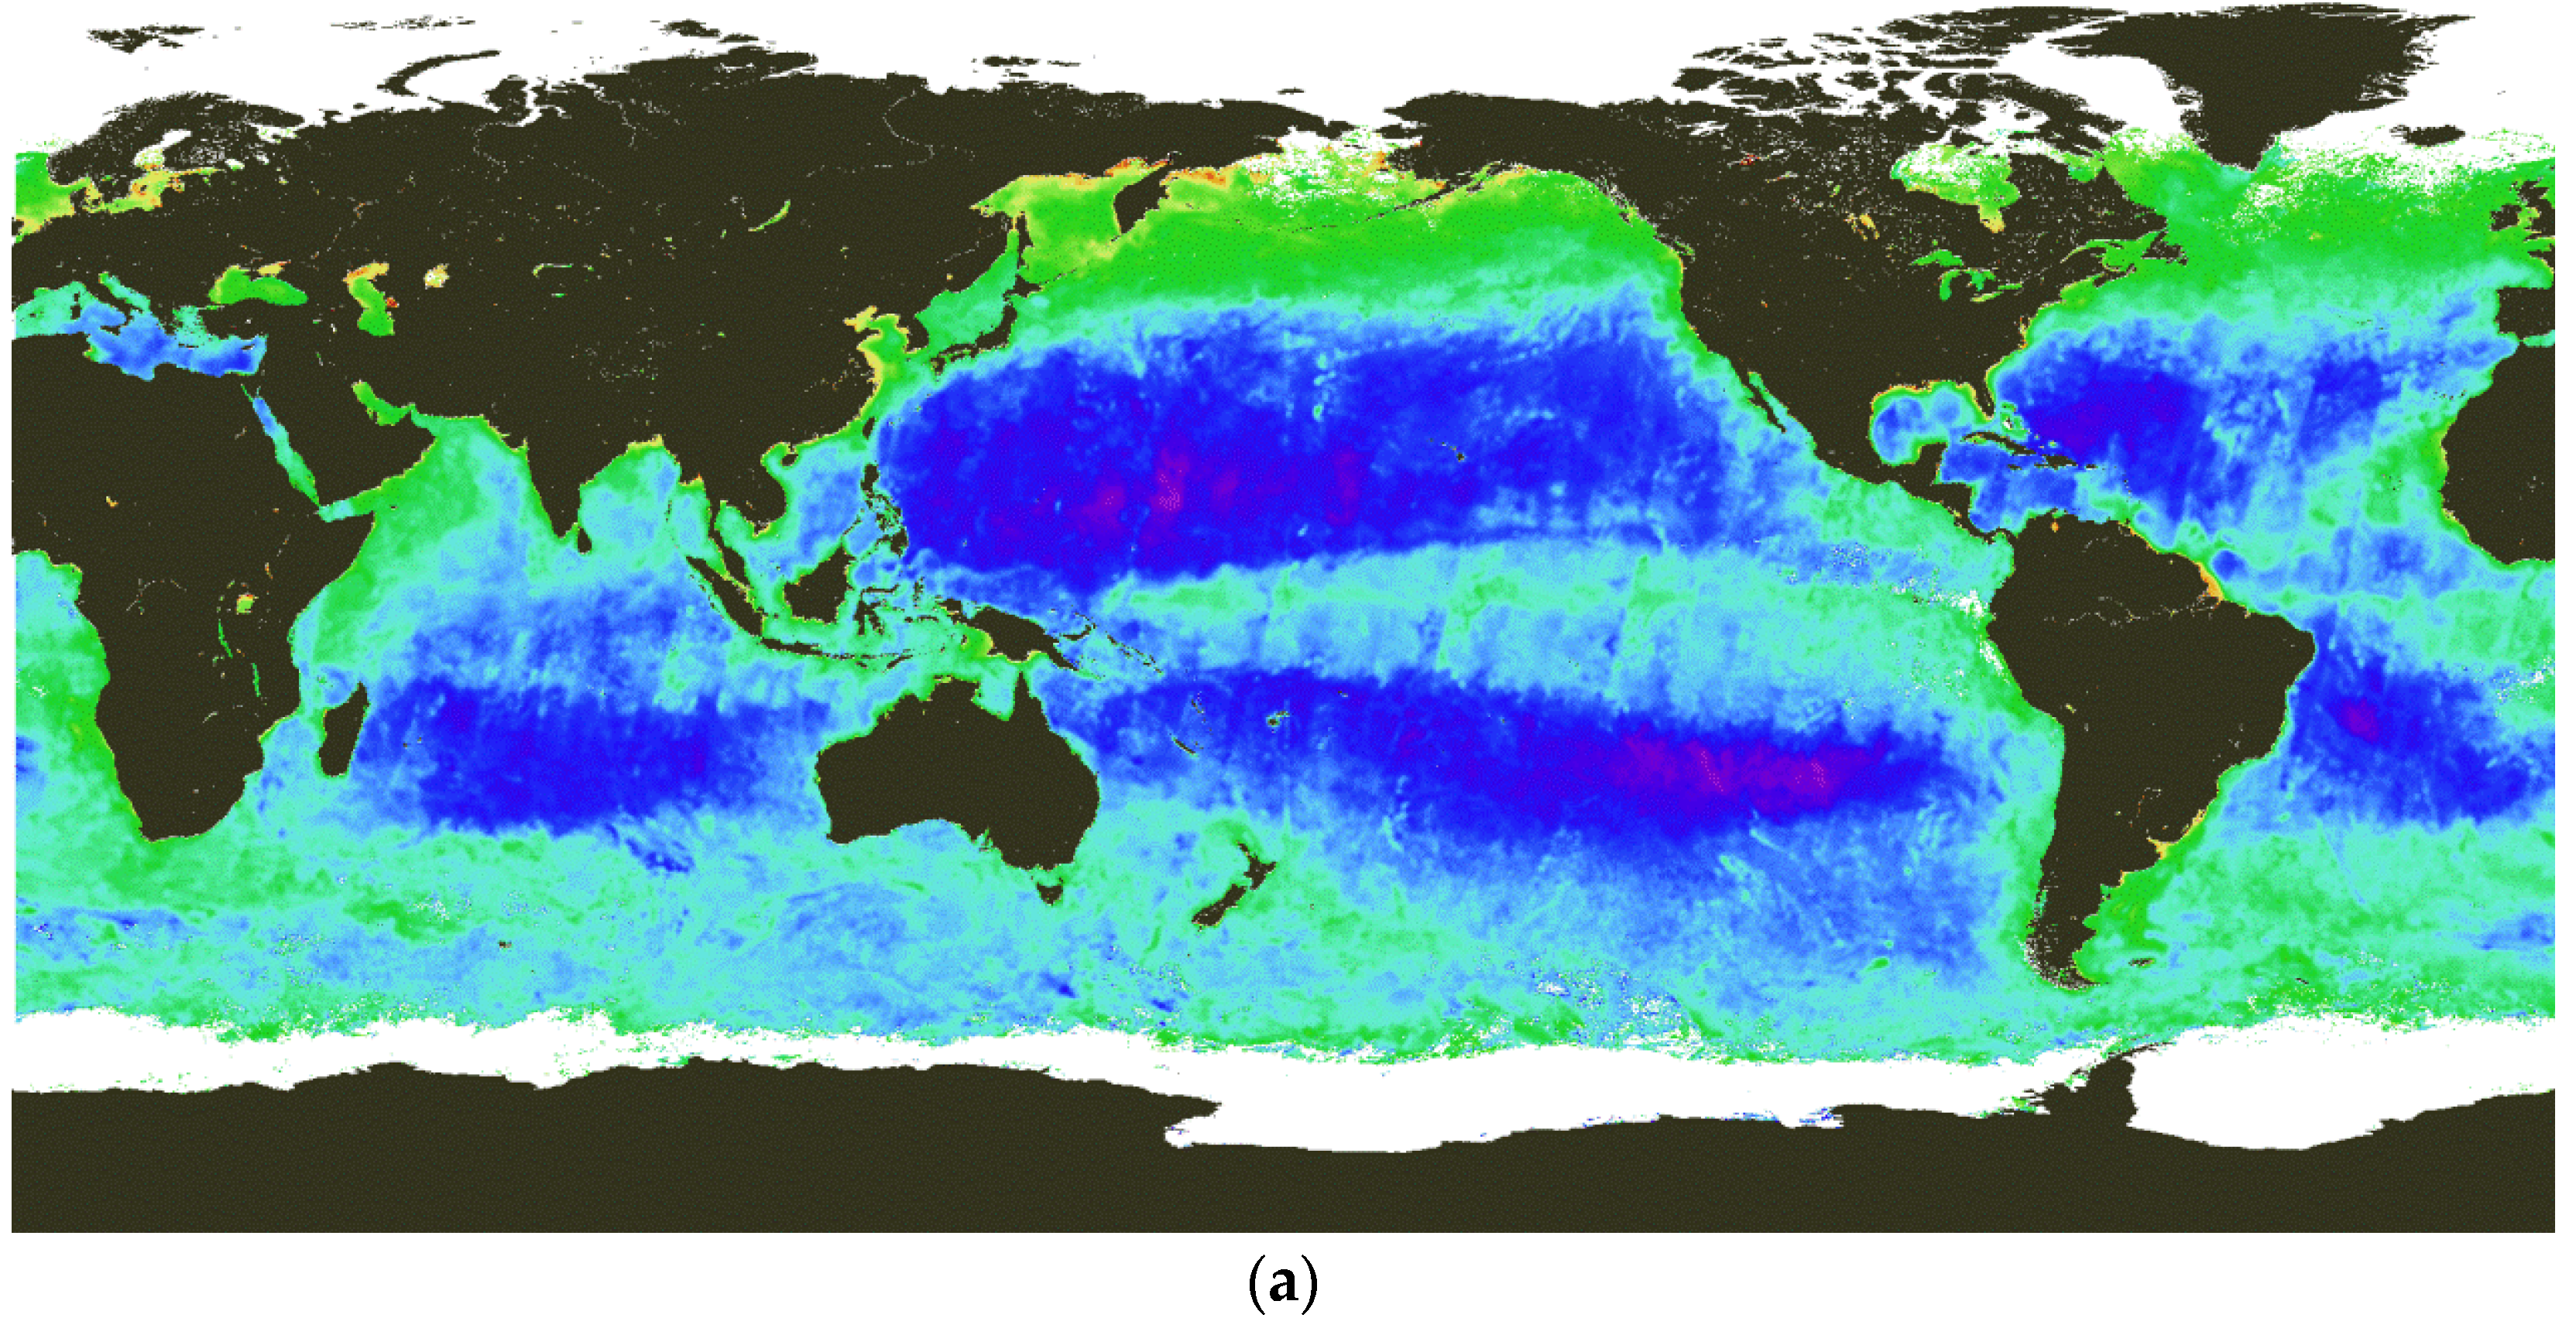
Figure 8a shows the reconstructed Chl-a spatial distribution derived from the three COCTS sensors on 6 October 2024. In contrast, Figure 8b shows the reconstruction results from the three VIIRS sensor datasets as inputs under identical temporal conditions.
The reconstructed Chl-a concentration derived from COCTS data exhibit a spatial distribution that is generally consistent with the VIIRS-based reconstruction results, as illustrated in Figure 8. Notably, the striping artifacts observed in the oligotrophic oceanic regions shown in Figure 8a may be attributed to the lower quality of the input COCTS data sources, as indicated by the validation records. Quantitative comparison between the reconstruction results derived from distinct data sources (Figure 8a vs. Figure 8b) revealed a strong linear correlation (Pearson correlation coefficient R = 0.93), with a mean bias of 0.08 (the unit of  10 b i a s  is mg·m−3) and a mean relative error of 26% between the two reconstructed datasets. Statistical analysis of daily data spanning 1 to 30 October 2024, yielded the following results: a mean bias of 0.09 (the unit of  10 b i a s  is mg·m−3), a mean relative error of 26%, and a mean linear correlation coefficient of 0.93. The mean relative error is of the same order of magnitude as the evaluation results reported in Ye et al. [28].
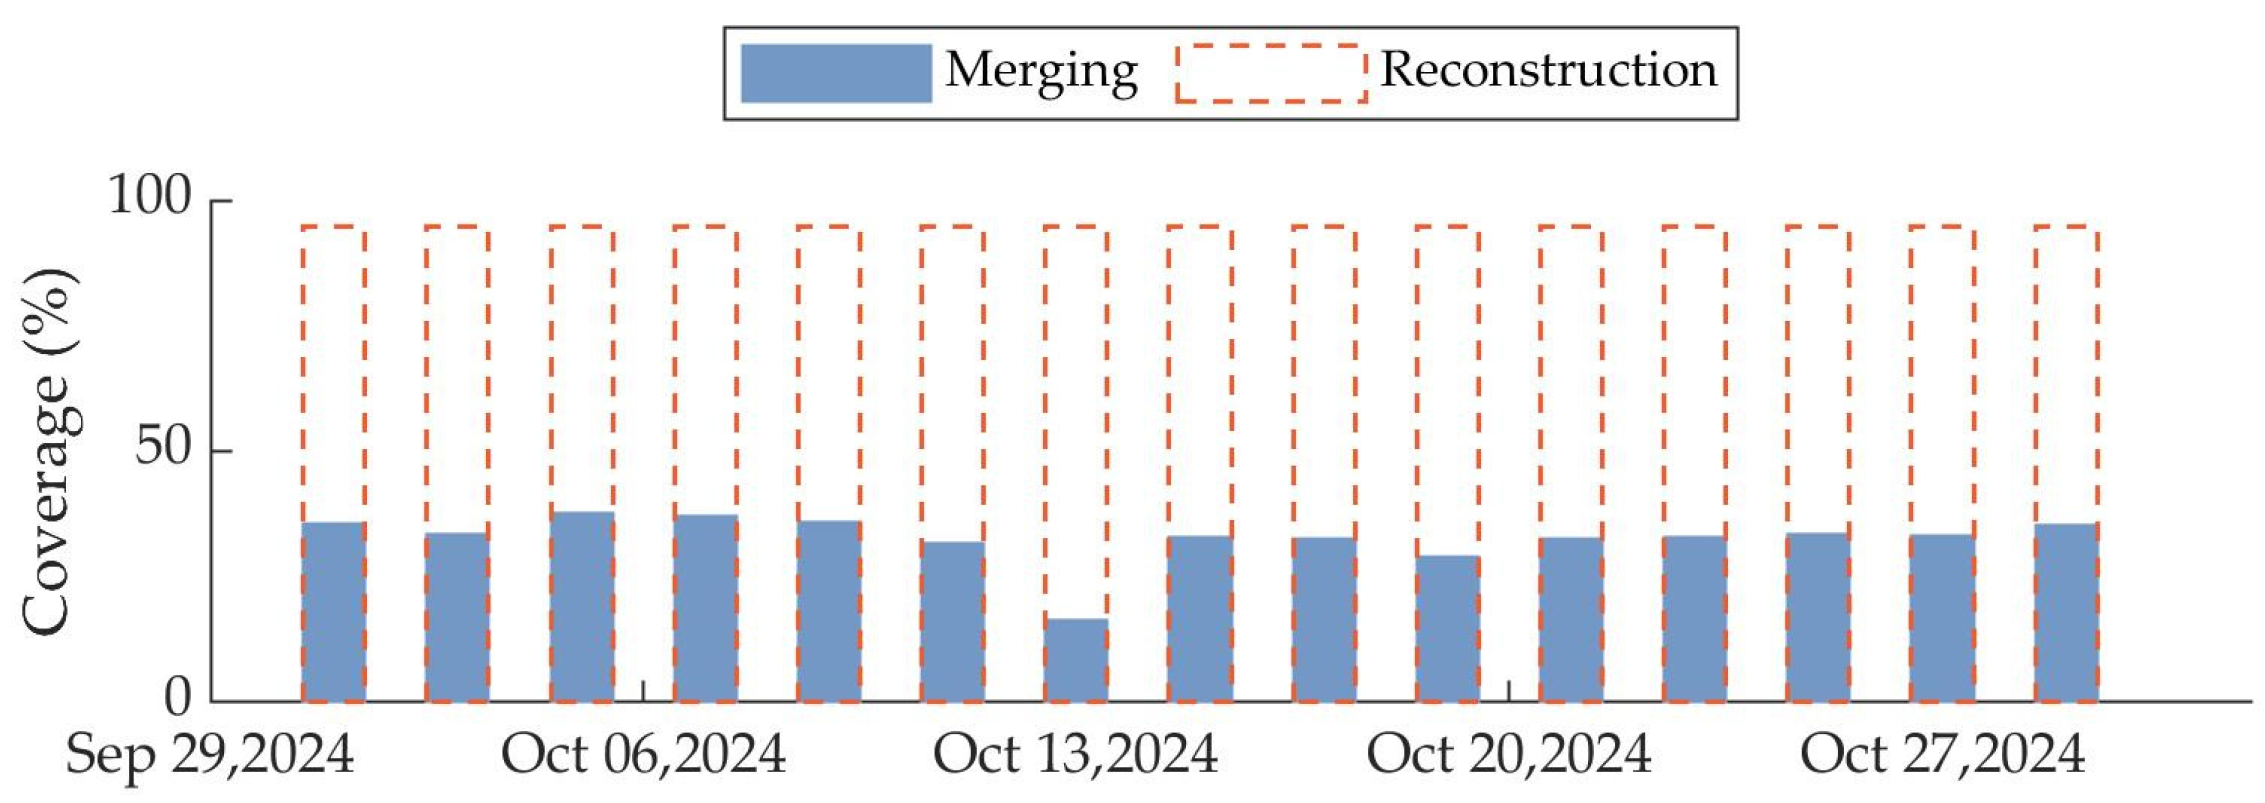
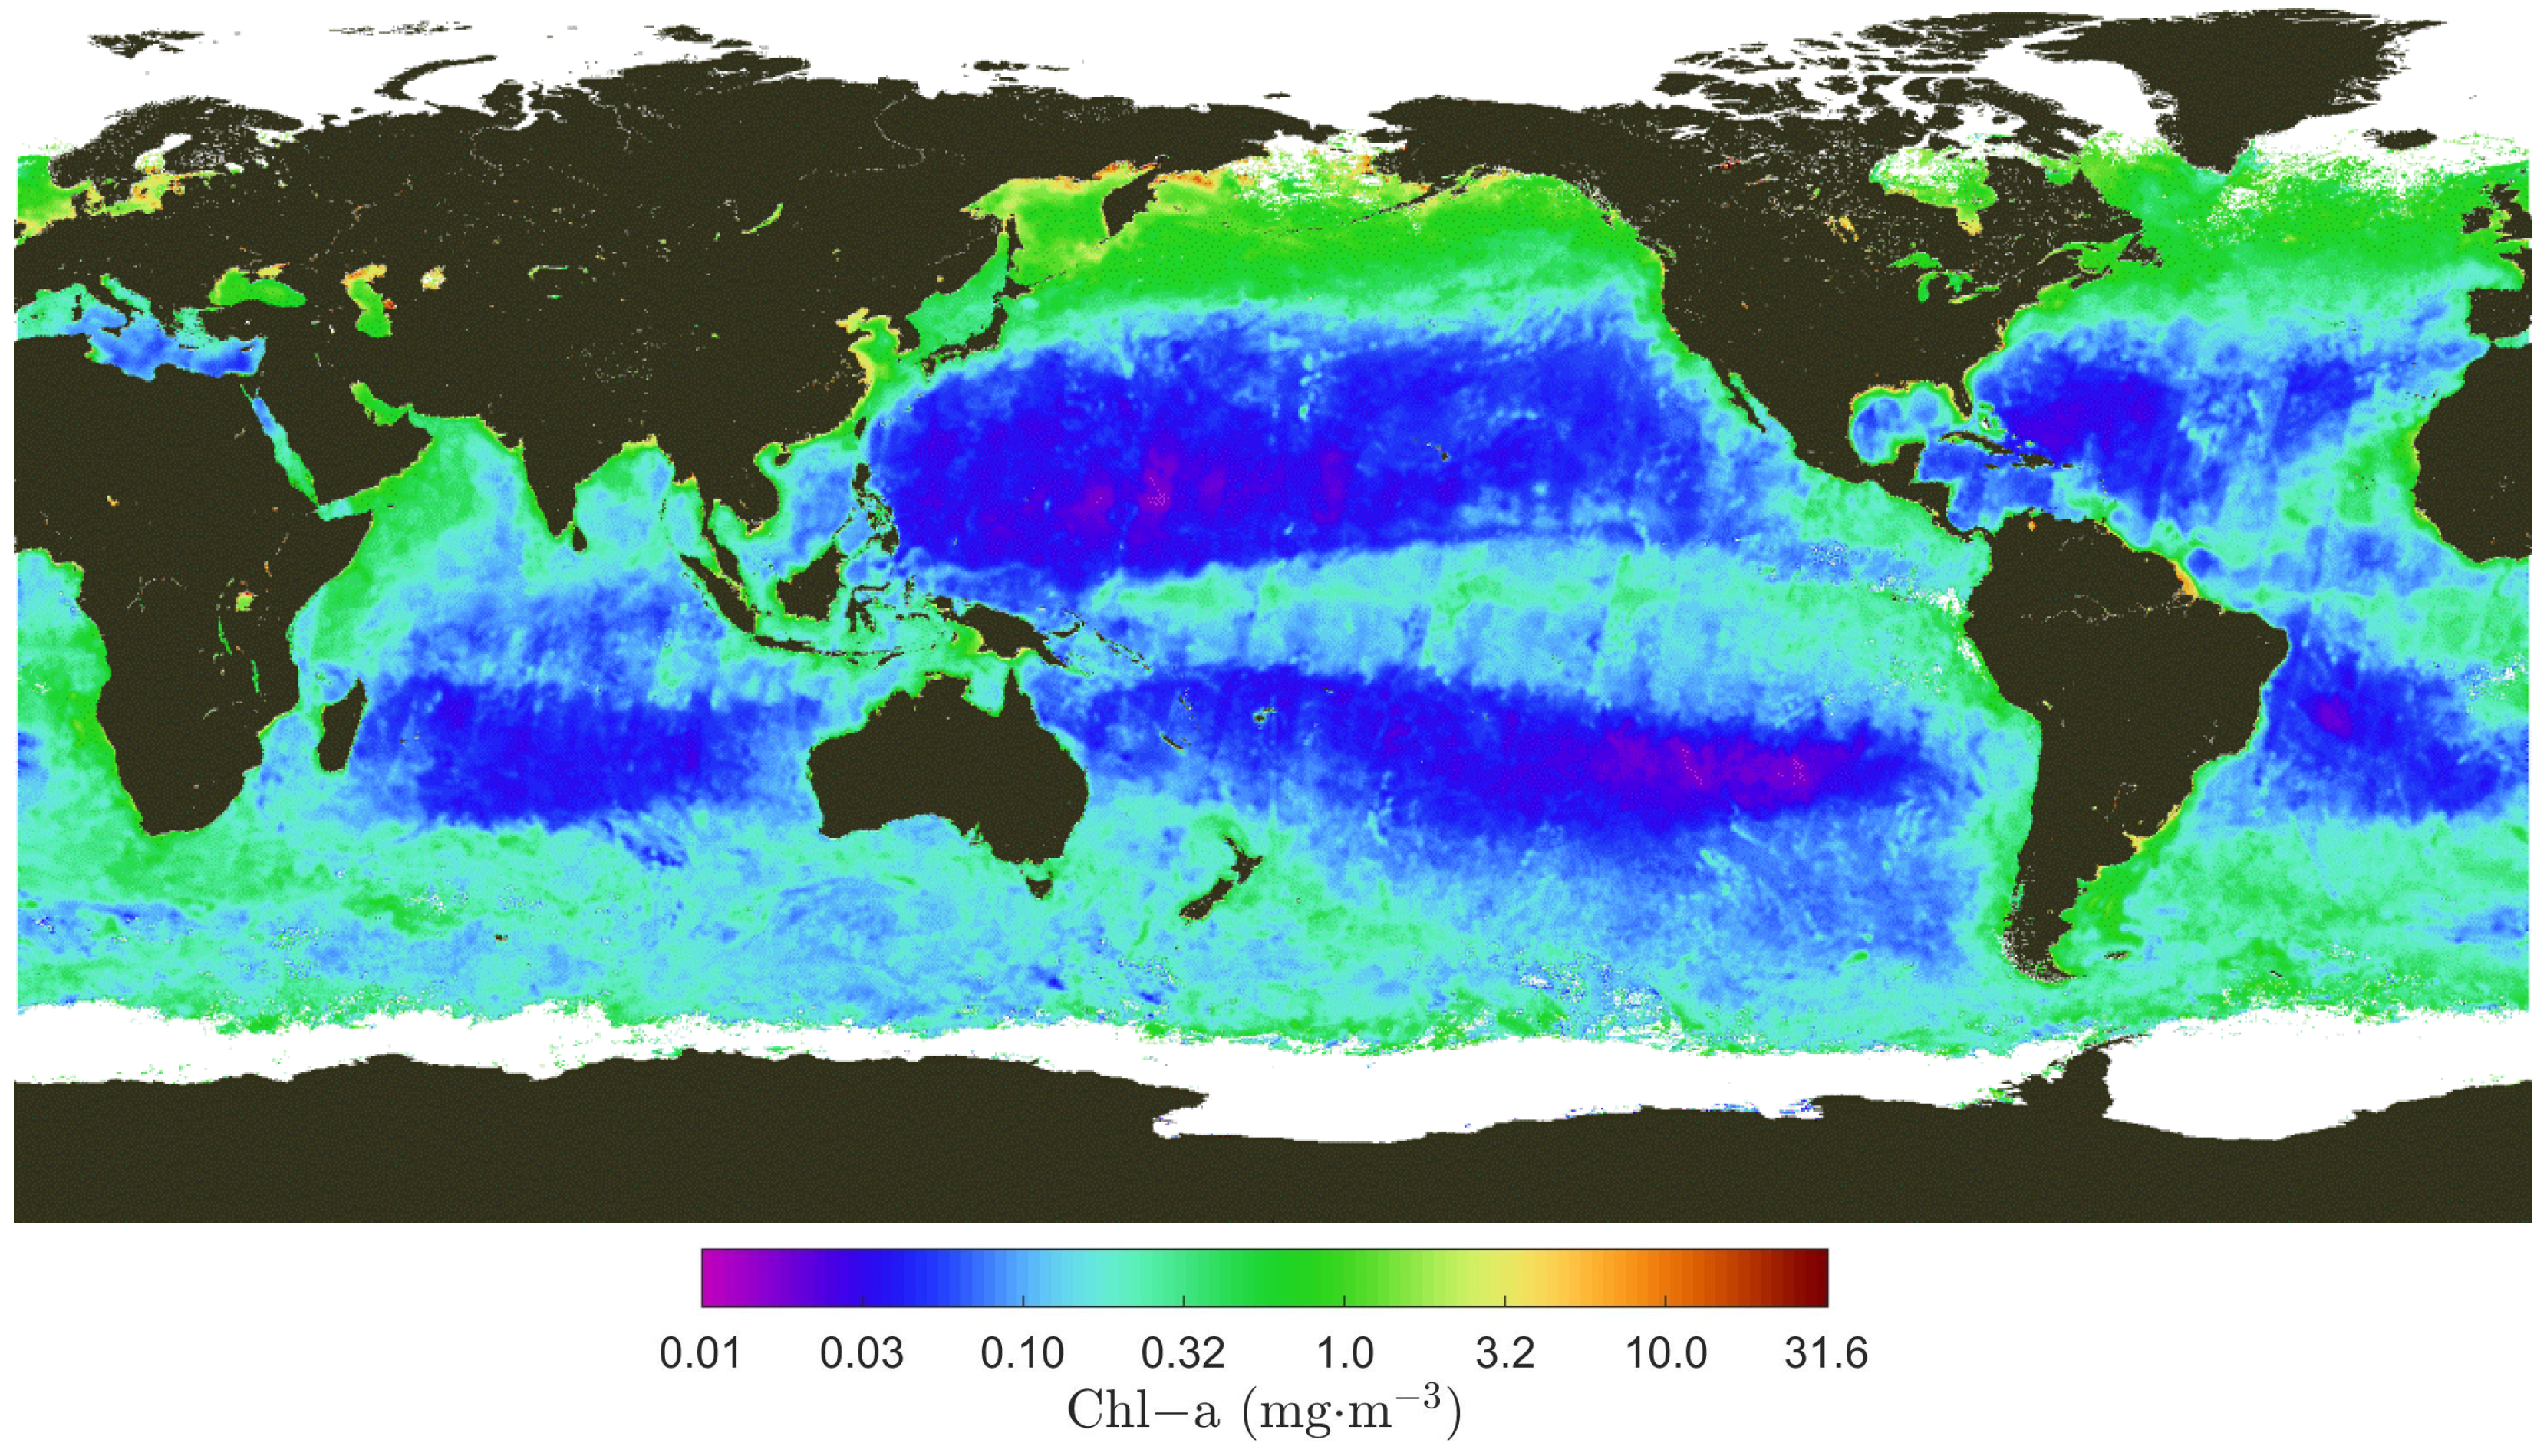
Comparison of Figure 5d and Figure 8a reveals a significant improvement in the coverage of reconstructed Chl-a concentration data, demonstrating that satellite data reconstruction technology effectively enhances data completeness. Figure 9 presents the coverage histograms of merged Chl-a concentration data from COCTS on the HY-1C/D/E satellites and the results reconstructed using the DINEOF method during October 2024 (statistical range: 65°S–65°N). To optimize visualization, the figure adopts a skip-day sampling strategy, displaying coverage statistics for only one day every two days. Analysis of Figure 9 reveals that the daily merged Chl-a concentration data coverage from COCTS on the HY-1C/D/E satellites is less than 38%, whereas after DINEOF reconstruction, the effective coverage increases to approximately 95%. It should be noted that the reconstruction coverage does not reach 100% primarily due to insufficient satellite-valid data in certain high-latitude regions (as shown in Figure 8a,b), limiting the reconstruction effectiveness.
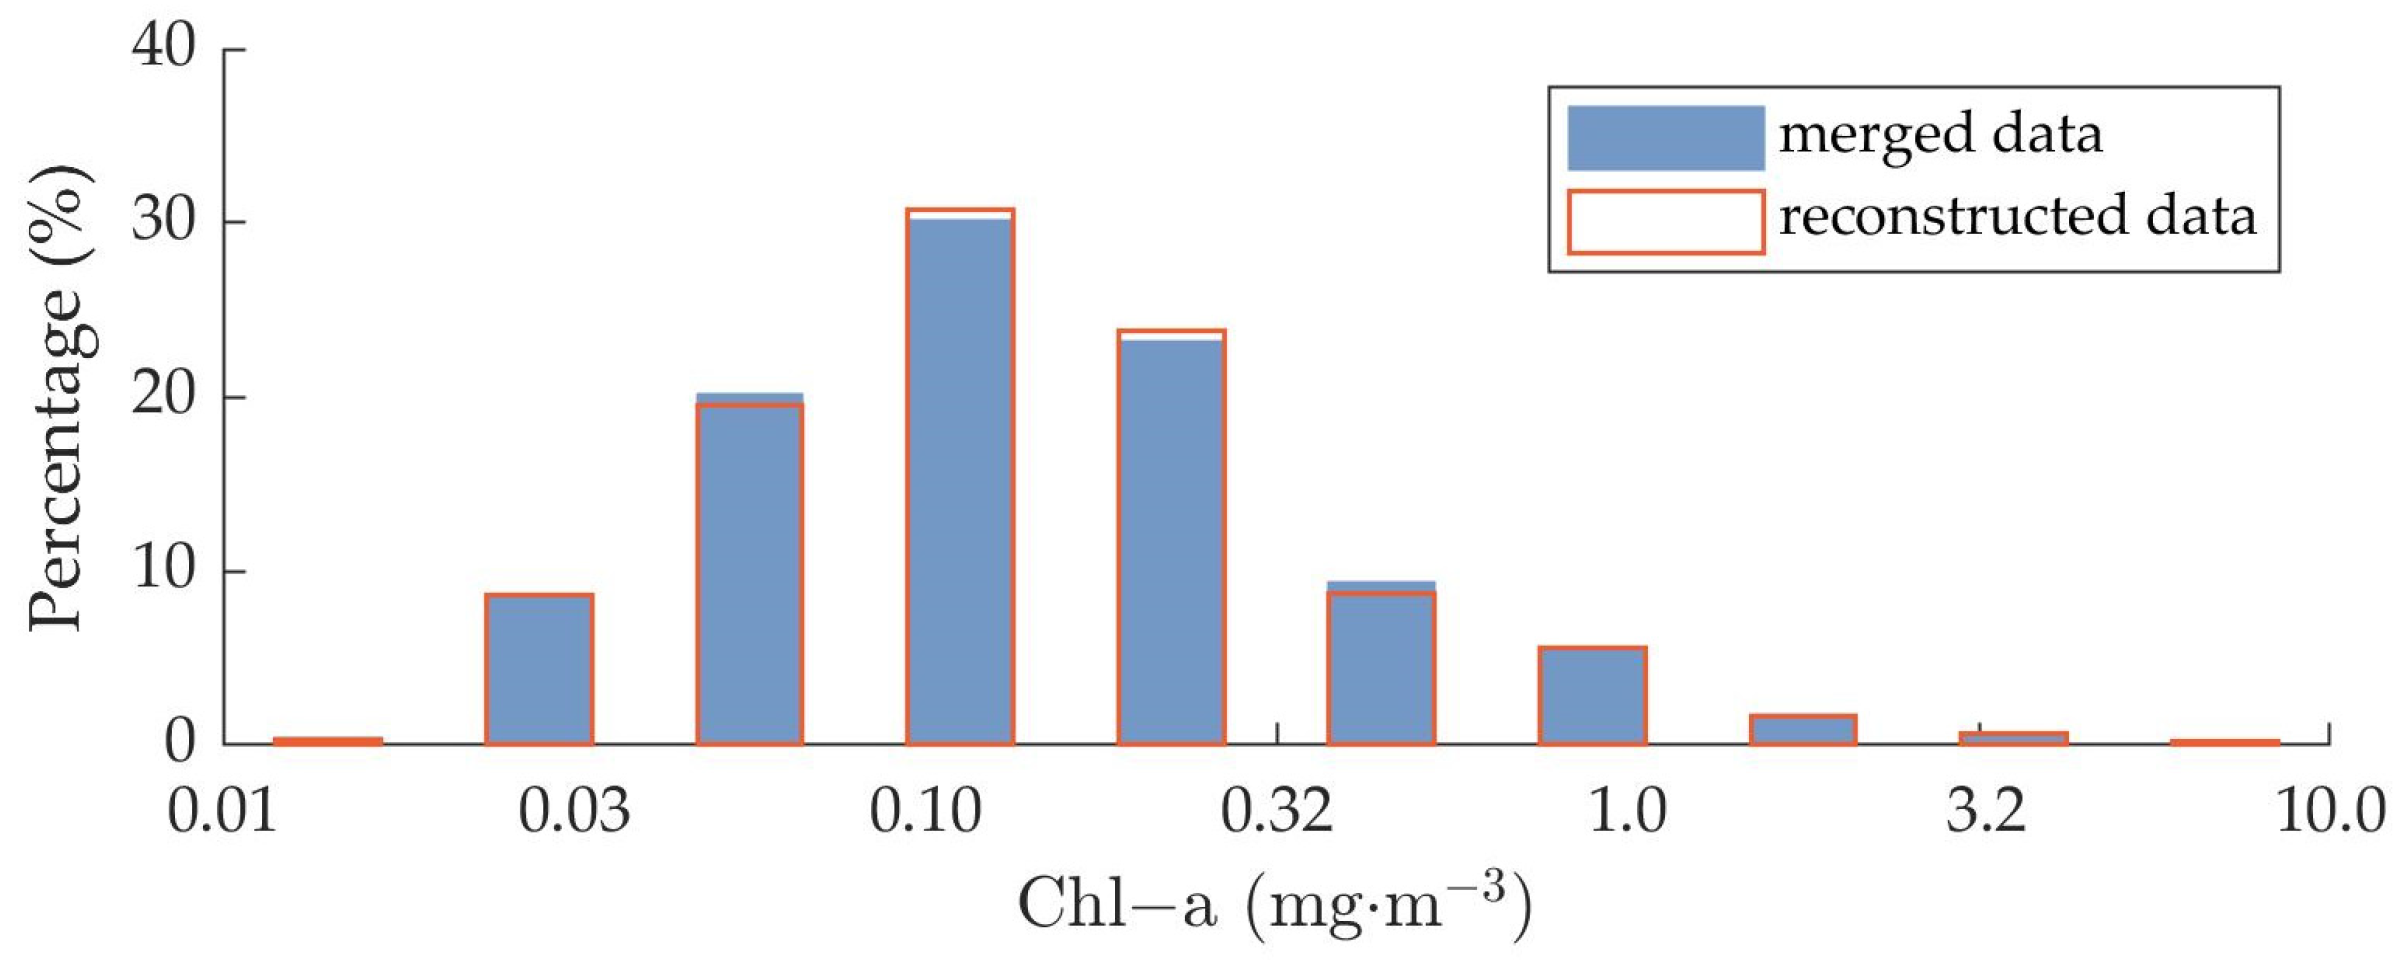
The reconstruction process fills the gaps in the merged data, resulting in differences in coverage between the merged data and reconstructed results (as shown in Figure 9). Therefore, we cannot directly compare their numerical values or statistically analyze their daily histogram distributions. However, further analysis reveals that the monthly averaged coverages of the two datasets are equal, both at 95%. For this reason, we instead conducted a statistical comparison of the monthly averaged Chl-a concentration distributions between the merged and reconstructed data for October 2024 (Figure 10). The results show that the histograms of the merged and reconstructed Chl-a concentration values are nearly identical. This demonstrates that the reconstruction process does not compromise the applicability of these data in long-term time series or climate change studies. Instead, it enhances the coverage of daily data products.
For quantitative assessment of the reconstruction accuracy of the reconstructed Chl-a concentration, the input data were sampled prior to reconstruction via the DINEOF method. The sampled data points served as the ground truth for validation. Concurrently, the sampled points underwent nullification (i.e., modifying the observed values at these locations to invalid values) before use as reconstruction inputs. The reconstructed values at these sampled positions constituted the validation dataset for evaluation. Via the use of the reconstructed Chl-a concentration for the COCTS on 6 October 2024, in a case study, the accuracy of the reconstruction results was assessed. Figure 11 shows the global distribution and locally magnified views of the merged COCTS Chl-a concentration after sampling and nullification of the sample values derived from Figure 5d. To obtain validation samples with extensive geographical coverage and Chl-a concentration representation, uniformly spaced sampling was applied to the input data (a post-sampling magnified view is shown in the lower part of Figure 11). Following data reconstruction, the algorithm effectively reconstructed the missing areas in Figure 11 caused by cloud cover, inter-orbit gaps, and sun-glint effects. Additionally, the artificially created nullified points from sampling were successfully reconstructed. The reconstructed Chl-a concentration distribution is shown in Figure 12.
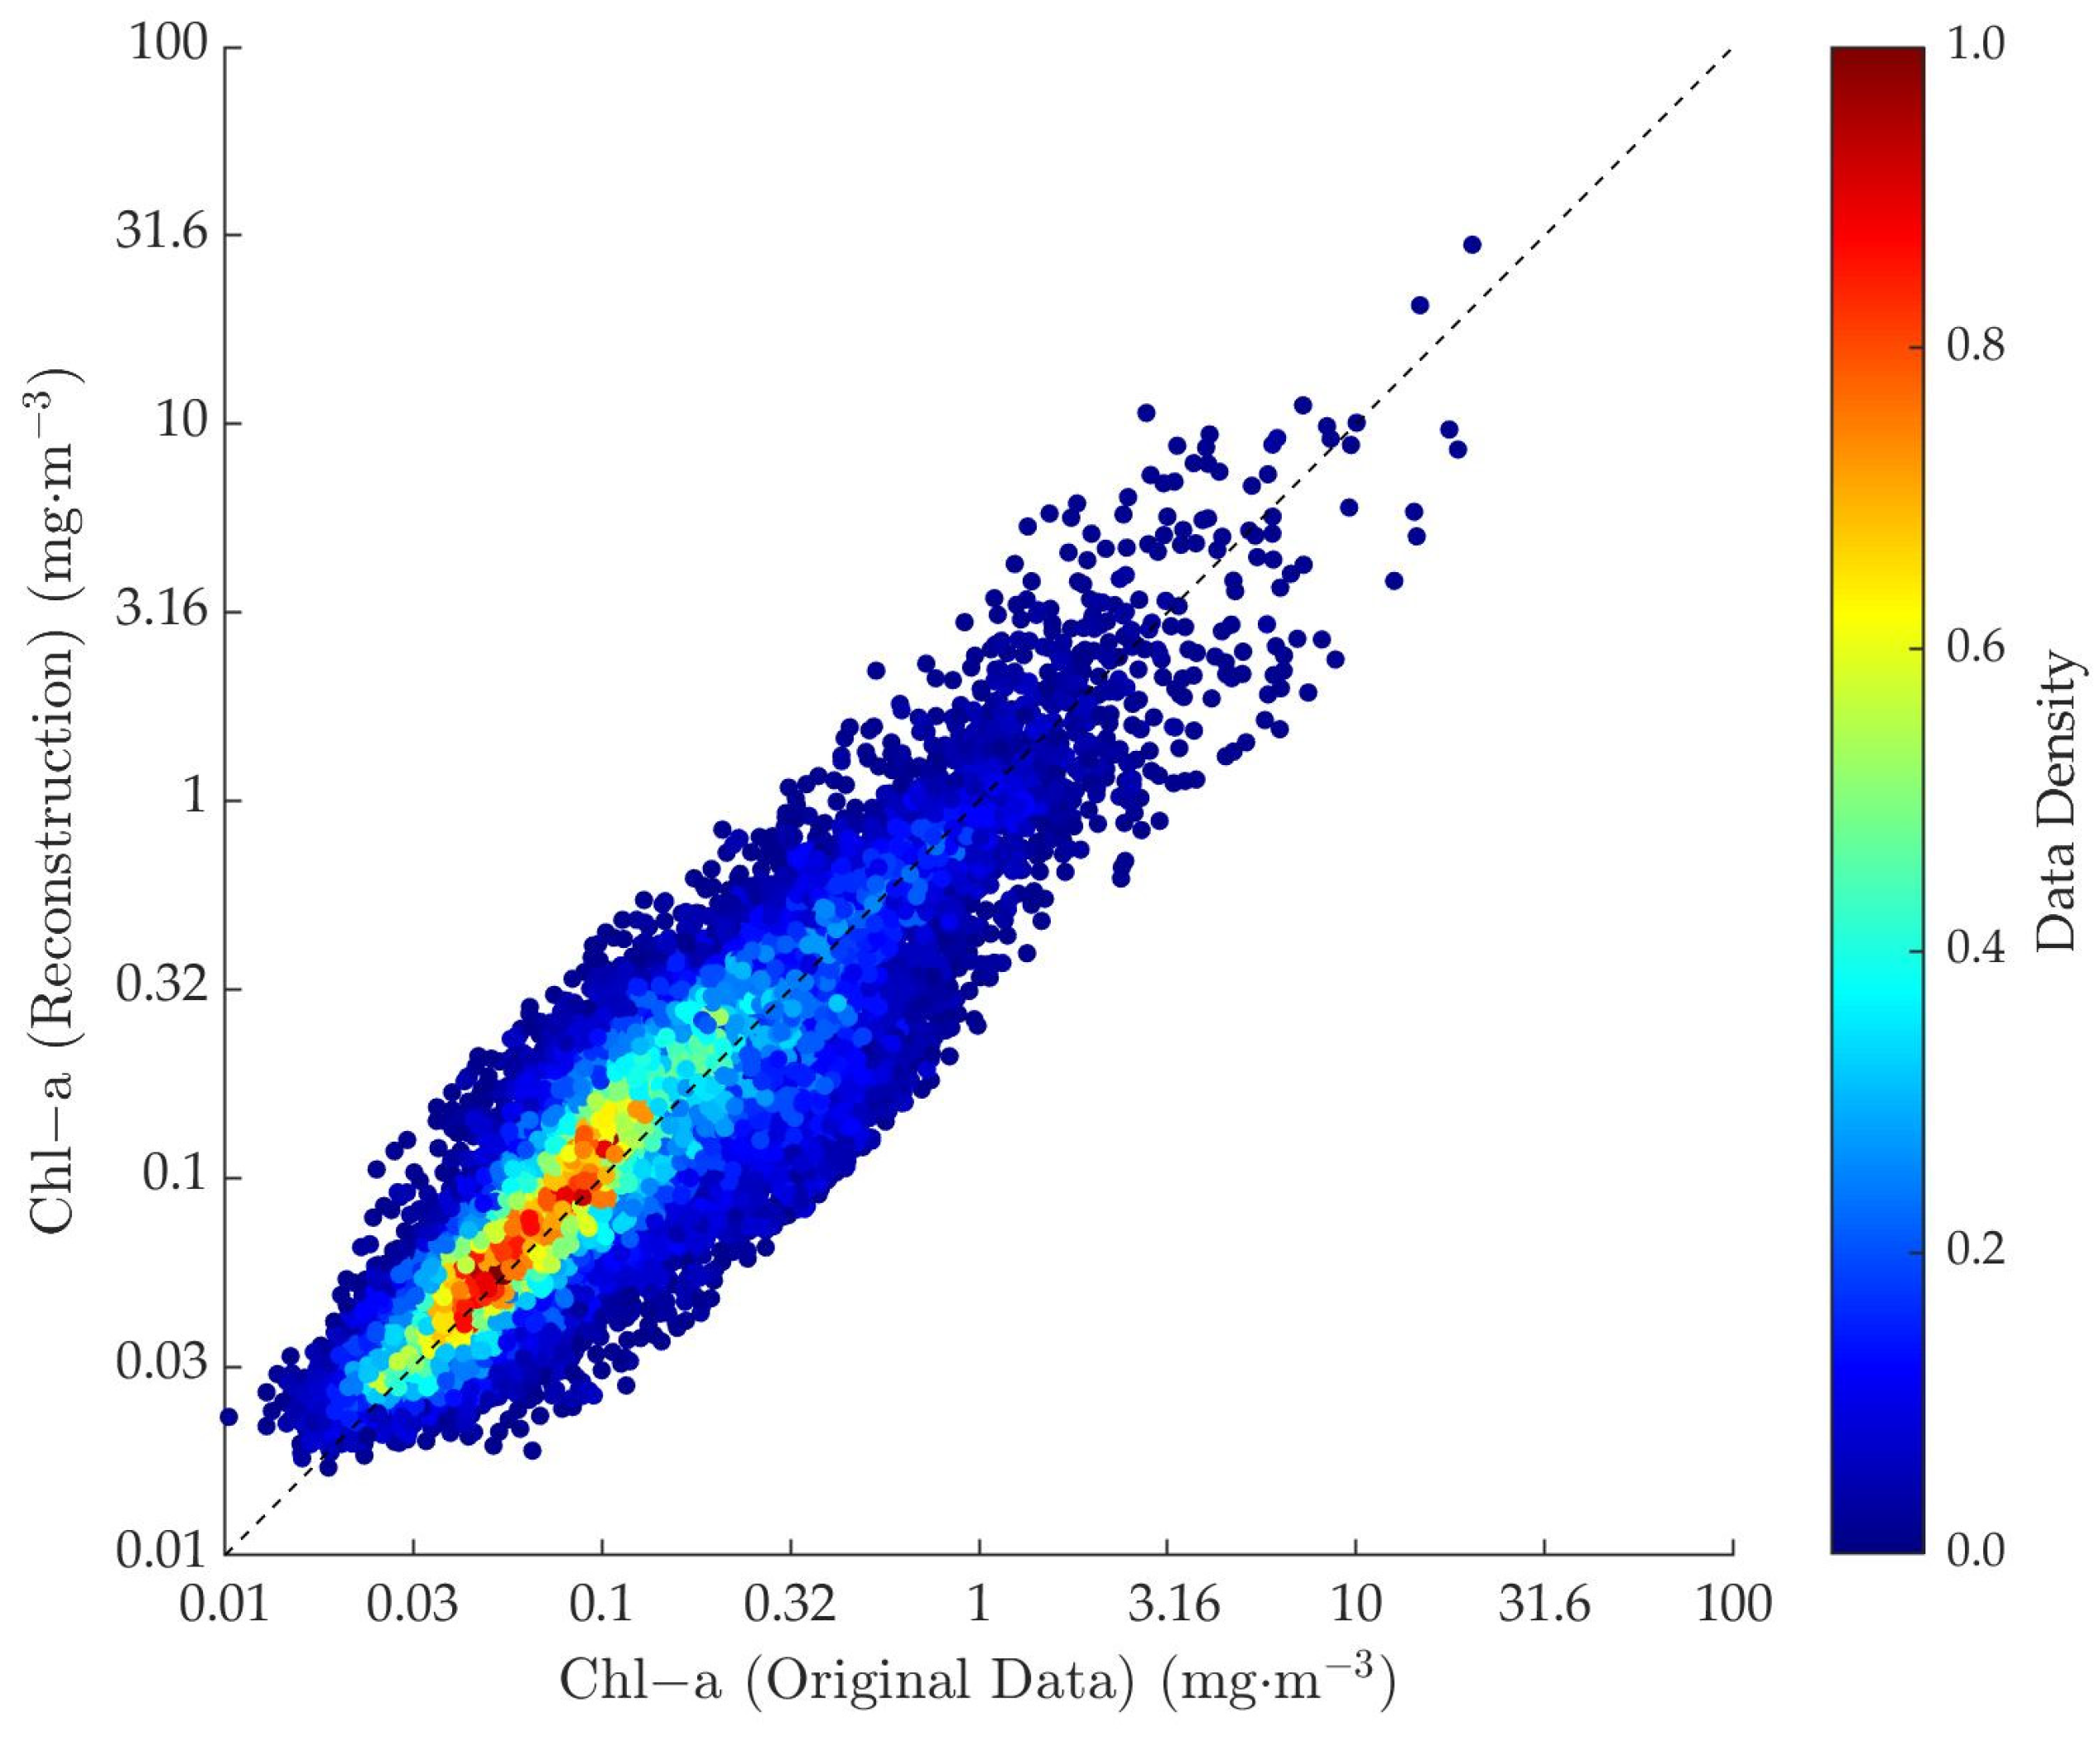
Utilizing the original Chl-a concentration data at the sampling locations depicted in Figure 11, the corresponding Chl-a concentration generated by reconstruction were validated. The validation results demonstrated a relative error of 27% between the reconstructed values and original data, whereas statistical analysis using linear regression revealed a strong and significant relationship between the two datasets, with a correlation coefficient of 0.90 (R = 0.90). The scatter plot shown in Figure 13 validates this correlation pattern. Collectively, the quantitative validation metrics and visual analysis revealed high agreement between the reconstructed outputs and the original inputs, demonstrating that the reconstruction approach successfully reproduces the spatial patterns of Chl-a distribution.

3.3. Application Evaluation of the Reconstruction Results

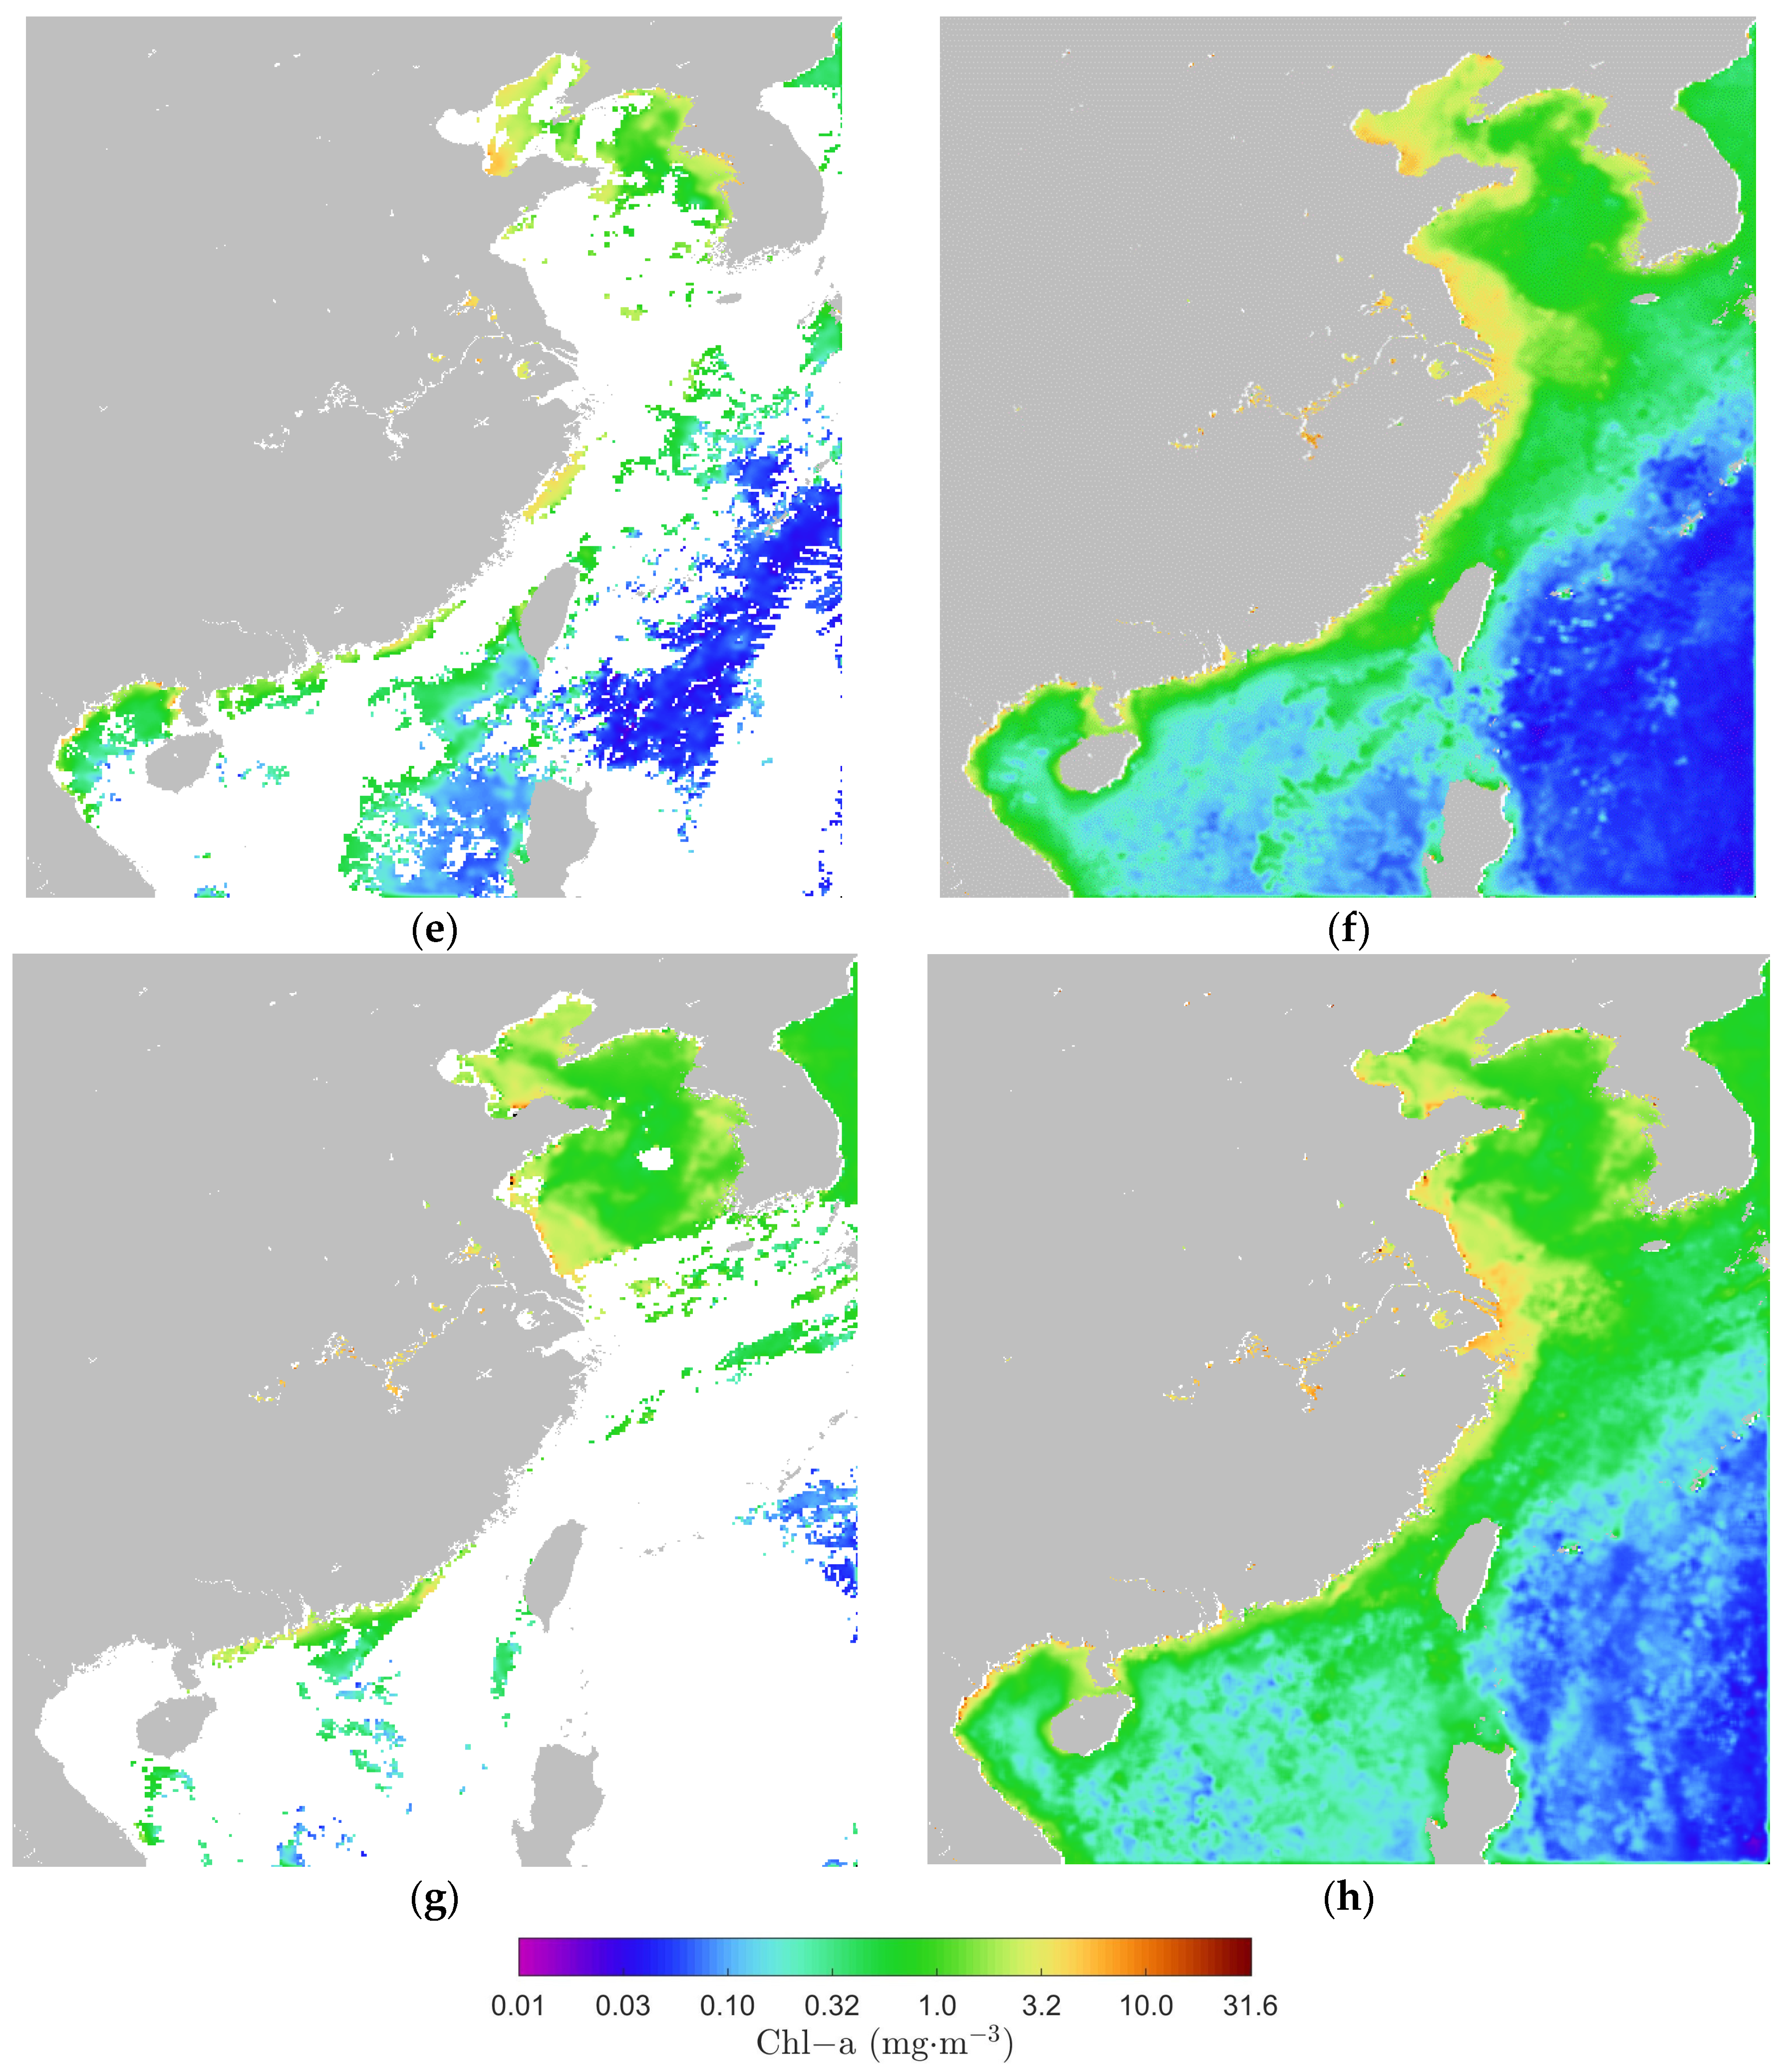
In addition to the quantitative assessment of the reconstructed Chl-a concentration from Chinese ocean color satellites (COCTS) described previously, Chl-a concentration reconstruction products representative of typical oceanic regions were selected to evaluate the reconstruction performance. We employed reconstructed data from October 2024 over the Bohai Sea, Yellow Sea, East China Sea, the northern section of South China Sea, and their adjacent waters as illustrative examples. Figure 14 shows the merged Chl-a concentration products derived from COCTS-H1C, COCTS-H1D and COCTS-H1E and their corresponding reconstructed distributions on 30 September, 10, 20, and 30 October 2024. As shown in Figure 14, via the use of reconstruction, data gaps within the observation areas were successfully filled. The temporal distribution patterns of Chl-a concentration further demonstrate that the reconstructed product with gap-filling captures the spatial and temporal variations in Chl-a concentration in coastal waters.
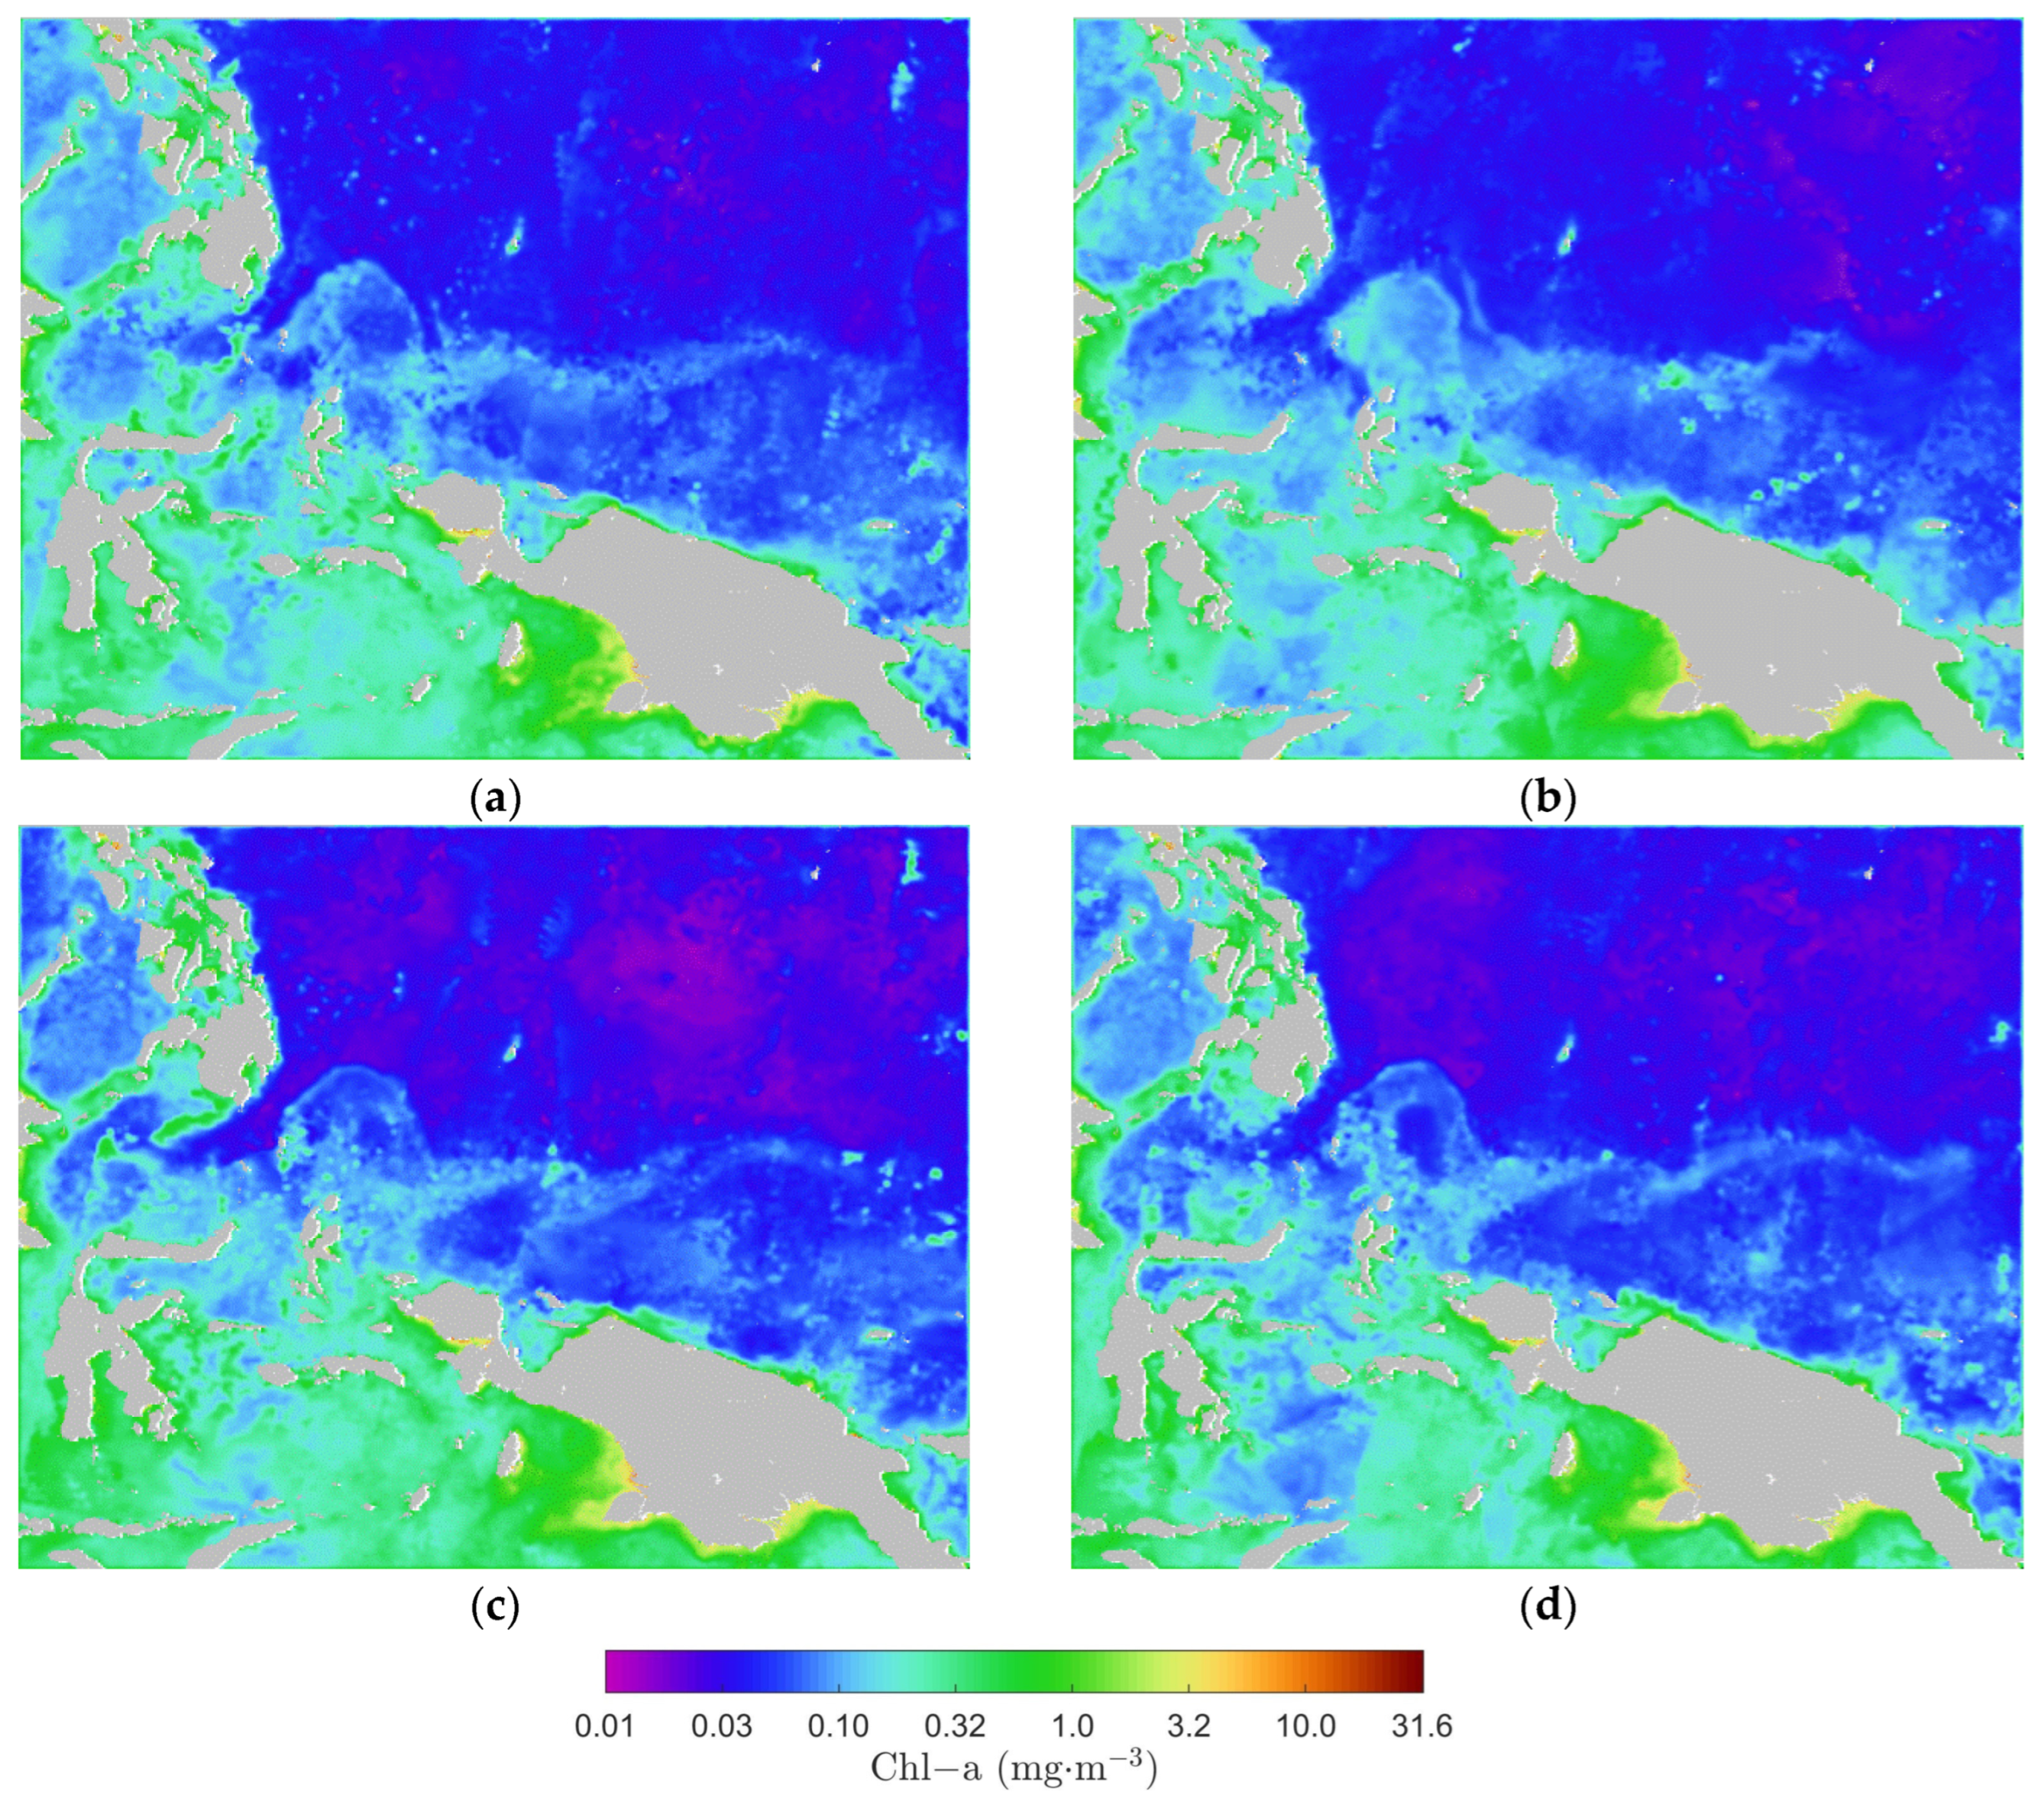
Figure 15 shows the spatial distributions of Chl-a concentration in the waters east of Mindanao and north of New Guinea on 6, 9, 12 and 15 October 2024. These daily resolved distributions were reconstructed on the basis of merged Chl-a concentration data from the COCTS-H1C, COCTS-H1D and COCTS-H1E, which characterize Chl-a as a biological tracer. Through variations in concentration gradients, the images effectively show the morphological configuration and evolution of the equatorial current in this marine region.

4. Discussion

Traditional interpolation methods, such as kriging or inverse distance weighting, rely heavily on spatial/temporal proximity assumptions and often fail to capture complex nonlinear relationships inherent in oceanographic processes. Despite artificial intelligence (AI) being established as an effective method for reconstructing ocean color data, particularly for spatiotemporal reconstruction of critical parameters such as the global-scale Chl-a concentration [18,43,44,45], the DINEOF method exhibits distinct advantages in operational production systems and long-term climate trend analysis. This superiority stems from the reliance of this method solely on the intrinsic characteristics of the data for reconstruction, thus eliminating the need for training datasets and enabling high-precision gap-filling from short-term observational sequences [20].
While DINEOF can also be applied to monthly gap-filled products [12], our current focus is on gap-filling for daily data. We acknowledge that comparing reconstructed data with single-sensor datasets for long-term climate trends is critical. Future work will assess whether reconstruction alters estimated long-term change rates and their implications for existing single-sensor-based interpretations.
Between 2018 and 2023, Liu and Wang used DINEOF to reconstruct ocean color data from single-satellite VIIRS (Suomi NPP) [12], dual-satellite VIIRS (Suomi NPP and NOAA-20) [13], and multi-satellite ocean color sensors (VIIRS on Suomi NPP and NOAA-20 satellites, and OLCI on Sentinel-3A [20]; VIIRS on Suomi NPP and NOAA-20, OLCI on Sentinel-3A and Sentinel-3B [25]). These studies laid the foundation for the operational reconstruction products of STAR at NESDIS. The DINEOF method, in addition to being applied in the reconstruction of ocean color satellite remote sensing data, can also be used for satellite-derived SST reconstruction. Furthermore, improvements to the DINEOF method can enhance the temporal resolution of Chl-a concentration data [23]. Nevertheless, a systematic comparative study remains needed to evaluate the relative merits of AI versus the DINEOF method for ocean color data reconstruction. In addition, the appropriate improvement of the DINEOF method to further enhance the reconstruction quality of satellite-derived ocean color and SST data remains a key focus of future research.

5. Conclusions

This study demonstrated that applying the DINEOF method to Chl-a concentration products derived from merging multisource data of COCTS sensors aboard the HY-1C, HY-1D and HY-1E satellites successfully achieves data gap-filling, thereby generating spatially continuous global daily reconstruction products. Case studies of typical applications confirm that these reconstructed products can reproduce the full-coverage distribution of Chl-a concentration in representative oceanic regions and capture the visual characteristics of Chl-a variation processes induced by ocean currents. However, the strip-like artifacts along satellite tracks observed in the reconstructed COCTS products over oligotrophic waters may originate from the inherent errors in the original COCTS Chl-a concentration retrieval data. This highlights the critical influence of the input data quality on the reconstruction results. Consequently, enhancing the retrieval quality of the original COCTS products emerges as a potentially crucial factor for improving the quality of the final reconstructed data.
Multi-satellite collaborative observations significantly increase the coverage of ocean color parameters. This study confirmed that the HY-1C, HY-1D, and HY-1E constellation observation systems can provide Chl-a concentration datasets that meet the requirements for daily global coverage, thereby offering novel technical support for marine environmental monitoring.

Author Contributions

Conceptualization, Methodology, writing, X.Y.; Conceptualization, Writing—review, Funding acquisition. M.L.; Conceptualization, Methodology, Writing—review, B.Z.; Validation, Editing, X.W.; Recourses, Editing, Z.L. All authors have read and agreed to the published version of the manuscript.

Funding

This study was supported in part by the National Key Research and Development Program of China under Grants 2022YFC3104900 and 2022YFC3104903.

Data Availability Statement

The COCTS data used in this study are accessible from the National Satellite Ocean Application Service (NSOAS) data distribution portal (https://osdds.nsoas.org.cn/home) (accessed on 15 March 2025). MODIS, VIIRS, and OLCI data can be obtained through NASA’s Ocean Color Web platform (https://oceancolor.gsfc.nasa.gov/) (accessed on 20 March 2025).

Acknowledgments

The authors wish to thank the NASA Goddard Space Flight Center (GSFC), Ocean Ecology Laboratory, Ocean Biology Processing Group (OBPG) for affording them access to the MODIS, VIIRS and OLCI data.

Conflicts of Interest

The authors declare no conflicts of interest.

References

  1. Field, C.B.; Behrenfeld, M.J.; Randerson, J.T.; Falkowski, P. Primary production of the biosphere: Integrating terrestrial and oceanic components. Science 1998, 281, 237–240. [Google Scholar] [CrossRef] [PubMed]
  2. Falkowski, P.; Scholes, R.J.; Boyle, E.; Canadell, J.; Canfield, D.; Elser, J.; Gruber, N.; Hibbard, K.; Högberg, P.; Linder, S.; et al. The Global Carbon Cycle: A Test of Our Knowledge of Earth as a System. Science 2000, 290, 291–296. [Google Scholar] [CrossRef] [PubMed]
  3. Irion, S.; Christaki, U.; Berthelot, H.; L’Helguen, S.; Jardillier, L. Small phytoplankton contribute greatly to CO2-fixation after the diatom bloom in the Southern Ocean. ISME J. 2021, 15, 2509–2522. [Google Scholar] [CrossRef] [PubMed]
  4. Behrenfeld, M.J.; O’malley, R.T.; Boss, E.S.; Michael, J.; Westberry, T.K.; Graff, J.R.; Halsey, K.H.; Milligan, A.J.; Siegel, D.A.; Brown, M.B. Revaluating ocean warming impacts on global phytoplankton. Nat. Clim. Change 2016, 6, 323–330. [Google Scholar] [CrossRef]
  5. Xu, W.; Wang, G.; Jiang, L.; Cheng, X.; Zhou, W.; Cao, W. Spatiotemporal Variability of Surface Phytoplankton Carbon and Carbon-to-Chlorophyll a Ratio in the South China Sea Based on Satellite Data. Remote Sens. 2021, 13, 30. [Google Scholar] [CrossRef]
  6. Gregg, W.W.; Rousseaux, C.S. Decadal trends in global pelagic ocean chlorophyll: A new assessment integrating multiple satellites, in situ data, and models. J. Geophys. Res. Oceans 2014, 119, 5921–5933. [Google Scholar] [CrossRef]
  7. Keerthi, M.G.; Prend, C.J.; Aumont, O.; Lévy, M. Annual variations in phytoplankton biomass driven by small-scale physical processes. Nat. Geosci. 2022, 15, 1027–1033. [Google Scholar] [CrossRef]
  8. Agarwal, V.; Chávez-Casillas, J.; Inomura, K.; Mouw, C.B. Patterns in the temporal complexity of global chlorophyll concentration. Nat. Commun. 2024, 15, 1522. [Google Scholar] [CrossRef]
  9. Zhai, D.; Beaulieu, C.; Kudela, R.M. Long-Term Trends in the Distribution of Ocean Chlorophyll. Geophys. Res. Lett. 2024, 51, e2023GL106577. [Google Scholar] [CrossRef]
  10. Gordon, H.R. Atmospheric correction of ocean color imagery in the Earth Observing System era. J. Geophys. Res. 1997, 102, 17081–17106. [Google Scholar] [CrossRef]
  11. Werdell, P.J.; Behrenfeld, M.J.; Bontempi, P.S.; Boss, E.; Cairns, B.; Davis, G.T.; Franz, B.A.; Gliese, U.B.; Gorman, E.T.; Hasekamp, O.; et al. The Plankton, Aerosol, Cloud, Ocean Ecosystem Mission: Status, Science, Advances. B. Am. Meteorol. Soc. 2019, 100, 1775–1794. [Google Scholar] [CrossRef]
  12. Liu, X.; Wang, M. Gap Filling of Missing Data for VIIRS Global Ocean Color Products Using the DINEOF Method. IEEE Trans. Geosci. Remote Sens. 2018, 56, 4464–4476. [Google Scholar] [CrossRef]
  13. Liu, X.; Wang, M. Filling the gaps of missing data in the merged VIIRS SNPP/NOAA-20 ocean color product using the DINEOF method. Remote Sens. 2019, 11, 178. [Google Scholar] [CrossRef]
  14. Chen, S.; Hu, C.; Barnes, B.B.; Xie, Y.; Lin, G.; Qiu, Z. Improving ocean color data coverage through machine learning. Remote Sens. Environ. 2019, 222, 286–302. [Google Scholar] [CrossRef]
  15. Mélin, F.; Vantrepotte, V.; Chuprin, A.; Grant, M.; Jackson, T.; Sathyendranath, S. Assessing the fitness-for-purpose of satellite multi-mission ocean color climate data records: A protocol applied to OC-CCI chlorophyll-a data. IEEE Trans. Geosci. Remote Sens. 2017, 203, 139–151. [Google Scholar] [CrossRef]
  16. Martinez, E.; Gorgues, T.; Lengaigne, M.; Sauzède, R.; Menkes, C.; Uitz, J.; Di Lorenzo, E.; Fablet, R. Reconstructing Global Chlorophyll-a Variations Using a Non-linear Statistical Approach. Front. Mar. Sci. 2020, 7, 464. [Google Scholar] [CrossRef]
  17. Xing, M.; Yao, F.; Zhang, J.; Meng, X.; Jiang, L.; Bao, Y. Data reconstruction of daily MODIS chlorophyll-a concentration and spatio-temporal variations in the Northwestern Pacific. Sci. Total Environ. 2022, 843, 156981. [Google Scholar] [CrossRef] [PubMed]
  18. Roussillon, J.; Fablet, R.; Gorgues, T.; Drumetz, L.; Littaye, J.; Martinez, E. A Multi-Mode Convolutional Neural Network to reconstruct satellite-derived chlorophyll-a time series in the global ocean from physical drivers. Front. Mar. Sci. 2023, 10, 1077623. [Google Scholar] [CrossRef]
  19. Chen, S.; Deng, L.; Zhao, J. Enhanced reconstruction of satellite-derived monthly chlorophyll a concentration with fourier transform convolutional-LSTM. IEEE Trans. Geosci. Remote Sens. 2024, 62, 4206014. [Google Scholar] [CrossRef]
  20. Liu, X.; Wang, M. Global daily gap-free ocean color products from multi-satellite measurements. Int. J. Appl. Earth Obs. Geoinf. 2022, 108, 102714. [Google Scholar] [CrossRef]
  21. Alvera-Azcárate, A.; Barth, A.; Beckers, J.-M.; Weisberg, R.H. Multivariate reconstruction of missing data in sea surface temperature, chlorophyll, and wind satellite fields. J. Geophys. Res. 2007, 112, C03008. [Google Scholar] [CrossRef]
  22. Alvera-Azcárate, A.; Vanhellemont, Q.; Ruddick, K.; Barth, A.; Beckers, J.M. Analysis of high frequency geostationary ocean colour data using DINEOF. Estuar. Coast. Shelf Sci. 2015, 159, 28–36. [Google Scholar] [CrossRef]
  23. Zhao, H.; Matsuoka, A.; Manizza, M.; Winter, A. DINEOF interpolation of global ocean color data: Error analysis and masking. J. Atmos. Ocean. Tech. 2024, 41, 953–968. [Google Scholar] [CrossRef]
  24. Zhou, G.; Liu, M.; Xu, L.; Li, L. A gap-filling method for satellite-derived chlorophyll-a time series based on neighborhood spatiotemporal information. Int. J. Appl. Earth Obs. Geoinf. 2024, 128, 103724. [Google Scholar] [CrossRef]
  25. Liu, X.; Wang, M. High Spatial Resolution Gap-Free Global and Regional Ocean Color Products. IEEE Trans. Geosci. Remote Sens. 2023, 61, 4204118. [Google Scholar] [CrossRef]
  26. Alvera-Azcárate, A.; Van der Zande, D.; Barth, A.; Dille, A.; Massant, J.; Beckers, J.-M. Generation of super-resolution gap-free ocean colour satellite products using data-interpolating empirical orthogonal functions (DINEOF). Ocean Sci. 2025, 21, 787–805. [Google Scholar] [CrossRef]
  27. Shi, W.; Wang, M. Ocean responses to Hurricane Ian from daily gap-free satellite observations. Remote Sens. Lett. 2023, 14, 877–889. [Google Scholar] [CrossRef]
  28. Ye, X.; Liu, J.; Lin, M.; Ding, J.; Song, Q. Global ocean chlorophyll-a concentrations derived from COCTS onboard the HY-1C satellite and their preliminary evaluation. IEEE Trans. Geosci. Remote Sens. 2021, 59, 9914–9926. [Google Scholar] [CrossRef]
  29. Ye, X.; Liu, J.; Lin, M.; Ding, J.; Song, Q. Sea surface temperatures derived from COCTS onboard the HY-1C satellite. IEEE J. Sel. Top. Appl. Earth Observ. Remote Sens. 2021, 14, 1038–1047. [Google Scholar] [CrossRef]
  30. Ye, X.; Liu, J.; Lin, M.; Ding, J.; Song, Q.; Teng, Y. Evaluation of sea surface temperatures derived from the HY-1D satellite. IEEE J. Sel. Top. Appl. Earth Observ. Remote Sens. 2022, 15, 654–665. [Google Scholar] [CrossRef]
  31. Li, H.; He, X.; Ding, J.; Bai, Y.; Wang, D.; Gong, F.; Li, T. The Inversion of HY-1C-COCTS Ocean Color Remote Sensing Products from High-Latitude Seas. Remote Sens. 2022, 14, 5722. [Google Scholar] [CrossRef]
  32. Liu, J.; Ye, X.; Song, Q.; Ding, J.; Zou, B. Products of HY-1C/D ocean color satellites and their typical applications. Natl. Remote Sens. Bull. 2023, 27, 1–13. (In Chinese) [Google Scholar] [CrossRef]
  33. Hu, C.; Lee, Z.; Franz, B. Chlorophyll a algorithms for oligotrophic oceans: A novel approach based on three-band reflectance difference. J. Geophys. Res. 2012, 117, C01011. [Google Scholar] [CrossRef]
  34. Hu, C.; Feng, L.; Lee, Z.; Franz, B.A.; Bailey, S.W.; Werdell, P.J.; Proctor, C.W. Improving satellite global chlorophyll a data products through algorithm refinement and data recovery. J. Geophys. Res. Oceans 2019, 124, 1524–1543. [Google Scholar] [CrossRef]
  35. O’Reilly, J.E.; Werdell, P.J. Chlorophyll algorithms for ocean color sensors-OC4, OC5 & OC6. IEEE Trans. Geosci. Remote Sens. 2019, 229, 32–47. [Google Scholar] [CrossRef]
  36. Mélin, F. Impact of inter-mission differences and drifts on chlorophyll-a trend estimates. Int. J. Remote Sens. 2016, 37, 2233–2251. [Google Scholar] [CrossRef]
  37. Bai, R.; He, X.; Ye, X.; Li, H.; Bai, Y.; Ma, C.; Song, Q.; Jin, X.; Zhang, X.; Gong, F. Development of the operational atmospheric correction algorithm for the COCTS2 onboard the Chinese new-generation ocean color satellite. Opt. Express 2025, 22, 38029. [Google Scholar] [CrossRef]
  38. Jackson, T.; Hockley, K.; Calton, B.; Chuprin, A. C3S Ocean Colour Version 6.0: Algorithm Theoretical Basis Document. Issue 1.1. E.U. Copernicus Climate Change Service. Document ref. WP2-FDDP-2022-04_C3S2-Lot3_ATBD-of-v6.0-OceanColour-product. 2022. Available online: https://dast.copernicus-climate.eu/documents/satellite-ocean-colour/v6.0/WP2-FDDP-2022-04_C3S2-Lot3_ATBD-of-v6.0-OceanColour-product_v1.1_FINAL.pdf (accessed on 15 December 2024).
  39. Beckers, J.M.; Rixen, M. EOF Calculations and Data Filling from Incomplete Oceanographic Datasets. J. Atmos. Ocean. Technol. 2003, 20, 1839–1856. [Google Scholar] [CrossRef]
  40. Alvera-Azcárate, A.; Barth, A.; Rixen, M.; Beckers, J.M. Reconstruction of incomplete oceanographic data sets using empirical orthogonal functions: Application to the Adriatic Sea surface temperature. Ocean Model. 2005, 9, 325–346. [Google Scholar] [CrossRef]
  41. Henn, B.; Raleigh, M.S.; Fisher, A.; Lundquist, J.D. A Comparison of Methods for Filling Gaps in Hourly Near-Surface Air Temperature Data. J. Hydrometeorol. 2013, 14, 929–945. [Google Scholar] [CrossRef]
  42. Campbell, J.W.; Blaisdell, J.M.; Darzi, M. Level-3 SeaWiFS Data Products: Spatial and Temporal Binning Algorithms ; NASA Technical Memorandum; Hooker, S.B., Firestone, E.R., Acker, J.G., Eds.; NASA Goddard Space Flight Center: Greenbelt, MD, USA, 1995; Volume 32, p. 104566.
  43. Hong, Z.; Long, D.; Li, X.; Wang, Y.; Zhang, J.; Hamouda, M.A.; Mohamed, M.M. A global daily gap-filled chlorophyll-a dataset in open oceans during 2001–2021 from multisource information using convolutional neural networks. Earth Syst. Sci. Data 2023, 15, 5281–5300. [Google Scholar] [CrossRef]
  44. Ye, H.; Yang, C.; Dong, Y.; Tang, S.; Chen, C. A daily reconstructed chlorophyll-a dataset in the South China Sea from MODIS using OI-SwinUnet. Earth Syst. Sci. Data 2024, 16, 3125–3147. [Google Scholar] [CrossRef]
  45. Xu, Q.; Yang, G.; Yin, X.; Sun, T. Reconstruction of Sea Surface Chlorophyll-a Concentration in the Bohai and Yellow Seas Using LSTM Neural Network. Remote Sens. 2025, 17, 174. [Google Scholar] [CrossRef]
Figure 1. Global daily chlorophyll-a concentration distributions from multiple satellites on 6 October 2024.
Remotesensing 17 03433 g001aRemotesensing 17 03433 g001b
Figure 2. Time series of global average satellite-derived chlorophyll-a concentration in October 2024.
Remotesensing 17 03433 g002
Figure 3. Comparative scatter plot of the daily chlorophyll-a concentration between the COCTS2 onboard the HY-1E satellite and the MODIS onboard the Aqua satellite on 6 October 2024.
Remotesensing 17 03433 g003
Figure 4. Schematic diagram of the DINEOF computational framework for chlorophyll-a concentration reconstruction.
Remotesensing 17 03433 g004
Figure 5. Global daily merged results of chlorophyll-a concentration from (a) MODIS, (b) VIIRS, (c) OLCI, and (d) COCTS on 6 October 2024.
Remotesensing 17 03433 g005
Figure 6. Global daily chlorophyll-a concentration merged from ten satellite sensors (including two MODIS sensors, three VIIRS sensors, two OLCI sensors, and three COCTS sensors) for 6 October 2024.
Remotesensing 17 03433 g006
Figure 7. Coverage of the daily chlorophyll-a concentration of multiple satellite ocean color sensors from 4 October to 8 October 2024.
Remotesensing 17 03433 g007
Figure 8. Global daily chlorophyll-a concentration reconstructed from merged products of (a) the COCTS and (b) VIIRS on 6 October 2024.
Remotesensing 17 03433 g008aRemotesensing 17 03433 g008b
Figure 9. Histogram of chlorophyll-a concentration coverage for COCTS merged data and the reconstruction by the DINEOF.
Remotesensing 17 03433 g009
Figure 10. Histogram comparison of COCTS-derived chlorophyll-a concentrations (merged data vs. reconstructed results) for October 2024.
Remotesensing 17 03433 g010
Figure 11. Global and zoomed-in distribution maps of the COCTS-merged chlorophyll-a concentration after sampling and invalid value processing on 6 October 2024. The white points in the zoom-in maps indicate the invalid value processed data.
Remotesensing 17 03433 g011
Figure 12. Global daily chlorophyll-a concentration reconstructed from the data shown in Figure 11.
Remotesensing 17 03433 g012
Figure 13. Comparison scatter plot of the original and reconstructed chlorophyll-a concentration from the validation samples of the COCTS products on 6 October 2024.
Remotesensing 17 03433 g013
Figure 14. Spatiotemporal distributions of daily chlorophyll-a concentration derived from the COCTS aboard the HY-1C, HY-1D and HY-1E satellites: (a,c,e,g) Merged products and (b,d,f,h) reconstructed products for (a,b) 30 September, (c,d) 10 October, (e,f) 20 October, and (g,h) 30 October 2024.
Remotesensing 17 03433 g014aRemotesensing 17 03433 g014b
Figure 15. Spatiotemporal distributions of the daily reconstructed chlorophyll-a concentration derived from the COCTS aboard the HY-1C, HY-1D and HY-1E satellites on (a) 6 October, (b) 9 October, (c) 12 October, and (d) 15 October 2024.
Remotesensing 17 03433 g015
Table 1. Chlorophyll-a concentration retrieval algorithms and corresponding spectral bands used for satellite sensors.
No.SensorAlgorithmOCx Rrs Used 1
1MODIS/Terra and AquaOC3M, CIRrs(443 > 488)/Rrs(547)
2VIIRS/Suomi NPPOC3_VIIRS_SNPP, CIRrs(443 > 486)/Rrs(551)
3VIIRS/JPSS-1OC3_VIIRS_NOAA20, CIRrs(445 > 489)/Rrs(556)
4VIIRS/JPSS-2OC3_VIIRS_NOAA21, CIRrs(445 > 488)/Rrs(555)
5OLCI/Sentinel-3A and Sentinel-3BOC4, CIRrs(443 > 490 > 510)/Rrs(560)
6COCTS/HY-1C and HY-1DOC4, CIRrs(443 > 490 > 520)/Rrs(565) [28]
7COCTS2/HY-1EOC4, CIRrs(443 > 490 > 520)/Rrs(565) [37]
1 Rrs represents the remote sensing reflectance, with the numerical value in parentheses indicating the central wavelength of the spectral band used, in nanometers (nm). Detailed algorithms for Chl-a concentration retrieval from MODIS, VIIRS, and OLCI are provided in the table, with further information available at: https://www.earthdata.nasa.gov/apt/documents/chlor-a/v1.0 (accessed on 14 September 2025).
Disclaimer/Publisher’s Note: The statements, opinions and data contained in all publications are solely those of the individual author(s) and contributor(s) and not of MDPI and/or the editor(s). MDPI and/or the editor(s) disclaim responsibility for any injury to people or property resulting from any ideas, methods, instructions or products referred to in the content.