Article

An Improved Instance Segmentation Approach for Solid Waste Retrieval with Precise Edge from UAV Images

1
State Key Laboratory of Resources and Environmental Information System, Institute of Geographic Sciences and Natural Resources Research, Chinese Academy of Sciences, Beijing 100101, China
2
College of Resource and Environment, University of Chinese Academy of Sciences, Beijing 100049, China
*
Author to whom correspondence should be addressed.
Remote Sens. 2025, 17(20), 3410; https://doi.org/10.3390/rs17203410 (registering DOI)
Submission received: 23 August 2025 / Revised: 28 September 2025 / Accepted: 3 October 2025 / Published: 11 October 2025
(This article belongs to the Section Environmental Remote Sensing)

Abstract

Highlights

What are the main findings?
  • Proposes WMNet-SW, which fuses an improved Mask R-CNN (with anchor/RoI optimization and a Layer Feature Aggregation mask head) with the watershed transform to retrieve precise-edge SW from high-resolution UAV images.
  • Outperforms baseline deep learning model, captures fine edge details and even mitigates limitations in training GT.
What is the implication of the main finding?
  • Provides a practical solution for retrieving precise-edge SW from UAV imagery, contributing to the protection of regional environment and ecosystem health.

Abstract

As a major contributor to environmental pollution in recent years, solid waste has become an increasingly significant concern in the realm of sustainable development. Unmanned Aerial Vehicle (UAV) imagery, known for its high spatial resolution, has become a valuable data source for solid waste detection. However, manually interpreting solid waste in UAV images is inefficient, and object detection methods encounter serious challenges due to the patchy distribution, varied textures and colors, and fragmented edges of solid waste. In this study, we proposed an improved instance segmentation approach called Watershed Mask Network for Solid Waste (WMNet-SW) to accurately retrieve solid waste with precise edges from UAV images. This approach combined the well-established Mask R-CNN segmentation framework with the watershed transform edge detection algorithm. The benchmark Mask R-CNN was improved by optimizing the anchor size and Region of Interest (RoI) and integrating a new mask head of Layer Feature Aggregation (LFA) to initially detect solid waste. Subsequently, edges of the detected solid waste were precisely adjusted by overlaying the segments generated by the watershed transform algorithm. Experimental results show that WMNet-SW significantly enhances the performance of Mask R-CNN in solid waste retrieval, increasing the average precision from 36.91% to 58.10%, F1-score from 0.5 to 0.65, and AP from 63.04% to 64.42%. Furthermore, our method efficiently detects the details of solid waste edges, even overcoming the limitations of training Ground Truth (GT). This study provides a solution for retrieving solid waste with precise edges from UAV images, thereby contributing to the protection of the regional environment and ecosystem health.

1. Introduction

Rapid urbanization and industrial expansion have precipitated a dramatic increase in solid waste volumes, creating substantial risks to ecological stability and public well-being [1,2,3,4]. According to the World Bank in 2022, annual solid waste production exceeded 2.24 billion metric tons globally [5], while the National Bureau of Statistics of China (NBSC) reported that the amount in China specifically reached 0.24 billion tons [6]. Unregulated solid waste disposal disrupts hydrological systems and degrades arable land, glaciers, and other ecosystems [7]. Furthermore, solid waste accumulation serves as a reservoir for pathogenic organisms and disease vectors, which poses a direct threat to human health [8]. To efficiently supervise solid waste, it is crucial to detect accurate and up-to-date information regarding its spatial location and volume.
Previous attempts for detailed solid waste detection predominantly relied on field-based assessments or manual interpretation of remote sensing imagery, both of which are constrained by significant resource expenditure and geographical coverage limitations [9,10]. The inherent complexities of solid waste monitoring, including micro-scale dimensions, dispersed spatial arrangements, heterogeneous spectral–textural signatures, and irregular morphological boundaries, persistently challenge both satellite remote sensing and ground-based surveys [10,11,12]. Low-altitude UAV imagery offers the capability to accurately retrieve solid waste with high spatiotemporal resolutions, which has been an important technique due to its advantages of operational flexibility, cost-effectiveness, and rapid acquisition of centimeter-level precision data [7,13]. Nevertheless, the ultra-fine spatial resolution of UAV imagery leads to intra-scene radiometric divergence and geospatial fragmentation [14], which seriously weakens the ability of algorithms to maintain intra-class consistency and inter-class variance [15,16,17]. As a result, conventional automated algorithms (e.g., thresholding, machine learning-based methods [18,19]) often exhibit suboptimal operational efficiency when applied to time-sensitive detection of solid waste in UAV imagery [12,20,21]. Therefore, an automatic, accurate, and efficient approach for retrieving solid waste from UAV imagery, thereby minimizing time and labor costs, is urgently required.
As an important branch of machine learning, deep learning has become the state-of-the-art methodology for object detection in remote sensing applications due to its ability to autonomously extract hierarchical features, which has been successfully applied to solid waste detection with UAV imagery [10]. Among the deep learning models, Convolutional Neural Networks (CNNs), such as Faster R-CNN [22], YOLO [23], and U-Net [24], have exhibited remarkable advantages in solid waste detection. A deep CNN-based framework was proposed to automatically detect scattered garbage regions using UAV imagery for high-altitude natural reserve environmental protection, addressing challenges posed by varying scales, different viewpoints, and complex backgrounds [7]. Recent advancements include the Blocked Channel Attention Network (BCA-Net), which is based on Faster R-CNN and was applied to rapid waste detection on a global scale [12]. Chen et al. [25] employed YOLO for real-time detection of solid waste by integrating data augmentation and feature fusion techniques. Gao et al. [26] proposed IUNet-IF for monitoring construction waste by extending the traditional U-Net with the incorporation of texture and color features. To capture fine-grained features in UAV imagery, Transformer-derived attention mechanisms have been introduced in solid waste detection [27]. For instance, Liu et al. [28] proposed an urban solid waste monitoring method by incorporating a ResNet34 encoder and a semantic flow alignment module enhanced by an attention mechanism, which improves long-range feature optimization and detection accuracy. Li et al. [29] introduced GPINet, which integrates CNN and Transformer features through bilateral coupling and incorporates a geometric prior generation module, thus enabling semantic segmentation of high-spatial-resolution remote sensing images. While existing deep learning architectures adapted from generic image analysis pipelines show promise in UAV-based solid waste retrieval, further optimization is necessary to align deep learning models with the unique morphological and spectral characteristics of solid waste.
As an anthropogenic pollutant, solid waste always exhibits characteristics of scattered and irregular deposition, resulting in diverse shapes with fragmented edges in UAV imagery. Beyond spatial localization, precise edges are critical for volume estimation in solid waste management. Although deep learning-based semantic segmentation models can delineate the edges of solid waste, most of them remain suboptimal for high-fidelity edge extraction of such highly fragmented objects [30]. In the field of computer vision, edge detection is an efficient method for delineating the edges of fragmented objects. This technique extracts object edges from images based on differences in photometric attributes including spectral reflectance, illumination gradients, and textural discontinuities [31,32]. The watershed algorithm is a widely used edge detection method that excels in disambiguating adjacent structures while preserving edge integrity in noisy environments [33,34]. These technologies inspire our research to improve solid waste detection from UAV imagery with precise edge delineation.
In this study, our motivation is to design an improved instance segmentation approach, namely, WMNet-SW, which has the potential to address the aforementioned challenges in retrieving solid waste with precise edges from UAV imagery. Initially, the two-stage object detection and segmentation network of Mask R-CNN is employed as the benchmark deep learning architecture (Figure 1). To effectively retrieve solid waste, we optimize the anchor size and the number of RoIs to enhance Mask R-CNN’s [35] capacity to detect solid waste from complex environments. According to [13], hyperparameter optimization is important for specific applications, which can improve the robustness of deep learning models in particular tasks. Next, a novel LFA mask head based on the multi-scale feature fusion is introduced to the original Mask R-CNN architecture, which can improve the performance of capturing the details of object edges. Finally, based on overlay analysis and image histogram analysis, the morphological watershed transform is integrated with Mask R-CNN (LFA) to improve the edge delineation accuracy of solid waste detection.
The main contributions of this study are threefold, as listed in the following:
(1)
A hyperparameter optimization strategy that enhances the adaptability of Mask R-CNN to specialized target detection tasks is proposed. Compared to common object detection tasks, the model with parameters optimized for specialized targets demonstrates superior detection accuracy and enhanced robustness.
(2)
Two novel and plug-and-play modules based on multi-scale feature fusion are proposed: Deformable Scaling Cell (DSC) and Layer Feature Aggregation (LFA), which together form an innovative LFA mask head to better extract solid waste samples in complex geographical environments. In particular, the new mask head simultaneously extracts coarse-to-fine multi-scale features and enables cross-scale feature synthesis.
(3)
A precise edge adjustment module based on overlay analysis and image histogram analysis is proposed, which employs spatial coincidence and spectral consistency metrics to integrate deep learning and watershed outputs, thereby refining the edges while preventing fragmentation and over-sharpening of edges.
The remainder of this article is organized as follows: Section 2 first introduces the data resource and processing, then elaborates the proposed hyperparameter optimization strategy, LFA mask head and precise edge adjustment. After that, Section 3 provides details on the extensive experiments conducted. The performances of the proposed method and several benchmark models are systematically compared. The qualitative results of edge adjustment are also validated in this section. In Section 4, we critically analyze the advantages and limitations of our method and identify potential directions for future research. Finally, the conclusion is given in Section 5.

2. Materials and Methods

2.1. Data Resource and Processing

UAV imagery was acquired by the Ministry of Ecology and Environment (MEE) of the People’s Republic of China during an environmental remediation initiative and used for the visual interpretation of solid waste. The airborne sensor was a SONY ILCE-7RM2 RGB camera (Sony Corporation, Bangkok, Thailand). Image acquisition protocols employed a rapid 1/1000 s exposure time to capture high-resolution frames (6000 × 4000 pixels) stored in uncompressed TIFF files. Flight plans were designed to provide approximately 80 percent forward overlap and 60 percent side overlap. Data collection was generally performed near solar noon, with solar zenith angles typically below 70 degrees in flat terrain, below 60 degrees in hilly terrain, and below 45 degrees in mountainous terrain. Flights were conducted at optimized altitudes, ensuring a ground sampling distance of less than 10 cm.
Geospatial coordinates from preliminary solid waste assessments guided the extraction of 600 × 600 pixel sub-images, yielding 3619 processed scenes containing 4378 annotated solid waste instances. In this study, three types of solid waste were detected: industrial solid waste (I-SW), construction solid waste (C-SW), and domestic solid waste (D-SW). For model development, we performed a random 7:3 split into training and validation sets and then applied a small number of manual adjustments to improve spatial and temporal balance. All three categories appear in both splits, and no subgroup is exclusive to a single split. Following the COCO annotation standard [36], we employed Labelme [37] to generate a dataset containing 3619 labeled images, which collectively included 4378 instances. Accordingly, the dataset was partitioned into training (3045 instances) and validation (1333 instances) subsets, with categorical distributions detailed in Table 1.
To mitigate class imbalance and increase effective sample diversity prior to training, we applied an extensive set of data augmentation operations. These include geometric transformations (random rotations, horizontal and vertical flips, and random scaling) and photometric adjustments (color jitter, brightness and contrast variation). Such augmentations were applied to improve model robustness to appearance and scale variability.
Software and libraries used for experiments are reported here for reproducibility. Model development and training were implemented in Python 3.8.0, PyTorch 1.10.1 and opencv-python 4.6.0.66.

2.2. WMNet-SW for Automatic Extraction of Solid Waste

In this study, we proposed a deep learning approach called WMNet-SW by combining Mask R-CNN and the watershed transform algorithm to retrieve solid waste with precise edges (Figure 2). We initially optimized the original Mask R-CNN parameters to enhance its performance in specific object detection tasks [13]. Then, the original Mask R-CNN architecture was improved by introducing an LFA head based on multi-scale feature fusion, to improve the performance of capturing the details of object edges. Moreover, the watershed transform algorithm was employed to adjust the solid waste edges of segmentation results of Mask R-CNN in noisy and complex environments based on overlay analysis derived from the Geographic Information System (GIS).

2.2.1. Mask R-CNN Optimization

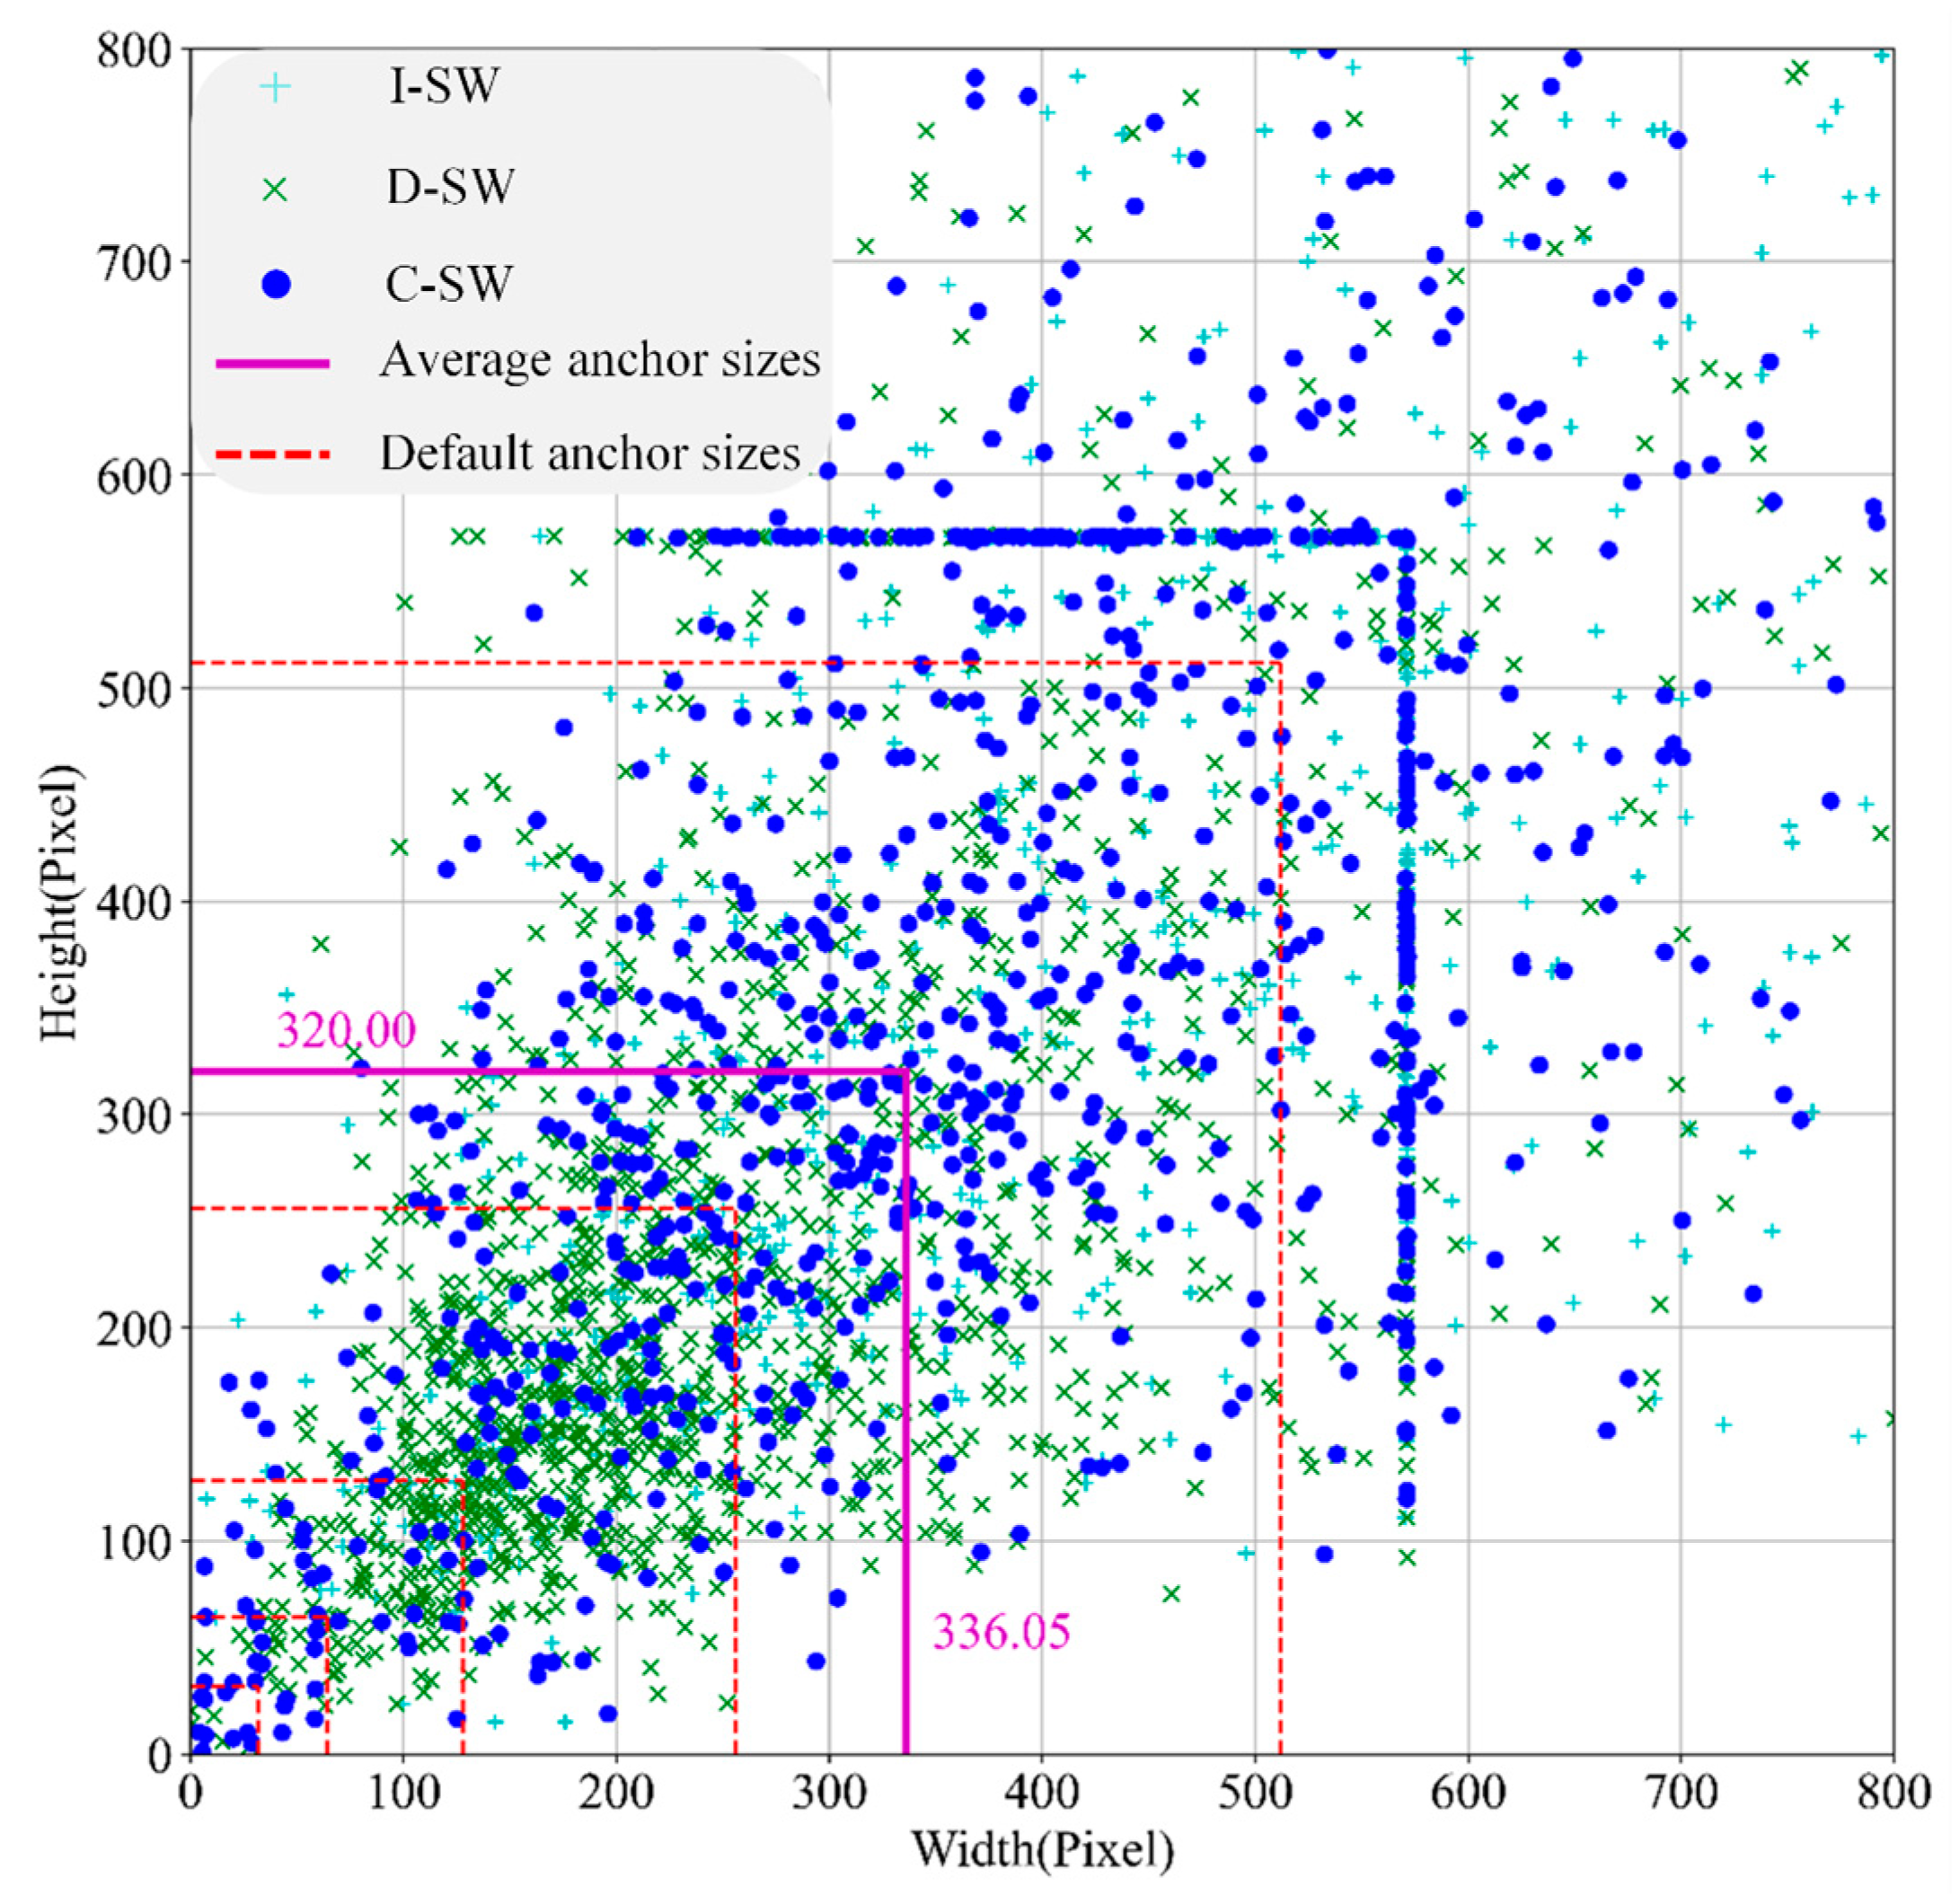
As the benchmark deep learning architecture, anchor size and RoIs are two significant hyperparameters in Mask R-CNN, which need to be optimized in specific applications [13]. Anchors, generated by the Region Proposal Network (RPN), are dense grids of reference boxes. These anchors are configured with five scales ([32, 64, 128, 256, 512]) and three aspect ratios ([1:1, 1:2, 2:1]), yielding fifteen anchors per sliding position by default. Considering the spatial resolution of 0.1 m in UAV images, many solid waste samples are relatively large and cannot be completely covered by anchors with the default sizes (Figure 3). We optimized the anchor size with new aspect ratios ([48, 96, 192, 384, 768]) and scales ([1:1, 1:2, 2:1]) to ensure exhaustive coverage across all solid waste samples.
The RoIs are defined as candidate image regions proposed by the RPN during the first stage of the two-stage detection framework. These RoIs represent spatially localized areas within the feature map that exhibit high probability of containing objects of interest. Each RoI is characterized by its coordinates and serves as the input to subsequent stages for refined object localization, classification, and instance segmentation. An excessive concentration of redundant RoIs near GT boxes significantly impedes training efficiency due to unnecessary computational overhead. To achieve an optimal trade-off between training efficiency and model accuracy in solid waste retrieval tasks, we strategically reduce the number of RoIs from 1000 to 900 based on empirical validation.
The performance improvement achieved through optimized anchor sizes and the RoIs is quantitatively analyzed in Section 3.1, with comparative results presented against the default configuration.

2.2.2. Layer Feature Aggregation Mask Head

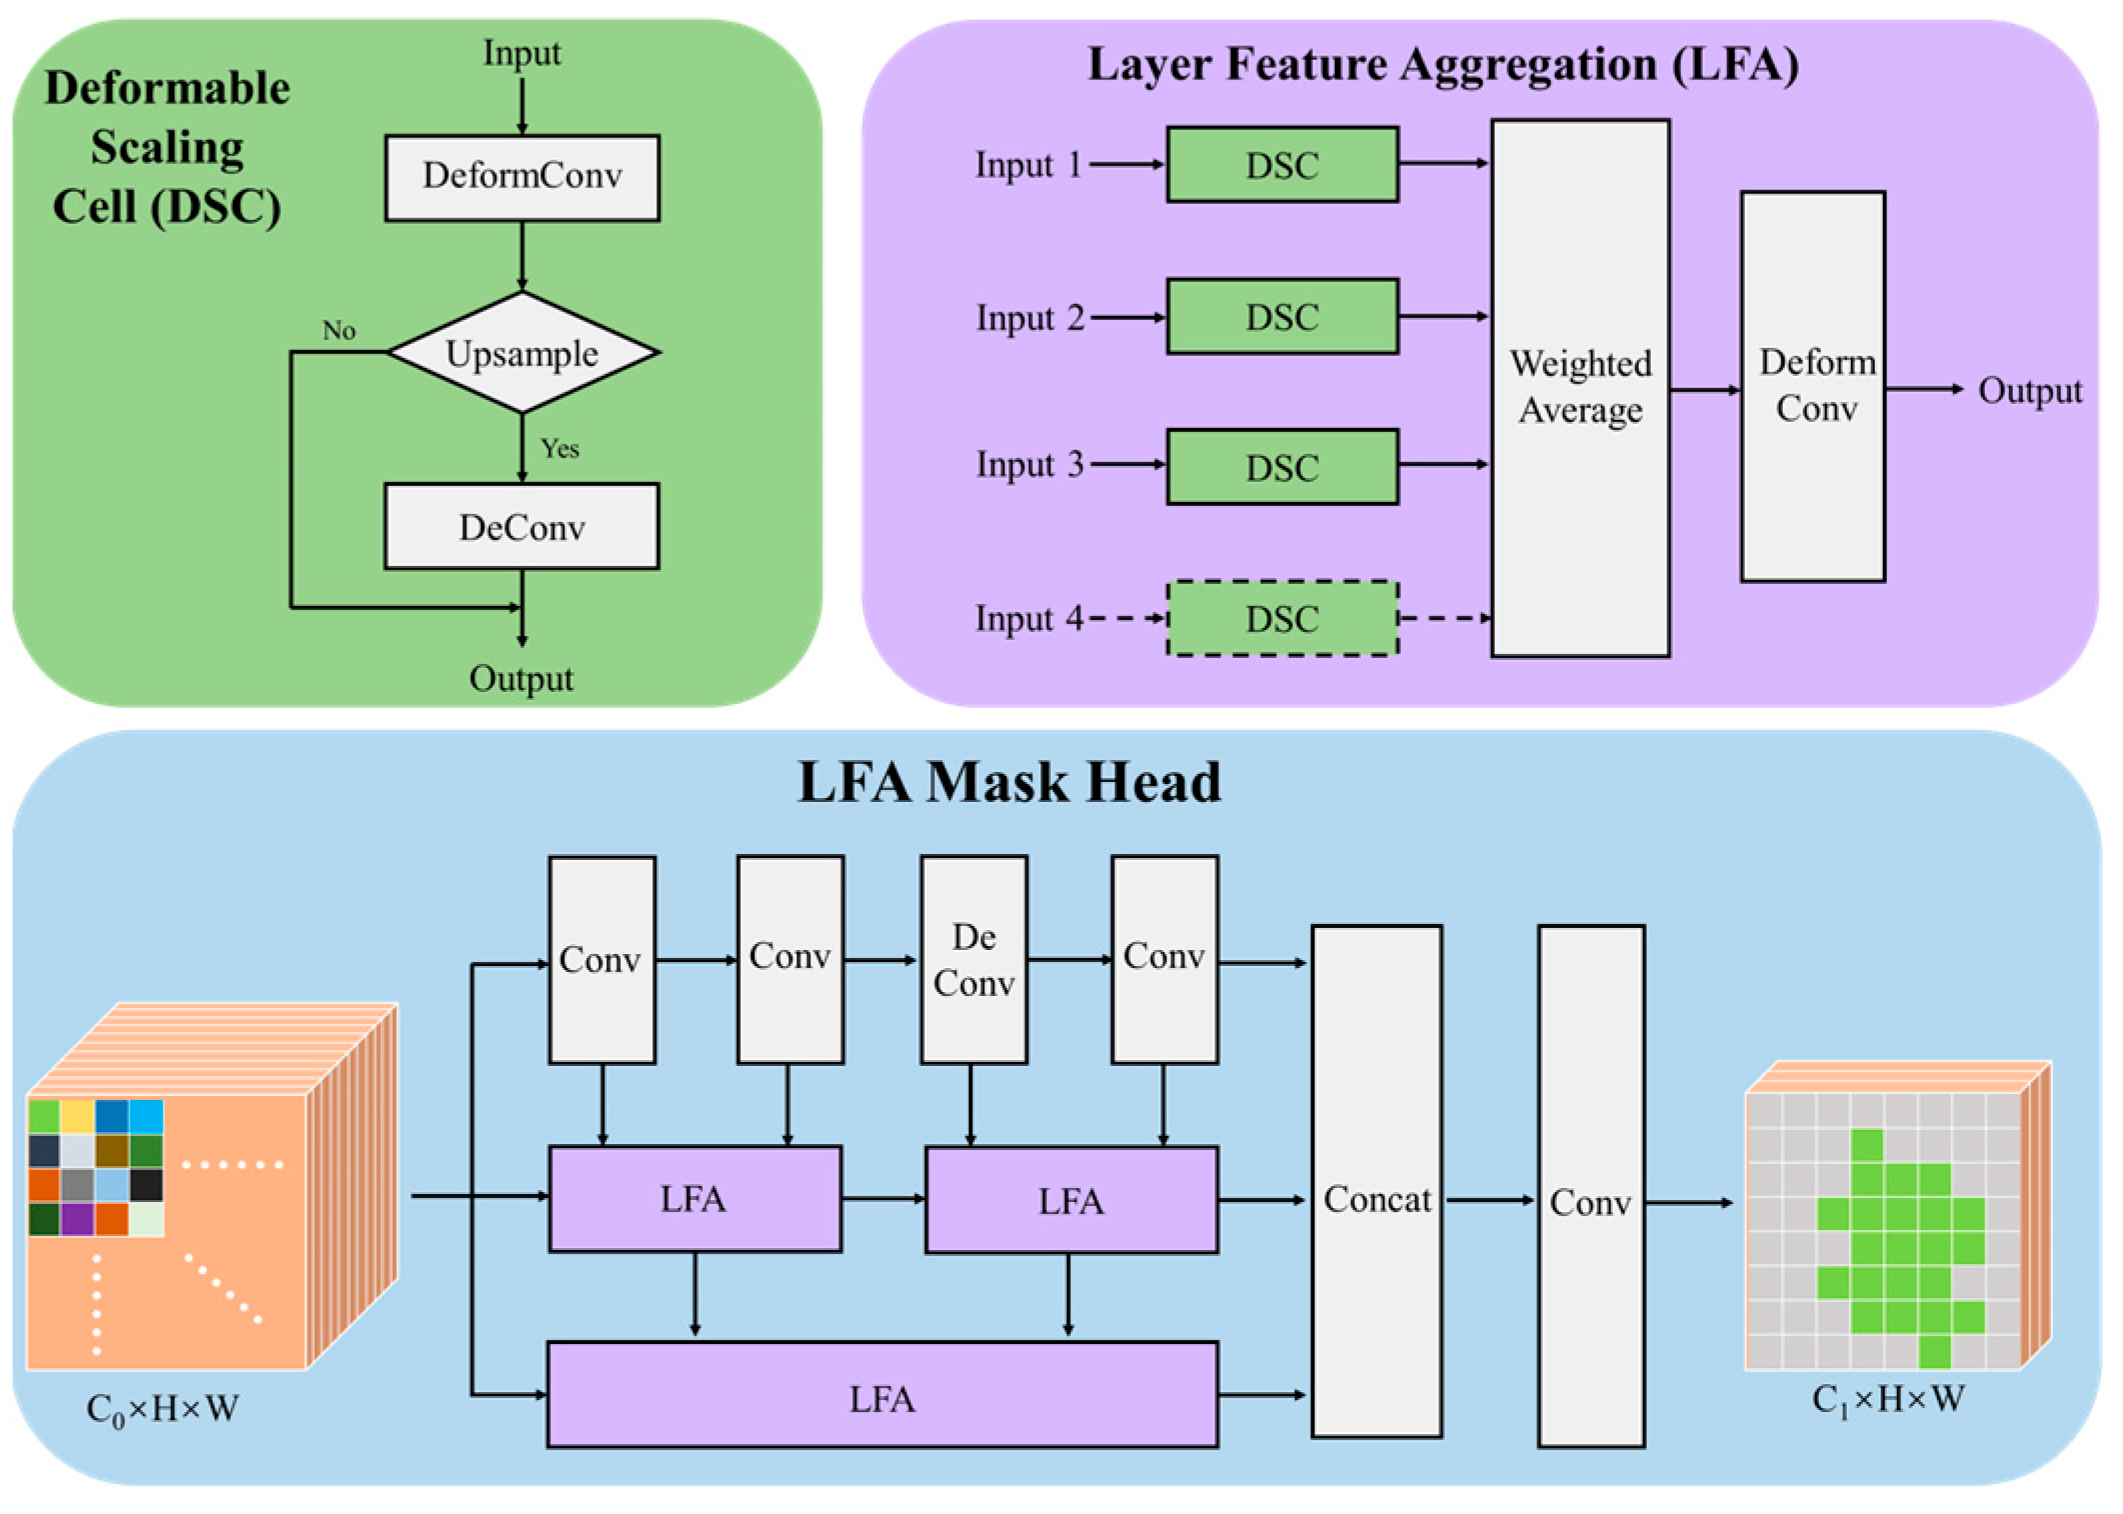
The mask head of Mask R-CNN is a fully convolutional network (FCN) [38], which is used to generate segmentation masks for each object. Due to the lightweight and straightforward structure of the mask head, more complex designs have the potential to enhance mask generation performance [35,39]. In this study, we designed a deformable scaling cell (DSC) and further constructed an LFA mask head to better extract solid waste samples in complex geographical environments (Figure 4).
The DSC consists of the deformable convolution network (DeformConv) [40] and the deconvolution network (DeConv) [41] to augment spatial sampling locations with additional offsets while controlling feature map scaling. They are described below.
DeformConv controls downsampling and feature extraction through stride configuration, while DeConv is responsible for upsampling and feature reconstruction, effectively extracting solid waste edge information from the RoI feature maps.
In DeformConv, offsets are added to the sample points on the input feature map, thereby making the receptive field irregular and more flexible during the convolution process for enhanced feature extraction. Each location p 0 on the output feature map can be expressed as:
DeformConv p 0 = p n R ω p n · x p 0 + p n + p n  
where p n is the location within the receptive field size, p n is the offset, x p 0 + p n + p n is an arbitrary location on the input feature map, and ω p n is the weight of the convolution kernel.
DeConv performs upsampling on the feature maps extracted by DeformConv to alleviate the misalignment between low-level and high-level features [42]. In the DSC, the unpooling strides of the DeConv are set to 2, corresponding to 2× pooling of the feature map obtained in the deformable convolution layer. Upsampling through DeConv is required when the output feature map is twice the input size.
The LFA module consists of DSC, which is designed to improve the performance of solid waste segmentation from UAV images. For the feature maps Xk from K different layers, K DSCs are employed to extract features and adjust sizes, and after weighted averaging, feature aggregation is carried out through a deformable convolution layer:
y L F A = DeformConv 1 K k = 1 K D S C k x k
where y L F A is the feature map output by the LFA, and D S C k x k is the feature map output by the k-th DSC.
In the LFA head, the feature maps from different layers in the original FCN head are fed into distinct LFA modules, enabling multi-scale RoI feature aggregation. Subsequently, the aggregated feature maps are concatenated along the channel axis. Finally, masks are generated by processing these feature maps through a convolutional layer. Intuitively, the LFA head simultaneously extracts coarse-to-fine multi-scale features from RoIs and integrates them into a unified feature map after alignment. Therefore, LFA is not a design that selects only one fixed set of layers (e.g., only very low-level or only very high-level features). Instead, it performs an organic combination of low-level image-detail features and higher-level semantic cues produced in the mask-branch stages, producing a richer, multi-scale aggregated representation that yields more precise mask predictions for fragmented solid waste targets.

2.2.3. Precise Edge Adjustment

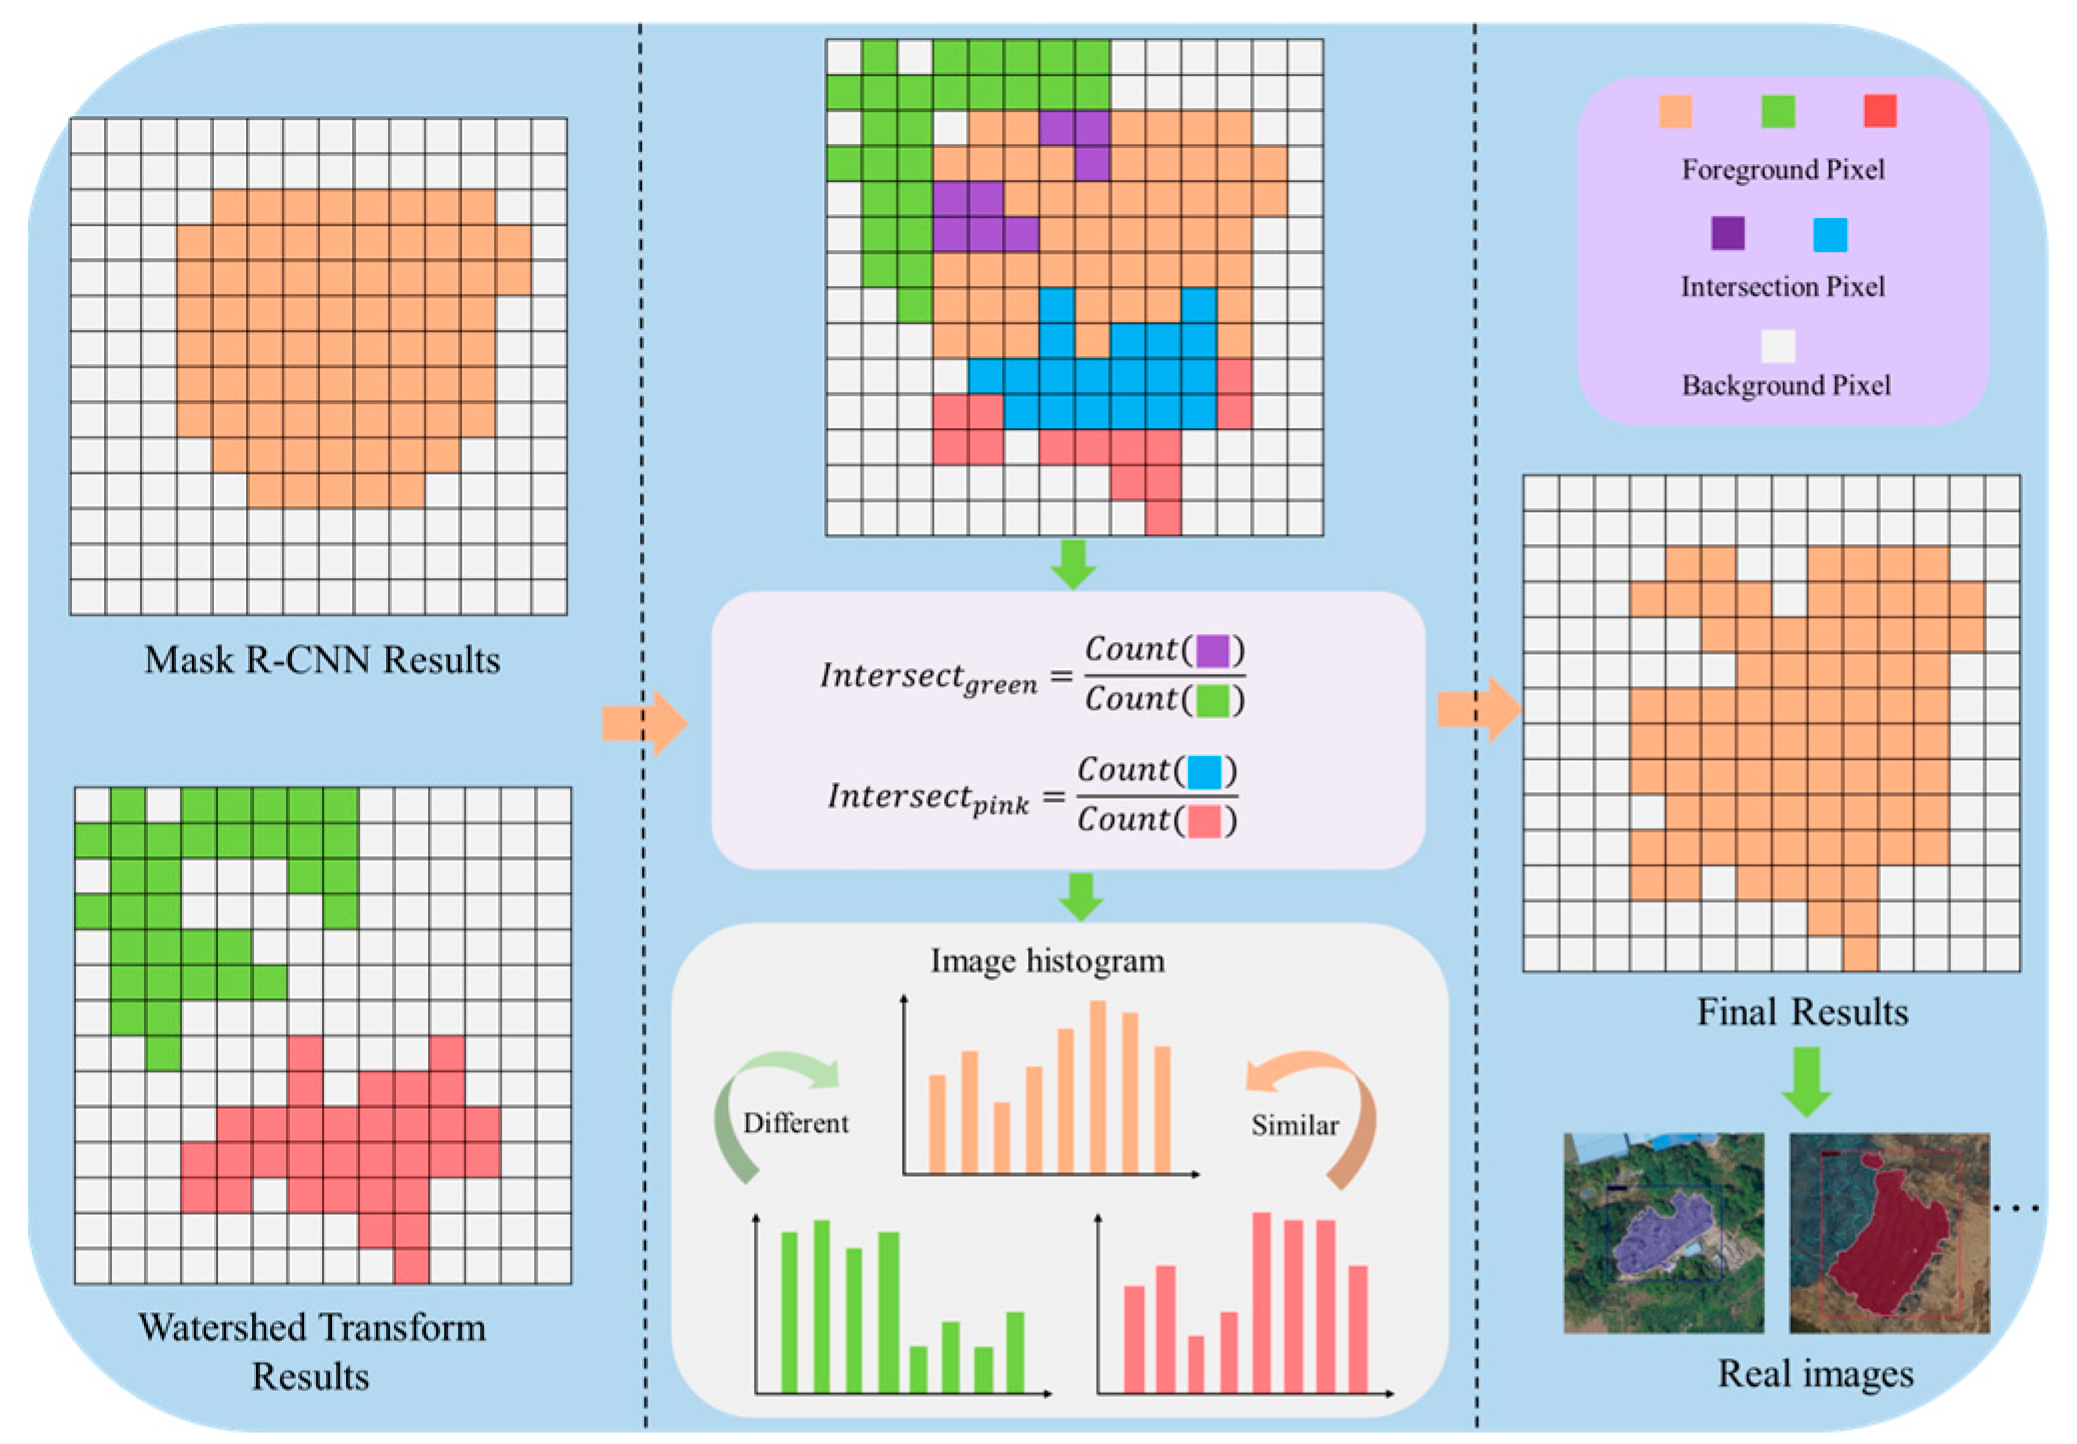
To accurately delineate the edges of highly fragmented solid waste samples, the morphological watershed transform was applied to further adjust the edges of solid waste segmentation results from the improved Mask R-CNN. As shown in Figure 2, based on the initial bounding box and rough edges of solid waste from Mask R-CNN (LFA head), the original imagery was cropped by a buffer zone that was established around the bounding box with a certain proportion. In this study, the buffer zone was determined as follows:
x m i n = x m i n β x m a x x m i n 2 y m i n = y m i n β y m a x y m i n 2 x m a x = x m a x + β x m a x x m i n 2 y m a x = y m a x + β y m a x y m i n 2
where ( x m i n , y m i n ) and ( x m a x , y m a x ) are the coordinates of the top-left and bottom-right corners of the bounding box, β is the buffer ratio. ( x m i n , y m i n ) and ( x m a x , y m a x ) are the new coordinates of the top-left and bottom-right corners of the buffer zone. Considering that the image size in the dataset is 600 × 600, values below 0 or exceeding 600 after buffering are clipped to 0 and 600, respectively.
Then, a segmentation result with more complex edges was generated from the cropped imagery in the morphological watershed transform module. Grayscale thresholding is initially employed to binarize the images. Secondly, basic morphological operators are utilized for preprocessing to eliminate local maxima and perform background dilation, encompassing operations such as erosion, expansion, opening, closing, and so on [43]. Subsequently, the Euclidean distance transform is applied to the binary image obtained by adaptive threshold segmentation. This process generates distance maps used for identifying reliable foreground regions via thresholding, thus determining the unknown regions. Finally, the watershed algorithm is applied to segment the image based on these labeled regions. A unique value for indexing is assigned to each region, after which the regions are restored to their original size.
Since the watershed transform often produces over-segmentation results and both the pre- and post-processing are needed [44], we integrate the segmentation results of Mask R-CNN (LFA head) and watershed transform through GIS overlay analysis to leverage the complementary advantages of both approaches for solid waste edges adjustment. The details of overlay analysis are shown in Figure 5.
Considering the spatial and spectral characteristics of solid waste samples, spatial correlation and HSV color histogram were applied for precise edge adjustment. The edges from Mask R-CNN (LFA head) are adjusted by watershed transform results using overlay analysis as follows:
Intersect A m a x Dist D m i n ,   R f = R w R m Intersect A m i n Dist D m a x ,   R f = R m \ R w else ,   R f = R m
where A m i n and A m a x are intersecting area thresholds, D m i n and D m a x are the chi-square distance thresholds, I n t e r s e c t is the intersecting area ratio of two segmentation results, D i s t is the chi-square distance between the two histograms, R m is the region derived from Mask R-CNN (LFA head), R w is the region from watershed transform, and R f is the merged region. The symbol \ denotes the difference between two regions, A \ B = x x A x B .
In this study, the Intersect is defined as:
Intersect = C O U N T ( R w R m ) C O U N T ( R w ) = n / N × 100 %
where C O U N T ( ) is the counting function, N is the number of pixels in R w , and n is the number of pixels in the intersection result between R m with R w .
The spectral similarity between the two regions is assessed using the chi-square distance D i s t , which is defined as:
Dist H W , H m = k = 1 K H w k H m k 2 H w k + H m k
where H w and H m are the image histograms of R m and R w in the HSV color space, respectively. K is the number of image histograms bins, and H w k and H m k denote the pixel frequencies in the k-th bin of histograms H w and H m , respectively.

3. Results

To quantitatively assess the performance of WMNet-SW, we employed precision, recall, F1-score, and average precision (AP), along with mAP variants, including mAP50, mAP75, mAPM, and mAPL, as evaluation metrics [13,35]. Specifically, mAP50 and mAP75 represent AP values calculated under intersection-over-union (IoU) thresholds of ≥0.5 and ≥0.75, respectively, while mAPM and mAPL denote the mean AP for medium-sized objects (32 × 32 to 96 × 96 pixels) and large-sized objects (>96 × 96 pixels). Statistical analysis revealed an absence of small-scale objects (<32 × 32 pixels) in the solid waste dataset, precluding the need for mAPMS evaluation. The experiments of WMNet-SW were performed on a workstation with an RTX 3090 GPU, Intel Core i7-12700F CPU, and 64 GB RAM. We set the number of epochs to 50 with a minibatch size of 8, and used the SGD optimizer to update network parameters, with momentum of 0.9 and the weight decay of 5 × 10⁻⁴. In the selection of watershed parameters, and given the inherently Euclidean geometry of the target features [45], we use the Euclidean distance metric for the distance transform and set the distance-transform threshold ratio to 0.3. To more effectively refine the edges of solid-waste instances, we generally favor somewhat smaller threshold ratios so that the watershed supplies finer candidate edges for subsequent fusion and refinement.
To evaluate WMNet-SW, we first detailed the comparison experiments of Mask R-CNN for optimizing the parameters. Based on the optimized parameters, we introduced several variants of Mask R-CNN with different architectures and compared their performance against Mask R-CNN with LFA head. Finally, we presented the results of precise edge adjustment.

3.1. Mask R-CNN Optimization Results

We implement two strategic modifications to enhance Mask R-CNN for solid waste retrieval: anchor size optimization and RoI quantity adjustment. The default anchors are configured with five scales ([32, 64, 128, 256, 512]) and three aspect ratios ([1:1, 1:2, 2:1]), and the number of RoIs is 1000 by default. The default configuration employs five anchor scales ([32, 64, 128, 256, 512]) with three aspect ratios (1:1, 1:2, 2:1), while maintaining a default setting of 1000 RoIs per image. As shown in Table 2 and Figure 6, we optimize the anchor scales to [48, 96, 192, 384, 768] and reduce the number of RoIs to 900 per image, achieving better performance for solid waste retrieval tasks. The optimized model maintains recall and average precision within acceptable variation thresholds while exhibiting a 16.7% increase in mAP and a 0.12 increment in F1-score, statistically validating its balanced enhancement in both class-specific solid waste detection accuracy and holistic performance metrics. Precision metrics for all solid waste categories demonstrated substantial advancements, with I-SW achieving 74.94% (initial: 56.25%), D-SW reaching 42.41% (initial: 26.96%), and C-SW attaining 43.77% (initial: 27.43%), corresponding to absolute increments of 18.69, 15.45, and 16.34 percentage points. Similarly, F1-scores showed consistent progression across categories: I-SW rose to 0.80 from a baseline of 0.68, D-SW advanced to 0.55 relative to an initial 0.41, and C-SW attained 0.50 compared to its starting value of 0.40, with differential magnitudes of 0.12, 0.14, and 0.10, respectively. The parametric refinements critically enhance Mask R-CNN’s operational synergy between detection and instance segmentation for solid waste tasks. Since Mask R-CNN requires combining solid waste categories for instance segmentation, incorrect predictions compromise subsequent tasks. By reconfiguring anchor scales to better align with solid waste size distributions and strategically limiting RoIs candidates, the model suppresses feature ambiguity that traditionally propagates misclassification errors into segmentation outputs. At the same time, the parameter-optimized model reduces false positives while maintaining high recall, demonstrating enhanced adaptability and balanced performance. These improvements make it more suitable for solid waste identification, classification, and instance segmentation.

3.2. LFA Mask Head Results

We conducted a comprehensive evaluation of Mask R-CNN (LFA head) performance, benchmarking its capabilities in solid waste classification, bounding box regression, and segmentation against multiple state-of-the-art methods through both quantitative and qualitative analyses. Three models of Mask R-CNN were adopted for comparison: Mask R-CNN with the FCN head (default architecture), Mask R-CNN with a feature fusion block (FFB) mask head [46], and Cascade R-CNN [47], to assess the performance of Mask R-CNN (LFA head). The quantitative and qualitative assessments are reported in Table 3 and Table 4 and Figure 7, respectively.
For solid waste classification performance, as shown in Table 3 and Figure 7, the proposed approach outperformed the other three models in average precision, recall, F1 score, and average AP. In terms of average precision, the Mask R-CNN (LFA head) achieved 58.10%, surpassing Cascade R-CNN by 2.67%, outperforming Mask R-CNN (FFB head) by 3.88%, and exceeding Mask R-CNN (FCN head) by 4.49%, while demonstrating superior precision in I-SW recognition at 87.84%. Regarding average recall, the LFA-enhanced Mask R-CNN attained 77.29%, representing a 3.55% improvement over Cascade R-CNN, 0.79% advantage against the FFB variant, and 2.23% superiority compared to the FCN configuration, with class-specific recall values for all solid waste categories exceeding competing models, particularly achieving 90.30% recall for I-SW. The model’s average F1-score reached 0.65, outperforming all three comparative architectures, while attaining a peak F1-score of 0.89 for I-SW detection. In average AP evaluation, the LFA-head implementation achieved 64.42%, exceeding Cascade R-CNN by 2.24%, surpassing the FFB variant by 1.12%, and outperforming the FCN configuration by 2.40%, while maintaining AP superiority across all solid waste subcategories. The experimental results demonstrate that the Mask R-CNN architecture integrated with the LFA head exhibits comprehensive performance advantages across critical evaluation metrics compared to both Cascade R-CNN and other Mask R-CNN variants. This configuration consistently achieves superior detection accuracy, recall capability, and harmonic mean balance in precision–recall tradeoff, particularly excelling in category-specific recognition tasks. The observed performance enhancements suggest that the LFA-head design effectively optimizes feature representation and decision boundaries, enabling more robust multi-category detection capabilities. Notably, the model maintains detection superiority across all subcategories while demonstrating exceptional discriminative power for challenging target classes, indicating its potential for complex instance segmentation scenarios requiring high-precision localization and classification.
Furthermore, we evaluated the performance of different model architectures in terms of bounding box regression and solid waste segmentation (Table 4). In bounding box regression, Mask R-CNN (LFA head) exhibited performance improvements ranging from 0.5% to 5% across all metrics compared to Mask R-CNN (FCN head), while also surpassing Mask R-CNN (FFB head). The Mask R-CNN (LFA head) demonstrated superior performance across all evaluation metrics compared to both Mask R-CNN (FCN head) and Mask R-CNN (FFB head). Specifically, it outperformed the Mask R-CNN (FCN head) by margins of 4.9%, 2.2%, and 2% in per-class solid waste AP measurements, with corresponding advantages of 3% in average AP, 0.5% in mAP50, 5% in mAP75, 4.1% in mAPM, and 3% in mAPL. When compared to the Mask R-CNN (FFB head), the Mask R-CNN (LFA head) achieved respective improvements of 0.6%, 1%, and 1.2% in per-class solid waste AP evaluations, accompanied by performance enhancements of 0.9% in average AP, 0.4% in mAP50, 1.2% in mAP75, 4.1% in mAPM, and 0.9% in mAPL. Although Cascade R-CNN held an advantage in bounding box regression with its multi-stage cascaded detector structure, Mask R-CNN (LFA head) exceeded Cascade R-CNN by 2.3% and 1.5% for IoU50 and mAPM., respectively. Additionally, it achieved similar performance to Cascade R-CNN in other bounding box regression metrics. These comparative advantages persist across both per-class solid waste AP evaluations (4.9% maximum gain) and comprehensive AP averages (3% improvement), confirming the LFA head’s robustness against both class-specific variations and aggregate performance metrics. The consistent performance hierarchy across all measurement dimensions underscores the fundamental superiority of the LFA’s feature processing paradigm in bounding box regression tasks.
In solid waste segmentation, Mask R-CNN (LFA head) outperformed all other models across almost all metrics. Specifically, it surpassed the Mask R-CNN (FCN head) by 4.3%, 1.9%, and 1.4% in per-class solid waste AP measurements, with corresponding advantages of 2.5% in average AP, 2.4% in mAP50, 5.2% in mAP75, 0.7% in mAPM, and 2.7% in mAPL. Compared to the Mask R-CNN (FFB head), the Mask R-CNN (LFA head) achieved improvements of 0.9% and 1.4% in D-SW and C-SW AP evaluations, respectively, along with performance gains of 0.4% in average AP, 1.1% in mAP50, 1% in mAPM, and 0.2% in mAPL. Furthermore, the Mask R-CNN (LFA head) outperformed Cascade R-CNN by margins of 2.9%, 2.1%, and 0.9% in per-class solid waste AP assessments, complemented by enhancements of 1.9% in average AP, 2.2% in mAP50, 2.6% in mAP75, 2.9% in mAPM, and 1.7% in mAPL. Notably, the Mask R-CNN (LFA head) demonstrates a pronounced advantage in high-precision localization, as evidenced by its substantial improvements in mAP75 metrics across all comparative models, suggesting enhanced capability in capturing fine-grained object boundaries and geometric details. Its consistent gains across both per-class and average AP metrics further indicate robustness to class-specific variations and overall segmentation consistency. These collective improvements across multiple evaluation dimensions confirm that the LFA mechanism significantly advances segmentation accuracy through optimized feature representation learning and spatial context modeling.
Both Mask R-CNN (FFB head) and Mask R-CNN (LFA head) demonstrated comparable performance in solid waste segmentation, likely attributable to their shared multi-scale feature fusion strategy. However, the structurally complex FFB head required 1.4× longer training time than the LFA head. Similarly, Cascade R-CNN’s multi-stage cascaded detector architecture exhibited higher computational complexity, resulting in 1.3× longer training duration compared to the LFA head. Notably, Mask R-CNN equipped with the LFA head achieved superior performance with optimally balancing model efficacy and computational efficiency.

3.3. Evaluation of Precise Edge Adjustment

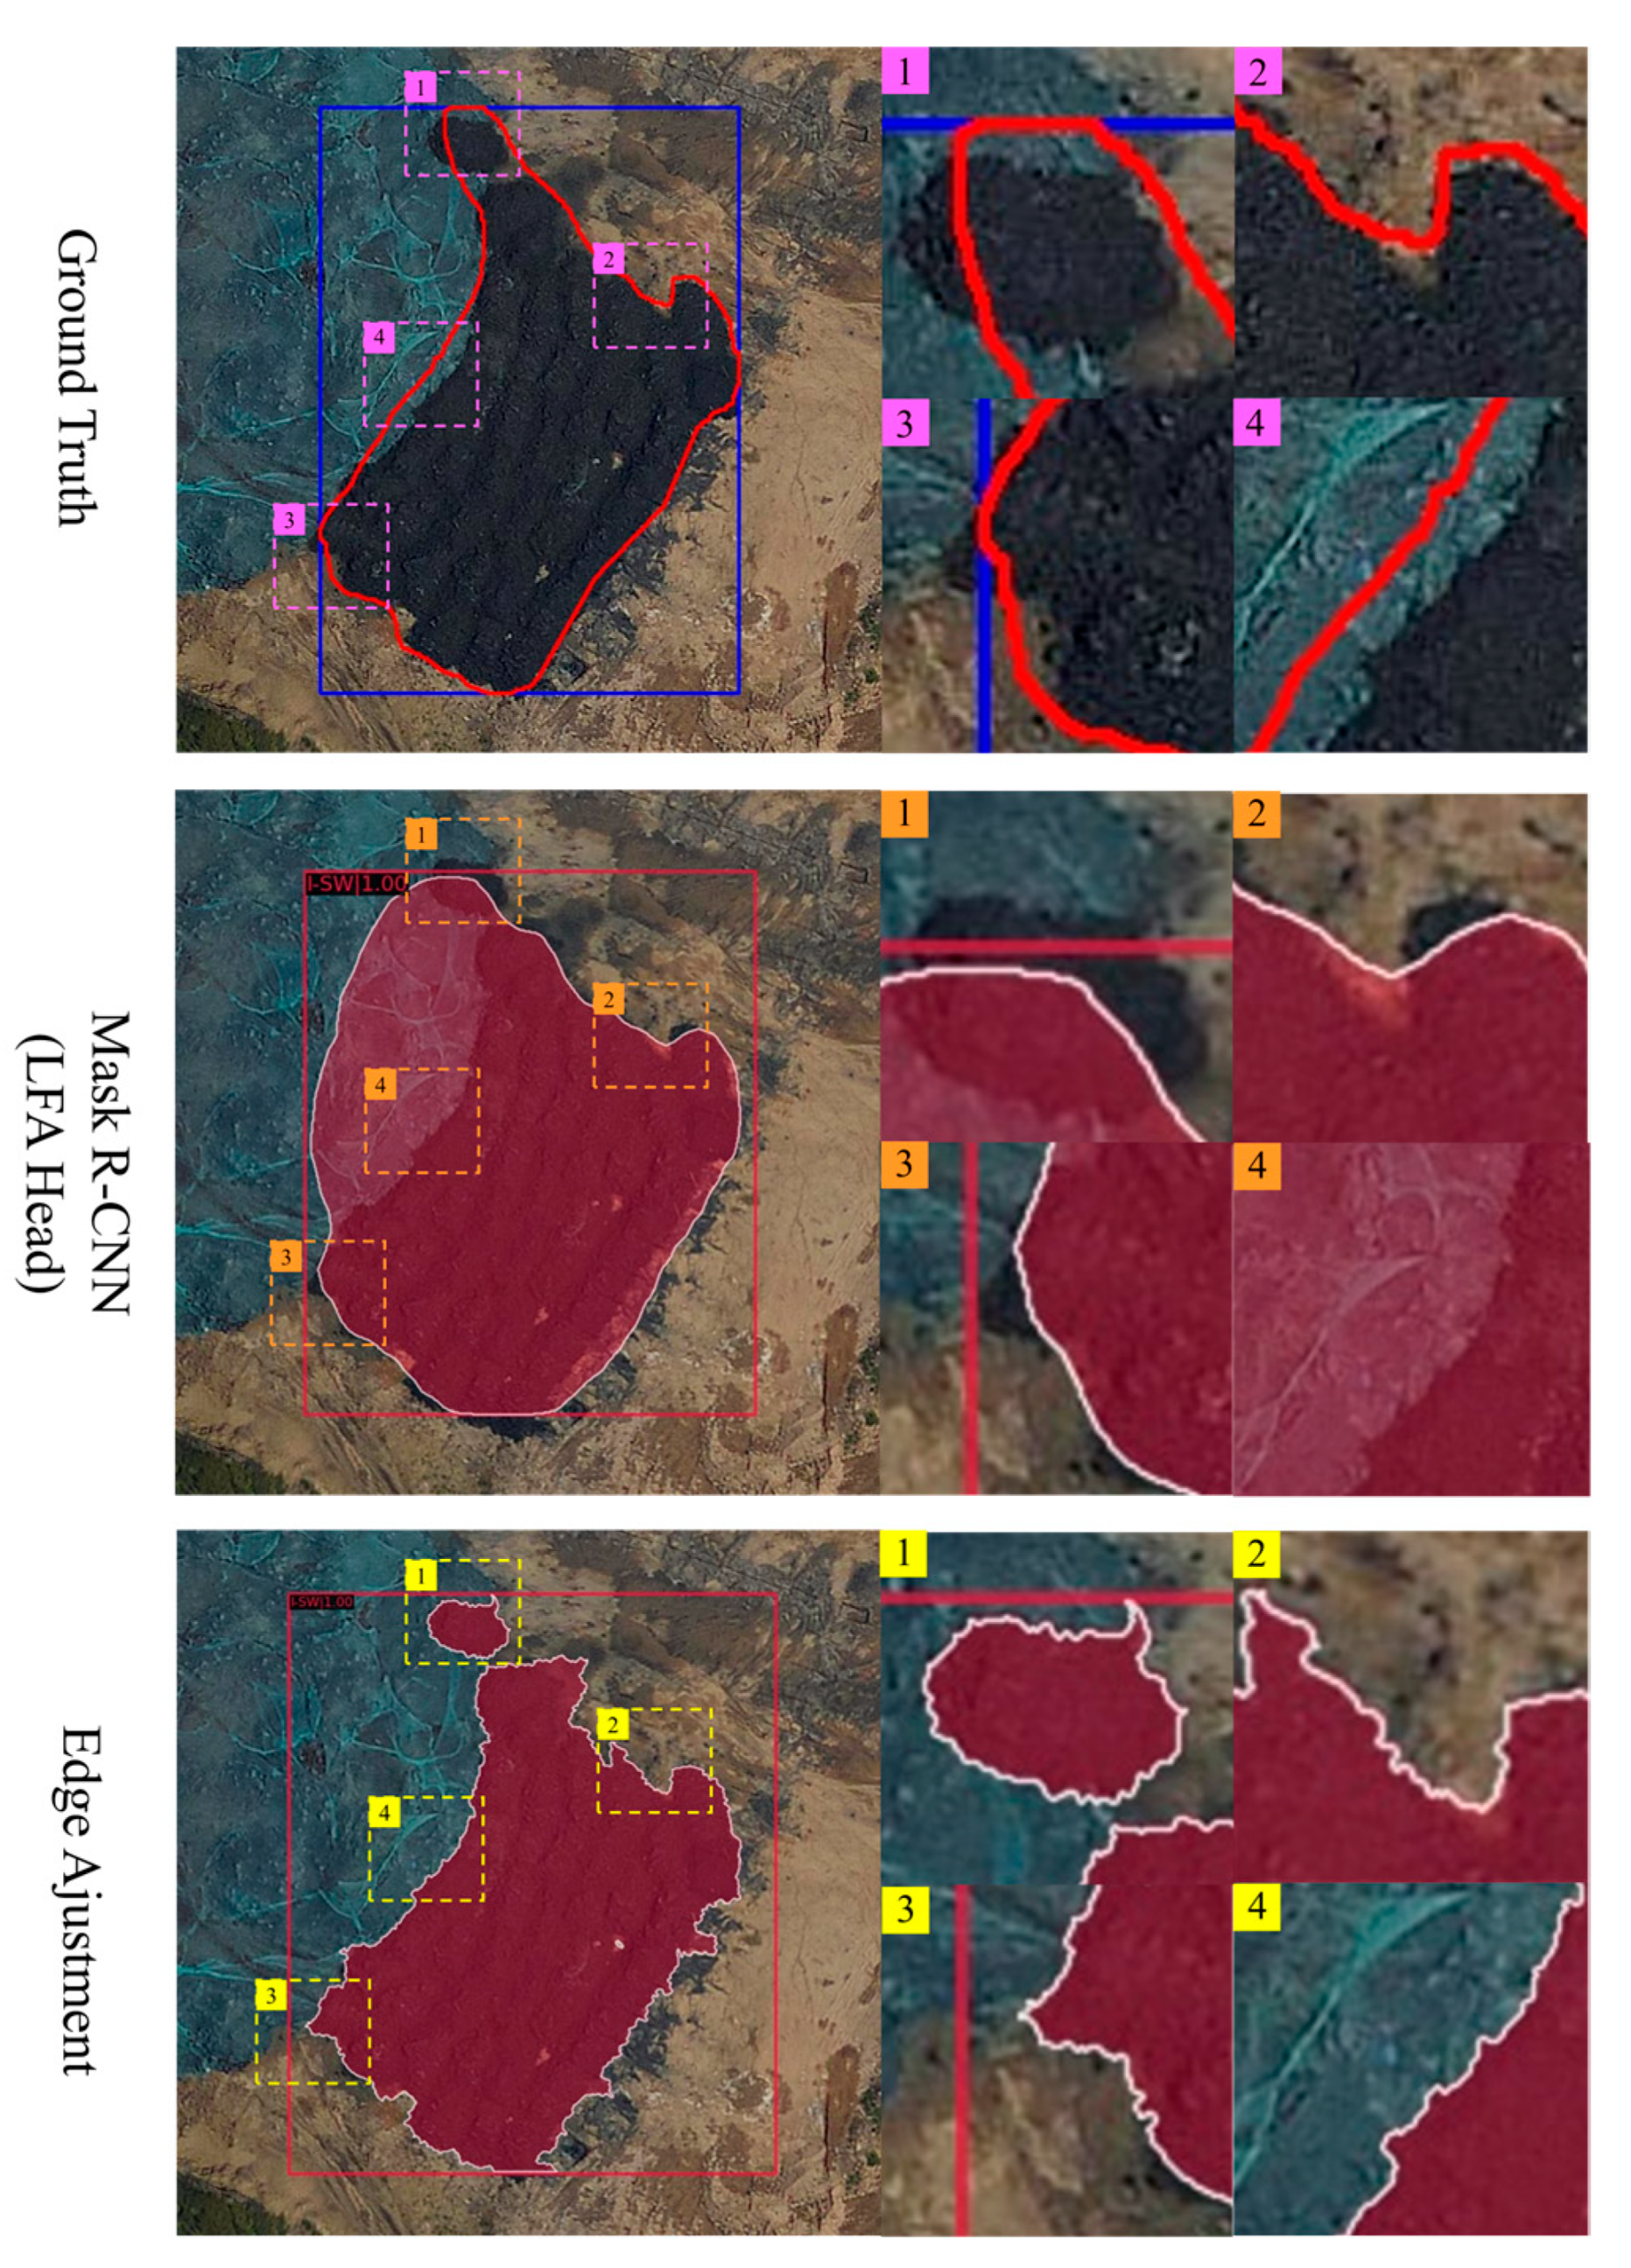
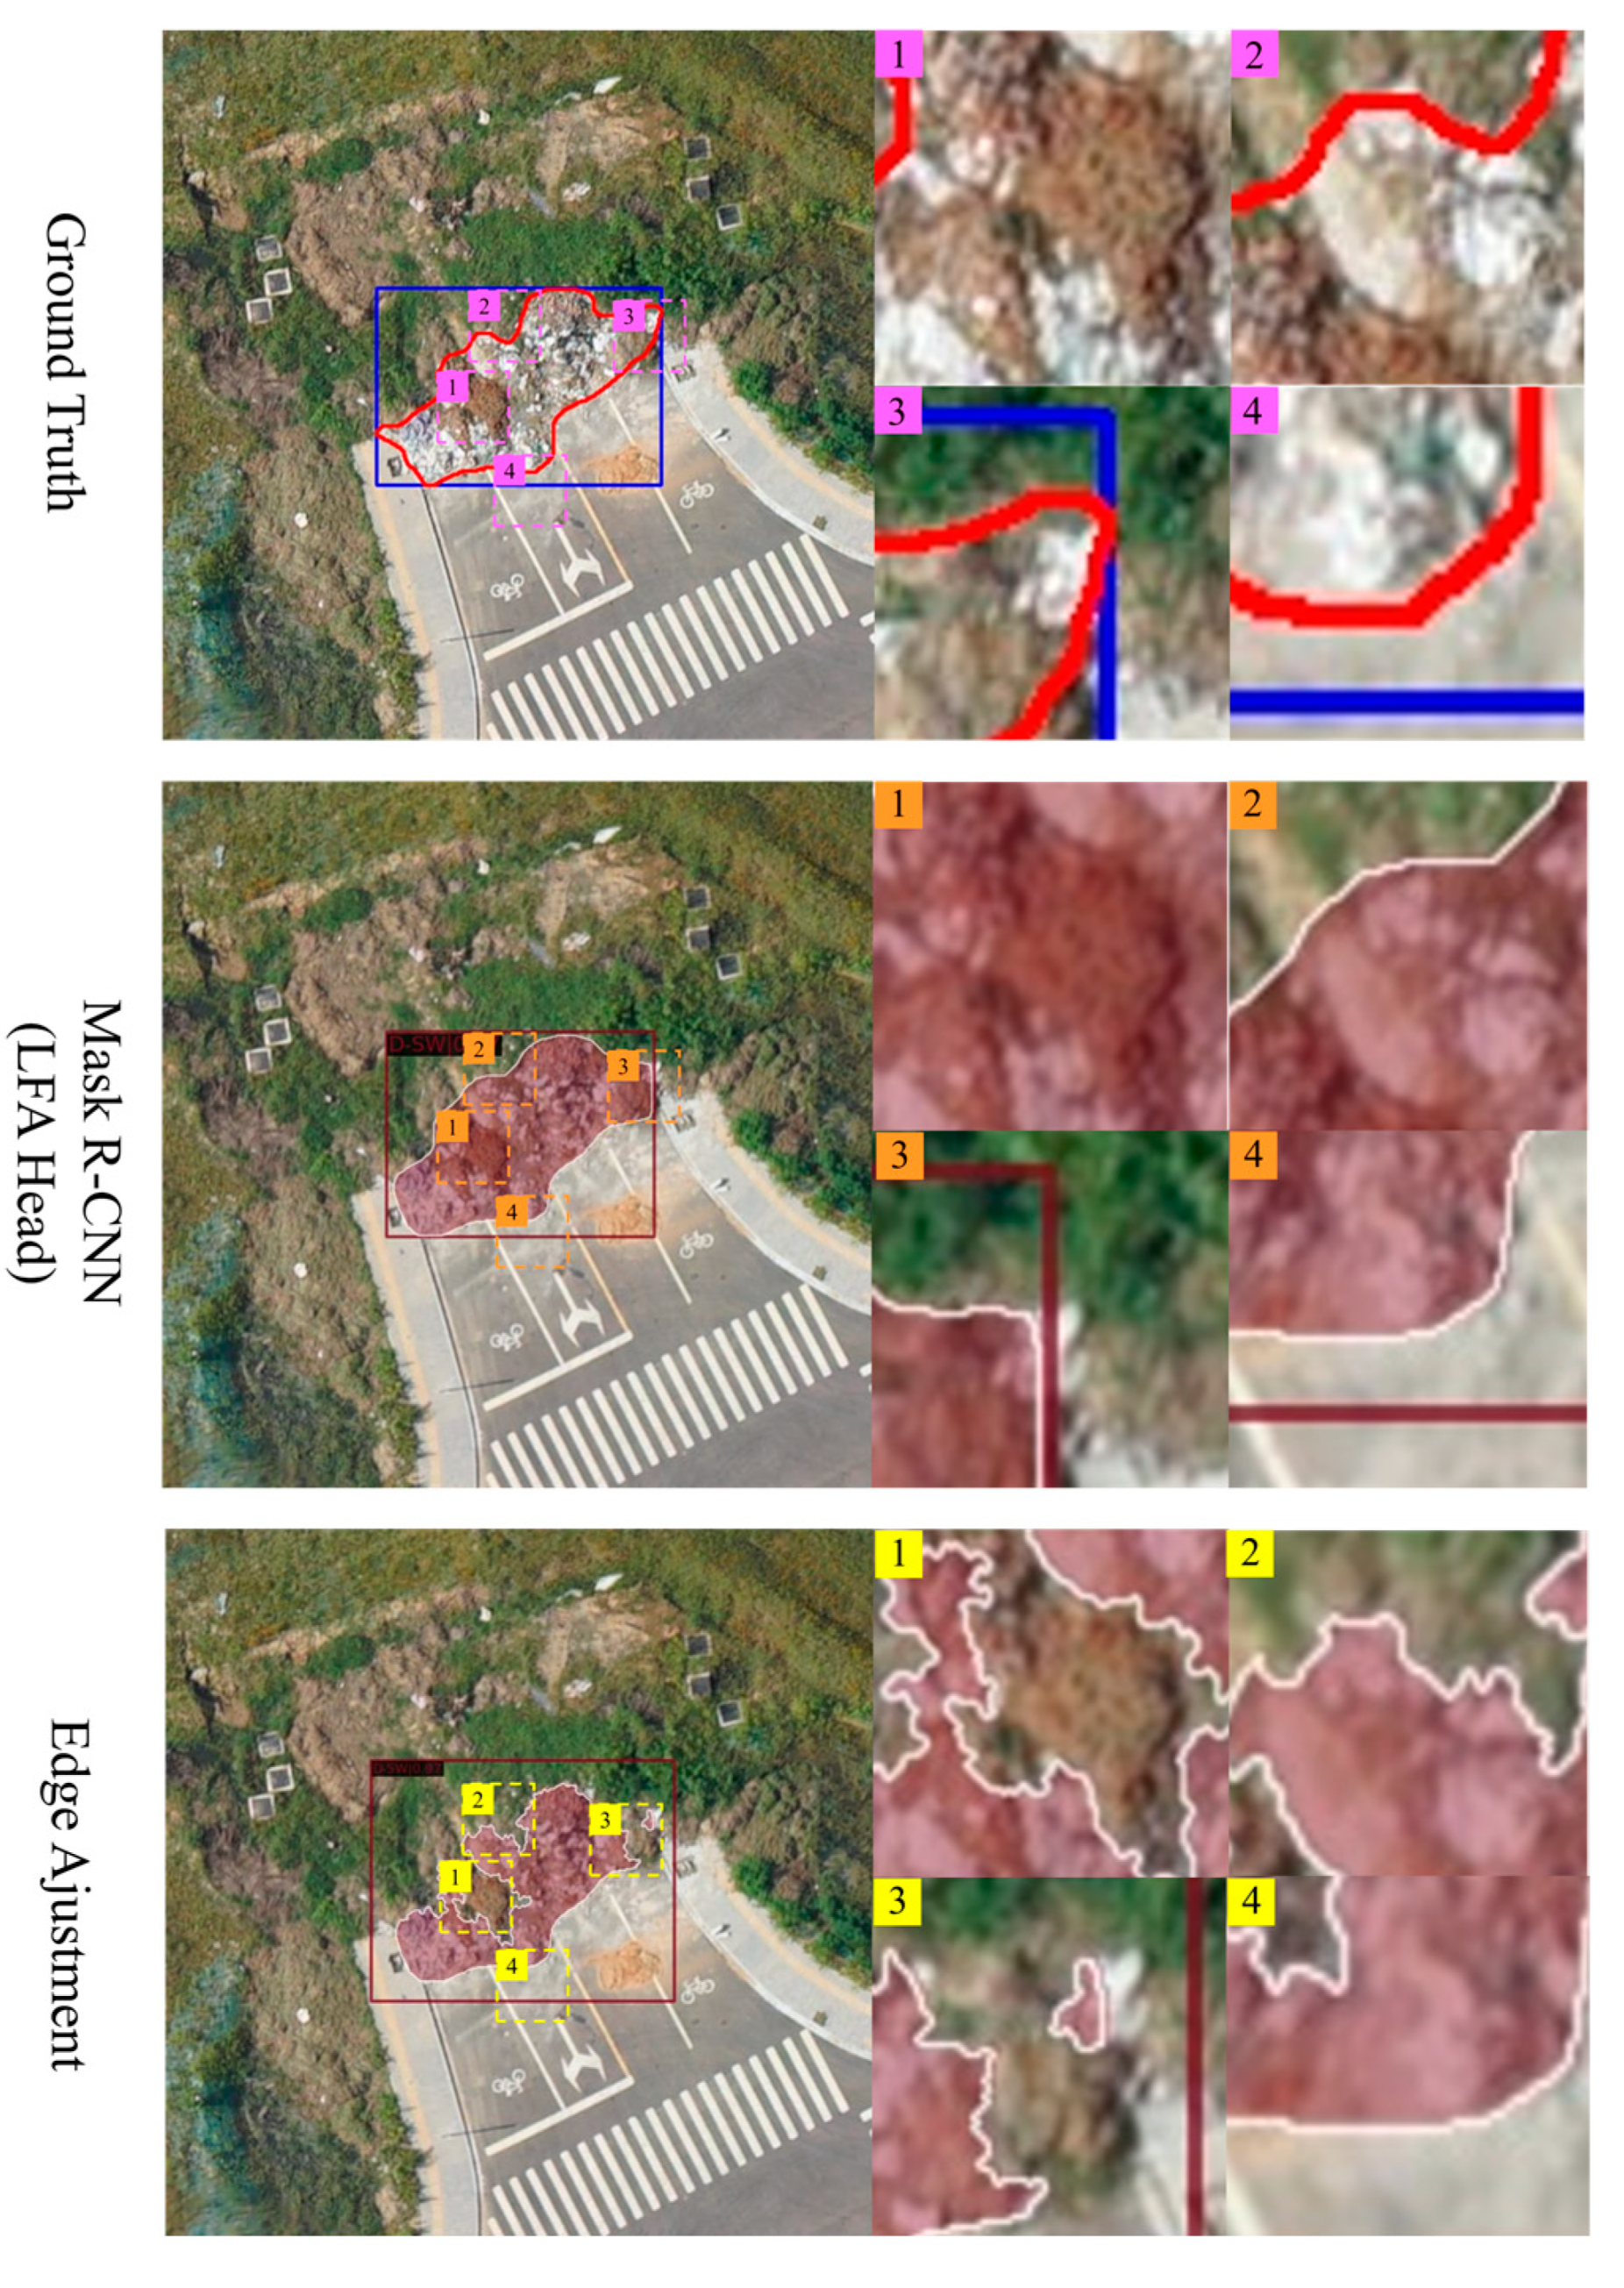
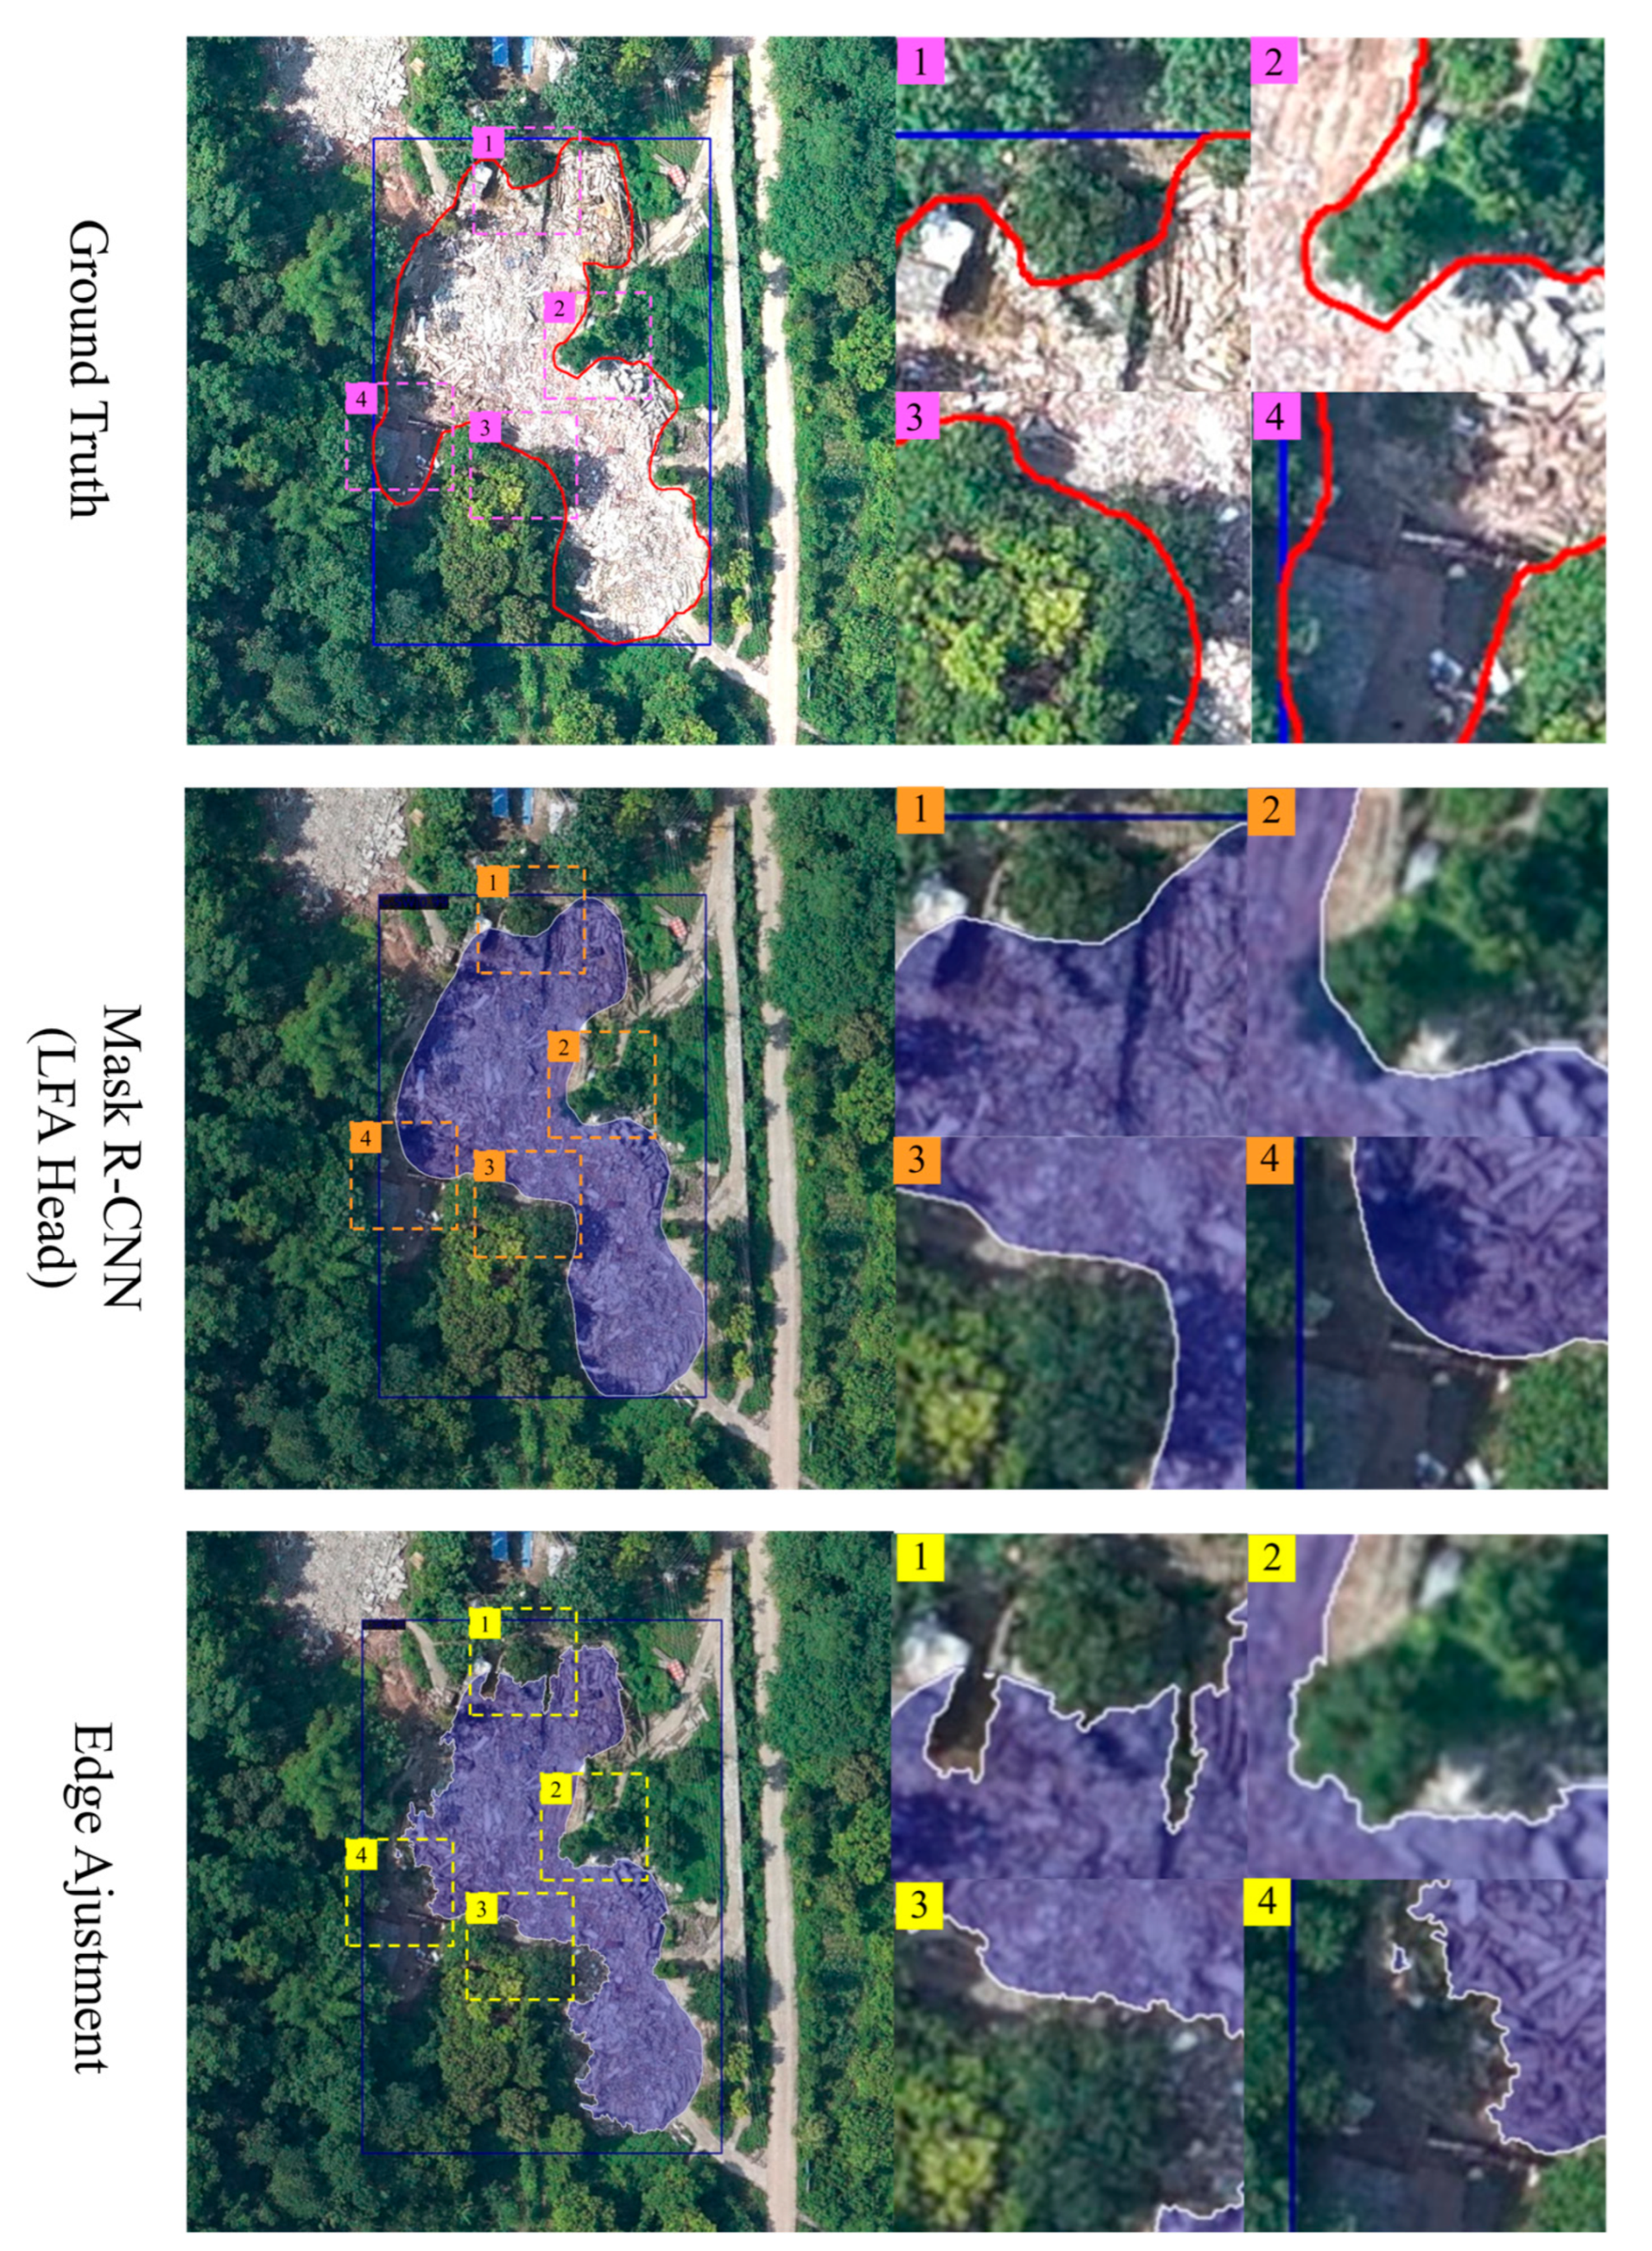
This section evaluates the performance of edge adjustment by comparing solid waste segmentation results under different conditions. Figure 8, Figure 9 and Figure 10 detail GT and Mask R-CNN (LFA Head) segmentation outcomes and refine solid waste segmentation instances with precise edge adjustment of I-SW, D-SW, C-SW, respectively. It is evident that I-SW is distinct from the other two solid waste types, being characterized by significant aggregation, block-like distribution, and regular shapes with well-defined boundaries. In contrast, D-SW and C-SW exhibit similar colors and distribution patterns, with relatively fuzzy edges and dispersed arrangements.
For I-SW, the edge adjustment detected the precise edge of solid waste and was consistent with the UAV image. In Figure 8, GT interpreted generally accurate edges of I-SW. However, the spatial resolution of 0.1 m is too fine for the size of solid waste and manual visual interpretation, leading to edge mismatches in detail, particularly evident in region 1 of Figure 8. The result of Mask R-CNN (LFA Head) showed relatively smooth edges that failed to fully fit the solid waste edges. Furthermore, I-SW was over-detected by Mask R-CNN (LFA Head) in region 4, which was corrected after edge adjustment. Additionally, edge adjustment effectively delineated precise edges in region 1, disconnected from the main body of the I-SW. Overall, the edge adjustment generated more precise edges of solid waste than Mask R-CNN (LFA Head), and it even overcame the edge limitations of GT. Figure 9 shows an evaluation sample of D-SW with relatively fragmented edges and diverse shapes. As shown in Figure 9, a cavity existed in region 1 within D-SW that reduced the fineness of the edges, which was successfully detected by edge adjustment. Additionally, the isolated D-SW patches in region 3 were accurately segmented, and the smooth transitional edges in detailed region 4 were well preserved. Generally, solid waste often disperses in complex environments and presents indistinct edges with surrounding objects. Figure 10 shows a sample of C-SW located in a forest region. After edge adjustment, the edges of C-SW were significantly improved by eliminating ravines (region 1), trees (region 2 and region 3) and other non-solid waste objects (region 4).
From the edge adjustment samples of the three types of solid waste, it can be observed that the proposed edge adjustment method integrates the strengths of deep learning-based semantic segmentation and gradient-based image segmentation. This approach effectively segments solid waste from UAV images, refining the edges while preventing fragmentation and over-sharpening of edges.

4. Discussion

To retrieve solid waste with precise edge delineation from UAV images, we have proposed WMNet-SW, an improved instance segmentation approach. Since most deep learning models are primarily designed for general object extraction, WMNet-SW enhances the robustness and reliability of Mask R-CNN for solid waste retrieval by optimizing anchor size and the number of RoIs. The anchor size was systematically increased to 150% of the default configuration, aligning detector receptive fields with characteristic solid waste object sizes. Concurrently, RoI candidate quantities were strategically reduced during RPN operations to suppress feature redundancy. These refinements collectively enhanced Mask R-CNN’s operational efficiency while boosting key detection metrics, particularly in precision and F1-score. The developed optimization paradigm demonstrates transfer learning potential for adapting similar detection frameworks to specialized environmental monitoring tasks requiring high spatial fidelity.
Moreover, we integrated a novel LFA mask head employing multi-scale feature fusion into WMNet-SW to enhance solid waste detection in complex geographical environments. The enhanced Mask R-CNN architecture demonstrated superior performance metrics compared to benchmark models across both classification and segmentation evaluations. An in-depth analysis revealed that each module of the LFA mask head plays a critical role. The DSC within the LFA head effectively preserves solid waste features while expanding the receptive field compared to conventional convolutional layers. Additionally, the LFA head enables efficient multi-branch DSC feature integration by modularly replacing conventional FCN-based feature connectors, thereby facilitating cross-scale Region-of-Interest feature synthesis. This architectural innovation allows WMNet-SW to precisely distinguish solid waste signatures from background noise artifacts during extraction. Similar to Feature Pyramid Networks (FPN) [48], the LFA mask head based on multi-scale feature fusion may improve the performance of specific object extraction.
In real-world scenarios, the spatially heterogeneous distribution of solid waste and its irregular morphological configurations create substantial technical barriers to high-precision edge extraction. While the morphological watershed algorithm leverages gradient-driven edge detection without requiring training data, its outputs exhibit semantic ambiguity and excessive fragmentation due to inherent noise sensitivity. To address these limitations, WMNet-SW synergizes deep learning-generated semantic priors with gradient-based watershed features via geospatial data fusion. In WMNet-SW, the integration is augmented by histogram-driven spectral analysis to exploit color data complementarity, thereby harmonizing data-driven pattern recognition with physics-based edge detection paradigms. The edge adjustment results indicate that WMNet-SW achieves high-precision edge delineation for solid waste instances with discontinuous edges, amorphous geometries, and low-contrast signatures in cluttered scenes. Notably, the framework partially compensates for annotation inaccuracies in GT labels through its hybrid optimization mechanism. However, WMNet-SW retains limitations under several challenging conditions. Performance degrades not only under extreme illumination changes, low contrast between solid waste and background, heavy object overlap or occlusion but also in cases of strong background clutter, motion blur and compression artifacts, because RGB texture and gradient cues alone become ambiguous. To enhance robustness, a viable strategy is to incorporate complementary payloads such as LiDAR, thermal infrared, multispectral, or hyperspectral sensors. These systems provide critical structural and material information, which is instrumental in resolving ambiguities in low-contrast, occluded, or spectrally similar scenarios.
Although WMNet-SW demonstrates effective solid waste retrieval capabilities in UAV imagery, three key challenges warrant deeper investigation. The paucity of annotated solid waste training instances in publicly available benchmark datasets constrains model generalizability. Our current dataset suffers from skewed category distribution, limited sample diversity, and coarse annotation granularity. Moreover, its temporal coverage is incomplete, and manual annotation of very small or highly fragmented solid waste instances inevitably introduces label noise and coarse mask edges, which reduce effective diversity for rare object configurations and limit the statistical power for cross-site generalization. The development of large-scale, hierarchically labeled repositories remains a critical factor for advancing the solid waste retrieval from UAV imagery. Empirical studies suggest that dataset quality exerts greater influence on detection accuracy than architectural refinements [13]. Additionally, the high diversity of solid waste across application scenarios demands fine-grained taxonomies supported by pixel-level annotation protocols. Furthermore, WMNet-SW employs spatial coincidence and spectral consistency metrics to integrate deep learning and watershed outputs. A systematic evaluation of alternative fusion criteria (e.g., morphological similarity, edge confidence scores), together with the incorporation of attention mechanisms to adaptively weight and select informative features [49], could further optimize edge precision. Finally, the successful adaptation of geospatial correlation analysis principles in this work motivates future exploration of advanced GIS techniques, including spatial–temporal pattern mining and 3D volumetric analysis, for improved solid waste retrieval.

5. Conclusions

This study establishes WMNet-SW, an improved instance segmentation approach that achieves pixel-accurate solid waste retrieval in UAV-acquired imagery through three critical innovations. First, we optimize Mask R-CNN with task-specific parameters, enhancing its capacity to detect solid waste in complex environments. Second, the developed LFA mask head overcomes challenges in scale-variant target representation by effectively utilizing convolutional layer features, outperforming conventional multi-scale fusion approaches for precise delineation of solid waste edges. Third, based on GIS overlay analysis and image histogram analysis, the morphological watershed transform is integrated with Mask R-CNN (LFA) to jointly leverage geometric priors, radiometric signatures and semantic information, which integrates computer vision architectures with geospatial analysis paradigms synergistically. The experimental results confirm that WMNet-SW can rapidly and accurately extract geographic information such as solid waste categories, spatial locations and coverage area from UAV imagery, even with limited sample accuracy. It provides a novel approach for annotating specific ground objects such as solid waste and offers scientific guidance for solid waste detection, management, and environmental protection.

Author Contributions

Supervision, conceptualization, resources, methodology, writing—review and editing, Y.H.; resources, methodology, numerical simulation, writing—original draft preparation, Z.C. All authors have read and agreed to the published version of the manuscript.

Funding

This work was supported in part by the Strategic Priority Research Program of the Chinese Academy of Sciences (XDB0740202), National Natural Science Foundation of China (42471386) and Technology Fundamental Resources Investigation Program (2023FY101002).

Data Availability Statement

The data mentioned in the manuscript may be requested by email from the author.

Conflicts of Interest

The authors declare no conflicts of interest.

References

  1. Jiang, N.; Sun, Y.Z.; Li, X.F.; Pan, J.Q. Research progress of solid waste-derived carbon materials for electrochemical capacitors through controlled structural regulation. J. Power Sources 2025, 629, 235990. [Google Scholar] [CrossRef]
  2. Sharma, G.; Sharma, A. Solid Waste Management by Considering Compost Potential in Bikaner and Challenges. AIP Conf. Proc. 2020, 2220, 020165. [Google Scholar] [CrossRef]
  3. Song, Q.B.; Li, J.H.; Zeng, X.L. Minimizing the increasing solid waste through zero waste strategy. J. Clean. Prod. 2015, 104, 199–210. [Google Scholar] [CrossRef]
  4. Shovon, S.M.; Akash, F.A.; Rahman, W.; Rahman, M.A.; Chakraborty, P.; Hossain, H.M.Z.; Monir, M.U. Strategies of Managing Solid Waste and Energy Recovery for a Developing Country—A Review. Heliyon. 2024, 10, e24736. [Google Scholar] [CrossRef]
  5. World Bank. Solid Waste Management. Available online: https://www.worldbank.org/en/topic/urbandevelopment/brief/solid-waste-management (accessed on 11 February 2022).
  6. Hu, H.Z. China Energy Statistical Yearbook; China Statistics Press: Beijing, China, 2022; Available online: https://inds.cnki.net/knavi/yearbook/Detail/GOBY/YCXME (accessed on 1 March 2022).
  7. Chen, W.Y.; Zhao, Y.Y.; You, T.F.; Wang, H.F.; Yang, Y.; Yang, K. Automatic detection of scattered garbage regions using small unmanned aerial vehicle low-altitude remote sensing images for high-altitude natural reserve environmental protection. Environ. Sci. Technol. 2021, 55, 3604–3611. [Google Scholar] [CrossRef]
  8. Cruvinel, V.R.N.; Marques, C.P.; Cardoso, V.; Novaes, M.R.; Araújo, W.N.; Angulo-Tuesta, A.; Escalda, P.M.; Galato, D.; Brito, P.; Da Silva, E.N. Health conditions and occupational risks in a novel group: Waste pickers in the largest open garbage dump in Latin America. BMC Public Health 2019, 19, 581. [Google Scholar] [CrossRef]
  9. Li, H.F.; Hu, C.; Zhong, X.R.; Zeng, C.; Shen, H.F. Solid Waste Detection in Cities Using Remote Sensing Imagery Based on a Location-Guided Key Point Network With Multiple Enhancements. IEEE J. Sel. Top. Appl. Earth Observ. Remote Sens. 2022, 16, 191–201. [Google Scholar] [CrossRef]
  10. Wang, B.S.; Xing, Y.H.; Wang, N.; Chen, C.L.P. Monitoring Waste From Uncrewed Aerial Vehicles and Satellite Imagery Using Deep Learning Techniques: A Review. IEEE J. Sel. Top. Appl. Earth Observ. Remote Sens. 2024, 17, 20064–20079. [Google Scholar] [CrossRef]
  11. Li, P.; Xu, J.Y.; Liu, S.B. Solid Waste Detection Using Enhanced YOLOv8 Lightweight Convolutional Neural Networks. Mathematics 2024, 12, 2185. [Google Scholar] [CrossRef]
  12. Sun, X.; Yin, D.; Qin, F.; Yu, H.; Lu, W.; Yao, F.; He, Q.; Huang, X.; Yan, Z.; Wang, P.; et al. Revealing influencing factors on global waste distribution via deep-learning based dumpsite detection from satellite imagery. Nat. Commun. 2023, 14, 1444. [Google Scholar] [CrossRef] [PubMed]
  13. Huang, Y.H.; Wu, C.B.; Yang, H.J.; Zhu, H.T.; Chen, M.X.; Yang, J. An Improved Deep Learning Approach for Retrieving Outfalls Into Rivers From UAS Imagery. IEEE Trans. Geosci. Remote Sens. 2021, 60, 1–14. [Google Scholar] [CrossRef]
  14. Zhong, Y.F.; Hu, X.; Luo, C.; Wang, X.Y.; Zhao, J.; Zhang, L.P. WHU-Hi: UAV-borne hyperspectral with high spatial resolution (H2) benchmark datasets and classifier for precise crop identification based on deep convolutional neural network with CRF. Remote Sens. Environ. 2020, 250, 112012. [Google Scholar] [CrossRef]
  15. Aplin, P. On scales and dynamics in observing the environment. Int. J. Remote Sens. 2007, 27, 2123–2140. [Google Scholar] [CrossRef]
  16. Tamouridou, A.A.; Alexandridis, T.K.; Pantazi, X.E.; Lagopodi, A.L.; Kashefi, J.; Moshou, D. Evaluation of UAV imagery for mapping Silybum marianum weed patches. Int. J. Remote Sens. 2016, 38, 2246–2259. [Google Scholar] [CrossRef]
  17. Torres-Sánchez, J.; López-Granados, F.; Peña, J.M. An automatic object-based method for optimal thresholding in UAV images: Application for vegetation detection in herbaceous crops. Comput. Electron. Agric. 2015, 114, 43–52. [Google Scholar] [CrossRef]
  18. Chen, Q.; Li, Y.Y.; Jia, Z.Y.; Cheng, Q.H. 3D Change Detection of Urban Construction Waste Accumulations Using Unmanned Aerial Vehicle Photogrammetry. Sens. Mater. 2021, 33, 4521–4543. [Google Scholar] [CrossRef]
  19. Long-Xin, X.; Yong-hua, S.; Wen-huan, W.; Kai, Z.; Shi-jun, H.; Yuan-ming, Z.; Miao, Y.; Xiao-han, Z. Research on Classification of Construction Waste Based on UAV Hyperspectral Image. Spectrosc. Spectr. Anal. 2022, 42, 3927–3934. [Google Scholar] [CrossRef]
  20. Huang, Y.H.; Zhao, C.P.; Yang, H.J.; Song, X.Y.; Chen, J.; Li, Z.H. Feature Selection Solution with High Dimensionality and Low-Sample Size for Land Cover Classification in Object-Based Image Analysis. Remote Sens. 2017, 9, 939. [Google Scholar] [CrossRef]
  21. Jiang, D.; Huang, Y.H.; Zhuang, D.F.; Zhu, Y.Q.; Xu, X.L.; Ren, H.Y. A Simple Semi-Automatic Approach for Land Cover Classification from Multispectral Remote Sensing Imagery. PLoS ONE 2012, 7, e45889. [Google Scholar] [CrossRef]
  22. Ren, S.Q.; He, K.M.; Girshick, R.; Sun, J. Faster R-CNN: Towards Real-Time Object Detection with Region Proposal Networks. IEEE Trans. Pattern Anal. Mach. Intell. 2017, 39, 1137–1149. [Google Scholar] [CrossRef]
  23. Redmon, J.; Divvala, S.; Girshick, R.; Farhadi, A. You Only Look Once: Unified, Real-Time Object Detection. In Proceedings of the IEEE Conference on Computer Vision and Pattern Recognition (CVPR), Las Vegas, NV, USA, 27–30 June 2016; pp. 779–788. [Google Scholar]
  24. Ronneberger, O.; Fischer, P.; Brox, T. U-Net: Convolutional Networks for Biomedical Image Segmentation. In Proceedings of the 18th International Conference on Medical Image Computing and Computer-Assisted Intervention (MICCAI), Munich, Germany, 5–9 October 2015; pp. 234–241. [Google Scholar]
  25. Chen, W.Y.; Wang, H.F.; Li, H.; Li, Q.J.; Yang, Y.; Yang, K. Real-Time Garbage Object Detection With Data Augmentation and Feature Fusion Using SUAV Low-Altitude Remote Sensing Images. IEEE Geosci. Remote Sens. Lett. 2021, 19, 1–5. [Google Scholar] [CrossRef]
  26. Gao, S.Y.; Liu, Y.; Cao, S.; Chen, Q.; Du, M.; Zhang, D.; Jia, J.; Zou, W. IUNet-IF: Identification of construction waste using unmanned aerial vehicle remote sensing and multi-layer deep learning methods. Int. J. Remote Sens. 2022, 43, 7181–7212. [Google Scholar] [CrossRef]
  27. Zhang, X.Y.; Chen, Y.L.; Han, W.; Chen, X.D.; Wang, S. Fine mapping of Hubei open pit mines via a multi-branch global–local-feature-based ConvFormer and a high-resolution benchmark. Int. J. Appl. Earth Obs. Geoinf. 2024, 133, 104111. [Google Scholar] [CrossRef]
  28. Liu, Y.; Gou, P.; Nie, W.; Xu, N.; Zhou, T.Y.; Zheng, Y.L. Urban Surface Solid Waste Detection Based on UAV Images. In Proceedings of the 8th China High Resolution Earth Observation Conference (CHREOC 2022), Beijing, China, 5–8 November 2022; pp. 124–134. [Google Scholar]
  29. Li, X.; Xu, F.; Liu, F.; Tong, Y.; Lyu, X.; Zhou, J. Semantic Segmentation of Remote Sensing Images by Interactive Representation Refinement and Geometric Prior-Guided Inference. IEEE Trans. Geosci. Remote Sens. 2024, 62, 1–18. [Google Scholar] [CrossRef]
  30. Soylu, B.E.; Guzel, M.S.; Bostanci, G.E.; Ekinci, F.; Asuroglu, T.; Acici, K. Deep-Learning-Based Approaches for Semantic Segmentation of Natural Scene Images: A Review. Electronics 2023, 12, 2730. [Google Scholar] [CrossRef]
  31. Kheradmandi, N.; Mehranfar, V. A critical review and comparative study on image segmentation-based techniques for pavement crack detection. Constr. Build. Mater. 2022, 321, 126162. [Google Scholar] [CrossRef]
  32. Xiao, J.; Mao, S.; Li, M.; Liu, H.; Zhang, H.; Fang, S.; Yuan, M.; Zhang, C. MFPA-Net: An efficient deep learning network for automatic ground fissures extraction in UAV images of the coal mining area. Int. J. Appl. Earth Obs. Geoinf. 2022, 114, 103039. [Google Scholar] [CrossRef]
  33. Vincent, L.; Soille, P. Watersheds in digital spaces: An efficient algorithm based on immersion simulations. IEEE Trans. Pattern Anal. Mach. Intell. 2002, 13, 583–598. [Google Scholar] [CrossRef]
  34. Yasir, M.; Sheng, H.; Fan, H.; Nazir, S.; Niang, A.J.; Salauddin, M.; Khan, S. Automatic Coastline Extraction and Changes Analysis Using Remote Sensing and GIS Technology. IEEE Access 2020, 8, 180156–180170. [Google Scholar] [CrossRef]
  35. He, K.M.; Gkioxari, G.; Dollár, P.; Girshick, R. Mask R-CNN. IEEE Trans. Pattern Anal. Mach. Intell. 2018, 42, 386–397. [Google Scholar] [CrossRef]
  36. Lin, T.Y.; Maire, M.; Belongie, S.; Hays, J.; Perona, P.; Ramanan, D.; Dollár, P.; Zitnick, C.L. Microsoft COCO: Common Objects in Context. In Proceedings of the European Conference on Computer Vision (ECCV), Zurich, Switzerland, 6–12 September 2014; pp. 740–755. [Google Scholar] [CrossRef]
  37. Wada, K. Labelme: Image Polygonal Annotation with Python (Version 3.9.0). 2019. Available online: https://github.com/zhong110020/labelme (accessed on 20 August 2025).
  38. Long, J.; Shelhamer, E.; Darrell, T. Fully convolutional networks for semantic segmentation. In Proceedings of the IEEE Conference on Computer Vision and Pattern Recognition (CVPR), Boston, MA, USA, 7–12 June 2015; pp. 3431–3440. [Google Scholar]
  39. Wang, S.J.; Sun, G.L.; Zheng, B.W.; Du, Y.W. A Crop Image Segmentation and Extraction Algorithm Based on Mask RCNN. Entropy 2021, 23, 1160. [Google Scholar] [CrossRef]
  40. Dai, J.F.; Qi, H.; Xiong, Y.; Li, Y.; Zhang, G.; Hu, H.; Wei, Y. Deformable Convolutional Networks. In Proceedings of the IEEE International Conference on Computer Vision (ICCV), Venice, Italy, 22–29 October 2017; pp. 764–773. [Google Scholar]
  41. Zeiler, M.D.; Krishnan, D.; Taylor, G.W.; Fergus, R. Deconvolutional networks. In Proceedings of the IEEE Computer Society Conference on Computer Vision and Pattern Recognition (CVPR), San Francisco, CA, USA, 13–18 June 2010; pp. 2528–2535. [Google Scholar]
  42. Noh, H.; Hong, S.; Han, B. Learning Deconvolution Network for Semantic Segmentation. In Proceedings of the IEEE International Conference on Computer Vision (ICCV), Santiago, Chile, 13–16 December 2015; pp. 1520–1528. [Google Scholar]
  43. Caponetti, L.; Castellan, G.; Basile, M.T.; Corsini, V. Fuzzy mathematical morphology for biological image segmentation. Appl. Intell. 2014, 41, 117–127. [Google Scholar] [CrossRef]
  44. Chen, Q.X.; Zhou, C.H.; Luo, J.C.; Ming, D.P. Fast segmentation of high-resolution satellite images using watershed transform combined with an efficient region merging approach. In Proceedings of the 10th International Workshop on Combinatorial Image Analysis, Auckland, New Zealand, 1–3 December 2004; pp. 621–630. [Google Scholar] [CrossRef]
  45. Li, X.; Xu, F.; Liu, F.; Lyu, X.; Gao, H.M.; Zhou, J.; Kaup, A. A Euclidean Affinity-Augmented Hyperbolic Neural Network for Semantic Segmentation of Remote Sensing Images. IEEE Trans. Geosci. Remote Sens. 2025, 63, 1–18. [Google Scholar] [CrossRef]
  46. Xiao, C.; Yin, Q.; Ying, X.; Li, R.; Wu, S.; Li, M.; Liu, L.; An, W.; Chen, Z. DSFNet: Dynamic and Static Fusion Network for Moving Object Detection in Satellite Videos. IEEE Geosci. Remote Sens. Lett. 2021, 19, 1–5. [Google Scholar] [CrossRef]
  47. Cai, Z.W.; Vasconcelos, N. Cascade R-CNN: Delving Into High Quality Object Detection. In Proceedings of the IEEE/CVF Conference on Computer Vision and Pattern Recognition (CVPR), Salt Lake City, UT, USA, 18–22 June 2018; pp. 6154–6162. [Google Scholar]
  48. Lin, T.Y.; Dollár, P.; Girshick, R.; He, K.M.; Hariharan, B.; Belongie, S. Feature Pyramid Networks for Object Detection. In Proceedings of the IEEE Conference on Computer Vision and Pattern Recognition (CVPR), Honolulu, HI, USA, 21–26 July 2017; pp. 936–944. [Google Scholar]
  49. Li, X.; Xu, F.; Liu, F.; Lyu, X.; Tong, Y.; Xu, Z.N.; Zhou, J. A Synergistical Attention Model for Semantic Segmentation of Remote Sensing Images. IEEE Trans. Geosci. Remote Sens. 2023, 61, 1–16. [Google Scholar] [CrossRef]
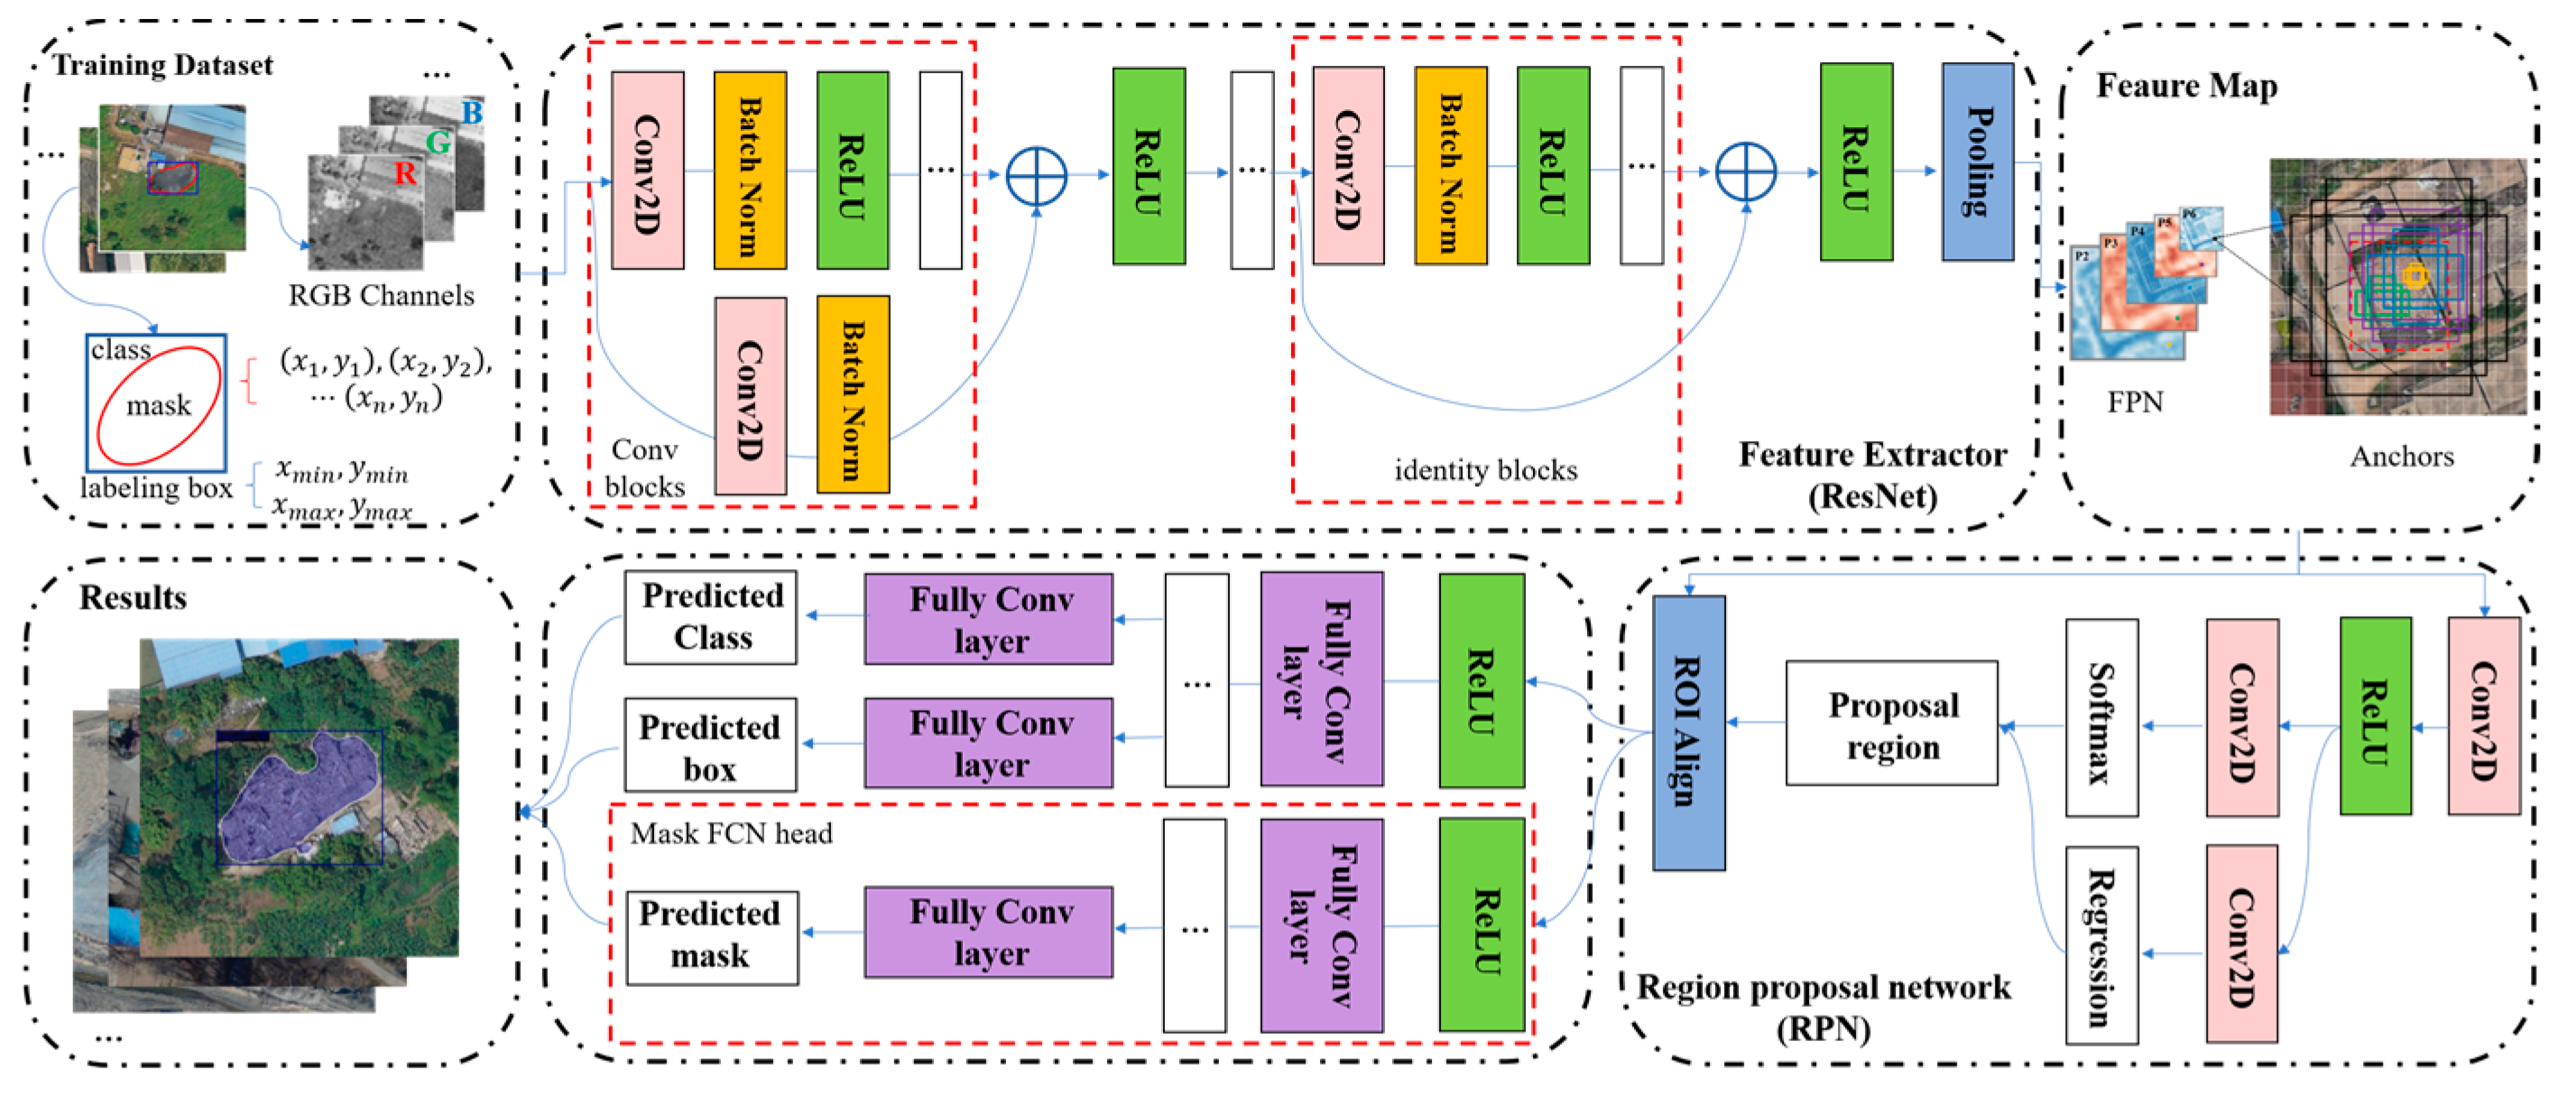
Figure 1. Overall architecture of the Mask R-CNN.
Remotesensing 17 03410 g001
Figure 2. Overall architecture of the WMNet-SW.
Remotesensing 17 03410 g002
Figure 3. Sizes of the GT box of solid waste samples.
Remotesensing 17 03410 g003
Figure 4. Structure of LFA head in Mask R-CNN.
Remotesensing 17 03410 g004
Figure 5. Overlay analysis for edge adjustment.
Remotesensing 17 03410 g005
Figure 6. Precision–recall curve of Mask R-CNN optimization results.
Remotesensing 17 03410 g006
Figure 7. Precision–recall curve of different architectures.
Remotesensing 17 03410 g007
Figure 8. Edge adjustment of I-SW.
Remotesensing 17 03410 g008
Figure 9. Edge adjustment of D-SW.
Remotesensing 17 03410 g009
Figure 10. Edge adjustment of C-SW.
Remotesensing 17 03410 g010
Table 1. Allocation of training and validation dataset.
TypeImagesInstancesTrain InstancesValidation Instances
I-SW11941269908361
D-SW61014671039428
C-SW181516421098544
Table 2. Evaluation results of parameters optimization.
ModelParams
Aspects: [1:1, 1:2, 2:1]
TypePrecision (%)Recall (%)F1AP (%)
DefaultScales: [32, 64, 128, 256, 512]
RoIs:1000
I-SW56.3587.810.6881.00
D-SW26.9685.980.4160.99
C-SW27.4373.160.4047.13
Avg36.9182.320.5063.04
OptimizedScales: [48, 96, 192, 384, 768]
RoIs:900
I-SW74.9486.700.8080.24
D-SW42.4180.370.5560.92
C-SW43.7758.090.5044.89
Avg53.6175.060.6262.02
Table 3. Evaluation of classification across different model architectures.
ModelTypePrecision (%)Recall (%)F1AP (%)
Mask R-CNN
(FCN Head)
I-SW74.9486.700.8080.24
D-SW42.4180.370.5560.92
C-SW43.7758.090.5044.89
Avg53.6175.060.6262.02
Mask R-CNN
(FFB Head)
I-SW76.8589.750.8285.54
D-SW43.3680.840.5661.17
C-SW42.4659.190.4943.18
Avg54.2276.590.6363.3
Cascade R-CNNI-SW65.6287.260.7583.00
D-SW49.1278.270.6059.66
C-SW51.5455.70.5343.87
Avg55.4373.740.6362.18
Mask R-CNN
(LFA head)
I-SW87.8490.300.8985.96
D-SW43.3281.070.5662.22
C-SW43.1460.480.5045.08
Avg58.1077.290.6564.42
Table 4. Evaluation of bounding box regression, segmentation and training time across different model architectures.
ModelTypeBounding Box RegressionSegmentationTraining Time
APmAP50mAP75mAPMmAPLAPmAP50mAP75mAPMmAPL
Mask R-CNN
(FCN Head)
I-SW0.5040.6590.4090.2650.4120.3970.6200.2650.2850.3154.20 h
D-SW0.3640.284
C-SW0.3110.241
Avg0.3930.307
Mask R-CNN
(FFB Head)
I-SW0.5470.6600.4470.3050.4310.4500.6330.3170.2820.34010.62 h
D-SW0.3760.294
C-SW0.3190.241
Avg0.4140.328
Cascade R-CNNI-SW0.5600.6410.4860.2910.4510.4110.6220.2910.2630.3259.50 h
D-SW0.3870.282
C-SW0.3370.246
Avg0.4280.313
Mask R-CNN
(LFA head)
I-SW0.5530.6640.4590.3060.4420.4400.6440.3170.2920.3427.49 h
D-SW0.3860.303
C-SW0.3310.255
Avg0.4230.332
Disclaimer/Publisher’s Note: The statements, opinions and data contained in all publications are solely those of the individual author(s) and contributor(s) and not of MDPI and/or the editor(s). MDPI and/or the editor(s) disclaim responsibility for any injury to people or property resulting from any ideas, methods, instructions or products referred to in the content.