Article

An Automated Framework for Abnormal Target Segmentation in Levee Scenarios Using Fusion of UAV-Based Infrared and Visible Imagery

1
National Institute of Natural Hazards, Ministry of Emergency Management of the People’s Republic of China, Beijing 100085, China
2
Key Laboratory of Compound and Chained Natural Hazards Dynamics, Ministry of Emergency Management of China, Beijing 100085, China
3
Information Institute of the Ministry of Emergency Management of the People’s Republic of China, Beijing 100029, China
*
Author to whom correspondence should be addressed.
Remote Sens. 2025, 17(20), 3398; https://doi.org/10.3390/rs17203398
Submission received: 25 August 2025 / Revised: 4 October 2025 / Accepted: 6 October 2025 / Published: 10 October 2025

Abstract

Highlights

What are the main findings?
  • We reframe levee monitoring as an unsupervised anomaly detection task, unifying diverse hazards and response elements into a single “abnormal targets” category for comprehensive situational awareness.
  • We propose a novel, fully automated and training-free framework that integrates multi-modal fusion with an adaptive segmentation module, where Bayesian optimization automatically tunes a mean-shift algorithm.
What is the implication of the main finding?
  • Our framework provides a practical solution for a challenging, data-scarce domain by eliminating the need for labelled training data, a major bottleneck for traditional supervised methods.
  • The proposed method demonstrates superior performance over all baselines in complex, real-world scenarios, proving the effectiveness of synergistic multi-modal fusion and adaptive unsupervised learning for disaster management.

Abstract

Levees are critical for flood defence, but their integrity is threatened by hazards such as piping and seepage, especially during high-water-level periods. Traditional manual inspections for these hazards and associated emergency response elements, such as personnel and assets, are inefficient and often impractical. While UAV-based remote sensing offers a promising alternative, the effective fusion of multi-modal data and the scarcity of labelled data for supervised model training remain significant challenges. To overcome these limitations, this paper reframes levee monitoring as an unsupervised anomaly detection task. We propose a novel, fully automated framework that unifies geophysical hazards and emergency response elements into a single analytical category of “abnormal targets” for comprehensive situational awareness. The framework consists of three key modules: (1) a state-of-the-art registration algorithm to precisely align infrared and visible images; (2) a generative adversarial network to fuse the thermal information from IR images with the textural details from visible images; and (3) an adaptive, unsupervised segmentation module where a mean-shift clustering algorithm, with its hyperparameters automatically tuned by Bayesian optimization, delineates the targets. We validated our framework on a real-world dataset collected from a levee on the Pajiang River, China. The proposed method demonstrates superior performance over all baselines, achieving an Intersection over Union of 0.348 and a macro F1-Score of 0.479. This work provides a practical, training-free solution for comprehensive levee monitoring and demonstrates the synergistic potential of multi-modal fusion and automated machine learning for disaster management.

1. Introduction

Floods caused by extreme rainfall often lead to river levee breaches and result in significant economic and human losses [1]. Ensuring the structural integrity and stability of levees is therefore fundamental to effective flood prevention and mitigation [2]. Piping, a phenomenon caused by internal erosion under a significant water pressure differential, can lead to the rapid and catastrophic collapse of the entire embankment structure [3,4]. Consequently, the rapid identification of potential piping zones is of paramount importance to enable timely emergency response and personnel evacuation.
Currently, manual inspection is still the primary method used to handle levee hazards because of its flexibility [5]. However, manual inspection is time-consuming, labour-intensive and prone to human error, which is not practical during flood seasons. Therefore, an automated monitoring method that can supplement or replace traditional labour is urgently needed. Recently, remote sensing from Unmanned Aerial Vehicles (UAVs), especially using thermal and visible sensors [6], has emerged as the most promising alternative.
Despite its potential, the application of UAV-based remote sensing to levee safety faces three main challenges. First, at the objective level, existing research focuses narrowly on identifying physical hazards such as piping, neglecting other critical elements such as personnel and assets [7]. This approach hinders comprehensive situational awareness. Second, at the algorithmic level, effectively fusing the complementary information from thermal and visible sensors remains a significant hurdle [8]. Thermal data reveals temperature anomalies indicative of seepage, but often lacks contextual detail, whereas visible data provides rich texture and structure but cannot detect subsurface thermal signatures. Third, these issues are compounded at the data level by a severe scarcity of annotated real-world examples for any single type of target. This data bottleneck forces many studies to rely on laboratory-simulated data [9], which may not accurately represent the complexities of real-world conditions and thus limits the generalizability and practical deployment of the developed algorithms.
Given the data-scarce nature of real-world levee failure events and the need for a universally applicable monitoring system, we argue that a supervised learning paradigm is fundamentally ill-suited for this task. Therefore, we reframe the problem as an unsupervised anomaly detection task. This design choice is driven by the core assumption that a healthy levee under threat presents a relatively homogeneous background in both thermal and visual spectra, against which hazards and critical objects manifest as salient anomalies. Consequently, we define “abnormal targets” as as any objects or regions that deviate from this established norm. The schematic diagram of the abnormal targets can be seen in Figure 1. This definition unifies critical elements that require attention, from geophysical hazards like piping zones to essential response elements like personnel and equipment. This anomaly-centric perspective is particularly advantageous. From a remote sensing standpoint, these disparate targets—though semantically different—often share common visual traits as anomalies: they are typically small, salient objects with distinct thermal or textural signatures against the background. From a machine learning standpoint, this approach elegantly bypasses the critical challenge of data scarcity, as it eliminates the need for pre-labelled examples of every possible hazard.
Building on this paradigm, we propose a novel automated framework integrating three key modules: image registration, fusion, and segmentation. Specifically, to fully leverage multi-modal information, we employ FusionGAN [10], a generative adversarial network designed for image fusion. To overcome the lack of annotated data, we adopted the mean-shift algorithm, an unsupervised method for segmentation. In addition, to enhance the robustness and automation of the segmentation process, we introduce a novel approach where Bayesian optimization (BO) [11], guided by a custom entropy-based index, is used to adaptively determine the optimal hyperparameter for mean-shift under varying conditions. Finally, we conduct experiments on the real-world dataset, collected from the Qingyuan City levee monitoring system. The comparative experiments and the ablation study demonstrate that the proposed framework can effectively monitor the levee hazards and accurately segment the corresponding regions. In summary, our contributions can be summarized as follows:
  • We are the first to frame levee monitoring as an unsupervised anomaly detection task. The definition of abnormal targets unifies diverse critical objects for comprehensive situational awareness.
  • We propose a novel, fully automated framework for levee hazard identification, which integrates UAV-based multi-modal image registration, fusion, and segmentation, demonstrating a complete automatic solution.
  • We introduce an innovative unsupervised segmentation module that couples the mean-shift algorithm with Bayesian optimization. This approach eliminates the need for manual annotation and enables adaptive segmentation across diverse scenes, significantly enhancing the framework’s practicality and scalability.
  • We validate the proposed framework on a real-world levee dataset, providing empirical evidence that the fusion of thermal and visible imagery substantially improves the identification accuracy of potential piping hazards compared to using either modality alone.
The remainder of this paper is organized as follows: Section 2 provides an overview of related work. Section 3 introduces the dataset used to verify our methods. Section 4 details the proposed framework. Section 5 presents and analyses the experimental results. Section 6 discusses the findings, and finally, Section 7 concludes the paper.

2. Related Work

2.1. Levee Safety Monitoring and Situational Awareness

2.1.1. Traditional and Geophysical Methods

Traditional approaches to monitoring levee leakage and piping rely on direct measurements of physical properties using geotechnical and geophysical techniques, such as thermal sensing [12], electromagnetic surveys [13], ground-penetrating radar [14], and radioactive tracers [15]. However, these methods often require specialized, costly equipment and sometimes involve retrofitting existing infrastructure, making their rapid deployment during critical flood seasons impractical. Similarly, manual patrols for monitoring personnel and assets are labour-intensive and provide delayed, non-continuous information. Satellite-based remote sensing has been widely adopted for large-area flood monitoring due to its extensive coverage [16]. Nevertheless, its application to specific levee hazard identification is often limited by coarse spatial resolution, low revisit frequency, susceptibility to cloud cover, and significant data latency.

2.1.2. UAV-Based Monitoring with Supervised Learning

The advent of UAVs equipped with thermal (TIR) and visible sensors has revolutionized levee monitoring due to the advantages of flexibility, portability and low operational cost. Capitalizing on this rich data, the mainstream approach has been to employ supervised learning for tasks like classification [9], object detection [7], and semantic segmentation [17].
However, despite impressive performance on private, often simulated datasets, this supervised paradigm suffers from two inherent limitations in real-world disaster scenarios. First, the data dependency is crippling. Labelled data of real levee failures is exceptionally scarce, forcing reliance on simulated data [7,17] which compromises model generalization. Furthermore, their monitoring scope is narrow. A model trained to detect ‘piping’ cannot recognize a novel hazard or an unexpected critical object, as it is confined to its predefined training classes. These fundamental bottlenecks necessitate a shift towards more flexible, data-efficient paradigms.

2.2. Unsupervised Anomaly Segmentation

As established in Section 2.1.2, supervised learning paradigms face fundamental challenges in dynamic, real-world levee monitoring. To address these limitations, we turn to unsupervised anomaly segmentation [18], a more suitable framework for this task. The core objective of unsupervised anomaly segmentation is to identify pixels that deviate significantly from the dominant, ‘normal’ patterns within an image, without relying on any predefined labels.
Approaches in this domain can be broadly categorized into three main types: dictionary-based, reconstruction-based, and clustering-based methods. Dictionary-based methods [19] attempt to construct a comprehensive dictionary representing the ‘normal’ background, with anomalies being identified as elements that cannot be well-represented by this dictionary. However, their performance can be sensitive to noise and variations within the background itself. Reconstruction-based methods, such as those using auto-encoders [20], learn a compressed representation of normal data. The underlying assumption is that the model will reconstruct normal regions with low error, while failing to accurately reconstruct unseen anomalies, thus revealing them through high reconstruction errors. However, they require a vast amount of purely normal data for training, which is often impractical in data-scarce scenarios like ours. Clustering-based methods offer a more direct approach. The core assumption here is that normal background pixels form large, dense clusters in the feature space, while anomalies manifest as small, sparse, or statistically distinct clusters. This principle aligns perfectly with the nature of our problem. Algorithms like mean-shift [21], a density-based clustering method, can identify these outlier clusters based on intrinsic data properties. However, their performance is highly sensitive to the choice of hyperparameters. Manually tuning these parameters for optimal performance across diverse and unpredictable real-world conditions is a major bottleneck. Therefore, addressing this adaptive hyperparameter tuning challenge is the critical next step toward unlocking the full potential of unsupervised methods for robust and automated levee monitoring. This is precisely the gap our proposed framework aims to fill.

2.3. Multi-Modal Fusion for Levee Anomaly Segmentation

2.3.1. The Synergy of Thermal and Visible Data

The use of UAV-based TIR imagery is a promising approach to levee monitoring, as it can reveal subsurface seepage through thermal anomalies [7]. However, relying solely on TIR data is often unreliable. Thermal signatures can be ambiguous, caused by confounders such as soil moisture or vegetation, leading to false positives [5]. In contrast, visible (RGB) imagery provides crucial contextual and textural details to disambiguate these anomalies, but cannot detect subsurface thermal patterns. Therefore, a consensus is emerging that fused information from both modalities is essential for accurate and robust levee hazard detection [8].
Early fusion attempts in this domain were often superficial. For example, some studies used RGB data merely as auxiliary information at the decision level to confirm or reject anomalies detected in thermal data [5,22]. These approaches do not achieve deep integration of multi-modal features, limiting their ability to detect complex or subtle anomalies. In contrast, deep fusion has become standard practice in other safety-critical domains such as autonomous driving [23] and medical diagnosis [24], suggesting a significant untapped potential for levee monitoring.

2.3.2. Deep Learning-Based Fusion

Infrared and visible image fusion (IVIF) aims to generate a single composite image that is more informative than that from either source. Although traditional methods based on multi-scale transforms or sparse representation exist [25,26], they often lack adaptability due to handcrafted rules. Modern IVIF is dominated by deep learning-based generative models.
Early prominent paradigms included auto-encoders (AE) and generative adversarial networks (GANs). Models like DenseFuse [27] used AE architectures, while FusionGAN [10]—the model used in our framework—leveraged an adversarial training process to produce fused images that effectively preserve thermal contrast while inheriting rich textural details. More recently, Diffusion Models [28], such as DDFM [29], have emerged as state-of-the-art techniques, demonstrating superior visual quality.
For our specific task of anomaly segmentation, the choice of fusion model is critical. While Diffusion Models excel at creating visually pleasing images, their tendency to generate fine-grained, sometimes hallucinated details can introduce noise that complicates subsequent segmentation. We selected FusionGAN because it strikes an effective balance: it robustly merges the core salient information from both modalities without producing excessive textural artifacts, creating a cleaner feature representation that is more conducive to identifying anomalous regions. The further discussion about the different fusion strategies can be found in Section 6.1.

3. Study Site and Dataset

3.1. Study Site

The study was conducted in Qingyuan City, located in Guangdong Province, China (approx. 23.45° to 25.19°N, 111.92° to 113.93°E). The region is characterized by a subtropical monsoon climate and complex, undulating terrain. The primary flood season spans from April to September, during which intense precipitation driven by monsoons and typhoons frequently leads to severe flooding events.
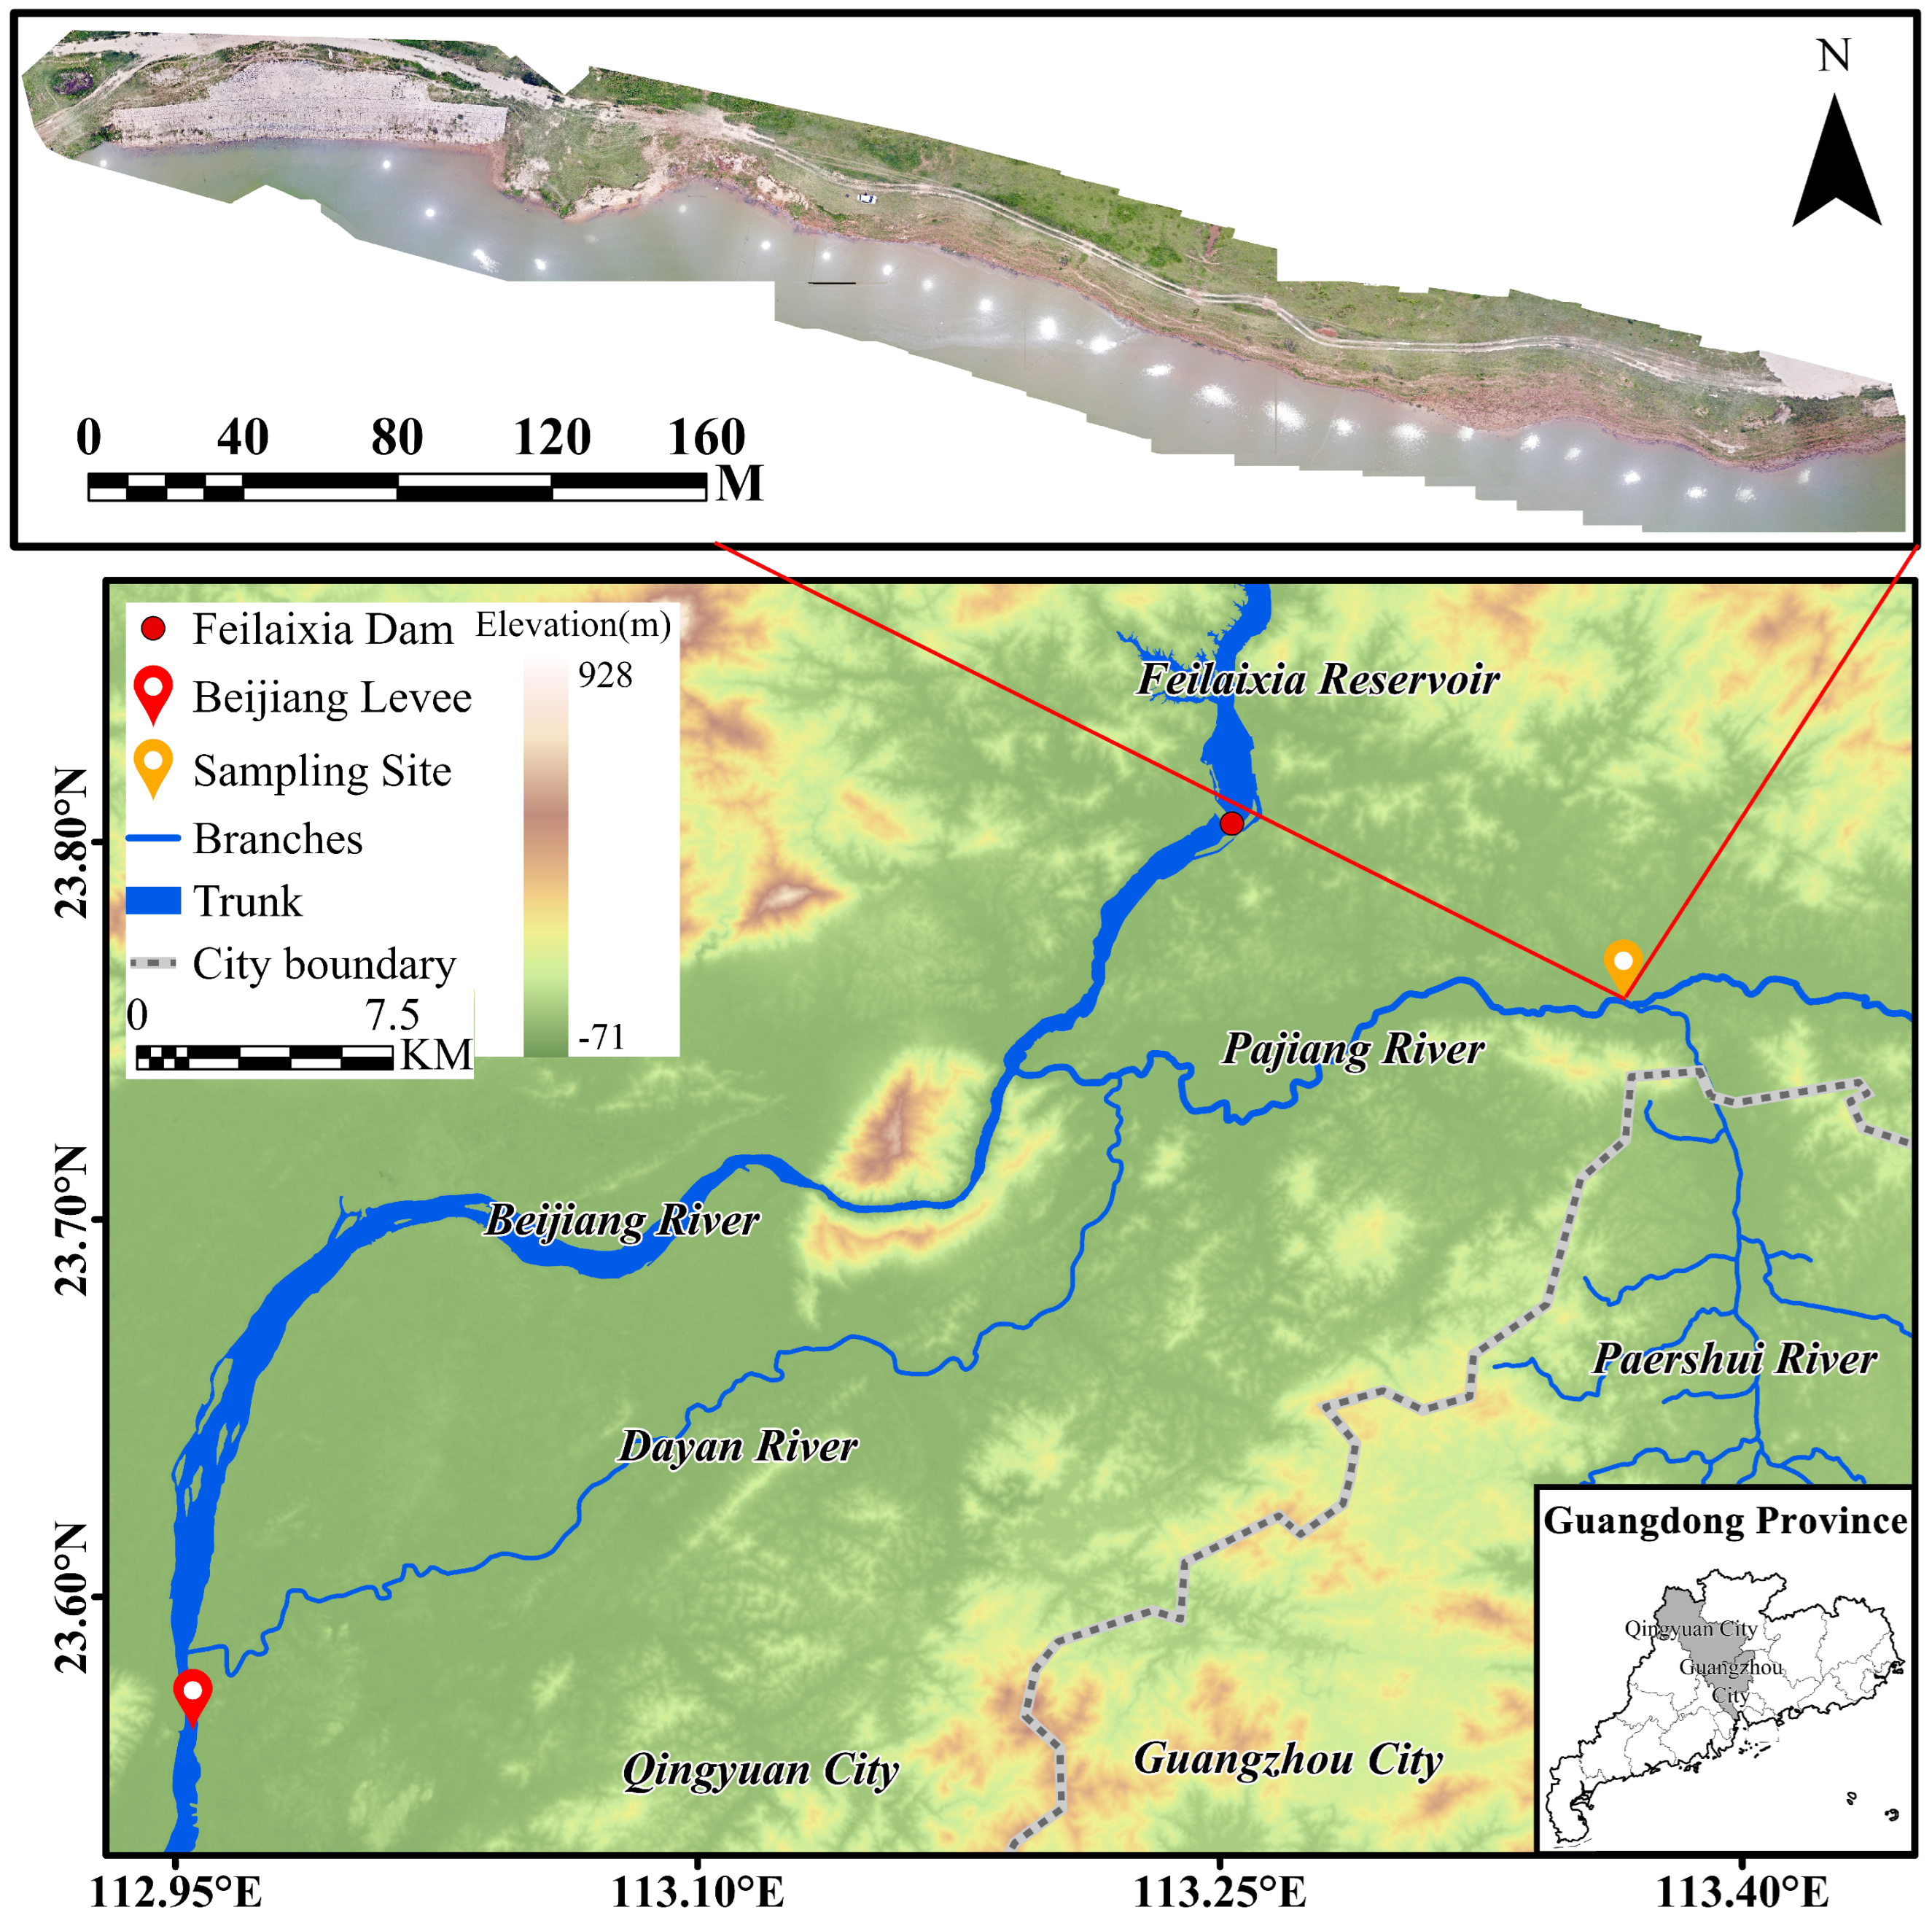
The data was collected from the levee at the confluence of the Pajiang River and the Pa’ershui River. Due to its geographical location, this area is frequently affected by floods. As shown in Figure 2, the Pajiang River is a tributary of the Beijiang River, resulting in susceptibility to the hydrological regime of Beijiang River. In detail, if a major flood occurs in the Beijiang River and the water level rises, it may cause the outlet of the Pajiang River to be uplifted, affecting its drainage capacity and exacerbating the flooding in the Pajiang River basin. Furthermore, there is a large multi-purpose water conservancy project, Feilai Gorge Reservoir, lying upstream of the outlets of Pajiang River, which means that the condition of Pajiang River is affected by the reservoir regulation.
This unique geographical configuration subjects the local levee system to immense hydraulic and public safety stress during the flood season. First, flood discharge from the upstream Feilai Gorge Reservoir, combined with the backwater effect from a swollen Beijiang River, can cause a rapid and significant rise in the Pajiang River’s water level. Second, to protect the vital downstream Beijiang Levee, the Pajiang River basin is often designated as a flood storage and detention area, further increasing the duration and intensity of the load on its levees. Therefore, the safety of the levee here not only affects both banks of the Pajiang River but may also impact the safety of the Guangzhou metropolitan area, making it a critical subject for advanced monitoring research.

3.2. Sensors and Dataset

The dataset was acquired on 20 April 2023, at approximately 12:55 local time (UTC+8), over the previously described levee section in Qingyuan. Data collection was performed using a DJI Matrice 350 RTK UAV platform equipped with a Zenmuse H20T integrated multi-sensor payload. Flight missions were planned and executed using DJI Terra software. The UAV maintained a constant relative altitude of 50 m above the levee crest, resulting in a Ground Sample Distance (GSD) of approximately 1.72 cm/pixel for the visible (RGB) images and 4.45 cm/pixel for the thermal infrared (TIR) images. The key specifications of the Zenmuse H20T’s sensors are detailed in Table 1.
Following data acquisition, a pre-processing pipeline was applied to prepare the dataset. First, due to the physical separation of the sensors on the H20T payload, a precise registration was required to align each TIR image with its corresponding visible image. This was accomplished using the RoMa algorithm [30], an advanced feature-matching method known for its robustness. Subsequently, the raw radiometric data from the TIR images were converted to a standard pseudo-colour palette using the DJI Thermal SDK to enhance visual interpretation. Then, we divided the dataset into two parts; the images in subset A contain at least one abnormal target and the others in subset B do not. There are 17 co-registered TIR–visible image pairs in subset A and 52 pairs in subset B. Finally, we labelled targets in subset A as the ground truth with an open-source annotation tool, LabelMe. After this pipeline, subset A was used exclusively for testing and evaluation in this study. A representative sample from our dataset, including source images and their corresponding ground truth masks, is provided in Figure 3.

4. Methods

4.1. Framework

The proposed framework is shown in Figure 4. Firstly, the infrared and visible images were captured by the UAV. Due to the difference in Diagonal Field of View (DFOV) between the two cameras, next step was to register the infrared and visible images using the RoMa algorithm [30]. The registration process aimed to align the infrared and visible images in a way that maximizes the similarity between them. The third step was to fuse the image pair using the FusionGAN model [10]. The fusion process aimed to generate a fused image that combines the information from both infrared and visible images. This step was crucial for combining the information from both modalities. The next step was to segment the fused images using the four widely used MS clustering algorithms. The segmentation process aims to distinguish the three types of pixel from each other, identify abnormal objects, and optimize the parameters of the clustering algorithms using the AutoML approach, ultimately achieving automatic segmentation.

4.2. Registration of Infrared and Visible Images

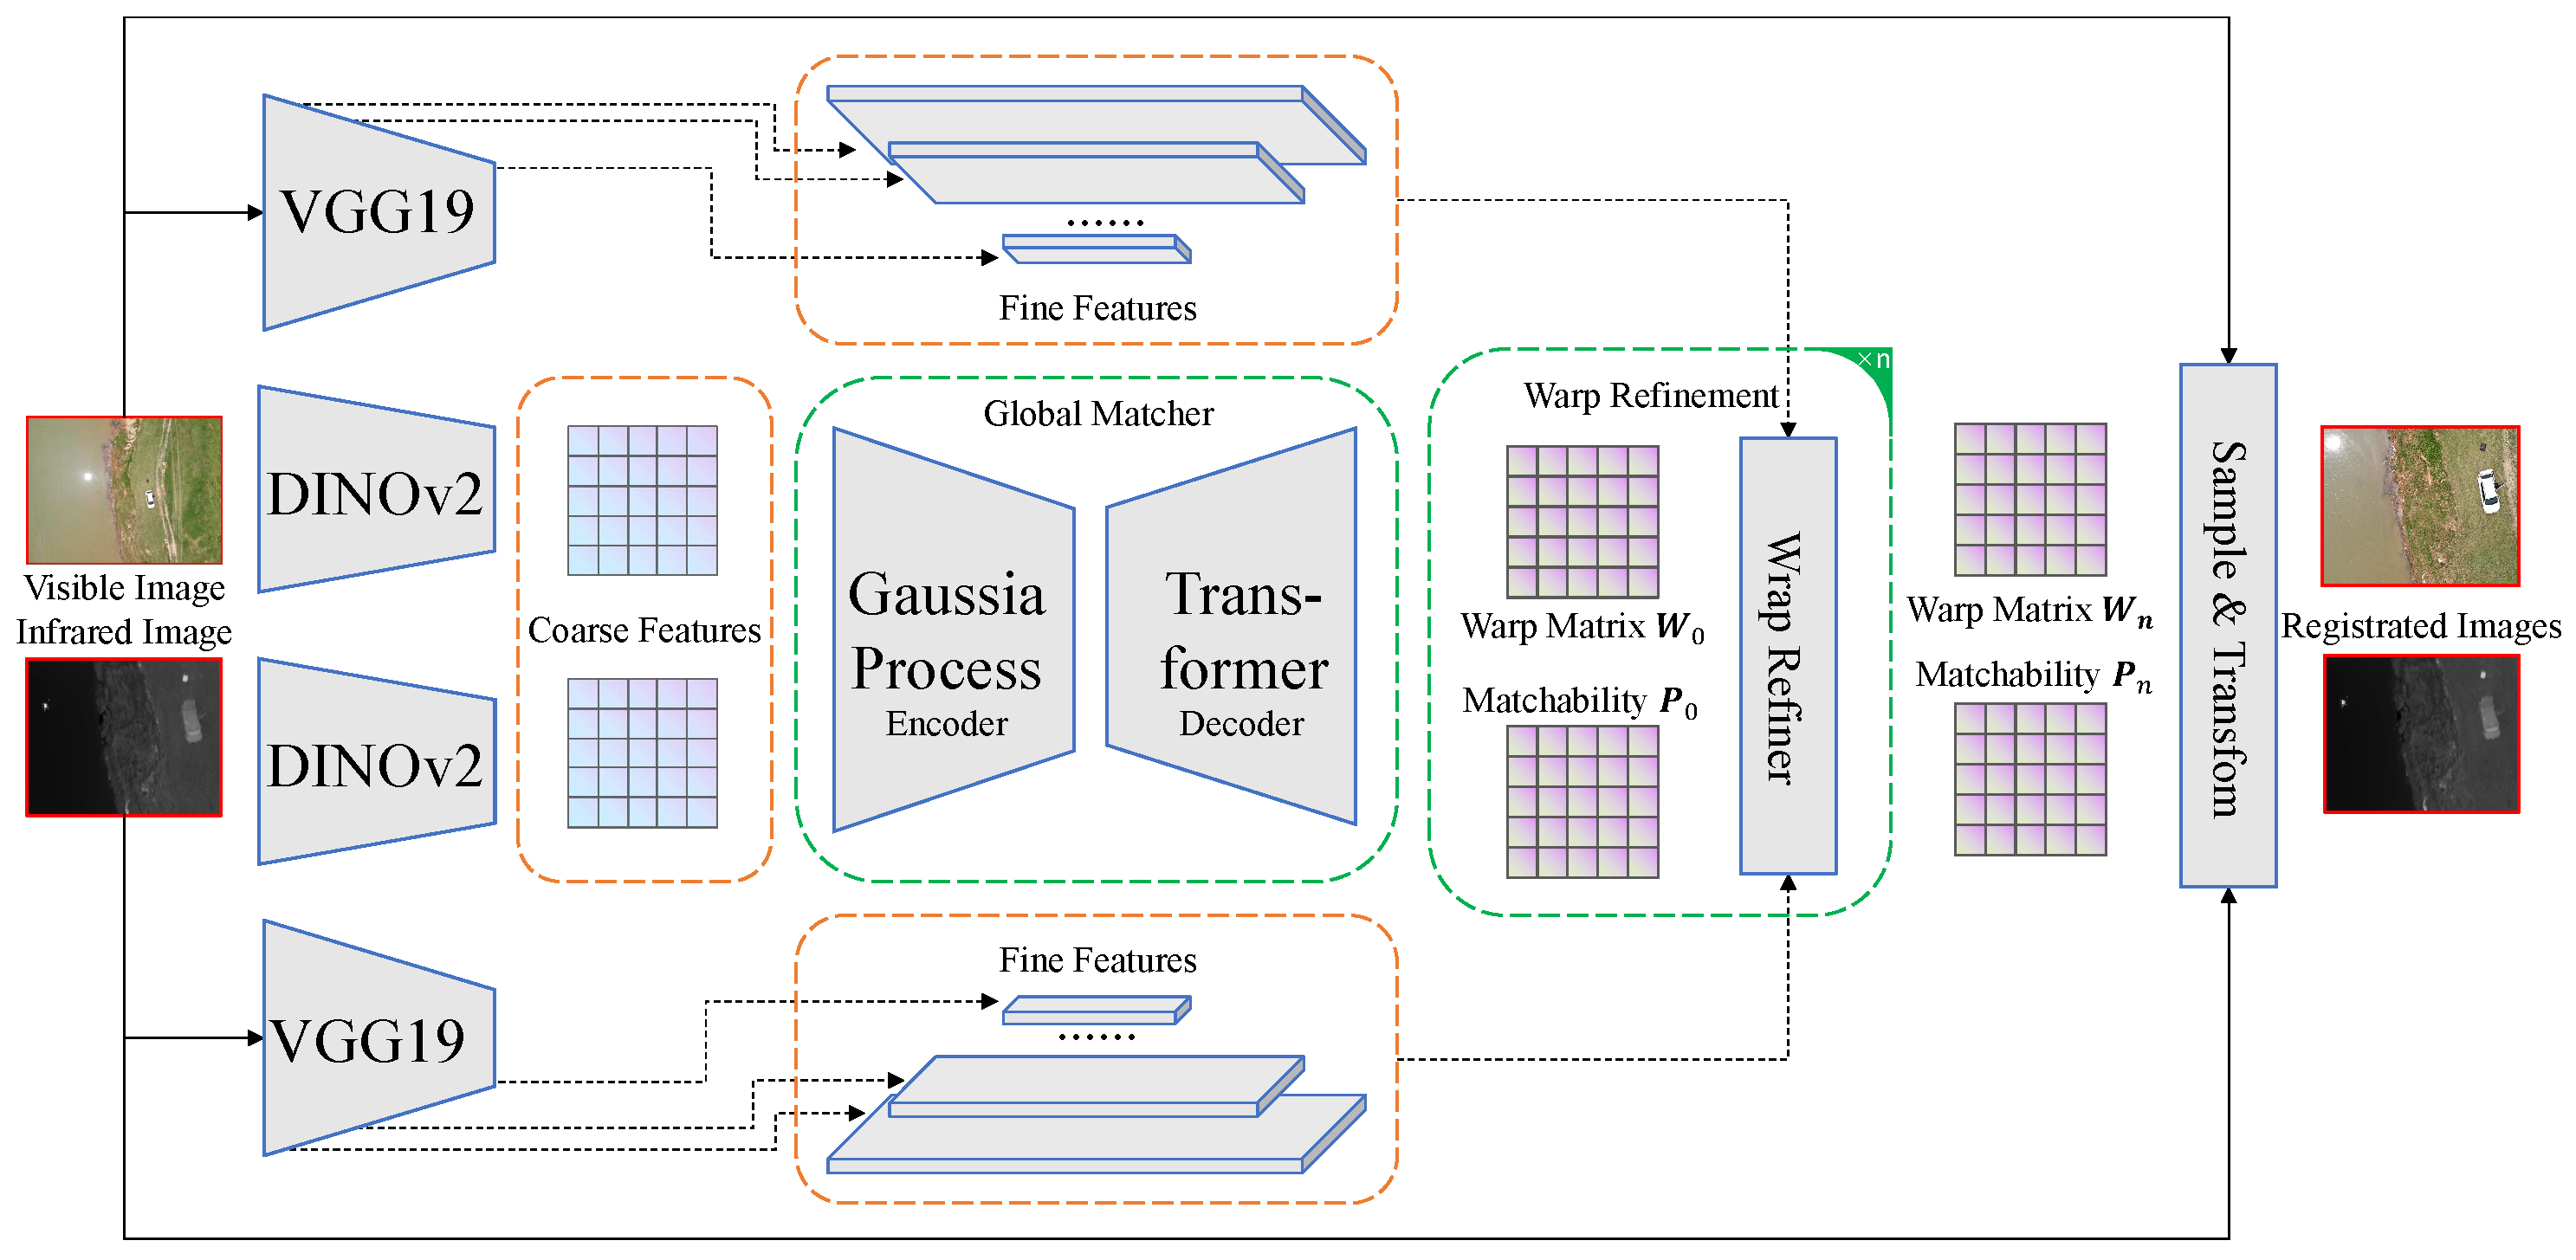
As infrared and visible images were captured by distinct cameras, they exhibited inherent incompatibility in their raw forms. Moreover, the two modalities exhibited distinct spatial resolutions, making them difficult to align directly. Consequently, image registration becomes a pivotal prerequisite for effective fusion. To address this challenge, a state-of-the-art feature matching algorithm, Robust Dense Feature Matching (RoMa) [30], was employed.
As illustrated in Figure 5, RoMa is a sophisticated feature matching algorithm that aims to align two images by maximizing their similarity. It leverages powerful, pre-trained vision models to extract robust multi-level features, enabling dense and accurate matching even across significant domain gaps like those between thermal and visible imagery. In our framework, RoMa computes a precise transformation to warp the visible image into the coordinate system of the infrared image. The resulting aligned image pair provides the essential pixel-wise correspondence necessary for the subsequent fusion module.

4.3. Fusion of Infrared and Visible Images

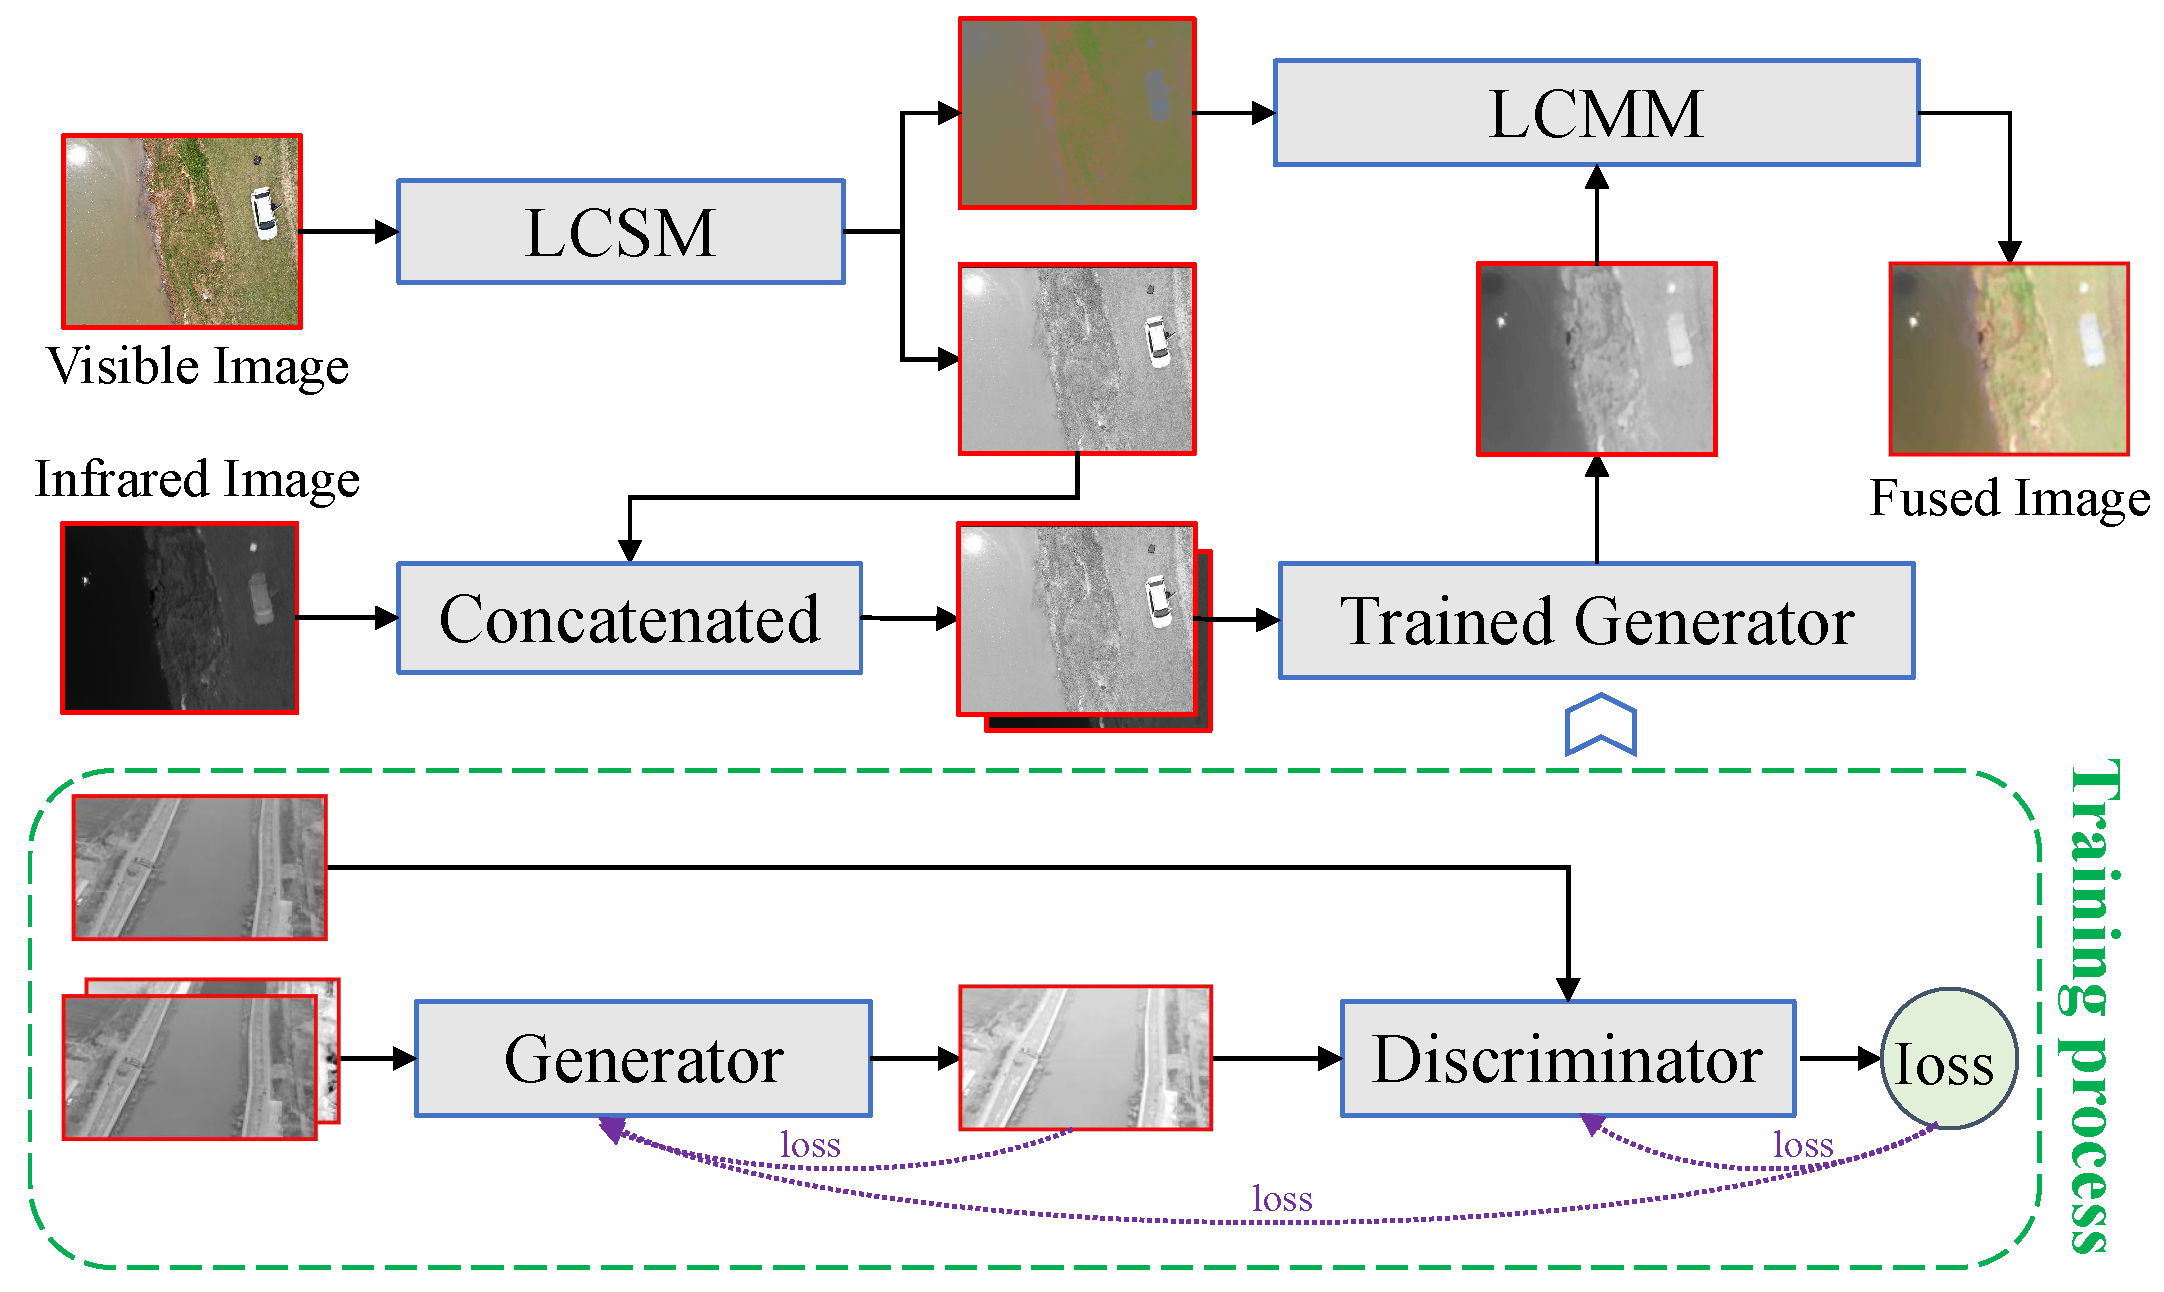
In this paper, an advanced fusion framework, FusionGAN Model (FGM) [10], was employed to approach infrared and visible image fusion. The FGM utilises a generative adversarial network to fuse infrared and visible images, which is composed of two parts: the generator and the discriminator. The generator is a convolutional neural network that aims to generate a fused image from the infrared and visible images. The discriminator is also a convolutional neural network that aims to distinguish the fused image from the visible images. The discriminator and the generator are trained simultaneously, and ultimately, the images from generator keep the thermal radiation in infrared images and the textures in visible images. The adversarial training process can be represented as follows:
min G max D V G A N ( G , D ) = E x p d a t a ( x ) [ log D ( x ) ] + E z p z ( z ) log [ 1 D G z ] ,
where G is the generator, D is the discriminator, x is the visible image, z is the latent variable, and p d a t a ( x ) and p z ( z ) are the data distribution and the prior distribution, respectively.
Considering that the original design of the FGM is not able to process the multi-channel data, we encapsulated the model in an LCSM-LCMM structure, which is shown in Figure 6. In detail, before the fusion, the visible images were firstly processed by a luminance/chrominance separation module (LCSM), which aimed to separate a visible image into the luminance component and chrominance component. Because the texture information is preserved mainly in the luminance component, we only fused the luminance component with the infrared image. The chrominance component was used to enhance the details after the fusion process with Luminance/Chrominance Merging module (LCMM). The advantage of this LCSM-LCMM structure is that it can fully preserve the texture and colour information of the visible images and the thermal information of the infrared images. Simultaneously, it can cut down the computational cost of the fusion process.

4.4. Segmentation of Fused Images

The process of segmentation of fused images can be divided into two parts: hyperparameter optimization and the fused image segmentation module. The core of the segmentation process is Mean Shift (MS) [21], a density-based clustering algorithm. The hyperparameter optimization was implemented to find the best bandwidth of the MS algorithms. The segmentation module uses the MS algorithms with the best bandwidth to segment the fused images.
The MS algorithm is a density-based algorithm which uses an iterative method to find the direction of increasing data point density. The core of this method is to find the local maximum density position of data points through kernel density estimation, thereby achieving clustering. Kernel density estimation is a method to estimate the probability density function of a random variable. The form of the kernel density estimation is as follows:
f ( s ) = 1 m i = 1 m K h ( s s i )
where s is the sample vector, s i is the ith vector, and K h ( · ) is the kernel function with bandwidth h. Generally, the kernel function is a Gaussian kernel function, defined as follows:
K h ( s s i ) = ( ( 2 π ) n | Σ j | ) 1 2 · e x p ( 1 2 ( s i μ j ) T Σ j 1 ( s i μ j ) )
where μ j is the mean vector of the jth Gaussian distribution and Σ j is the covariance matrix of the jth Gaussian distribution. Generally, smaller h results in a more fine-grained analysis of the data density, potentially identifying smaller clusters and being more sensitive to noise. Conversely, a larger h smooths the density estimate over a wider area, which can help to merge clusters and be less susceptible to outliers. Therefore, the choice of h significantly impacts the number and shape of the discovered clusters, acting as a crucial factor in the algorithm’s performance and the interpretation of its results. The whole algorithm is as follows:
  • Choose a sample point s randomly from the dataset.
  • Calculate the kernel density estimation of s and find the local maximum density position of s .
  • If the local maximum density position of s is not in the cluster, add s to the cluster.
  • If the local maximum density position of s is in the cluster, choose a new sample point s randomly from the dataset and repeat step 2.
  • Repeat step 2 and 3 until all data points are in the cluster.
It is crucial to note that the output of this clustering stage is a class-agnostic map, where pixels are assigned to different clusters based on feature similarity. The algorithm itself does not assign semantic meaning. However, these clusters are not without meaning. By its very nature, density-based clustering performs a rudimentary form of semantic labelling based on statistical properties. It inherently separates the data into (1) large, high-density clusters, which represent the ‘normal’ and dominant background patterns, and (2) small, low-density, or isolated clusters, which represent statistical anomalies. Therefore, our framework’s core function is to produce anomaly segmentation, delineating these statistically anomalous regions from the normal background. The subsequent evaluation protocol serves to empirically validate a key hypothesis of this work: that these algorithmically identified statistical anomalies correspond strongly to the semantically meaningful ‘abnormal targets’ critical for levee safety.

4.5. Hyperparameter Optimization

Clustering algorithms involve various hyperparameters—such as the number of clusters, the fuzziness parameter q, and the bandwidth h—that significantly influence their performance. To enable an automated and high-performing clustering pipeline, we employ Bayesian optimization (BO) [11] to systematically tune these hyperparameters. BO is a sample-efficient, global optimization method particularly well-suited for expensive-to-evaluate, non-convex problems. Prior work [31] has demonstrated that BO achieves superior performance with substantially fewer function evaluations compared to conventional hyperparameter tuning strategies like grid search and random search. In this work, we replace the standard Gaussian Process (GP) surrogate model with PTESampler, a probabilistic surrogate that offers improved computational efficiency while maintaining optimization effectiveness.
However, conventional objective functions for clustering hyperparameter optimization—typically based on internal evaluation metrics such as Dunn’s Index (DI) [32] and the Davies–Bouldin Index (DB) [33]—tend to favour large, globally coherent clusters and often overlook smaller yet critical anomaly clusters. To address this limitation, we propose a novel objective function composed of two components: an Entropy Index (EI) and a penalty term. The primary goal of our optimization framework is to maximize the EI, a custom metric designed specifically to assess segmentation quality in the context of anomaly detection. Unlike traditional metrics such as DB, which prioritize compactness and separation and thereby risk merging sparse, small anomaly clusters into the dominant background cluster, EI encourages the preservation of fine-grained structural diversity. Specifically, EI is derived from the entropy H of the pixel-value probability distribution of the segmented image. A segmentation that collapses the image into only a few homogeneous regions yields a low entropy H, whereas one that successfully distinguishes multiple regions produces a higher H. Thus, maximizing EI inherently promotes the identification and retention of critical small-scale clusters. The underlying principle is that a high-quality segmentation should faithfully preserve and differentiate the semantic regions present in the original image, rather than erroneously merging them. For each candidate hyperparameter configuration, we first perform clustering to generate a segmented image. We then compute the entropy H of its pixel-value distribution. A model that oversimplifies the image into very few regions results in a low H, while a model that captures multiple distinct components—e.g., background, water, and subtle anomalies—yields a higher H. Consequently, our objective function is designed to maximize H, thereby encouraging the discovery and preservation of structural diversity and preventing small targets from being subsumed by the dominant background. Mathematically, the objective function is defined as follows:
min C , L J ( C , L ) = E I ( C , L ) + β P ( C ) ,
where J ( C , L ) is the objective function, C = { c 1 , c 2 , , c M } is the cluster set, L = { l 1 , l 2 , , l N } is the label set, E I ( C , L ) is the Entropy Index, P ( L ) is the punishment term, and β , set as 0.5, is the punishment coefficient. The first term E I ( C , L ) , in the range of ( 0 , 1 ] , encourages the model to provide more information to find these critical clusters. E I ( C , L ) is defined as follows:
E I ( C , L ) = 1 1 + H S e g m e n t e d I m a g e ,
H S e g m e n t e d I m a g e = v s . t . p ( v | S ) > 0 p ( v | C L ) log p ( v | C L ) ,
p ( v | C L ) = k = 1 N I ( C L k = v ) N .
where C L is the cluster centre of the label; I ( · ) is the indicator function that equals 1 if C L k = v , and 0 otherwise. The second term P ( L ) , suppresses the model from generating too many small clusters. P ( L ) is defined as follows:
P ( C ) = max 0 , M α
where α , set as 6, is the threshold that controls the maximum number of clusters, and M is the number of clusters.

4.6. Evaluation

To quantitatively assess the performance of our unsupervised framework against the semantically labelled ground truth, a unified evaluation protocol was established. For our method, each cluster produced by the algorithm is treated as a distinct candidate anomaly region. Similarly, for SOTA baselines that output an anomaly score map, each connected component above a certain threshold is treated as a candidate region. These candidate regions are then matched against the ground truth instances using a greedy matching algorithm based on the Intersection over Union (IoU) metric. This protocol allows for a fair comparison of all methods on their core ability to localize and delineate abnormal targets, independent of their underlying mechanism. The greedy algorithm is as follows:
  • Instance Extraction: First, unique instance IDs are extracted from both the ground truth (GT) and predicted (Pred) segmentation masks. Let G = { g 1 , g 2 , , g m } represent the set of ground truth instances and Q = { q 1 , q 2 , , q n } denote the set of predicted instances, where m and n are the number of instances in GT and Pred respectively.
  • IoU Matrix Construction: For each pair of ground truth instance g i G and predicted instance q j Q , we calculate their IoUs:
    IoU ( g i , q j ) = | g i q j | | g i q j |
    where | g i q j | is the number of overlapping pixels and | g i q j | is the total number of pixels in either instance. These scores are stored in an m × n IoU matrix M , where M i j = IoU ( g i , q j ) .
  • Greedy Matching: The algorithm processes each predicted instance q j in turn:
    • For q j , find the ground truth instance g i with the maximum IoU score in column j of matrix M .
    • If IoU ( g i , q j ) θ , where θ is a predefined threshold, establish a match between q j and g i .
    • Once matched, g i is removed from consideration for other predicted instances to ensure one-to-one matching.
I o U and F 1 - S c o r e are widely used to evaluate the performance of abnormal segmentation. It indicates the similarity between a predicted abnormal map and the ground truth. The definition of I o U is shown in Equation (9). The F 1 - S c o r e can be defined as follows:
F 1 = 2 I o U 1 + I o U

5. Results

5.1. Model Training

To complete the proposed framework, the training of the FGM and RoMa models was conducted. For the RoMa model, we used pre-trained weights provided by the authors. Regarding FGM, we trained on a dataset that was randomly sampled from M3FD [34], RoadSense [35] and DUT-VTUAV [36]. The training set contains 1400 images in total, in which infrared and visible images constitute half. To be specific, DUT-VTUAV is a dataset (excluding videos) with visible and infrared dual-model images in aerial view. We randomly sampled 100 RGB–thermal image pairs each from the P47, P125, P126, P129, and P169 series, including coastal beaches, riverbank embankments, and recreational lawns as three typical scenarios, to simulate dyke rescue scenarios. RoadSense is a main dataset for visible and infrared image fusion. We randomly sampled 100 RGB–thermal image pairs from RoadSense to ensure the general ability of image fusion. M3FD encompasses a variety of complex scenarios, including low light and adverse weather conditions. We randomly sampled 100 pairs of RGB-thermal images to improve adaptability in complex scenarios. Due to the different resolutions of the three datasets, we merged them into 640 × 512 resolution. The test set was kept the same as the dataset in Section 3.
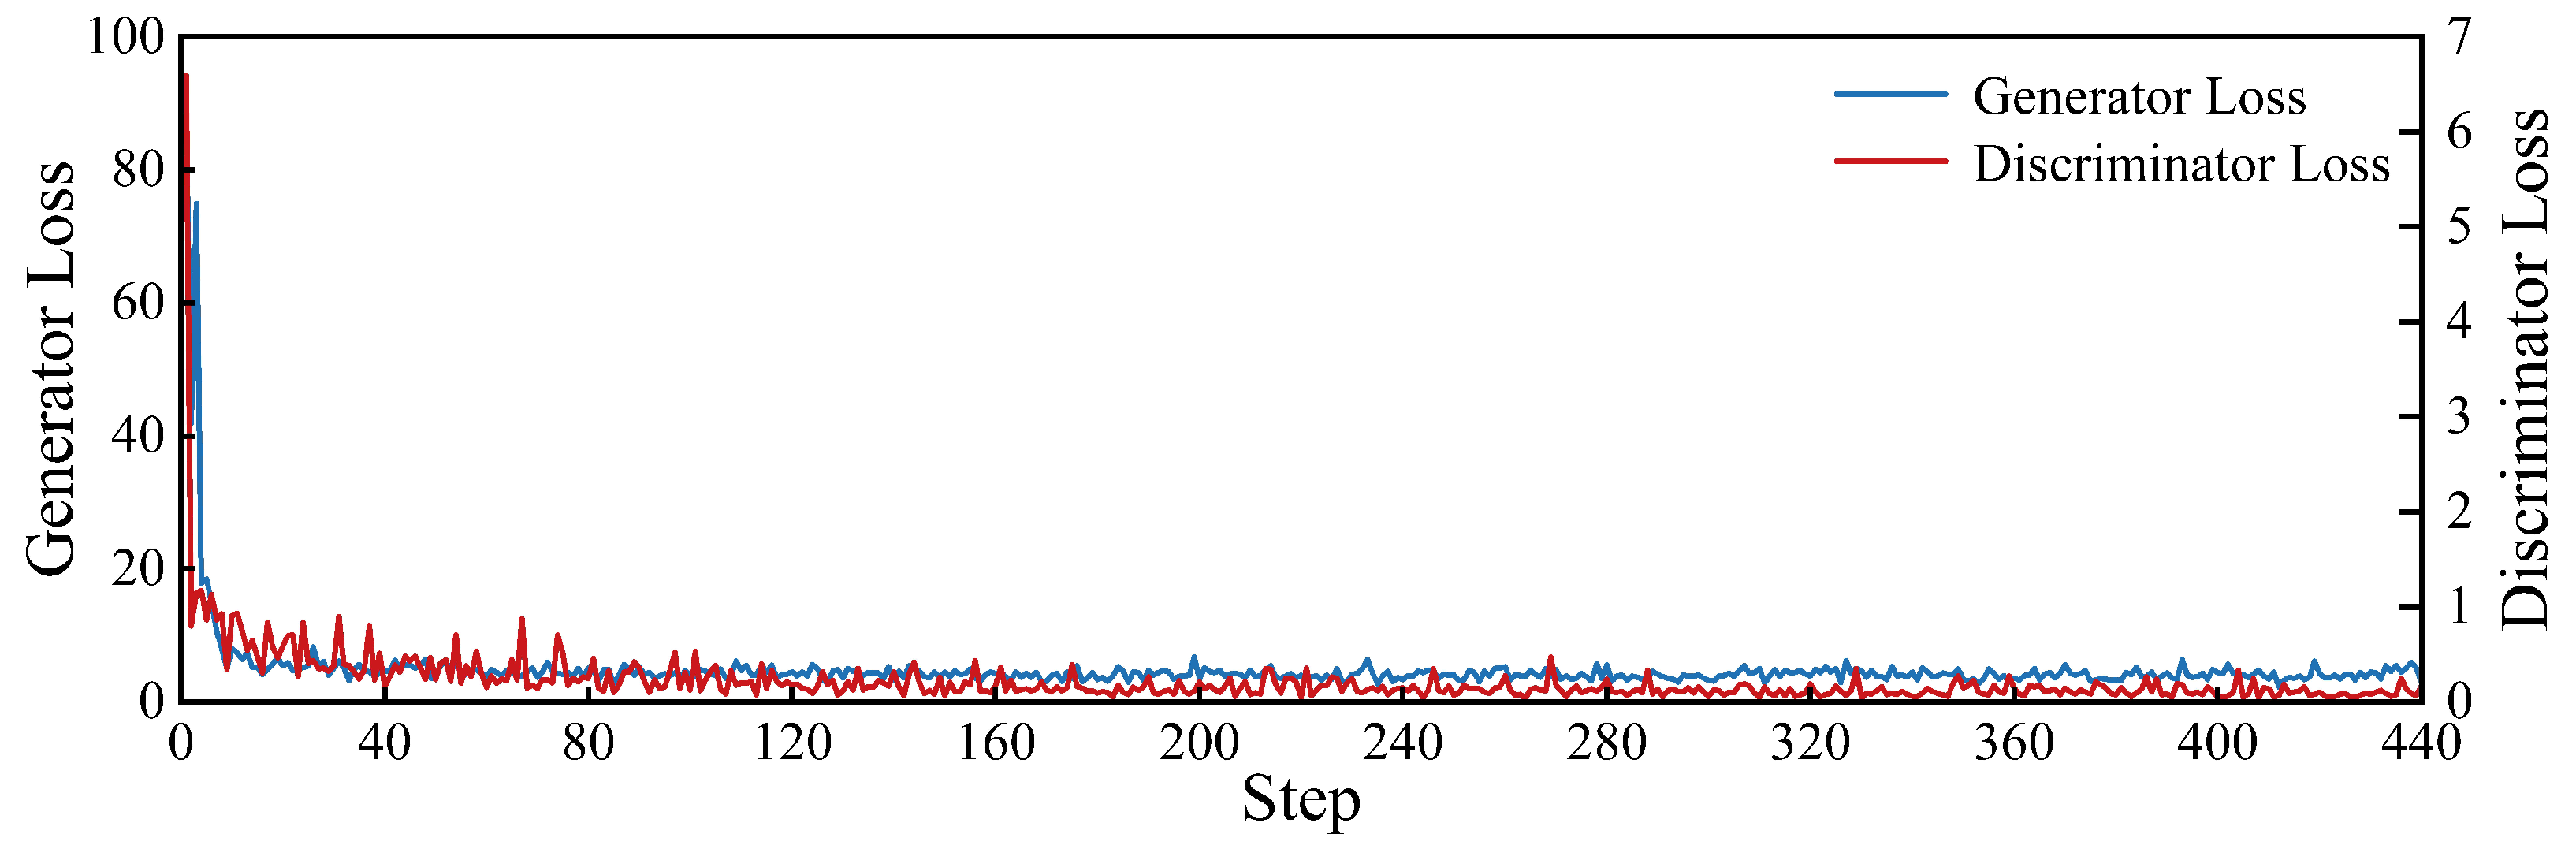
The training was conducted in the environment of Python 3.9, Pytorch 12.4 and CUDA 12.6. The hardware platform consisted of an NVIDIA GeForce RTX 4060 Laptop GPU (8 GB VRAM) (Santa Clara, CA, USA) with an AMD Ryzen 9 7940HX CPU with Radeon Graphics (Santa Clara, CA, USA). With a 1 × 10 4 learning rate and 8 images per batch, the FGM model was trained for 5 epochs and achieved generator loss of 2.19 and discriminator loss of 0.04. The training process is shown in Figure 7.

5.2. Comparative Experiments

In order to demonstrate the superiority of our framework, we conducted a series of comparative experiments. The results unequivocally demonstrate the superiority of our approach, particularly highlighting the benefits of multi-modal fusion and our novel optimization strategy. The comparative experiments can be divided into two parts: the comparison with external SOTA baselines (EB) and internal baselines (IB). The comparison with EB aims to determine performance against the state-of-the-art method in unsupervised anomaly detection. We chose Auto-AD [20] as our baseline, an advanced unsupervised online autonomous abnormality detection method which is based on background reconstruction and an adaptive weighted loss function that can suppress anomaly reconstruction. The impressive performance on the WHU-Hi-Park, WHU-Hi-Station [37] and HYDICE datasets makes Auto-AD a formidable baseline. Considering that Auto-AD lacks multi-modal capability, we tested three forms of data: visible images, infrared images and fused images. Their experimental results can be found in E 2-5, E 2-6 and E 2-6 respectively. As for the IB, we replace different modules in the algorithm to demonstrate our choices. Details are as follows:
  • Segmentation Module (SM): We displaced the mean-shift algorithm with K-means [38] and a Gaussian Mixture Model [39]. In the optimisation module, considering the hyperparameter must be an integer, we calculated the corresponding results and their EI for each value between 1 and 6, and then selected the minimum EI and its corresponding result as the final result. Detailed experimental results can be found in E 2-1 and E 2-2 respectively.
  • Fusion Module (FM): We compare the FGM with DDFM [29]. DDFM is one of the best fusion algorithms. The rest remains unchanged. Detailed experimental results can be found in E 2-3.
  • Optimisation Module (OM): We compare the proposed EI with DB [33]. This experiment is set to demonstrate that the proposed EI is better than other traditional clustering indexes. Detailed experimental results can be found in E 2-4.
Figure 8 provides a comprehensive qualitative comparison of our framework against various internal and external baselines across three distinct scenarios. Image A requires the capture of weak thermal signals in complex backgrounds. Traditional clustering algorithms cannot distinguish the piping signals from the background. SOTA methods, such as Auto-AD, mistake noise for signals. Image B highlights a scenario with multiple distinct objects. Traditional clustering algorithms trend towards false alarms, while Auto-AD trend towards missed alarms. Only our method provides an accurate warning. Image C provides an abnormal event on a water body. It can be seen that our model also achieves a relatively precise prediction.
The quantitative results in Table 2 clearly show that our full framework E 0-0 outperforms all baseline methods across most metrics. Specifically, our method significantly outperforms Auto-AD on all data modalities (E 2-5, E 2-6, E 2-7 vs. E 0-0), proving that a purpose-built fusion and segmentation pipeline is more effective than applying a general-purpose anomaly detector. Furthermore, ablating any part of our framework, such as using K-Means instead of Mean-Shift E 2-2, or DDFM instead of E 2-3, leads to a performance drop. This validates the soundness of each individual module choice within our integrated pipeline. In addition, it is noteworthy that our model’s recall is significantly higher than its precision, indicating a strategy that favours comprehensive coverage of potential anomalies, which is often desirable in safety-critical inspection scenarios.
In conclusion, the comparative experiments demonstrate the outstanding performance of our model.

5.3. Ablation Studies

We conducted three ablation experiments to confirm the soundness of our modules. The details are as follows:
  • Fusion Module (FM): In order to verify the fusion module, we removed the fusion process and segmented the visible and infrared images. The results are shown in E 3-1 and E 3-2.
  • LCSM-LCMM Module (LM): As the FGM can only process single-channel images, we conduct the fusion based on the greyscale visible images and infrared images. The rest remains unchanged and the results are shown in E 3-3.
  • Optimisation Module (OM): We replace the BO with an empirical and adaptable method to obtain the hyperparameters of the MS algorithm, the results of which can be found in E 3-4. The baseline is shown as follows:
    • First, sample 100 pixels from the image. Record them as set S .
    • Next, calculate the distance in RGB space between any two different points in sample set S . Record them as set L .
    • Finally, calculate the q-quantile of the distance set L , where q = 0.2 . Record it as b w . Then, the bandwidth, a hyperparameter of the MS algorithm, is set as b w .
As seen in Table 3, our model defeats others in the control group on most indicators, which further demonstrates the effectiveness and rationality of our approach.

5.4. Computational Efficiency Analysis

In a real-world emergency scenario, the inference speed of the model is paramount. In order to analyse the computational efficiency, we record the running time of these models when they process an image. As shown in Table 4, under the conditions we have set, our algorithm is superior to Auto-AD. In our model, the biggest bottleneck of computation efficiency is the BO process. If we deactivate the optimization, the registration module becomes the main obstacle to improving inference speed. One possible reason is that the registration process involves the processing of multiple resolution images, while the subsequent process is based on the lowest resolution image. It should be noted that the processing speed of the algorithm for each image is affected by the dataset itself, and the data in Table 4 only represents the speed in our dataset.

6. Discussion

6.1. Discussion on Fusion Module

By comparing the result in Table 2 and Table 3, we found the impact of different fusion strategies. Firstly, as shown in E 3-1 and E 3-2 versus E 0-0, a fusion process is necessary for the whole framework. Without thermal information, the segmentation algorithm cannot discern the underlying features between different things, such as the green water and tussocks in Images A, B and C. Without visible information, the segmentation algorithm is frequently confused by similar thermal radiation. For instance, it cannot distinguish the beach umbrella from the tussocks in Image B. Combining dual-model information, a model can make abnormal targets more distinguishable. In addition, different fusion strategies can provide different results. Our experimental results reveal that the optimal image fusion strategy for downstream segmentation is not necessarily the one that scores highest on general image fusion metrics. This is evidenced by the stark contrast between the performance of DDFM [29] and FGAN [10] in our pipeline. Quantitatively, DDFM outperforms FGAN on a suite of standard fusion metrics, as detailed in Table 5. It achieves higher SF and SSIM, indicating its superior ability to generate visually appealing and texturally rich images. However, this advantage does not translate to superior segmentation performance. As shown in Table 2, our framework using FGAN achieves an IoU of 0.378, significantly higher than the DDFM-based variant. The qualitative results in Figure 8 reveal that DDFM’s tendency to generate excessive textural details and high-frequency noise, while visually impressive, introduces artifacts that mislead the subsequent clustering algorithm. In contrast, FGAN produces a cleaner, more stable fusion that preserves thermal saliency without introducing distracting textures, making it more “segmentation-friendly.”
In conclusion, segmentation on a visible image or infrared image alone does not yield good results; excellent results are only achieved after image fusion operation. This demonstrates the strong complementary of the two modalities.

6.2. Discussion on Segmentation and Optimisation Module

The success of our framework hinges on the adaptive and fully automated nature of its segmentation module. The comparison between E 2-1, E 2-2, and E 0-0 confirms that a density-based approach is inherently more suitable for anomaly detection, as it naturally isolates sparse, low-density regions from dense backgrounds. More significantly, the integration of BO with our EI is a key innovation. It solves a fundamental practical problem: the manual tuning of the bandwidth hyperparameter, h, for MS across diverse scenes. As evidenced by the results of E 3-4 and E 2-4, traditional approaches fail. The DB index, designed to find compact and well-separated clusters, invariably favours merging small anomaly clusters into the background, leading to severe under-segmentation. Our EI, by maximizing the informational content of the segmented image, effectively guides the BO to find a bandwidth value that preserves these critical small clusters. This automated process ensures robust performance across varying conditions without any manual intervention, which is a crucial step towards practical deployment in real-world levee monitoring scenarios.

6.3. Discussion on Synergistic Effects of the Proposed Framework

The framework’s high performance is not attributable to any single component, but rather to the synergistic interplay of its three modules. RoMa provides the foundational pixel-level alignment, without which fusion would be meaningless. The fusion module then acts as a feature enhancer, transforming the registered multi-modal data into a new representation where anomalies are maximally salient. Finally, the adaptive segmentation module acts as an intelligent interpreter, robustly and automatically extracting these enhanced features. The entire pipeline forms a logical chain from data preparation to feature enhancement and finally to intelligent decision-making, where each link is indispensable for the final outcome.

6.4. Limitations and Future Work

While the proposed strategy demonstrates significant promise, several limitations and challenges warrant further attention. For example, since our data was obtained from one site, it still faces the challenge of insufficient diversity due to the relatively uniform scenarios, such as extreme weather conditions or with heavily occluded targets. Although the proposed method has achieved superior performance compared to the SOTA algorithm in effectiveness and efficiency, it still needs to be improved to meet the needs of levee monitoring.
In the next stage, more field data from different locations with more diversity can be collected to further improve the performance of the proposed model. Furthermore, few-shot segmentation [42] and zero-shot segmentation [43] can be introduced to improve the performance of the model. In addition, advanced end-to-end trainable networks that jointly optimize fusion and segmentation are another avenue worth exploring. In addition, the development history of other research fields shows that an open-source, well annotated large-scale dataset can promote the advancement of disaster early warning. In the future, we sincerely hope to promote the production and disclosure of mature datasets in this field.

7. Conclusions

In this paper, we addressed the critical challenge of levee safety monitoring by proposing a novel, fully automated, and unsupervised framework for abnormal target segmentation. Our approach successfully integrates UAV-based infrared and visible imagery through a synergistic pipeline of robust registration, effective fusion, and adaptive segmentation. By re-framing the problem as an unsupervised anomaly detection task, our framework overcomes the key limitations of data scarcity and poor generalization inherent in traditional supervised methods.
Experimental results on a real-world dataset validate the superiority of our approach. The proposed framework achieved a mean I o U of 0.378 and an F 1 - S c o r e of 0.479 for abnormal targets, significantly outperforming both traditional clustering methods and a state-of-the-art anomaly detection baseline. Our analysis confirms that the multi-modal fusion module is indispensable for enhancing anomaly signatures, while the Bayesian-optimized, entropy-guided segmentation module provides the necessary robustness and adaptability for diverse real-world scenes. The framework demonstrates practical viability, processing an image pair in under 80 s in inference mode.
In conclusion, this study demonstrates that the intelligent fusion of multi-modal data, coupled with an adaptive unsupervised learning strategy, offers a powerful and practical solution for automated levee hazard assessment. This work not only provides a valuable tool for current monitoring efforts but also lays the groundwork for future advancements in data-efficient systems for disaster risk reduction.

Author Contributions

Conceptualization, J.Z. and Z.W.; methodology, J.Z. and L.G.; software, J.Z.; validation, J.Z., Z.W. and L.G.; formal analysis, J.Z.; investigation, Z.W. and L.G.; resources, Z.W. and L.G.; data curation, J.Z. and J.C.; writing—original draft preparation, J.Z. and L.G.; writing—review and editing, J.Z., Z.W. and L.G.; visualization, J.C. and F.W.; supervision, Z.W.; project administration, Z.W. and L.G.; funding acquisition, F.W. All authors have read and agreed to the published version of the manuscript.

Funding

This research was funded by research grants from the National Institute of Natural Hazards, Ministry of Emergency Management of China (Grant Number: ZDJ2024-17) and the S&T Innovation and Development Project of the Information Institution of the Ministry of Emergency Management (Project No. 2024506).

Data Availability Statement

The data used in this paper belong to the National Institute of Natural Hazards, Ministry of Emergency Management, People’s Republic of China, and can be made available upon request to the corresponding author.

Conflicts of Interest

The authors declare that they have no known competing financial interests or personal relationships that could have appeared to influence the work reported in this paper.

Abbreviations

The following abbreviations are used in this manuscript:
UAVUnmanned Aerial Vehicle
mIoUMean Intersection over Union
TIRThermal Infrared Remote Sensing
SURFSpeeded-Up Robust Features
DFOVDiagonal Field of View
RoMaRobust Dense Feature Matching
MSMean-Shift
FGMFusionGAN Model
BOBayesian Optimization
GPGaussian Process
LCSMluminance/chrominance separation module
LCMMLuminance/Chrominance Merging Module
DIDunn’s Index
DBDavies–Bouldin Index
EIEntropy Index
GTGround Truth
PredPrediction
DDFMDenoising Diffusion image Fusion Model

References

  1. Kreibich, H.; Loon, A.F.; Schrter, K.; Ward, P.J.; Mazzoleni, M.; Sairam, N.; Abeshu, G.W.; Agafonova, S.; Aghakouchak, A.; Aksoy, H. The challenge of unprecedented floods and droughts in risk management. Nature 2022, 608, 80–86. [Google Scholar] [CrossRef]
  2. Ceccato, F.; Simonini, P. The effect of heterogeneities and small cavities on levee failures: The case study of the Panaro levee breach (Italy) on 6 December 2020. J. Flood Risk Manag. 2023, 16, e12882. [Google Scholar] [CrossRef]
  3. Vorogushyn, S.; Lindenschmidt, K.E.; Kreibich, H.; Apel, H.; Merz, B. Analysis of a detention basin impact on dike failure probabilities and flood risk for a channel-dike-floodplain system along the river Elbe, Germany. J. Hydrol. 2012, 436, 120–131. [Google Scholar] [CrossRef]
  4. Ghorbani, A.; Revil, A.; Bonelli, S.; Barde-Cabusson, S.; Girolami, L.; Nicoleau, F.; Vaudelet, P. Occurrence of sand boils landside of a river dike during flooding: A geophysical perspective. Eng. Geol. 2024, 329, 107403. [Google Scholar] [CrossRef]
  5. Li, R.; Wang, Z.; Sun, H.; Zhou, S.; Liu, Y.; Liu, J. Automatic Identification of Earth Rock Embankment Piping Hazards in Small and Medium Rivers Based on UAV Thermal Infrared and Visible Images. Remote Sens. 2023, 15, 4492. [Google Scholar] [CrossRef]
  6. Nam, J.; Chang, I.; Lim, J.S.; Song, J.; Lee, N.; Cho, H.H. Active adaptation in infrared and visible vision through multispectral thermal Lens. Int. Commun. Heat Mass Transf. 2024, 158, 107898. [Google Scholar] [CrossRef]
  7. Duan, Q.; Chen, B.; Luo, L. Rapid and Automatic UAV Detection of River Embankment Piping. Water Resour. Res. 2025, 61, e2024WR038931. [Google Scholar] [CrossRef]
  8. Su, H.; Ma, J.; Zhou, R.; Wen, Z. Detect and identify earth rock embankment leakage based on UAV visible and infrared images. Infrared Phys. Technol. 2022, 122, 104105. [Google Scholar] [CrossRef]
  9. Zhou, R.; Wen, Z.; Su, H. Automatic recognition of earth rock embankment leakage based on UAV passive infrared thermography and deep learning. ISPRS J. Photogramm. Remote Sens. 2022, 191, 85–104. [Google Scholar] [CrossRef]
  10. Ma, J.; Yu, W.; Liang, P.; Li, C.; Jiang, J. FusionGAN: A generative adversarial network for infrared and visible image fusion. Inf. Fusion 2019, 48, 11–26. [Google Scholar] [CrossRef]
  11. Falkner, S.; Klein, A.; Hutter, F. BOHB: Robust and Efficient Hyperparameter Optimization at Scale. In Proceedings of the 35th International Conference on Machine Learning, Stockholm, Sweden, 10–15 July 2018; Dy, J., Krause, A., Eds.; PMLR, Proceedings of Machine Learning Research. Volume 80, pp. 1437–1446. [Google Scholar]
  12. Bersan, S.; Koelewijn, A.R.; Simonini, P. Effectiveness of distributed temperature measurements for early detection of piping in river embankments. Hydrol. Earth Syst. Sci. 2018, 22, 1491–1508. [Google Scholar] [CrossRef]
  13. Loke, M.; Wilkinson, P.; Chambers, J.; Uhlemann, S.; Sorensen, J. Optimized arrays for 2-D resistivity survey lines with a large number of electrodes. J. Appl. Geophys. 2015, 112, 136–146. [Google Scholar] [CrossRef]
  14. Baccani, G.; Bonechi, L.; Bongi, M.; Casagli, N.; Ciaranfi, R.; Ciulli, V.; D’Alessandro, R.; Gonzi, S.; Lombardi, L.; Morelli, S.; et al. The reliability of muography applied in the detection of the animal burrows within River Levees validated by means of geophysical techniques. J. Appl. Geophys. 2021, 191, 104376. [Google Scholar] [CrossRef]
  15. Wang, T.; Chen, J.; Li, P.; Yin, Y.; Shen, C. Natural tracing for concentrated leakage detection in a rockfill dam. Eng. Geol. 2019, 249, 1–12. [Google Scholar] [CrossRef]
  16. Wieland, M.; Martinis, S.; Kiefl, R.; Gstaiger, V. Semantic segmentation of water bodies in very high-resolution satellite and aerial images. Remote Sens. Environ. 2023, 287, 113452. [Google Scholar] [CrossRef]
  17. Chen, B.; Duan, Q.; Luo, L. From manual to UAV-based inspection: Efficient detection of levee seepage hazards driven by thermal infrared image and deep learning. Int. J. Disaster Risk Reduct. 2024, 114, 104982. [Google Scholar] [CrossRef]
  18. Jha, S.B.; Babiceanu, R.F. Deep CNN-based visual defect detection: Survey of current literature. Comput. Ind. 2023, 148, 103911. [Google Scholar] [CrossRef]
  19. Fanwu, M.; Tao, G.; Di, W.; Xiangyi, X. Unsupervised surface defect detection using dictionary-based sparse representation. Eng. Appl. Artif. Intell. 2025, 143, 110020. [Google Scholar] [CrossRef]
  20. Wang, S.; Wang, X.; Zhang, L.; Zhong, Y. Auto-AD: Autonomous hyperspectral anomaly detection network based on fully convolutional autoencoder. IEEE Trans. Geosci. Remote. Sens. 2021, 60, 1–14. [Google Scholar] [CrossRef]
  21. Comaniciu, D.; Meer, P. Mean shift: A robust approach toward feature space analysis. IEEE Trans. Pattern Anal. Mach. Intell. 2002, 24, 603–619. [Google Scholar] [CrossRef]
  22. Su, S.; Yan, L.; Xie, H.; Chen, C.; Zhang, X.; Gao, L.; Zhang, R. Multi-Level Hazard Detection Using a UAV-Mounted Multi-Sensor for Levee Inspection. Drones 2024, 8, 90. [Google Scholar] [CrossRef]
  23. Tang, Y.; He, H.; Wang, Y.; Mao, Z.; Wang, H. Multi-modality 3D object detection in autonomous driving: A review. Neurocomputing 2023, 553, 126587. [Google Scholar] [CrossRef]
  24. Salvi, M.; Loh, H.W.; Seoni, S.; Barua, P.D.; García, S.; Molinari, F.; Acharya, U.R. Multi-modality approaches for medical support systems: A systematic review of the last decade. Inf. Fusion 2024, 103, 102134. [Google Scholar] [CrossRef]
  25. Tang, H.; Liu, G.; Qian, Y.; Wang, J.; Xiong, J. EgeFusion: Towards Edge Gradient Enhancement in Infrared and Visible Image Fusion With Multi-Scale Transform. IEEE Trans. Comput. Imaging 2024, 10, 385–398. [Google Scholar] [CrossRef]
  26. Li, X.; Tan, H.; Zhou, F.; Wang, G.; Li, X. Infrared and visible image fusion based on domain transform filtering and sparse representation. Infrared Phys. Technol. 2023, 131, 104701. [Google Scholar] [CrossRef]
  27. Li, H.; Wu, X.J. DenseFuse: A Fusion Approach to Infrared and Visible Images. IEEE Trans. Image Process. 2019, 28, 2614–2623. [Google Scholar] [CrossRef] [PubMed]
  28. Ho, J.; Jain, A.; Abbeel, P. Denoising diffusion probabilistic models. In Proceedings of the 34th International Conference on Neural Information Processing Systems, Red Hook, NY, USA, 6–12 December 2020. NIPS ’20. [Google Scholar]
  29. Zhao, Z.; Bai, H.; Zhu, Y.; Zhang, J.; Xu, S.; Zhang, Y.; Zhang, K.; Meng, D.; Timofte, R.; Van Gool, L. DDFM: Denoising diffusion model for multi-modality image fusion. In Proceedings of the IEEE/CVF International Conference on Computer Vision, Paris, France, 1–6 October 2023; pp. 8082–8093. [Google Scholar]
  30. Edstedt, J.; Sun, Q.; Bökman, G.; Wadenbäck, M.; Felsberg, M. RoMa: Robust Dense Feature Matching. In Proceedings of the 2024 IEEE/CVF Conference on Computer Vision and Pattern Recognition (CVPR), Seattle, WA, USA, 16–22 June 2024; pp. 19790–19800. [Google Scholar]
  31. He, X.; Zhao, K.; Chu, X. AutoML: A survey of the state-of-the-art. Knowl.-Based Syst. 2021, 212, 106622. [Google Scholar] [CrossRef]
  32. Bezdek, J.C.; Pal, N.R. Cluster Validation with Generalized Dunn’s Indices. In Proceedings of the 1995 Second New Zealand International Two-Stream Conference on Artificial Neural Networks and Expert Systems, Dunedin, New Zealand, 20–23 November 1995. [Google Scholar]
  33. Davies, D.L.; Bouldin, D.W. A Cluster Separation Measure. IEEE Trans. Pattern Anal. Mach. Intell. 1979, PAMI-1, 224–227. [Google Scholar] [CrossRef]
  34. Liu, J.; Fan, X.; Huang, Z.; Wu, G.; Liu, R.; Zhong, W.; Luo, Z. Target-aware Dual Adversarial Learning and a Multi-scenario Multi-Modality Benchmark to Fuse Infrared and Visible for Object Detection. In Proceedings of the IEEE/CVF Conference on Computer Vision and Pattern Recognition, New Orleans, LA, USA, 18–24 June 2022; pp. 5802–5811. [Google Scholar]
  35. Xu, H.; Ma, J.; Le, Z.; Jiang, J.; Guo, X. FusionDN: A Unified Densely Connected Network for Image Fusion. In Proceedings of the Thirty-Fourth AAAI Conference on Artificial Intelligence, New York, NY, USA, 7–12 February 2020. [Google Scholar]
  36. Pengyu, Z.; Zhao, J.; Wang, D.; Lu, H.; Ruan, X. Visible-Thermal UAV Tracking: A Large-Scale Benchmark and New Baseline. In Proceedings of the IEEE Conference on Computer Vision and Pattern Recognition, New Orleans, LA, USA, 18–24 June 2022. [Google Scholar]
  37. Zhong, Y.; Hu, X.; Luo, C.; Wang, X.; Zhao, J.; Zhang, L. WHU-Hi: UAV-borne hyperspectral with high spatial resolution (H2) benchmark datasets and classifier for precise crop identification based on deep convolutional neural network with CRF. Remote Sens. Environ. 2020, 250, 112012. [Google Scholar] [CrossRef]
  38. Ikotun, A.M.; Ezugwu, A.E.; Abualigah, L.; Abuhaija, B.; Heming, J. K-means clustering algorithms: A comprehensive review, variants analysis, and advances in the era of big data. Inf. Sci. 2023, 622, 178–210. [Google Scholar] [CrossRef]
  39. Rasmussen, C. The infinite Gaussian mixture model. Adv. Neural Inf. Process. Syst. 1999, 12. [Google Scholar]
  40. Ma, J.; Ma, Y.; Li, C. Infrared and visible image fusion methods and applications: A survey. Inf. Fusion 2019, 45, 153–178. [Google Scholar] [CrossRef]
  41. Liu, J.; Wu, G.; Liu, Z.; Wang, D.; Jiang, Z.; Ma, L.; Zhong, W.; Fan, X. Infrared and visible image fusion: From data compatibility to task adaption. IEEE Trans. Pattern Anal. Mach. Intell. 2024, 47, 2349–2369. [Google Scholar] [CrossRef] [PubMed]
  42. Wang, X.; Zhang, X.; Cao, Y.; Wang, W.; Shen, C.; Huang, T. SegGPT: Towards Segmenting Everything in Context. In Proceedings of the IEEE/CVF International Conference on Computer Vision (ICCV), Paris, France, 1–6 October 2023; pp. 1130–1140. [Google Scholar]
  43. Liu, S.; Zeng, Z.; Ren, T.; Li, F.; Zhang, H.; Yang, J.; Jiang, Q.; Li, C.; Yang, J.; Su, H.; et al. Grounding DINO: Marrying DINO with Grounded Pre-training for Open-Set Object Detection. In European Conference on Computer Vision, Proceedings of the Computer Vision–ECCV 2024, 18th European Conference, Milan, Italy, 29 September–4 October 2024; Leonardis, A., Ricci, E., Roth, S., Russakovsky, O., Sattler, T., Varol, G., Eds.; Springer: Cham, Switzerland, 2025; pp. 38–55. [Google Scholar]
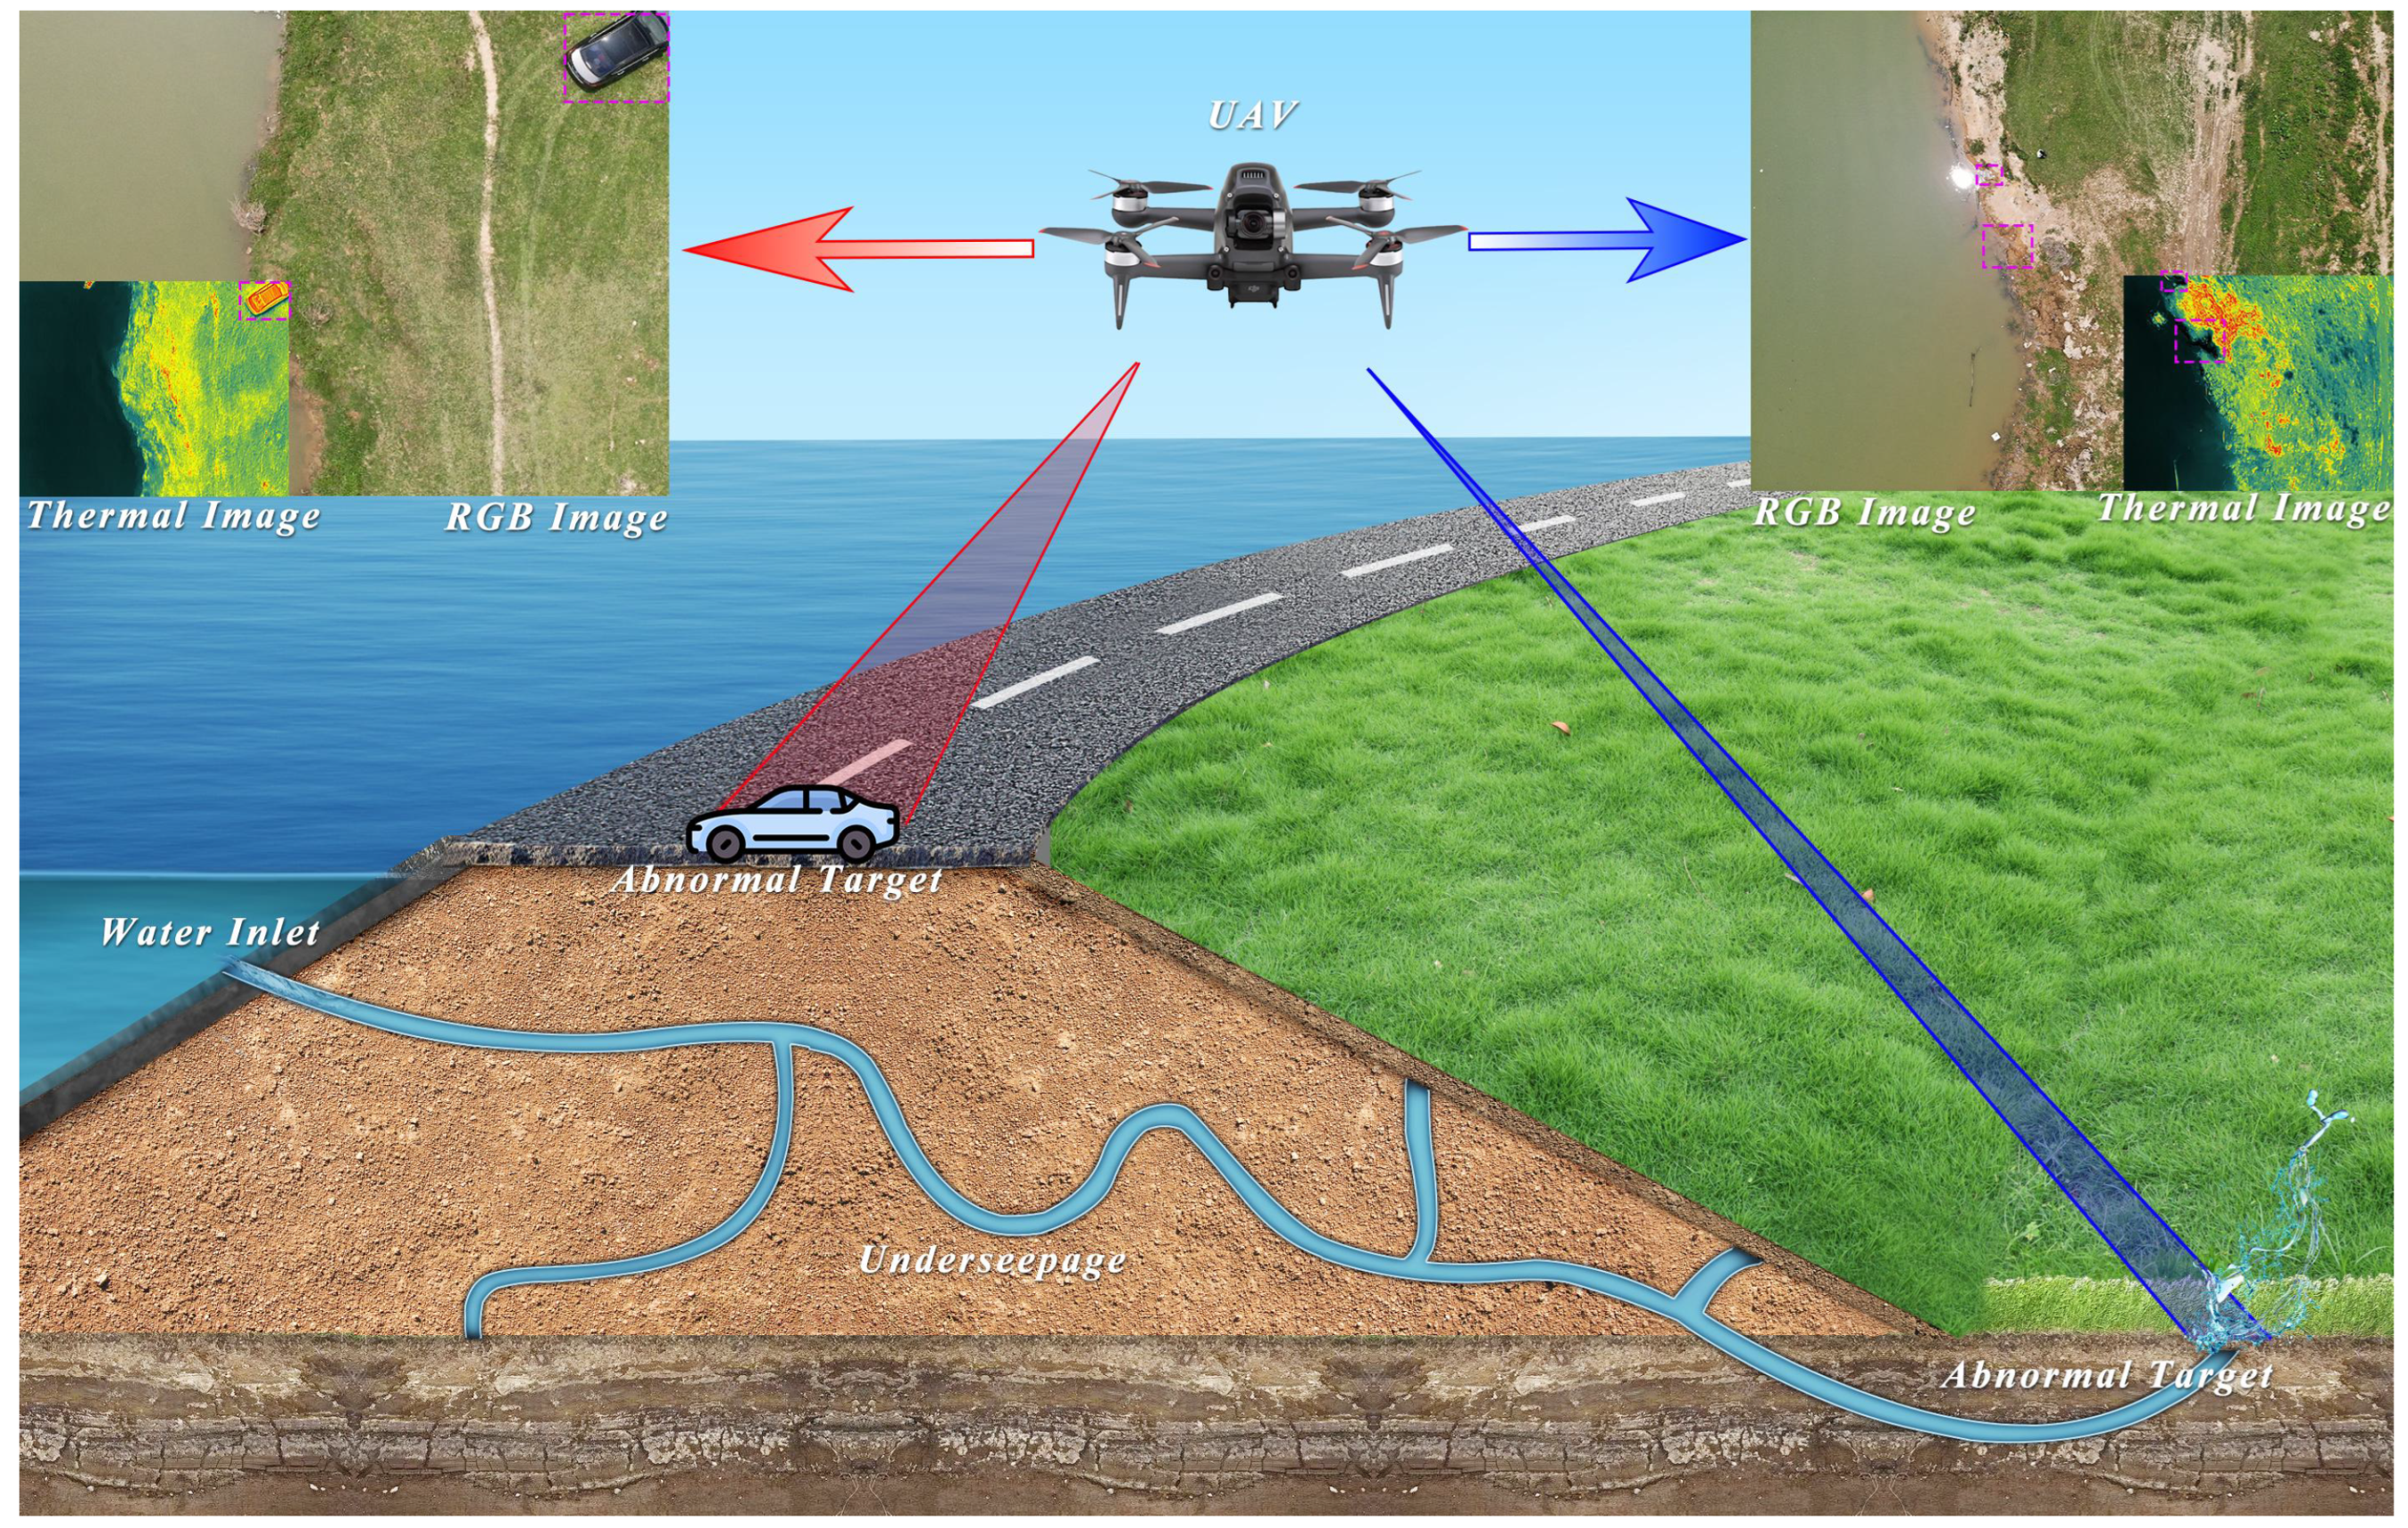
Figure 1. Conceptual framework for UAV-based identification of abnormal targets on a levee. An “abnormal target” is defined as any significant deviation from the expected state of the levee, encompassing both foreign objects and thermal anomalies caused by under-seepage. The figure demonstrates the detection of different types of abnormal targets.The insets provide real-world examples of detected targets, enclosed in purple boxes.
Remotesensing 17 03398 g001
Figure 2. Study area.
Remotesensing 17 03398 g002
Figure 3. The process of making the dataset.
Remotesensing 17 03398 g003
Figure 4. The proposed framework.
Remotesensing 17 03398 g004
Figure 5. An overview of the RoMa framework, adapted from [30].
Remotesensing 17 03398 g005
Figure 6. The framework of FGM.
Remotesensing 17 03398 g006
Figure 7. Training process of FGM.
Remotesensing 17 03398 g007
Figure 8. Three cases in the comparative experiment. “GMM” means segmenting images with Gaussian Mixture Model (E 2-1). “KM” means segmenting images with k-means algorithm (E 2-2). “DDFM” means fusing the visible and infrared images with DDFM (E 2-3). “MS+DB” means optimising the hyperparameter based on DB index (E 2-4). “AA+vi” means that we process the RGB images with Auto-AD (E 2-5). “AA+ir” means that we process the thermal images with Auto-AD (E 2-6). “AA+Fu” means that we process the fused images with Auto-AD (E 2-7). “Ground Truth” is the true label that was marked manually to work as a benchmark of evaluation. “D Fused” means the image is generated by DDFM. “G Fused” means the image is generated by FGM.
Remotesensing 17 03398 g008
Table 1. Camera characteristics.
SensorsParametersSpecifications
RGB CameraSpecifications of Sensor1/2.3″ CMOS
Effective Pixels of Sensor12 million
DFOV 1 of Lens82.9°
Focal Length of Lens4.5 mm (Equivalent: 24 mm)
Aperture of Lensf/2.8
Focus Distance1 m to infinity
Exposure ModeProgram Auto Exposure
Exposure Compensation±3.0 (in 1/3-step increments)
Metering ModeSpot Metering, Center-Weighted Metering
Shutter Speed1-1/8000
ISO Range100 to 25,600
Thermal CameraTypeUncooled Vanadium Oxide (VOx) Microbolometer
DFOV of Lens40.6°
Focal Length of Lens13.5 mm (Equivalent: 58 mm)
Aperture of Lensf/1.0
Focus Distance of Lens5 m to infinity
Photo Resolution640 × 512
Pixel Pitch12 μm
Spectral Range8–14 μm
NETD 2≤50 mK @ f/1.0
Temperature Measurement ModesPoint Measurement, Area Measurement
Temperature Range−40 °C to 150 °C (High Gain Mode),
−40 °C to 550 °C (Low Gain Mode)
1: Diagonal Field of View; 2: noise equivalent temperature difference.
Table 2. The quantitative results of comparative experiments. The bold and red fonts represent the best result in the experiment. SM represents the experiment aimed at the segmentation module. FM represents the experiment aimed at the fusion module. OM represents the experiment aimed at the optimisation module.
IDExperimentsEB or IBEvaluation Metrics of Abnormal Targets
PrecisionRecallF1-ScoreIoU
E 2-1(SM) GMMIB0.2540.5650.3150.231
E 2-2(SM) KMIB0.2970.3320.3050.253
E 2-3(FM) DDFMIB0.1620.5200.2190.148
E 2-4(OM) MS+DBIB0.0540.0470.0500.043
E 2-5Auto-AD+RGBEB0.3440.2600.2350.157
E 2-6Auto-AD+ThermalEB0.3380.1640.1860.129
E 2-7Auto-AD+FusedEB0.3490.2560.2350.158
E 0-0ours0.4890.6050.4790.378
Table 3. The quantitative results of ablation experiments. The bold and red fonts represent the best result in the experiment. SM represents the experiment aimed at the segmentation module. FM represents the experiment aimed at the fusion module. OM represents the experiment aimed at the optimisation module.
IDExperimentsEvaluation Metrics of Abnormal Targets
PrecisionRecallF1-ScoreIoU
E 3-1(FM) Only ir0.2900.4280.3190.244
E 3-2(FM) Only vi0.1660.5160.2070.144
E 3-3(LM) Greyscale0.2180.3260.2520.188
E 3-4(OM) Without BO0.3470.4310.3670.300
E 0-0ours0.4890.6050.4790.378
Table 4. The quantitative results of efficiency analysis.
IDModelModuleProcessing Time per Image (Seconds)
E 4-1-RoMa Registration10.439
E 4-2-FGM Fusion0.093
E 4-3-KM Abnormal Segmentation1.012
E 4-4-GMM Abnormal Segmentation21.555
E 4-5-MS Abnormal Segmentation (without optimization)1.703
E 4-6-MS Abnormal Segmentation ( n 1 iterations of optimization) 2.320 × n 1
E 0-0oursTotal ( 30 1 iterations of optimization)80.232
E 4-7Auto-AD-119.202
1: The number of iterations depends on the time budget and the expectation of the accuracy, but we recommend n > 20 based on our experience. In this research, n = 30 .
Table 5. Evaluation of fusion models. EN represents the entropy of fused images, reflecting the amount of information. SF represents the richness of the edges and textures. MI and PSNR represent the maintenances and loss of information that is transferred from source images to the fused image. VIF evaluates the fidelity of the fused image relative to the human visual system. SSIM represents the structure loss and distortion of images. The algorithm of these indicators comes from [40,41].
ModelEN ↑ SF ↑MI ↑PSNR ↑VIF ↑SSIM ↑
FGAN7.0242.4770.98010.0740.4040.553
DDFM6.52018.5051.51613.8381.2201.397
Disclaimer/Publisher’s Note: The statements, opinions and data contained in all publications are solely those of the individual author(s) and contributor(s) and not of MDPI and/or the editor(s). MDPI and/or the editor(s) disclaim responsibility for any injury to people or property resulting from any ideas, methods, instructions or products referred to in the content.