Article

Local Surface Environmental Changes in a Basin in the Permafrost Region of Qinghai-Tibet Plateau Affected by Lake Outburst Event

1
School of Civil and Environmental Engineering, Changsha University of Science and Technology, Changsha 410114, China
2
State Key Laboratory of Cryospheric Science and Frozen Soil Engineering, Chinese Academy of Sciences, Lanzhou 730000, China
3
University of Chinese Academy of Sciences, Beijing 100049, China
4
School of Environment and Geographic Sciences, Shanghai Normal University, Shanghai 200234, China
*
Author to whom correspondence should be addressed.
Remote Sens. 2025, 17(19), 3392; https://doi.org/10.3390/rs17193392
Submission received: 26 July 2025 / Revised: 24 September 2025 / Accepted: 4 October 2025 / Published: 9 October 2025
(This article belongs to the Special Issue Remote Sensing of Water Dynamics in Permafrost Regions)

Abstract

Highlights

What are the main findings?
  • A “hot zone” with higher surface temperatures and reduced vegetation cover emerged around Zonag Lake following its outburst.
  • Downstream areas (from Kusai Lake to Salt Lake) exhibited significantly higher dryness levels compared to the upstream region.
What is the implication of the main finding?
  • The outburst-induced surface changes drive contrasting permafrost processes: desertification enhances permafrost development upstream, while wetting accelerates degradation downstream.
  • This study provides critical insights for assessing environmental impacts and engineering safety in high-altitude permafrost regions under lake outburst events.

Abstract

The outburst of Zonag Lake in the permafrost region of the Qinghai-Tibet Plateau (QTP) has significantly altered the local environment, particularly affecting surface conditions and permafrost dynamics. By employing remote sensing and GIS tools, this study analyzed the spatial and temporal variations in surface environmental changes (surface temperature, vegetation, and dryness) within the Zonag–Salt Lake basin. The results indicate that the outburst caused higher surface temperatures and reduced vegetation cover around Zonag Lake. Analysis using the Temperature–Vegetation Dryness Index (TVDI) reveals higher dryness levels in downstream areas, especially from Kusai Lake to Salt Lake, compared to the upstream Zonag Lake. Temporal trends from 2000 to 2023 show a decrease in average Land Surface Temperature (LST) and an increase in the Normalized Difference Vegetation Index (NDVI). Geographical centroid shifts in environmental indices demonstrate migration patterns influenced by seasonal climate changes and the outburst event. Desertification around Zonag Lake accelerates permafrost development, while the wetting environment around Salt Lake promotes permafrost degradation. The Zonag Lake region is also an ecologically significant area, serving as a key calving ground for the Tibetan antelope (Pantholops hodgsonii), a nationally protected species. Thus, the environmental changes revealed in this study carry important implications for biodiversity conservation on the Tibetan Plateau. These findings highlight the profound impact of the Zonag Lake outburst on the surface environment and permafrost dynamics in the region, providing critical insights for understanding environmental responses to lake outbursts in high-altitude regions.

1. Introduction

In the context of intensified climate warming and wetting, lakes on the Qinghai-Tibet Plateau (QTP) have shown an increasing trend [1]. As a critical distribution area of lakes in China, the QTP accounts for 39.2% of the total number of lakes and 51.4% of the total lake area nationwide [2]. Lakes, as connectors between the hydrosphere, atmosphere, cryosphere, and other spheres, exhibit significant responses to climate change [3]. The total area of lakes on the plateau slightly decreased from the 1970s to the 1990s but rapidly increased from 2000 to 2010 [1]. Research on plateau lakes has revealed that the driving factors for lake expansion are diverse, including climate change, glacier melting, and permafrost degradation [4,5,6,7]. The expansion of lakes can also trigger a series of natural disasters, impacting economic and property security to varying degrees [8]. Notably, lake outbursts are among the most severe disasters in both glacier and permafrost regions.
Lakes in glacier regions are primarily supplied by glacier meltwater. Under the warm and humid conditions of the QTP, the melting of most glaciers has led to a widespread increase in glacier lake area, thereby exacerbating the risk of glacier lake outburst floods (GLOFs) [9,10]. GLOF events often result in floods extending hundreds of kilometers, causing significant losses to human lives and property [11,12,13]. For instance, the GLOF that occurred in Kangma County in July 1954 submerged approximately 5733 hectares of farmland, resulting in the deaths of more than 400 people and affecting over 20,000 individuals [14,15]. Similarly, the 1981 GLOF in Nyalam destroyed parts of the China-Nepal Highway and bridge structures [14,15,16].
In contrast to the expansion and outburst of lakes in glacier regions, lake expansion in permafrost regions rarely leads to outburst events. As a thermally sensitive soil, permafrost produces a large amount of meltwater during its degradation process. This meltwater infiltrates into faults connected to nearby water systems or is discharged through cracks, leading to an increase in lake area and volume [17]. The expansion of lake area disturbs the thermal conditions of permafrost, subsequently accelerating its degradation [18,19,20]. In this cyclical process, lakes in permafrost regions exhibit more significant expansion. For example, during the expansion of thermokarst lakes, the permafrost layer continuously moves downward, accompanied by rising ground temperatures and the melting of underground ice. This results in numerous cracks and collapses at the lake shore. As the cracks widen and lengthen, the lake area continues to expand, with the expansion rate controlled by the temperature of the lake bottom and permafrost [21]. Due to the thermal sensitivity of permafrost, the construction and maintenance of engineering projects in these regions face significant challenges. External disturbances can easily disrupt the thermal balance of permafrost, leading to geological disasters such as thermokarst collapses and thermokarst lakes [22]. Disease investigation data show that, except for the Qinghai-Tibet Railway, the disease rate of road engineering in permafrost areas exceeds 30% [23]. Among these challenges, the increase in lake area caused by lateral erosion poses significant risks to the safe operation of linear engineering projects, such as thermokarst lakes [24,25].
In September 2011, an outburst occurred at Zonag Lake, located in the continuous permafrost region of the QTP. The spilled lake water flowed successively through and filled Kusai Lake and Haidingnor Lake before finally entering Salt Lake, the terminal lake of the basin [26,27]. This event altered the distribution of surface water bodies in the basin, resulting in a reduction in the area of the upstream Zonag Lake and a continuous increase in the area of the downstream Salt Lake [28,29,30]. Additionally, the changes in surface water distribution influenced the permafrost state in the basin, leading to permafrost development around Zonag Lake and degradation around Salt Lake [7,31,32]. Beyond its hydrological and permafrost context, the Zonag Lake region holds particular ecological significance. It serves as one of the main calving grounds for the Tibetan antelope (Pantholops hodgsonii), a flagship species of the Tibetan Plateau and a nationally protected animal in China. Changes in this environment may therefore not only affect hydrology and permafrost processes, but also have profound implications for biodiversity conservation and the long-term survival of this species.
Previous research on the Zonag Lake outburst has highlighted several important consequences, such as desertification around the exposed lakebed, severe downstream channel erosion, and potential engineering risks to infrastructure [4,27,29,30,33,34,35]. These studies have provided valuable insights into geomorphological and engineering impacts, as well as large-scale water redistribution and broader permafrost dynamics in the Zonag–Salt Lake basin. However, relatively less attention has been given to the localized ecological and climatic consequences, particularly in terms of vegetation dynamics, land surface temperature (LST), and soil moisture conditions.
This study contributes by addressing these gaps through a basin-scale, quantitative, and long-term assessment of ecological responses using integrated remote sensing indicators (NDVI, LST, and TVDI) combined with spatial analytical methods. In particular, we emphasize localized environmental changes, especially in areas around the exposed lakebed and downstream Salt Lake. Furthermore, we highlight the contrasting spatial impacts between the exposed lakebed and the expanding Salt Lake, and link these patterns to hydrological redistribution and permafrost processes, thereby offering deeper mechanistic insights. This localized focus provides a more granular understanding of how the outburst reshaped the surface environment and adds new perspectives to the complex interactions among lake outbursts, ecological dynamics, and permafrost degradation that have not been adequately addressed in previous studies.

2. Study Area and Dataset

2.1. Study Area

This research focuses on a specific study area located in the northeastern section of Hoh Xil, an inland region of the Qinghai-Tibet Plateau (QTP), bordered by the Kunlun Mountains to the north (Figure 1). The study area exhibits a pronounced topographical gradient, with the western part being significantly higher than the eastern part. This west-high-to-east-low terrain influences regional natural factors, including climate and hydrology, and has a profound impact on the ecosystem. Four major lakes—Zonag Lake, Kusai Lake, Haidingnor Lake, and Salt Lake—are distributed consecutively from high to low elevations.
Under the influence of Quaternary glacial processes and the regional climate, the soil composition in this area is predominantly gravelly sandy, posing challenges for the sustenance of robust vegetation. With a vegetation coverage of less than 30%, Stipa grass emerges as the dominant plant species. The study area exhibits a well-developed permafrost regime. Based on geotechnical borehole data, the thickness of the active layer ranges from 2 to 3 m, with permafrost temperatures exceeding –1 °C. Beneath the permafrost table, the ice content varies between 30% and 70%.

2.2. Dataset

To acquire data on land surface temperature (LST), vegetation, and drought conditions in the study area before and after the collapse of Zonag Lake, MOD11A2 and MOD13A2 datasets were selected. While MODIS data has a relatively coarse spatial resolution, it is suitable for basin-scale studies like ours due to its long temporal span, and ability to provide consistent, high-quality data over time. MODIS data strikes a balance between spatial and temporal resolution, making it particularly effective for monitoring large-scale environmental changes in high-altitude and remote regions where higher-resolution data may not be readily available. Daytime LST and Normalized Difference Vegetation Index (NDVI) values within the basin were extracted using the Google Earth Engine platform. Given the seasonal variations in temperature and vegetation on the Qinghai-Tibet Plateau (QTP), the data were divided into four quarters: Q1 (January–March), Q2 (April–June), Q3 (July–September), and Q4 (October–December).

3. Methods

3.1. Environmental Indexes: LST, NDVI and TVDI

As a critical parameter integrating surface–atmosphere interactions and energy exchange between the atmosphere and land, Land Surface Temperature (LST) can reflect spatiotemporal variations in surface energy balance [37]. With the development of satellite technology and the data accumulation, there are increasingly diverse remote sensing methods for retrieving surface temperature, including single-channel algorithms, multi-channel algorithms, and multi-angle algorithms. Due to the MODIS data balanced spatial and temporal resolution, this study uses the MODIS data to extract the LST and NDVI of the study area. The MOD11 series data selected in this study employs the generalized split window algorithm, which belongs to the multi-channel algorithm category. Unlike single-channel algorithms, it does not require precise knowledge of surface emissivity for each pixel, atmospheric radiative transfer models, or accurate atmospheric profiles, making it suitable for regions where field measurements are challenging, such as the QTP.
The Normalized Difference Vegetation Index (NDVI), utilizing vegetation absorption of red light and reflection of near-infrared light, can reflect changes in vegetation in sensitive areas. The calculation equation is as follows:
N D V I = ρ R e d ρ N I R ρ R e d + ρ N I R
where ρ R e d represents the red band and ρ N I R represents the near-infrared band. The MOD13 series data used in this study calculates NDVI products of different resolutions by applying the above equation to the respective bands of MODIS Level 1 data. To reduce potential anomalies, NDVI values were restricted to the range of 0–1 during data preprocessing. This thresholding procedure excluded most negative values typically associated with snow, ice, and water bodies, thereby minimizing their impact on the NDVI–LST feature space.
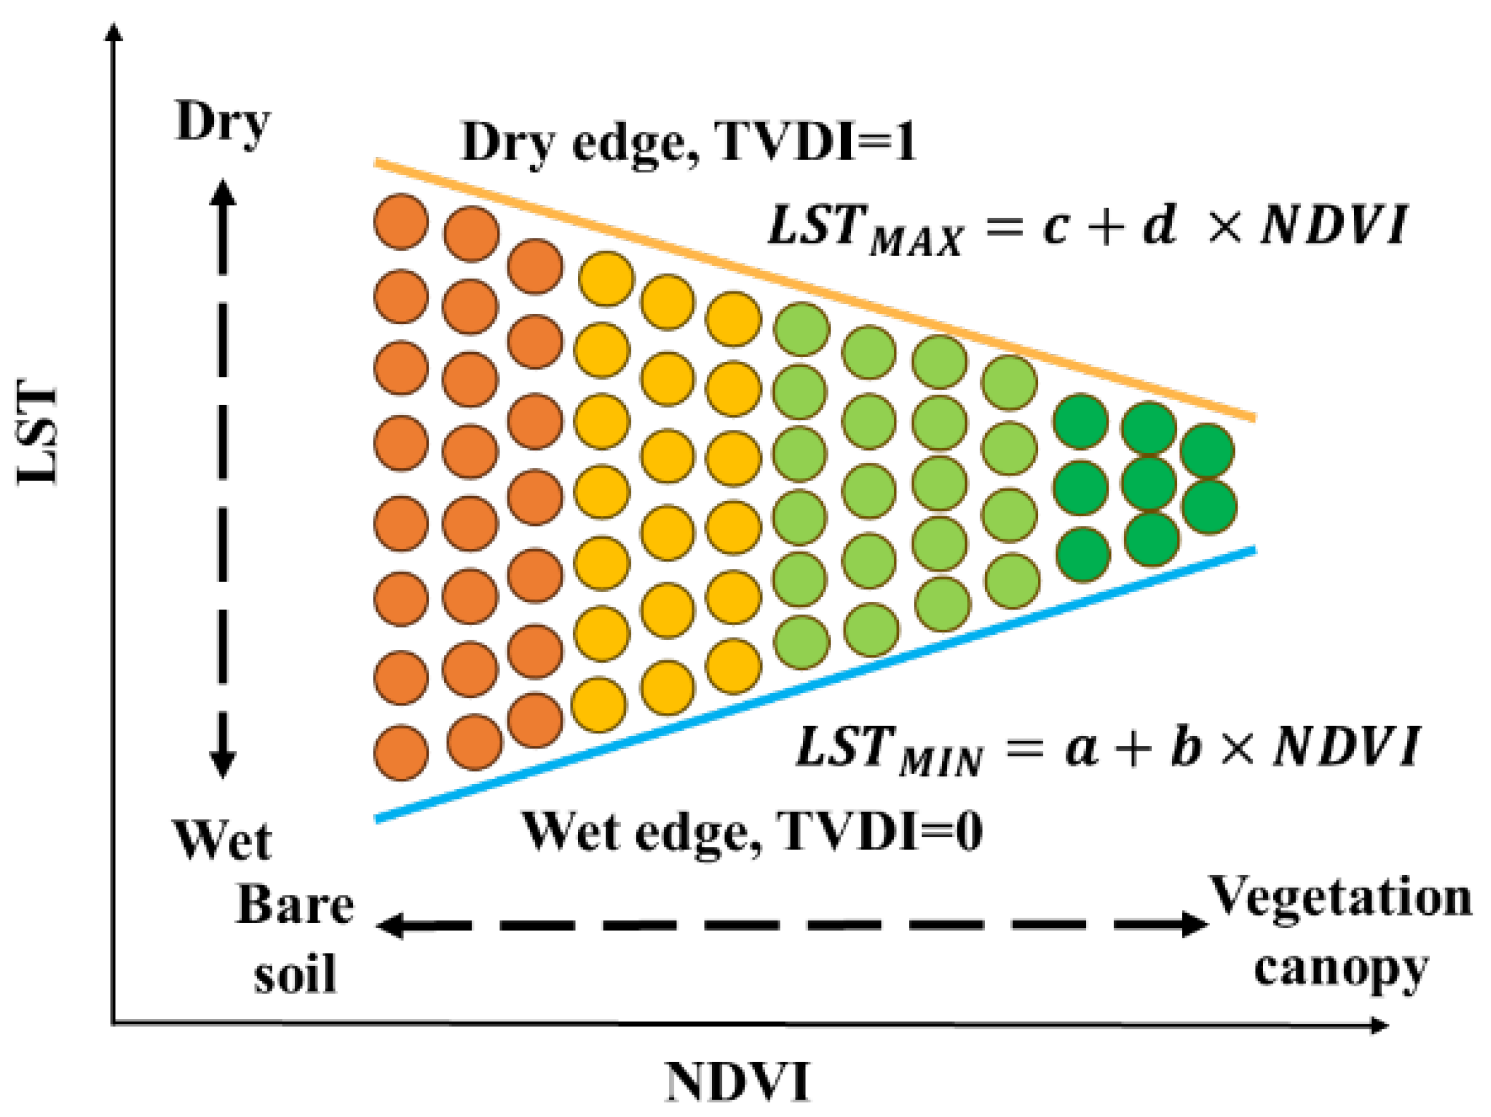
Based on LST and NDVI data, the Temperature Vegetation Dryness Index (TVDI) of the Zonag-Salt Lake Basin can be calculated. By constructing an NDVI-LST feature space and utilizing the triangular relationship between NDVI and LST, the equations of dry and wet boundaries are established to calculate the TVDI value for the study area. The method for calculate TVDI is as follows:
T V D I = L S T L S T M I N L S T M A X L S T M I N
where L S T M I N = a + b × N D V I and L S T M A X = c + d × N D V I , with a and b representing coefficients for the wet edge, and c and d representing coefficients for the dry edge. N D V I and L S T are the Normalized Difference Vegetation Index and Land Surface Temperature of the pixels involved in the calculation. In the NDVI-LST feature space, for pixels with the same NDVI value, the corresponding maximum and minimum LST values are determined (Figure 2). Linear regression equations are then obtained for these maximum and minimum values to establish the dry and wet boundaries of TVDI. The TVDI value is 1 at the dry edge and 0 at the wet edge [38]. After obtaining the dry and wet boundaries, the TVDI values of all pixels within the study area are computed.

3.2. Spatial Distribution Characteristics

The geographic mean centroid reflects the distribution of a geographic element within a study area. Based on the direction and distance of the movement of the geographic centroid, the spatial change magnitude and spatial variation in the geographic element over a certain period can be analyzed. The method for calculating the geographic centroid is as follows:
x ¯ = i = 1 n W i x i i = 1 n W i y ¯ = i = 1 n W i y i i = 1 n W i
where x ¯ and y ¯ are the coordinates corresponding to the geographic centroid; x i and y i are the coordinates corresponding to each geographic element; W i is the weight, represent the value corresponding to the geographic element; and n is the number of geographic elements.
The standard deviation ellipse can characterize the concentration and dispersion degree, as well as the directional trend of geographic elements, thereby expressing the spatial characteristics of the geographic elements. The major axis of the standard deviation ellipse represents the direction of data distribution, while the minor axis represents the range of data distribution. The greater the difference between the major and minor axes, the larger the elongation, and the greater the directional nature of the geographic data. A larger value of the minor axis indicates greater dispersion of the geographic data. The principle of the standard deviation ellipse is to calculate the standard deviation of the x and y coordinates of each geographic element from the mean center as the starting point, thereby defining the axes of the ellipse. The calculation method for the center of the ellipse is as follows:
S D E x = i = 1 n x i X ¯ 2 n S D E y = i = 1 n y i Y ¯ 2 n
where x i and y i are the spatial coordinate values of the geographic element, X ¯ and Y ¯ are the mean centers of the geographic elements, and n is the value of geographic elements.
The calculation method for the major and minor axes of the ellipse is as follows:
σ x = 2 i = 1 n x ~ i   cos θ y ~ i   cos θ 2 n σ y = 2 i = 1 n x ~ i   cos θ + y ~ i   cos θ 2 n
where σ x and σ y are the lengths of the x (major axis) and y (minor axis) of the standard deviation ellipse, x ~ i and y ~ i are the differences between the mean center and the geographic coordinates, and θ is the orientation angle of the ellipse. Particularly, the oblateness f can be calculated by the equation f = σ x σ y σ x .
The abovementioned methods are the calculation process for the standard deviation ellipse. Additionally, the spatial distribution of specific geographic elements weighted standard deviation ellipse can be obtained by considering the value of the elements in the calculating process.

3.3. Research Workflow

This research primarily utilizes the Google Earth Engine (GEE) and ArcGIS platforms, as illustrated in Figure 3. Data acquisition and TVDI calculations are conducted on the GEE platform. This involves clipping the original data to extract LST and NDVI values within the study area. Based on these datasets, an NDVI-LST space is constructed. Sampling points are then created within the study area, and LST and NDVI values are extracted at these points. Linear regression is applied to the boundaries of the sampling points in the NDVI-LST space to derive equations for the dry and wet boundaries, yielding the fitting coefficients for these boundaries. These coefficients are subsequently used in the TVDI calculation equation to derive TVDI values for the Zonag-Salt Lake Basin.
Spatial analysis is primarily performed using the ArcGIS platform. The raster-to-point tool is employed to vectorize the TVDI, NDVI, and LST data obtained from the GEE platform, generating a point dataset for the study area. Geographic centroids and standard deviation ellipses are then extracted from these point datasets to analyze the migration and directional distribution of TVDI, NDVI, LST, and surface water bodies within the Zonag-Salt Lake Basin. Additionally, since centroid migration and standard deviation ellipse methods can also reveal the spatiotemporal variations in surface water bodies, spatial analysis of surface water bodies is integrated into the ArcGIS processing workflow.

4. Results

4.1. The Changes in the Environmental Indexes

4.1.1. Changes in LST and NDVI

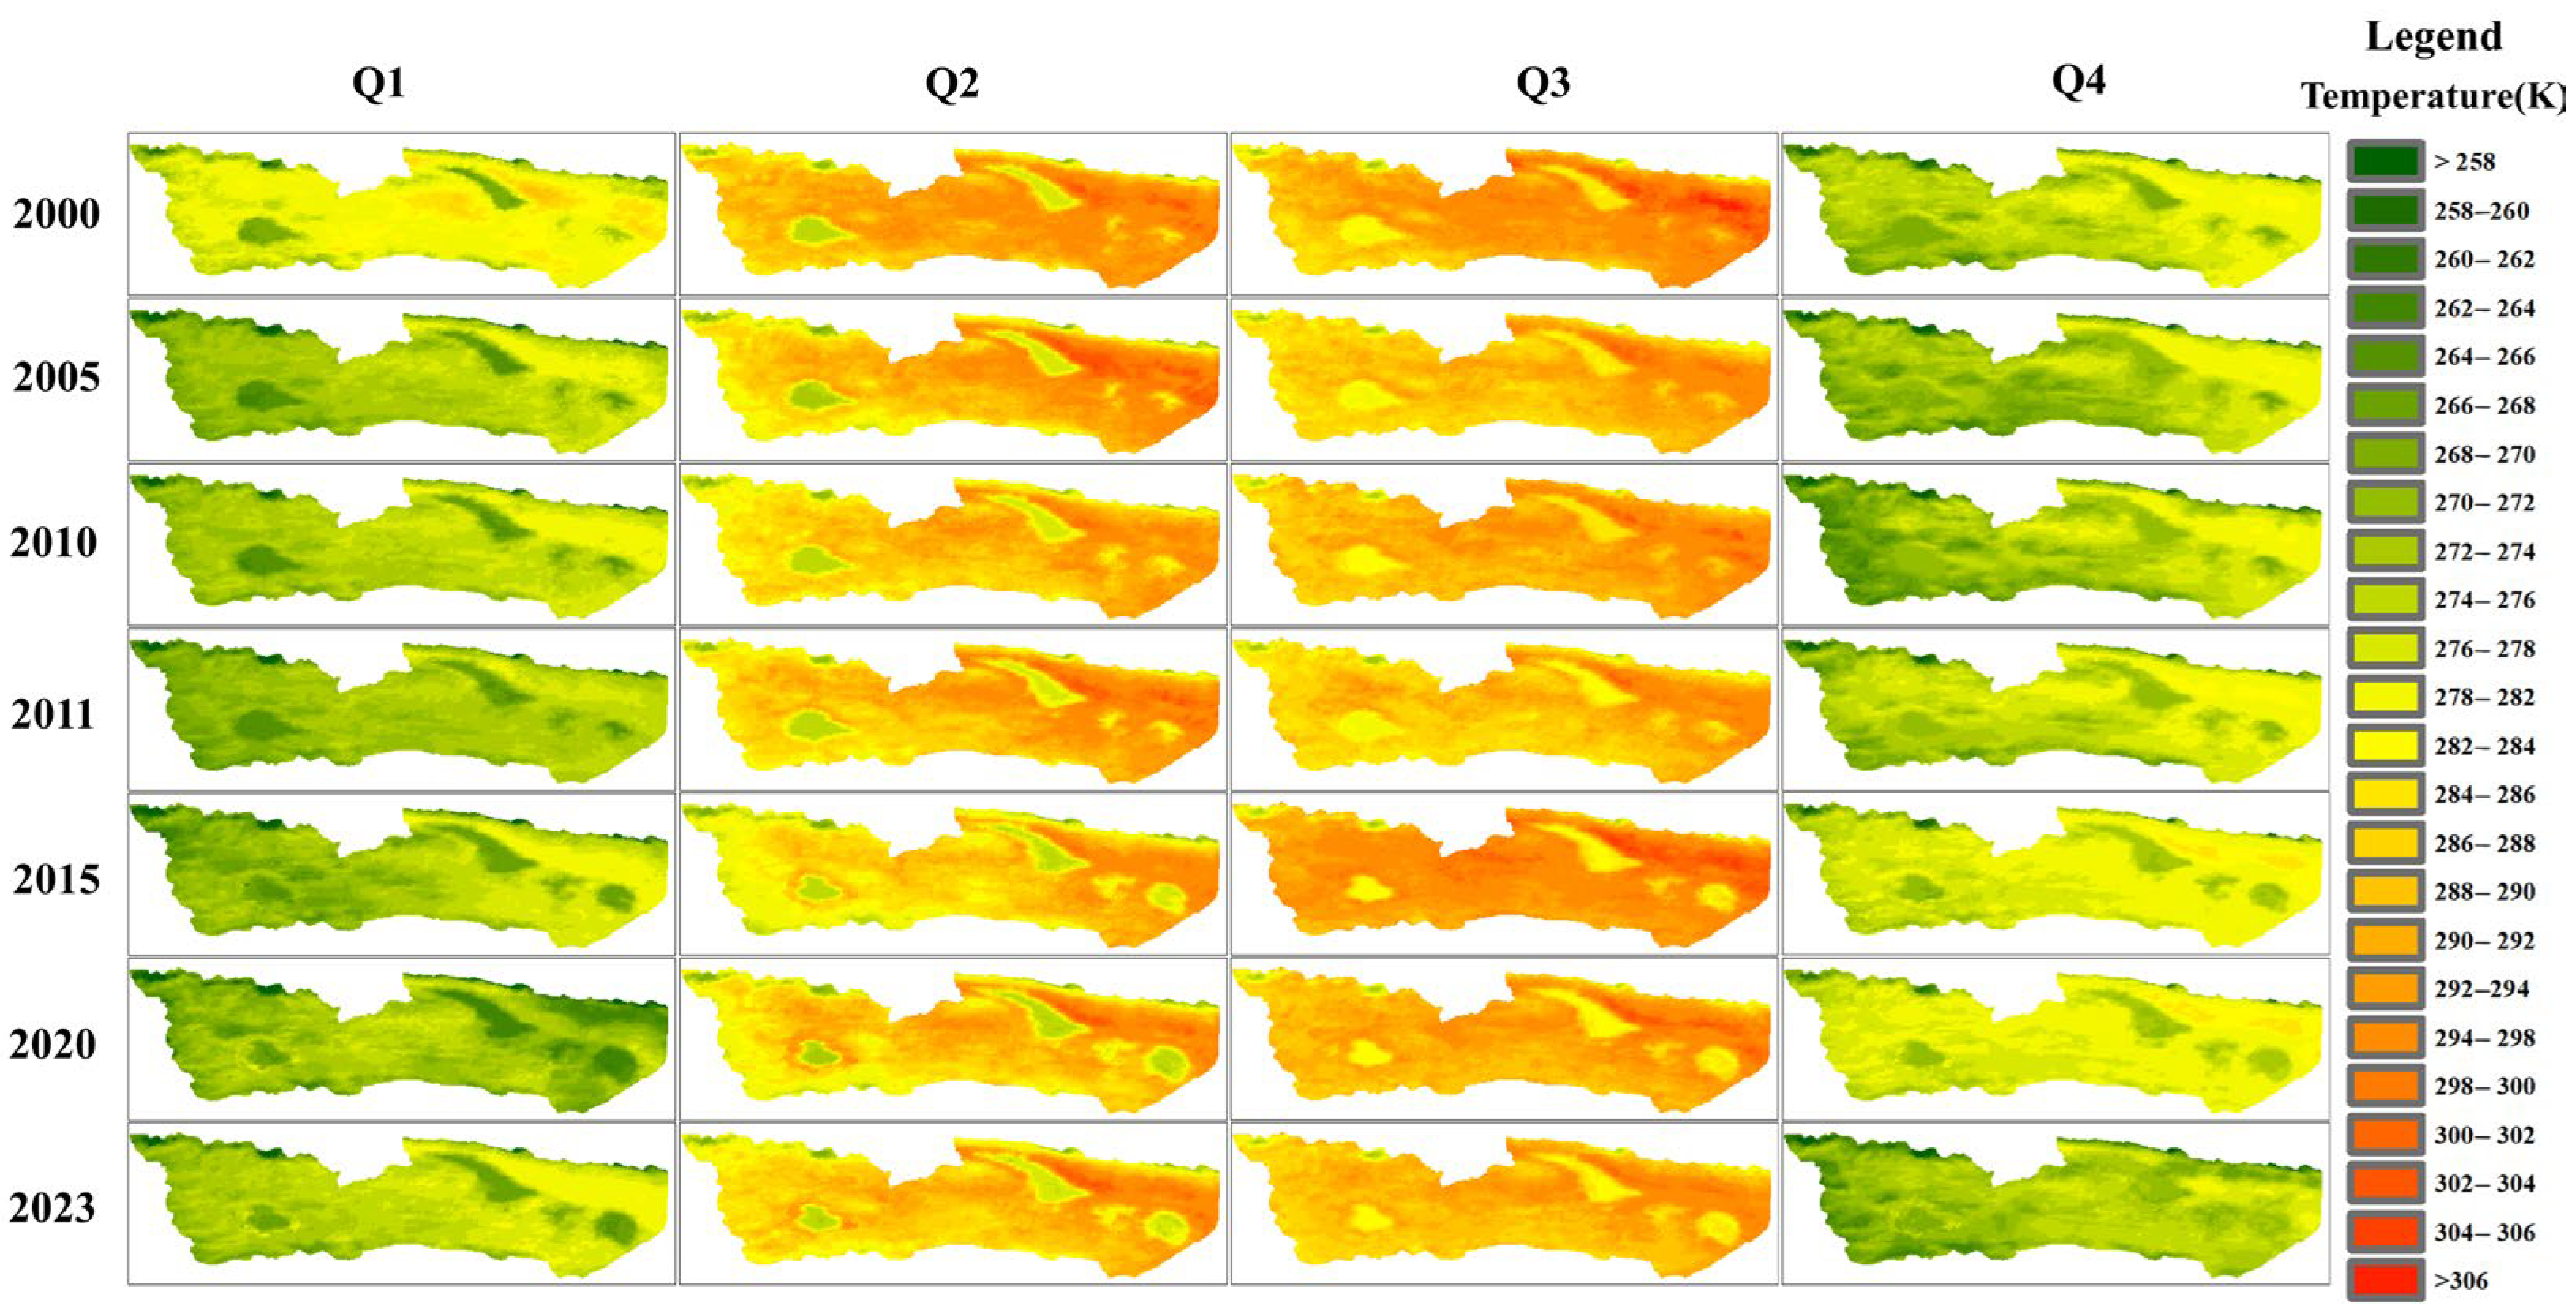
By extracting the corresponding bands from MODIS, LST and NDVI images for the study area were obtained from 2000 to 2022. Figure 4 illustrates images for seven representative years: 2000, 2005, 2010, 2011, 2015, 2020, and 2023 (the images of each quarter from 2000 to 2023 are shown in Figure S1, Supplementary data). From a single LST image, it is evident that the LST in the study area generally exhibits an east-high and west-low trend, with temperatures within the four lakes significantly lower than those of the surrounding land surfaces. Cyclical variations in LST are noticeable when comparing images between different seasons in the same year. Specifically, temperatures are relatively lower in Q1 and Q4 and higher in Q2 and Q3.
Significant changes induced by the outburst of Zonag Lake can be observed by comparing LST between the same seasons of different years. Following the outburst in Q3 of 2011, no significant change in LST was observed in Q4. Subsequently, with the continuous reduction in the area of Zonag Lake, a distinct “hot zone” appeared around the lake. This “hot zone” is located between the area range of Zonag Lake before and after its outburst (lakebed exposed after outburst), with its development being more pronounced in Q2. Correspondingly, a noticeable temperature zone appeared around the downstream tailing’s lake, Salt Lake, between the area range before and after the outburst. This temperature zone can also be well observed in Q2, although its development is not as clear as the “hot zone” around Zonag Lake.
Figure 5 and Figure S2 reveal the distribution of vegetation within the study area. Considering that areas with NDVI values less than 0 are mostly covered by water, clouds, or snow, a masking process was applied to remove values below 0 from the NDVI image. From the images, it is evident that the overall vegetation development in the study area is poor, with most NDVI values below 0.5. Areas with higher NDVI values are mainly concentrated in the western and southern parts of the study area, indicating better vegetation development in these regions compared to others. Similar to the LST image, the distribution of vegetation also exhibits noticeable seasonal cycles. Vegetation development is most favorable in Q3, followed by Q2, and is poorer in Q1 and Q4.
When examining NDVI values for the same season across different years, there is generally little variation in NDVI values within the study area. Before the outburst, vegetation around Zonag Lake developed better in the study area. However, after the outburst, the exposed lakebed due to the reduction in Zonag Lake’s area exhibited lower NDVI values. From the NDVI images of Q2 and Q3 in 2023, it can be observed that even after more than 10 years since the outburst, there is still a certain difference in vegetation development status between the sedimentation area of the original lakebed and the surrounding vegetation. However, this difference in NDVI values is not significant in Q1 and Q4.

4.1.2. Changes in TVDI

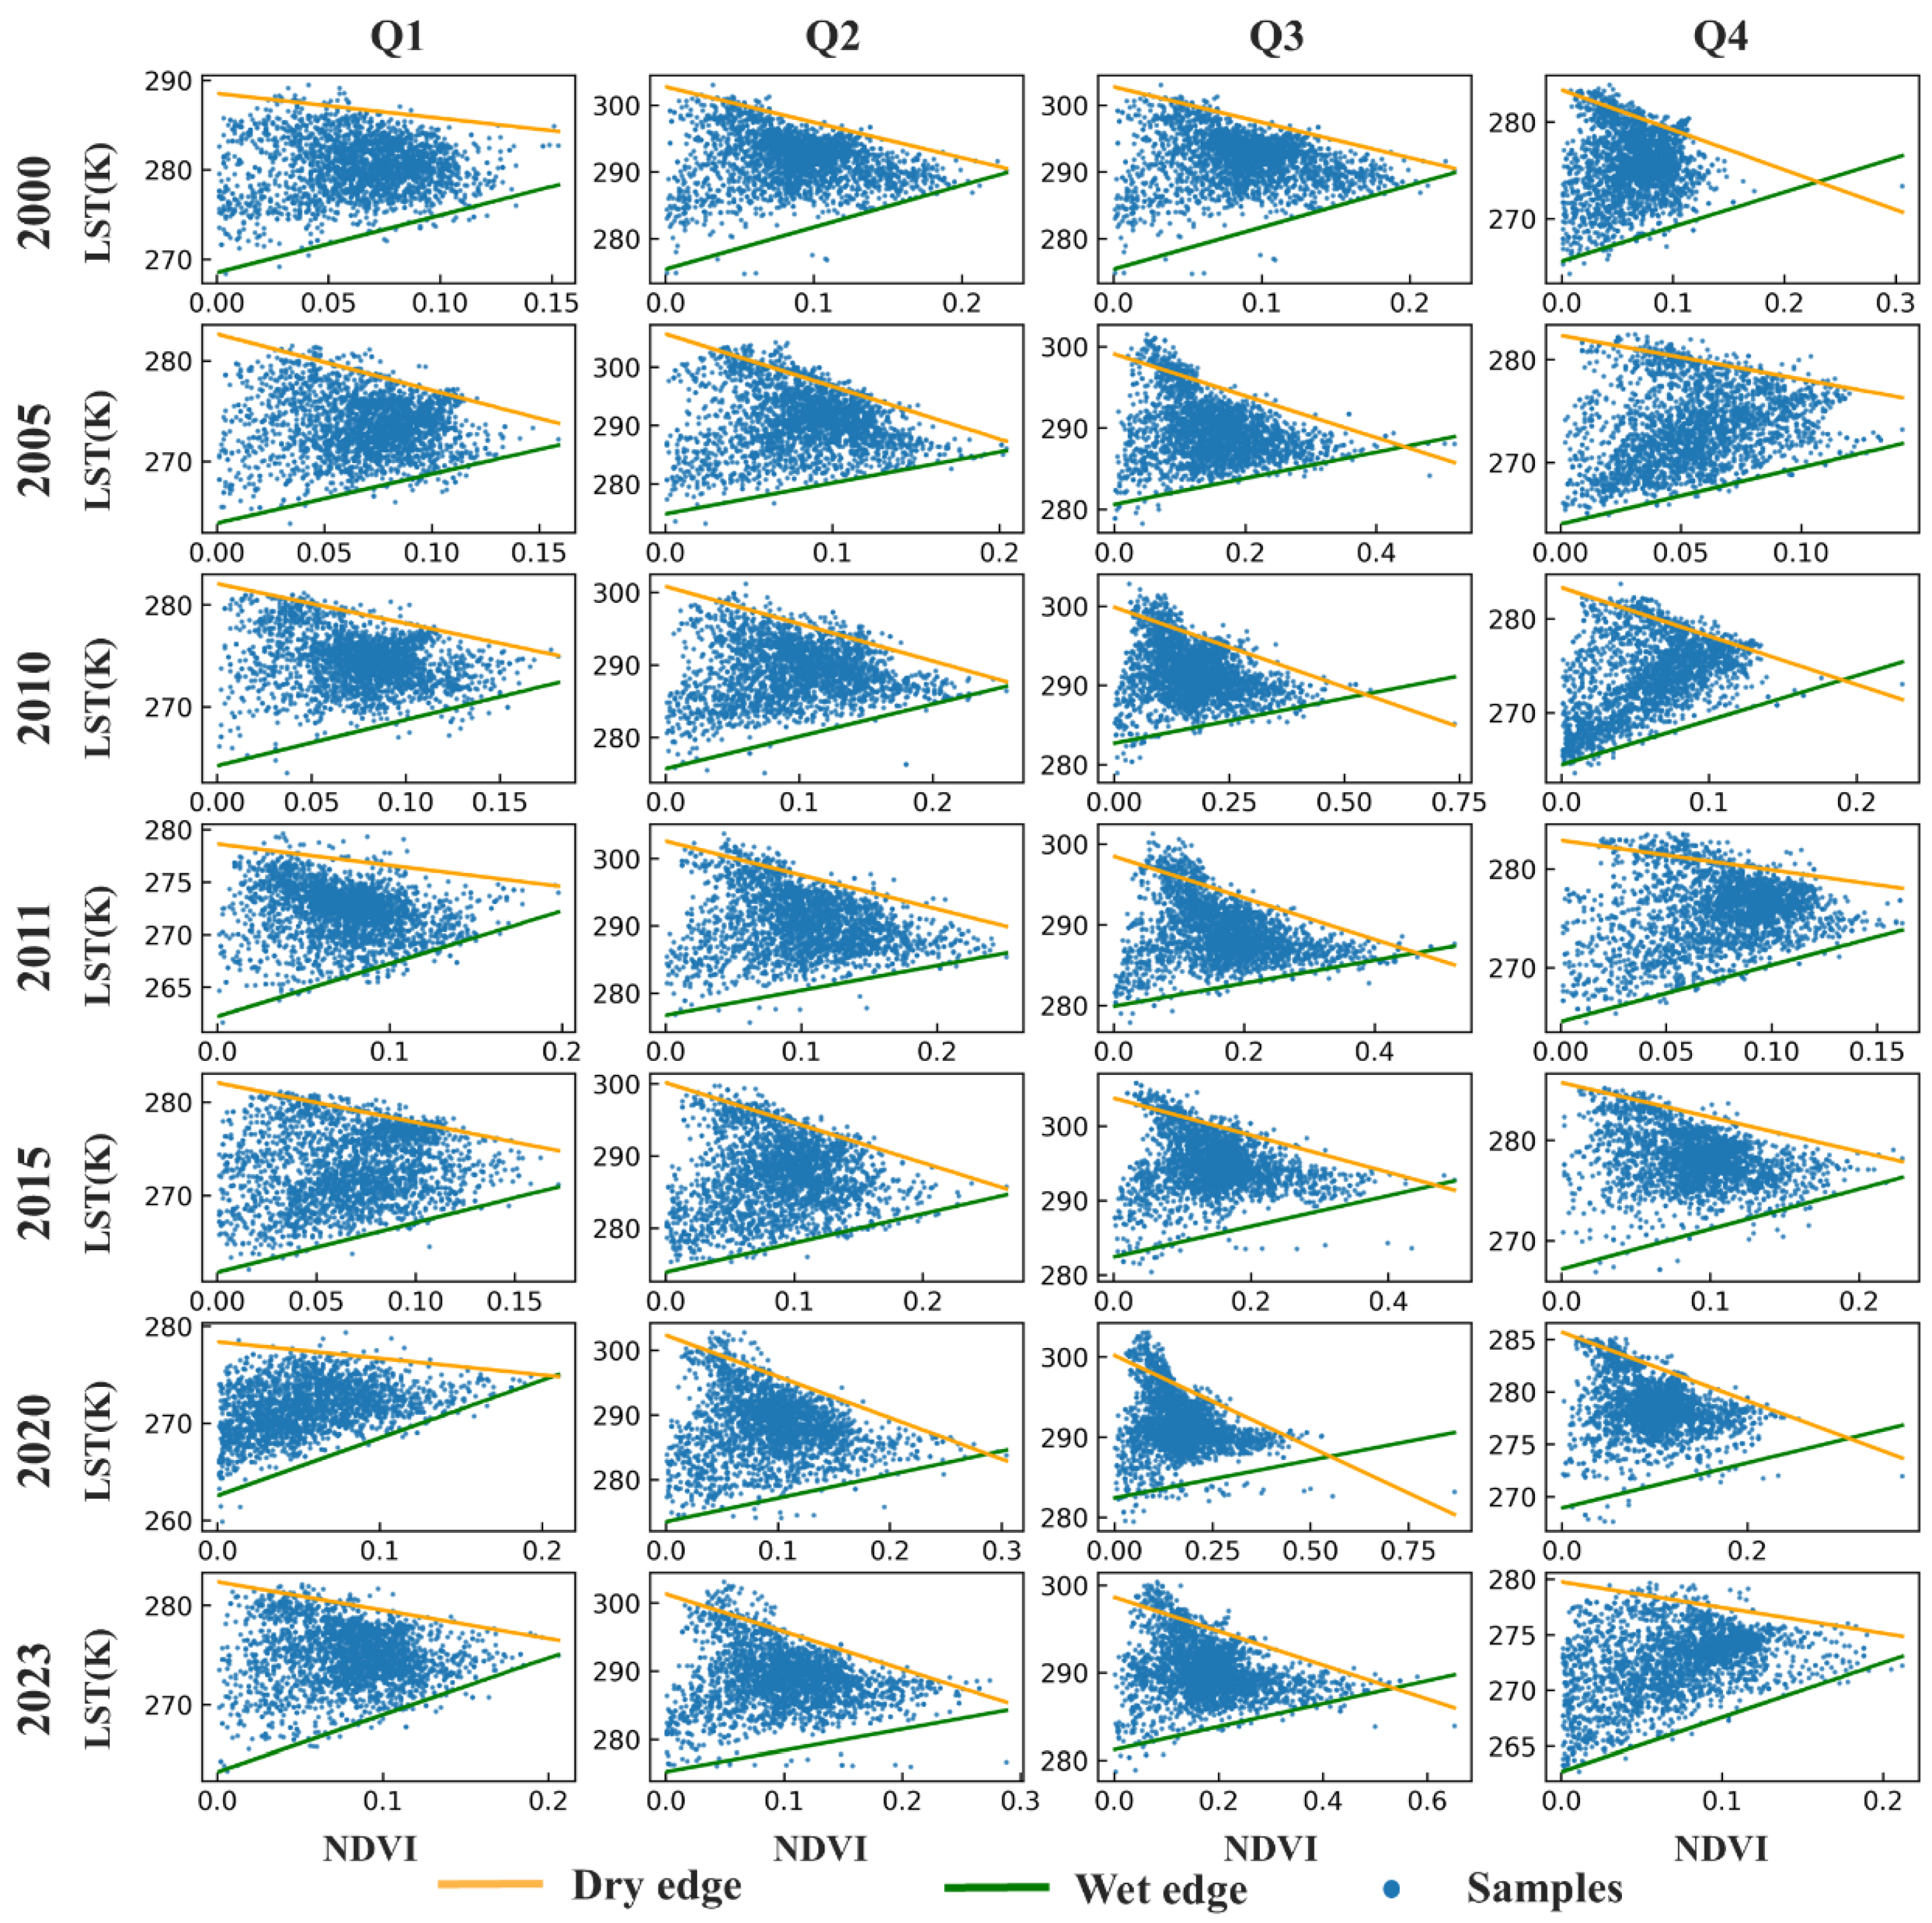
After obtaining the LST and NDVI data for the study area, the NDVI-LST feature space for each quarter can be constructed. In this feature space, linear regression is applied separately to the maximum and minimum LST corresponding to the same NDVI value to derive the equations for the dry edge (TVDI = 1) and wet edge (TVDI = 0), which are necessary for calculating the TVDI in the study area. Figure 6 and Figure S4 illustrate the equations for the dry edge and wet edge from 2000 to 2023. From the figure, it is evident that both NDVI and LST in the study area exhibit noticeable seasonal fluctuations. In Q1 and Q4, there are some points with relatively small NDVI values but median LST values. As NDVI and LST values increase in Q2 and Q3, this distribution trend gradually disappears. Considering the numerous lakes, developed water systems, and significant winter snowfall in the study area, this variation is related to the winter freezing and summer thawing of surface water, as well as winter snow cover.
The coefficients of the dry edge and wet edge equations for the NDVI-LST feature space are shown in Table 1. From the table, it can be observed that the intercept exhibits a certain degree of seasonal fluctuation. The trend of intercept values for both equations is that they are relatively small in Q1, reach their maximum values for the year in Q2 and Q3, and then decrease in Q4. Intercept a of the wet edge equation reaches its maximum in Q3 throughout the study period, while intercept c of the dry edge equation often reaches its maximum in Q2. In contrast, the changes in slope do not show clear periodic regularity within the quarters of the year, but the absolute values of the slopes of both equations exhibit good consistency.
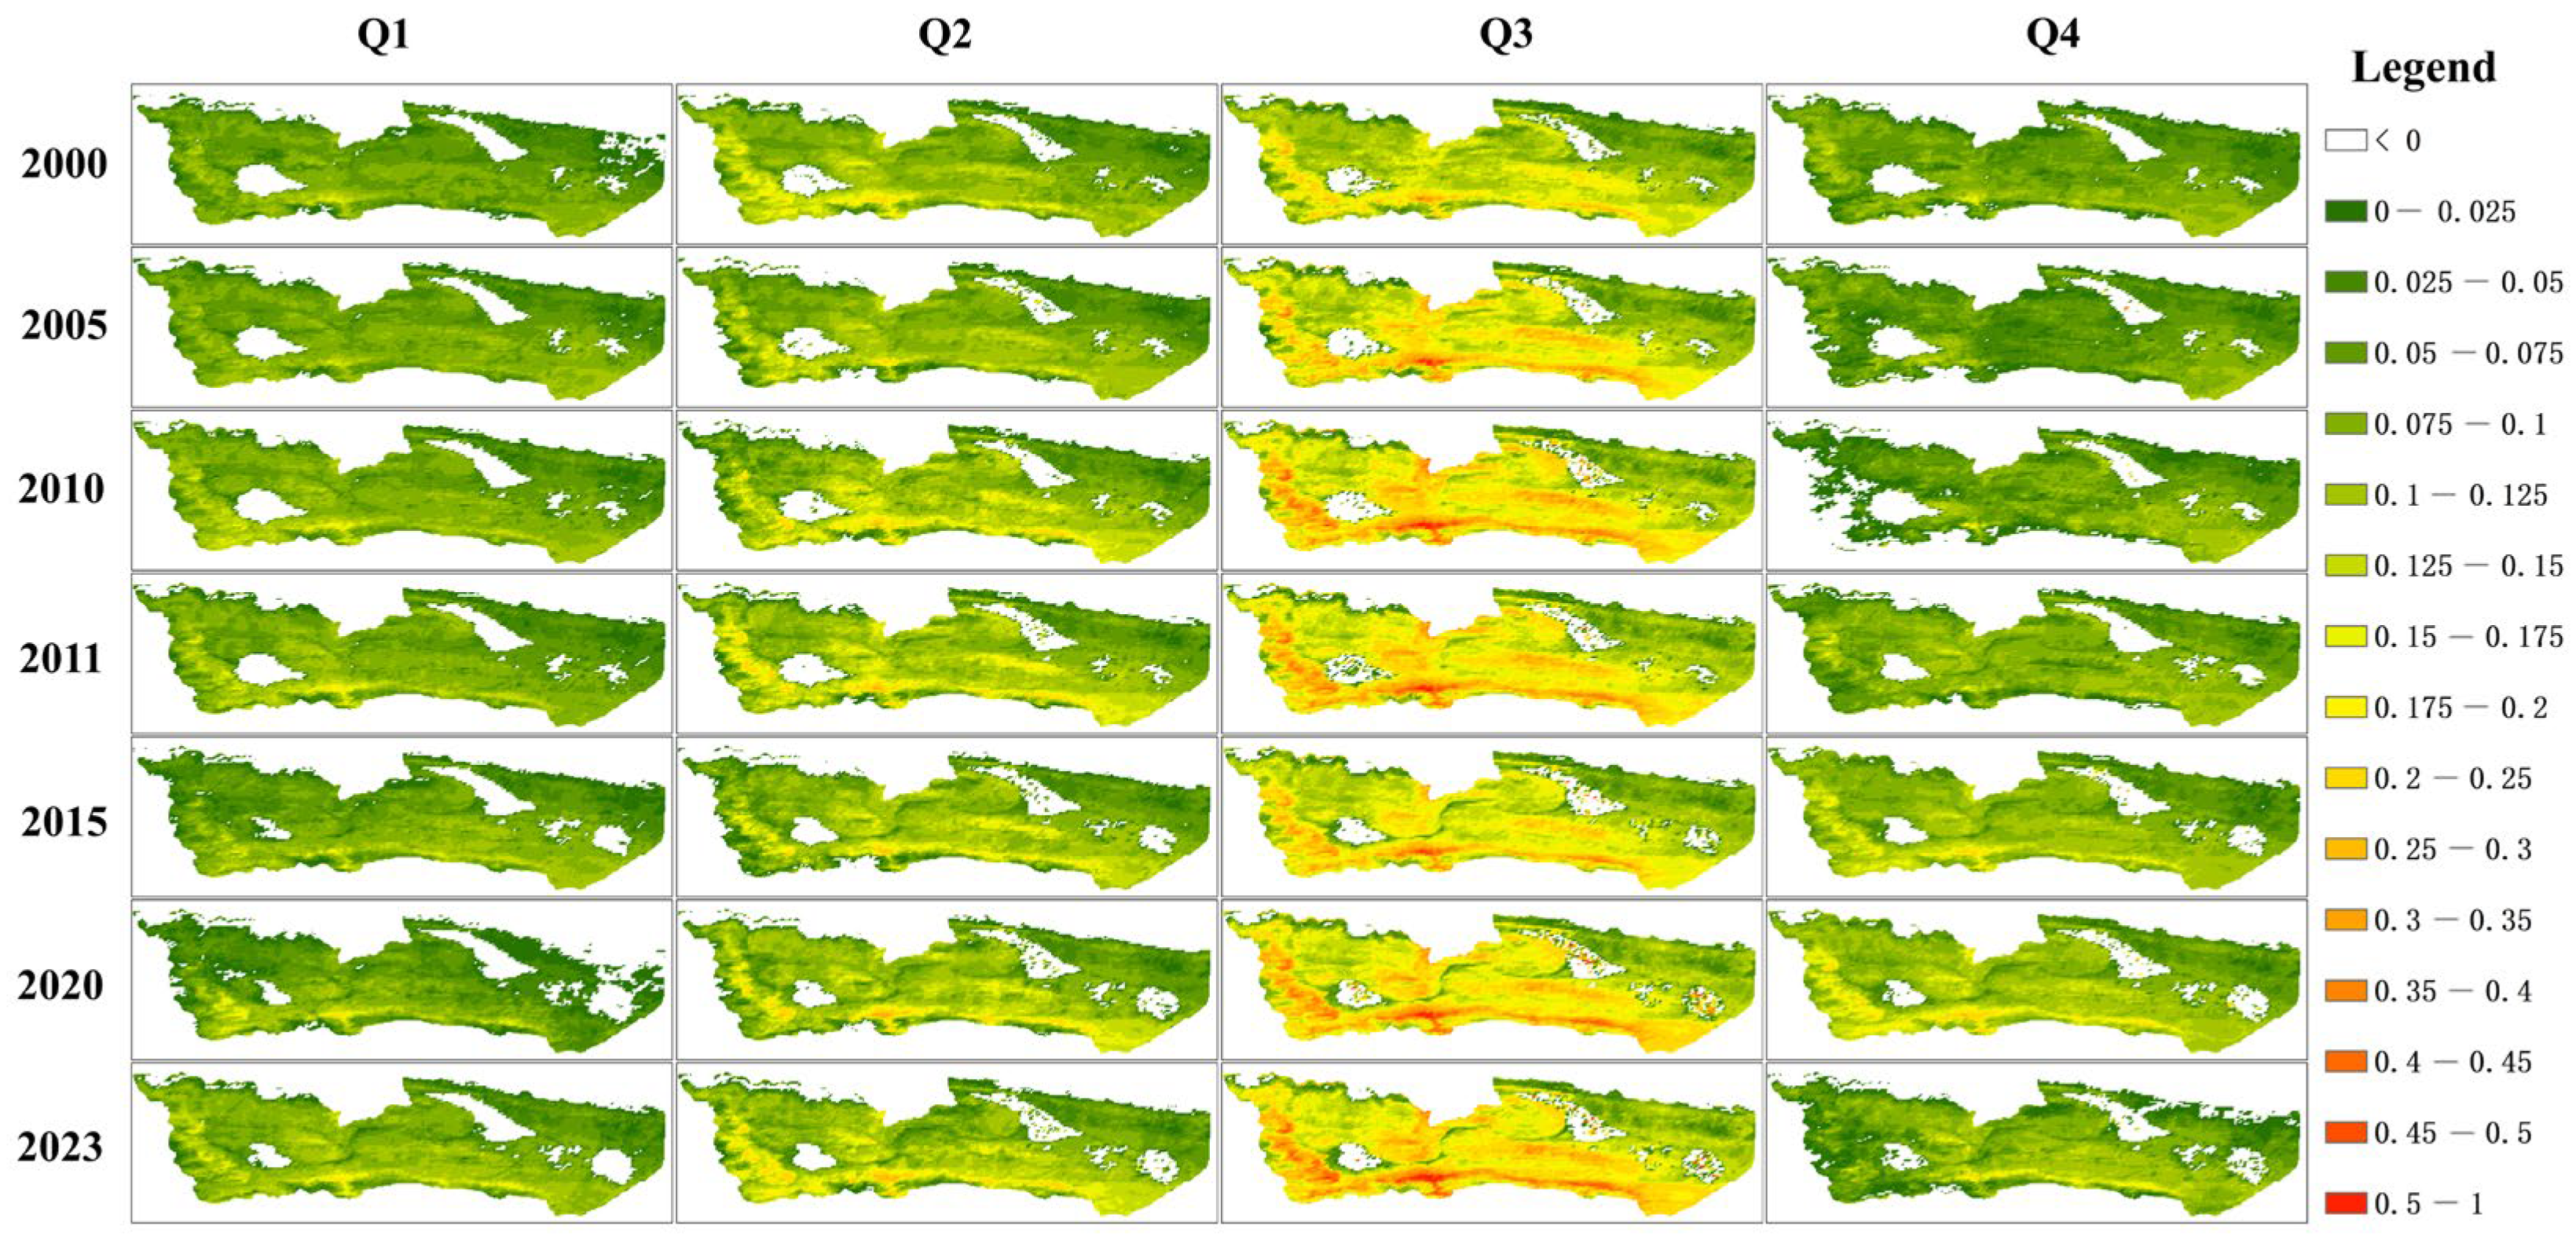
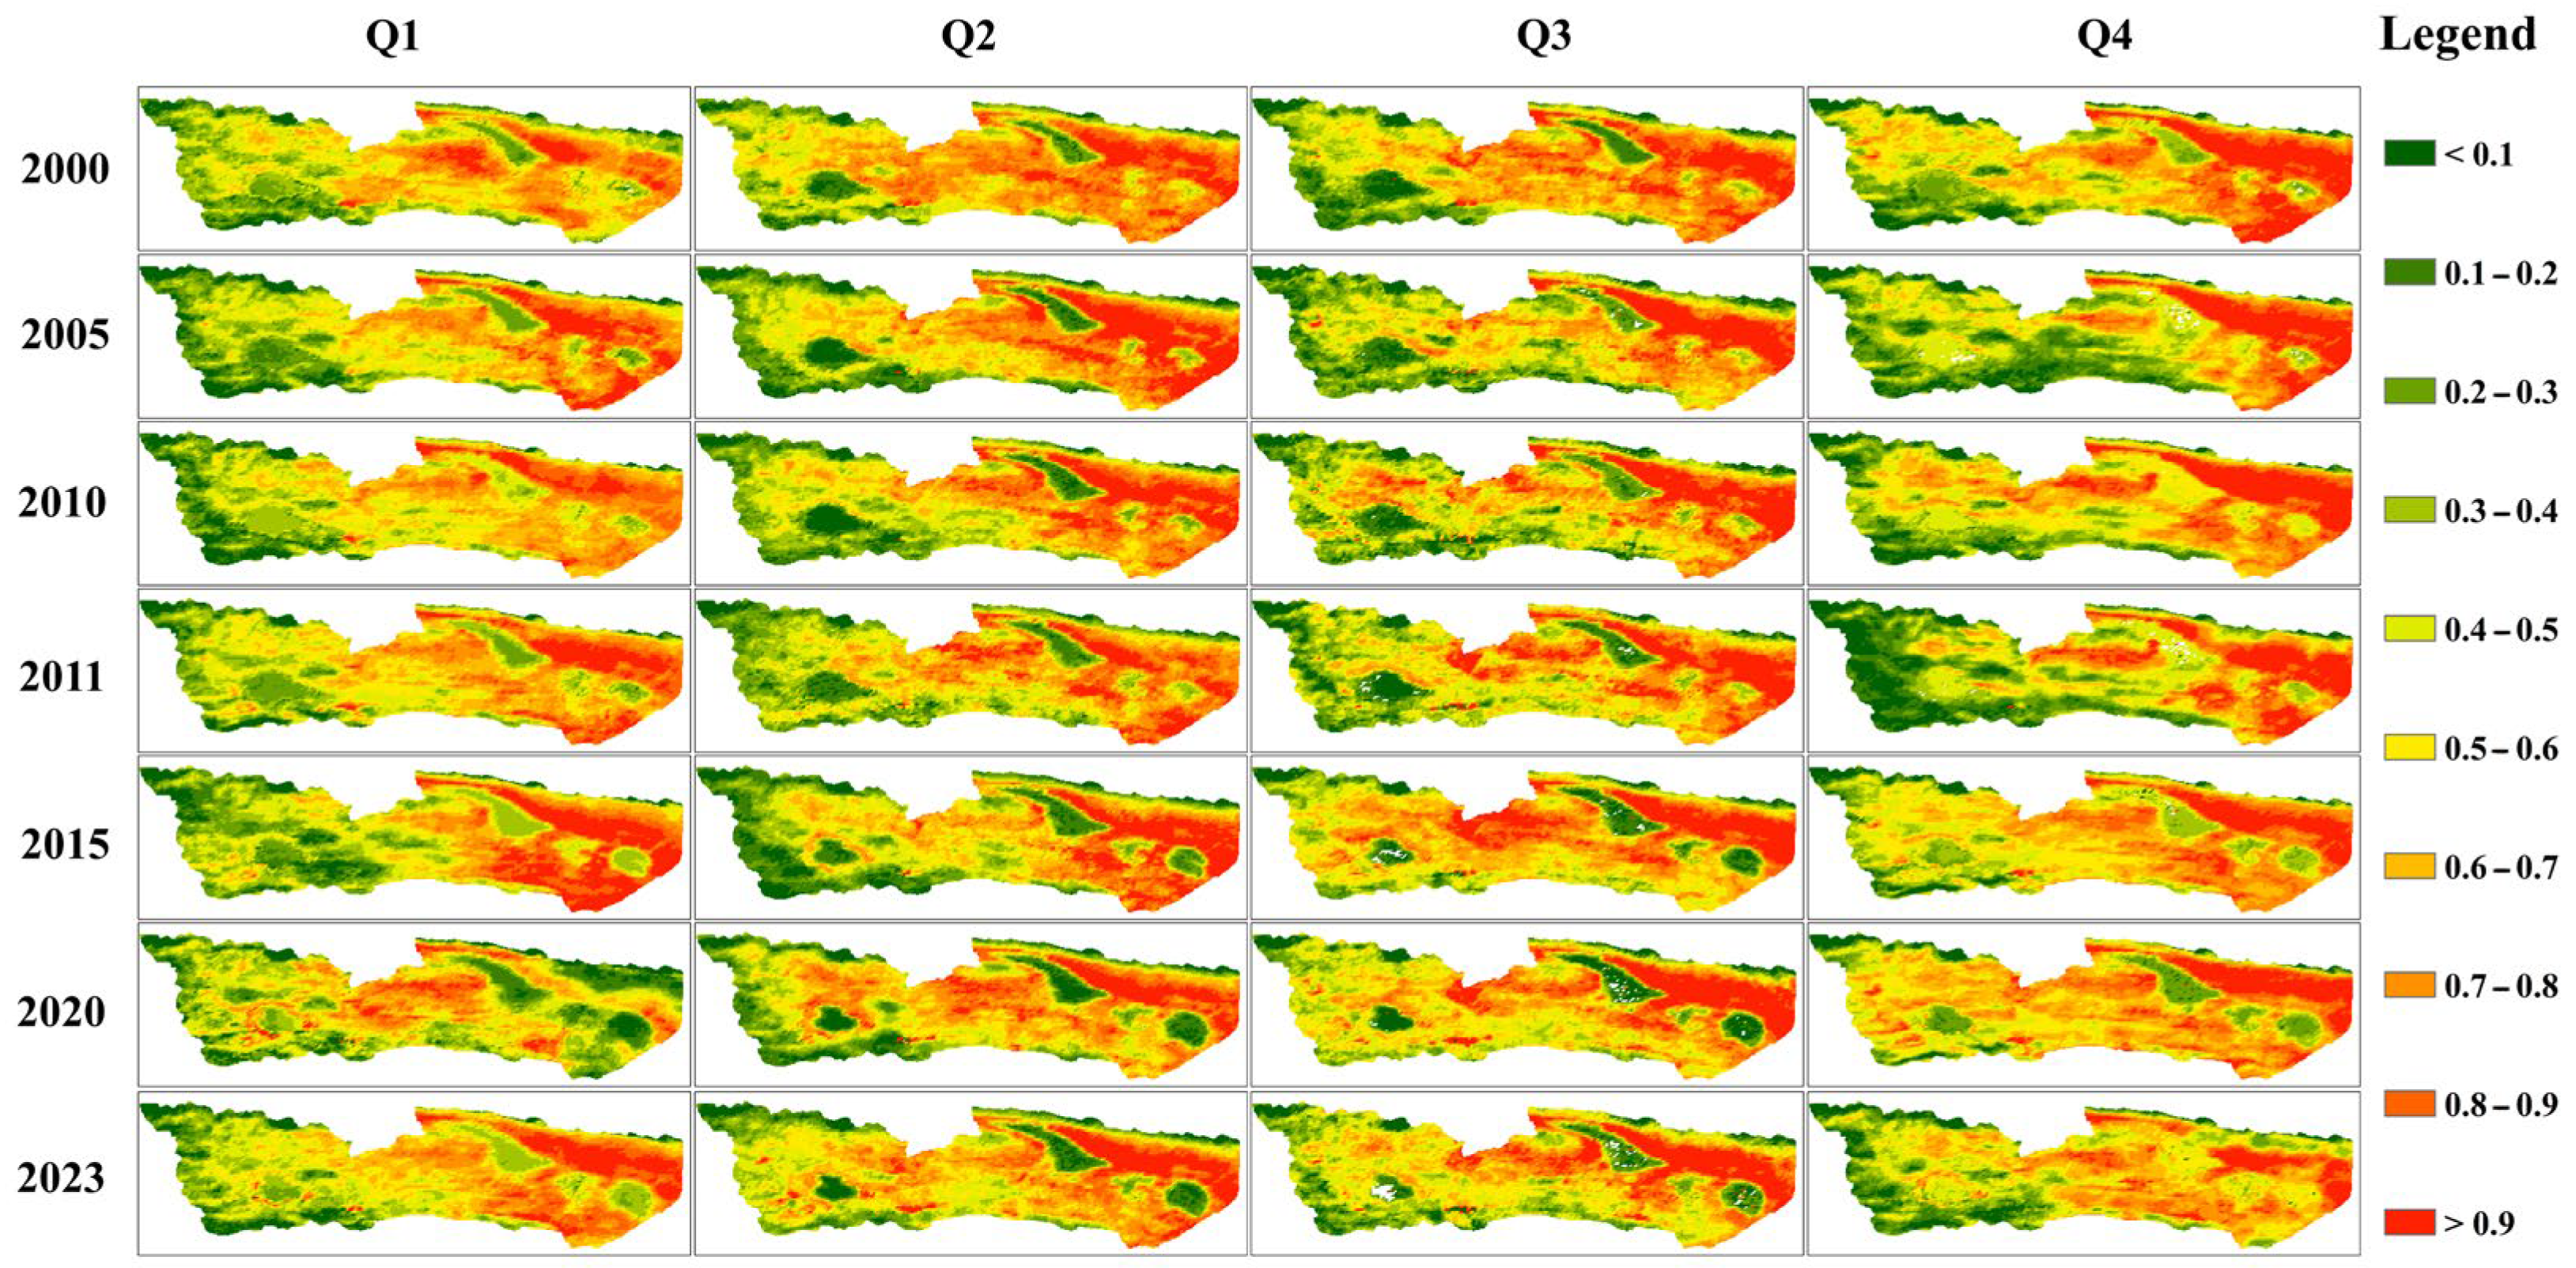
After obtaining the equations for the dry edge and wet edge and calculating the TVDI for each quarter of the study area, the distribution of TVDI within the study area can be obtained. Figure 7 and Figure S3 illustrate the distribution of TVDI for specific years between 2000 and 2023. It should be noted that, despite the NDVI range restriction, residual winter anomalies still affected the NDVI–LST space in Q1 and Q4. These seasonal effects are reflected in the lower intercept values of the dry and wet edge equations compared with those in Q2 and Q3, which can be attributed to the freezing–thawing cycle and the presence of lake ice. From the spatial distribution of TVDI, it is evident that the downstream part of the study area, from Lake Kusai to Salt Lake, exhibits significantly higher dryness index compared to the upstream Zonag Lake area. In the northeast direction of the study area, the maximum values of dryness index within the entire basin are concentrated, while the dryness index around the lakes is relatively low.
In terms of seasonal variation, the dryness index in Q1 and Q4 is generally lower compared to Q2 and Q3. When comparing before and after the outburst, the exposed lakebed area of Zonag Lake becomes a significantly arid area, particularly evident in Q2 and Q3. Within this area, which was formerly Zonag Lake before the outburst, there are lower dryness index values, while outside this area but within the former Zonag Lake region, higher aridity index values appear. However, compared to the area exposed by the outburst, this region has lower dryness index values.

4.2. Temporal and Spatial Analysis of the Environmental Indexes

4.2.1. Temporal Analysis of the Mean Value

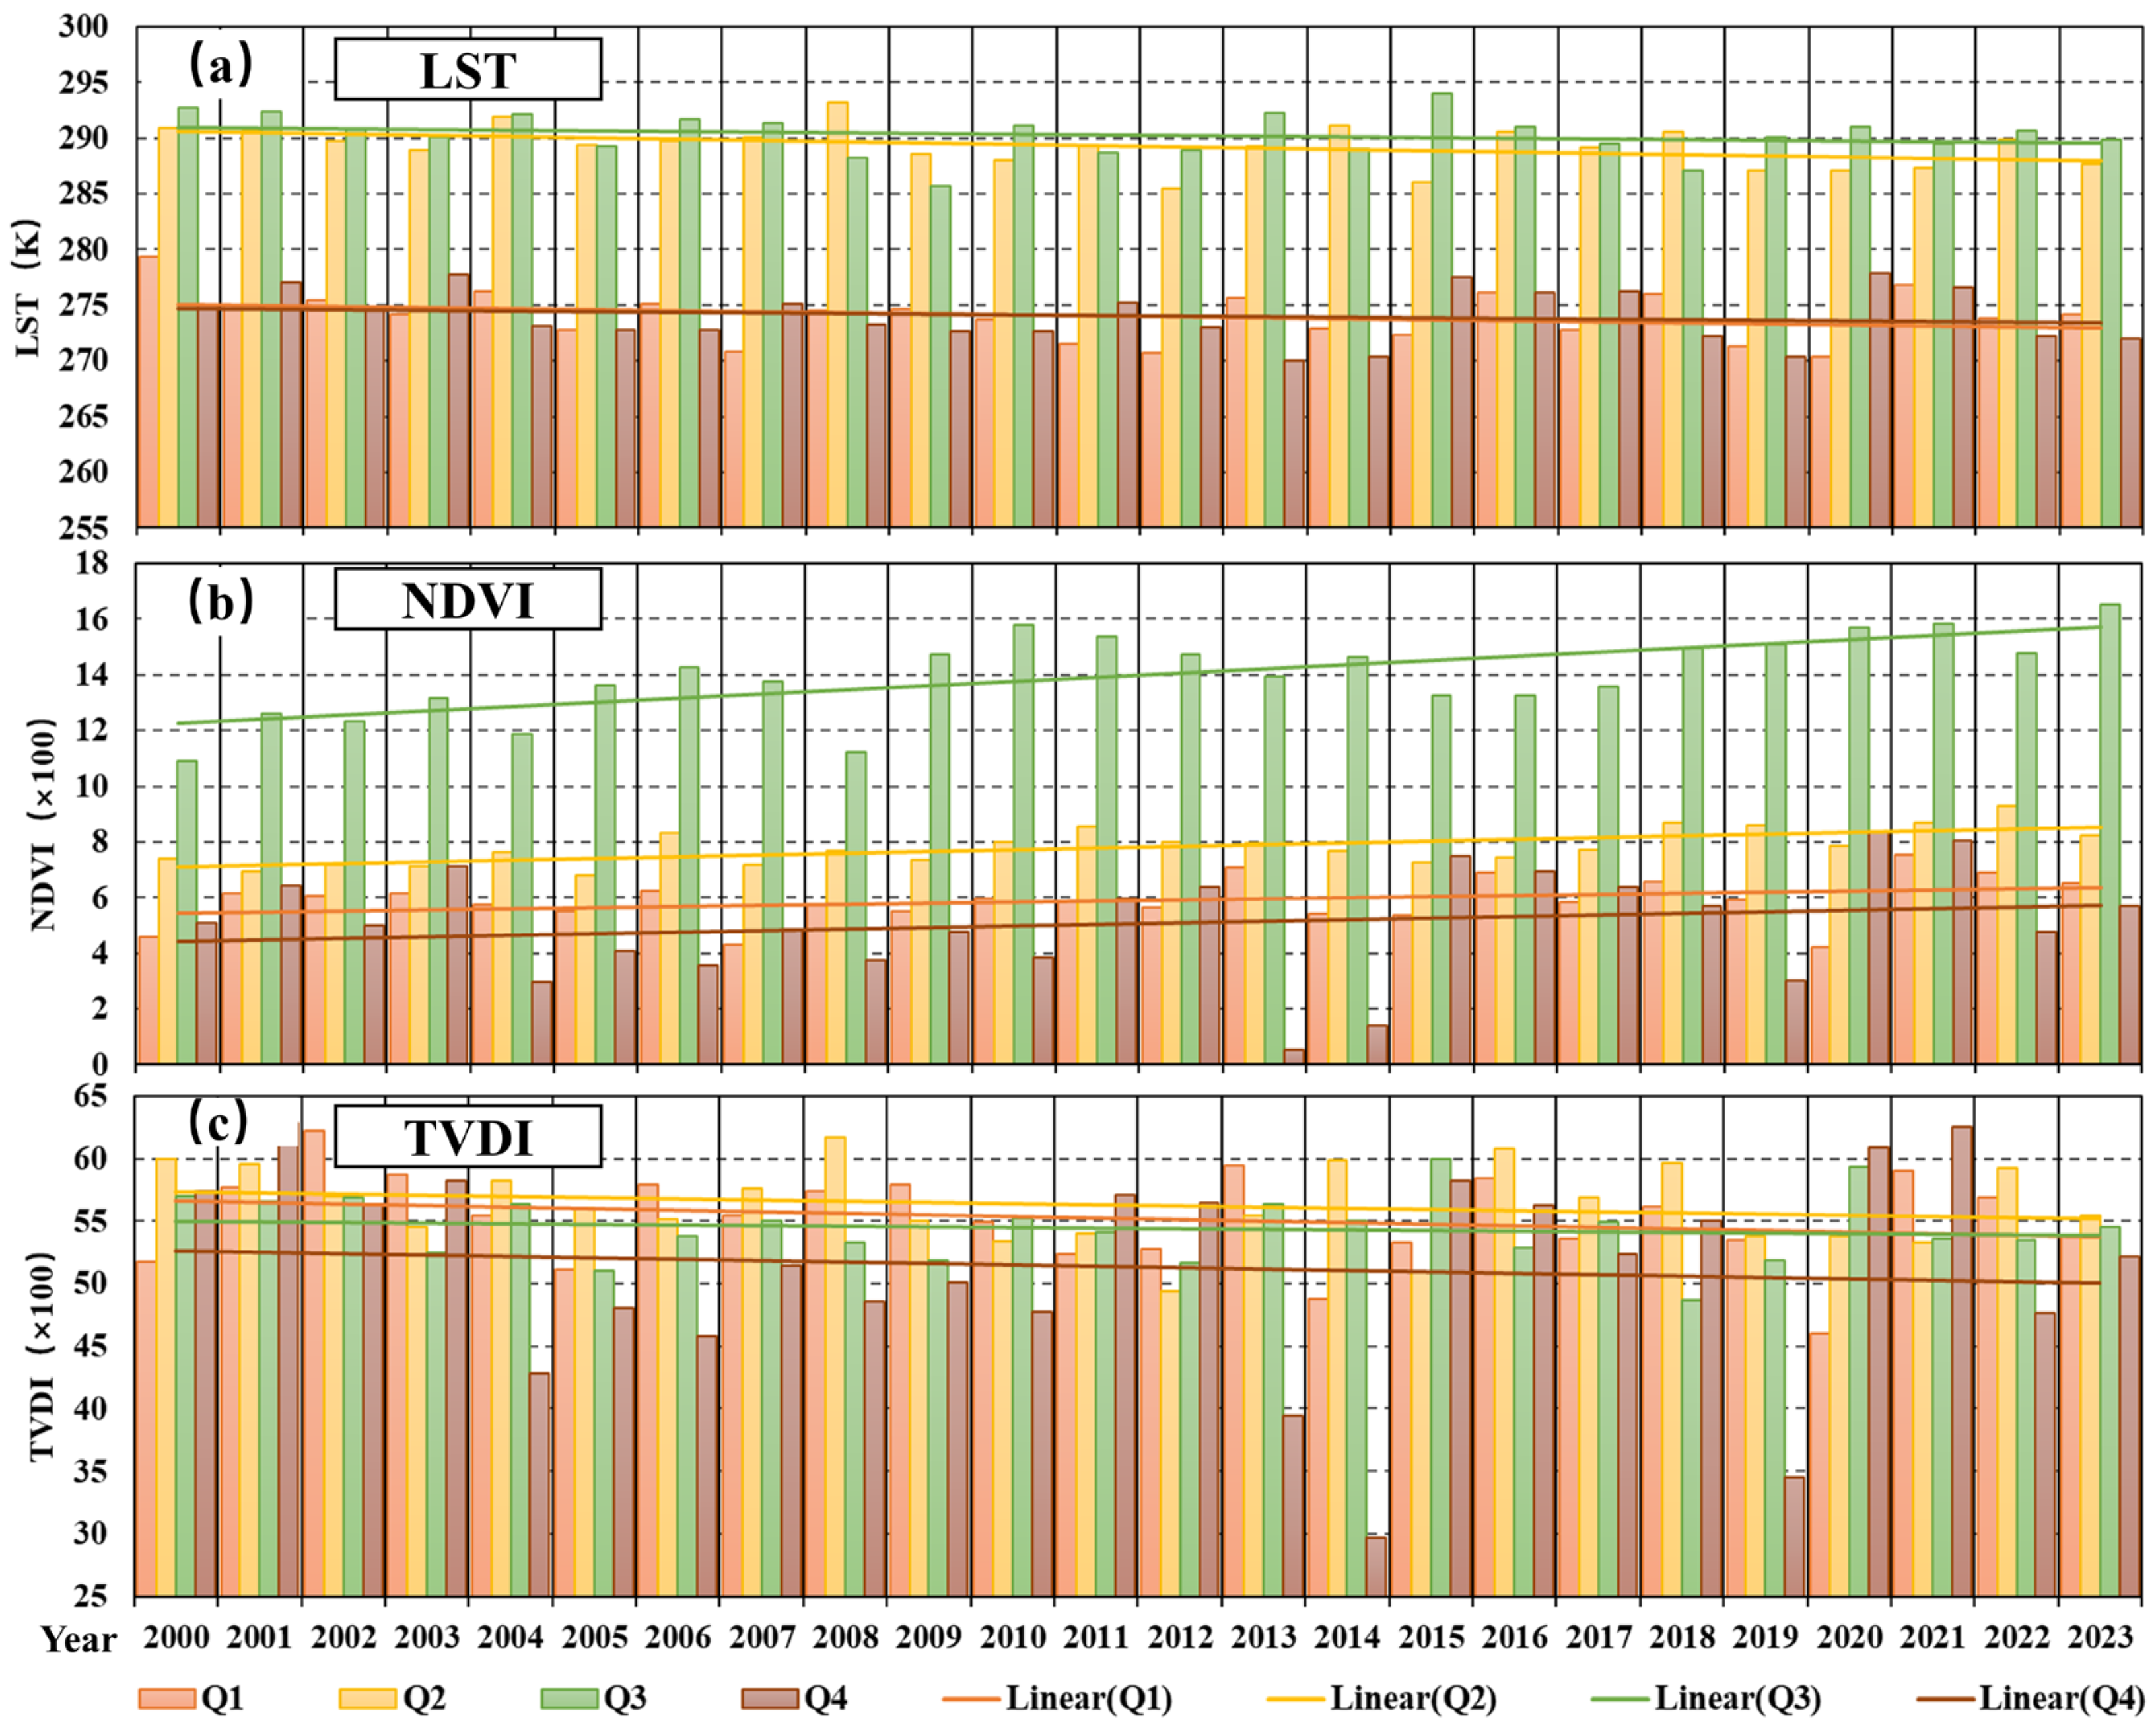
By calculating the average values of LST, NDVI, and TVDI in the Zonag-Salt Lake basin from 2000 to 2023, the temporal variations in these indices were obtained. As shown in Figure 8a, the average LST in the basin exhibits significant periodicity, with the highest temperatures occurring in Q2 and Q3 of each year. The maximum value was recorded in Q3 of 2015, with an average LST of 294.04 K (20.89 °C), while the minimum value occurred in Q4 of 2013, with an average LST of 269.9 K (−3.18 °C). Linear regression analysis of LST for each quarter reveals a declining trend in temperatures across all seasons. Q2 shows the most significant decline, reaching −0.12 °C/year, while Q4 exhibits the smallest decline, approximately −0.05 °C/year. Although an overall decreasing trend is observed in LST, the decline is not pronounced and shows relative stability across the study area. Considering the significant changes in water bodies before and after the outburst, the decrease in average LST may be related to the noticeable increase in surface water bodies in the study area.
In contrast to LST, the average NDVI in the study area shows an upward trend from 2000 to 2023. This upward trend is clearly reflected in Figure 8b when the average values in the basin are stretched (100× magnification). Among the four quarters, Q3 exhibits the largest increase in NDVI values, reaching 0.15/year, while Q4 shows the smallest increase, at 0.06/year. The minimum NDVI value occurred in Q4 of 2013, at 0.5, while the maximum value appeared in Q3 of 2023, at 16.54. The distribution of average NDVI values throughout the year shows significantly higher values in Q3 compared to other quarters, while Q1 and Q4 have relatively lower NDVI values. The rapid increase in NDVI values in Q3 compared to Q1 and Q4 indicates increasing vegetation differences across seasons over time.
Figure 8c illustrates the changes in TVDI of the study area (stretched 100 times). Between 2000 and 2023, the maximum TVDI value occurred in Q4 of 2001, at 62.8, while the minimum value appeared in Q4 of 2014, at 29.6. Unlike LST and NDVI, TVDI does not exhibit a distinct seasonal distribution, with significant fluctuations observed within the same quarter across different years. Overall, TVDI shows a decreasing trend in the study area, with the most pronounced decline observed in Q4, at −0.11/year, and the least decline observed in Q3, at −0.05/year.
In addition to the quarterly average values for the study area, the violin plots for the region also illustrate the temporal variation trends and data distribution (Figures S5–S7). Based on the data distribution and the median lines in the images, the LST and NDVI distributions are relatively concentrated, with the medians located at the peak of the data distribution. In contrast, the TVDI distribution is more dispersed, with most images lacking a distinct peak, and the median shows considerable fluctuation in Q4. Overall, the violin plots and the temporal medians for the study area reflect trends consistent with the mean values.

4.2.2. Spatially Analysis

The spatial variations in LST centroids across seasons show relatively minor fluctuations over the study period (Figure 9, Tables S1 and S4). In Q1, the centroid alternated between eastward and westward shifts, but by 2020 it returned close to its initial position, indicating overall stability. In Q2, the centroid migration was more concentrated, with only small oscillations around its original location. Q3 exhibited a generally westward movement with short-term reversals, ending about 330 m west of the 2000 centroid. In Q4, the centroid shifted eastward before 2010 and westward thereafter, yet remained within a few hundred meters of the initial position. The orientation angles of the standard deviation ellipses in all four seasons changed only slightly (within 0.05°), and oblateness remained stable at about 0.74, reflecting the persistence of the spatial distribution of LST.
The NDVI centroids displayed larger seasonal fluctuations compared to LST. In Q1, the centroid first shifted southwestward and later showed alternating east–west movements, with migration distances up to several kilometers. In Q2, the centroid mainly moved eastward before 2011, followed by pronounced westward shifts, with cumulative displacements of over 5 km, indicating substantial seasonal variability. Q3 centroids migrated north–south over shorter distances (hundreds of meters to ~1.6 km), while Q4 showed the most dramatic changes, with shifts exceeding 30 km during 2010–2015 and again between 2015 and 2023. The azimuths of standard deviation ellipses in Q1–Q3 were relatively stable (~94°), while Q4 exhibited noticeable fluctuations. Ellipse oblateness in all quarters remained in the range of 0.72–0.75, suggesting a generally consistent spatial structure of vegetation despite centroid shifts (Figure 10, Tables S2 and S5).
Compared with LST and NDVI, TVDI centroids demonstrated the widest migration ranges (Figure 11, Tables S3 and S6). In Q1, the centroid oscillated markedly, with displacements exceeding 20 km in some periods. Q2 showed smaller but still significant east–west shifts, reaching nearly 9 km by 2023. In Q3, the centroid remained near its original position until 2010, but later migrated up to 9 km westward, followed by smaller south–east shifts. Q4 displayed the greatest variability, with the centroid alternating between being 8 km east and more than 12 km west of its 2000 location. The orientation angles of ellipses varied moderately (91.6–94.5°), with Q3 showing the largest fluctuations. Ellipse oblateness across all seasons remained stable (~0.73–0.75), indicating that although centroid positions shifted considerably, the overall spatial pattern of dryness remained structurally consistent.

5. Discussion

5.1. The Climate Conditions Triggered the Surface Environmental Changes

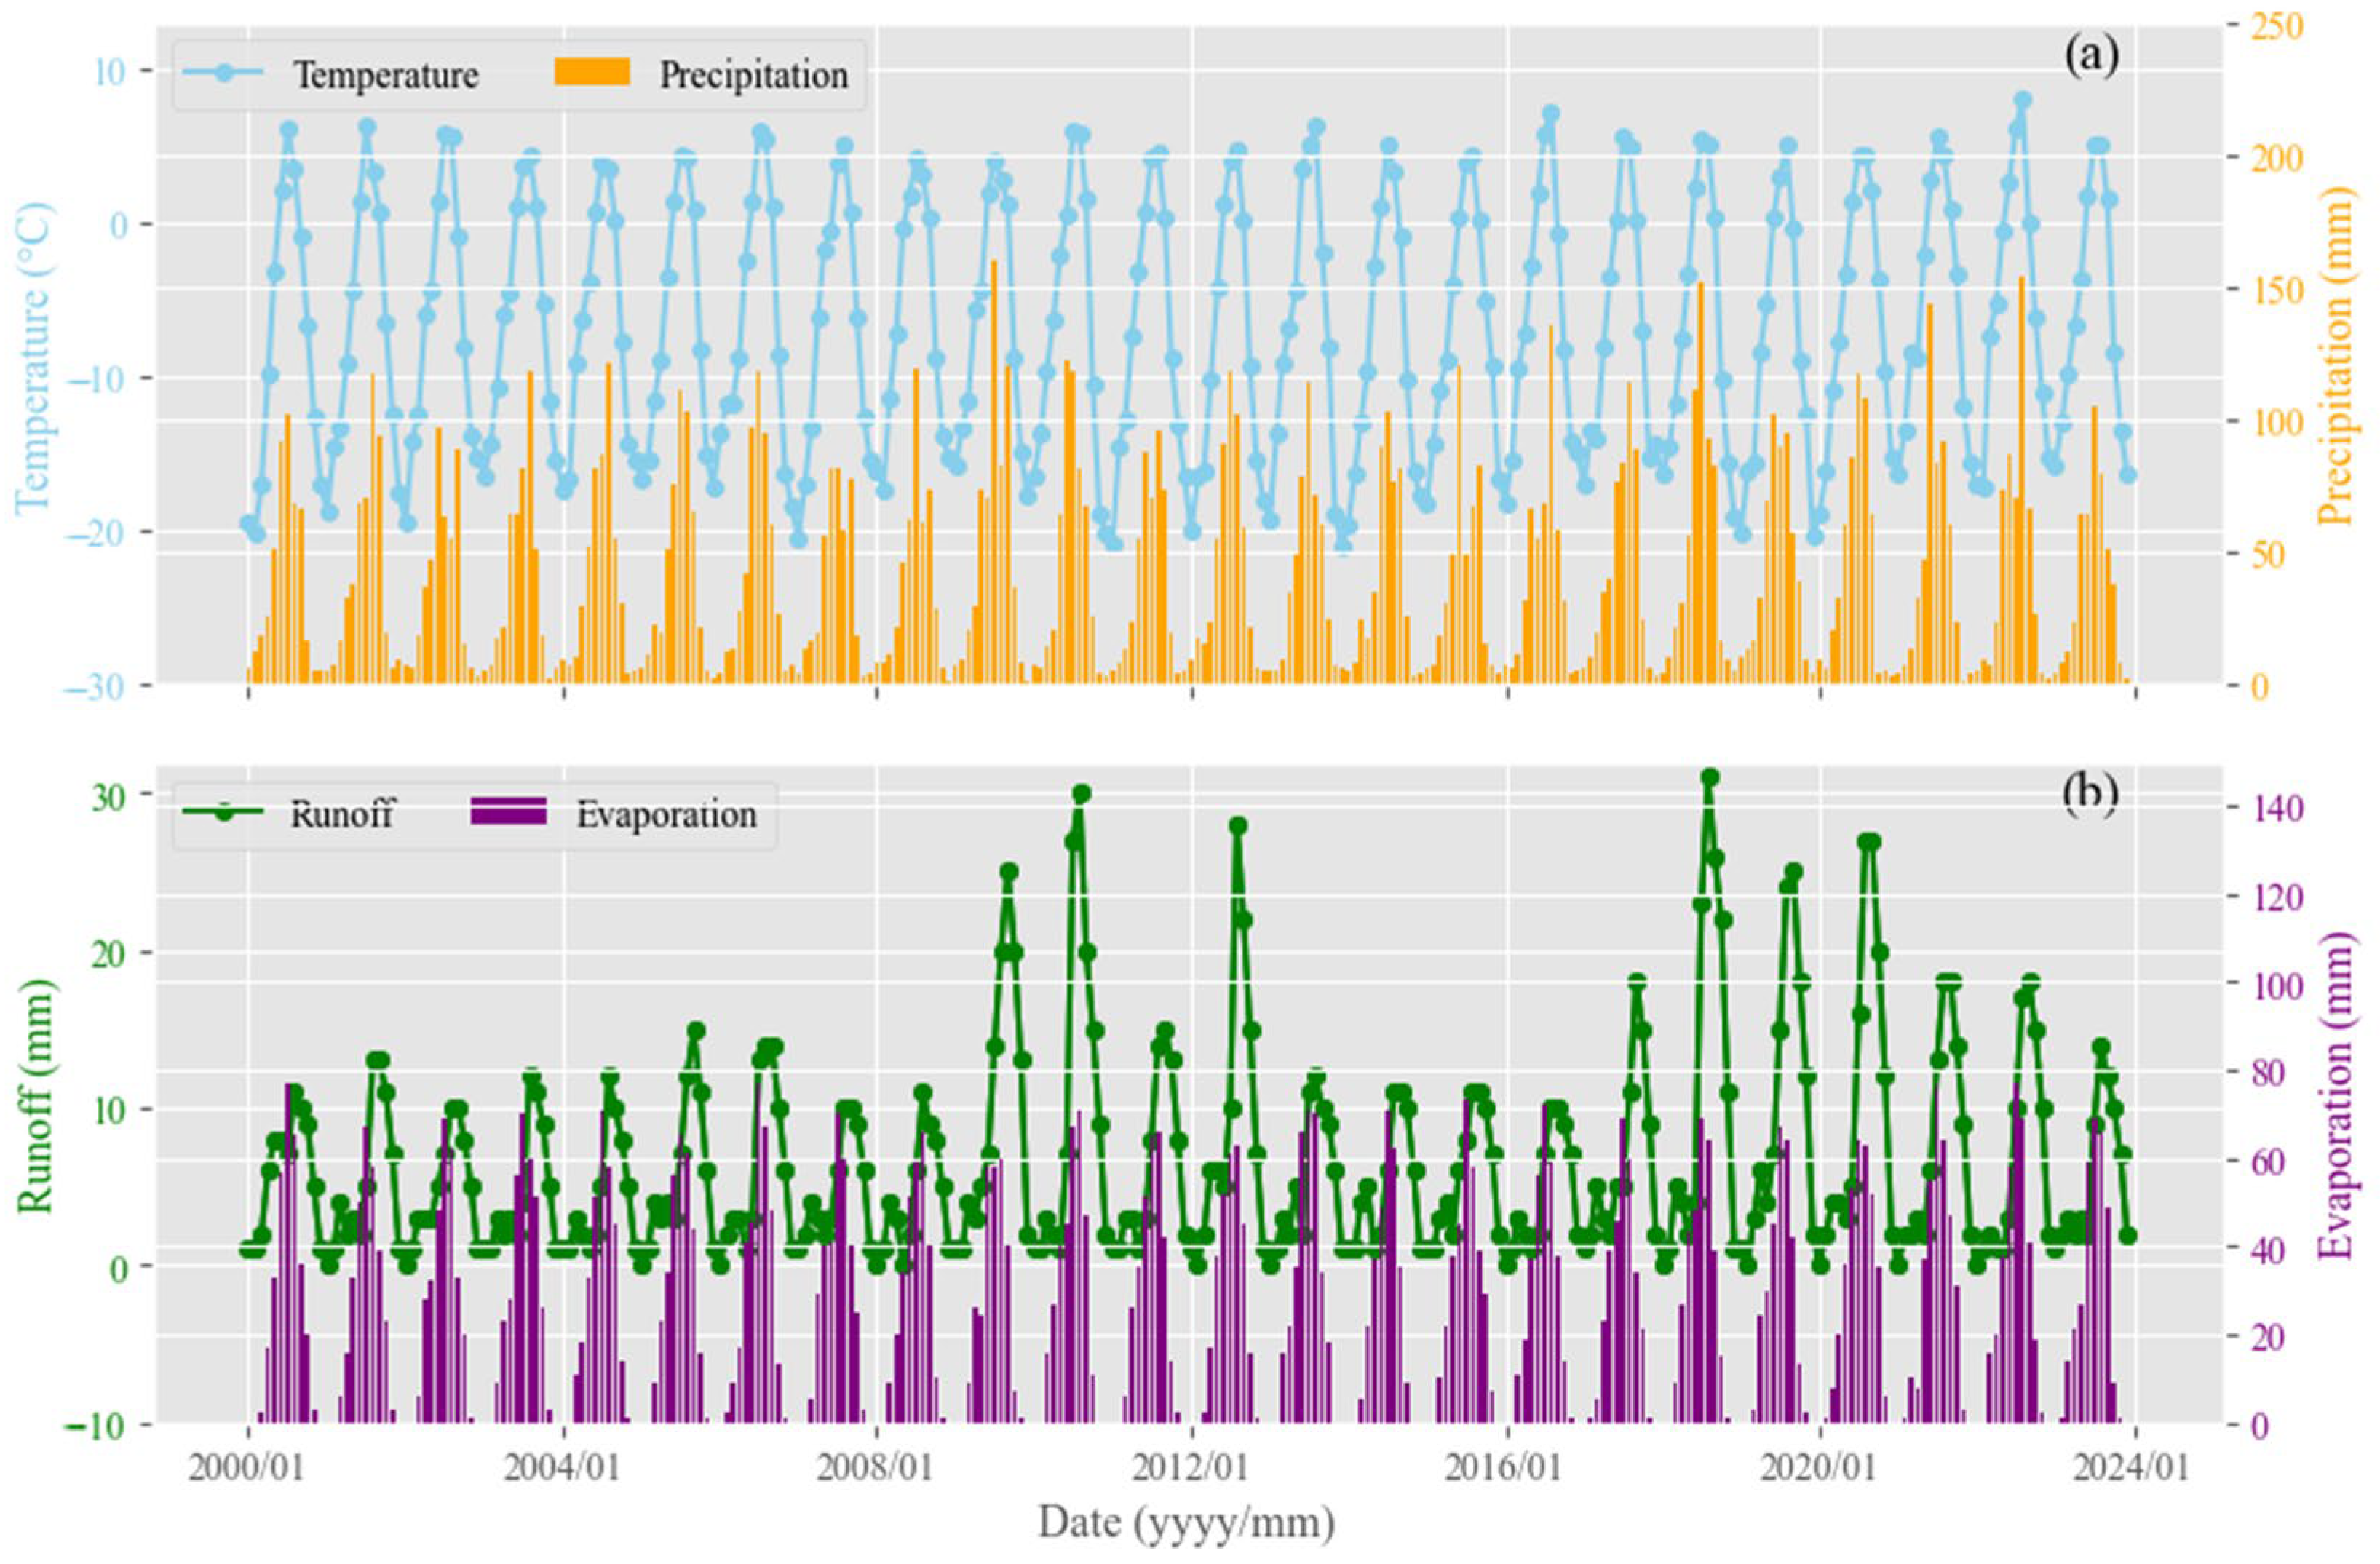
Climate and environmental factors profoundly influence changes in the Earth’s surface, especially in high-altitude regions like the Tibetan Plateau [39,40]. In lake areas within permafrost regions, temperature, precipitation, runoff, and evaporation have significant impacts on lake changes [17]. By focusing on the study area and limiting the study period, monthly data for four indicators—temperature, precipitation, runoff, and lake evaporation—were extracted from the ERA5-Land Monthly Aggregated dataset for the Zonag-Salt Lake Basin from 2000 to 2023 (Figure 12). ERA5-Land dataset incorporates improved land surface parameterizations and has been widely validated in high-altitude cold regions, including the QTP. These characteristics make it particularly suitable for capturing the climate variability that influences hydrological and permafrost dynamics in the study area. The figure shows that all four indicators exhibit noticeable seasonal variations. The maximum temperature was recorded at 7.9 °C in August 2022, with the minimum at −21.2 °C in December 2013. Precipitation peaked at 160 mm in July 2019, with many months recording less than 5 mm. Regarding surface runoff, the highest value was 31 mm in August 2018. Lake evaporation reached its maximum of 77 mm in July 2022. Notably, in the years surrounding the Zonag Lake outburst, surface runoff peaks were consistently above average levels, suggesting that increased surface runoff may have been one of the main factors contributing to the outburst of Zonag Lake. The outburst event subsequently caused local environmental changes, such as albedo changes, and led to the emergence of a ‘hot zone’ around the lake.
It is important to distinguish the effects of the regional climate background from the localized disturbance induced by the outburst event. The overall increase in NDVI in the Zonag–Salt Lake basin from 2000 to 2023 is broadly consistent with the regional climate warming and wetting trend across the QTP (Figure 12), which has promoted vegetation growth in many alpine ecosystems. By contrast, the outburst of Zonag Lake imposed heterogeneous local impacts: vegetation declines around the exposed lakebed due to drying and desertification, and vegetation enhancement near Salt Lake as a result of the wetter hydrological conditions. Therefore, while the long-term NDVI increase is primarily attributable to regional climate forcing, the outburst event superimposed spatially variable effects that shaped localized vegetation dynamics within the basin.

5.2. The Variance and Trend of Surface Environmental Changes in the Basin

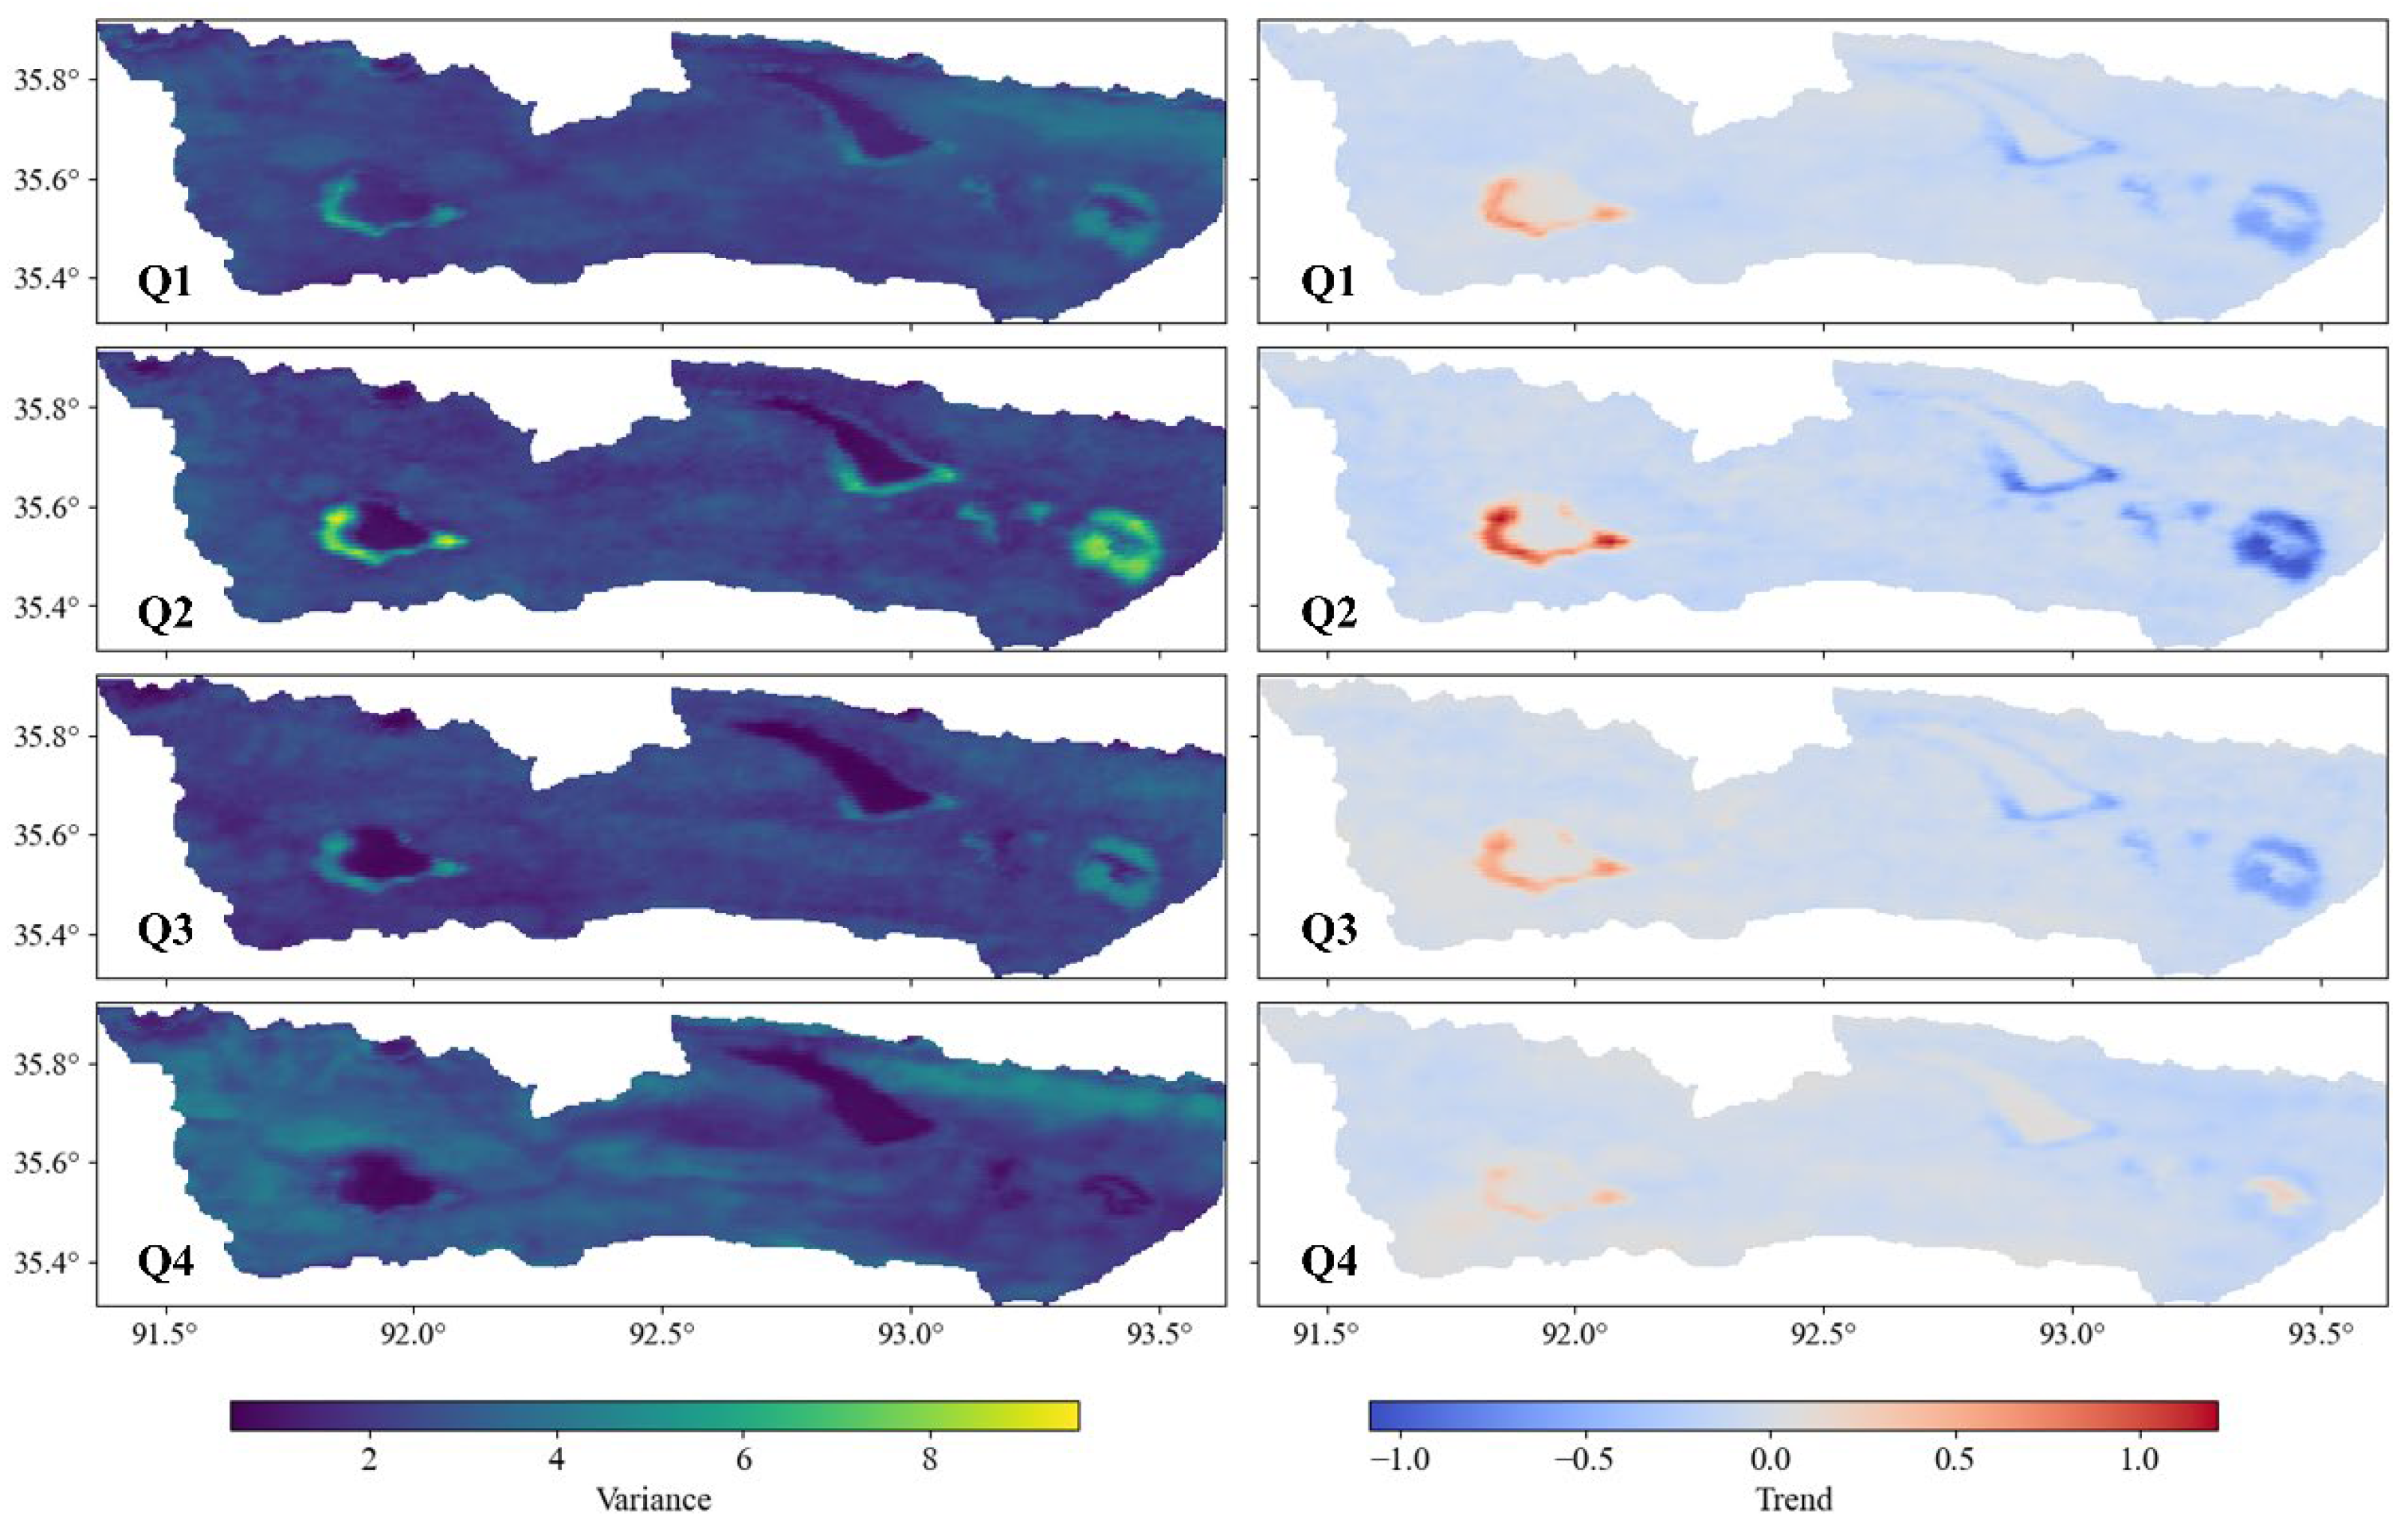
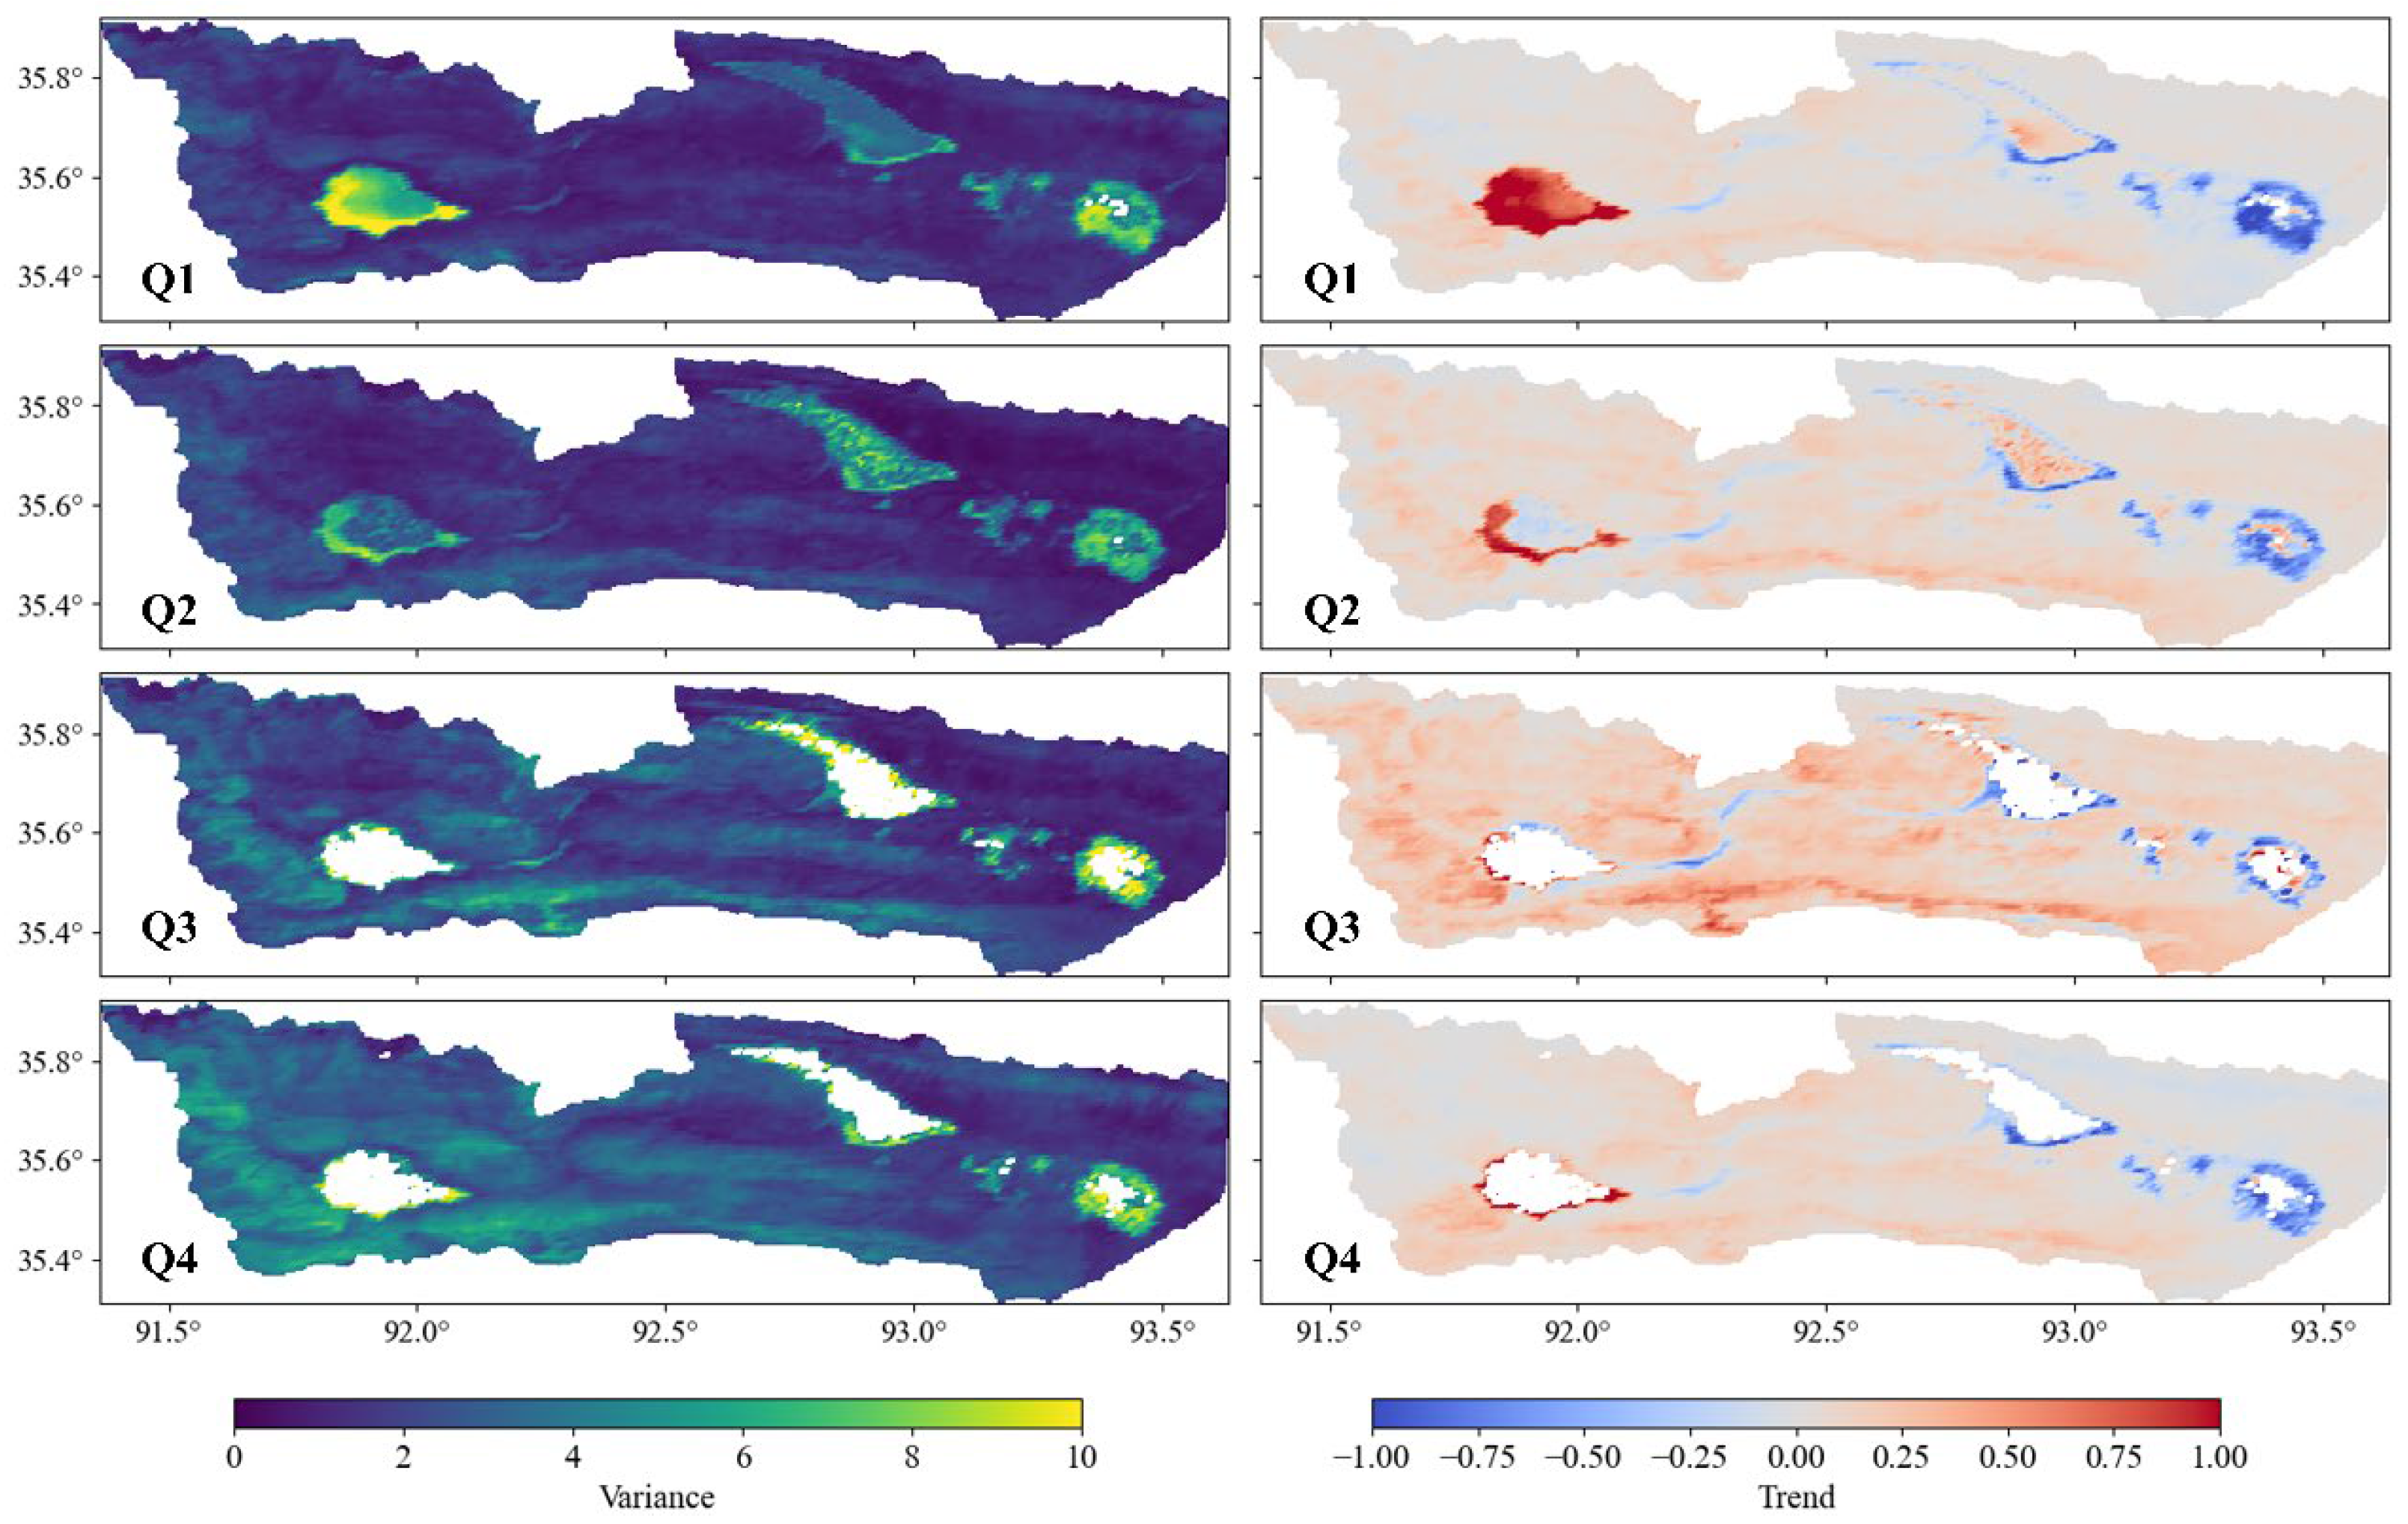
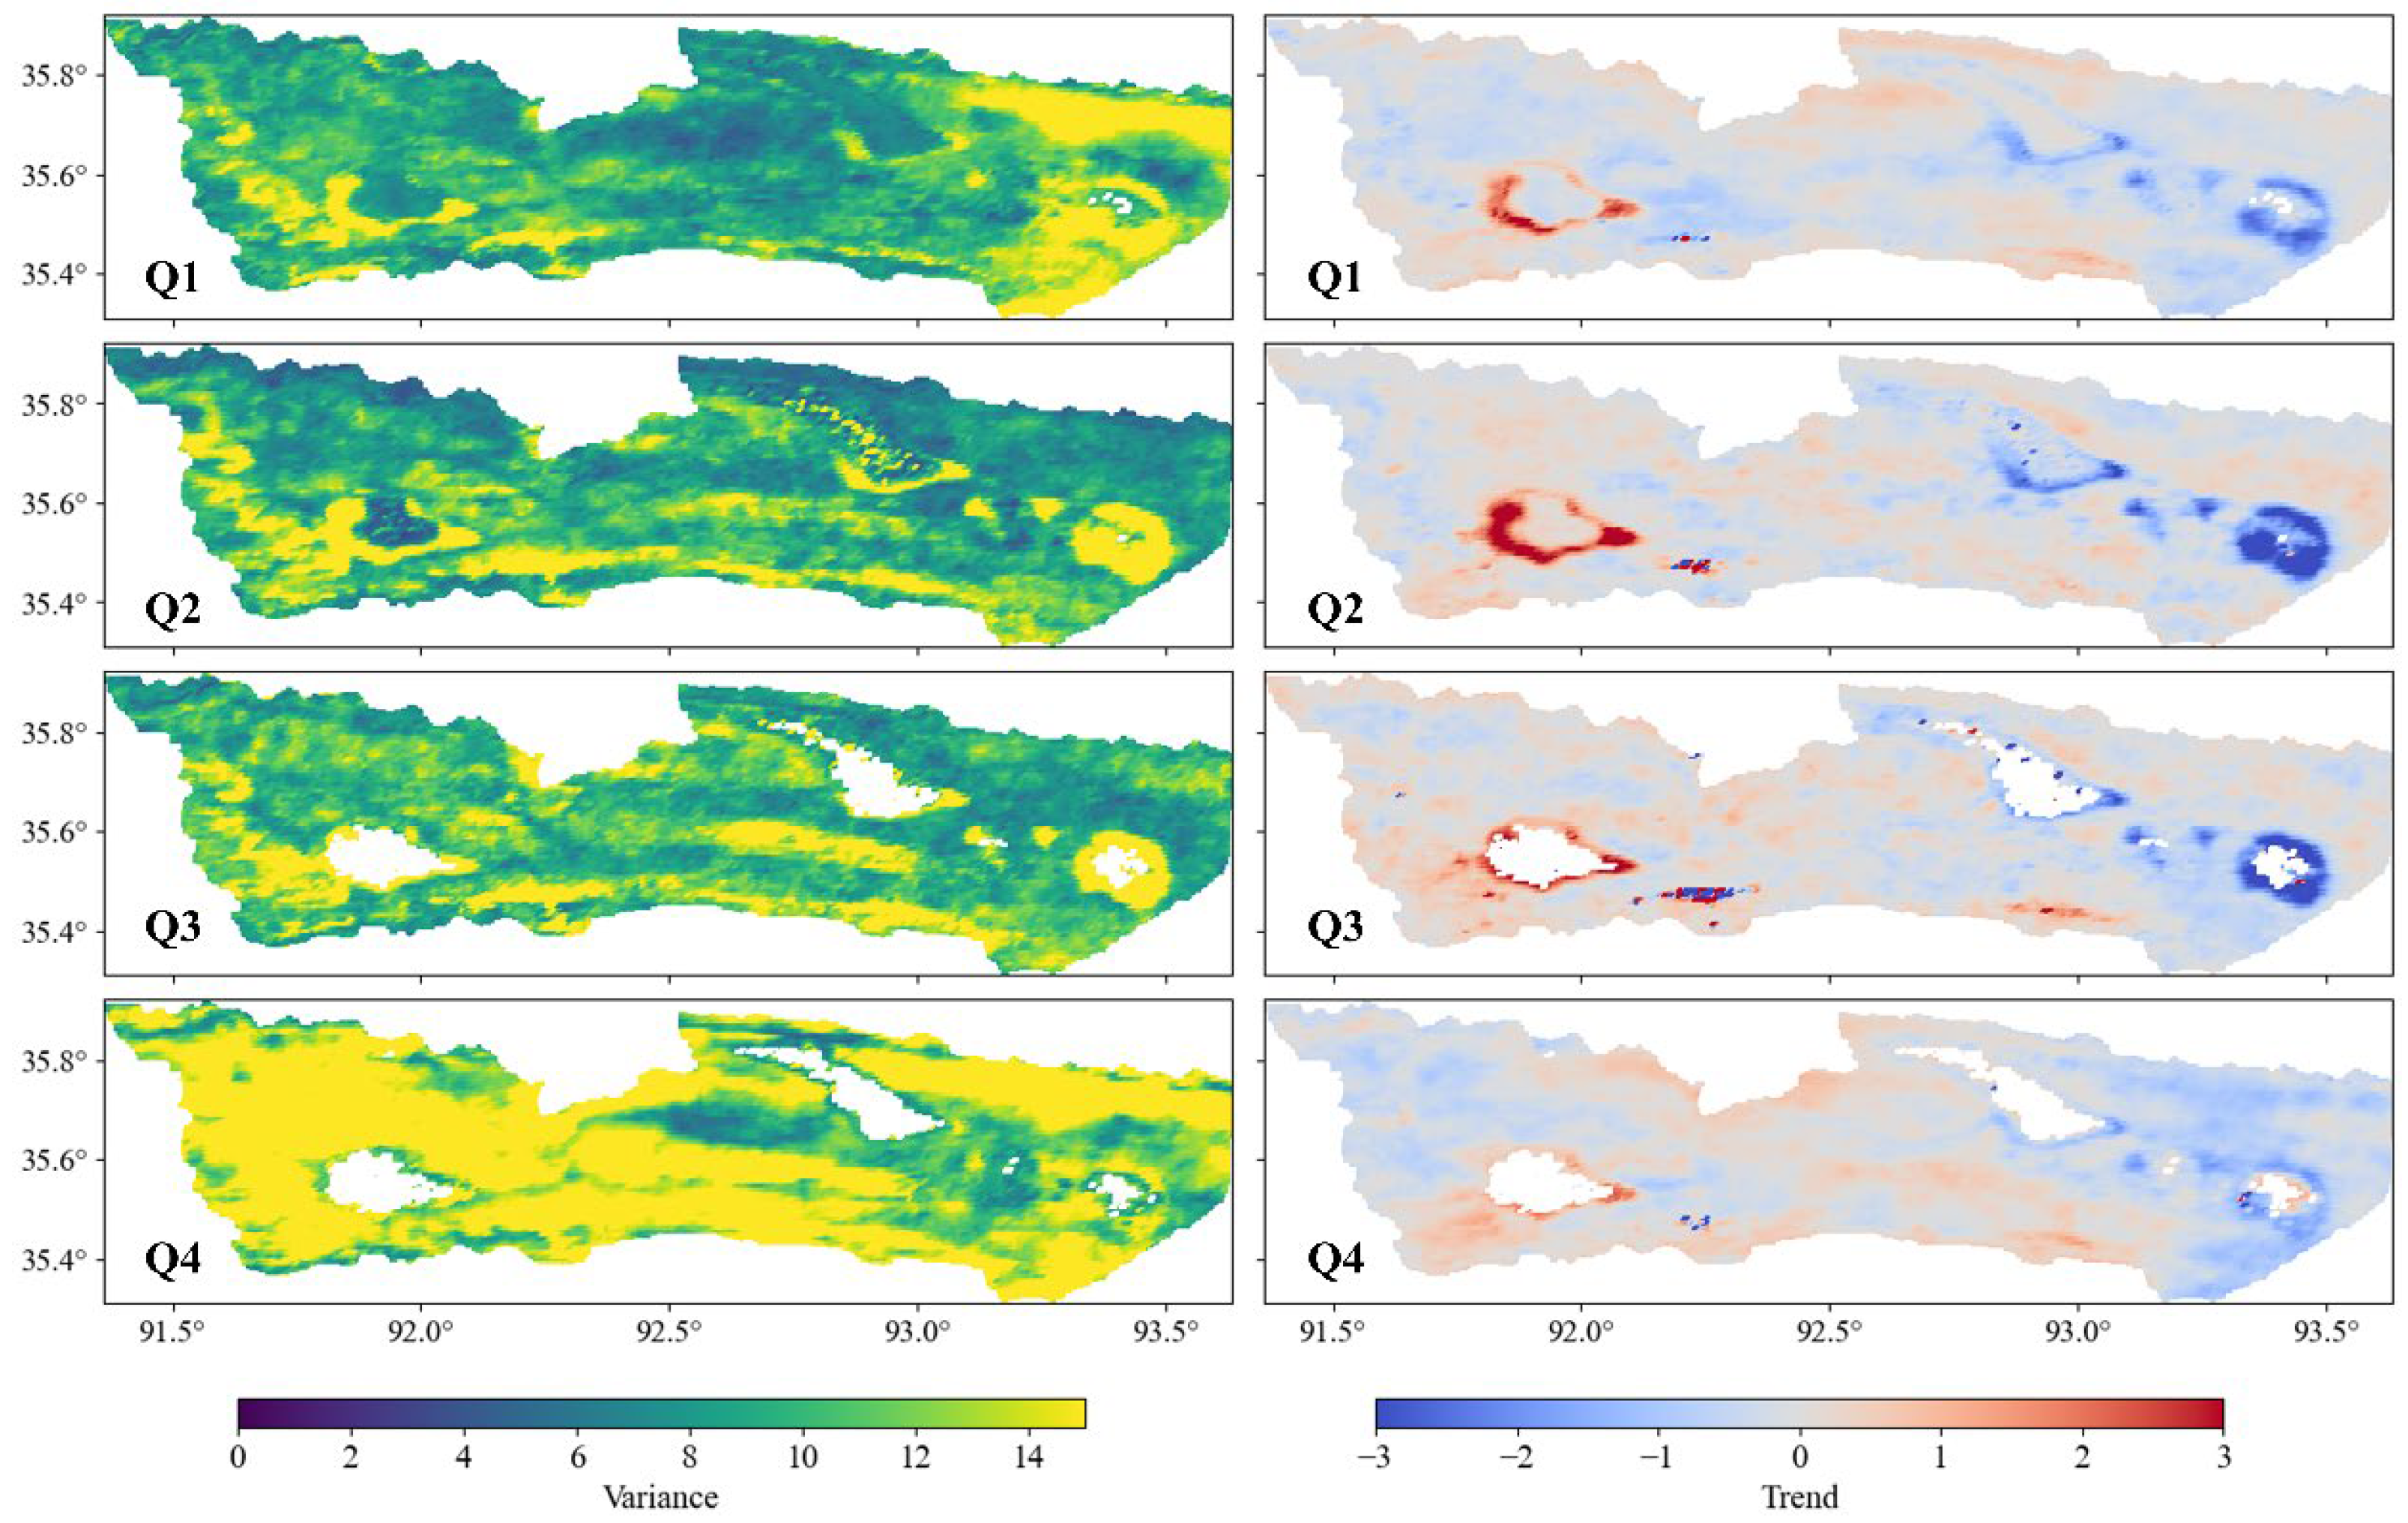
Permafrost is highly sensitive to environmental changes, and alterations in surface environmental conditions modify the thermal state of permafrost, thereby impacting its development. The outburst event in the Zonag-Salt Lake basin drastically altered the surface environment of the basin, bringing varying degrees of impact to the upstream and downstream lakes. Figure 13, Figure 14 and Figure 15 reveal the variance and trends across different spatial points in the study area for various quarters.
In addition to the general trends observed, the slight overall decrease in LST across the basin can be mechanistically explained by the expansion of Salt Lake following the Zonag Lake outburst. The continuous increase in the water surface area enhanced the evaporative cooling effect, thereby reducing the regional surface temperature. This cooling effect contrasts with the warming pattern observed around the exposed lakebed of Zonag Lake, where the newly formed “hot zone” promoted local surface heating and desertification. Such spatial heterogeneity reflects a coupled mechanism in which the retreat of the upstream lake promotes localized warming, while the expansion of the downstream terminal lake induces large-scale cooling. Therefore, the observed LST decline should be interpreted as the net result of the combined effects of lakebed exposure and evaporative cooling, highlighting the dual and contrasting roles of outburst-induced hydrological redistribution in shaping the thermal environment of permafrost basins.
Regarding LST variance and trends, the most noticeable changes occur near the upstream Zonag Lake and the downstream Salt Lake, with the trend being particularly pronounced in Q2. Near Zonag Lake, there is a significant increasing trend, while around the Salt Lake, a significant decreasing trend is observed (Figure 13). Similarly, NDVI shows a significant upward trend near Zonag Lake and a significant downward trend around the outflow lakes (Kusai Lake, Haidingnor Lake) and the downstream Salt Lake, with an overall noticeable upward trend in Q3 (Figure 14). TVDI exhibits high variance, particularly around Zonag Lake and the Salt Lake, showing a positive high-variance trend near Zonag Lake and a negative high-variance trend near the Salt Lake, with these trends being especially evident in Q2 and Q3 (Figure 15).
Overall, considering the variance and trends of each index, the areas most affected are the upstream Zonag Lake, which experienced the outburst, and the downstream terminal Salt Lake, with the areas around the Kusai Lake and Haidingnor Lakes also being relatively significantly impacted.
The variance and trend of the Zonag-Salt Lake basin reveal that the most drastic surface environmental changes occur around Zonag Lake and Salt Lake. As the breach lake, Zonag Lake exposed part of the lakebed to the air, forming a hot zone around the lake and becoming a source of aeolian sand [41]. This has caused local desertification around the lake, which could facilitate the development of permafrost [39]. In contrast, Salt Lake, as the main lake receiving overflow water, has experienced a wetter environment, which could accelerate permafrost degradation [40,41].

5.3. Broader Ecological, Climatic, and Engineering Implications

Beyond describing the observed trends, these patterns can be mechanistically explained by linking them to permafrost processes and surface hydrology. For instance, the vegetation recovery near Salt Lake likely reflects wetter conditions due to water redistribution, while vegetation decline around the exposed lakebed is associated with drying and enhanced permafrost thaw. Likewise, changes in LST and TVDI indicate the role of thawing–refreezing cycles in altering soil moisture and surface temperature, which collectively shape localized ecological responses.
The findings on the localized impacts of the lake outburst in the Zonag–Salt Lake basin can also be situated within the broader context of lake outburst and thermokarst phenomena observed in other high-altitude and cold-region ecosystems. Similar cases on the Tibetan Plateau, as well as thermokarst and permafrost degradation in Arctic regions, show comparable patterns of vegetation shifts, hydrological redistribution, and permafrost dynamics [42,43,44,45]. These comparisons suggest that climate-induced disturbances, such as lake outbursts, are globally significant, with potential implications for ecosystems in other high-altitude or permafrost-affected regions. By placing our results in this global perspective, we emphasize their relevance for understanding climate change impacts on cold-region ecosystems.
Furthermore, the ecological consequences observed here also carry potential engineering implications. The expansion of the exposed lakebed, intensified desertification, and downstream channel erosion not only alter local ecological conditions but also increase the risk of a potential Salt Lake outburst. Previous research has suggested that such processes may pose threats to regional infrastructure, including the Qinghai–Tibet Railway. Our findings, which reveal vegetation degradation, elevated LST, and increasing dryness around the exposed lakebed, provide ecological evidence that complements these engineering risk assessments. Together, they underscore the need to integrate ecological and engineering perspectives when evaluating the long-term impacts of lake outburst events in permafrost regions.

6. Conclusions

The expansion and outburst events of lakes on the QTP have significantly impacted the local environment. Particularly of note, the outburst of Zonag Lake in the permafrost region in 2011 not only altered the surface distribution of the lake’s water body, but it also affected the permafrost status within the basin. In this study, by using remote sensing platforms and GIS tools, the local surface environmental changes in the Zonag-Salt Lake basin have been analyzed spatially and temporally. The following conclusions were drawn:
  • Analysis of LST and NDVI extracted from satellite data revealed the emergence of a “hot zone” in the post-outburst Zonag Lake area, indicating higher surface temperatures compared to surrounding land. Additionally, reduced vegetation cover due to the exposed lakebed negatively impacted vegetation development in this region.
  • Calculation of the TVDI showed significantly higher dryness indexes in downstream areas of Zonag Lake, such as from Kusai Lake to Salt Lake, compared to the upstream Zonag Lake area.
  • Temporal analysis indicated a declining trend in average LST despite seasonal fluctuations, while NDVI values showed an increasing trend from 2000 to 2023, indicating an improvement in vegetation conditions in the region.
  • Analysis of geographical centroid shifts in environmental indexes across different seasons revealed varying migration directions and distances during specific time periods, which are linked to seasonal climate changes and the outburst event.
  • The surface environmental changes could lead to different variations in permafrost. The local desertification around Zonag Lake accelerates permafrost development, while the wetting environment around Salt Lake could cause permafrost degradation.
In summary, the outburst of Zonag Lake has not only altered the lake pattern and permafrost conditions in a specific area of the QTP but also profoundly impacted the surface environment in the region. These findings are crucial for understanding the ecological responses of high-altitude regions under the backdrop of global warming and may provide insights for future environmental conservation and resource management efforts.
This study has certain limitations that should be acknowledged. Although MODIS images provide consistent and long-term observations suitable for basin-scale analyses, their relatively coarse spatial resolution limits the ability to capture fine-scale processes around individual lakes, such as localized vegetation recovery or permafrost dynamics. Moreover, the analysis relies primarily on remote sensing indices (LST, NDVI, and TVDI) without incorporating ground-based validation, which may introduce uncertainties in the interpretation of ecological and hydrological responses. Future research should therefore combine MODIS-based results with higher-resolution satellite imagery (e.g., Landsat, Sentinel) for improved spatial detail, and integrate extensive field measurements of vegetation, soil moisture, and permafrost conditions to strengthen validation. Such combined approaches will provide more comprehensive and robust insights into the ecological and hydrological consequences of lake outburst events in permafrost regions.

Supplementary Materials

The following supporting information can be downloaded at: https://www.mdpi.com/article/10.3390/rs17193392/s1, Figure S1: The LST of each quarter from 2000 to 2023; Figure S2: The NDVI of each quarter from 2000 to 2023; Figure S3: The TVDI of each quarter from 2000 to 2023; Figure S4: Dry and wet edges of each quarter from 2000 to 2023; Figure S5: Time series of LST from 2000 to 2023 in violin chart; Figure S6: Time series of NDVI from 2000 to 2023 in violin chart; Figure S7: Time series of TVDI from 2000 to 2023 in violin chart; Table S1: The Line Azimuth and Length of LST; Table S2: The Line Azimuth and Length of NDVI; Table S3: The Line Azimuth and Length of TVDI; Table S4: The Line Azimuth and Oblateness of LST; Table S5: The Line Azimuth and Oblateness of NDVI; Table S6: The Line Azimuth and Oblateness of TVDI; Table S7: The equation coefficients of the dry and wet edges from 2000 to 2023.

Author Contributions

Conceptualization, Y.M. and F.N.; methodology, S.Z. and Z.D.; software, S.Z., S.W. and Z.D.; validation, Y.M.; formal analysis, Y.M.; investigation, S.Z., S.W. and Z.D.; resources, Y.M.; data curation, S.Z. and Z.D.; writing—original draft preparation, S.Z.; writing—review and editing, Y.M. and F.N.; visualization, S.Z.; funding acquisition, Y.M. and S.Z. All authors have read and agreed to the published version of the manuscript.

Funding

This research was funded by the Science and Technology Program of Gansu Province (grant numbers 23ZDFA017 and 22ZD6FA004), Science and Technology Program of Gansu Province (grant number 25JRRA535), National Natural Science Foundation of China (grant number 42201149), and Natural Science Foundation of Hunan Province of China (grant number 2024JJ6023).

Data Availability Statement

The raw data used in this study and figures in this paper are publicly available from the sources provided in the following links. The processed data generated from this study will be made available upon request. MOD11A2 and MOD13A2 data: https://lpdaac.usgs.gov/ (accessed on 30 June 2024), SRTM data: https://earthexplorer.usgs.gov/ (accessed on 30 June 2024), Figures: https://data.mendeley.com/datasets/ftvf398znk/1 (accessed on 30 June 2024).

Acknowledgments

We sincerely appreciate the editors and reviewers of this journal for their valuable suggestions on this manuscript.

Conflicts of Interest

The authors declare no conflicts of interest.

References

  1. Zhang, G.Q.; Luo, W.; Chen, W.F.; Zheng, G.X. A robust but variable lake expansion on the Tibetan Plateau. Sci. Bull. 2019, 64, 1306–1309. [Google Scholar] [CrossRef]
  2. Ma, R.; Yang, G.; Duan, H.; Jiang, J.; Wang, S.; Feng, X.; Li, A.; Kong, F.; Xue, B.; Wu, J.; et al. China’s lakes at present: Number, area and spatial distribution. Sci. China Earth Sci. 2011, 54, 283–289. [Google Scholar] [CrossRef]
  3. Zhang, G.; Yao, T.; Piao, S.; Bolch, T.; Xie, H.; Chen, D.; Gao, Y.; O’Reilly, C.M.; Shum, C.K.; Yang, K.; et al. Extensive and drastically different alpine lake changes on Asia’s high plateaus during the past four decades. Geophys. Res. Lett. 2017, 44, 252–260. [Google Scholar] [CrossRef]
  4. Ke, X.M.; Wang, W.; Niu, F.j.; Gao, Z.Y.; Huang, W.K.; Cao, H.K. Thermokarst lakes disturb the permafrost structure and stimulate through-talik formation in the Qinghai–Tibet Plateau, China: A hydrogeophysical investigation. EGUsphere, 2025; preprint. [Google Scholar] [CrossRef]
  5. Yao, T.; Thompson, L.; Yang, W.; Yu, W.; Gao, Y.; Guo, X.; Yang, X.; Duan, K.; Zhao, H.; Xu, B.; et al. Different glacier status with atmospheric circulations in Tibetan Plateau and surroundings. Nat. Clim. Chang. 2012, 2, 663–667. [Google Scholar] [CrossRef]
  6. Zhang, G.Q.; Bolch, T.; Chen, W.F.; Crétaux, J.F. Comprehensive estimation of lake volume changes on the Tibetan Plateau during 1976–2019 and basin-wide glacier contribution. Sci. Total Environ. 2021, 772, 145463. [Google Scholar] [CrossRef]
  7. Zhang, Y.S.; Ohata, T.; Kadota, T. Land-surface hydrological processes in the permafrost region of the eastern Tibetan Plateau. J. Hydrol. 2003, 283, 41–56. [Google Scholar] [CrossRef]
  8. Wang, W.; Xiang, Y.; Gao, Y.; Lu, A.; Yao, T. Rapid expansion of glacial lakes caused by climate and glacier retreat in the central Himalayas. Hydrol. Process. 2015, 29, 859–874. [Google Scholar] [CrossRef]
  9. Richardson, S.D.; Reynolds, J.M. An overview of glacial hazards in the Himalayas. Quat. Int. 2000, 65–66, 31–47. [Google Scholar] [CrossRef]
  10. Shugar, D.H.; Burr, A.; Haritashya, U.K.; Kargel, J.S.; Watson, C.S.; Kennedy, M.C.; Bevington, A.R.; Betts, R.A.; Harrison, S.; Strattman, K. Rapid worldwide growth of glacial lakes since 1990. Nat. Clim. Chang. 2020, 10, 939–945. [Google Scholar] [CrossRef]
  11. Cheng, Z.L.; Tian, J.C.; Zhang, Z.B.; Qiang, B. Debris flow induced by glacial-lake break in southeast Tibet. Earth Sci. Front. 2009, 16, 207–214. [Google Scholar] [CrossRef]
  12. Cui, P.; Dang, C.; Cheng, Z.L.; Scott, K.M. Debris flows resulting from glacial-lake outburst floods in Tibet, China. Phys. Geogr. 2010, 31, 508–527. [Google Scholar] [CrossRef]
  13. Liu, J.J.; Tang, C.; Cheng, Z.L.; Liu, Y. Impact of temperature on glacier-lake outbursts in Tibet. J. Jilin Univ. Earth Sci. Ed. 2011, 41, 1121–1129. [Google Scholar] [CrossRef]
  14. Liu, W. Preliminary study on debris flow induced by glacier lake outburst in Tibet. Hydrogeol. Eng. Geol. 2006, 3, 88–92. [Google Scholar] [CrossRef]
  15. Xu, D.M.; Feng, Q.H. Dangerous glacial lake and outburst features in Xizang Himalayas. Acta Geogr. Sin. 1989, 3, 343–351. [Google Scholar] [CrossRef]
  16. Xu, D. Characteristics of debris flow caused by outburst of glacial lake in Boqu River, Xizang, China, 1981. GeoJournal 1988, 17, 569–580. [Google Scholar] [CrossRef]
  17. Luo, D.L.; Jin, H.J.; Du, H.Q.; Li, C.; Ma, Q.; Duan, S.Q.; Li, G.S. Variation of alpine lakes from 1986 to 2019 in the headwater area of the Yellow River, Tibetan Plateau using Google Earth Engine. Adv. Clim. Chang. Res. 2020, 11, 11–21. [Google Scholar] [CrossRef]
  18. Lin, Z.; Niu, F.; Liu, H.; Lu, J. Hydrothermal processes of alpine tundra lakes, Beiluhe Basin, Qinghai-Tibet Plateau. Cold Reg. Sci. Technol. 2011, 65, 446–455. [Google Scholar] [CrossRef]
  19. Lin, Z.; Niu, F.; Luo, J.; Liu, M.; Yin, G. Thermal regime at bottom of thermokarst lakes along Qinghai-Tibet Engineering Corridor. Earth Sci. 2015, 40, 179–188. [Google Scholar] [CrossRef]
  20. Lin, Z.J.; Niu, F.J.; Xu, Z.Y.; Wang, P. Thermal regime of a thermokarst lake and its influence on permafrost, Beiluhe Basin, Qinghai-Tibet Plateau. Permafr. Periglac. Process. 2010, 21, 315–324. [Google Scholar] [CrossRef]
  21. Wen, Z.; Zhelezniak, M.; Wang, D.Y.; Ma, W.; Wu, Q.; Yang, Z.; Zhirkov, A.; Gao, Q. Thermal interaction between a thermokarst lake and a nearby embankment in permafrost regions. Cold Reg. Sci. Technol. 2018, 155, 214–224. [Google Scholar] [CrossRef]
  22. Niu, F.J.; Cheng, G.D.; Shi, Y.Y.; Yin, G.A.; Luo, J. Permafrost and stability of the major linear engineering in the pan-Arctic region. J. Earth Sci. Environ. 2021, 43, 587–603. [Google Scholar] [CrossRef]
  23. Ma, W.; Zhou, G.Q.; Niu, F.J.; Mu, Y.H. Progress and prospect of the basic research on the major permafrost projects in the Qinghai-Tibet Plateau. China Basic Sci. 2016, 18, 9–19. [Google Scholar] [CrossRef]
  24. Mu, Y.H.; Ma, W.; Li, G.Y.; Niu, F.; Liu, Y.; Mao, Y. Impacts of supra-permafrost water ponding and drainage on a railway embankment in continuous permafrost zone. Cold Reg. Sci. Technol. 2018, 154, 23–31. [Google Scholar] [CrossRef]
  25. Niu, F.J.; Dong, S.; Lin, Z.J.; Lu, J.; Luo, J. Distribution of thermokarst lakes and its thermal influence on permafrost along Qinghai-Tibet Highway. Adv. Earth Sci. 2013, 28, 695–702. [Google Scholar] [CrossRef]
  26. Ding, Z.K.; Niu, F.J.; Li, G.Y.; Mu, Y.; Chai, M.; He, P. The outburst of a lake and its impacts on redistribution of surface water bodies in high-altitude permafrost region. Remote Sens. 2022, 14, 2918. [Google Scholar] [CrossRef]
  27. Liu, W.H.; Xie, C.W.; Zhao, L.; Wu, T.H.; Wang, W.; Zhang, Y.X.; Yang, G.Q.; Zhu, X.F.; Yue, G.Y. Dynamic changes in lakes in the Hoh Xil region before and after the 2011 outburst of Zonag Lake. J. Mt. Sci. 2019, 16, 1098–1110. [Google Scholar] [CrossRef]
  28. Ding, Z.K.; Niu, F.J.; Mu, Y.H.; Li, G.; Chai, M.; Gao, Z.; Chen, L.; Zhang, K.; Mao, Y. Dynamic variations in thermal regime and surface deformation along the drainage channel for an expanding lake on the Tibetan Plateau. GIScience Remote Sens. 2023, 60, 2266661. [Google Scholar] [CrossRef]
  29. Liu, W.; Xie, C.; Wang, W.; Yang, G.; Zhang, Y.; Wu, T.; Liu, G.; Pang, Q.; Zou, D.; Liu, H. The Impact of Permafrost Degradation on Lake Changes in the Endorheic Basin on the Qinghai–Tibet Plateau. Water 2020, 12, 1287. [Google Scholar] [CrossRef]
  30. Liu, W.; Xie, C.; Wang, W.; Zhang, Y.; Yang, G.; Liu, G. Analysis on expansion trend and outburst risk of the Yanhu Lake in Hoh Xil region, Qinghai-Tibet Plateau. J. Glaciol. Geocryol. 2019, 41, 1467–1474. [Google Scholar] [CrossRef]
  31. Ding, Z.K.; Niu, F.J.; Mu, Y.H.; He, P.; Gao, Z.; Fan, X. Primarily investigation with multiple methods on permafrost state around a rapid change lake in the interior of the Tibet Plateau. Environ. Res. Lett. 2023, 18, 114010. [Google Scholar] [CrossRef]
  32. Zhou, H.Y.; Zhao, L.; Wang, L.X.; Xing, Z.; Zou, D.; Hu, G.; Xie, C.; Pang, Q.; Liu, G.; Du, E.; et al. Characteristics of freeze–thaw cycles in an endorheic basin on the Qinghai-Tibet Plateau based on SBAS-InSAR technology. Remote Sens. 2022, 14, 3168. [Google Scholar] [CrossRef]
  33. Zhang, Y.; Xie, C.; Zhao, L.; Wu, T.; Pang, Q.; Liu, G.; Wang, W.; Liu, W. The formation of permafrost in the bottom of the Zonag Lake in Hoh Xil on the Qinghai-Tibet Plateau after an outburst: Monitoring and simulation. J. Glaciol. Geocryol. 2017, 39, 949–956. [Google Scholar]
  34. Zhang, Y.; Xie, C.; Wu, T.; Zhao, L.; Wu, J.; Wu, X.; Li, R.; Hu, G.; Liu, G.; Wang, W.; et al. New permafrost is forming on the exposed bottom of Zonag Lake on the Qinghai-Tibet Plateau. Sci. Total Environ. 2022, 815, 152879. [Google Scholar] [CrossRef] [PubMed]
  35. Zhang, Y.; Zhao, L.; Xie, C.; Wu, T.; Wu, X.; Yang, G.; Yang, S.; Wang, W.; Pang, Q.; Liu, G.; et al. Permafrost characteristics and potential influencing factors in the lake regions of Hoh Xil, Qinghai-Tibet Plateau. Geoderma 2023, 437, 116572. [Google Scholar] [CrossRef]
  36. Ran, Y.H.; Li, X.; Cheng, G.D.; Zhang, T.; Wu, Q.; Jin, H.; Jin, R. Distribution of permafrost in China: An overview of existing permafrost maps. Permafr. Periglac. Process. 2012, 23, 322–333. [Google Scholar] [CrossRef]
  37. Hachem, S.; Duguay, C.R.; Allard, M. Comparison of MODIS-derived land surface temperatures with ground surface and air temperature measurements in continuous permafrost terrain. Cryosphere 2012, 6, 51–69. [Google Scholar] [CrossRef]
  38. Sandholt, I.; Rasmussen, K.; Andersen, J. A simple interpretation of the surface temperature/vegetation index space for assessment of surface moisture status. Remote Sens. Environ. 2002, 79, 213–224. [Google Scholar] [CrossRef]
  39. Li, X.; Wang, L.; Guo, X.; Chen, D. Does summer precipitation trend over and around the Tibetan Plateau depend on elevation? Int. J. Climatol. 2017, 37, 1278–1284. [Google Scholar] [CrossRef]
  40. Thompson, L.G.; Yao, T.D.; Davis, M.E.; Mosley-Thompson, E.; Wu, G.; Porter, S.E.; Xu, B.; Lin, P.N.; Wang, N.; Beaudon, E.; et al. Ice core records of climate variability on the Third Pole with emphasis on the Guliya ice cap. Quat. Sci. Rev. 2018, 188, 1–14. [Google Scholar] [CrossRef]
  41. Lu, S.L.; Jin, J.M.; Zhou, J.F.; Li, X.; Ju, J.; Li, M.; Chen, F.; Zhu, L.; Zhao, H.; Yan, Q.; et al. Drainage basin reorganization and endorheic–exorheic transition triggered by climate change and human intervention. Glob. Planet. Chang. 2021, 201, 103494. [Google Scholar] [CrossRef]
  42. Chen, Y.T.; Liu, A.B.; Cheng, X. Vegetation grows more luxuriantly in Arctic permafrost drained lake basins. Glob. Change Biol. 2021, 27, 5865–5876. [Google Scholar] [CrossRef]
  43. Jones, B.M.; Grosse, G.; Arp, C.D.; Jones, M.C.; Anthony, K.M.W.; Romanovsky, V.E. Modern thermokarst lake dynamics in the continuous permafrost zone, northern Seward Peninsula, Alaska. J. Geophys. Res. Biogeosci. 2011, 116, Artn G00m03. [Google Scholar] [CrossRef]
  44. Jones, B.M.; Grosse, G.; Farquharson, L.M.; Roy-Léveillée, P.; Veremeeva, A.; Kanevskiy, M.Z.; Gaglioti, B.; Breen, A.L.; Parsekian, A.D.; Ulrich, M.; et al. Lake and drained lake basin systems in lowland permafrost regions. Nat. Rev. Earth Environ. 2022, 3, 85–98. [Google Scholar] [CrossRef]
  45. Tao, J.; Liljedahl, A.K.; Burn, C.R.; Grosse, G.; Noetzli, J.; Goetz, S.J.; Douglas, T.A.; Yang, Y.H. Permafrost vulnerability to climate change: Understanding thaw dynamics and climate feedback of permafrost degradation. Environ. Res. Lett. 2025, 20, 100201. [Google Scholar] [CrossRef]
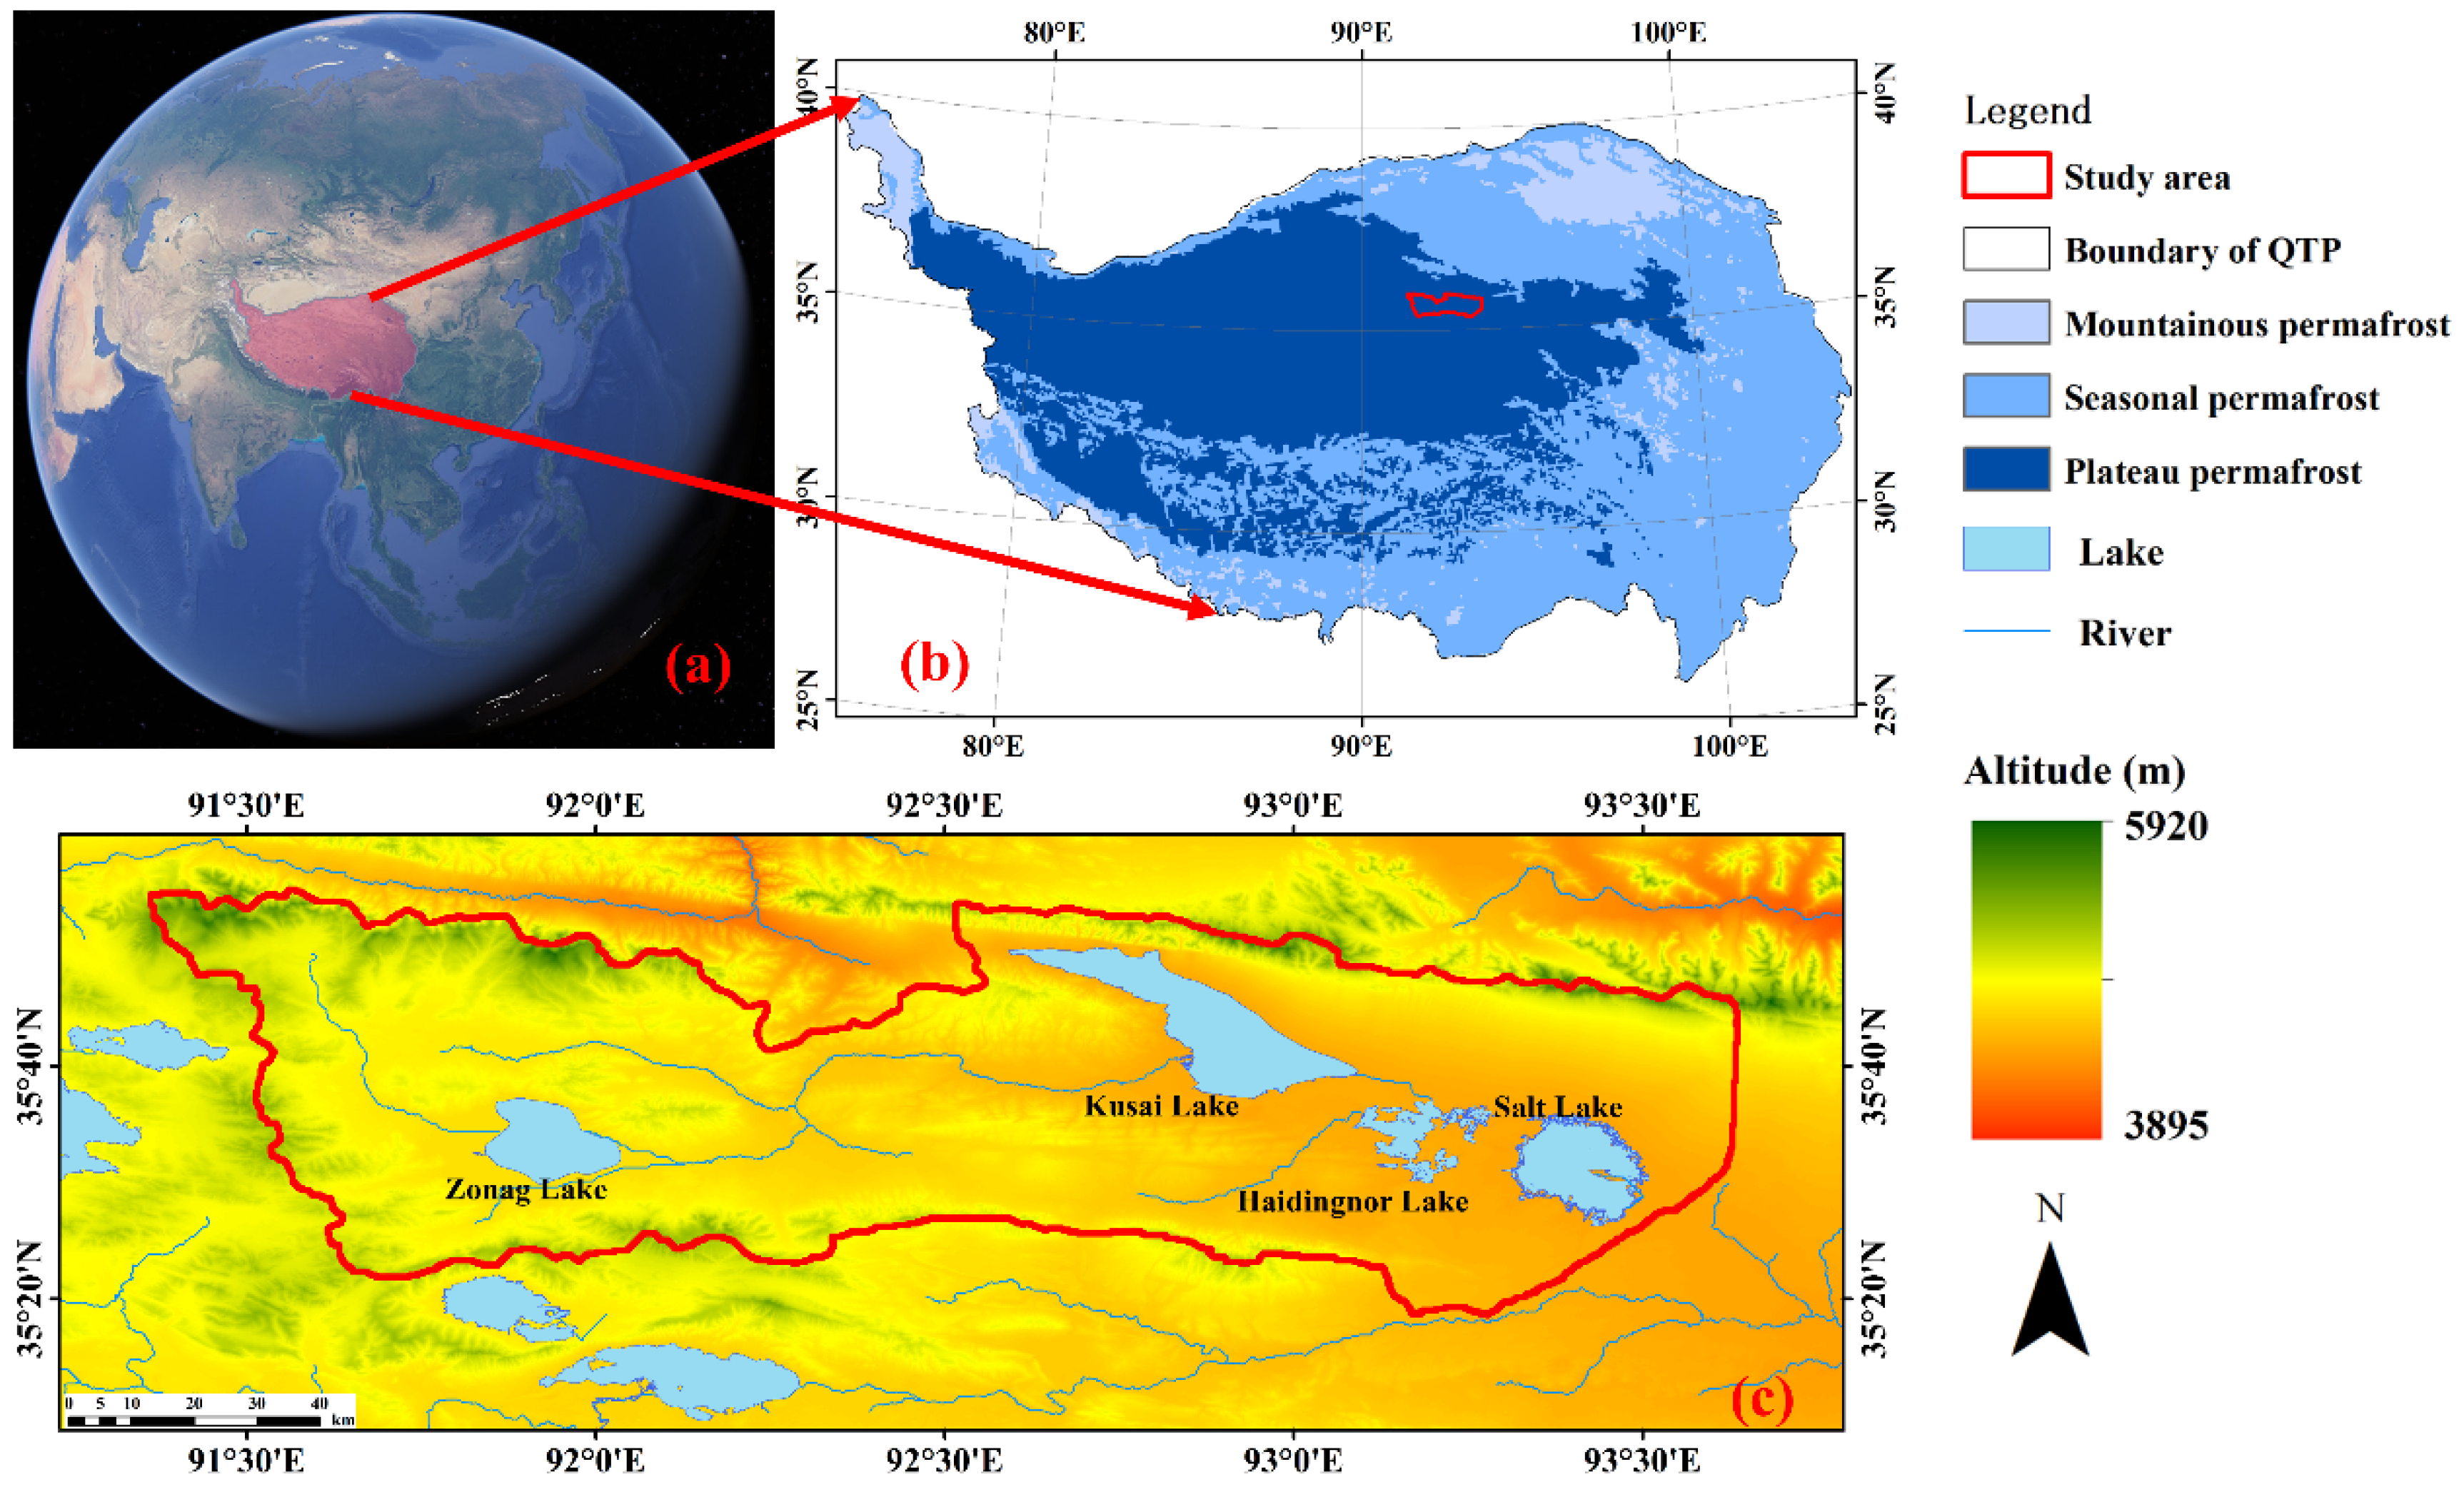
Figure 1. Overview of the study area (a) Location of the QTP (Google earth); (b) Permafrost distribution on QTP [36]; (c) The terrain and lakes of the study area.
Remotesensing 17 03392 g001
Figure 2. The principle of the TVDI. (Circles from warm color to cold color: bare soil to vegetable; warm line: dry edge; cold line: wet edge).
Remotesensing 17 03392 g002
Figure 3. The flowchart of this research.
Remotesensing 17 03392 g003
Figure 4. Distribution of LST in the basin from 2000 to 2023.
Remotesensing 17 03392 g004
Figure 5. Distribution of NDVI in the basin from 2000 to 2023.
Remotesensing 17 03392 g005
Figure 6. Dry and wet edges of the study area in different years.
Remotesensing 17 03392 g006
Figure 7. Distribution of TVDI in the basin from 2000 to 2023.
Remotesensing 17 03392 g007
Figure 8. Time series of LST, NDVI, and TVDI from 2000 to 2023 in the Zonag-Salt Lake basin.
Remotesensing 17 03392 g008
Figure 9. Spatial changes in LST in the Zonag-Salt Lake basin from 2000 to 2023 ((a-1d-1) represent the direction and distance of centroid migration; (a-2d-2) represent the azimuth and the oblateness of the ellipse).
Remotesensing 17 03392 g009
Figure 10. Spatial changes in NDVI in the Zonag-Salt Lake basin from 2000 to 2023 ((a-1d-1) represent the direction and distance of centroid migration; (a-2d-2) represent the azimuth and the oblateness of the ellipse).
Remotesensing 17 03392 g010
Figure 11. Spatial changes in TVDI in the Zonag-Salt Lake basin from 2000 to 2023 ((a-1d-1) represent the direction and distance of centroid migration; (a-2d-2) represent the azimuth and the oblateness of the ellipse).
Remotesensing 17 03392 g011
Figure 12. Climate conditions of the Zonag-Salt Lake basin since 2000 (a) the air temperature and precipitation; (b) the runoff and evaporation.
Remotesensing 17 03392 g012
Figure 13. Variance and trend of LST.
Remotesensing 17 03392 g013
Figure 14. Variance and trend of NDVI.
Remotesensing 17 03392 g014
Figure 15. Variance and trend of TVDI.
Remotesensing 17 03392 g015
Table 1. The equation coefficients of the dry and wet edges *.
YearQabcdYearQabcd
20001268.5 64.0 288.5 −27.7 20113279.9 14.3 298.5 −25.8
20002275.4 62.8 302.7 −53.1 20114264.5 57.2 282.9 −30.0
20003275.4 62.8 302.7 −53.1 20151261.8 53.1 282.1 −42.3
20004265.6 35.6 283.3 −41.2 20152273.9 40.4 300.1 −55.4
20051263.9 48.8 282.7 −55.9 20153282.4 20.6 303.8 −24.9
20052274.9 53.0 305.7 −90.0 20154267.2 39.9 285.7 −34.3
20053280.6 16.1 299.1 −25.7 20201262.5 59.3 278.4 −17.0
20054264.0 55.1 282.4 −42.7 20202273.5 36.4 302.3 −63.8
20101264.2 45.1 282.1 −39.0 20203282.4 9.4 300.2 −22.9
20102275.7 44.5 300.8 −51.5 20204268.9 21.5 285.7 −32.8
20103282.7 11.3 299.9 −20.2 20231263.3 57.3 282.4 −28.6
20104264.5 47.4 283.3 −51.6 20232275.3 31.0 301.3 −55.1
20111262.2 50.2 278.6 −20.2 20233281.2 13.1 298.6 −19.4
20112276.7 36.9 302.6 −50.5 20234262.7 48.8 279.8 −23.1
*   a and b representing coefficients for the wet edge, c and d representing coefficients for the dry edge.
Disclaimer/Publisher’s Note: The statements, opinions and data contained in all publications are solely those of the individual author(s) and contributor(s) and not of MDPI and/or the editor(s). MDPI and/or the editor(s) disclaim responsibility for any injury to people or property resulting from any ideas, methods, instructions or products referred to in the content.