Article

Spatial/Spectral-Frequency Adaptive Network for Hyperspectral Image Reconstruction in CASSI

Key Laboratory of Precision Opto-Mechatronics Technology, Ministry of Education, Beihang University, Beijing 100191, China
*
Author to whom correspondence should be addressed.
Remote Sens. 2025, 17(19), 3382; https://doi.org/10.3390/rs17193382
Submission received: 28 August 2025 / Revised: 27 September 2025 / Accepted: 3 October 2025 / Published: 8 October 2025

Abstract

Highlights

What are the main findings?
  • We propose SSFAN, a novel dual-branch transformer network that integrates spatial and channel attention with frequency-domain learning (via a dedicated FDT module and loss) for high-fidelity HSI reconstruction in CASSI.
  • The introduced channel compression and expansion modules effectively optimize the computational efficiency of the network, enabling superior detail preservation with moderate resource consumption.
What is the implication of the main findings?
  • The integrated spatial/spectral-frequency learning framework achieves breakthrough reconstruction accuracy by simultaneously modeling multi-domain features, particularly in recovering fine textures and suppressing noise.
  • This work provides a practical and efficient solution for high-quality hyperspectral imaging, balancing performance and complexity for real-world applications.

Abstract

Coded-Aperture Snapshot Spectral Imaging (CASSI) systems acquire 3D spatial–spectral information on dynamic targets by converting 3D hyperspectral images (HSIs) into 2D compressed measurements. Various end-to-end networks have been proposed for HSI reconstruction from these measurements. However, these methods have not explored the frequency-domain information of HSIs. This research presents the spatial/spectral-frequency adaptive network (SSFAN) for CASSI image reconstruction. A frequency-division transformation (FDT) decomposes HSIs into distinct Fourier frequency components, enabling multiscale feature extraction in the frequency domain. The proposed dual-branch architecture consists of a spatial–spectral module (SSM) to preserve spatial–spectral consistency and a frequency division module (FDM) to model inter-frequency dependencies. Channel compression/expansion modules are integrated into the FDM to balance computational efficiency and reconstruction quality. Frequency-division loss supervises feature learning across divided frequency channels. Ablation experiments validate the contributions of each network module. Furthermore, comparison experiments on synthetic and real CASSI datasets demonstrate that SSFAN outperforms state-of-the-art end-to-end methods in reconstruction performance.

1. Introduction

Hyperspectral images (HSIs) have been widely used in various fields such as remote sensing [1,2,3], medical diagnosis [4,5,6], military security [7,8,9], and tracking [10,11] because they have more spectral bands and richer spectral information than monochromatic or RGB images. Recently, snapshot hyperspectral imaging systems [12,13,14,15,16,17,18] have been developed to capture the 3D spatial–spectral data cubes of dynamic targets. Inspired by compressive sensing theory, coded-aperture snapshot spectral imaging (CASSI) systems [16,19,20,21,22] have been developed to achieve hyperspectral data cubes with high spatial resolution. However, reconstructing HSIs from 2D compressed data remains a critical challenge for CASSI systems.
It is evident that reconstructing 3D HSI data from 2D compressed measurements is a highly ill-posed inverse problem [12]. Reconstruction algorithms for CASSI systems are primarily divided into two categories: optimization algorithms and deep learning methods. Traditional optimization algorithms [20,23,24,25,26] leverage hand-crafted priors and rely on iterative algorithms to solve the problem of reconstruction. For example, Liu proposed the decompress snapshot compressive imaging (DeSCI) algorithm by constructing a joint model that integrates [24] the non-local self-similarity of video/hyperspectral frames and the rank minimization approach. Yuan proposed generalized alternating projection (GAP) to address the inverse problem in CASSI imaging by introducing a prior that minimizes the total variance [25]. Zhang et al. proposed dimension-discriminative low-rank tensor recovery (DLTR) to reconstruct HSIs [26]. Yin et al. uses the non-local low-rank tensor (NLRT) prior to design an optimization algorithm [20]. These traditional optimization methods have notable drawbacks, such as slow reconstruction speed and limited generalization capabilities. Algorithm parameters often require manual adjustment. Moreover, the algorithms often suffer from low accuracy when applied to noisy data.
The deep-learning-based methods for CASSI systems are categorized into three main types: plug-and-play (PnP), deep unfolding networks, and end-to-end (E2E) networks. The PnP algorithm [27,28,29,30,31] substitutes the prior module in the iterative process of optimization algorithm with a denoising network. Comparing with traditional optimization algorithms, PnP algorithms significantly improve reconstruction accuracy [32].
Deep unfolding networks [33,34,35,36] are designed on the basis of the iterative frameworks of optimization algorithms. They feature high interpretability and good reconstruction accuracy. Ma et al. proposed a deep tensor alternating direction method of multipliers network (ADMM-Net) [33] for video SCI systems. They achieved this by unfolding the inference iterations into a layerwise structure and designed a deep neural network based on tensor operations for the prior model. Huang proposed a deep unfolding method for the CASSI system based on the maximum a posteriori (MAP) estimation framework, which uses the learned Gaussian scale mixture (GSM) prior [34]. Cai et al. proposed a principled degradation-aware unfolding half-shuffle transformer (DAUHST) by combining the degradation-aware unfolding framework (DAUF) and the half-shuffle transformer (HST) [35]. Li et al. presented a pixel-adaptive deep unfolding transformer (PADUT) for HSI reconstruction in CASSI by incorporating a pixel-adaptive data module and a non-local spectral transformer prior module [36].
E2E networks [37,38,39,40,41,42,43] aim to establish a direct mapping from the compressed measurements of the CASSI system to reconstructed HSIs. These types of methods have exhibited good reconstruction performance. However, existing E2E networks predominantly exploit the spatial–spectral information of HSIs for reconstruction, without considering the spatial-frequency-domain information of the targets.
CASSI systems can be categorized into single-disperser CASSI (SD-CASSI) [16] and dual-disperser CASSI (DD-CASSI) [21,22]. In this study, taking SD-CASSI as an example, we propose a spatial/spectral-frequency adaptive network (SSFAN) for HSI reconstruction from compressive CASSI measurements. The frequency-division transformation (FDT) is proposed to process the frequency information of the feature maps, and a loss function is developed to help the network learn information from different frequency bands of HSIs. Additionally, both channel-dimension and spatial-dimension transformers are introduced to improve image reconstruction.
Our main contributions are as follows:
1. A novel E2E neural network framework, SSFAN, is proposed for the reconstruction of HSIs in a CASSI system. The framework features two branches—a transformer based on spatial attention and a transformer based on channel attention—designed to reconstruct the spatial–spectral and Fourier frequency components of HSIs across different bands.
2. The FDT is designed to obtain distinct Fourier frequency components and is accompanied by FDT loss to supervise the learning of information from different frequency channels.
3. To address the high computational load caused by the FDT, a channel compression module and a channel expansion module are introduced to balance the reconstruction performance and computer resource consumption of the neural network.
The article is organized as follows. Section 2 briefly reviews the existing E2E networks for CASSI and some works on frequency-domain processing. Section 3 describes the image formation model of SD-CASSI. Section 4 introduces a mathematical formulation of the proposed reconstruction method. Section 5 details the proposed two-branch E2E framework, including the network architecture (a spatial–spectral module and a frequency-division module) and the loss function. Section 6 shows the results of the ablation and comparison experiments. Finally, Section 7 presents the conclusion of this study.

2. Related Works

E2E networks are constructed based on three key aspects: the specific network structure, the utilization of system information, and the selection of loss functions. Regarding network structure, the basic structure of an E2E network includes linear layers, a convolution layer [44], and attention layers [45]. These fundamental components are combined to form the residual structure, the transformer structure [46], the UNet structure [47], etc. These diverse architectures are employed in various E2E networks available today [48,49,50,51,52]. Regarding the use of system information to extract features from inputs, many neural networks utilize various transforms, such as the Fourier transform [53], wavelet transform [54], and S-transform [55]. Regarding loss functions, different types are employed, including, among others, mean square error (MSE) [56] and learned perceptual image patch similarity (LPIPS) [57].

2.1. E2E Neural Networks for CASSI Reconstruction

Many E2E networks have been developed for the reconstruction of CASSI data. The λ -net [37] is a dual-stage generative model specifically designed to reconstruct the desired 3D data from SCI system. Meng et al. proposed spatial–spectral self-attention (TSA) [38] to process each dimension sequentially but in an order-independent manner. Hu et al. proposed a high-resolution dual-domain learning network (HDNet) integrating a residual network and spatial–spectral attention as its core architecture [39]. Cai et al. proposed the mask-guided spectral-wise transformer (MST) [40] by introducing spectral-wise multi-head self-attention (MSA) and a mask-guided mechanism (MM) to boost performance in HSI reconstruction. Cai et al. designed the coarse-to-fine sparse transformer (CST) [42]. This model employs a spectra-aware screening mechanism (SASM) and spectra-aggregation hashing multi-head self-attention (SAH-MSA) for tasks such as coarse patch selection, fine pixel clustering and self-similarity capturing. Luo et al. designed a dual-window multiscale transformer (DWMT) to capture both long-range dependencies and local details for HSI reconstruction in CASSI systems [43].

2.2. Frequency-Domain Processing

Frequency-domain processing has long been an important research area in signal processing. In recent years, with the extensive applications of deep learning across various fields, many methods [58,59,60,61,62,63,64,65,66] have emerged to integrate deep learning with frequency domain analysis. Xu [58] et al. found that deep neural networks often fit target functions from low to high frequencies during the training process, a concept referred to as the F-Principle. Based on these findings, frequency-domain processing techniques can help networks achieve superior performance. Kai et al. found that learning in the frequency domain with selected static channels can achieve higher accuracy than the conventional spatial downsampling approaches [59]. Wei et al. introduced an invariant wavelet transform with multiple parameters in the fractional domain for a watermarking algorithm [60]. Yang et al. utilized Fourier frequency features in super-resolution fields [61]. Jiang et al. proposed focal frequency loss [62], which enables neural networks to adaptively focus on frequency components in a process called frequency-domain learning. Karami et al. proposed a system that recognizes static gestures of alphabetic characters in Persian Sign Language (PSL) by combining a wavelet transform and neural networks [63]. Jamali et al. introduced the Haar wavelet transform in deep CNNs [64] to facilitate effective feature extraction, thereby enhancing the classification accuracy of polarimetric synthetic-aperture radar imagery. Meanwhile, HDNet employed frequency domain learning to improve reconstruction quality. Zhang et al. employed the fast Fourier transform (FFT) during subaperture decomposition to enhance feature extraction for SAR target recognition [65]. Wan et al. proposed a frequency-domain spectral feature module to perform FFT in order to extract multiscale and multi-frequency features, enhancing the discrimination of local features and global patterns in HSI classification [66]. Inspired by the above works, we propose a network module to learn information from the Fourier frequency components of HSIs.

3. Image Formation Model of SD-CASSI

As shown in Figure 1, the SD-CASSI system consists of an objective lens, a coding mask, a disperser, two relay lenses, and a monochromatic sensor. The input HSI cube is imaged by the objective lens and then spatially modulated by the encoding mask. Next, the coded HSI is spectrally sheared by the disperser. Finally, the spatially sheared and coded HSI is captured compressively by the sensor, creating a 2D compressed image.
For an SD-CASSI system, it is assumed that the input 3D HSI cube is X 0 R C × H × W , where H and W are the spatial dimensions and C is the spectral dimension. Furthermore, let the coded aperture be M 0 R H × W . The modulated HSI cube X 1 after passing through the coded aperture can be expressed as
X 1 ( λ , h , w ) = X 0 ( λ , h , w ) · M 0 ( h , w )
where h and w are the spatial indices of the object plane corresponding to the H and W dimensions, respectively, while λ is the spectral index for the C dimension. After passing through the relay lenses and the disperser element, the dispersed HSI cube X 2 ( λ , m , n ) is given by
X 2 ( λ , m , n ) = X 1 ( λ , h , w + d ( λ λ c ) )
where m and n are spatial indices of pixels on the sensor plane, d denotes a dispersive element with linear dispersion, and λ c denotes the center wavelength (note that this model assumes linear dispersion). The sensor captures X 2 and generates a 2D measurement Y , which is given by
Y = λ = 1 C X 2 ( λ , : , : ) + G
where G R H × ( W + d ( λ λ c ) ) is random noise generated during the imaging process.
The core task in reconstructing an HSI is to retrieve the original HSI cube from the measurement Y obtained by the SD-CASSI system.

4. Problem Formulation

As shown in Figure 2, the E2E model for spectral image reconstruction in the CASSI system is a mapping from the HSIs of targets to the system measurements via a neural network. This mapping can be expressed as
X pred = F ( Y )
where X pred is the reconstructed HSI, Y is the measurements captured by the CASSI system, and F denotes the mapping relationship between them. The E2E networks commonly employed for CASSI reconstruction in recent years are mainly single-branch networks that learn spatial and spectral features.
Currently, these network methods rarely include the learning of spatial-frequency features for data reconstruction in the SD-CASSI system. To incorporate the frequency-domain feature, we propose a two-branch E2E network that extracts and fuses the holistic HSI information and frequency-band-specific details. Before presenting our reconstruction model, we first introduce our frequency-domain processing approach.

4.1. Frequency-Division Transformation

For the spectral images, although the image of each wavelength captures the same scene, the spatial profiles across different wavelengths exhibit both similarities and disparities. The similarities correspond to the low-frequency components of spatial frequency information, while the differences align with high-frequency components represent band-specific detail variations. Notably, existing neural network methods for HSI reconstruction predominantly utilize spatial information, with limited utilization of information in the spatial-frequency domain.
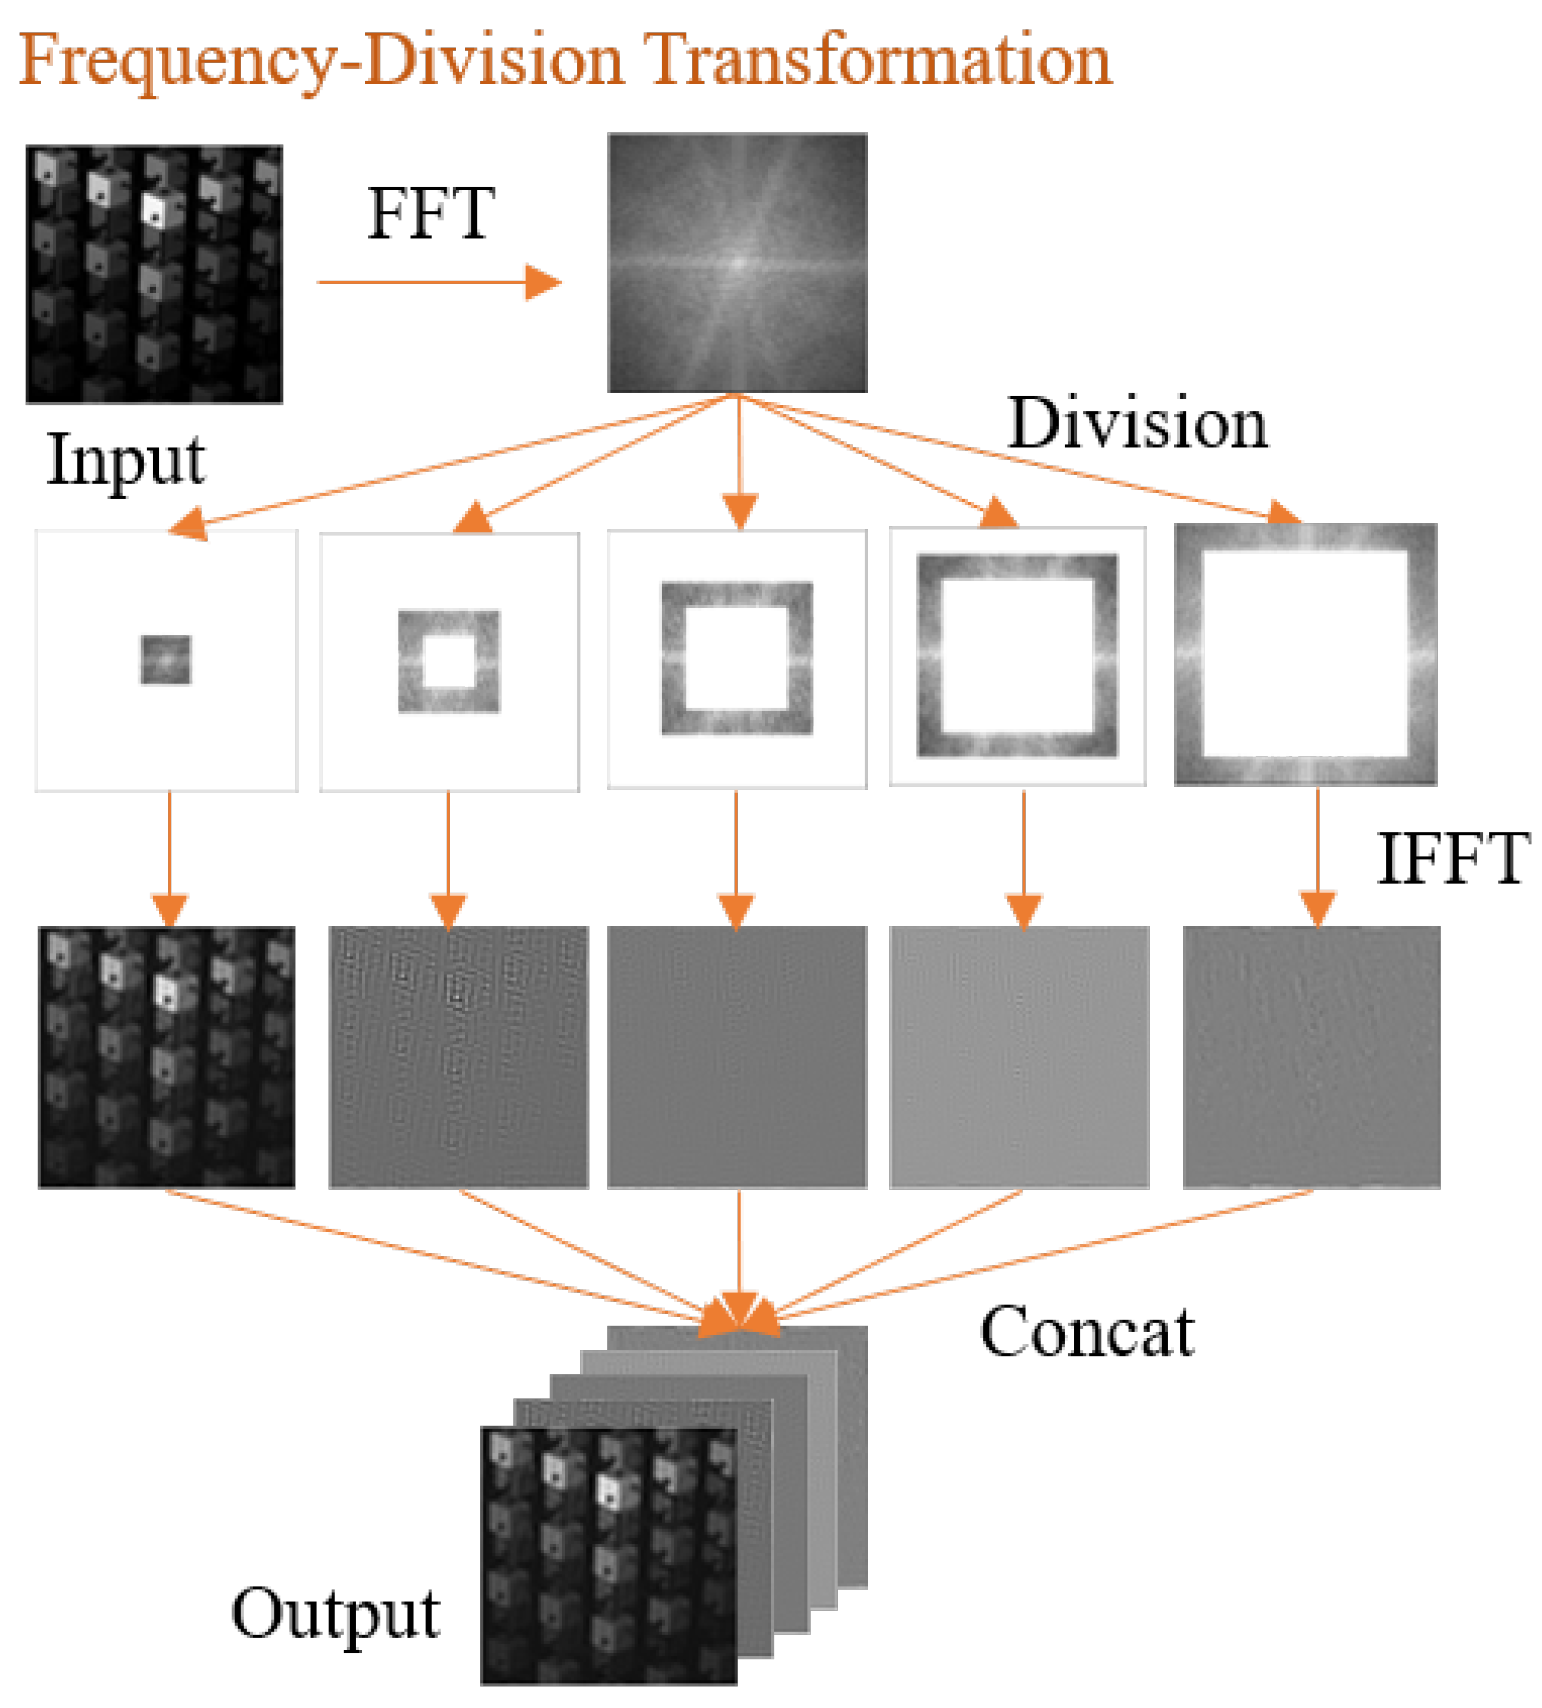
In the present study, to address this gap, we propose frequency-division transformation (FDT) to decompose spectral images into distinct spatial-frequency components, enabling the network to explicitly learn frequency-specific features. The procedure for FDT is shown in Figure 3.
The input, an arbitrary 3D data cube, is represented as X R C × H × W . First, an FFT is performed on the input X to calculate the amplitude diagrams A R C × U × V and phase diagrams P R C × U × V :
A , P = FFT ( X )
where U and V are dimensions in the frequency domain, corresponding, respectively, to the spatial dimensions H and W.
Since the Fourier transform of a real-valued image exhibits symmetric property, a symmetric division of its spectrogram is principled and necessary. This approach inherently respects the physical structure of the frequency domain, ensuring that redundant symmetric component pairs are processed cohesively. Consequently, it enhances parameter efficiency and prevents the model from learning inconsistent representations from spectrally identical regions.
Taking the center of the spectrogram as the origin, the entire image domain is defined over u [ U 2 , U 2 ] , v [ V 2 , V 2 ] . Suppose that the spectrogram needs to be divided into P segments. By symmetrically dividing both axes, the frequency bands of the positive half-axis of U can be derived as follows: ( 0 , U 2 P ) , ( U 2 P , U P ) , , ( ( P 1 ) U 2 P , U 2 ) . Similarly, the frequency bands of the V-axis can be obtained. Combining these bands from both axes yields a segmented magnitude spectrum [ a 1 , a 2 , , a P ] . This process is defined by the following function:
[ a 1 , a 2 , , a P ] = Divide ( A )
Subsequently, the image components at different frequencies are retrieved by applying the inverse fast Fourier transform (IFFT) to the amplitude spectrum components of the phase spectrum, which is given by
x p = IFFT ( a p , P )
A total of P component images are generated; they are denoted as { x p p = 1 , 2 , , P } . Finally, these P images are concatenated along the channel dimension, resulting in the output data X F D T R C P × H × W . The pseudocode for the FDT operation described above is summarized in Algorithm 1.
Algorithm 1 Frequency-Division Transformation
Input: Data cube X R C × H × W .
 1:
Calculate amplitude map A R C × U × V and phase map P R C × U × V
A , P = FFT 2 ( X , dim = H , W )
 2:
Divide amplitude map A into P sub-maps [ a 1 , a 2 , , a P ]
 3:
for p:1 to P do
 4:
    X p = IFFT ( a p , P )
 5:
end for
Output: Data cube after division X F D T R C P × H × W

4.2. Reconstruction Model

In the algorithms addressing the restoration problem of the SD-CASSI system, the measurement Y serves as input, while the prediction value X pred constitutes the output.
The framework of the reconstruction model is shown in Figure 2. With the feature extraction operation F input , a feature map Z R C × H × W can be calculated as
Z = F input ( Y )
Here, Z encapsulates all the spatial- and spectral-domain information.
The FDT operation is applied to decompose Z into spatial-frequency band components as follows:
F = FDT ( Z ) = [ f 1 , f 2 , , f P ]
The spatial–spectral module (SSM), denoted as F SSM , is designed to map Z onto the base spatial and spectral information of the input HSI cube X 0 .
S pred = F SSM ( Z )
Assume that the true values of different spatial-frequency bands of targets’ HSIs are represented by X FDT . In order to achieve results close to the spatial-frequency components of X FDT , the frequency-division module (FDM), denoted as F FDM , is designed to map f P to the predicted value f pred p :
f pred p = F FDM ( f p )
As a result, the F FDM process generates the predicted F pred = [ f pred 1 , f pred 2 , , f pred P ] . Finally, the two pieces of information, S pred and F pred , are fused to obtain the predicted HSI value X pred .
X pred = F fusion ( S pred , F pred )

5. Proposed Method

In this paper, we propose an E2E network for the reconstruction of CASSI. This method restores HSIs from compressed measurements by extracting spatial–spectral and frequency features from different spatial frequency bands. It is named the spatial/spectral-frequency adaptive network (SSFAN).

5.1. Network Framework

The framework of SSFAN is illustrated in Figure 2. The initial part of the network consists of a convolution layer followed by several residual blocks (RBs), which correspond to the function F input in the reconstruction model. Through this initial processing, the feature map Z is obtained. The subsequent section splits into two branches. The right branch is designed to learn the spatial–spectral features of HSI, corresponding to the role of the function F SSM in the reconstruction model. The left branch, FDM, aims to learn the features of different spatial frequency components of HSIs and corresponds to the function of the expression F FDM in the reconstruction model. When Z is fed into these two branches, they learn the features of HSIs, resulting in the outputs S pred and [ f pred 1 , f pred 2 , , f pred P ] , respectively. They are fed into the final part of the network to generate the final reconstructed HSIs. This part consists of several residual blocks that correspond to the F fusion function.

5.2. Spatial–Spectral Module (SSM)

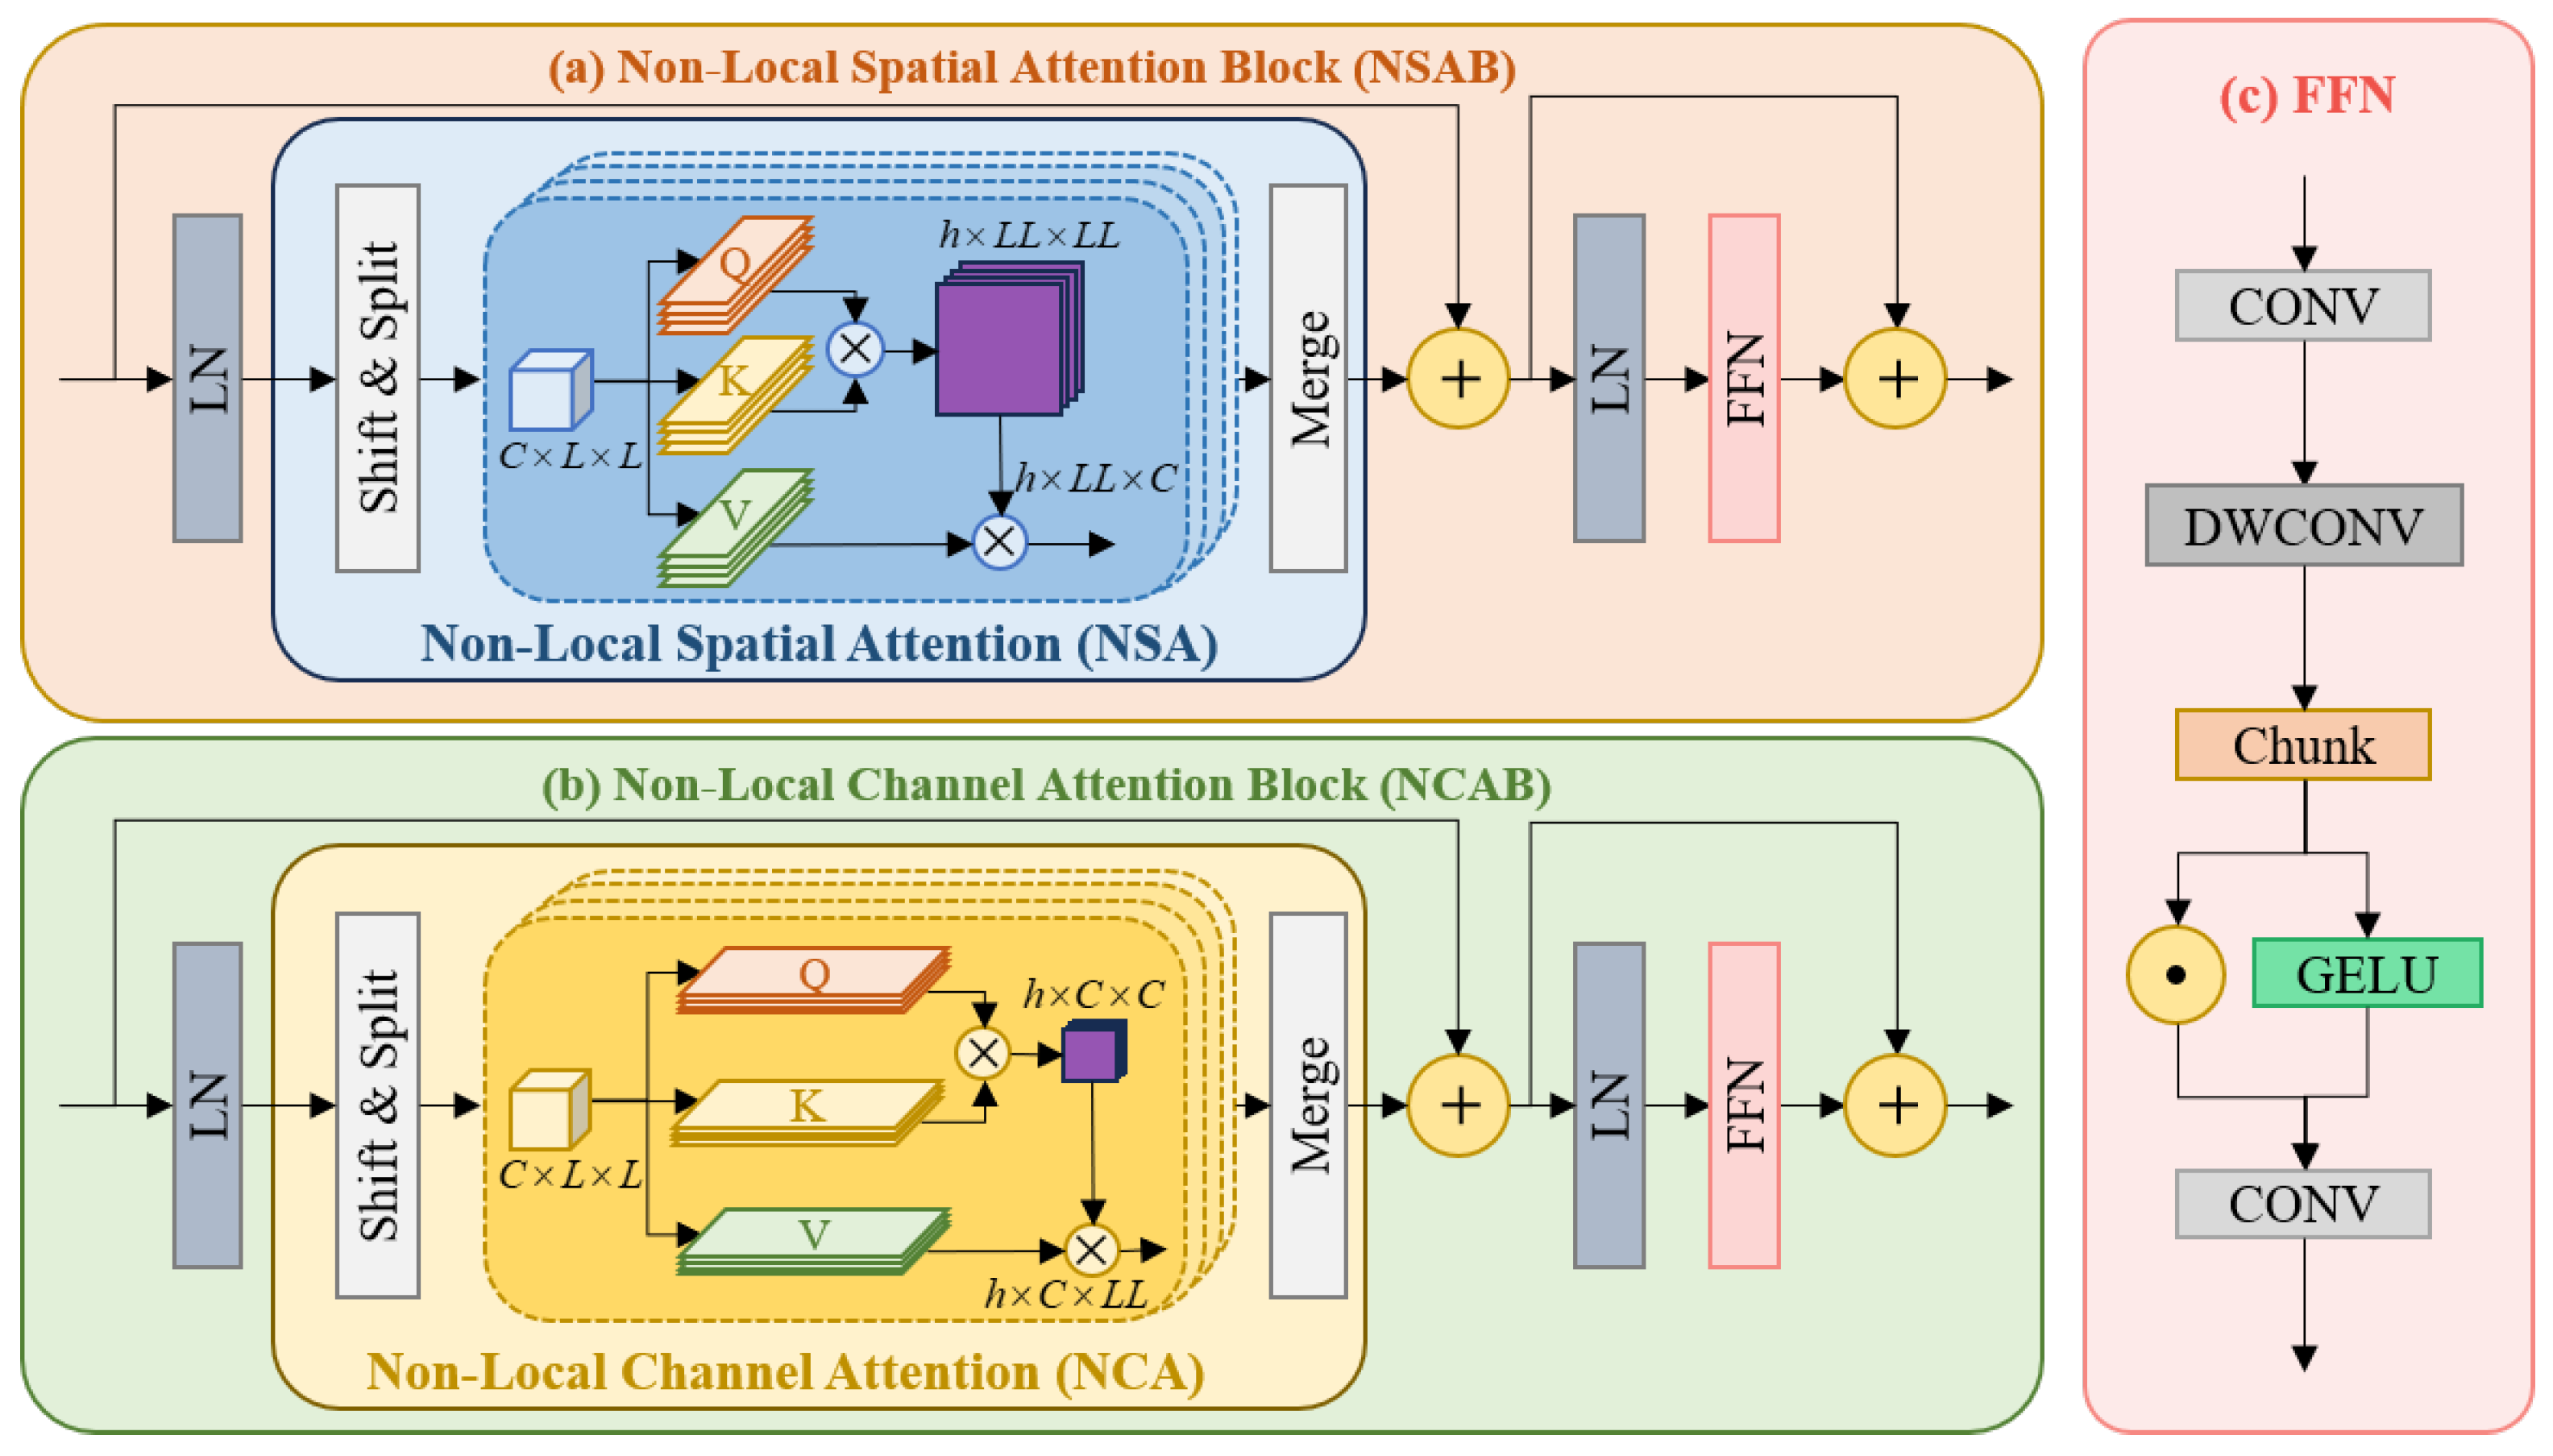
As shown in Figure 4a, the SSM is designed to implement the F SSM function. It takes the feature map Z as input and generates S pred as output. The number of input channels, Z , increases through a convolution layer. Then, the cube is fed into a U-shaped network constructed with a non-local spatial attention block (NSAB). As illustrated in Figure 5a, the NSAB comprises two layer normalization (LN) layers, a non-local spatial attention (NSA) module, and a feedforward neural network (FNN). The FFN, shown in Figure 5c, consists of two convolution (CONV) layers, a Gaussian error linear unit (GELU), and a depthwise convolution (DWConv).
The architecture of the NSA module is shown in Figure 5a. First, the input X in R C × H × W is shifted with L / 2 . Then, the shifted data are divided into several data cubes [ x 1 , x 2 , , x n ] , where the size of each cube x i is C × L × L ( i = 1 , 2 , , n ) . For each cube x i , three group networks are utilized to transform it into query vectors Q i , key vectors K i , and value vectors V i . These vectors have a size of h × L L × C , where h represents the number of heads in the multi-head attention mechanisms.
Q i = x i W Q
K i = x i W K
V i = x i W V
Then, the attention output is given by
Attention ( Q i , K i , V i ) = V i Softmax ( K i T Q i β )
The attention map has a size of h × L L × L L . This map can guide the network to learn features of a specific position.

5.3. Frequency-Division Module (FDM)

As shown in Figure 4b, the FDM is designed to implement the function F F D M . As shown in Figure 2, the feature map Z is taken as input, with F pred generated as output. The FDT-P block transforms the input into spatial-frequency map F = f 1 , f 2 , , f P . The FDM includes multiple non-local channel attention blocks (NCABs). The structure of NCABs is detailed in Figure 5b.
The data volume of this feature map is extremely large. The input feature map size is C × H × W and the number of parts established by spatial-frequency division is P. Accordingly, the size of F pred is C P × H × W . A comparative analysis of chosen values for P is presented in Section 6.1. Assuming C = 28 and P = 5 , there will be 140 channels to be processed. Obviously, it is difficult to train a network with limited memory to process data with 140 channels using the network. On the other hand, the features extracted from different spatial frequency divisions do not have the same significant impact on the final reconstruction results.
In order to reduce the computation cost, we can reasonably compress the channel dimension using the channel compress module (CCM). A smaller feature map X F D C R C × H × W ( C < C P ) is obtained. This feature map is processed by the network to retrieve frequency information. Its channel is then expanded back to C P by the channel extension module (CEM).
The CCM consists of three convolution layers and three RELU activation layers. The first convolution layer, with both the input and output channels set to C P , is designed to extract features from the output of FDM. The second convolution layer, with input channels of size C P and output channels of size C , is designed to compress the channel information. The third convolution layer, featuring C input and output channels, organizes compressed features for subsequent modules. The architecture is designed to approximate a sufficiently complex function to retain the most efficient information from frequency division while minimizing reconstruction loss. The process can be expressed as the following equation:
CCM ( x ) = RELU ( Conv C C ( RELU ( Conv C P C ( RELU ( Conv C P C P ( x ) ) ) ) ) )
The CEM also consists of three convolution layers and three RELU activation layers, with the input and output channel configurations of the convolution layers being exactly the opposite of those in the CCM. Therefore, the process can be expressed by the following equation:
CEM ( x ) = RELU ( Conv C P C P ( RELU ( Conv C C P ( RELU ( Conv C C ( x ) ) ) ) ) )
The NCAB serves as the core learning structure in the FDM. Analogous to the NSAB, it is composed of two LN layers, a feedforward neural network, and a non-local channel attention (NCA) module. There are two reasons for adopting NCA over NSA. First, the FDT concatenates the HSI data of different frequencies along the channel dimension, so that the information of different frequency components is stored in the channel dimension. Second, the spectral data of the same pixel in a hyperspectral image are also encoded within the channel dimension.
As with the NSA module, cubes are generated by shifting and splitting the input data. For each cube, Q i , K i , and V i are derived via Equations (13)–(15). The attention output is computed using Equation (16). In NCA, unlike NSA, these vectors have a size of h × C × L L , and the attention map has a size of h × C × C . The feature map is finally restored to the input image size by fusion operations and a series of residual blocks.

5.4. Loss Function

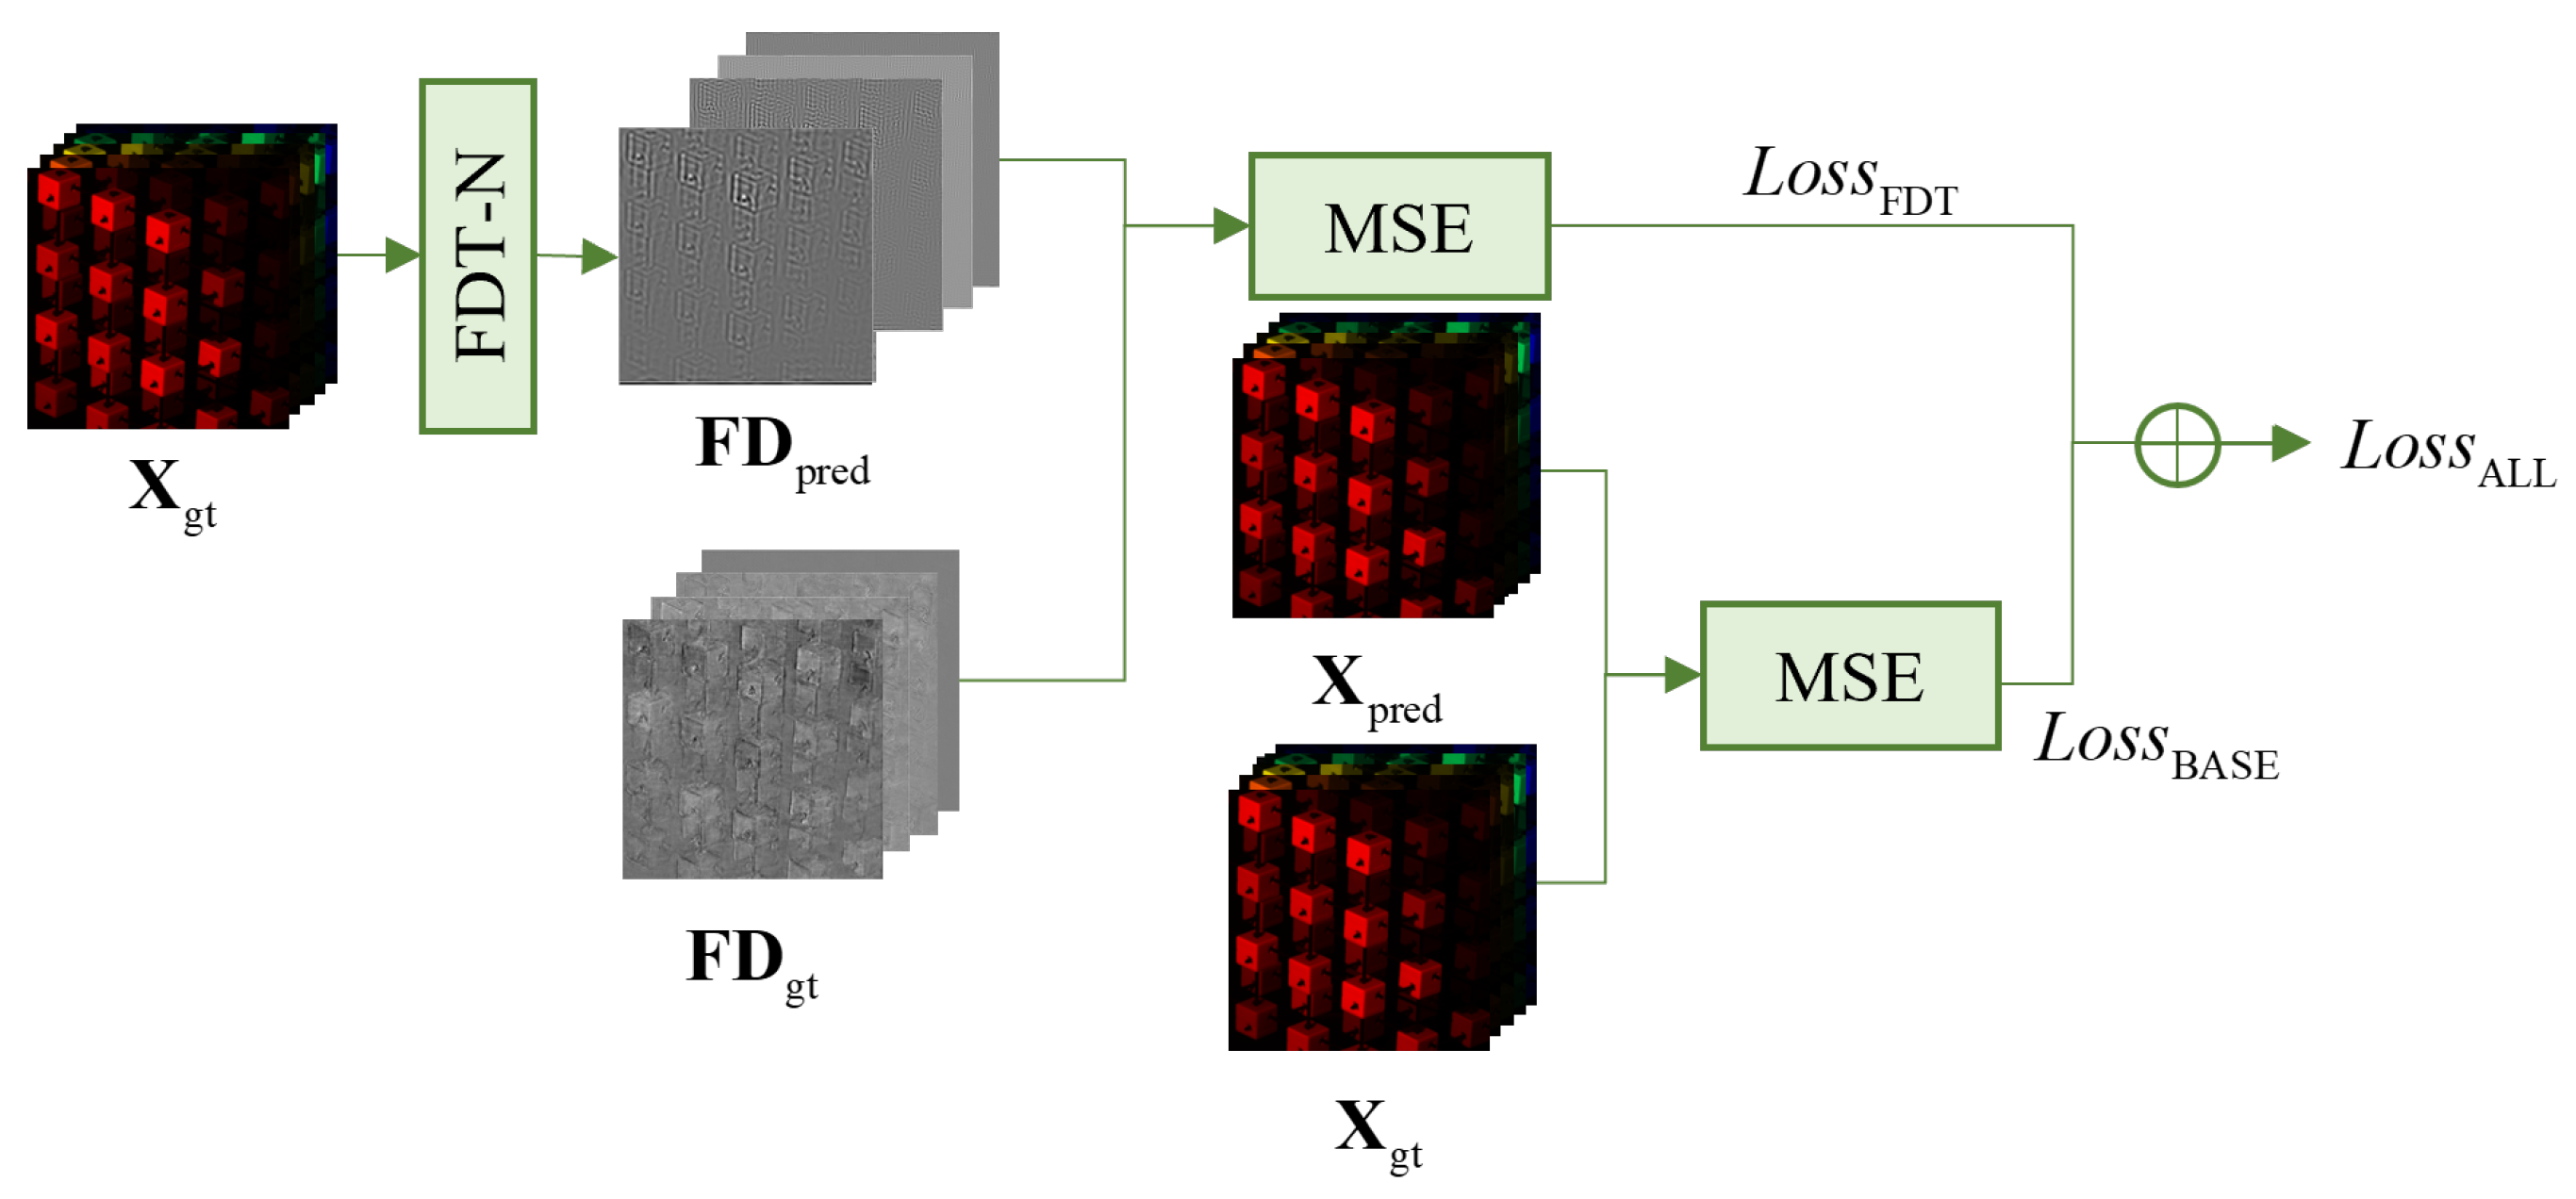
To ensure that the neural network output aligns closely with the ground truth (GT), we adjust parameters not only by comparing the final output to the GT in the spatial domain but also by comparing the local outputs of a specific module to the GT in the frequency domain. Therefore, the loss function of the network consists of two main components: the base loss and the frequency-division loss.
The mean squared error (MSE) loss is a standard choice for regression tasks, effectively ensuring pixelwise spectral fidelity and promoting the smoothness of reconstructed features. Therefore, we accordingly adopt the l 2 loss function (MSE) to calculate each loss term, as expressed in the following equation:
L o s s MSE = 1 N j = 1 N ( x j x ^ j ) 2
The basic loss is given by the following equation:
L o s s BASE = MSE ( X gt , X pred )
where X gt is the GT image and X pred is the final output of the network.
As shown in Figure 6, the frequency-division loss is calculated using the FDM of the predicted output ( F D pred = F FDM ( X pred ) ) and the GT frequency component ( F D gt = F FDM ( X gt ) ), which is given by the following equation:
L o s s FDT = MSE ( F D pred , F D gt )
The final loss function is expressed as follows:
L o s s ALL = L o s s FDT + η L o s s BASE
where η is a weighting coefficient that balances the two loss terms.

6. Experimental Results

In this section, ablation experiments are conducted on the proposed network, and comparison experiments are conducted with multiple algorithms. The proposed method is compared with several E2E networks, λ -net [37], TSA-Net [38], HDNet [39], MST-L [40], MST++ [41], CST-L [42], and DWMT [43]. The experiments are performed and evaluated on both synthetic datasets and real datasets.
The peak signal-to-noise ratio (PSNR), structural similarity (SSIM), and spectral angle mapper (SAM) are employed to evaluate the reconstruction performance of different methods. For the spatial evaluation indicators PSNR and SSIM, we calculate them for each 2D spectral image and then compute the average values across all spectral bands as the final results. For the spectral indicator SAM, the values of each spatial point are calculated and then averaged to generate the final value.

6.1. Experiment Setup

In the simulation experiments, two datasets, namely, CAVE [67] and KAIST [68], are adopted to generate compressed 2D measurements of the SD system based on the model presented in Section 3. Meanwhile, ten scenes from the KAIST dataset are used to generate a test set. In the real experiment, HSIs of five real scenes captured by an SD-CASSI system [38] are used for comparison. The real HSIs consist of 28 spectral channels ranging from 450 nm to 650 nm, with each channel having two-pixel dispersion.
The proposed SSFAN is implemented using PyTorch 2.7.1. The network models for quantitative comparisons and ablation studies are trained with the Adam optimizer [69] and cosine annealing scheme [70] for 500 epochs on an NVIDIA GeForce RTX 4090 (NVIDIA Corporation; Santa Clara, CA, USA). The training uses a batch size of five and input patches of size 256 × 256. The loss weight η is set to one. The initial learning rate during training is 2 × 10 4 .

6.2. Ablation Study

In this section, we conduct several ablation experiments to investigate the hyperparameters of models and the effectiveness of different components in models. The baseline of the model is a small version in which only the number of network layers is reduced.
First, the optimal number of frequency bands in the FDT for the reconstruction results is investigated. Table 1 shows the average PSNR, SSIM and SAM values of ten test scenes in the test dataset. Five different numbers of divided bands are tested in the FDT. The best performance is achieved when the frequency band number is set to five.
The optimal channel numbers in the CCM and CEM are then explored. In this experiment, the channel numbers in the CCM and CEM are set to 28, 40, 56, and 64. According to Table 2, the model performance does not improve monotonically with increasing channel number. The best results are obtained when the channel number is set to 56. The ablation study in Table 3 clearly highlights the compression capability of the CCM and CEM. The proposed model requires only 117.28 GFLOPs and 6.34 M parameters, which is a decrease of about 61.4% and 69.5%, respectively, from the baseline model that operates without them.
To verify the effectiveness of the SSM and FDM, module ablation experiments are conducted. The experiments include three scenarios: one using only the SSM, one using only the FDM, and one using both modules. Table 4 summarizes the results. When only the SSM is used, higher PSNR and SAM values but lower SSIM are obtained than when only the FDM is used. When both modules are used, the best overall performance is achieved. These results indicate that the SSM can provide some spatial information and reduce the noise in HSIs, while the FDM can contribute more structural information and spectral information from the image.
The impact of the FDT was also investigated. In order to isolate the effects of the number of channels on the FDT, a comparison is made between the FDT and a convolution layer that can achieve the same channel-number expansion. The results are presented in Table 5. The network employing the FDT achieves a 0.33 dB improvement over the network using the convolution layer. This finding confirms that the FDT can capture more information about HSIs than the conventional option of increasing the number of channels.

6.3. Performance Evaluation on a Simulation Dataset

Table 6 summarizes PSNR, SSIM, SAM of eight different methods across ten different scenes on a simulation dataset. Compared with λ -Net, TSA-Net, HDNet, MST-L, MST++, CST-L, and DWMT, the proposed SSFAN demonstrates superior reconstruction performance. Specifically, SSFAN can achieve an average PSNR improvement of 0.96 dB over CST-L. In terms of spectral accuracy, SSFAN reduces the average SAM by 0.016 rad compared to CST-L.
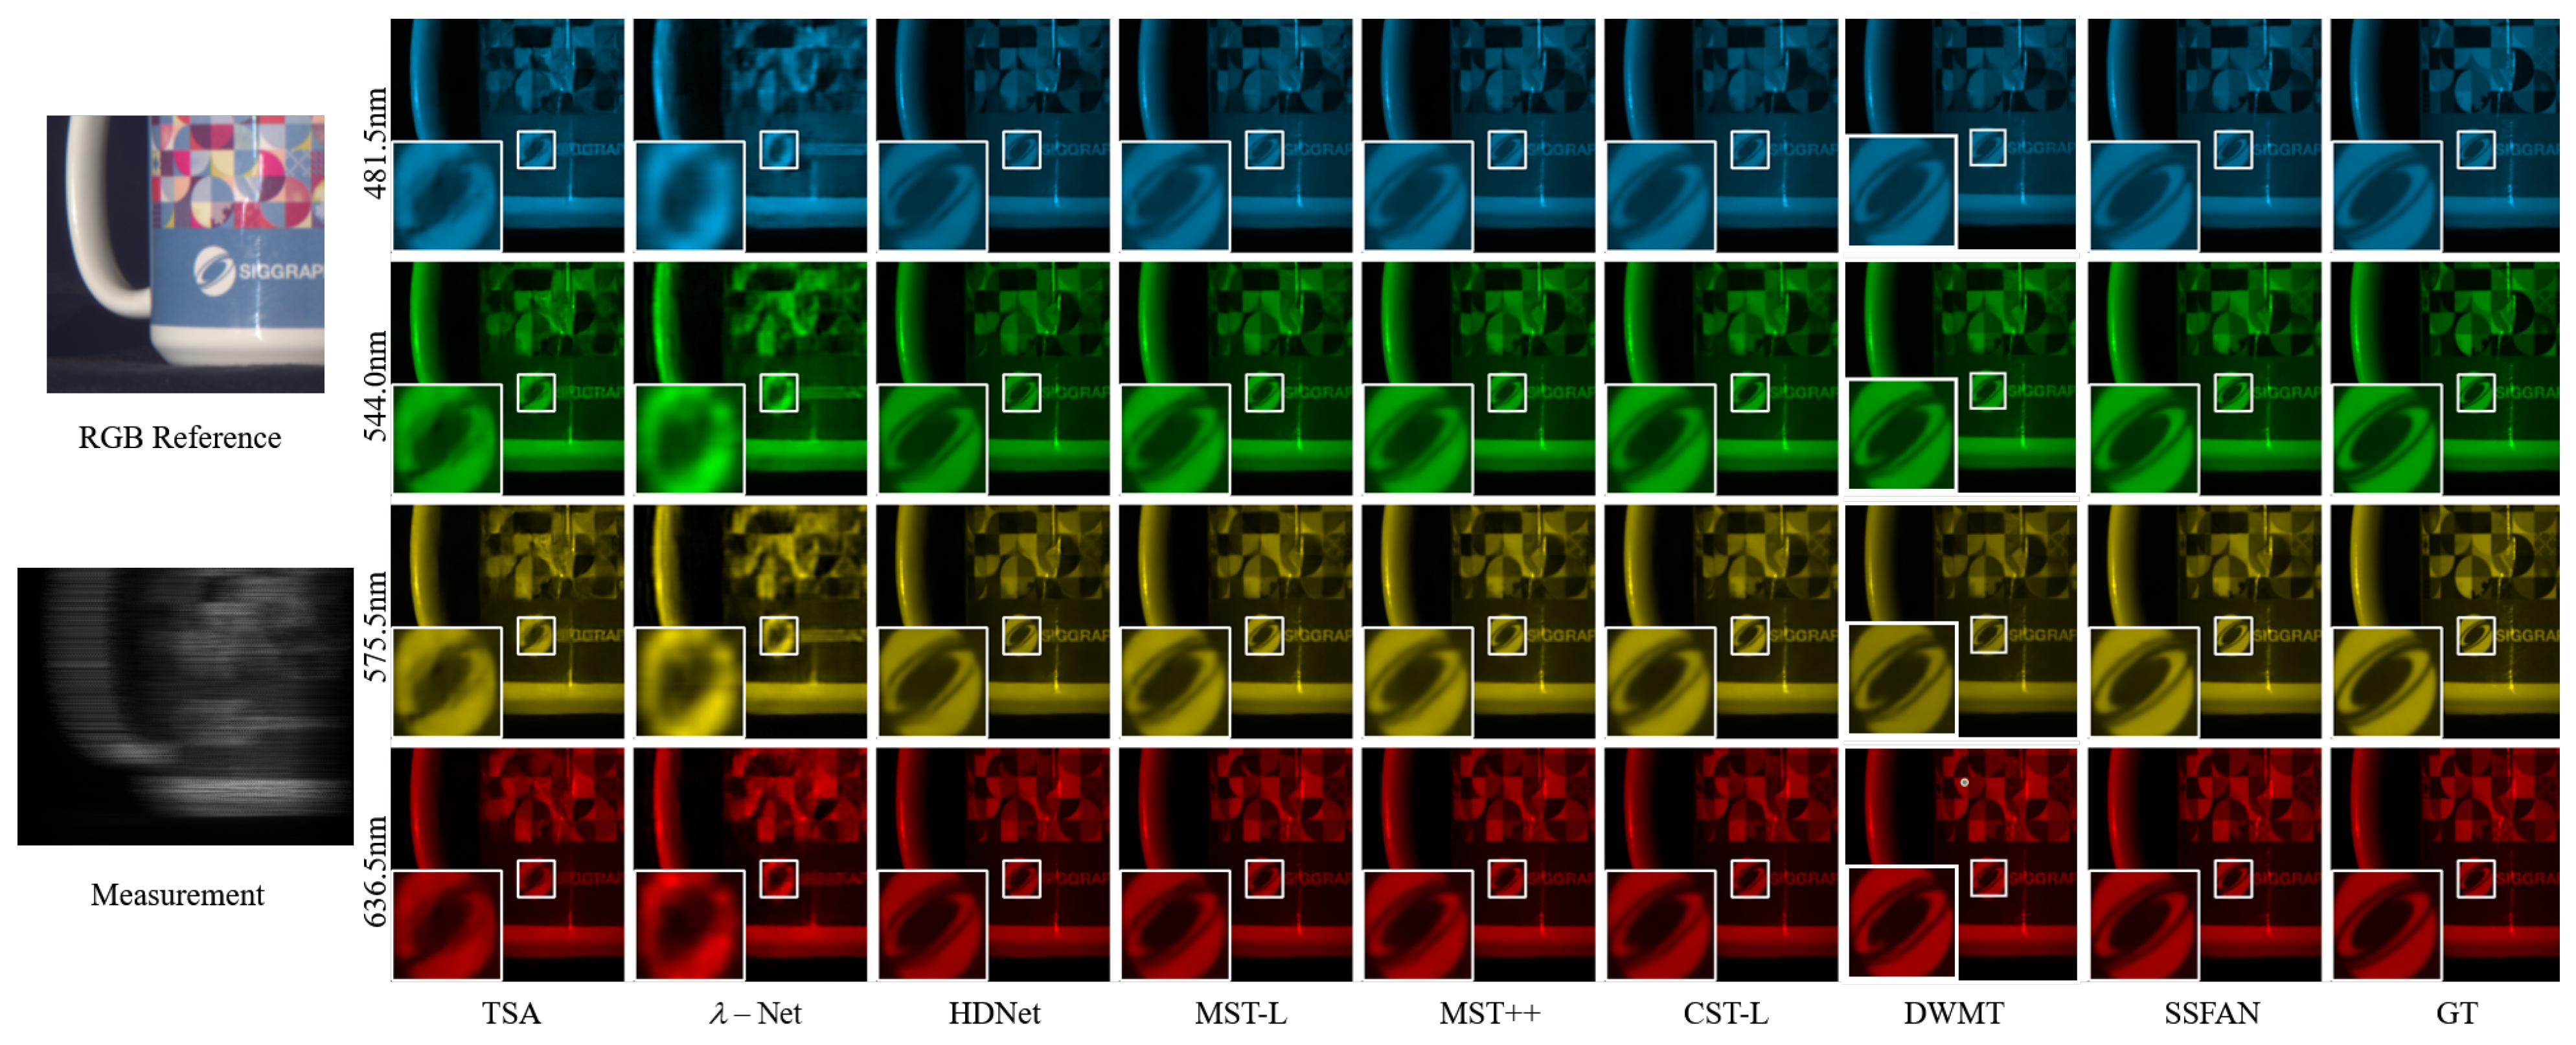
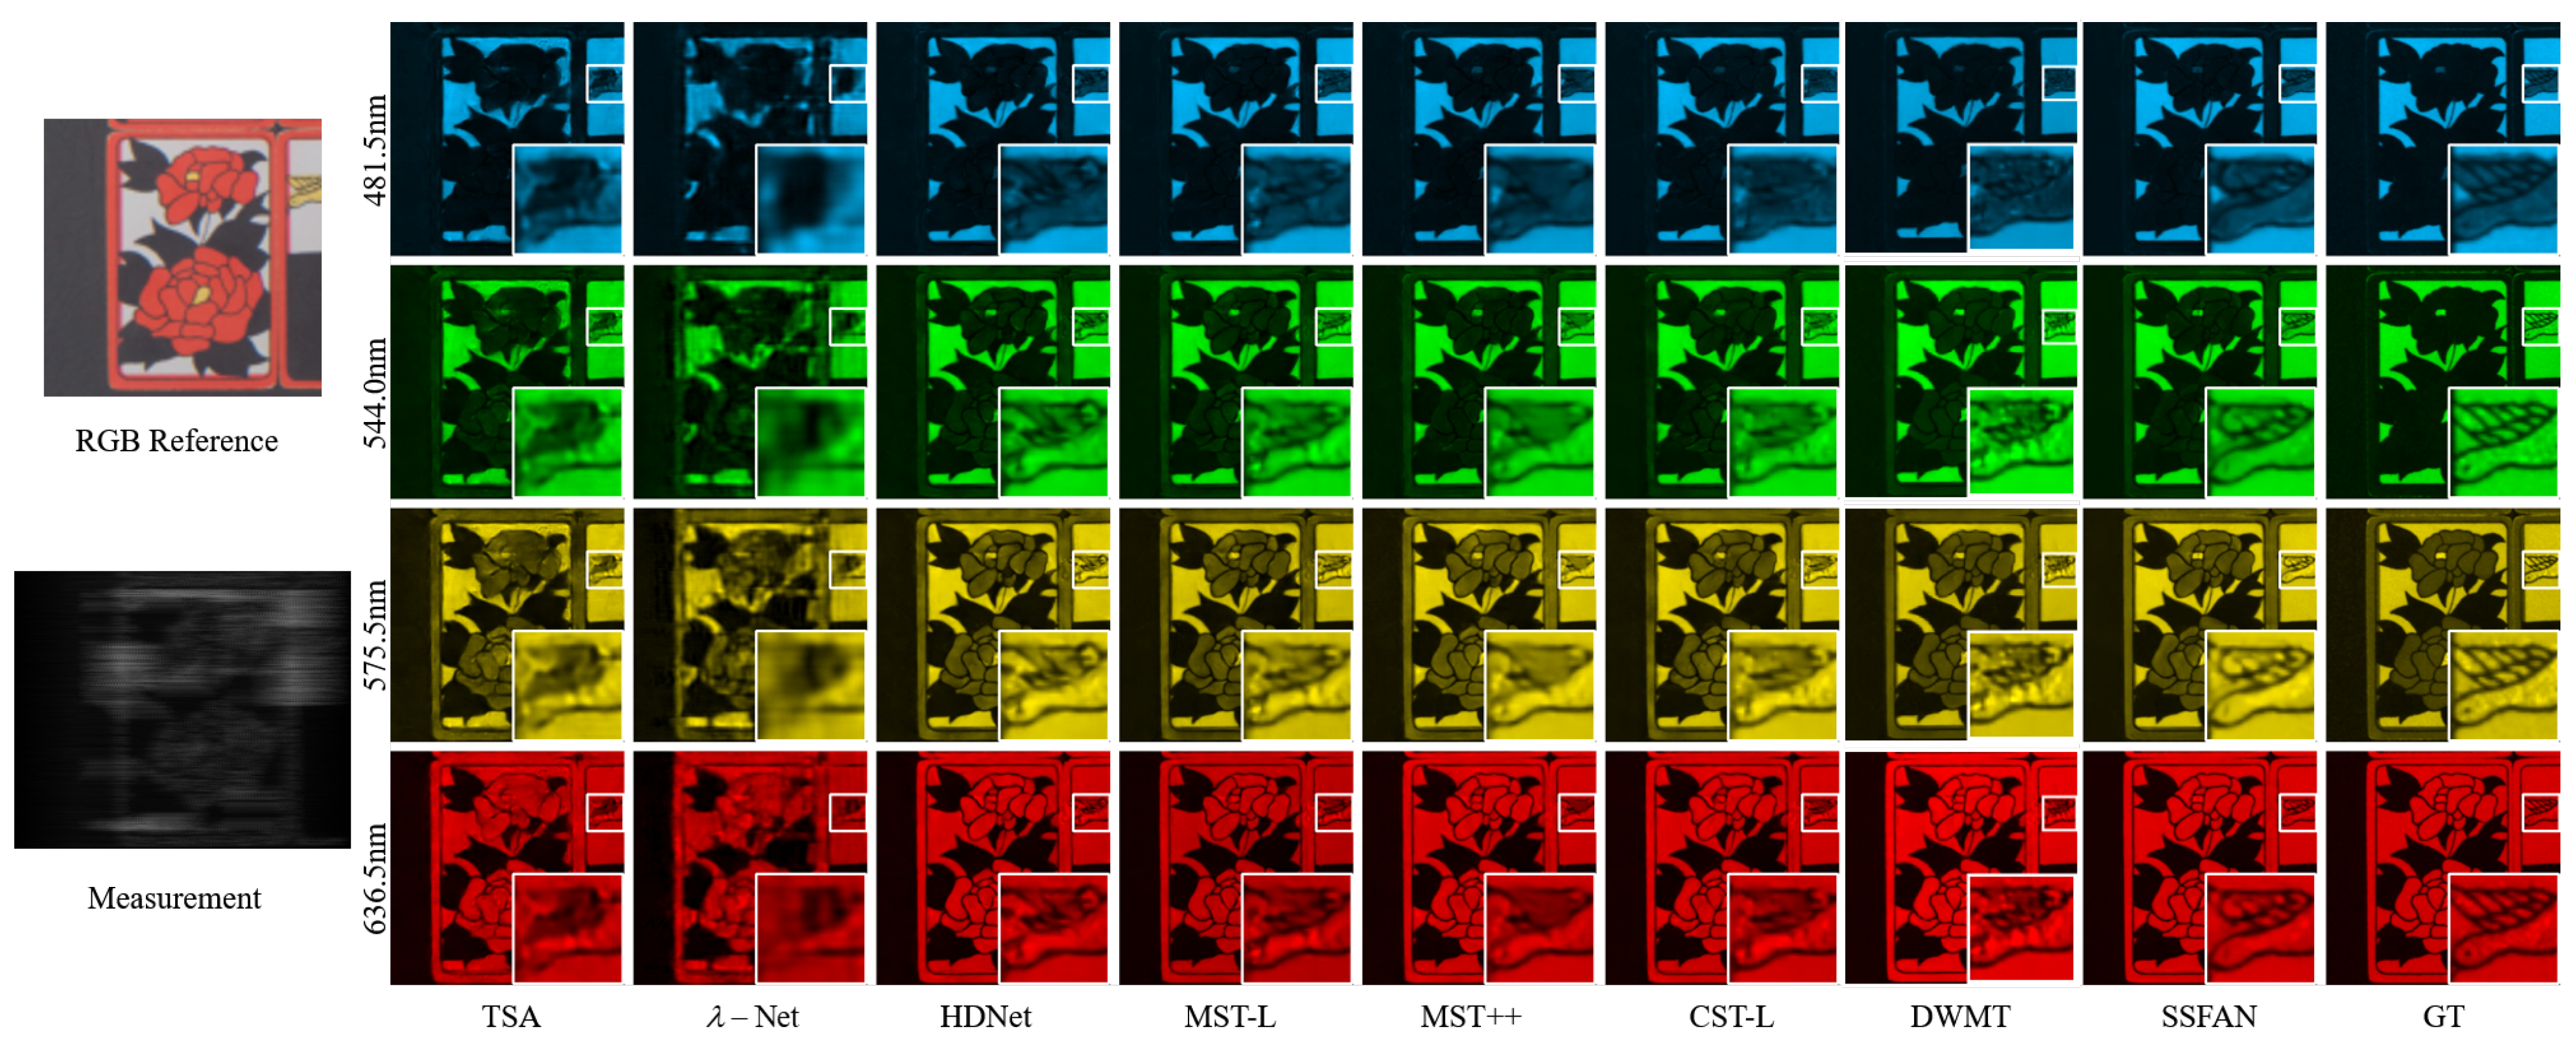
Visualizations of reconstruction results for eight methods in scenes 5 and 7 are illustrated in Figure 7 and Figure 8. For the 28 spectral bands, the 481.5 nm, 544.0 nm, 575.5 nm, and 636.5 nm bands of HSIs are selected, and these wavelength data are converted into images. Additionally, each image includes zoomed-in patches of the regions of interest (ROIs) within white rectangles. Notably, SSFAN reconstructs HSIs with more accurate image structural information and finer details.
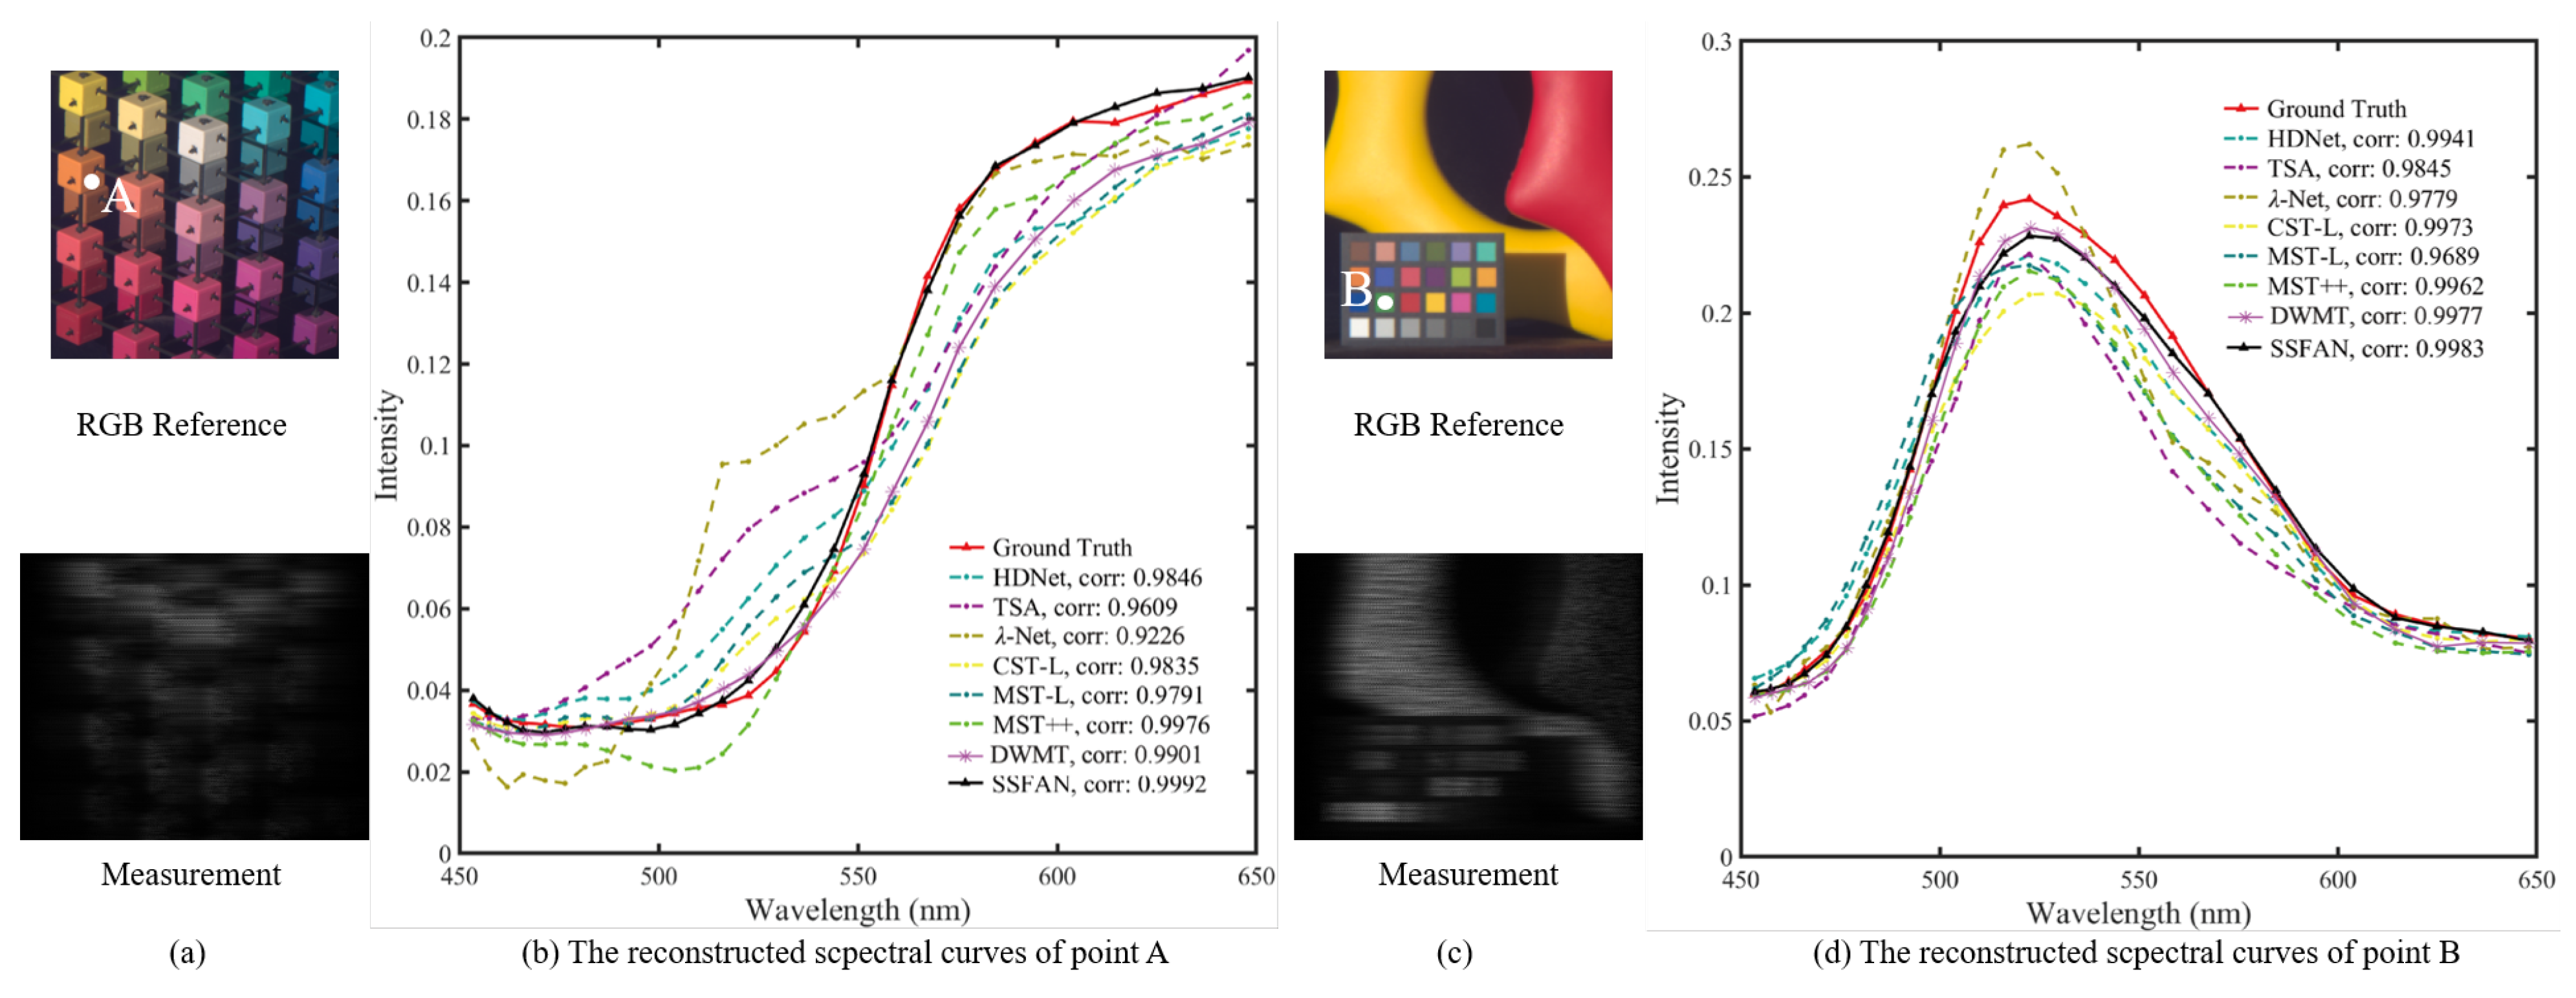
The spectral curves and the correlation coefficients of the spectral curves for selected points of scenes 2 and 3 are illustrated in Figure 9. The correlation coefficient corr is given by
corr ( X , Y ) = cov ( X , Y ) σ X σ Y
Here, cov denotes covariance, and σ X and σ Y denote the variance of X and Y . By comparing the reconstructed spectral signatures with those of other methods, we demonstrate that the proposed SSFAN can achieve higher spectral accuracy than other methods.
In terms of visualization comparison, as shown in Figure 8, the textures in the wings of the bird are reconstructed by SSFAN. On the other hand, the structural information of the same region is not clear in the results of other methods. This is attributed to the proposed FDT module that provides information on different spatial frequency bands to the SSFAN network, thereby enhancing the reconstruction ability for structural information of details in images.

6.4. Performance Evaluation with Real CASSI Data

The effectiveness of SSFAN in reconstructing HSIs from real CASSI measurements is also evaluated. Following the same experimental setup as previous studies on HSI reconstruction of real CASSI images [34,38,40,42], SSFAN is trained using both the CAVE and KAIST datasets with the real mask. To investigate the anti-noise ability of the proposed network, 11-bit shot noise is added during the training process.
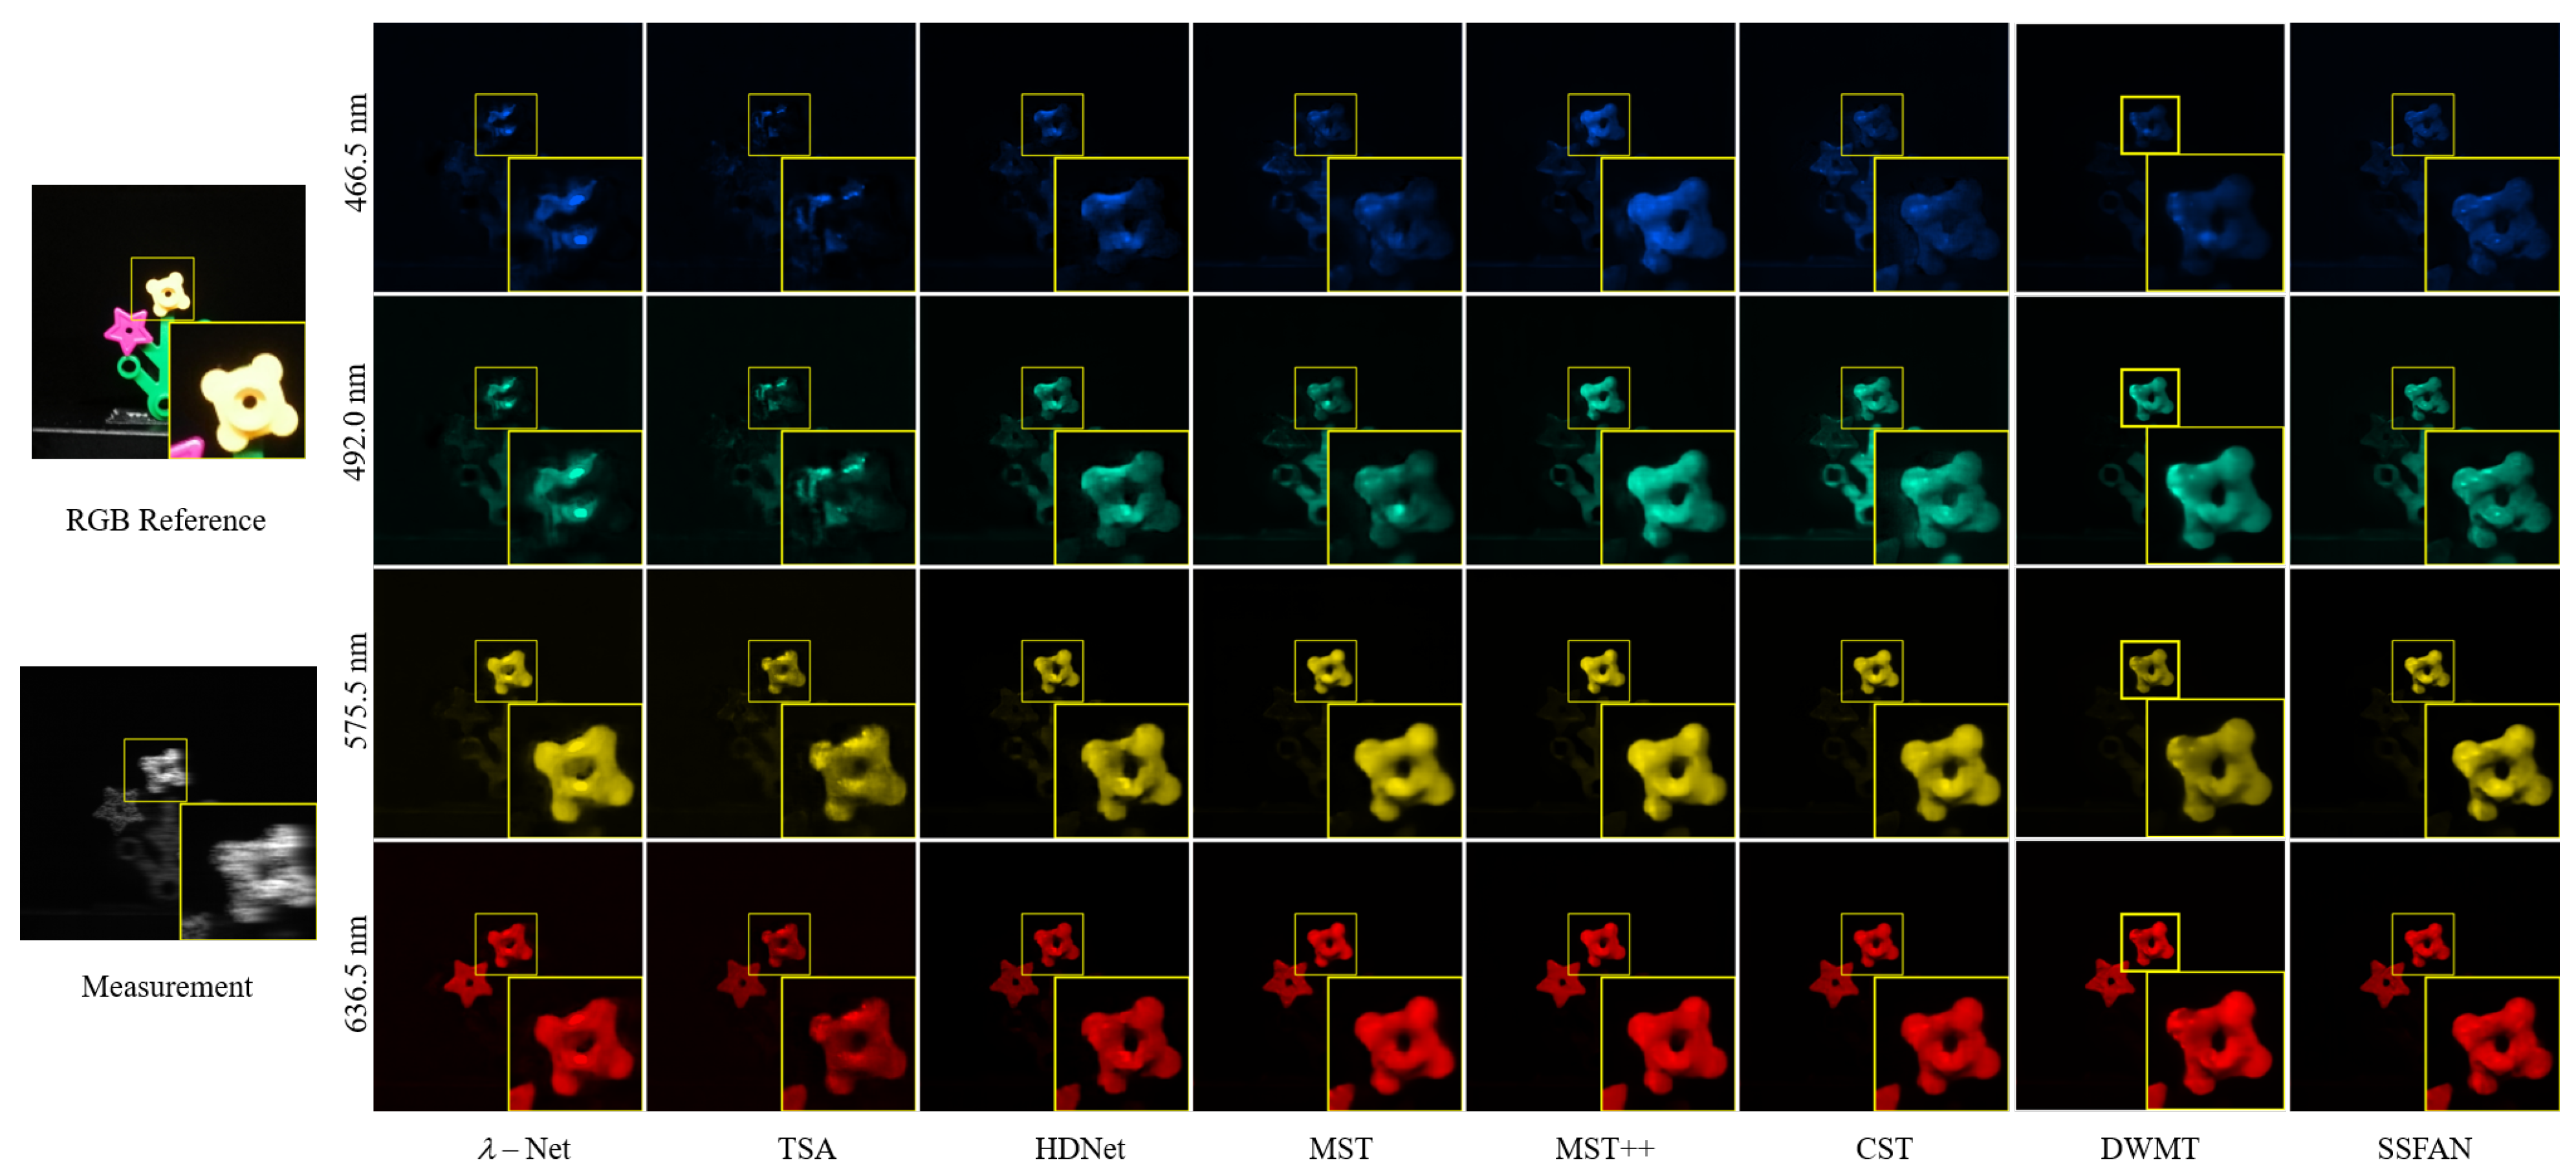
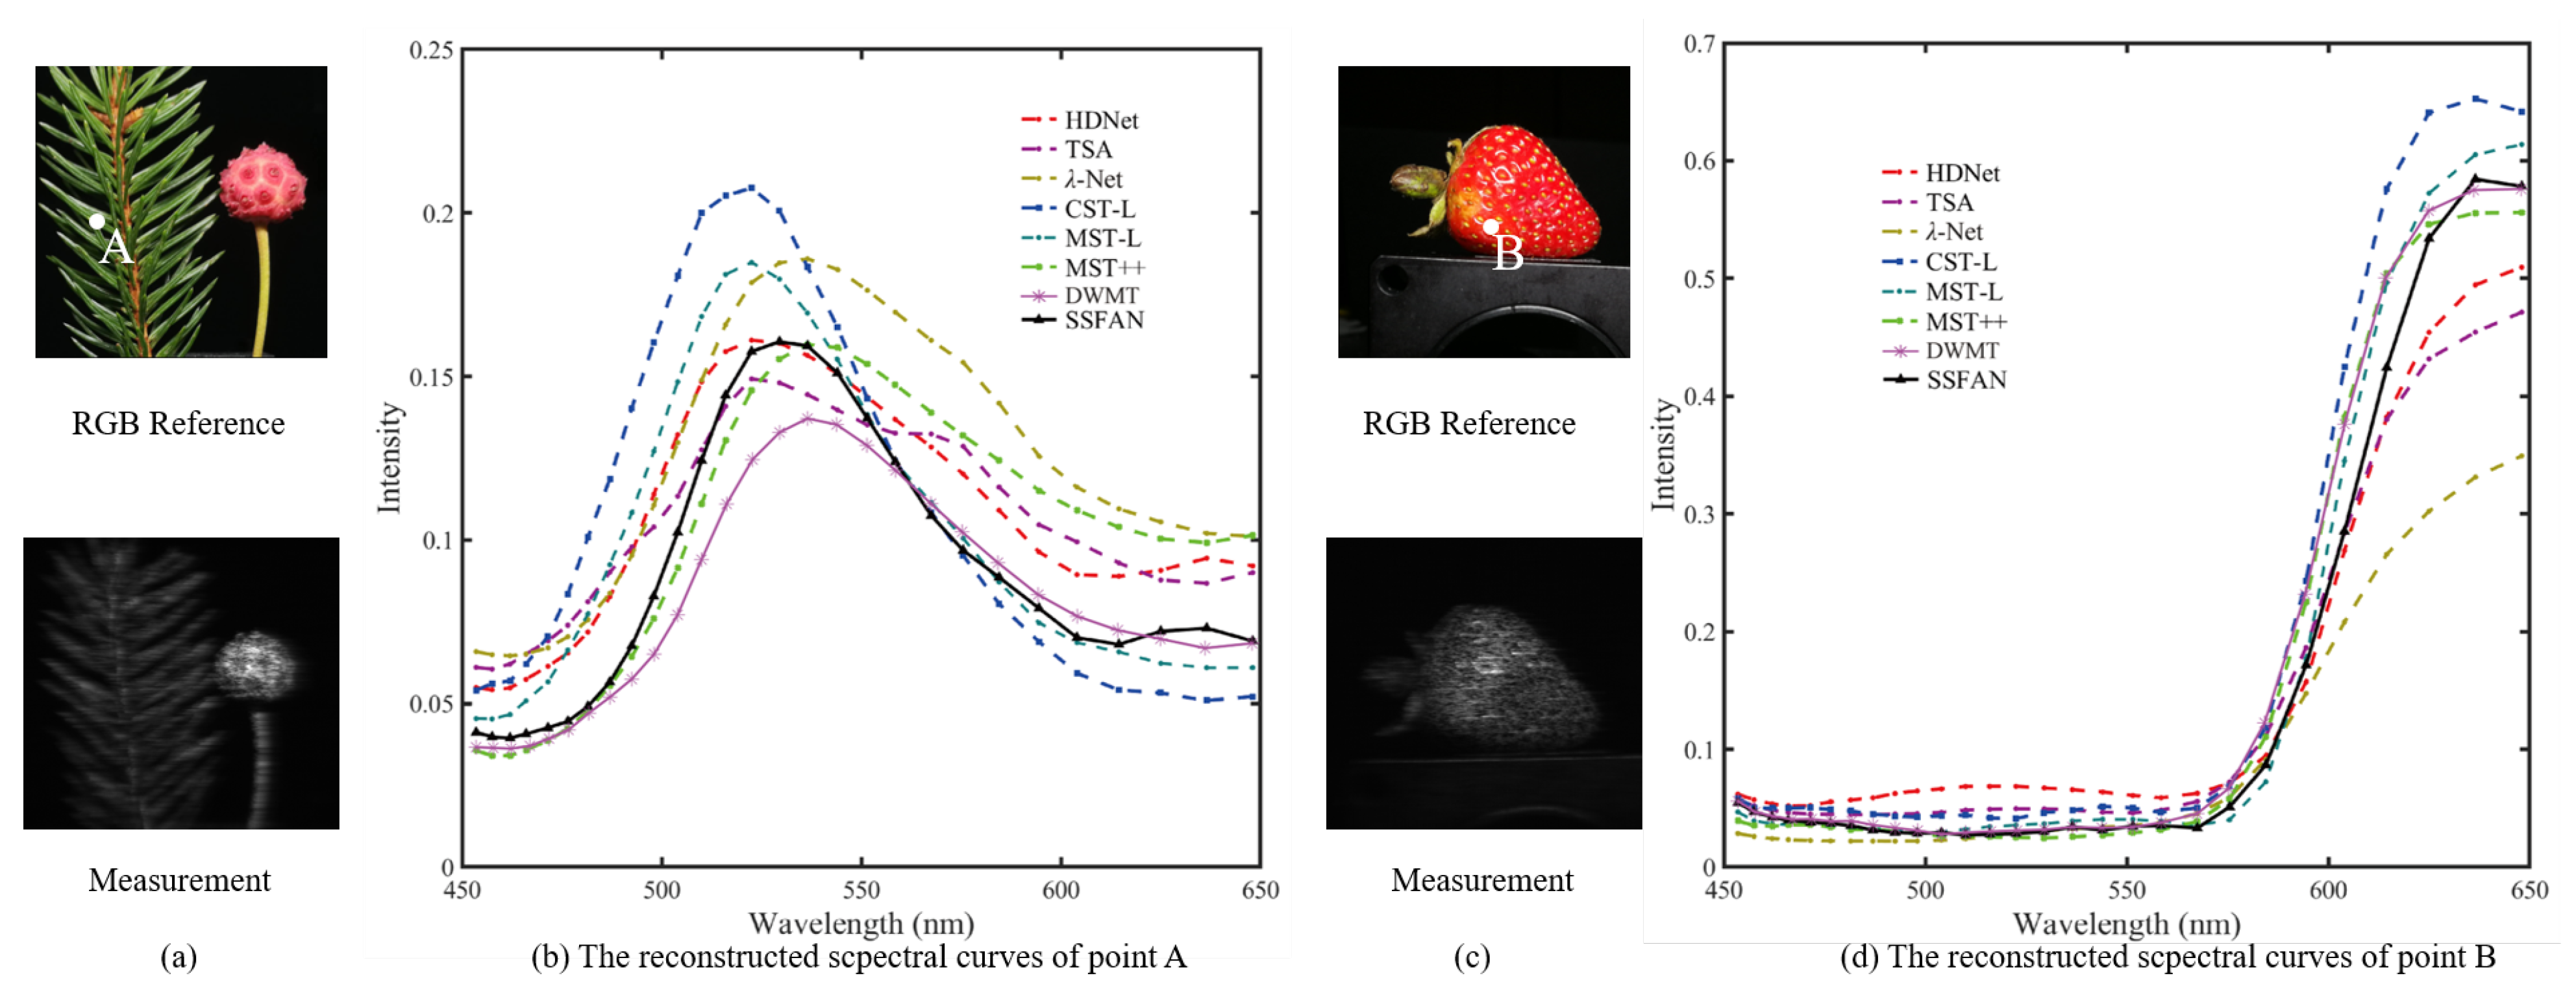
Figure 10 provides the visualization of four spectral bands of the HSIs reconstructed by different methods. Compared with other E2E methods, the spectral images reconstructed by SSFAN exhibit more spatial details. In the top two rows, corresponding to the short-wave bands, the MST and CST methods produce noisy artifacts on the left of the foreground target, whereas the results of SSFAN show no apparent noise. This indicates that our SSFAN is more effective in CASSI reconstruction. Furthermore, the spectral curves of the green branch (point A) and the red strawberry (point B) in the reconstructed HSIs are illustrated in Figure 11b,d for comparison. The spectral curves obtained by SSFAN match the colors of the selected points better than those generated by other methods.

7. Conclusions

In this paper, we propose a novel E2E hyperspectral image reconstruction framework for CASSI. The network, named SSFAN, integrates frequency-domain processing and cross-dimensional feature learning. The FDT is proposed to decompose HSIs into distinct Fourier frequency components, enabling the network to capture multiscale spatial-frequency dependencies. Leveraging the FDT, the network is designed to reconstruct HSIs by fusing spatial–spectral information and specific frequency features. Specifically, SSM employs spatial transformers to extract local spatial structures and preserve spectral consistency, while FDM utilizes channelwise attention to model the inter-correlations of specific Fourier frequency components. To balance computational efficiency and reconstruction quality, channel compression and expansion modules are incorporated to optimize feature dimensionality during frequency processing. Ablation experiments validate the contribution of specific modules and parameters in reconstruction performance. Extensive experiments on both simulated and real SD-CASSI datasets demonstrate that SSFAN outperforms state-of-the-art E2E methods. Visual comparisons reveal that SSFAN reconstructs fine textures (e.g., bird wings) and suppresses noise more effectively than existing methods, confirming its superiority in preserving spatial detail. Future research will explore the perceptual and structural loss functions to further improve the visual quality of the reconstructed HSIs.

Author Contributions

Methodology, H.L.; software, H.L.; validation, X.Y.; formal analysis, H.L. and X.Y.; data curation, X.Y.; writing—original draft preparation, H.L.; writing—review and editing, X.Y., L.S. and Y.Y; visualization, X.Y.; funding acquisition, L.S. and Y.Y. All authors have read and agreed to the published version of the manuscript.

Funding

This research was funded by the National Natural Science Foundation of China under Grant No. 61635002 and by the Fundamental Research Funds for the Central Universities.

Data Availability Statement

The original contributions presented in this study are included in the article. Further inquiries can be directed to the corresponding author.

Conflicts of Interest

The authors declare no conflicts of interest.

References

  1. Borengasser, M.; Hungate, W.S.; Watkins, R. Hyperspectral Remote Sensing: Principles and Applications; CRC Press: Boca Raton, FL, USA, 2007. [Google Scholar]
  2. Aburaed, N.; Alkhatib, M.Q.; Marshall, S.; Zabalza, J.; Al Ahmad, H. A review of spatial enhancement of hyperspectral remote sensing imaging techniques. IEEE J. Sel. Top. Appl. Earth Obs. Remote Sens. 2023, 16, 2275–2300. [Google Scholar] [CrossRef]
  3. Benediktsson, J.A.; Ghamisi, P. Spectral-Spatial Classification of Hyperspectral Remote Sensing Images; Artech House: Boston, MA, USA, 2015. [Google Scholar]
  4. Keshava, N. Distance metrics and band selection in hyperspectral processing with applications to material identification and spectral libraries. IEEE Trans. Geosci. Remote Sens. 2004, 42, 1552–1565. [Google Scholar] [CrossRef]
  5. Fei, B. Hyperspectral imaging in medical applications. In Data Handling in Science and Technology; Elsevier: Amsterdam, The Netherlands, 2019; Volume 32, pp. 523–565. [Google Scholar]
  6. Lu, G.; Fei, B. Medical hyperspectral imaging: A review. J. Biomed. Opt. 2014, 19, 010901. [Google Scholar] [CrossRef] [PubMed]
  7. Shimoni, M.; Haelterman, R.; Perneel, C. Hypersectral imaging for military and security applications: Combining myriad processing and sensing techniques. IEEE Geosci. Remote Sens. Mag. 2019, 7, 101–117. [Google Scholar] [CrossRef]
  8. Yuen, P.W.; Richardson, M. An introduction to hyperspectral imaging and its application for security, surveillance and target acquisition. Imaging Sci. J. 2010, 58, 241–253. [Google Scholar] [CrossRef]
  9. Briottet, X.; Boucher, Y.; Dimmeler, A.; Malaplate, A.; Cini, A.; Diani, M.; Bekman, H.; Schwering, P.; Skauli, T.; Kasen, I.; et al. Military applications of hyperspectral imagery. In Proceedings of the Targets and Backgrounds XII: Characterization and Representation, Orlando (Kissimmee), FL, USA, 17–18 April 2006; SPIE: Bellingham, WA, USA, 2006; Volume 6239, pp. 82–89. [Google Scholar]
  10. Xiong, F.; Zhou, J.; Qian, Y. Material based object tracking in hyperspectral videos. IEEE Trans. Image Process. 2020, 29, 3719–3733. [Google Scholar] [CrossRef]
  11. Van Nguyen, H.; Banerjee, A.; Chellappa, R. Tracking via object reflectance using a hyperspectral video camera. In Proceedings of the 2010 IEEE Computer Society Conference on Computer Vision and Pattern Recognition-Workshops, San Francisco, CA, USA, 13–18 June 2010; IEEE: Piscataway, NJ, USA, 2010; pp. 44–51. [Google Scholar]
  12. Yuan, X.; Brady, D.J.; Katsaggelos, A.K. Snapshot compressive imaging: Theory, algorithms, and applications. IEEE Signal Process. Mag. 2021, 38, 65–88. [Google Scholar] [CrossRef]
  13. Gao, L.; Wang, L.V. A review of snapshot multidimensional optical imaging: Measuring photon tags in parallel. Phys. Rep. 2016, 616, 1–37. [Google Scholar] [CrossRef]
  14. Hu, H.; Zhou, H.; Xu, Z.; Li, Q.; Feng, H.; Chen, Y.; Jiang, T.; Xu, W. Practical snapshot hyperspectral imaging with DOE. Opt. Lasers Eng. 2022, 156, 107098. [Google Scholar] [CrossRef]
  15. Xu, N.; Xu, H.; Chen, S.; Hu, H.; Xu, Z.; Feng, H.; Li, Q.; Jiang, T.; Chen, Y. Snapshot hyperspectral imaging based on equalization designed doe. Opt. Express 2023, 31, 20489–20504. [Google Scholar] [CrossRef]
  16. Wagadarikar, A.; John, R.; Willett, R.; Brady, D. Single disperser design for coded aperture snapshot spectral imaging. Appl. Opt. 2008, 47, B44–B51. [Google Scholar] [CrossRef] [PubMed]
  17. Llull, P.; Liao, X.; Yuan, X.; Yang, J.; Kittle, D.; Carin, L.; Sapiro, G.; Brady, D.J. Coded aperture compressive temporal imaging. Opt. Express 2013, 21, 10526–10545. [Google Scholar] [CrossRef]
  18. He, K.; Wang, X.; Wang, Z.W.; Yi, H.; Scherer, N.F.; Katsaggelos, A.K.; Cossairt, O. Snapshot multifocal light field microscopy. Opt. Express 2020, 28, 12108–12120. [Google Scholar] [CrossRef]
  19. Arce, G.R.; Brady, D.J.; Carin, L.; Arguello, H.; Kittle, D.S. Compressive coded aperture spectral imaging: An introduction. IEEE Signal Process. Mag. 2013, 31, 105–115. [Google Scholar] [CrossRef]
  20. Yin, X.; Su, L.; Chen, X.; Liu, H.; Yan, Q.; Yuan, Y. Hyperspectral Image Reconstruction of SD-CASSI Based on Nonlocal Low-Rank Tensor Prior. IEEE Trans. Geosci. Remote Sens. 2024, 62, 1–15. [Google Scholar] [CrossRef]
  21. Gehm, M.E.; John, R.; Brady, D.J.; Willett, R.M.; Schulz, T.J. Single-shot compressive spectral imaging with a dual-disperser architecture. Opt. Express 2007, 15, 14013–14027. [Google Scholar] [CrossRef] [PubMed]
  22. Xu, P.; Liu, L.; Jia, Y.; Zheng, H.; Xu, C.; Xue, L. A refinement boosted and attention guided deep FISTA reconstruction framework for compressive spectral imaging. IEEE Trans. Geosci. Remote Sens. 2023, 61, 1–12. [Google Scholar] [CrossRef]
  23. Bioucas-Dias, J.M.; Figueiredo, M.A. A new TwIST: Two-step iterative shrinkage/thresholding algorithms for image restoration. IEEE Trans. Image Process. 2007, 16, 2992–3004. [Google Scholar] [CrossRef]
  24. Liu, Y.; Yuan, X.; Suo, J.; Brady, D.J.; Dai, Q. Rank minimization for snapshot compressive imaging. IEEE Trans. Pattern Anal. Mach. Intell. 2018, 41, 2990–3006. [Google Scholar] [CrossRef]
  25. Yuan, X. Generalized alternating projection based total variation minimization for compressive sensing. In Proceedings of the 2016 IEEE International Conference on Image Processing (ICIP), Phoenix, AZ, USA, 25–28 September 2016; IEEE: Piscataway, NJ, USA, 2016; pp. 2539–2543. [Google Scholar]
  26. Zhang, S.; Wang, L.; Fu, Y.; Zhong, X.; Huang, H. Computational hyperspectral imaging based on dimension-discriminative low-rank tensor recovery. In Proceedings of the IEEE/CVF International Conference on Computer Vision, Seoul, Republic of Korea, 27 October–2 November 2019; pp. 10183–10192. [Google Scholar]
  27. Chan, S.H.; Wang, X.; Elgendy, O.A. Plug-and-play ADMM for image restoration: Fixed-point convergence and applications. IEEE Trans. Comput. Imaging 2016, 3, 84–98. [Google Scholar] [CrossRef]
  28. Qiao, M.; Liu, X.; Yuan, X. Snapshot spatial–temporal compressive imaging. Opt. Lett. 2020, 45, 1659–1662. [Google Scholar] [CrossRef]
  29. Meng, Z.; Yu, Z.; Xu, K.; Yuan, X. Self-supervised neural networks for spectral snapshot compressive imaging. In Proceedings of the IEEE/CVF International Conference on Computer Vision, Montreal, QC, Canada, 11–17 October 2021; pp. 2622–2631. [Google Scholar]
  30. Zheng, S.; Liu, Y.; Meng, Z.; Qiao, M.; Tong, Z.; Yang, X.; Han, S.; Yuan, X. Deep plug-and-play priors for spectral snapshot compressive imaging. Photonics Res. 2021, 9, B18–B29. [Google Scholar] [CrossRef]
  31. Yuan, X.; Liu, Y.; Suo, J.; Durand, F.; Dai, Q. Plug-and-play algorithms for video snapshot compressive imaging. IEEE Trans. Pattern Anal. Mach. Intell. 2021, 44, 7093–7111. [Google Scholar] [CrossRef]
  32. Yuan, X.; Liu, Y.; Suo, J.; Dai, Q. Plug-and-play algorithms for large-scale snapshot compressive imaging. In Proceedings of the IEEE/CVF Conference on Computer Vision and Pattern Recognition, Seattle, WA, USA, 14–19 June 2020; pp. 1447–1457. [Google Scholar]
  33. Ma, J.; Liu, X.Y.; Shou, Z.; Yuan, X. Deep tensor admm-net for snapshot compressive imaging. In Proceedings of the IEEE/CVF International Conference on Computer Vision, Seoul, Republic of Korea, 27 October–2 November 2019; pp. 10223–10232. [Google Scholar]
  34. Huang, T.; Dong, W.; Yuan, X.; Wu, J.; Shi, G. Deep gaussian scale mixture prior for spectral compressive imaging. In Proceedings of the IEEE/CVF Conference on Computer Vision and Pattern Recognition, Nashville, TN, USA, 19–25 June 2021; pp. 16216–16225. [Google Scholar]
  35. Cai, Y.; Lin, J.; Wang, H.; Yuan, X.; Ding, H.; Zhang, Y.; Timofte, R.; Gool, L.V. Degradation-aware unfolding half-shuffle transformer for spectral compressive imaging. Adv. Neural Inf. Process. Syst. 2022, 35, 37749–37761. [Google Scholar]
  36. Li, M.; Fu, Y.; Liu, J.; Zhang, Y. Pixel adaptive deep unfolding transformer for hyperspectral image reconstruction. In Proceedings of the IEEE/CVF International Conference on Computer Vision, Paris, France, 2–6 October 2023; pp. 12959–12968. [Google Scholar]
  37. Miao, X.; Yuan, X.; Pu, Y.; Athitsos, V. l-net: Reconstruct hyperspectral images from a snapshot measurement. In Proceedings of the IEEE/CVF International Conference on Computer Vision, Seoul, Republic of Korea, 27 October–2 November 2019; pp. 4059–4069. [Google Scholar]
  38. Meng, Z.; Ma, J.; Yuan, X. End-to-end low cost compressive spectral imaging with spatial-spectral self-attention. In Proceedings of the European Conference on Computer Vision, Glasgow, UK, 23–28 August 2020; Springer: Cham, Switzerland, 2020; pp. 187–204. [Google Scholar]
  39. Hu, X.; Cai, Y.; Lin, J.; Wang, H.; Yuan, X.; Zhang, Y.; Timofte, R.; Van Gool, L. Hdnet: High-resolution dual-domain learning for spectral compressive imaging. In Proceedings of the IEEE/CVF Conference on Computer Vision and Pattern Recognition, New Orleans, LA, USA, 19–24 June 2022; pp. 17542–17551. [Google Scholar]
  40. Cai, Y.; Lin, J.; Hu, X.; Wang, H.; Yuan, X.; Zhang, Y.; Timofte, R.; Van Gool, L. Mask-guided spectral-wise transformer for efficient hyperspectral image reconstruction. In Proceedings of the IEEE/CVF Conference on Computer Vision and Pattern Recognition, New Orleans, LA, USA, 19–24 June 2022; pp. 17502–17511. [Google Scholar]
  41. Cai, Y.; Lin, J.; Lin, Z.; Wang, H.; Zhang, Y.; Pfister, H.; Timofte, R.; Van Gool, L. Mst++: Multi-stage spectral-wise transformer for efficient spectral reconstruction. In Proceedings of the IEEE/CVF Conference on Computer Vision and Pattern Recognition, New Orleans, LA, USA, 19–24 June 2022; pp. 745–755. [Google Scholar]
  42. Cai, Y.; Lin, J.; Hu, X.; Wang, H.; Yuan, X.; Zhang, Y.; Timofte, R.; Van Gool, L. Coarse-to-fine sparse transformer for hyperspectral image reconstruction. In Proceedings of the European Conference on Computer Vision, Milan, Italy, 23–27 October 2022; Springer: Berlin/Heidelberg, Germany, 2022; pp. 686–704. [Google Scholar]
  43. Luo, F.; Chen, X.; Gong, X.; Wu, W.; Guo, T. Dual-window multiscale transformer for hyperspectral snapshot compressive imaging. In Proceedings of the AAAI Conference on Artificial Intelligence, Vancouver, BC, Canada, 26–27 February 2024; Volume 38, pp. 3972–3980. [Google Scholar]
  44. LeCun, Y.; Bottou, L.; Bengio, Y.; Haffner, P. Gradient-based learning applied to document recognition. Proc. IEEE 1998, 86, 2278–2324. [Google Scholar] [CrossRef]
  45. Bahdanau, D. Neural machine translation by jointly learning to align and translate. arXiv 2014, arXiv:1409.0473. [Google Scholar]
  46. Vaswani, A.; Shazeer, N.; Parmar, N.; Uszkoreit, J.; Jones, L.; Gomez, A.N.; Kaizer, L.; Polosukhin, I. Attention is all you need. In Proceedings of the 31st International Conference on Neural Information Processing Systems, Long Beach, CA, USA, 4–9 December 2017; pp. 6000–6010. [Google Scholar]
  47. Ronneberger, O.; Fischer, P.; Brox, T. U-net: Convolutional networks for biomedical image segmentation. In Proceedings of the Medical Image Computing and Computer-Assisted Intervention—MICCAI 2015: 18th International Conference, Munich, Germany, 5–9 October 2015; proceedings, part III 18. Springer: Berlin/Heidelberg, Germany, 2015; pp. 234–241. [Google Scholar]
  48. Mehraban, S.; Adeli, V.; Taati, B. Motionagformer: Enhancing 3d human pose estimation with a transformer-gcnformer network. In Proceedings of the IEEE/CVF Winter Conference on Applications of Computer Vision, Waikoloa, HI, USA, 3–8 January 2024; pp. 6920–6930. [Google Scholar]
  49. Zhou, S.; Chen, D.; Pan, J.; Shi, J.; Yang, J. Adapt or perish: Adaptive sparse transformer with attentive feature refinement for image restoration. In Proceedings of the IEEE/CVF Conference on Computer Vision and Pattern Recognition, Seattle, WA, USA, 16–22 June 2024; pp. 2952–2963. [Google Scholar]
  50. Gao, J.; Zhang, Y.; Geng, X.; Tang, H.; Bhatti, U.A. PE-Transformer: Path enhanced transformer for improving underwater object detection. Expert Syst. Appl. 2024, 246, 123253. [Google Scholar] [CrossRef]
  51. Xu, L.; Bennamoun, M.; Boussaid, F.; Laga, H.; Ouyang, W.; Xu, D. Mctformer+: Multi-class token transformer for weakly supervised semantic segmentation. IEEE Trans. Pattern Anal. Mach. Intell. 2024, 46, 8380–8395. [Google Scholar] [CrossRef]
  52. Liu, Z.; Lin, Y.; Cao, Y.; Hu, H.; Wei, Y.; Zhang, Z.; Lin, S.; Guo, B. Swin transformer: Hierarchical vision transformer using shifted windows. In Proceedings of the IEEE/CVF International Conference on Computer Vision, Montreal, BC, Canada, 11–17 October 2021; pp. 10012–10022. [Google Scholar]
  53. Chicchi, L.; Buffoni, L.; Febbe, D.; Giambagli, L.; Marino, R.; Fanelli, D. Automatic Input Feature Relevance via Spectral Neural Networks. arXiv 2024, arXiv:2406.01183. [Google Scholar] [CrossRef]
  54. Fujieda, S.; Takayama, K.; Hachisuka, T. Wavelet convolutional neural networks. arXiv 2018, arXiv:1805.08620. [Google Scholar] [CrossRef]
  55. Liu, G.; Zhou, W.; Geng, M. Automatic Seizure Detection Based on S-Transform and Deep Convolutional Neural Network. Int. J. Neural Syst. 2020, 30, 1950024. [Google Scholar] [CrossRef]
  56. Bauer, E.; Kohavi, R. An empirical comparison of voting classification algorithms: Bagging, boosting, and variants. Mach. Learn. 1999, 36, 105–139. [Google Scholar] [CrossRef]
  57. Zhang, R.; Isola, P.; Efros, A.A.; Shechtman, E.; Wang, O. The unreasonable effectiveness of deep features as a perceptual metric. In Proceedings of the IEEE Conference on Computer Vision and Pattern Recognition, Salt Lake City, UT, USA, 18–22 June 2018; pp. 586–595. [Google Scholar]
  58. Xu, Z.Q.J.; Zhang, Y.; Luo, T.; Xiao, Y.; Ma, Z. Frequency principle: Fourier analysis sheds light on deep neural networks. arXiv 2019, arXiv:1901.06523. [Google Scholar] [CrossRef]
  59. Xu, K.; Qin, M.; Sun, F.; Wang, Y.; Chen, Y.K.; Ren, F. Learning in the frequency domain. In Proceedings of the IEEE/CVF Conference on Computer Vision and Pattern Recognition, Seattle, WA, USA, 14–19 June 2020; pp. 1740–1749. [Google Scholar]
  60. Wei, D.; Deng, Y. Redistributed invariant redundant fractional wavelet transform and its application in watermarking algorithm. Expert Syst. Appl. 2025, 262, 125707. [Google Scholar] [CrossRef]
  61. Zhang, Y.; Zheng, P.; Jiang, J.; Xiao, P.; Gao, X. FCIR: Rethink aerial image super resolution with Fourier analysis. In Proceedings of the ICASSP 2023-2023 IEEE International Conference on Acoustics, Speech and Signal Processing (ICASSP), Rhodes Island, Greece, 4–10 June 2023; IEEE: Piscataway, NJ, USA, 2023; pp. 1–5. [Google Scholar]
  62. Jiang, L.; Dai, B.; Wu, W.; Loy, C.C. Focal frequency loss for image reconstruction and synthesis. In Proceedings of the IEEE/CVF International Conference on Computer Vision, Montreal, QC, Canada, 11–17 October 2021; pp. 13919–13929. [Google Scholar]
  63. Karami, A.; Zanj, B.; Sarkaleh, A.K. Persian sign language (PSL) recognition using wavelet transform and neural networks. Expert Syst. Appl. 2011, 38, 2661–2667. [Google Scholar] [CrossRef]
  64. Jamali, A.; Mahdianpari, M.; Mohammadimanesh, F.; Bhattacharya, A.; Homayouni, S. PolSAR image classification based on deep convolutional neural networks using wavelet transformation. IEEE Geosci. Remote Sens. Lett. 2022, 19, 1–5. [Google Scholar] [CrossRef]
  65. Zhang, H.; Wang, W.; Deng, J.; Guo, Y.; Liu, S.; Zhang, J. MASFF-Net: Multi-azimuth scattering feature fusion network for SAR target recognition. IEEE J. Sel. Top. Appl. Earth Obs. Remote Sens. 2025, 18, 19425–19440. [Google Scholar] [CrossRef]
  66. Wan, X.; Chen, F.; Mo, D.; Liu, H.; Li, Z.; Hu, K. FS-CGNet: Frequency Spectral-Channel Fusion and Cross-Scale Global Aggregation Network for Hyperspectral Image Classification. IEEE Trans. Geosci. Remote Sens. 2025, 63, 1–22. [Google Scholar] [CrossRef]
  67. Yasuma, F.; Mitsunaga, T.; Iso, D.; Nayar, S.K. Generalized assorted pixel camera: Postcapture control of resolution, dynamic range, and spectrum. IEEE Trans. Image Process. 2010, 19, 2241–2253. [Google Scholar] [CrossRef]
  68. Choi, I.; Jeon, D.S.; Nam, G.; Gutierrez, D.; Kim, M.H. High-quality hyperspectral reconstruction using a spectral prior. ACM Trans. Graph. (TOG) 2017, 36, 1–13. [Google Scholar] [CrossRef]
  69. Kingma, D.P. Adam: A method for stochastic optimization. arXiv 2014, arXiv:1412.6980. [Google Scholar]
  70. Loshchilov, I.; Hutter, F. Sgdr: Stochastic gradient descent with warm restarts. arXiv 2016, arXiv:1608.03983. [Google Scholar]
Figure 1. The principle of CASSI. The input HSI is encoded by an optical imaging system, and then an E2E network is used to reconstruct the HSI from the compressed measurement.
Remotesensing 17 03382 g001
Figure 2. The proposed framework of the reconstruction model for CASSI.
Remotesensing 17 03382 g002
Figure 3. The process of frequency-division transformation.
Remotesensing 17 03382 g003
Figure 4. Schematic frameworks of proposed (a) spatial–spectral module and (b) frequency-division module.
Remotesensing 17 03382 g004
Figure 5. Architectural schematics of principal blocks. (a) Structure of the non-local spatial attention block (NSAB), which integrates a non-local spatial attention (NSA) module to extract spatial attention features. (b) Structure of the non-local channel attention block (NCAB), which incorporates a non-local channel attention (NCA) module to extract channel attention features. (c) Configuration of the feedforward network (FFN).
Remotesensing 17 03382 g005
Figure 6. The loss function of SSFAN.
Remotesensing 17 03382 g006
Figure 7. The reconstructed spectral images of scene 5. (Left) RGB image and simulated SD-CASSI measurement. (Right) Visualizations of GT and reconstruction results in four spectral bands, which are illustrated in corresponding colors. The respective PSNR, SSIM, and SAM values of eight methods are as follows: TSA (29.39 dB/0.884/0.117), λ -Net (26.19 dB/0.817/0.285), HDNet (32.69 dB/0.946/0.089), MST-L (33.38 dB/0.947/0.101), MST++ (33.28 dB/0.952/0.081), CST-L (33.25 dB/0.955/0.078), DWMT (34.05 dB/0.962/0.071), and proposed SSFAN (34.85 dB/0.969/0.064).
Remotesensing 17 03382 g007
Figure 8. The reconstructed spectral images of scene 7. (Left) RGB image and simulated SD-CASSI measurement. (Right) Visualizations of GT and reconstruction results in four spectral bands, which are illustrated in corresponding colors. The respective PSNR, SSIM, and SAM values of eight methods are as follows: TSA (20.32 dB/0.878/0.133), λ -Net (26.47 dB/0.806/0.246), HDNet (33.67 dB/0.926/0.114), MST-L (35.87 dB/0.925/0.110), MST++ (34.35 dB/0.934/0.103), CST-L (36.58 dB/0.944/0.099), DWMT (35.29 dB/0.948/0.092), and proposed SSFAN (36.14 dB/0.955/0.086).
Remotesensing 17 03382 g008
Figure 9. The reconstructed spectral curves of the following methods: TSA, λ -Net, HDNet, MST-L, MST++, CST-L, DWMT, and proposed SSFAN. (a) RGB image and corresponding simulated SD-CASSI measurement of scene 2. (b) Reconstructed GT spectral curves of point A by eight E2E networks. The correlation coefficients between the reconstructed curves and the GT are listed. (c) RGB image and corresponding simulated CASSI measurement of scene 3. (d) Reconstructed spectral curves of point B by eight E2E networks. The correlation coefficients between the reconstructed curves and the GT are listed.
Remotesensing 17 03382 g009
Figure 10. (Left) Reference RGB image and corresponding real SD-CASSI measurement. (Right) Visualization of four spectral bands reconstructed by eight E2E networks. Different spectral bands are illustrated in corresponding colors.
Remotesensing 17 03382 g010
Figure 11. The reconstructed spectral curves of the following methods: TSA, λ -Net, HDNet, MST-L, MST++, CST-L, DWMT, and proposed SSFAN. (a) Reference RGB image and corresponding real SD-CASSI measurement. (b) The spectral curves of point A reconstructed by eight E2E networks. (c) Reference RGB image and corresponding real CASSI measurement. (d) The spectral curves of point B reconstructed by eight methods.
Remotesensing 17 03382 g011
Table 1. Ablation study of the number of frequency bands in the FDT on the simulation dataset; the average PSNR, SSIM and SAM are listed. The optimal results are highlighted in bold within the table.
Number of Frequency BandsPSNRSSIMSAM
336.700.9640.097
436.820.9640.093
537.020.9660.091
636.930.9650.092
736.980.9650.094
Table 2. Ablation study of the number of compressed channels in the CCM and CEM on the simulation dataset; the average PSNR, SSIM, SAM, speed (GFLOPs) and parameter count (Params) are listed. The optimal results are highlighted in bold within the table.
Number of Compressed ChannelsPSNRSSIMSAMGFLOPsParams
2836.730.9640.09789.464.24 M
4036.910.9640.09599.294.97 M
5637.020.9650.091117.286.34 M
6436.390.9630.100128.447.19 M
Table 3. Ablation study of the CCM and CEM.
ModelGFLOPsParams
w/o CCE and CEM304.0820.82 M
w/ CCE and CEM117.286.34 M
Table 4. Ablation study for sub-modules of the SFDN on the simulation dataset; the average PSNR, SSIM and SAM are listed. The optimal results are highlighted in bold within the table.
SSMFDMPSNRSSIMSAM
36.910.9630.100
36.770.9650.976
37.020.9650.091
Table 5. Ablation study of the FDT and convolution layer on the simulation dataset; the average PSNR, SSIM, and SAM are listed. The optimal results are highlighted in bold within the table.
OperationPSNRSSIMSAM
FDT37.020.9650.091
Convoluton Layer36.690.9650.095
Table 6. Comparison between the proposed network and open-source E2E methods on ten test scenes (S1–S10). The PSNR, SSIM, SAM, speed (FLOPs), and parameter count (Params) are listed. The optimal results are highlighted in bold within the table.
MethodsParamsGFLOPsS1S2S3S4S5S6S7S8S9S10Avg
30.1028.4627.7337.0126.1928.6426.4726.0927.5027.1328.53
λ -net62.64 M117.980.8490.8050.8700.9340.8170.8530.8060.8310.8260.8160.841
0.2470.3040.2720.4200.2850.4540.2460.4810.2770.4540.344
32.0331.0032.2539.1929.3931.4420.3229.3530.0129.5931.46
TSA-Net44.25 M110.060.8920.8580.9150.9530.8840.9080.8780.8880.8900.8740.894
0.1520.1810.1290.1460.1170.1690.1330.1990.1340.1670.153
35.1435.6736.0342.3032.6934.4633.6732.4834.8932.3834.97
HDNet2.37 M154.760.9350.9400.9430.9690.9460.9520.9260.9410.9420.9370.943
0.1290.1420.0970.1020.0890.1200.1140.1420.1110.1190.117
35.4035.8736.5142.2732.7734.8035.8732.6735.3932.5035.18
MST-L2.03 M28.150.9410.9440.9530.9730.9470.9550.9250.9480.9490.9410.957
0.1230.1420.1060.1300.1010.1370.1100.1800.1300.1460.131
35.8036.2337.3442.6333.3835.3834.3533.7136.6733.3835.99
MST++1.33 M19.420.9430.9470.9570.9730.9520.9570.9340.9530.9530.9450.951
0.1180.1300.0800.1210.0810.1150.1030.1450.1000.1160.111
35.9636.8438.1642.4433.2535.7236.5834.3436.5133.0936.28
CST-L3.00 M27.810.9490.9550.9620.9750.9550.9630.9440.9610.9570.9450.956
0.1160.1180.0820.0990.0780.1040.0990.1190.1010.1020.102
36.5437.8538.5944.6634.0536.2435.2934.6237.5234.0536.94
DWMT14.48 M46.710.9570.9630.9640.9840.9620.9700.9480.9670.9650.9580.964
0.1090.1140.0730.0970.0710.1030.0920.1190.0880.0980.096
37.4138.8538.1943.8434.8537.0736.1434.8037.4233.8237.24
SSFAN6.34 M117.280.9650.9710.9650.9850.9690.9730.9550.9690.9650.9590.968
0.1010.1030.0730.0770.0640.0830.0860.0970.0860.0890.086
Disclaimer/Publisher’s Note: The statements, opinions and data contained in all publications are solely those of the individual author(s) and contributor(s) and not of MDPI and/or the editor(s). MDPI and/or the editor(s) disclaim responsibility for any injury to people or property resulting from any ideas, methods, instructions or products referred to in the content.