Article

Full-Cycle Evaluation of Multi-Source Precipitation Products for Hydrological Applications in the Magat River Basin, Philippines

by
Jerome G. Gacu
1,2,3,
Sameh Ahmed Kantoush
2 and
Binh Quang Nguyen
4,*
1
Department of Urban Management, Kyoto University, Nishikyo, Kyoto 615-8246, Japan
2
Disaster Prevention Research Institute, Kyoto University, Gokasho, Uji, Kyoto 611-0011, Japan
3
Department of Civil Engineering, College of Engineering and Technology, Romblon State University, Liwanag, Odiongan 5505, Romblon, Philippines
4
Faculty of Water Resources Engineering, The University of Danang–University of Science and Technology, Da Nang 550000, Vietnam
*
Author to whom correspondence should be addressed.
Remote Sens. 2025, 17(19), 3375; https://doi.org/10.3390/rs17193375
Submission received: 1 August 2025 / Revised: 1 October 2025 / Accepted: 6 October 2025 / Published: 7 October 2025

Abstract

Highlights

Full-cycle evaluation of satellite precipitation products:
  • Developed an integrated framework with bias correction and multi-criteria ranking.
  • Nine SPPs showed distinct seasonal strengths in the Magat River Basin, Philippines.
Implications of the approach for hydrological applications:
  • Corrected SPPs improve flood forecasting, drought monitoring, and water balance.
  • Provides a replicable method for data-scarce, localized, and ungauged basins.

Abstract

Satellite Precipitation Products (SPPs) play a crucial role in hydrological modeling, particularly in data-scarce and climate-sensitive basins such as the Magat River Basin (MRB), Philippines—one of Southeast Asia’s most typhoon-prone and infrastructure-critical watersheds. This study presents the first full-cycle evaluation of nine widely used multi-source precipitation products (2000–2024), integrating raw validation against rain gauge observations, bias correction using quantile mapping, and post-correction re-ranking through an Entropy Weight Method–TOPSIS multi-criteria decision analysis (MCDA). Before correction, SM2RAIN-ASCAT demonstrated the strongest statistical performance, while CHIRPS and ClimGridPh-RR exhibited robust detection skills and spatial consistency. Following bias correction, substantial improvements were observed across all products, with CHIRPS markedly reducing systematic errors and ClimGridPh-RR showing enhanced correlation and volume reliability. Biases were decreased significantly, highlighting the effectiveness of quantile mapping in improving both seasonal and annual precipitation estimates. Beyond conventional validation, this framework explicitly aligns SPP evaluation with four critical hydrological applications: flood detection, drought monitoring, sediment yield modeling, and water balance estimation. The analysis revealed that SM2RAIN-ASCAT is most suitable for monitoring seasonal drought and dry periods, CHIRPS excels in detecting high-intensity and erosive rainfall events, and ClimGridPh-RR offers the most consistent long-term volume-based estimates. By integrating validation, correction, and application-specific ranking, this study provides a replicable blueprint for operational SPP assessment in monsoon-dominated, data-limited basins. The findings underscore the importance of tailoring product selection to hydrological purposes, supporting improved flood early warning, drought preparedness, sediment management, and water resources governance under intensifying climatic extremes.

1. Introduction

Precipitation is a fundamental driver of the hydrological cycle and plays a critical role in regulating water resources, agricultural productivity, flood dynamics, and ecosystem stability [1,2]. Understanding the behavior of precipitation and quantifying accurate and timely precipitation information is crucial for hydroclimatic studies, flood forecasting, drought monitoring, and water resource management, especially in regions with complex terrain and varying climatic conditions [3,4,5]. Ground-based rain gauge networks are traditionally considered the most accurate method for measuring precipitation at a specific location [2,6,7]. However, their sparse distribution, especially in mountainous regions, rural areas, and developing countries, severely limits the ability to capture the spatial variability of precipitation [8,9,10]. Installing, maintaining, and calibrating rain gauges requires substantial financial and logistical resources, further constraining their availability in remote or politically unstable regions [4,11]. Moreover, rain gauges inherently provide only point-scale measurements, which may not be representative of area-averaged precipitation, particularly during localized extreme events such as convective storms or typhoons [12,13]. Weather radars can partially overcome this limitation by providing broader area coverage. Yet, they are still hampered by terrain blockage, signal attenuation, and limited range, especially in tropical and mountainous regions [14,15,16,17].
SPPs have emerged as an essential alternative, offering spatially continuous coverage and high temporal resolution, thus enabling regional and global hydrometeorological analyses [18,19]. Despite these advantages, SPPs inherently contain uncertainties and biases arising from sensor limitations, retrieval algorithm errors, and atmospheric conditions, necessitating their rigorous validation and correction before application [20,21]. Corrected and validated SPPs enhance the capability to monitor extreme events, optimize water resource systems [22], and improve decision-making processes in flood risk management [23], agriculture [8,24], and climate adaptation strategies [1,25,26,27]. To further contextualize the role of SPPs in hydrometeorological studies, a global review was conducted summarizing the spatial distribution and best-performing products from recent validation efforts [11,18,28]. As shown in Figure 1, SPP evaluations have been concentrated across data-scarce regions such as East Africa, Southeast Asia, and the Philippines, reflecting the urgent need for reliable precipitation information in these vulnerable areas [9,12,26,29,30,31]. The compilation of studies reveals that IMERG and CHIRPS were most frequently identified as the best-performing SPPs across a range of hydroclimatic applications, including drought monitoring, flood risk assessment, and water resource management [4,21,32]. This global synthesis emphasizes the growing reliance on satellite-derived precipitation estimates while simultaneously highlighting the persistent need for local validation and bias correction to improve their reliability under varying climatic and topographic conditions [20,33,34].
SPPs have emerged as valuable alternatives to address these spatial and temporal gaps in precipitation observation, offering near-global coverage with frequent revisit times [1,35]. Advances in remote sensing technologies provide critical inputs for hydrological modeling, drought monitoring, flood forecasting, and climate studies [21,26]. Nevertheless, SPPs are not without limitations. Errors arising from retrieval algorithms, sensor limitations, and atmospheric interactions often lead to biases and uncertainties that vary by region, season, and precipitation intensity [20,25]. Consequently, robust validation against ground observations and bias correction procedures are essential to enhance the reliability of satellite-derived precipitation estimates for practical applications [33,34,36]. Although SPPs offer valuable spatiotemporal precipitation information, they are often affected by systematic biases and random errors that must be corrected before practical applications [11,20]. These biases arise from multiple factors, including sensor limitations, retrieval algorithm assumptions, and atmospheric interactions such as wind drift and terrain-induced effects [12,36]. Biases in SPPs can lead to significant inaccuracies when used for hydrological modeling, drought analysis, flood forecasting, or water resource planning, particularly in regions with complex topography or intense convective systems [21,26,32]. Consequently, many studies emphasize the necessity of applying statistical post-processing techniques such as quantile mapping, local intensity scaling (LOCI), or distribution mapping to adjust SPP estimates closer to ground observations [5,25,33].
Quantile mapping (QM) has emerged as one of the most widely used bias correction approaches because it effectively adjusts not only the mean bias but also higher-order moments of the precipitation distribution, improving estimates for both light and extreme precipitation events [9,37,38]. Moreover, bias-corrected SPPs have been shown to substantially enhance hydrological simulations, drought indices, and runoff generation estimates, supporting more accurate and reliable decision-making for disaster risk reduction and water resource management [21,39]. However, it is essential to note that bias correction methods introduce uncertainties depending on the choice of reference dataset, correction technique, temporal scale, and climatic characteristics of the region [33,40]. Therefore, ongoing validation and context-specific evaluation of bias correction performance are crucial for ensuring the operational utility of satellite precipitation datasets in diverse hydroclimatic settings [26,34]. Although extensive validations of SPPs have been conducted globally, critical research gaps remain in linking SPP performance specifically to hydrological applications such as flood modeling, drought monitoring, sediment management, and water resource planning, particularly in tropical regions like the Philippines [9,14,33]. In the Philippines, where monsoon-driven precipitation variability and typhoon-induced extremes significantly impact livelihoods, accurate precipitation data are indispensable for sustainable water resource planning and disaster risk reduction [12,14]. Most studies emphasize general accuracy metrics without grouping performance indicators based on hydrological relevance, limiting their practical application for operational modeling and decision-support systems [11,21,26]. While bias correction methods such as quantile mapping have been widely recognized for improving precipitation estimations, the post-correction re-ranking of SPPs tailored to application needs remains underexplored [12,37,38]. SPPs open new possibilities for monitoring and modeling water resources and floods in data-sparse regions and developing countries [37,41]. Consequently, improving the understanding and usability of SPPs through robust evaluation and bias correction approaches is vital for advancing hydrological modeling, climate resilience, and environmental management [11,13].
Recent studies have demonstrated the value of precipitation products (PPs) in supporting hydrological applications [42] such as flood forecasting, drought monitoring, water balance estimation, and sediment modeling across tropical and monsoon-affected regions. CHIRPS and IMERG [5,33], for example, have been widely applied in Southeast Asia for drought assessment and flood hazard mapping. At the same time, ERA5 and MSWEP have been used for water balance and climate variability studies [29,43]. In the Philippines, applications of SPPs remain limited, with recent work focusing on rainfall bias correction for flood simulation and climate risk assessments in some watersheds or river basins, which are somewhat ungagged [44,45]. However, these efforts often rely on a single product or a subset of metrics, without integrating post-correction reassessment or aligning the evaluation with application-specific hydrological needs. This study builds on these regional and national efforts by introducing a full-cycle framework that not only evaluates nine multi-source precipitation datasets but also links their performance to four critical hydrological applications: floods, droughts, sedimentation, and water balance, providing both scientific advancement and operational relevance for Philippine basins and comparable tropical environments.
The absence of an integrated evaluation approach, one that simultaneously applies MCDA, bias correction, and post-correction reassessment grouped according to flood, drought, sedimentation, and water balance requirements, limits the operational value of SPPs for climate-adaptive water resource management in complex basins such as the MRB [25,26,46]. Addressing these gaps through a structured framework that evaluates pre-correction and post-correction performances by hydrological application is therefore crucial for optimizing the selection and use of SPPs in data-scarce, monsoon-dominated tropical environments [9,12,33]. This study addresses this gap by presenting a full-cycle evaluation framework that systematically integrates raw validation, bias correction, and post-correction reassessment under four key hydrological applications: flood prediction, drought monitoring, sediment estimation, and water balance modeling. While nine (9) widely used SPPs were assessed, the framework is not limited to these products but is designed to be transferable and adaptable to other watersheds and datasets. This approach is particularly valuable for the Philippines, where rainfall station networks are sparse and many catchments remain ungauged. By structuring evaluation around hydrological applications and operational needs, the study demonstrates how SPPs can be strategically selected and optimized to support more reliable flood forecasting, drought preparedness, sediment management, and water balance monitoring in tropical, data-scarce basins.

2. Materials and Methods

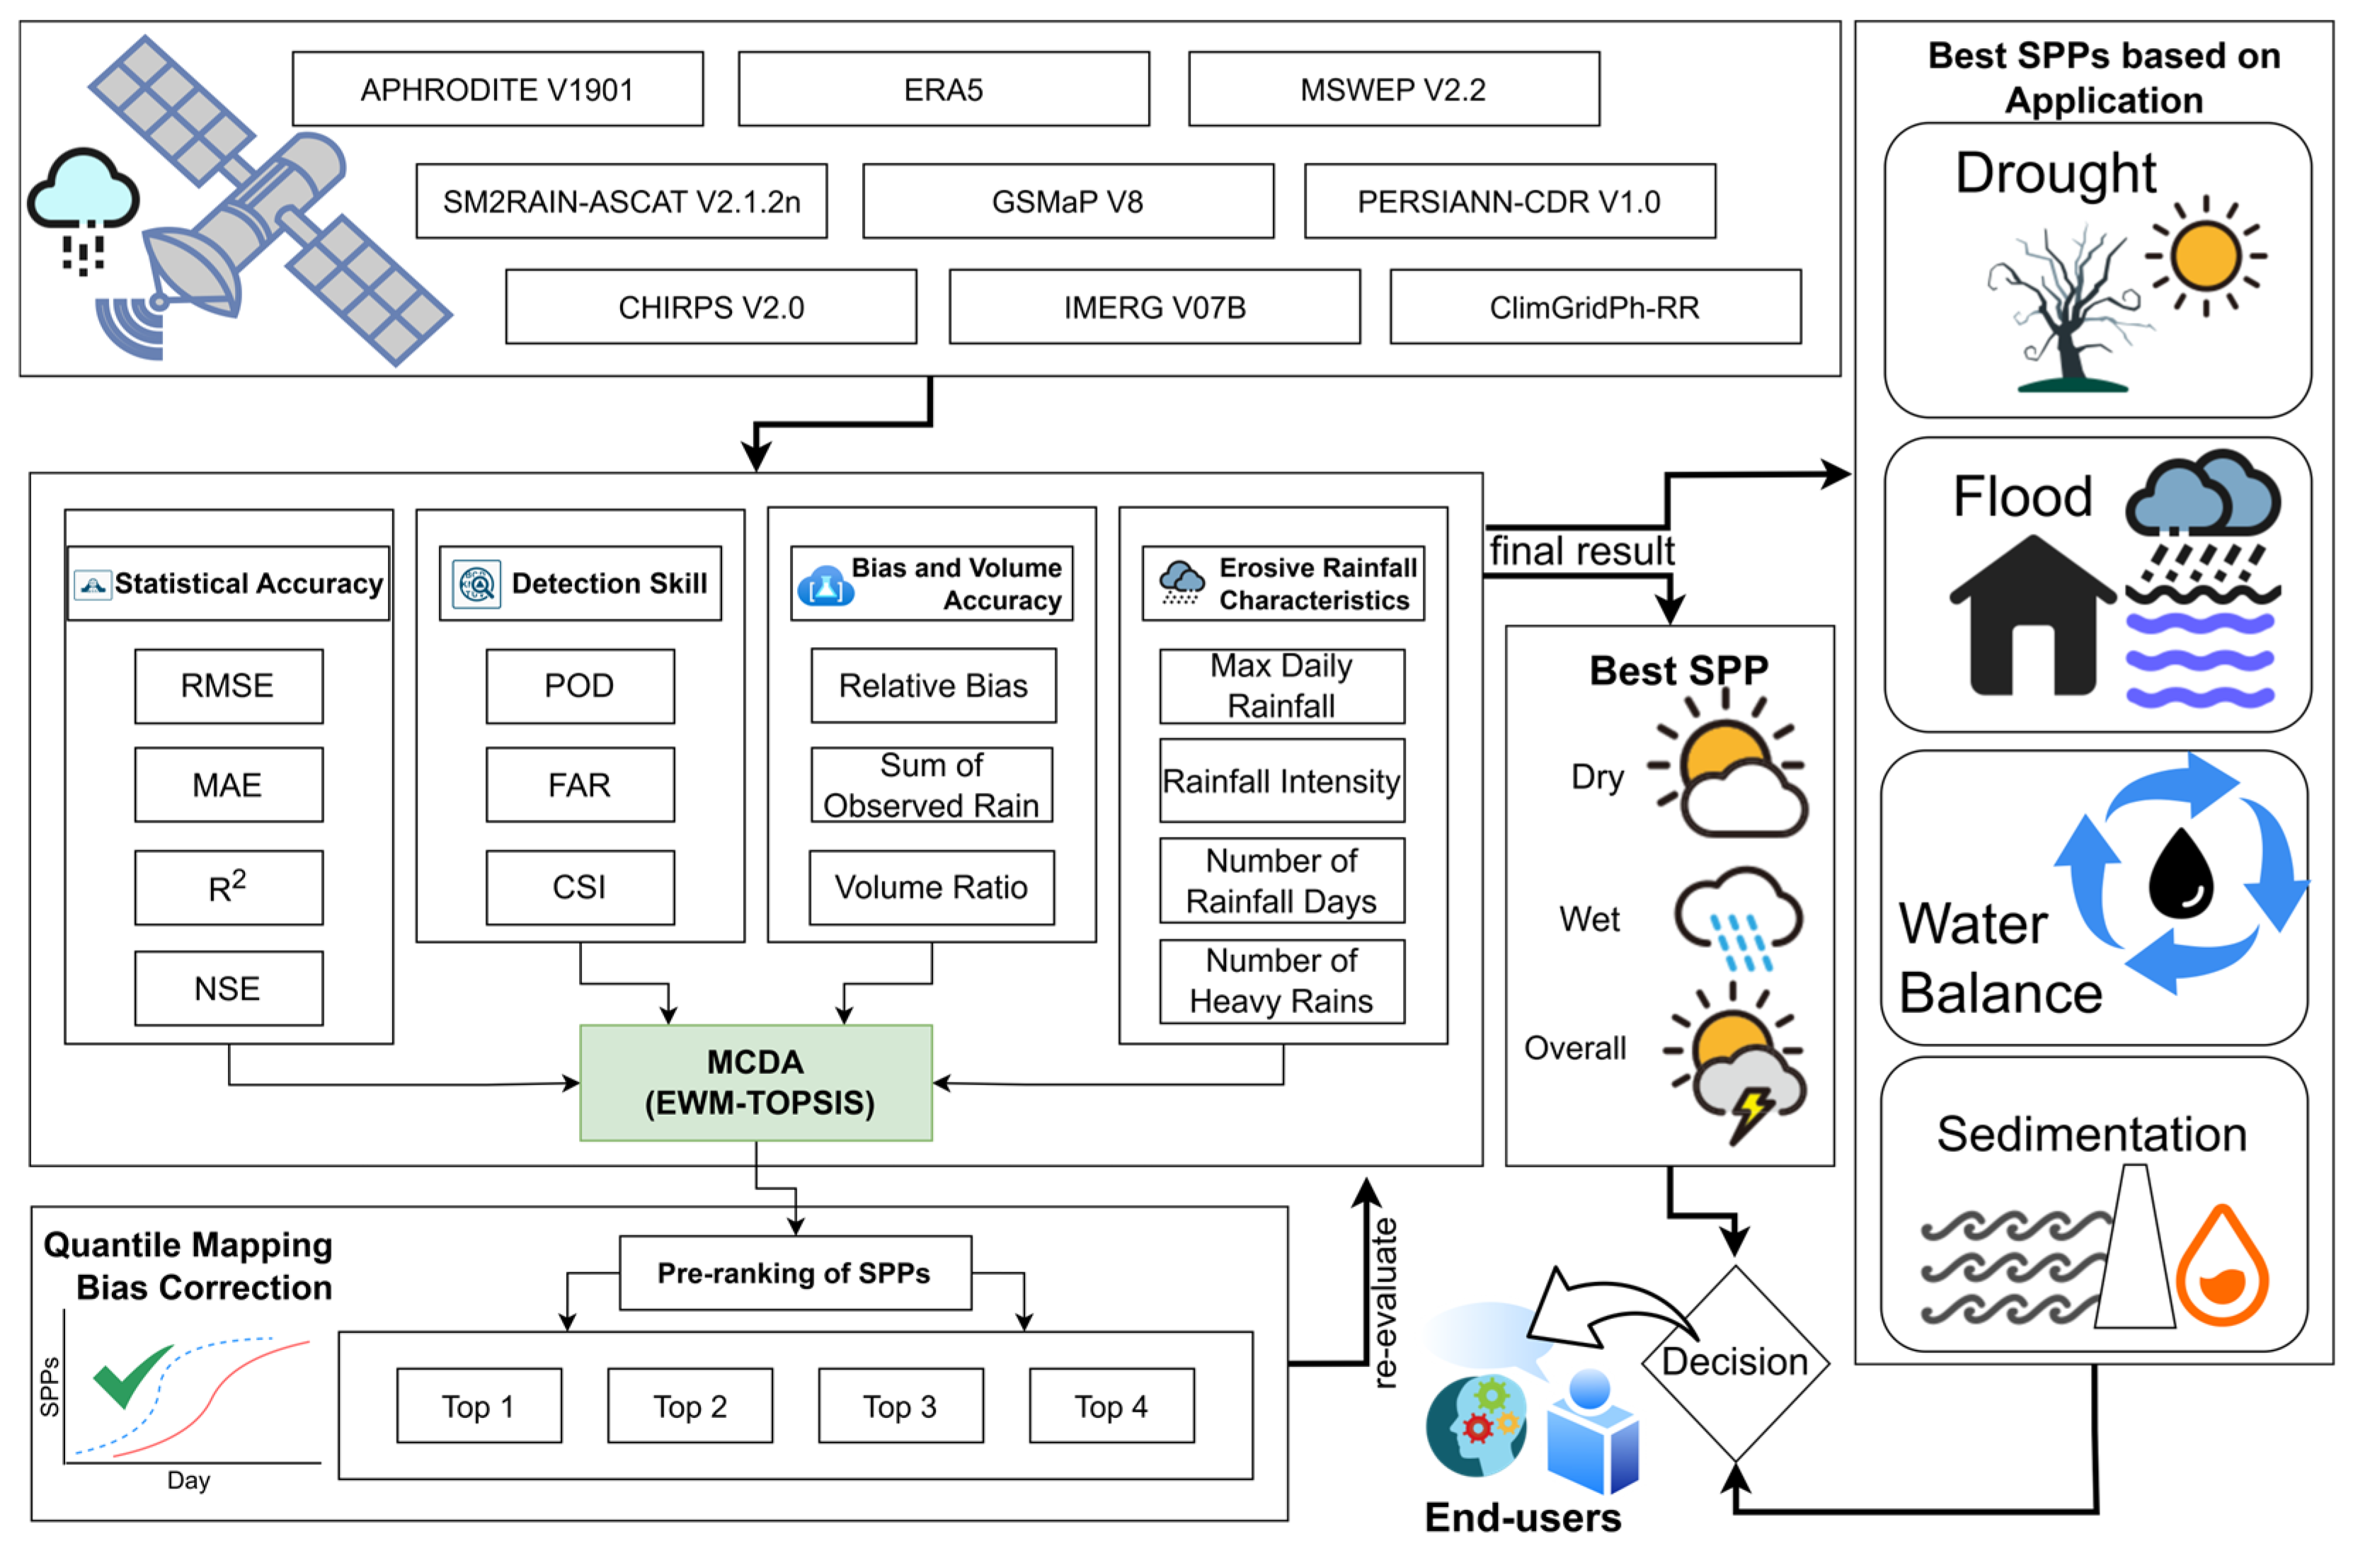
A comprehensive multi-step methodology was developed to systematically evaluate the performance of SPPs for hydrological applications (Figure 2). This approach begins with selecting 14 commonly used SPPs, followed by quantile mapping for bias correction. Multiple performance indicators—grouped into statistical accuracy, detection skill, bias and volume accuracy, and erosive precipitation characteristics—were computed using ground-based observations. These indicators were integrated through an MCDA framework. The process resulted in pre-ranking SPPs by season and hydrological application, enabling data-driven selection of the most suitable products for modeling drought, floods, water balance, and sedimentation processes.

2.1. Study Area

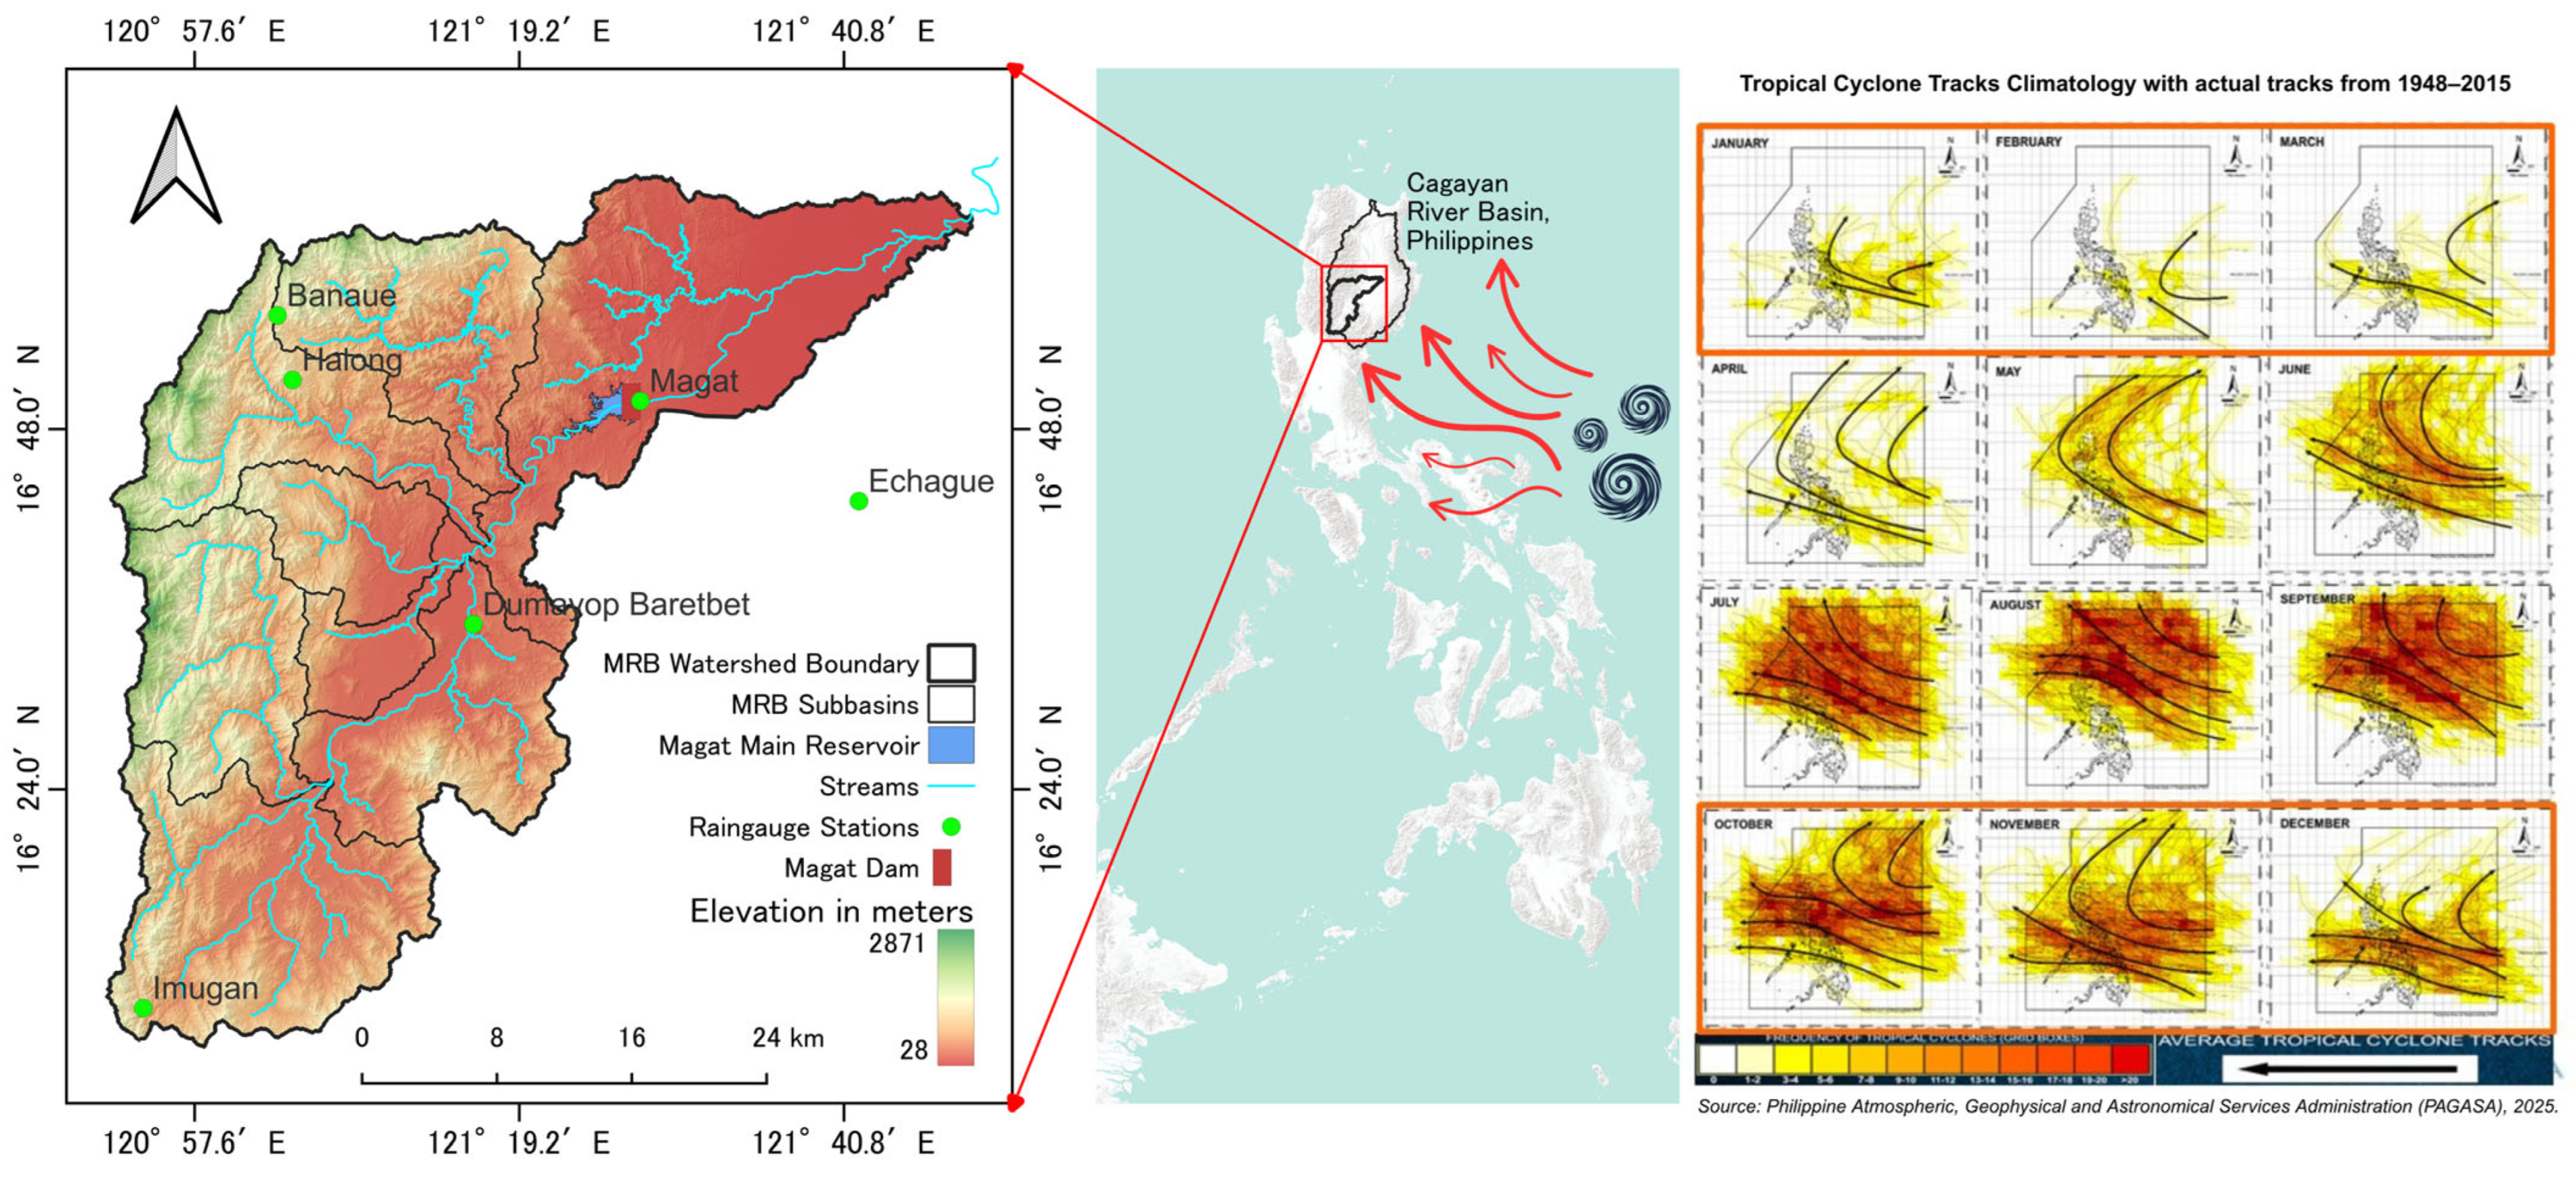
The Magat River Basin, with an estimated 5200 km2, is a major tributary of the Cagayan River Basin in Northern Luzon, Philippines (Figure 3). It is one of the largest tributaries of the Cagayan River Basin and is a vital hydrological system supporting irrigation, hydropower, and flood mitigation [47,48]. The basin’s topography is highly variable, ranging from rugged headwaters in the Cordillera and Sierra Madre Mountain ranges with elevations exceeding 2000 m above sea level (masl) to downstream floodplains below 100 masl. The average elevation across the basin is approximately 850 masl, contributing to varied hydroclimatic and land use dynamics.
The MRB experiences a tropical monsoonal climate characterized by a wet season from June to November and a dry season from December to May, following the seasonal southwest and northeast monsoons. Convective storms, monsoonal rains, and typhoons are the dominant sources of precipitation, with an average annual rainfall ranging from 1500 mm to over 3000 mm, depending on elevation. The basin is frequently impacted by 3 to 5 tropical cyclones per year, with some events causing intense rainfall and triggering floods, landslides, and sediment surges. Typhoon tracks that affect the MRB typically originate in the western Pacific Ocean and curve northwestward, often making landfall over eastern Luzon before traversing the northern interior, including the Cagayan River Basin (CRB), where the MRB is located [49]. The climatological track density is highest from July to October, coinciding with the basin’s peak rainfall period. These cyclonic systems enhance moisture convergence and orographic rainfall over the Sierra Madre and Cordillera ranges, increasing runoff and sediment yield into the Magat Reservoir. Given the scarcity and uneven distribution of ground-based rain gauges managed by the Philippine Atmospheric, Geophysical and Astronomical Services Administration (PAGASA) and the National Irrigation Administration—Magat River Integrated Irrigation System (NIA-MARIIS), especially in upland areas, reliance on SPPs has become essential for the region’s hydrological modeling, water management, and disaster preparedness. Integrating SPPs with historical typhoon climatology enhances real-time flood forecasting and long-term climate risk assessment for infrastructure and livelihoods in the MRB.

2.2. Data Sources

In this study, daily precipitation data from 2000 to 2024 were obtained for nine datasets spanning gauge-based, reanalysis, satellite-only, and merged products (Table 1). These include APHRODITE V1901 (Asian Precipitation–Highly Resolved Observational Data Integration Towards Evaluation), a gauge-based historical dataset; ERA5 (ECMWF Reanalysis v5), a global reanalysis product; MSWEP V2.2 (Multi-Source Weighted Ensemble Precipitation), a merged dataset combining gauge, reanalysis, and satellite data; SM2RAIN-ASCAT V2.1.2n (Soil Moisture to Rain–Advanced SCATterometer), a satellite-only rainfall dataset derived from soil moisture retrievals; GSMaP V8 (Global Satellite Mapping of Precipitation), a satellite-based product; PERSIANN-CDR V1.0 (Precipitation Estimation from Remotely Sensed Information using Artificial Neural Networks–Climate Data Record), a merged long-term dataset; CHIRPS V2.0 (Climate Hazards Group InfraRed Precipitation with Station data), which integrates infrared satellite estimates with ground station data; IMERG V07B (Final Run) (Integrated Multi-satellitE Retrievals for GPM), a merged satellite–gauge product; and ClimGridPh-RR (Philippine Gridded Rainfall Dataset), which provides a national-scale gridded product bias-corrected from IMERG using local rain gauge observations. These datasets were selected based on their spatial resolution, historical application in tropical hydrology, and open accessibility. All precipitation data were spatially subset using a shapefile of the MRB, and temporal aggregation was standardized across all products to ensure comparability in evaluation and bias correction. The gridded precipitation estimates were validated against daily records from six (6) operational rain gauge stations located across the MRB (Figure 3), managed by NIA-MARIIS. Only stations with complete and continuous datasets for the period 2000–2024 were used to ensure reliability. Minor gaps were addressed through standard quality control procedures, including cross-checking with neighboring station records and excluding days with insufficient coverage. This approach provided a consistent and robust ground-based benchmark for evaluating the performance of SPPs in a complex, irrigation-managed basin. Although some precipitation products (for example, CHIRPS, ClimGridPh-RR) assimilate PAGASA station data, which serves as the primary source of meteorological observations for most international climate and reanalysis products, the validation in this study relies on independent gauge records from NIA–MARIIS, which are used exclusively for dam and irrigation operations and are not incorporated into PAGASA’s climatological archives. This ensures that the evaluation remains independent and free from circular validation biases.

2.3. Evaluation Metrics

Traditional assessments of SPPs typically focus on individual statistical indices such as RMSE, MAE, R2, and NSE [18,28]. However, relying solely on these measures may overlook critical aspects like event detection and volume bias [21,32]. Recent studies recommend grouping metrics into broader categories—statistical accuracy, detection skill, bias and volume accuracy, and erosive precipitation characteristics—for a more comprehensive evaluation [26,33]. To further improve ranking, multi-criteria decision analysis (MCDA) methods have been increasingly applied [21,41], allowing the objective selection of the best-performing SPPs across diverse hydrological applications [9,39].
The evaluation of SPPs cannot be universally standardized across all hydrological studies, as different applications emphasize distinct precipitation characteristics [33,46]. For instance, flood modeling is highly sensitive to the accurate detection of extreme precipitation events and peak intensities, requiring metrics like maximum daily precipitation, probability of detection (POD), false alarm ratio (FAR), and critical success index (CSI) [21,26]. Conversely, drought monitoring demands a consistent representation of precipitation totals, seasonal trends, and dry spell characteristics, making volume ratio, mean absolute error (MAE), and number of precipitation days critical indicators [22,28]. In sediment transport and soil erosion studies, the frequency of heavy precipitation events and precipitation erosivity indices are fundamental, with parameters like the number of heavy rain days and average precipitation intensity serving as proxies [20,58]. Water balance and hydrological modeling studies prioritize accurate volume estimation, temporal distribution, and long-term precipitation patterns, making relative bias (RB), root mean square error (RMSE), and correlation coefficient (R2) vital performance criteria [11,32]. Recognizing these distinct needs, recent evaluations advocate grouping performance metrics by relevance to specific applications, ensuring that the satellite dataset selection aligns with the targeted hydrological goal [25]. This application-based grouping approach enhances the robustness of satellite product selection, minimizing mismatch between precipitation product strengths and the intended modeling or decision-making context [9,39]. Furthermore, it supports the development of specialized validation strategies that better reflect the operational realities of flood early warning systems, drought resilience planning, sedimentation risk assessment, and integrated water resource management [21,41].
In this study, thirteen (13) quantitative metrics were employed and grouped into four major performance domains to comprehensively evaluate the performance of the selected SPPs (Table 2). These domains capture precipitation estimates’ statistical, detection, volumetric, and erosive accuracy, essential in hydrological modeling and water resource applications. First, statistical accuracy was assessed using Root Mean Square Error (RMSE), Mean Absolute Error (MAE), Coefficient of Determination (R2), and Nash-Sutcliffe Efficiency (NSE), each indicating how well the SPP aligns with observed ground-based precipitation values. Second, detection skill—the ability of SPPs to identify precipitation occurrences—was measured through Probability of Detection (POD), False Alarm Ratio (FAR), and Critical Success Index (CSI), which are essential for flood forecasting and disaster early warning systems [12,59].
Third, bias and volume accuracy were evaluated using Relative Bias (RB), Volume Ratio (VR), and the Sum of Observed Precipitation at Stations (SORS), which collectively assess the ability of each product to reproduce precipitation volumes across varying intensities and regions [20,21]. Lastly, erosive precipitation characteristics, critical for sediment transport and soil erosion analysis, were captured through Maximum Daily Precipitation (MDR), Average Precipitation Intensity (ARI), Number of Precipitation Days in a Year (NDRY), and Number of Heavy Rain Days, NHRD (≥10 mm). These metrics were reorganized to support four core hydrological applications: flood modeling (requiring precision in peak detection), drought monitoring (favoring frequency and underestimation analysis), water balance estimation (focused on volume representation), and sediment yield modeling (driven by erosivity indicators). This structured metric framework provides a balanced evaluation and allows for application-specific ranking of SPPs through MCDA.

2.4. Multi-Criteria Decision Analysis (EWM-TOPSIS)

To comprehensively evaluate and rank the performance of SPPs, this study employed an MCDA framework that integrates the Entropy Weight Method (EWM) and the Technique for Order Preference by Similarity to Ideal Solution (TOPSIS) [60]. The EWM was used to derive objective weights for each performance metric by measuring the degree of variability in the data, where greater dispersion implies higher informational content [61]. For a normalized decision matrix R = r i j , the entropy for each metric j is computed as:
e j = k i = 1 m r i j ln ( r i j ) ,           w h e r e   k = 1 ln ( m )
The degree of diversification is then calculated as d j = 1 e j , and the weight of each metric is:
w j = d j j = 1 n d j
These weights are then used in the TOPSIS algorithm, which ranks alternatives based on their Euclidean distances to a hypothetical ideal solution. First, the weighted normalized matrix V = v i j , is formed using:
v i j = w j r i j
The ideal A + and anti-ideal A solutions are defined as:
A + = max v i j | j J + ; m i n ( v i j ) | j J , A = min v i j | j J + ; m a x ( v i j ) | j J
where J + and J are sets of beneficial and non-beneficial criteria, respectively.
The separation distances from the ideal and anti-ideal solutions are calculated for each S P P i as:
S i + = j = 1 n ( v i j A j + ) 2 ,             S i = j = 1 n ( v i j A j ) 2
Finally, the relative closeness C i to the ideal solution is computed:
C i = S i S i + + S i
Higher values of C i indicate better-performing alternatives. This procedure was applied separately for three temporal scales—dry season (December–May), wet season (June–November), and annual performance [62]—to allow seasonal differentiation of each SPP’s utility for hydrological applications such as flood risk modeling, drought monitoring, water balance estimation, and sediment yield analysis.

2.5. Bias Correction Using Quantile Mapping

Following the MCDA-based pre-ranking, the top four SPPs for each hydrological application and seasonal period (dry, wet, and overall) were subjected to bias correction using the Quantile Mapping (QM) technique. Quantile Mapping is a statistical approach that adjusts the distribution of satellite-based precipitation estimates to match the empirical distribution of ground-based observations, thereby correcting systematic biases in magnitude and frequency [5,38]. The general formulation of QM can be expressed as:
P ( t ) = F o b s 1 [ F m o d P m o d t ]
where P*(t) is the bias-corrected precipitation at time t, Pmod(t) is the raw precipitation from the SPP, Fmod is the cumulative distribution function (CDF) of the modeled/SPP precipitation, and F o b s 1 is the inverse CDF of the observed precipitation.
In this study, observed daily precipitation data from the NIA-MARIIS were used as the observational benchmark. The QM correction was applied to each grid cell, ensuring spatially coherent adjustments across the study domain. The corrected data were then reassembled into the geospatial format and prepared for subsequent performance re-evaluation. This step is essential to improve the overall statistical fidelity (e.g., reducing mean bias and improving correlation) and the representation of extreme precipitation events—critical for flood modeling and sedimentation analysis applications. Integrating QM into the SPP evaluation workflow enhances the practical usability of these datasets in operational and research hydrology across Philippine basins.

2.6. Post-Correction Re-Ranking and Decision Support

Following bias correction using the QM method, the reprocessed SPPs were re-evaluated using 13 performance metrics and re-ranked via the EWM-TOPSIS framework. This allowed for quantifying performance improvements and identifying SPPs that showed significant enhancement, especially under extreme precipitation conditions. Best-performing SPPs per season and hydrological applications were determined to support their operational use in modeling.
To strengthen the practical applicability of the findings, the final rankings were reassessed based on the relevance of specific metrics to four key hydrological applications: drought, flood, water balance, and sedimentation (refer to Table 3). For drought monitoring, critical indicators included RB to detect systematic over- or underestimation under dry conditions, NRDY to assess precipitation frequency, VR for total precipitation agreement, MAE for estimation accuracy, and the R2 for evaluating temporal consistency. Flood-related assessments prioritized MDR as a proxy for peak flow simulation, POD and FAR for event detection reliability, CSI to evaluate detection skill trade-offs, and performance metrics like NSE and RMSE to gauge model performance under extreme conditions. For water balance analysis, VR and the SOR were used to assess total precipitation inputs, while MAE, RMSE, and R2 supported evaluations of baseflow and interannual flow variability. Sedimentation-focused evaluations incorporated NHRD, ARI, MDR, and RB—parameters that reflect erosive event frequency, intensity, and long-term volume consistency. This updated metric framework supports a more tailored and hydrologically meaningful ranking of SPPs for operational use in climate-sensitive and data-scarce basins.

3. Results

3.1. Comparison of SPPs and Rain Gauge Observations

The comparative analysis of Annual Mean Rainfall (AMR) across the MRB using nine (9) SPPs reveals pronounced spatial variability and notable differences in product performance (Figure 4). These discrepancies stem from each product’s underlying retrieval algorithms, sensor types, and spatial-temporal resolutions, which affect their sensitivity to topography, convective storms, and monsoonal rainfall processes that dominate the basin.
Among the evaluated SPPs, SM2RAIN-ASCAT V2.1.2n produced the highest basin-wide AMR at 2968.53 mm, with extremely high rainfall estimates in S1 (3525.53 mm) and S2 (3324.48 mm)—the mountainous headwaters of the MRB. These results suggest a strong ability to detect orographically enhanced precipitation due to the soil moisture-based inversion method of SM2RAIN. However, it reported more conservative values in low-lying sub-basins such as S6 (2911.92 mm) and S7 (2893.32 mm), indicating some spatial realism in response to elevation gradients. This spatial concentration of rainfall supports its use in simulating inflow to upstream reservoirs and evaluating extreme rainfall events in high-altitude zones. ERA5, a reanalysis dataset with advanced assimilation schemes, followed closely with a basin-wide AMR of 2938.40 mm. Like SM2RAIN, it captured substantial rainfall in S1 (3298.43 mm) and S2 (3242.17 mm) but showed relatively inflated estimates in S4 (3172.78 mm) and S6 (2866.15 mm), raising concerns about potential overestimation in less-instrumented areas. While ERA5’s spatial resolution (0.1°) and hourly temporal granularity are advantageous, its biases in tropical basins warrant correction before operational hydrologic modeling.
GSMaP V8, which integrates microwave and infrared data with global rainfall retrievals, estimated a basin-wide AMR of 2851.82 mm, with high values in S7 (2657.71 mm) and S6 (2465.04 mm). While this dataset captured general rainfall trends, it overestimated rainfall in southern and mid-basin zones, which may not reflect true orographic influences and could mislead downstream runoff or sediment delivery simulations. ClimGridPh-RR, the only Philippines-specific gauge-adjusted product, offered a moderate AMR of 2672.58 mm, reflecting its calibration with local ground data. It displayed more balanced spatial patterns, especially in S2 (2397.84 mm), S4 (2662.22 mm), and S7 (2882.13 mm). Despite not capturing peak rainfall in high-elevation zones as powerfully as SM2RAIN, its consistency across sub-basins and alignment with orographic gradients make it a reliable reference for long-term water resource planning and model calibration in the MRB. CHIRPS V2.0, a popular blended product for drought and climate studies, reported a lower AMR of 2317.26 mm, with strong values in S1 (2157.67 mm) and S2 (2442.89 mm) but moderate underestimations in S6 (2130.66 mm) and S7 (2248.81 mm). Its acceptable spatial resolution (0.05°) and partial gauge correction enable a good representation of spatial variability but also show that underestimation in some lowland regions could impact water budget calculations or sediment modeling if not adjusted. IMERG V07B yielded a basin AMR of 2553.19 mm, with a reasonably uniform spatial distribution and notable rainfall in S7 (2552.69 mm) and S6 (2508.03 mm). However, it showed subdued intensity in upper catchments such as S2 (2506.56 mm) and S4 (2468.17 mm) compared to SM2RAIN and ERA5. This smoothing effect, possibly due to the merging of passive microwave and infrared estimates, may limit its utility for peak flow or erosive event analysis without bias correction. PERSIANN-CDR V1.0 reported a basin-wide AMR of 2309.03 mm, with moderate rainfall across all sub-basins, such as S1 (2275.86 mm) and S3 (2383.07 mm). Although it effectively captured broad seasonal trends, its lower spatial resolution and cloud-top temperature dependency limit its precision in mountainous terrain, making it less suitable for event-specific hydrologic modeling in the MRB. APHRODITE V1901, a gauge-based historical product, yielded one of the lowest basin-wide AMRs at 1855.02 mm. Despite capturing high rainfall in S2 (1878.41 mm), it showed noticeable underestimations in S6 (2019.19 mm) and S5 (1689.46 mm). This product is more applicable for long-term climatology than short-term hydrologic simulations due to coarse station density and interpolation limitations. MSWEP V2.2 had the lowest overall performance, with a basin-wide AMR of 1302.07 mm and major underestimations across all sub-basins—e.g., S1 (1133.38 mm), S4 (1328.79 mm), and S6 (1334.56 mm). These deficits indicate limitations in blending techniques or gauge assimilation for tropical monsoonal regions, reducing its reliability for any operational hydrological purpose in the MRB.
Across all products, sub-basins S1, S2, and S3, situated in the orographic north and northeast, consistently showed the highest rainfall values—reflecting terrain-induced enhancement from typhoons and monsoon interactions. Downstream sub-basins S5, S6, and S7 typically reported lower rainfall, aligning with elevation and exposure patterns. This spatial gradient reinforces the importance of elevation-sensitive SPPs for accurate water input estimation. The analysis confirms that no SPP performs uniformly across all MRB sub-basins. A hybrid selection approach—using SM2RAIN-ASCAT for capturing orographic peaks, ClimGridPh-RR for bias-adjusted consistency, and CHIRPS for drought-specific applications—offers the most robust strategy for hydrological modeling, flood forecasting, and sediment impact assessments in this complex, data-scarce watershed. This section may be divided by subheadings. It should provide a concise and precise description of the experimental results, their interpretation, as well as the experimental conclusions that can be drawn.
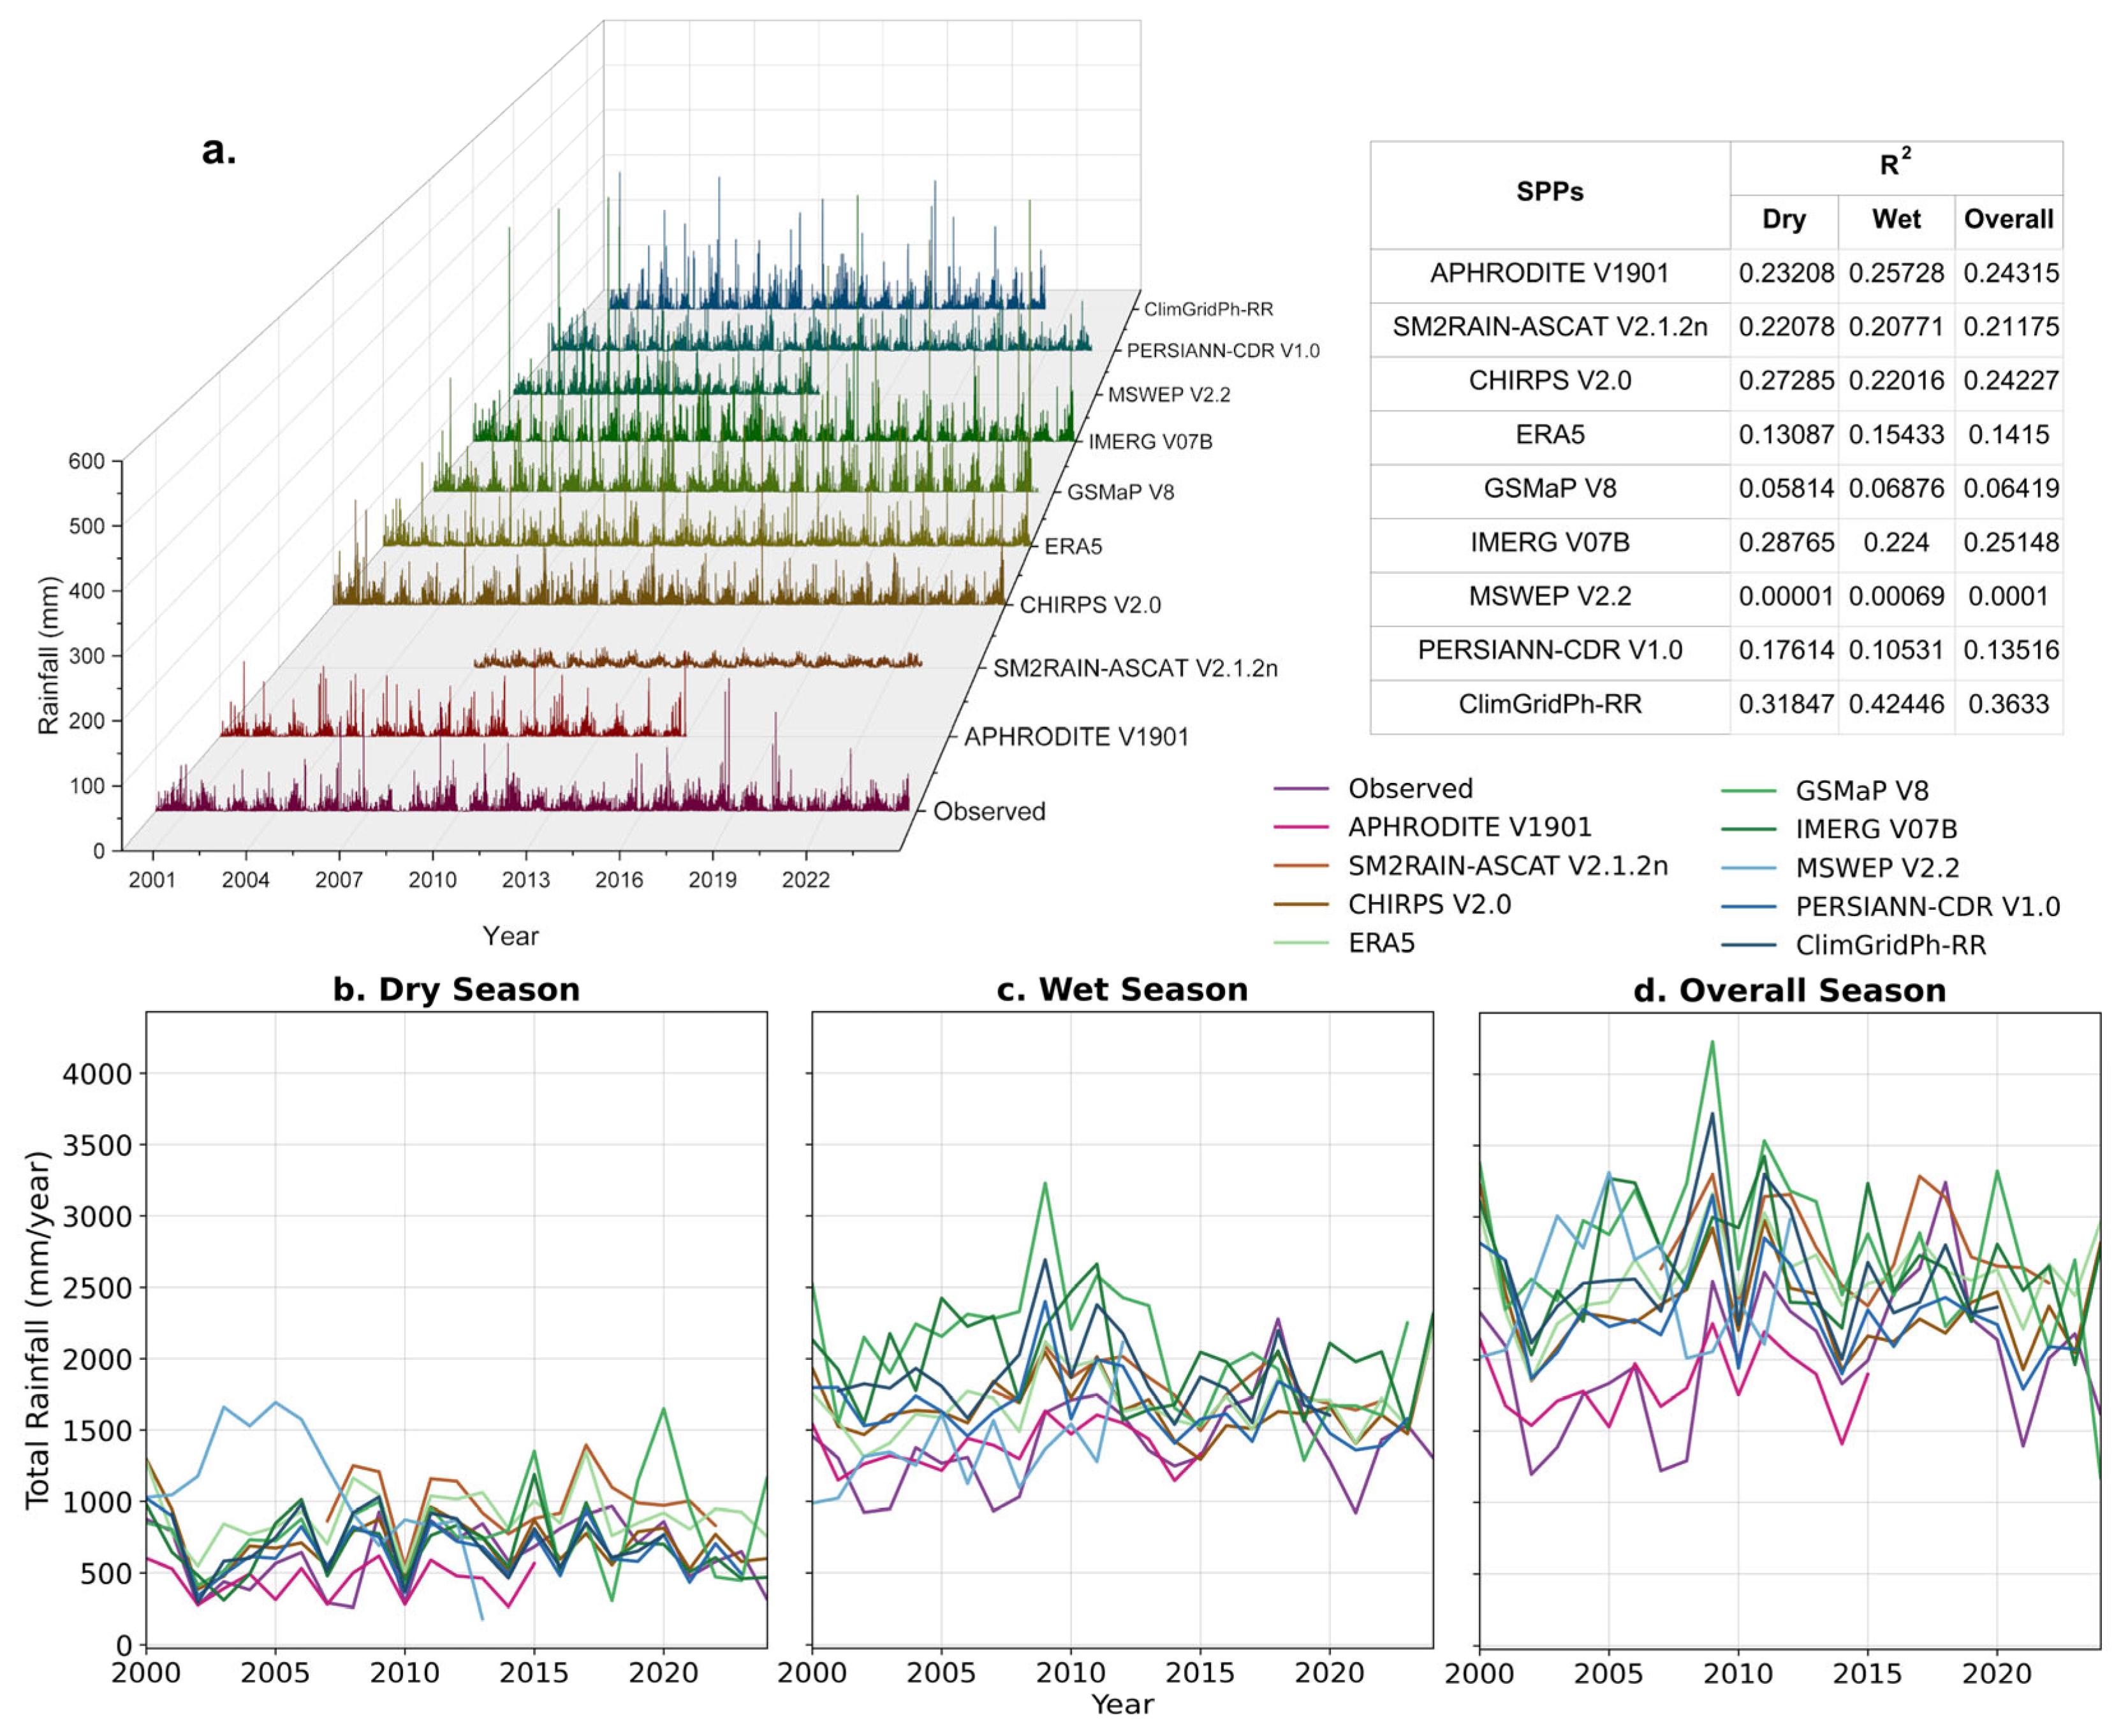
The inter-comparison analysis between SPPs and ground-based observations (Figure 5) reveals marked differences in temporal accuracy, seasonal performance, and capacity to reproduce observed rainfall variability in the MRB. The 3D waterfall plot in Figure 5a presents the daily rainfall time series from 2001 to 2025, where observed precipitation (in black) shows pronounced peaks and interannual fluctuations reflective of monsoonal and typhoon-induced extremes. Among the SPPs, IMERG V07B and GSMaP V8 consistently exhibit higher peak values, suggesting a tendency to overestimate daily intensities. On the other hand, SM2RAIN-ASCAT V2.1.2n and APHRODITE V1901 display more moderate rainfall behavior, better capturing both the frequency and intensity of observed precipitation events, especially during dry months. ERA5 and PERSIANN-CDR V1.0 tend to smooth or shift peak timing, while MSWEP V2.2 underrepresents rainfall throughout the time series.
Figure 5b–d provide seasonal summaries of total rainfall for the dry, wet, and overall periods, offering additional insights into long-term performance. During the dry season (Figure 5b), all SPPs generally follow the observed declining trend but with significant variation in magnitude. Products like IMERG V07B and ClimGridPh-RR show elevated dry-season totals in recent years, while ERA5 and MSWEP V2.2 remain consistently below observed values, indicating underdetection. CHIRPS V2.0, SM2RAIN-ASCAT, and APHRODITE V1901 align more closely with the observations, providing conservative yet consistent seasonal totals.
In the wet season (Figure 5c), the differences among SPPs become more pronounced. ClimGridPh-RR and IMERG V07B exhibit strong seasonal agreement with observed peaks, particularly in high-rainfall years like 2010 and 2020, while ERA5, CHIRPS, and SM2RAIN-ASCAT track overall variability but sometimes lag during extreme events. GSMaP V8 and MSWEP V2.2 show inconsistent behavior, with alternating years of under- and overestimation, which could compromise flood simulation applications. The overall seasonal trend (Figure 5d) reflects the aggregate impact of these biases. Products such as ClimGridPh-RR, IMERG V07B, and CHIRPS V2.0 demonstrate moderate agreement with the observed pattern, while GSMaP V8 consistently overshoots total rainfall, and MSWEP V2.2 and ERA5 remain underpredictive across most years. SM2RAIN-ASCAT maintains a stable trajectory that mirrors observed totals, particularly in transitional years with moderate rain, reinforcing its suitability for year-round modeling.
The R2 values in the upper-right table quantitatively summarize the temporal correlation of each SPP against observations. The highest overall R2 was recorded by ClimGridPh-RR (Overall: 0.3633; Wet: 0.4245; Dry: 0.3185), indicating strong temporal agreement across seasons. This was followed by IMERG V07B (0.2515) and CHIRPS V2.0 (0.2423), suggesting these products effectively capture interannual variability. Notably, SM2RAIN-ASCAT V2.1.2n, despite slightly lower correlation scores (Overall: 0.2118), remains reliable due to its consistent performance across all seasons. Meanwhile, MSWEP V2.2 had the lowest R2 across all periods (~0.0001), reflecting poor alignment with observed trends. ERA5 and GSMaP V8, while useful for high-resolution applications, posted weak correlation values (0.1415 and 0.0642, respectively), limiting their standalone use for seasonal or long-term planning. This temporal evaluation underscores the critical need to select SPPs based on spatial metrics and their ability to replicate seasonal and interannual precipitation variability. Products such as ClimGridPh-RR, CHIRPS, IMERG, and SM2RAIN-ASCAT exhibit promising alignment with observed rainfall patterns, making them strong candidates for hydrological modeling, flood risk assessment, and climate-resilient planning in monsoon-influenced basins like the MRB.

3.2. Performance of SPPs Based on Metrics

3.2.1. Statistical Accuracy and Detection Skills

A robust evaluation of the nine selected SPPs—APHRODITE V1901, SM2RAIN-ASCAT V2.1.2n, CHIRPS V2.0, ERA5, GSMaP V8, IMERG V07B, MSWEP V2.2, PERSIANN-CDR V1.0, and ClimGridPh-RR—was conducted using standard statistical and detection-based metrics across dry, wet, and overall annual periods. This sub-section critically interprets their performances using RMSE, MAE, R2, NSE, POD, FAR, and CSI, with Table 4 illustrating the full summary.
Among all products, SM2RAIN-ASCAT V2.1.2n consistently emerged as the best performer in terms of RMSE and MAE across all seasons. It recorded the lowest RMSE values—7.93 mm (dry), 9.69 mm (wet), and 8.86 mm (overall)—demonstrating minimal deviation from observed rainfall. Similarly, it maintained the lowest MAE scores across the board—5.51 mm (dry), 5.84 mm (wet), and 5.68 mm (overall), indicating strong agreement in both average magnitude and distribution of daily precipitation. In contrast, IMERG V07B and MSWEP V2.2 showed the highest RMSEs, reaching up to 16.53 mm, reflecting significant overestimations, especially during wet months when rainfall intensifies.
The R2 values confirmed these observations. While most SPPs showed weak or negative correlations during the dry season—ERA5: −0.74, GSMaP V8: −3.89, IMERG V07B: −2.00—ClimGridPh-RR recorded the highest seasonal correlations, with R2 = 0.318 (dry), 0.424 (wet), and 0.363 (overall). This highlights its relatively better temporal consistency and ability to track interannual variability. CHIRPS V2.0 and APHRODITE V1901 also showed improved R2 scores (>0.22) across seasons, while SM2RAIN-ASCAT, although moderate (0.21–0.22), maintained consistently positive values—a key advantage for hydrologic modeling. The NSE metric, which more stringently penalizes deviations from observed data, reinforced this trend. Only SM2RAIN-ASCAT V2.1.2n achieved consistently positive NSE values—0.15 (dry), 0.17 (wet), and 0.16 (overall). All other products yielded negative NSEs in at least two seasons, suggesting poor predictive skill and a tendency to deviate from the observed time series. Detection metrics further supported the superior performance of SM2RAIN-ASCAT. It achieved perfect or near-perfect POD values: 1.00 in all three seasons, indicating its excellent capability to detect rainfall occurrences. APHRODITE V1901 also demonstrated high POD (0.89–0.88), with CHIRPS and IMERG following closely. However, high POD must be interpreted alongside FAR to account for false alarms. SM2RAIN-ASCAT maintained relatively low FAR scores (0.27 overall), while MSWEP V2.2 and IMERG V07B posted higher FARs (≥0.30), reflecting a tendency to mispredict rainfall in dry conditions. The CSI, which balances POD and FAR, again favored SM2RAIN-ASCAT, which recorded the highest CSI values across all seasons—0.75 overall, 0.75 dry, and 0.72 wet—followed by APHRODITE and ClimGridPh-RR with moderate scores (~0.70). Lower CSI scores (<0.68) for MSWEP, IMERG, and PERSIANN-CDR suggest less reliable detection overall.
Bias metrics (RB) revealed overestimation tendencies in most products. GSMaP V8 recorded the highest positive bias at 50.81 mm (wet) and 42.42 mm (overall), while SM2RAIN-ASCAT remained well-controlled, with RB = 31.22 mm (dry), 32.77 mm (wet), and 32.77 mm (overall). APHRODITE V1901, CHIRPS, and ClimGridPh-RR offered more balanced RB values—generally between −14 mm and 18 mm—suggesting less systematic error. The collective evaluation underscores SM2RAIN-ASCAT V2.1.2n as the most statistically robust SPP across seasons and performance metrics. Its strengths lie in consistently low error, good temporal correlation, high detection ability, and manageable bias—making it a suitable candidate for operational hydrological modeling, especially in tropical river basins with complex precipitation regimes like the MRB. APHRODITE V1901 and CHIRPS V2.0 are viable alternatives for long-term climatology and drought monitoring. At the same time, IMERG, MSWEP, and ERA5 exhibit substantial limitations in reproducing accurate rainfall patterns—particularly in dry seasons—thus requiring further bias correction for high-resolution or event-based applications.

3.2.2. Bias and Volume Accuracy

The bias and volume performance of the SPPs were evaluated using three key indicators: RB, SORS, and VR, which collectively assess whether a product systematically overestimates or underestimates total precipitation and how such biases vary seasonally across the Magat River Basin. As shown in Table 4, the RB values reveal substantial variability in volumetric performance among SPPs.
Among all SPPs, APHRODITE V1901 exhibited the lowest RB values, indicating a tendency to underestimate precipitation, with scores of −6.85% (dry), −13.89% (wet), and −10.49% (overall). This consistent underestimation suggests a conservative depiction of rainfall, which may require correction in water balance studies. CHIRPS V2.0 showed the most balanced performance, with moderate and stable RB values across seasons: 13.37% (dry), 13.47% (wet), and 14.26% (overall). Such consistent bias within a manageable range supports its application in seasonal and long-term hydrologic modeling. ClimGridPh-RR, the gauge-based product tailored for the Philippines, also demonstrated favorable bias performance, with RB values of 27.00% (dry), 17.98% (wet), and 22.33% (overall)—indicating slightly higher precipitation estimates but within acceptable bounds for many planning applications. SM2RAIN-ASCAT V2.1.2n, although among the top performers in accuracy and detection, exhibited RB values of 31.22% (dry), 34.34% (wet), and 32.77% (overall). These figures indicate a moderate overestimation tendency, which should be considered in applications sensitive to absolute rainfall volumes, such as flood or erosion modeling.
By contrast, GSMaP V8 and ERA5 reported the highest biases, reaching 50.81% in the wet season and 42.42% overall, indicating a significant overestimation of rainfall totals. Unless bias correction methods are applied, these products may overpredict runoff and hydrological extremes. The RB analysis highlights that CHIRPS V2.0, ClimGridPh-RR, and SM2RAIN-ASCAT offer the most reliable precipitation volume estimates among the SPPs evaluated, balancing moderate bias with spatial and seasonal consistency.
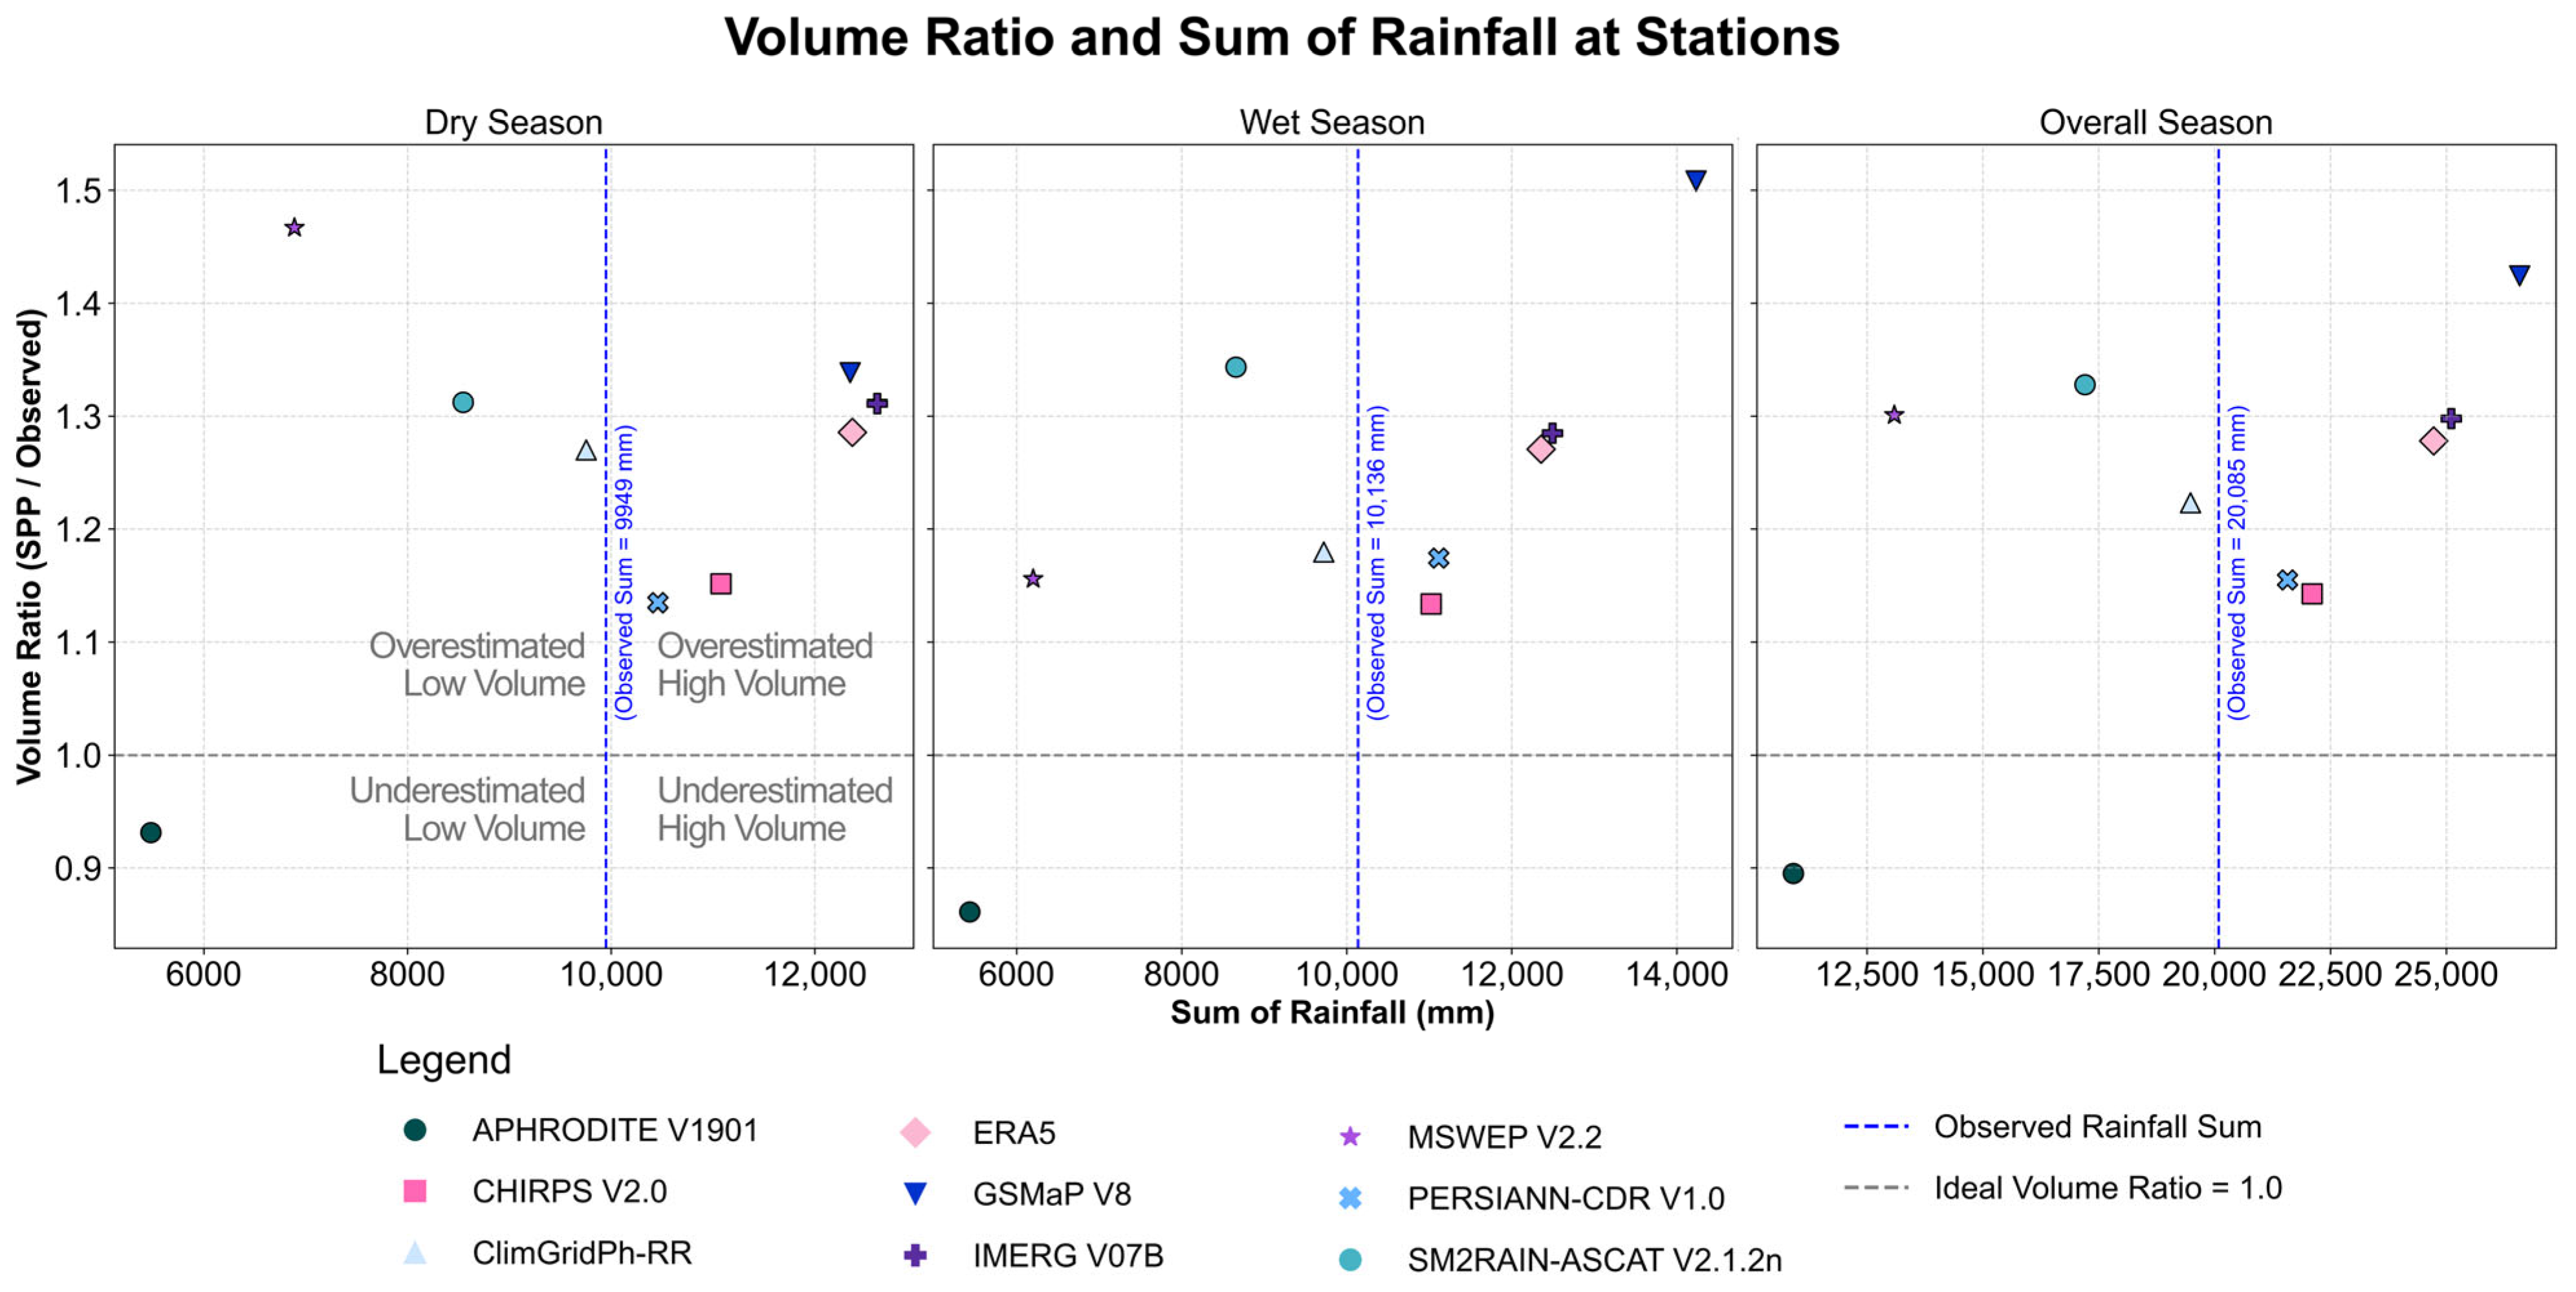
Figure 6 visually assesses precipitation volume accuracy across SPPs using a bivariate plot of VR versus the SORS for dry, wet, and overall seasons. This quadrant-based scatterplot allows intuitive classification of each product into one of four categories: (1) overestimated–low volume, (2) overestimated–high volume, (3) underestimated–low volume, and (4) underestimated–high volume. The dashed vertical and horizontal reference lines represent the observed precipitation sum and an ideal volume ratio of 1.0, respectively—benchmarks that define optimal agreement with ground observations.
In the dry season, most SPPs cluster in the overestimated–low-volume quadrant, indicating elevated volume ratios but still below the observed rainfall sum. Notably, CHIRPS V2.0, ClimGridPh-RR, and IMERG V07B occupy the upper-left section, signifying an overestimation tendency despite lower absolute totals. SM2RAIN-ASCAT V2.1.2n stands closest to the ideal intersection, suggesting a balanced volume estimate. In contrast, APHRODITE V1901 plots below the 1.0 ratio line with low total volume, placing it in the underestimated–low volume quadrant and indicating conservative dry-season estimates. During the wet season, the spread between products becomes more pronounced. ERA5 and GSMaP V8 fall within the overestimated–high volume zone, tending to overstate the seasonal peak volumes. Conversely, MSWEP V2.2 and PERSIANN-CDR V1.0 lie above the 1.0 ratio line, with total volumes exceeding the observed benchmark, placing them firmly in the overestimated–high-volume quadrant. Again, SM2RAIN-ASCAT remains near the ideal crosshair, showing consistent volume reliability across wet-season conditions.
In the overall season panel, products exhibit more precise separation. CHIRPS V2.0, ClimGridPh-RR, and SM2RAIN-ASCAT cluster around the observed total with ratios close to 1.0, reflecting stable cumulative volume representation. APHRODITE V1901 continues to show conservative estimates (low volume, low ratio), while ERA5 and GSMaP V8 remain outliers in the underestimated–low-volume region. While capturing higher volumes, MSWEP V2.2 and IMERG V07B overshoot both in sum and ratio, indicating a tendency toward inflated cumulative rainfall. This analysis emphasizes that volume consistency varies widely across SPPs and cannot be evaluated by a single metric alone. SM2RAIN-ASCAT V2.1.2n demonstrates the most reliable volume representation across all seasons, consistently aligning near the ideal VR = 1.0 and observed rainfall sum lines. Its performance underscores the importance of multi-metric, seasonally disaggregated validation in selecting precipitation products for hydrologically sensitive applications, such as reservoir operations, flood forecasting, and water resource allocation.

3.2.3. Erosive Precipitation Characteristics

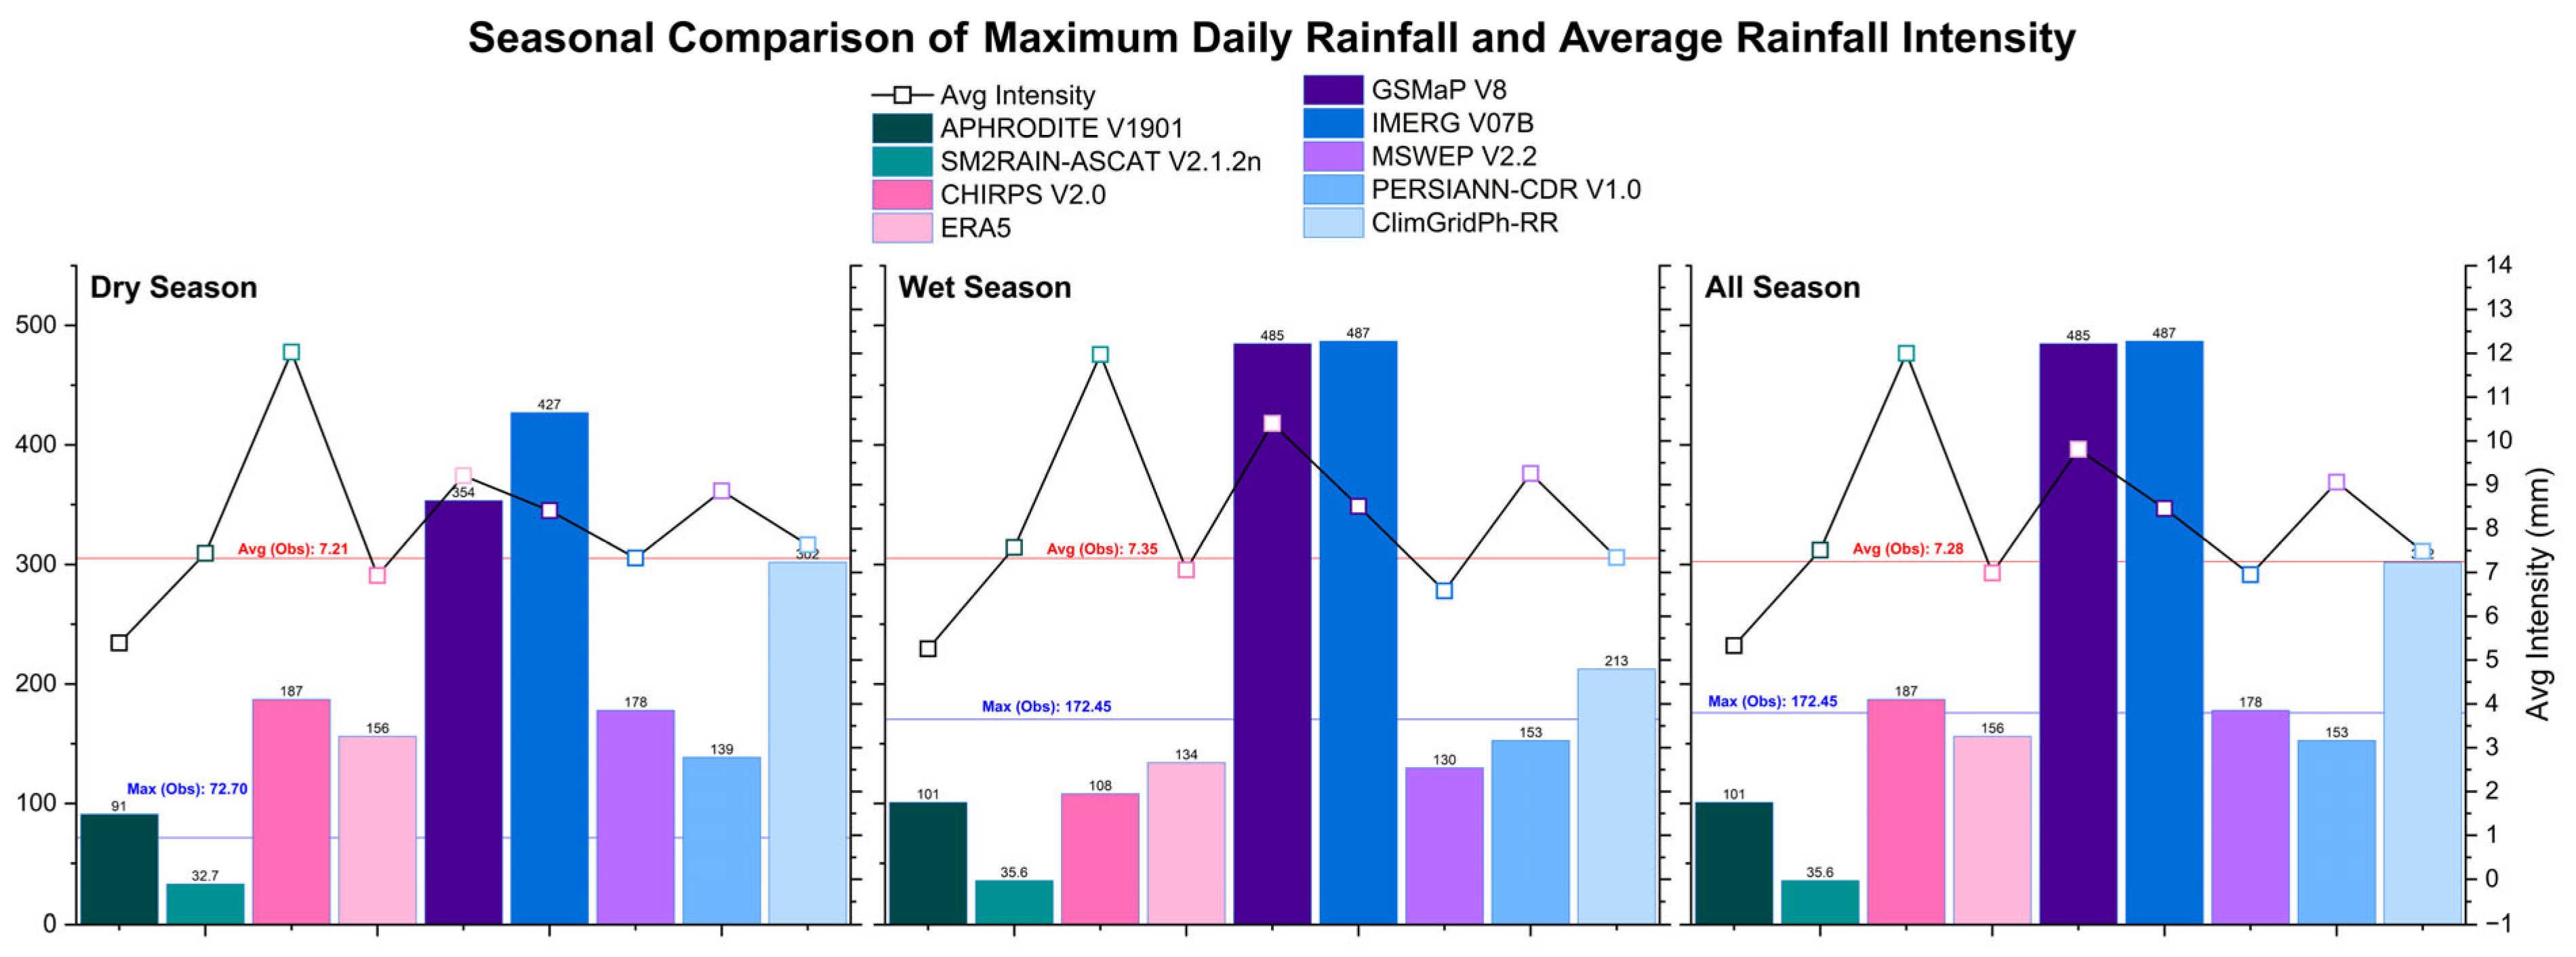
Erosive precipitation indicators, such as Maximum Daily Rainfall (MDR) and Average Rainfall Intensity (ARI), are vital for assessing the capacity of precipitation to trigger soil erosion and sediment transport processes, especially critical in steep, erosion-prone watersheds like the Magat River Basin. Figure 7 presents a seasonal comparison of MDR and ARI across SPPs, benchmarked against observed values: MDR = 172.45 mm and ARI thresholds of 7.21 mm/day (dry), 7.35 mm/day (wet), and 7.28 mm/day (overall). Across all seasons, IMERG V07B consistently reported the highest MDR, peaking at 487 mm in both the wet and overall periods and 477 mm in the dry season—far exceeding the observed MDR. This indicates a significant tendency to overestimate extreme events, which, if used uncorrected, could lead to inflated peak discharge and sediment yield predictions. GSMaP V8 closely mirrors this behavior, with maximum values nearly identical to IMERG, suggesting similar implications for erosion modeling.
CHIRPS V2.0 and ClimGridPh-RR reported moderate to high MDRs across seasons. CHIRPS ranged from 197 mm to 348 mm, while ClimGridPh-RR ranged from 213 mm (dry) to 302 mm (overall). While still above the observations, these values are more restrained than IMERG or GSMaP, placing them closer to realistic extremes. ClimGridPh-RR maintained a stable ARI near or above the observed baseline, especially in the dry season, where it recorded values close to 10 mm/day, aligning well with erosivity thresholds. This balance makes it a strong candidate for soil loss and sediment transport modeling.
In contrast, SM2RAIN-ASCAT V2.1.2n exhibited the lowest MDRs, ranging from about 73 mm (dry) to 101 mm (overall), well below observational extremes. Its ARI values also remained consistently low (often below 5 mm/day), indicating a dampened intensity distribution and limited ability to capture erosive rainfall events. ERA5 and MSWEP V2.2 also produced relatively low MDRs (generally <200 mm) with ARIs consistently below 5 mm/day, further suggesting a limited ability to represent high-intensity precipitation. This underestimation may cause these products to mischaracterize storm-driven sediment dynamics.
Meanwhile, IMERG V07B and GSMaP V8 tended to overestimate erosive extremes, while CHIRPS V2.0 and ClimGridPh-RR struck a better balance, with MDR and ARI values that tracked closer to observations. These findings highlight their suitability for erosion modeling, RUSLE applications, and landscape vulnerability assessments. Overall, the comparison underscores the importance of selecting SPPs that capture both cumulative rainfall and the intensity characteristics that drive sediment mobilization.
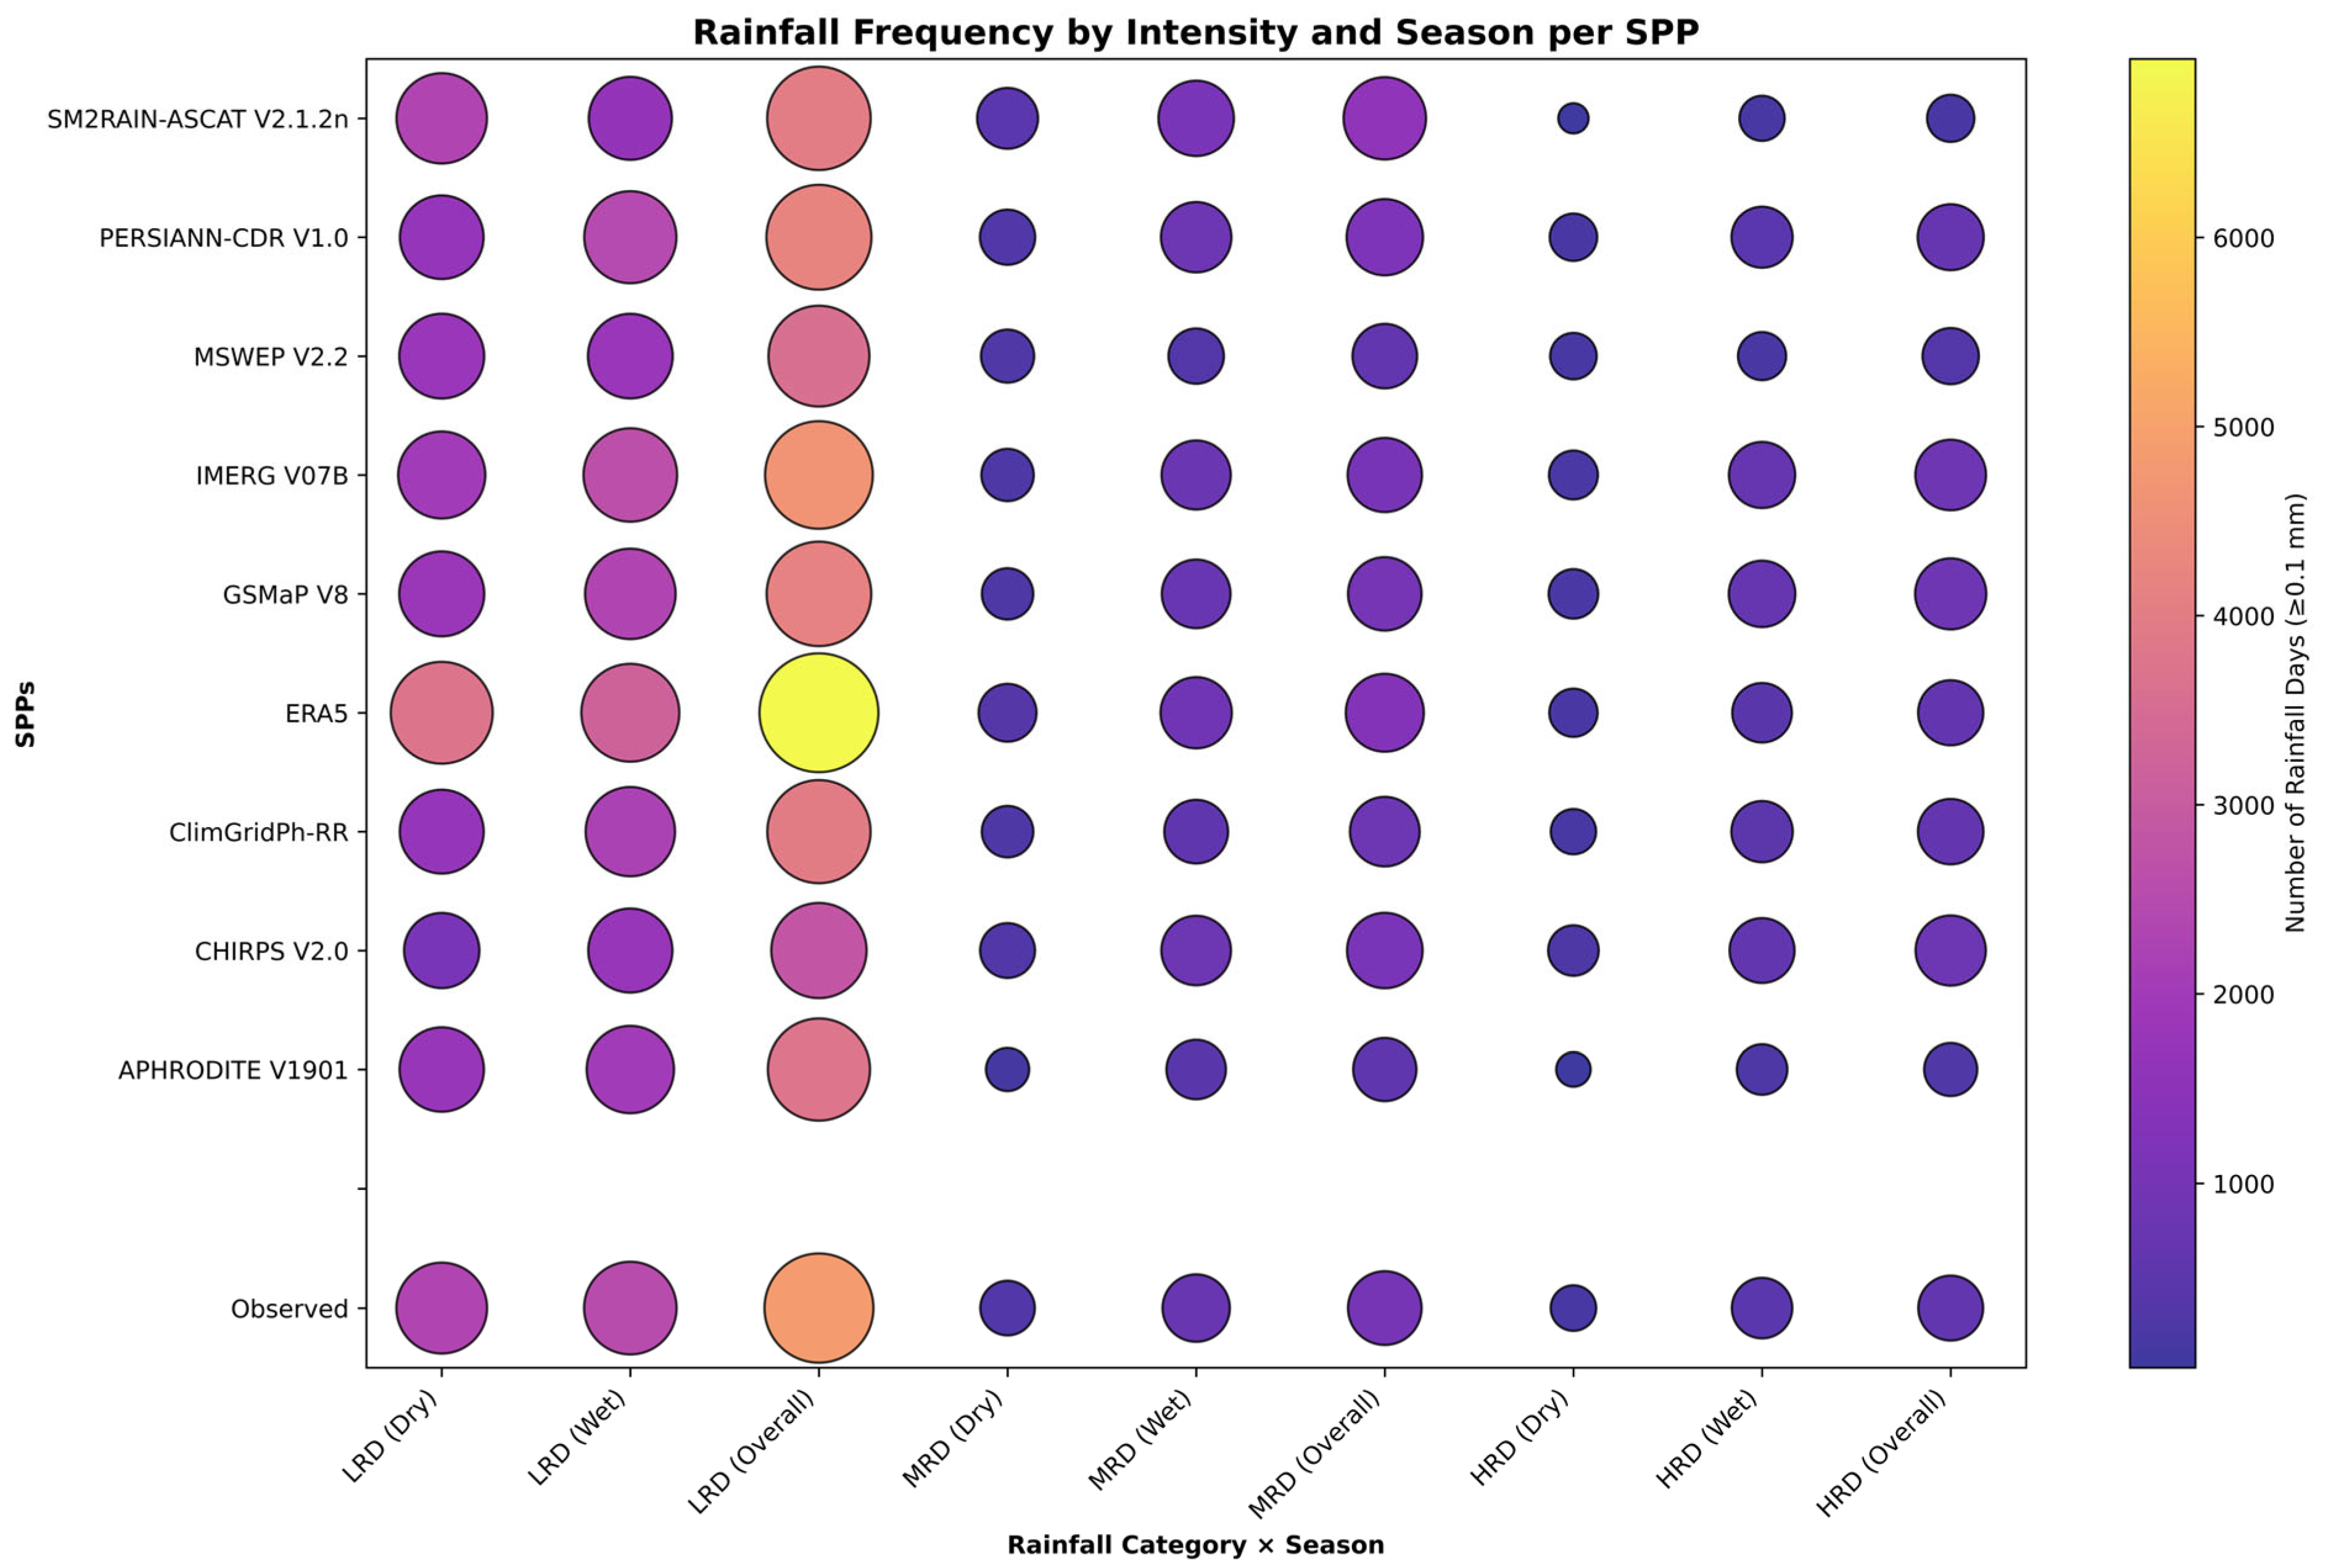
Figure 8 presents a comprehensive visual of rainfall event frequencies categorized into Low Rainfall Days (LRD: 0.1–9.9 mm), Moderate Rainfall Days (MRD: 10–20 mm), and Heavy Rainfall Days (HRD: >20 mm) for each SPP, segmented across the dry, wet, and overall seasons. The plot provides a comprehensive view of rainfall event occurrence, utilizing bubble size and color to represent frequency, serving as a diagnostic tool for evaluating each product’s ability to capture the rainfall spectrum.
Low Rainfall Days (LRD) dominate across all SPPs and seasons, with ERA5 notably overestimating these events—especially in the wet and overall periods—evidenced by the largest, most intense bubbles. This supports previous findings that ERA5 tends to over-detect light rainfall, possibly due to its high model sensitivity and assimilated reanalysis scheme. IMERG V07B, PERSIANN-CDR V1.0, and MSWEP V2.2 also show elevated LRD frequencies, though at more moderate levels. In contrast, SM2RAIN-ASCAT V2.1.2n underestimates LRDs across all seasons, which may reflect the conservative nature of its soil-moisture-based retrieval algorithm, potentially misclassifying light precipitation as background noise. Observed rainfall frequencies (last row) fall within the mid-range, highlighting that APHRODITE and CHIRPS V2.0 offer closer alignment with actual LRD behavior, making them suitable for drought assessment and soil moisture studies.
Moderate Rainfall Days (MRD)—critical for baseflow generation and agricultural water use—are best captured by IMERG V07B and SM2RAIN-ASCAT V2.1.2n, which show larger bubbles across all seasons. CHIRPS V2.0 and ClimGridPh-RR also align moderately well with observations, whereas ERA5, GSMaP V8, and APHRODITE V1901 tend to underestimate MRDs, especially during the wet season. This under-detection indicates these products may not fully reflect runoff-triggering rainfall, limiting their suitability for water budget and hydrological calibration applications.
Heavy Rainfall Days (HRD) are most accurately represented by IMERG V07B, followed by ClimGridPh-RR and CHIRPS V2.0. These products show more frequent detection of high-magnitude rainfall, particularly in the wet and overall seasons, supporting their application in flood forecasting, landslide hazard modeling, and sediment yield estimation. ERA5, MSWEP V2.2, and GSMaP V8 struggle to detect these events, with smaller or nearly absent bubbles in most categories—indicating potential risks in using them for extreme event modeling. The observed record confirms this frequency pattern, with IMERG and CHIRPS most closely mimicking the empirical HRD distribution.

3.3. Pre-Ranking Using EWM-TOPSIS Analysis

An Entropy Weight Method (EWM) was applied to fourteen (14) key evaluation metrics across all seasonal conditions (dry, wet, and overall) to integrate multi-dimensional performance results quantitatively. This method determines objective, data-driven weights (Wj) for each metric by analyzing their entropy (Ej) and diversification degree (Dj) across the evaluated SPPs. Metrics with greater informational variance (i.e., higher discriminative power) receive higher weights, ensuring that more decisive indicators exert more substantial influence during subsequent MCDA-TOPSIS ranking.
As shown in Table 5, several metrics emerged as dominant performance indicators due to their high diversification and low entropy values. Notably, MAE, R2, SORS, and VR received the maximum weight of 0.087, highlighting their strong contribution in differentiating SPP accuracy, consistency, and volume fidelity. Similarly, NSE, RB, RSRM, and ARI followed closely with weights between 0.085 and 0.086, confirming their importance in capturing predictive skill and erosive rainfall potential. Interestingly, the Moderate Daily Rainfall (MDR) metric also received a significant weight (0.081), indicating that peak rainfall events are recognized as influential variables in product assessment. POD, a standard event detection metric, earned a moderate weight (0.061), suggesting its functional but less decisive role compared to core statistical estimators.
On the other hand, some metrics were assigned minimal weights due to poor variability or limited contribution to differentiation among SPPs. For instance, although conceptually necessary for false alarm analysis, FAR showed limited discrimination (entropy = 0.438), resulting in a lower weight (0.049). Due to near-zero diversification or excessively high entropy, CSI and NRDY were assigned extremely low weights (0.001 and 0.033, respectively). This suggests these metrics were uniform across products or lacked enough fluctuation to impact ranking outcomes.
Overall, the EWM analysis reinforces the value of accuracy-based (RMSE, MAE), correlation-based (R2, NSE), and hydrologically significant volume/intensity metrics (VR, SORS, ARI, RB) as primary drivers in assessing SPP performance. Detection-based indicators, while useful, contributed less to the final ranking due to higher entropy or weaker variability. These weighted insights ensure that the ensuing MCDA-TOPSIS rankings are statistically grounded and seasonally integrative, optimizing the selection of SPPs for hydrological applications under variable climate conditions.
Figure 9 presents the seasonal and overall rankings of the evaluated SPPs using lollipop charts derived from MCDA-TOPSIS analysis. SM2RAIN-ASCAT V2.1.2n emerged as the top-performing product across all periods, ranking 1st in dry, wet, and overall seasons, reflecting its consistent accuracy, volume representation, and event detection strength. This performance confirms its suitability for full-season hydrologic modeling in the MRB.
SM2RAIN-ASCAT V2.1.2n consistently ranks 1st in all three periods, demonstrating outstanding reliability and robustness in capturing both seasonal and overall rainfall behavior. Its soil moisture–driven algorithm appears to effectively translate into accurate precipitation estimations, particularly valuable for water balance and hydrological applications in regions like the MRB. CHIRPS V2.0 also performs exceptionally well, ranking 2nd in the dry season, 3rd in the wet season, and 2nd overall. Its blended approach, integrating satellite and station data, contributes to stable detection of moderate and heavy rainfall—essential for hydrological modeling and drought monitoring. ClimGridPh-RR, the Philippine national gridded rainfall dataset developed using bias correction from ground stations, ranked 5th in dry, 2nd in wet, and 4th overall. Its strong wet season performance and regional calibration explain its high reliability, particularly in monsoon-dominant regions. While its dry season ranking is lower, its overall consistency makes it a valuable reference. APHRODITE V1901 ranks 4th in dry, 4th in wet, and 3rd overall, benefiting from relatively balanced seasonal behavior, especially in areas with sparse gauge networks. PERSIANN-CDR V1.0 performs moderately, ranking 3rd in dry, 5th in wet, and 5th overall, suggesting occasional strengths under low- to mid-intensity rainfall but inconsistent seasonal adaptability.
Lower-ranked products include MSWEP V2.2, IMERG V07B, GSMaP V8, and ERA5. Notably, ERA5 ranks last in all three categories (9th dry, wet, and overall), reflecting its limitations in detecting rainfall extremes and its tendency to overreport light rainfall—findings consistent with previous bias assessments. IMERG V07B, despite popularity in tropical settings, shows 6th in dry, 7th in wet, and 7th overall, indicating underperformance in capturing rainfall variability in the MRB. GSMaP V8 consistently ranks 8th, suggesting inadequate sensitivity during both dry and wet periods. MSWEP V2.2 fluctuates around the mid-to-lower tier, indicating moderate utility but lacking reliability for high-impact applications.
These results validate SM2RAIN-ASCAT, CHIRPS, and ClimGridPh-RR as the most suitable SPPs for hydrologic applications in the MRB, especially in scenarios requiring accurate seasonal variability and rainfall energy representation. This seasonal breakdown emphasizes the necessity of full-cycle evaluations, as product effectiveness is highly context- and season-dependent. These MCDA rankings are a robust foundation for SPP selection in streamflow simulation, soil erosion estimation, flood forecasting, and drought assessment applications. However, since raw satellite data often carries systematic biases—especially under intense or sparse precipitation conditions—the next phase of this study incorporates bias correction. The goal is to determine whether the top-performing SPPs can be further improved and how their performance metrics and ranks evolve post-correction.

3.4. Bias Correction Impact Assessment

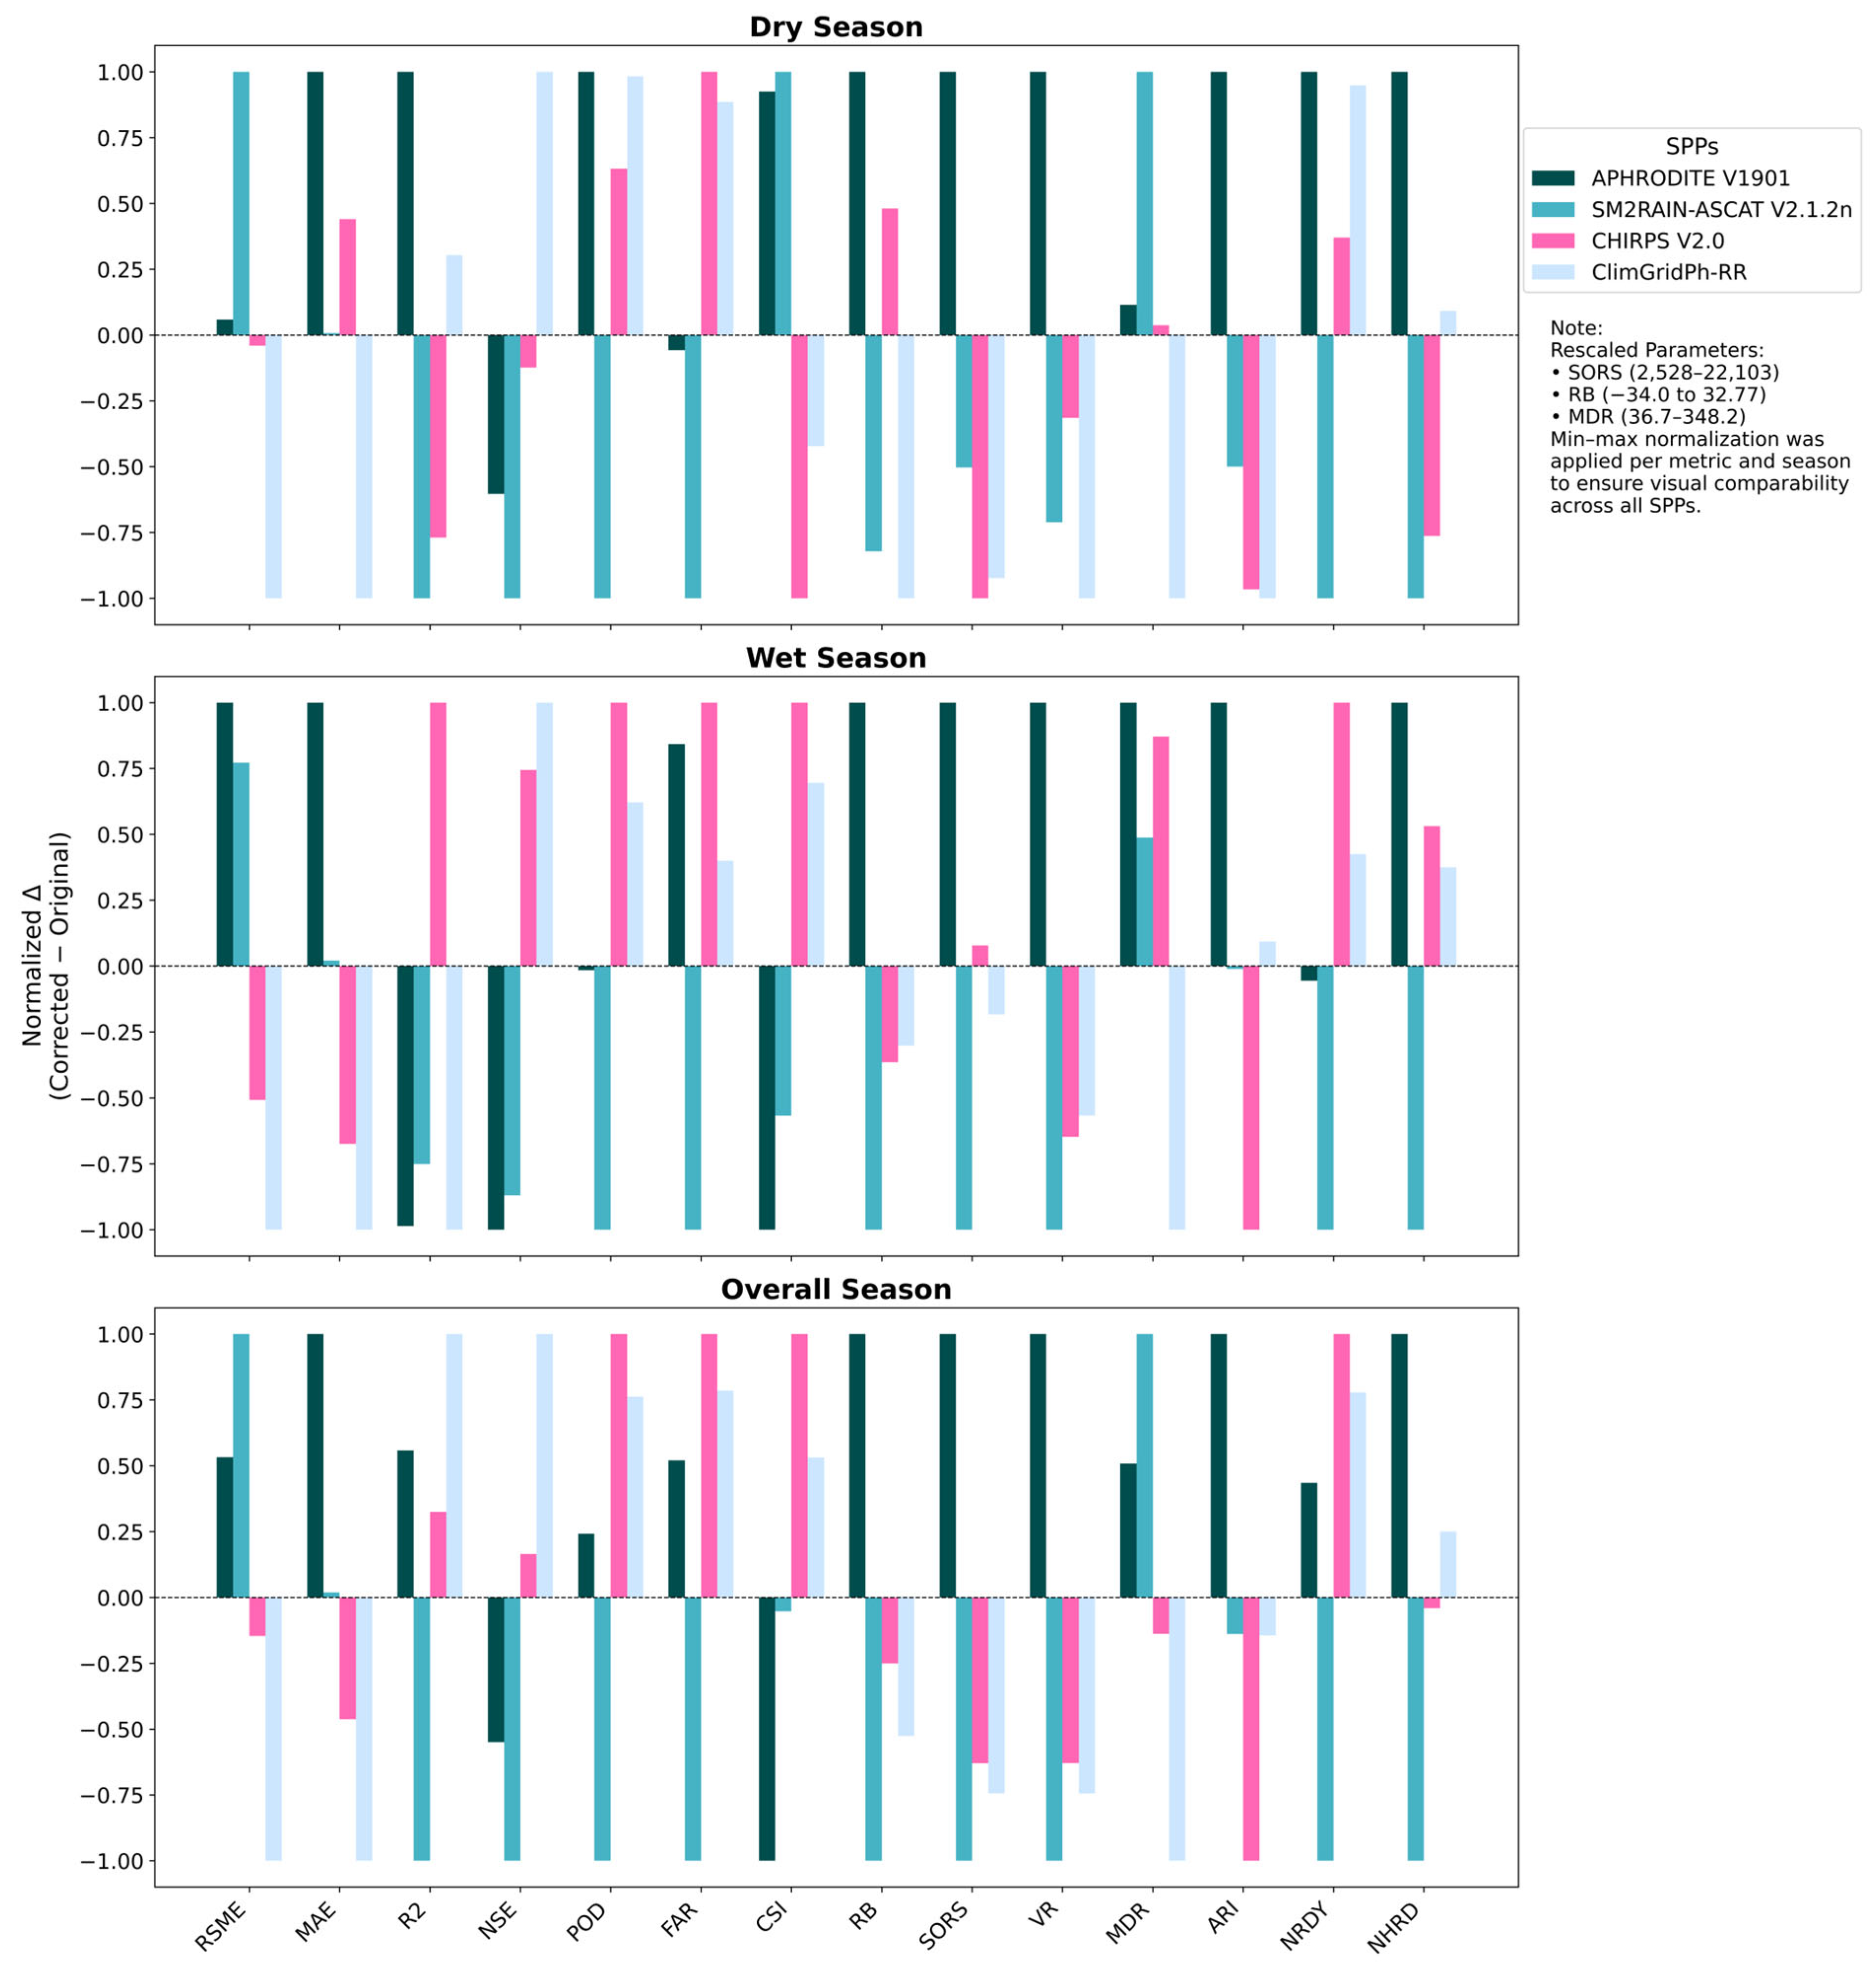
The impact of quantile mapping-based bias correction was assessed across 14 performance metrics for the four top-ranked SPPs—SM2RAIN-ASCAT V2.1.2n, CHIRPS V2.0, ClimGridPh-RR, and APHRODITE V1901—as identified through the pre-correction MCDA-TOPSIS evaluation. As shown in Figure 10, the normalized delta charts illustrate the direction and magnitude of changes (corrected minus original) for each metric across the dry, wet, and overall seasons. Normalization was applied per metric to ensure visual comparability, particularly for those with wide numerical ranges such as RB, SORS, and MDR.
The results show that bias correction led to substantial improvements across key statistical and hydrological metrics, particularly for SM2RAIN-ASCAT and CHIRPS. SM2RAIN-ASCAT displayed the most significant gains during the dry season, where improvements in RMSE, MAE, NSE, and R2 reflect significantly enhanced accuracy in capturing sparse rainfall events. Bias-related metrics such as RB and SORS showed strong negative deltas across all seasons, indicating that chronic overestimation was effectively corrected. Event detection indicators such as POD and CSI also improved, enhancing its utility for drought modeling and seasonal streamflow simulation. CHIRPS, on the other hand, exhibited peak performance gains during the wet season, particularly in metrics such as NSE, ARI, MDR, and NHRD—parameters essential for flood risk assessment and erosion modeling. The correction also reduced RB and SORS values toward observed benchmarks, reflecting better volumetric representation. Although minor increases were seen in FAR, this trade-off was outweighed by corresponding increases in POD and CSI, supporting more reliable event detection post-correction.
ClimGridPh-RR responded well to the correction across all seasons, especially in detection metrics (POD, CSI) and erosive indicators (ARI, NHRD). It also showed moderate improvements in correlation-based metrics (R2) and intensity metrics, making it more competitive post-correction. However, it showed mixed changes in FAR and NRDY, which may reflect the complexity of adjusting station-blended products. APHRODITE V1901 exhibited more modest but consistent improvements, mainly in RB, SORS, and POD, with less change in RMSE and NSE. While it did not respond as strongly as the other products, the correction process still enhanced its suitability for long-term climatological applications and low-resolution hydrologic assessments.
Among all metrics, RB demonstrated the most dramatic improvement, with all SPPs showing significant negative shifts post-correction, effectively neutralizing systematic overestimation. Similarly, SORS values dropped significantly, indicating closer alignment with observed rainfall totals. The MDR metric, which initially ranged from 36 mm to 348 mm, narrowed toward the observed benchmark (~172 mm), improving suitability for simulating flow peaks and sediment pulses. Other erosive metrics, such as ARI and NHRD, also showed consistent positive deltas for CHIRPS and ClimGridPh-RR, reinforcing their enhanced sensitivity to high-intensity precipitation. In summary, the delta analysis confirms that quantile mapping significantly improved the performance of key precipitation metrics across all seasons. SM2RAIN-ASCAT V2.1.2n and CHIRPS V2.0 emerged as the most responsive products, demonstrating improved statistical accuracy, event detection, and intensity representation. ClimGridPh-RR and APHRODITE also benefited from correction, although to a lesser extent.
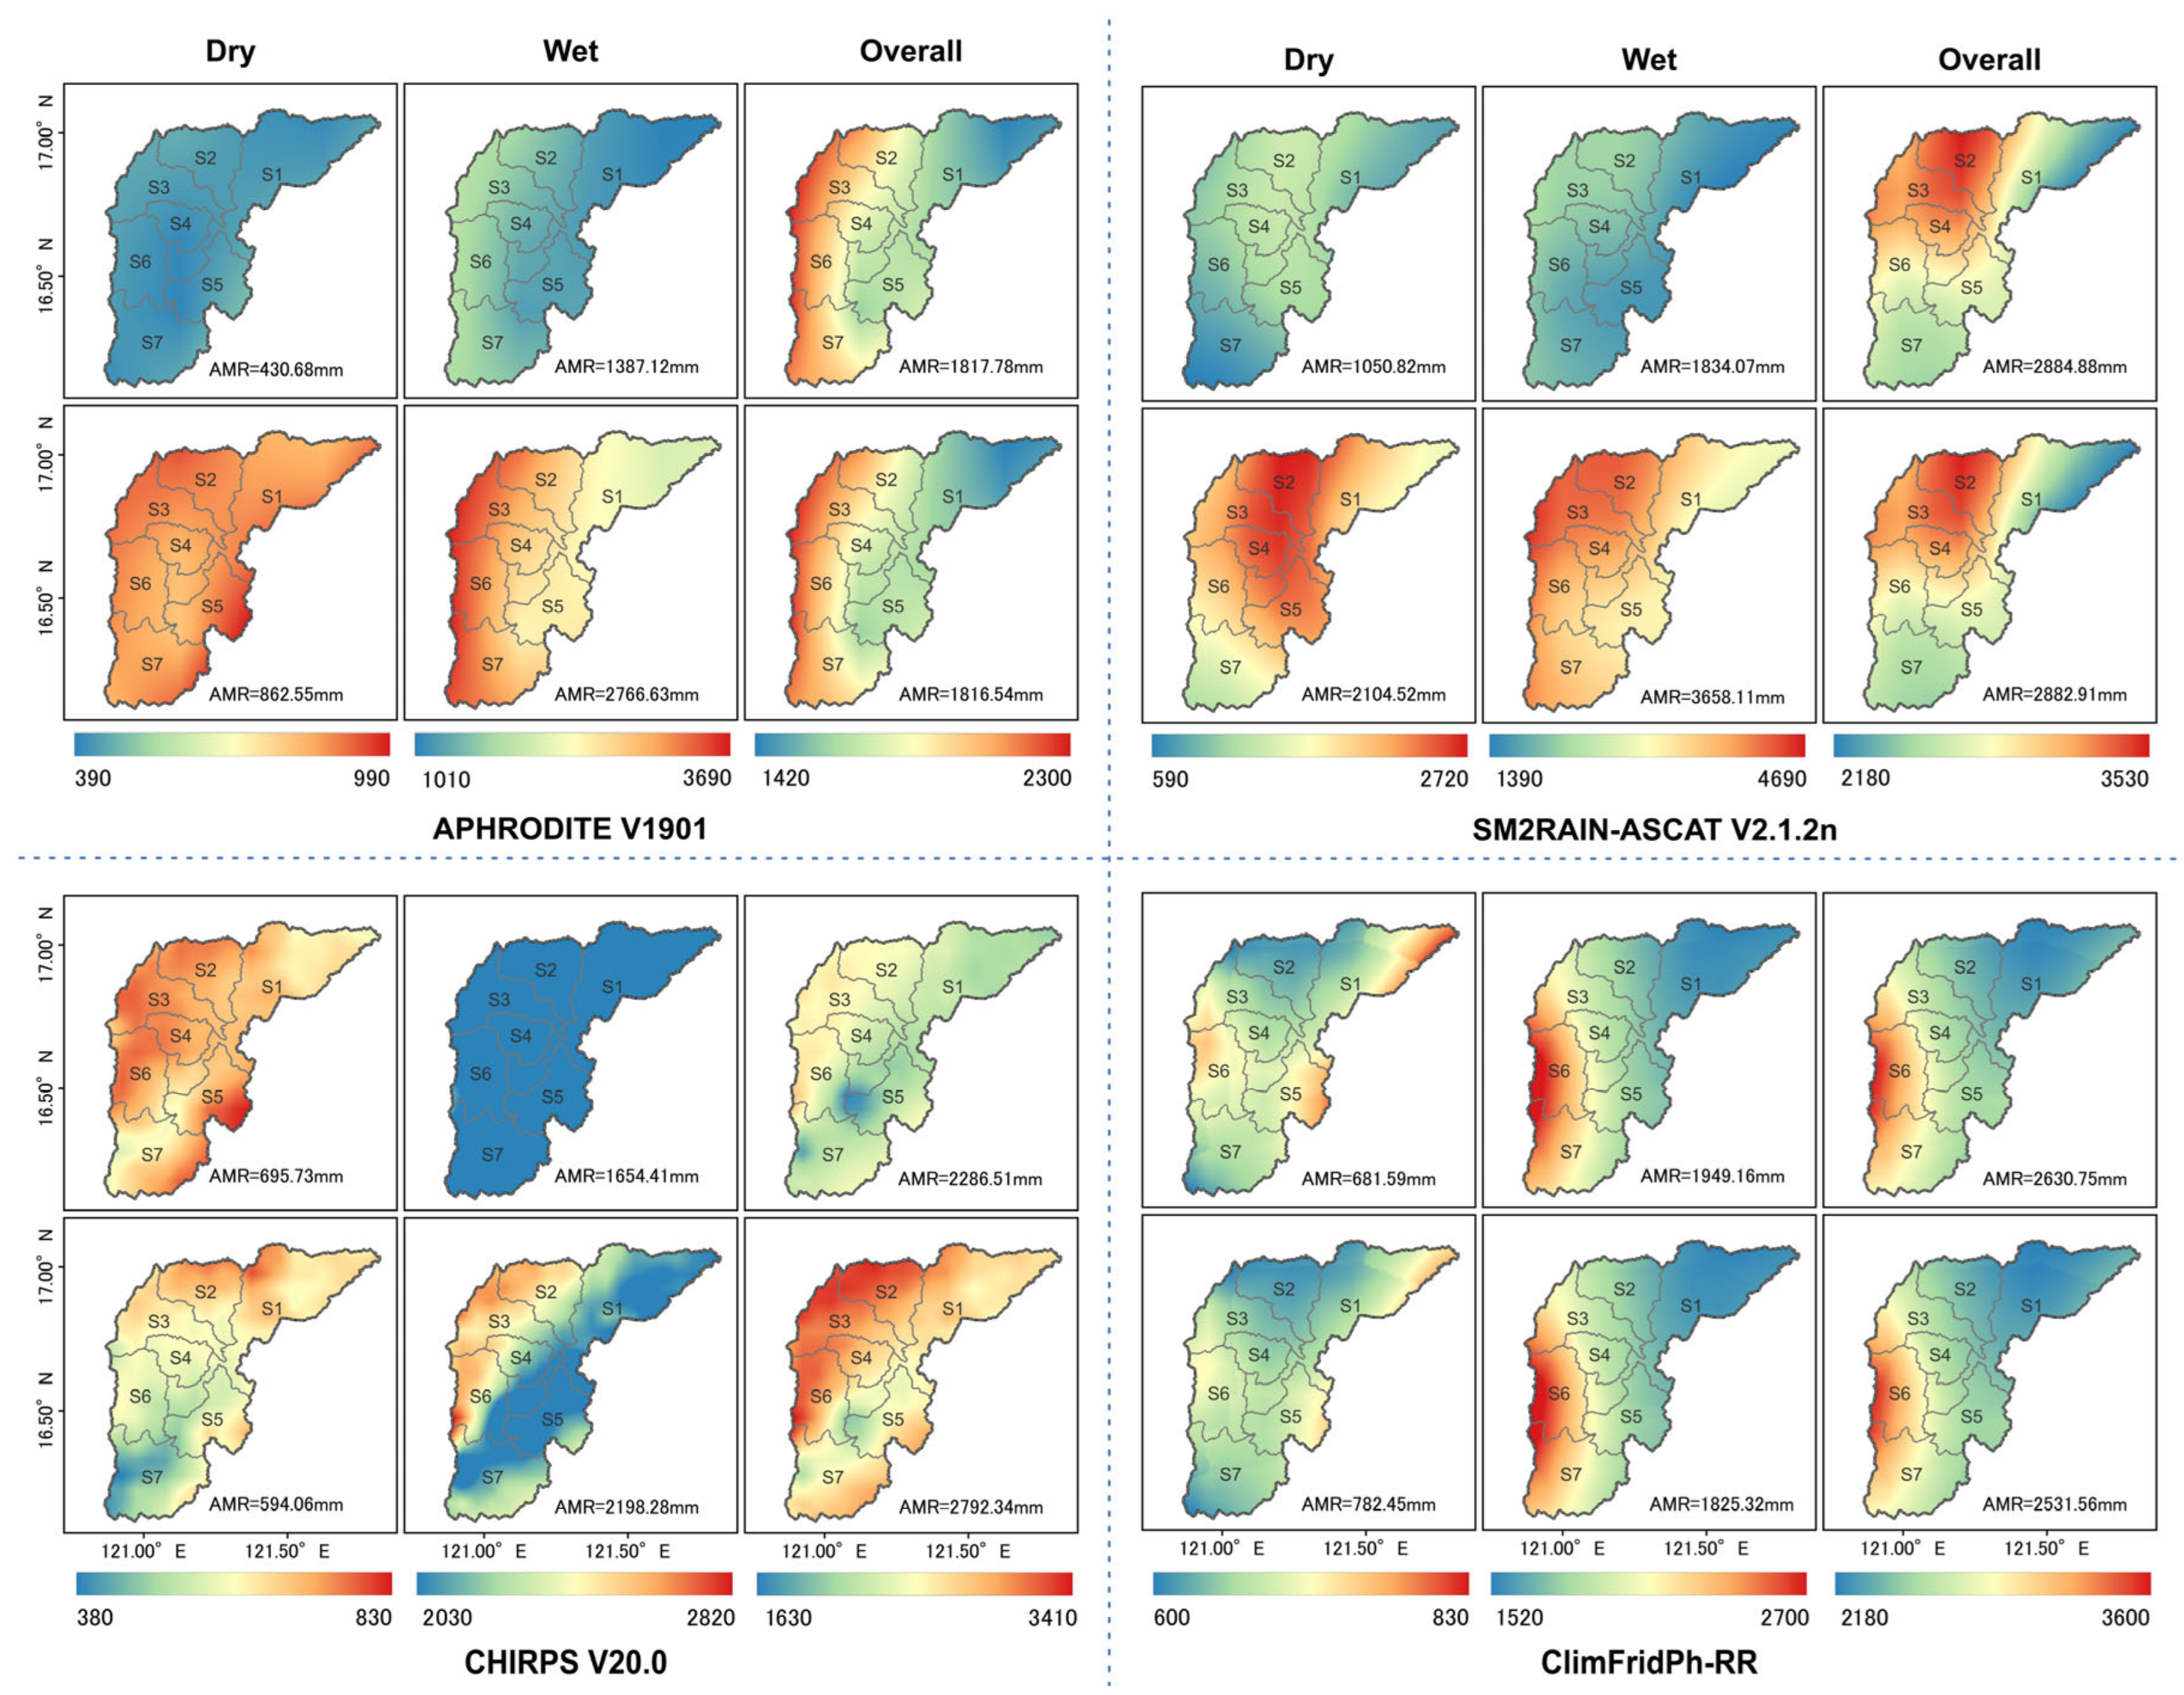
Figure 11 illustrates the spatial distribution of seasonal and overall rainfall (in mm) across sub-basins S1 to S7 in the Magat River Basin (MRB), using the top four ranked SPPs: APHRODITE V1901, SM2RAIN-ASCAT V2.1.2n, CHIRPS V2.0, and ClimGridPh-RR. Each dataset is shown before and after bias correction (upper and lower rows), segmented by dry, wet, and overall seasons (columns). The average rainfall (AMR) values across the MRB are also indicated to summarize seasonal totals. SM2RAIN-ASCAT V2.1.2n consistently reports the highest rainfall values among the four SPPs across all seasons, with a particularly strong signal in upstream sub-basins (S1–S3) during the wet season. Its raw data shows an AMR of 2884.88 mm overall, which slightly adjusts to 2882.91 mm post-correction—indicating this product is already well-calibrated and maintains orographic and seasonal gradients effectively. Spatially, it reflects realistic wet-season rainfall concentration in northern and central sub-basins, crucial for upstream hydrological modeling.
CHIRPS V2.0 shows a relatively balanced spatial distribution and seasonal rainfall pattern. In the dry season, higher rainfall is shown in central zones (S3–S6), while the wet season reveals stronger accumulation in the north (S1–S2). The correction enhances the spatial coherence and reduces overestimation in southern sub-basins. Overall AMR increases from 2286.51 mm (raw) to 2792.34 mm (corrected), suggesting that CHIRPS initially underestimates total rainfall volume but maintains strong spatial realism post-adjustment.
ClimGridPh-RR, the PAGASA-corrected gridded dataset, presents the most uniform spatial coverage and moderate rainfall values across all sub-basins. After correction, AMR slightly decreases from 2531.56 mm to 2286.51 mm, with seasonal shifts showing a slight reduction in peak wet season rainfall. Despite this, its spatial consistency and gauge-based calibration enhance its regional applicability, particularly in downstream modeling where station density supports interpolation reliability. APHRODITE V1901 shows notable underestimation of dry-season rainfall (AMR of 430.68 mm) and modest performance in the wet season (1387.12 mm). After correction, values increase in dry areas, especially in the southern catchments (S6–S7), improving alignment with expected climatological patterns. However, its spatial gradient remains flatter compared to SM2RAIN or CHIRPS, indicating potential limitations in capturing local orographic effects without in situ enhancement.
In conclusion, SM2RAIN-ASCAT maintains superior spatial variability and strong orographic sensitivity both before and after correction, reinforcing its utility for flood and sediment risk modeling. CHIRPS offers good seasonal contrast and benefits from correction in southern areas, while ClimGridPh-RR provides dependable regional coverage. APHRODITE, although improved post-correction, still reflects lower intensities and may underrepresent rainfall extremes. The figure underscores the critical role of bias correction in improving spatial rainfall realism and highlights the varying capabilities of SPPs across seasons and basin sub-units.
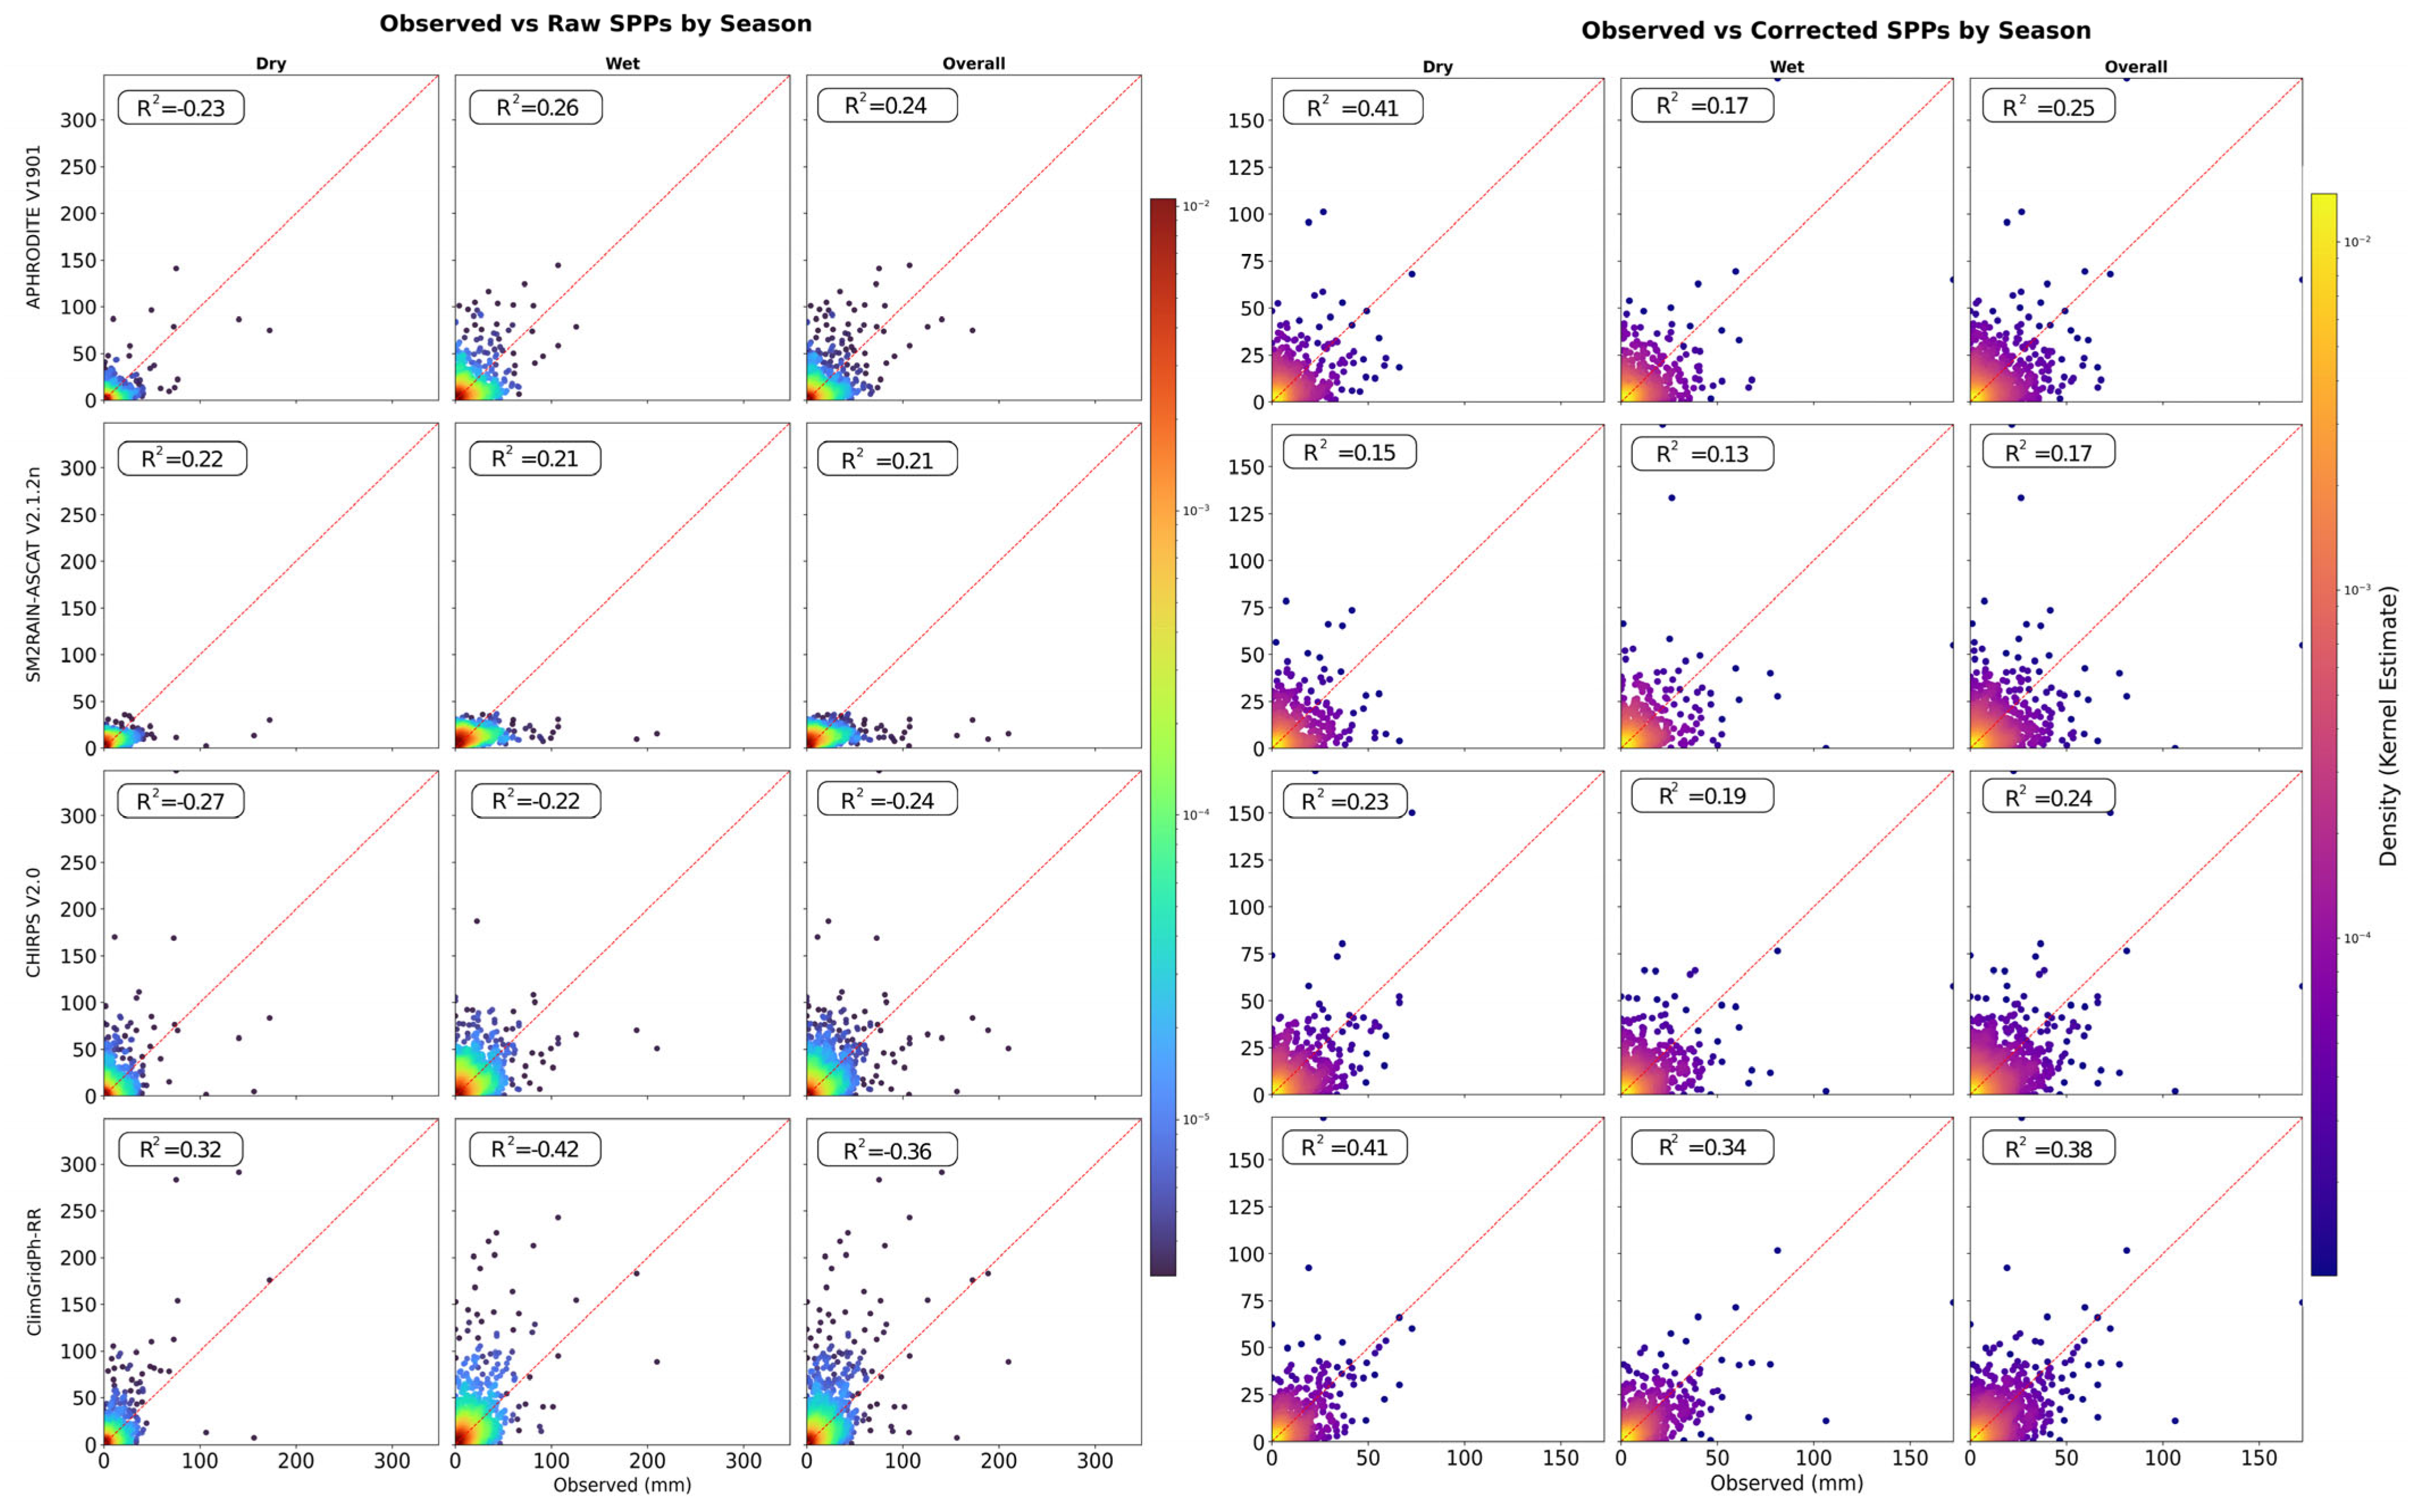
Figure 12 presents a detailed comparison between observed daily rainfall and both raw and bias-corrected SPPs—APHRODITE V1901, SM2RAIN-ASCAT V2.1.2n, CHIRPS V2.0, and ClimGridPh-RR—across the dry, wet, and overall seasons. The scatterplots use kernel density estimation (KDE) to visualize the concentration of rainfall values, overlaid with a red 1:1 line indicating perfect agreement. Each subplot includes the coefficient of determination (R2) to quantify the correlation between SPPs and rain gauge data. In their raw form (left panel), all SPPs show significant underestimation, particularly in the dry season, where most KDE density is concentrated in the lower-left corner, indicating low precipitation estimates across both observed and satellite records. ClimGridPh-RR displayed the strongest agreement among the raw datasets, with R2 values of 0.32 (dry), 0.42 (wet), and 0.36 (overall). CHIRPS V2.0 and APHRODITE V1901 followed, though with weaker correlations, particularly during the dry season (R2 = 0.27 and 0.23, respectively). SM2RAIN-ASCAT V2.1.2n exhibited the lowest correlations in all seasons (R2 = 0.22, 0.21, and 0.21), highlighting its limited raw sensitivity to observed variability despite strong performance in other evaluation metrics.
After bias correction, improvements were most evident in the dry and overall seasons, with ClimGridPh-RR and APHRODITE showing increased R2 values and tighter clustering around the 1:1 line. Notably, ClimGridPh-RR_corrected showed the highest R2 values overall—0.41 (dry), 0.34 (wet), and 0.38 (overall)—indicating consistent gains across all seasons. APHRODITE_corrected also showed marked improvement, rising to R2 = 0.41 (dry), 0.17 (wet), and 0.25 (overall). Although its dry season correction was strong, the wet season correlation remained modest. CHIRPS_corrected maintained similar values to its raw form (R2 = 0.23 to 0.24) with minor changes in the wet and overall periods, suggesting that the product was already well-aligned pre-correction but benefited slightly from error smoothing. SM2RAIN-ASCAT_corrected showed more modest gains (R2 = 0.15, 0.13, and 0.17), suggesting improved distribution fit, particularly for moderate rainfall, though its correlation remained relatively weak. In contrast, wet-season correlations remained relatively weak across all products, indicating that quantile mapping reduced biases in magnitude but did not fully resolve distributional errors during high rainfall periods. These results suggest that correction is more effective for moderate rainfall regimes, while wet-season extremes remain a challenge for SPPs.
Overall, all SPPs exhibited limitations in capturing dry season rainfall, even after correction. The KDE contours during the dry season remained concentrated near the origin, and R2 values were noticeably lower compared to the wet and overall seasons, indicating persistent challenges in simulating sparse and low-intensity rainfall. However, the wet season revealed more substantial improvements following bias correction. KDE densities shifted upward and aligned more closely with the 1:1 line, reflecting better detection of moderate to high rainfall events. The density gradient—from blue to yellow—emphasized how correction effectively reduced underestimation and scatter in the data. This KDE-enhanced scatterplot analysis highlights the positive impact of bias correction, particularly in improving statistical alignment and consistency across varying rainfall regimes. Among the products, ClimGridPh-RR exhibited the most significant gains, especially in the dry and overall seasons. CHIRPS V2.0 also showed notable improvements, particularly in high-frequency rainfall detection. SM2RAIN-ASCAT V2.1.2n and APHRODITE V1901 benefited from correction to a lesser extent, with modest improvements in correlation. These results affirm that bias correction substantially enhances the hydrologic applicability of SPPs, especially for rainfall-sensitive modeling such as flood simulation, soil erosion estimation, and water resource assessments in complex tropical basins like the Magat River Basin.
The post-correction performance metrics presented in Table 6 reveal significant improvements in the reliability and hydrological applicability of the four selected SPPs—APHRODITE V1901, SM2RAIN-ASCAT V2.1.2n, CHIRPS V2.0, and ClimGridPh-RR—across dry, wet, and overall seasons. Among these, ClimGridPh-RR emerged as the top-performing product in most statistical and detection-related indicators. It recorded the lowest RMSE (6.50 mm dry, 9.99 mm wet, 8.43 mm overall) and MAE (2.91 mm dry, 5.86 mm wet, 4.39 mm overall), alongside the highest R2 (0.41 dry and overall) and NSE (0.39 dry, 0.10 wet, 0.25 overall), indicating excellent agreement with ground observations. Its strong detection capability is reflected in high POD (0.95 wet) and CSI (0.67 overall), although it exhibited a slightly elevated FAR (0.20 overall) compared to CHIRPS. ClimGridPh-RR also demonstrated consistent performance in volumetric and erosivity measures, with satisfactory RB (–1.59%), ARI (7.29 mm/day), and SORS (15,666.84), reinforcing its robustness for operational hydrology.
CHIRPS V2.0 followed closely, excelling in high-intensity and frequency-related metrics. It had the highest ARI (10.80 mm/day wet, 10.18 mm/day overall), the best VR (1.00 overall), and matched the observed MDR (172.45 mm across all seasons). It also led in NHRD (642) and NRDY (1899), confirming its superior sensitivity to high-frequency and extreme rainfall events. Despite moderate R2 (0.24 overall) and NSE (–0.03 overall), it maintained reliable POD (0.63 overall) and CSI (0.56 overall), making it a well-balanced product ideal for erosion, sediment transport, and flood hazard modeling.
SM2RAIN-ASCAT V2.1.2n displayed balanced performance across several metrics. Though it did not top any single category, it performed steadily in detection (POD = 0.82, CSI = 0.72), volume (VR = 0.65), and reliability (RB = –2.83%, SORS = 12,589.58). Its MDR (172.45 mm across all seasons) aligns well with observations, confirming its capacity to represent rainfall intensities. However, correlation-based metrics remained modest (R2 = 0.17 overall; NSE = –0.20), suggesting some limitations in capturing temporal rainfall patterns.
Meanwhile, APHRODITE V1901, although improved after correction, continued to lag in several performance categories. While it attained decent R2 (0.25 overall) and POD (0.82 overall), its NSE remained negative (–0.01 overall), and it exhibited the highest RB (3.17%) and SORS (12,575.37) among the four products. Additionally, its ARI (7.32 mm/day), NRDY (1630), and NHRD (409) were among the lowest, indicating limited skill in capturing event-based rainfall extremes. These characteristics suggest that APHRODITE may be more suited for long-term climatological analysis rather than event-driven hydrological modeling.
A key outcome of the correction process was the convergence of MDR values (172.45 mm) across all four SPPs to the observed benchmark, significantly improving representation of extreme daily rainfall events. Reductions in RB across all SPPs confirmed the resolution of systematic biases, while decreases in SORS indicated improved agreement in cumulative rainfall. Collectively, the post-correction metrics highlight ClimGridPh-RR as the most statistically consistent and detection-accurate product, CHIRPS V2.0 as best for reproducing intensity and frequency extremes, and SM2RAIN-ASCAT V2.1.2n as a stable option for balanced hydrological applications. APHRODITE V1901, while useful for spatial climatology, remains less reliable for high-resolution hydrological tasks. These findings support the use of corrected SPPs—particularly ClimGridPh-RR and CHIRPS—for enhanced flood forecasting, sediment simulation, and water resource planning in the Magat River Basin.

3.5. Post-Correction Suitability Analysis for the Best SPP

Following bias correction, a multi-criteria decision analysis was conducted using the EWM combined with the TOPSIS. The aim was to objectively rank the performance of each SPP across both seasonal evaluation (Dry, Wet, Overall) and hydrological application domains (drought monitoring, flood simulation, water balance estimation, and sediment modeling). While the initial EWM analysis was conducted using the raw performance data of all nine SPPs to establish consistent weights for the overall assessment, a separate EWM analysis was also performed using the bias-corrected top-performing SPPs. Although the seasonal and application-specific weights derived from the latter provide valuable insights into metric sensitivity under different hydrological contexts, the original weights from the raw dataset were retained for final evaluation to maintain consistency and comparability and avoid introducing bias from post-correction performance.
Table 7 shows the entropy-derived weights assigned to each performance metric under both seasonal conditions (dry, wet, and overall) and application-specific contexts (drought, flood, water balance, and sedimentation). These weights quantify the relative importance of each metric in differentiating SPP performance using the EWM, where higher variability across SPPs results in greater weight due to higher information content.
In the seasonal subset, metrics such as MAE, NSE, and RMSE received the highest weights, especially during the wet and overall periods—reflecting their dominant role in capturing seasonal rainfall accuracy and variability. For instance, MAE reached 24.65% in the overall season, while NSE peaked at 20.90% in the wet season. Conversely, metrics like POD, CSI, and NRDY showed near-zero weights in some seasons due to low inter-product variability post-correction, rendering them statistically less influential under those conditions. To address this, an “Overall (Raw)” weight column was included based on the original uncorrected dataset. This ensures that metrics with meaningful influence in the pre-correction evaluation—such as POD, CSI, and NRDY—are not entirely excluded in the final assessment due to uniformity introduced during correction. These raw-derived weights preserve the original discriminative structure of the dataset and allow consistent performance tracking across pre- and post-correction phases.
In application-based weighting, different hydrologic priorities shaped the metric importance. For drought monitoring, R2 (0.204), MAE (0.203), and VR (0.203) received the highest weights, emphasizing the need for temporal consistency and precipitation magnitude accuracy. In flood analysis, FAR (0.174), NSE (0.174), and POD (0.160) were prioritized due to their role in simulating extreme rainfall and event detection. For water balance applications, a more even distribution was observed across RMSE, MAE, R2, VR, and RB (all 0.200), highlighting the relevance of magnitude and cumulative volume accuracy. In sedimentation modeling, RB (0.382) and ARI (0.371) dominated, reflecting their role in controlling erosion estimates and sediment transport, followed by NHRD and MDR as secondary contributors.
This dual-weighting approach (seasonal and application-based) will guide the TOPSIS-based SPP ranking in two phases: (1) evaluating SPPs under general climatological conditions using the seasonal weights and (2) assessing suitability for specific hydrological applications using the application weights. Incorporating the “Overall (Raw)” weights ensures robustness and fairness by preventing the loss of critical indicators due to entropy collapse in corrected data. This comprehensive weighting matrix enhances the objectivity and relevance of the SPP evaluation framework across both seasonal variability and operational use cases.
According to the aggregated entropy weights, performance metrics such as R2, NSE, and MAE had the greatest influence in the seasonal rankings, emphasizing accuracy, predictive skill, and temporal consistency. As visualized in the heatmap (Figure 13), SM2RAIN-ASCAT V2.1.2n achieved the top rank (1st) in the dry, overall, and application-specific categories, including flood, water balance, and sedimentation. This strong showing reflects its consistency in detecting seasonal precipitation volumes and its robustness in erosivity-related parameters, despite having only moderate correlation-based metrics.
APHRODITE V1901, on the other hand, led in the wet season and ranked high in water balance and sedimentation applications, indicating its strength in cumulative rainfall metrics (e.g., VR, RB, and SORS). Its consistent ranking in both dry and overall seasons (2nd) highlights its balanced performance across different climate conditions. ClimGridPh-RR displayed solid mid-tier performance across all seasonal and application categories. It ranked 2nd in the wet season and held 3rd place in most other categories, reflecting stable performance across both detection and error-based metrics. Its high POD and CSI scores made it a reliable choice for flood forecasting and seasonal analysis.
In contrast, CHIRPS V2.0 consistently ranked 4th across dry, wet, and overall seasonal evaluations, despite its strengths in high-intensity rainfall metrics (e.g., ARI and MDR). This lower ranking is largely due to its weaker performance in R2, NSE, and MAE, which had higher entropy weights. Nevertheless, CHIRPS showed better rankings in flood (2nd) and sedimentation (2nd) applications, indicating its suitability for high-impact event-based modeling. It remains a versatile SPP for operational hydrology, particularly where rainfall extremes are critical.
In summary, SM2RAIN-ASCAT V2.1.2n is best suited for volume-driven applications such as sedimentation, water balance modeling, and seasonal analysis. APHRODITE V1901 stands out for long-term climatology and wet season performance, while ClimGridPh-RR balances detection and error accuracy, making it ideal for flood and seasonal assessments. CHIRPS V2.0, despite lower seasonal rankings, remains valuable for flood and sediment-related applications, especially where rainfall intensity is the primary concern. This multi-criteria evaluation affirms the need to tailor SPP selection to specific hydrological objectives.

4. Discussion

The full-cycle evaluation in the MRB revealed systematic biases in raw PPs: ERA5 and GSMaP V8 tended to overestimate rainfall, while APHRODITE V1901 and IMERG V07B underestimated wet-season totals. CHIRPS V2.0 and ClimGridPh-RR were closer to seasonal means, and SM2RAIN-ASCAT showed strength in dry-season conditions (Figure 5, Table 4). Overall, ClimGridPh-RR emerged as the most balanced dataset for long-term hydrologic applications.
Bias correction using quantile mapping reduced magnitude errors and improved agreement with rain gauge observations. CHIRPS and SM2RAIN-ASCAT in particular showed significant reductions in bias and error variance, while ClimGridPh-RR further improved intensity and cumulative rainfall estimates (Figure 10 and Figure 12; Table 6). These corrections enhanced the operational value of SPPs for flood, drought, and sediment-related modeling.
Entropy-weighted TOPSIS ranking highlighted the distinct strengths of each product by application. CHIRPS performed best for flood-related analyses due to its strong event detection, SM2RAIN-ASCAT proved reliable for drought monitoring and dry-season flows, and ClimGridPh-RR ranked highest for sediment and long-term water balance studies (Figure 13). Together, these findings demonstrate the importance of linking SPP evaluation to specific hydrological applications, rather than relying solely on general accuracy metrics.
Comparative literature supports these findings. For example, Tran et al. (2023) [21] found CHIRPS optimal in Vietnam’s monsoon regions, while El Khalki et al. (2023) [41] identified PERSIANN-CDR as the most reliable in North Africa. In the Philippines, Veloria et al. (2021) and Aryastana et al. (2022) emphasized that while IMERG performed well in low-elevation zones and during typhoon events, its accuracy diminished in mountainous terrain [12,14]. ClimGridPh-RR’s strong performance aligns with DOST-PAGASA’s internal validations, where it is already used as a bias-corrected reference for national rainfall monitoring. Moreover, similar studies [33,38] have demonstrated the value of quantile mapping in correcting SPPs across tropical basins, reinforcing the transferability of our full-cycle framework. While widely used products like IMERG are often prioritized globally, our results emphasize the importance of region-specific correction and validation. In MRB’s complex terrain and typhoon-prone context, local products like ClimGridPh-RR and corrected CHIRPS outperform even the globally dominant datasets.
Beyond individual product performance, our results also align with broader findings on the limitations of reanalysis datasets in tropical regions. For instance, Buytaert et al. (2010) highlighted that regional climate models such as PRECIS tend to overestimate precipitation along the Andean slopes due to difficulties in capturing extreme orographic gradients [63]. This modeling bias is consistent with the overestimation we observed in reanalysis-driven products like ERA5 during peak rainfall events in the MRB, suggesting a broader challenge in representing precipitation extremes in complex, monsoon-influenced terrains. Similarly, Beck et al. (2019) noted MSWEP’s underrepresentation of extremes in Southeast Asia, which we also confirmed in our sediment and flood-related metrics [64]. These parallels indicate that the issues we identified are not unique to the Philippines but part of a broader pattern in monsoon-driven basins, underscoring the need for targeted corrections to ensure reliability in operational hydrology.
Most importantly, this study adds to the limited body of research that integrates gauge-based validation, bias correction, and multi-criteria decision analysis within the Philippine context. Previous local evaluations [14,15] were primarily focused on raw validation, leaving a gap in understanding how correction and application-specific ranking could improve dataset utility. By demonstrating that products like CHIRPS and ClimGridPh-RR perform best only after correction, our results show that raw comparisons can be misleading for operational decision-making.
Recent advances in artificial intelligence (AI) for precipitation estimation—such as deep learning downscaling and bias correction—show similar challenges in handling extremes, particularly under monsoon regimes [65,66]. Our full-cycle SPP evaluation parallels these AI studies by emphasizing that raw datasets often misrepresent intensity and require systematic correction to improve hydrological usability [67]. Unlike purely AI-based models, however, this study integrates gauge validation, quantile mapping, and multi-criteria analysis, providing a transparent and transferable framework for operational hydrology in data-scarce basins [68,69].
This study highlights the critical need for a context-specific and seasonally informed evaluation of SPPs, particularly in regions with complex tropical hydroclimates like the Magat River Basin. The post-correction analysis revealed that SM2RAIN-ASCAT V2.1.2n and CHIRPS V2.0 were the most adaptable and high-performing products across various hydrological applications. SM2RAIN-ASCAT consistently ranked highest in drought monitoring, water balance assessment, and sedimentation modeling due to its low bias, strong volumetric fidelity, and consistent detection capability. CHIRPS V2.0, on the other hand, excelled in flood modeling and event-based applications, demonstrating strong performance in detection metrics and a high capacity for capturing extreme rainfall events. While ClimGridPh-RR delivered balanced and reliable performance across most scenarios, its moderate sensitivity to extremes placed it slightly behind the top two. APHRODITE V1901 showed commendable accuracy in the dry season but lacked responsiveness to dynamic, high-intensity events, limiting its use to climatological assessments. These findings reinforce that no single SPP is universally optimal; rather, the best choice depends on both seasonal rainfall characteristics and the intended hydrological application. The proposed multi-criteria framework, integrating entropy-weighted metrics with the TOPSIS approach, offers a replicable and robust methodology for evaluating SPPs under local climatic conditions, supporting more informed decision-making for water resource management in the Philippines and similarly complex regions.
Among various MCDA methods, the EWM–TOPSIS approach adopted in this study stands out for its balance of objectivity, interpretability, and adaptability, particularly in hydrological evaluation contexts. While methods like the Analytic Hierarchy Process (AHP) [70,71], Fuzzy Analytic Hierarchy Process (FAHP) [61,72,73] and Simple Additive Weighting (SAW) [74,75] are frequently used in environmental decision-making, but they present key limitations when applied to the ranking of SPPs. AHP, for instance, relies heavily on expert judgment to construct pairwise comparisons and derive criteria weights. While this allows the incorporation of domain knowledge, it introduces subjectivity and inconsistency, especially when many evaluation metrics (like the 14 used here) are involved. AHP becomes increasingly unreliable in high-dimensional metric spaces, often requiring consistency ratio checks and expert consensus rounds impractical in data-driven evaluations [76] like SPP validation.
On the other hand, SAW assumes equal importance for all criteria or uses arbitrary weights, failing to account for each metric’s actual variance or discriminative ability. In contrast, EWM automatically assigns weights based on the entropy of each metric across alternatives, thereby prioritizing indicators that show greater differentiation among SPPs. This is particularly crucial in precipitation validation, where specific metrics like POD or R2 may carry more analytical value than stable indicators like NRDY.
In contrast, TOPSIS offers a direct and geometrically intuitive approach—ranking alternatives based on their closeness to an ideal solution and remoteness from an anti-ideal solution. Its compatibility with benefit and cost metrics, ability to scale across many options, and straightforward interpretability make it suitable for SPP ranking tasks. This is confirmed by previous studies, where EWM–TOPSIS has been successfully used for SPP selection and model comparison [77,78,79]. Compared to other MCDA techniques, the EWM-TOPSIS combines the strengths of data-driven weight assignment and interpretable decision ranking, offering a scientifically rigorous and operationally practical framework for assessing satellite precipitation datasets under multiple criteria and seasonal contexts.
Despite the comprehensive methodology adopted in this study, several limitations must be acknowledged. First, the accuracy of the evaluation and bias correction processes depends on the availability and spatial coverage of ground-based precipitation observations from NIA-MARIIS and PAGASA. While critical, the rain gauge network within the MRB remains spatially uneven, with some sub-catchments underrepresented. This spatial sampling bias may affect the reliability of SPP validation, especially in upland or remote areas, a common issue in tropical basins with limited monitoring infrastructure [1]. Second, using the EWM-TOPSIS as the primary MCDA framework, while objective and robust, introduces limitations in flexibility. EWM-TOPSIS is a static approach that does not incorporate stakeholder preferences, uncertainty quantification, or inter-metric dependencies. However, the practical limitations in the Philippine context—particularly the scarcity of experts familiar with advanced MCDA techniques and the difficulty of convening expert panels for AHP—make objective, automated methods like EWM-TOPSIS more feasible. The data-driven nature of EWM-TOPSIS also reduces subjectivity, ensuring consistency in performance evaluation across multiple parameters and avoiding potential biases introduced through expert judgment. Third, the bias correction technique applied focuses primarily on distributional matching between satellite and ground data. While effectively reducing systematic errors, QM does not address structural errors rooted in sensor limitations or retrieval algorithm assumptions (e.g., missed light rain, overestimated convective storms, or topographic effects). It assumes temporal stationarity in bias, which may not hold under changing land cover or climate regimes [13], potentially limiting its long-term reliability. Fourth, the findings of this study are geographically and climatologically specific to the Magat River Basin, a mountainous watershed with complex terrain and tropical precipitation patterns. Thus, the superior performance of certain SPPs, such as SM2RAIN-ASCAT or CHIRPS, may not directly translate to other hydrological contexts. For example, it is essential to note that while SM2RAIN-ASCAT V2.1.2n demonstrated strong performance in this study, its spatial availability is currently limited. The dataset may not offer full coverage across the entire Philippine archipelago or other tropical basins, which can constrain its broader applicability for regional-scale hydrologic modeling. Users are therefore advised to verify spatial availability and data continuity before operational integration. Lastly, although the evaluation integrated 14 performance metrics and was application-specific, the study did not include actual hydrologic model simulations because of a lack of data. The impact of using these SPPs, both raw and bias-corrected, as inputs to runoff generation, sediment modeling, or reservoir operations was not tested. Therefore, while the ranking results offer strong guidance for data selection, their hydrological implications in model calibration, water balance closure, or sediment yield prediction remain to be validated in future studies.
The novelty of this study lies in its integrated, seasonally stratified, and application-specific evaluation of SPPs tailored to the MRB in the Philippines, a hydrologically complex and infrastructure-critical watershed. Unlike prior studies that rely on limited statistical metrics or single-season assessments, this research implements a comprehensive multi-seasonal (dry, wet, and overall) evaluation across 14 performance indicators, followed by bias correction using quantile mapping and a post-correction reassessment via the EWM–TOPSIS framework. A key advancement is the linkage of specific performance metrics to four distinct hydrologic applications: drought monitoring, flood detection, sediment modeling, and water balance estimation, enabling targeted insights for operational water management. The inclusion of ClimGridPh-RR, a nationally developed, bias-corrected dataset integrating IMERG and PAGASA ground observations, highlights the value of localized SPPs rarely assessed in peer-reviewed literature. Its performance, validated against globally recognized datasets, underscores the importance of context-driven SPP development. To our knowledge, this is the first Philippine-based study to conduct a full-cycle evaluation of nine major SPPs through seasonal, application-oriented, and post-bias-correction ranking using entropy-weighted multi-criteria decision analysis. The results provide a replicable framework for bridging the gap between satellite rainfall data and its operational use in hydrologic modeling. It is particularly relevant for flood-prone and topographically diverse regions across Southeast Asia.

5. Conclusions

This study presents a full-cycle, application-oriented evaluation of nine (9) Multi-source PPs over the MRB, integrating statistical validation, quantile mapping-based bias correction, and MCDA using the Entropy Weight Method and TOPSIS. Going beyond conventional approaches, the framework incorporates seasonal stratification (dry, wet, and annual). It aligns performance metrics with four critical hydrological applications: drought monitoring, flood forecasting, sediment yield estimation, and water balance modeling.
The intercomparison of raw SPPs revealed substantial variability in temporal correlation, volume accuracy, and event detection skill. ERA5 and GSMaP V8 frequently overestimated peak rainfall, while APHRODITE and IMERG underestimated events, particularly during the wet season. CHIRPS V2.0 and ClimGridPh-RR showed the best alignment with observed seasonal means, though magnitude and intensity biases remained. Following bias correction, performance improvements were observed across all SPPs—most notably for CHIRPS V2.0 and SM2RAIN-ASCAT V2.1.2n, which exhibited significant reductions in RMSE, RB, and SORS, alongside gains in R2 and NSE. ClimGridPh-RR, already bias-adjusted, demonstrated further improvements in volume representation and erosive metrics (e.g., ARI, NHRD), reinforcing its suitability for sediment and flood modeling. While APHRODITE V1901 improved in bias and detection skill, it remained limited in representing dynamic and extreme rainfall events.
Entropy-weighted TOPSIS rankings identified SM2RAIN-ASCAT V2.1.2n as the most robust SPP across applications, especially in flood simulation, water balance, and sedimentation. CHIRPS V2.0 excelled in capturing high-intensity, event-based extremes, while APHRODITE V1901 showed strengths in long-term and seasonal drought monitoring. The inclusion of “Overall (Raw)” entropy weights preserved the influence of detection-related metrics (e.g., POD, CSI, NRDY), ensuring that improvements in post-correction scores did not mask critical differences in raw product skill. Ultimately, no single SPP outperformed across all metrics and applications—highlighting the need for application- and season-specific selection. The integrated approach of bias correction and MCDA offers a transparent, objective, and reproducible framework for SPP evaluation, particularly valuable in data-scarce, complex basins.
The findings directly support operational hydrology, early warning systems, and climate resilience planning in the Philippines. Agencies such as PAGASA, NIA, and local government units (LGUs) can adopt this framework to optimize flood forecasting, reservoir operations, drought monitoring, and sediment risk management. Future work should incorporate hydrological modeling using corrected SPPs and explore the integration of high-resolution radar or sensor-based datasets to enhance the monitoring of rainfall dynamics in complex tropical catchments like the MRB.

Author Contributions

Conceptualization, J.G.G., S.A.K. and B.Q.N.; methodology, J.G.G. and B.Q.N.; software, J.G.G.; validation, J.G.G. and B.Q.N.; formal analysis, J.G.G.; investigation, J.G.G.; resources, S.A.K.; data curation, J.G.G.; writing—original draft preparation, J.G.G.; writing—review and editing, S.A.K. and B.Q.N.; visualization, B.Q.N.; supervision, S.A.K.; project administration, S.A.K.; funding acquisition, S.A.K. and B.Q.N. All authors have read and agreed to the published version of the manuscript.

Funding

This research received no external funding.

Data Availability Statement

This study did not generate new datasets. All analyses are based on publicly available satellite and reanalysis precipitation products, which can be accessed through their respective data repositories as cited in the references. Ground-based rainfall data from NIA-MARIIS were used under institutional collaboration and are not publicly archived due to operational use restrictions.

Acknowledgments

This work was supported by the Japan Science and Technology Agency (JST) under the NEXUS Program, Grant Number JPMJNX24A2. The views expressed are solely those of the authors and do not necessarily reflect those of the funding agencies. Binh Quang Nguyen further acknowledges support from the Japan Society for the Promotion of Science (JSPS) Postdoctoral Fellowships Program, Fellowship ID: P24064. The authors declare that generative artificial intelligence (ChatGPT 5, OpenAI) was used solely to improve the readability and language clarity of this manuscript. The content, analyses, interpretations, and conclusions are entirely the authors’ own, and the role of the AI tool was strictly limited to linguistic enhancement.

Conflicts of Interest

The authors declare no conflicts of interest.

Abbreviations

The following abbreviations are used in this manuscript:
SPPSatellite Precipitation Product
PPPrecipitation Products
IMERGIntegrated Multi-satellitE Retrievals for GPM
CHIRPSClimate Hazards Group InfraRed Precipitation with Station Data
ClimGridPh-RRClimate Grid Philippines Reanalysis, daily gridded rainfall dataset for the Philippines
APHRODITEAsian Precipitation–Highly Resolved Observational Data Integration Towards Evaluation
ERA5ECMWF Reanalysis v5
MSWEPMulti-Source Weighted Ensemble Precipitation
SM2RAIN-ASCATSoil Moisture to Rain–Advanced Scatterometer
GSMaPGlobal Satellite Mapping of Precipitation
PERSIANN-CDRPrecipitation Estimation from Remotely Sensed Information using Artificial Neural Networks–Climate Data Record
MRBMagat River Basin
CRBCagayan River Basin
NIA-MARIISNational Irrigation Administration–Magat River Integrated Irrigation System
PAGASAPhilippine Atmospheric, Geophysical and Astronomical Services Administration
QMQuantile Mapping
MCDAMulti-Criteria Decision Analysis
NSENash-Sutcliffe Efficiency
RMSERoot Mean Square Error
MAEMean Absolute Error
R2Correlation Coefficient
RBRelative Bias
VRVolume Ratio
SORSSum of Residuals
PODProbability of Detection
FARFalse Alarm Ratio
CSICritical Success Index
ARIAverage Rainfall Intensity
NRDYNumber of Rainy Days in a Year
NHRDNumber of Heavy Rain Days
MDRMaximum Daily Rainfall
EWMEntropy Weight Method
TOPSISTechnique for Order of Preference by Similarity to Ideal Solution
LGULocal Government Unit
LOCILocal Intensity Scaling
maslMeters Above Sea Level
ECMWFEuropean Centre for Medium-Range Weather Forecasts

References

  1. Maggioni, V.; Meyers, P.C.; Robinson, M.D. A Review of Merged High-Resolution Satellite Precipitation Product Accuracy during the Tropical Rainfall Measuring Mission (TRMM) Era. J. Hydrometeorol. 2016, 17, 1101–1117. [Google Scholar] [CrossRef]
  2. He, R.; Li, H.; Luo, J.; Huang, H.; Zhu, Y. Comparison of the Reflectivities from Precipitation Measurement Radar Onboard the FY-3G Satellite and Ground-Based S-Band Dual-Polarization Radars. Remote Sens. 2025, 17, 1117. [Google Scholar] [CrossRef]
  3. Benkirane, M.; Amazirh, A.; Laftouhi, N.E.; Khabba, S.; Chehbouni, A. Assessment of GPM Satellite Precipitation Performance after Bias Correction, for Hydrological Modeling in a Semi-Arid Watershed (High Atlas Mountain, Morocco). Atmosphere 2023, 14, 794. [Google Scholar] [CrossRef]
  4. Vázquez-Rodríguez, D.A.; Guerra-Cobián, V.H.; Bruster-Flores, J.L.; Fonseca, C.R.; Yépez-Rincón, F.D. Evaluating the Performance and Applicability of Satellite Precipitation Products over the Rio Grande–San Juan Basin in Northeast Mexico. Atmosphere 2024, 15, 749. [Google Scholar] [CrossRef]
  5. Andari, R.; Nurhamidah, N.; Daoed, D. Marzuki Evaluation of Bias Correction Methods for Multi-Satellite Rainfall Estimation Products. IOP Conf. Ser. Earth Environ. Sci. 2024, 1317, 012008. [Google Scholar] [CrossRef]
  6. Maidment, R.I.; Grimes, D.; Black, E.; Tarnavsky, E.; Young, M.; Greatrex, H.; Allan, R.P.; Stein, T.; Nkonde, E.; Senkunda, S.; et al. A New, Long-Term Daily Satellite-Based Rainfall Dataset for Operational Monitoring in Africa. Sci. Data 2017, 4, 170063. [Google Scholar] [CrossRef]
  7. Kabite Wedajo, G.; Kebede Muleta, M.; Gessesse Awoke, B. Performance Evaluation of Multiple Satellite Rainfall Products for Dhidhessa River Basin (DRB), Ethiopia. Atmos. Meas. Tech. 2021, 14, 2299–2316. [Google Scholar] [CrossRef]
  8. Nair, S.; Srinivasan, G.; Nemani, R. Evaluation of Multi-Satellite TRMM Derived Rainfall Estimates over a Western State of India. J. Meteorol. Soc. Jpn. 2009, 87, 927–939. [Google Scholar] [CrossRef]
  9. Ramos, M.D.; Tendencia, E.; Espana, K.; Sabido, J.; Bagtasa, G. Assessment of Satellite Precipitation Products in the Philippine Archipelago. In Proceedings of the The International Archives of the Photogrammetry, Remote Sensing and Spatial Information Sciences, 2016 XXIII ISPRS Congress, Prague, Czech Republic, 12–19 July 2016; Volume XLI-B1, pp. 423–427. [Google Scholar] [CrossRef]
  10. de Moraes Cordeiro, A.L.; Blanco, C.J.C. Assessment of Satellite Products for Filling Rainfall Data Gaps in the Amazon Region. Nat. Resour. Model. 2021, 34, e12298. [Google Scholar] [CrossRef]
  11. Gado, T.A.; Zamzam, D.H.; Guo, Y.; Zeidan, B.A. Evaluation of Satellite-Based Rainfall Estimates in the Upper Blue Nile Basin. J. Earth Syst. Sci. 2024, 133, 27. [Google Scholar] [CrossRef]
  12. Aryastana, P.; Liu, C.Y.; Jong-Dao Jou, B.; Cayanan, E.; Punay, J.P.; Chen, Y.N. Assessment of Satellite Precipitation Data Sets for High Variability and Rapid Evolution of Typhoon Precipitation Events in the Philippines. Earth Space Sci. 2022, 9, e2022EA002382. [Google Scholar] [CrossRef]
  13. Sun, M.; Liu, A.; Zhao, L.; Wang, C.; Yang, Y. Evaluation of Multi-Source Precipitation Products in the Hinterland of the Tibetan Plateau. Atmosphere 2024, 15, 138. [Google Scholar] [CrossRef]
  14. Veloria, A.; Perez, G.J.; Tapang, G.; Comiso, J. Improved Rainfall Data in the Philippines through Concurrent Use of GPM IMERG and Ground-Based Measurements. Remote Sens. 2021, 13, 2859. [Google Scholar] [CrossRef]
  15. DOST-PAGASA. Combined In Situ and Satellite-Based Daily Rainfall Data of the Philippines in High-Resolution Grids; DOST-PAGASA: Quezon City, Philippines, 2024. [Google Scholar]
  16. Putra, M.; Rosid, M.S.; Handoko, D. A Review of Rainfall Estimation in Indonesia: Data Sources, Techniques, and Methods. Signals 2024, 5, 542–561. [Google Scholar] [CrossRef]
  17. Khan, F.S.; Hasany, N.; Abid, S.K.; Khurram, M.; Gacu, J.; Monjardin, C.E.; de Jesus, K.L. Machine Learning-Assisted Denoising of Raman Spectral Remote Sensing Data for Improved Land Use Mapping. Rev. Int. Géomat. 2025, 34, 415–432. [Google Scholar] [CrossRef]
  18. Perera, H.; Fernando, S.; Gunathilake, M.B.; Sirisena, T.A.J.G.; Rathnayake, U. Evaluation of Satellite Rainfall Products over the Mahaweli River Basin in Sri Lanka. Adv. Meteorol. 2022, 2022, 1926854. [Google Scholar] [CrossRef]
  19. Causse, A.; Planche, C.; Buisson, E.; Baray, J.L. Evaluation of Rain Estimates from Several Ground-Based Radar Networks and Satellite Products for Two Cases Observed over France in 2022. Atmosphere 2023, 14, 1726. [Google Scholar] [CrossRef]
  20. Chen, H.; Wen, D.; Du, Y.; Xiong, L.; Wang, L. Errors of Five Satellite Precipitation Products for Different Rainfall Intensities. Atmos. Res. 2023, 285, 106622. [Google Scholar] [CrossRef]
  21. Tran, T.N.D.; Le, M.H.; Zhang, R.; Nguyen, B.Q.; Bolten, J.D.; Lakshmi, V. Robustness of Gridded Precipitation Products for Vietnam Basins Using the Comprehensive Assessment Framework of Rainfall. Atmos. Res. 2023, 293, 106923. [Google Scholar] [CrossRef]
  22. Shalishe, A.; Berihu, T.; Arba, Y. Performance Evaluation of Multi-Satellite Rainfall Products for Analyzing Rainfall Variability in Abaya–Chamo Basin: Southern Ethiopia. J. Earth Syst. Sci. 2024, 133, 139. [Google Scholar] [CrossRef]
  23. Araujo Palharini, R.S.; Vila, D.A.; Rodrigues, D.T.; Palharini, R.C.; Mattos, E.V.; Pedra, G.U. Assessment of Extreme Rainfall Estimates from Satellite-Based: Regional Analysis. Remote Sens. Appl. Soc. Environ. 2021, 23, 100603. [Google Scholar] [CrossRef]
  24. Gowri, L.; Manjula, K.R.; Sasireka, K.; Deepa, D. Assessment of Statistical Models for Rainfall Forecasting Using Machine Learning Technique. J. Soft Comput. Civ. Eng. 2022, 6, 51–67. [Google Scholar] [CrossRef]
  25. Datti, A.D.; Zeng, G.; Tarnavsky, E.; Cornforth, R.; Pappenberger, F.; Abdullahi, B.A.; Onyejuruwa, A. Urban Peri-Urban Planning Impact. Remote Sens. 2024, 16, 1755. [Google Scholar] [CrossRef]
  26. Mashuri; Karlina; Sujono, J. Assessment of Satellite-Based Rainfall Products for Drought Monitoring in the Siak Watershed, Indonesia. Environ. Chall. 2025, 19, 101134. [Google Scholar] [CrossRef]
  27. da Silva Hucke, A.T.; Menegaz, M.N.; Isidoro, J.M.G.P.; de Oliveira Tiezzi, R. Assessment of Climate Change Impacts on Rainfall and Streamflow in the Alto Paranapanema Basin, Brazil. J. Water Clim. Change 2024, 15, 2110–2126. [Google Scholar] [CrossRef]
  28. Wodebo, D.Y.; Melesse, A.M.; Woldesenbet, T.A.; Mekonnen, K.; Amdihun, A.; Korecha, D.; Tedla, H.Z.; Corzo, G.; Teshome, A. Comprehensive Performance Evaluation of Satellite-Based and Reanalysis Rainfall Estimate Products in Ethiopia: For Drought, Flood, and Water Resources Applications. J. Hydrol. Reg. Stud. 2025, 57, 102150. [Google Scholar] [CrossRef]
  29. Omar, G.M.; Paturel, J.E.; Salles, C.; Mahé, G.; Jalludin, M.; Satgé, F.; Nour, M.I. Evaluation of Rainfall Products in Semi-Arid Areas: Application to the Southeast of the Republic of Djibouti and a Focus on the Ambouli Catchment. Water 2023, 15, 2168. [Google Scholar] [CrossRef]
  30. Nkunzimana, A.; Bi, S.; Alriah, M.A.A.; Zhi, T.; Kur, N.A.D. Comparative Analysis of the Performance of Satellite-Based Rainfall Products Over Various Topographical Unities in Central East Africa: Case of Burundi. Earth Space Sci. 2020, 7, e2019EA000834. [Google Scholar] [CrossRef]
  31. Dandridge, C.; Lakshmi, V.; Bolten, J.; Srinivasan, R. Evaluation of Satellite-Based Rainfall Estimates in the Lower Mekong River Basin (Southeast Asia). Remote Sens. 2019, 11, 2709. [Google Scholar] [CrossRef]
  32. Gebremicael, T.G.; Deitch, M.J.; Gancel, H.N.; Croteau, A.C.; Haile, G.G.; Beyene, A.N.; Kumar, L. Satellite-Based Rainfall Estimates Evaluation Using a Parsimonious Hydrological Model in the Complex Climate and Topography of the Nile River Catchments. Atmos. Res. 2022, 266, 105939. [Google Scholar] [CrossRef]
  33. Bonilla-López, E.; Lobato-Sánchez, R.; Medellin-Azuara, J.; Patiño-Gómez, C. Satellite Precipitation Assessment and Correction Technique Selection at Sub-Basin Scale for Maximum Annual Events. Case Study: Acaponeta River Basin. Atmósfera 2025, 75, 49–75. [Google Scholar] [CrossRef]
  34. Tan, M.L.; Ibrahim, A.L.; Duan, Z.; Cracknell, A.P.; Chaplot, V. Evaluation of Six High-Resolution Satellite and Ground-Based Precipitation Products over Malaysia. Remote Sens. 2015, 7, 1504–1528. [Google Scholar] [CrossRef]
  35. Kubota, T.; Ushio, T.; Shige, S.; Kida, S.; Kachi, M.; Okamoto, K. Verification of High-Resolution Satellite-Based Rainfall Estimates around Japan Using a Gauge-Calibrated Ground-Radar Dataset. J. Meteorol. Soc. Jpn. 2009, 87A, 203–222. [Google Scholar] [CrossRef]
  36. Jiang, Q.; Li, W.; Wen, J.; Fan, Z.; Chen, Y.; Scaioni, M.; Wang, J. Evaluation of Satellite-Based Products for Extreme Rainfall Estimations in the Eastern Coastal Areas of China. J. Integr. Environ. Sci. 2019, 16, 191–207. [Google Scholar] [CrossRef]
  37. Wei, Y. The Assessment of the Accuracy of Meteorological Satellite Rainfall Measurement Products in the Heihe River Basin. IOP Conf. Ser. Mater. Sci. Eng. 2018, 392, 062146. [Google Scholar] [CrossRef]
  38. Ceferino-Hernández, L.; Magaña-Hernández, F.; Campos-Campos, E.; Morosanu, G.A.; Torres-Aguilar, C.E.; Mora-Ortiz, R.S.; Díaz, S.A. Assessment of PERSIANN Satellite Products over the Tulijá River Basin, Mexico. Remote Sens. 2024, 16, 2596. [Google Scholar] [CrossRef]
  39. Bakary, F.; Abdou, A.; Honoré, D.; Ansoumana, B.; Salif, D.; Luc, D.; Bakary, F.; Abdou, A.; Honoré, D.; Ansoumana, B.; et al. Assessment of Satellite Rainfall Products for Stream Flow Simulation in Gambia Watershed. Afr. J. Environ. Sci. Technol. 2018, 12, 501–513. [Google Scholar] [CrossRef]
  40. Chen, H.; Yong, B.; Qi, W.; Wu, H.; Ren, L.; Hong, Y. Investigating the Evaluation Uncertainty for Satellite Precipitation Estimates Based on Two Different Ground Precipitation Observation Products. J. Hydrometeorol. 2020, 21, 2595–2606. [Google Scholar] [CrossRef]
  41. El Khalki, E.M.; Tramblay, Y.; Saidi, M.E.; Marchane, A.; Chehbouni, A. Hydrological Assessment of Different Satellite Precipitation Products in Semi-Arid Basins in Morocco. Front. Water 2023, 5, 1243251. [Google Scholar] [CrossRef]
  42. Hinge, G.; Hamouda, M.A.; Long, D.; Mohamed, M.M. Hydrologic Utility of Satellite Precipitation Products in Flood Prediction: A Meta-Data Analysis and Lessons Learnt. J. Hydrol. 2022, 612, 128103. [Google Scholar] [CrossRef]
  43. Hartmann, H. Comparison of Precipitation Rates from Global Datasets for the Five-Year Period from 2019 to 2023. Hydrology 2025, 12, 4. [Google Scholar] [CrossRef]
  44. Gacu, J.G.; Monjardin, C.E.F.; Mangulabnan, R.G.T.; Mendez, J.C.F. Application of Artificial Intelligence in Hydrological Modeling for Streamflow Prediction in Ungauged Watersheds: A Review. Water 2025, 5, 2722. [Google Scholar] [CrossRef]
  45. Pradhan, R.; Byrd, A.; Jourdan, M.R. Development of Predictive Relationships for Flood Hazard Assessments in Ungaged Basins; US Army Corps of Enginneers: Falls of Rough, KY, USA, 2016. [Google Scholar]
  46. Barraza, R.L.; Teresa, M.; Herrera, A.; Elizabeth, A.; Celestino, M.; Daniel, A.; Jáquez, B.; Armando, D.; Cruz, M. Evaluation of the Extreme Precipitation and Runoff Flow Characteristics in a Semiarid Sub-Basin Based on Three Satellite Precipitation Products. Hydrology 2025, 12, 89. [Google Scholar] [CrossRef]
  47. Felipe, A.J.B.; Alejo, L.A.; Balderama, O.F.; Rosete, E.A. Climate Change Intensifies the Drought Vulnerability of River Basins: A Case of the Magat River Basin. J. Water Clim. Change 2023, 14, 1012–1038. [Google Scholar] [CrossRef]
  48. Singson, C.L.; Alejo, L.A.; Balderama, O.F.; Bareng, J.L.R.; Kantoush, S.A. Modeling Climate Change Impact on the Inflow of the Magat Reservoir Using the Soil and Water Assessment Tool (SWAT) Model for Dam Management. J. Water Clim. Change 2023, 14, 633–650. [Google Scholar] [CrossRef]
  49. Gacu, J.G.; Kantoush, S.A.; Quang, B. Challenges and Approaches in Sediment Management in the Philippines: A Review of Current Research, Practices, and Proposed Countermeasures. Nat. Hazards 2025, 1–37. [Google Scholar] [CrossRef]
  50. Yatagai, A.; Kamiguchi, K.; Arakawa, O.; Hamada, A.; Yasutomi, N.; Kitoh, A. Aphrodite Constructing a Long-Term Daily Gridded Precipitation Dataset for Asia Based on a Dense Network of Rain Gauges. Bull. Am. Meteorol. Soc. 2012, 93, 1401–1415. [Google Scholar] [CrossRef]
  51. Hersbach, H.; Bell, B.; Berrisford, P.; Hirahara, S.; Horányi, A.; Muñoz-Sabater, J.; Nicolas, J.; Peubey, C.; Radu, R.; Schepers, D.; et al. The ERA5 Global Reanalysis. Q. J. R. Meteorol. Soc. 2020, 146, 1999–2049. [Google Scholar] [CrossRef]
  52. Beck, H.E.; Wood, E.F.; Pan, M.; Fisher, C.K.; Miralles, D.G.; Van Dijk, A.I.J.M.; McVicar, T.R.; Adler, R.F. MSWep v2 Global 3-Hourly 0.1° Precipitation: Methodology and Quantitative Assessment. Bull. Am. Meteorol. Soc. 2019, 100, 473–500. [Google Scholar] [CrossRef]
  53. Brocca, L.; Filippucci, P.; Hahn, S.; Ciabatta, L.; Massari, C.; Camici, S.; Schüller, L.; Bojkov, B.; Wagner, W. SM2RAIN-ASCAT (2007-2018): Global Daily Satellite Rainfall Data from ASCAT Soil Moisture Observations. Earth Syst. Sci. Data 2019, 11, 1583–1601. [Google Scholar] [CrossRef]
  54. Kubota, T.; Hashizume, H.; Shige, S.; Okamoto, K.; Aonashi, K.; Takahashi, N.; Ushio, T.; Kachi, M. Global Precipitation Map Using Satelliteborne Microwave Radiometers by the GSMaP Project: Production and Validation. Int. Geosci. Remote Sens. Symp. 2006, 45, 2584–2587. [Google Scholar] [CrossRef]
  55. Ashouri, H.; Hsu, K.L.; Sorooshian, S.; Braithwaite, D.K.; Knapp, K.R.; Cecil, L.D.; Nelson, B.R.; Prat, O.P. PERSIANN-CDR: Daily Precipitation Climate Data Record from Multisatellite Observations for Hydrological and Climate Studies. Bull. Am. Meteorol. Soc. 2015, 96, 69–83. [Google Scholar] [CrossRef]
  56. Funk, C.; Peterson, P.; Landsfeld, M.; Pedreros, D.; Verdin, J.; Shukla, S.; Husak, G.; Rowland, J.; Harrison, L.; Hoell, A.; et al. The Climate Hazards Infrared Precipitation with Stations—A New Environmental Record for Monitoring Extremes. Sci. Data 2015, 2, 150066. [Google Scholar] [CrossRef]
  57. Hou, A.Y.; Kakar, R.K.; Neeck, S.; Azarbarzin, A.A.; Kummerow, C.D.; Kojima, M.; Oki, R.; Nakamura, K.; Iguchi, T. The Global Precipitation Measurement Mission. Bull. Am. Meteorol. Soc. 2014, 95, 701–722. [Google Scholar] [CrossRef]
  58. Li, X.; Ye, X.; Xu, C. Assessment of Satellite-Based Precipitation Products for Estimating and Mapping Rainfall Erosivity in a Subtropical Basin, China. Remote Sens. 2022, 14, 4292. [Google Scholar] [CrossRef]
  59. Gebretsadkan, K.N.; Tamrie, M.B.; Desta, H.B. Performance Evaluation of Multi-Satellite Rainfall Products in the Gidabo Catchment, Rift Valley Basin, Ethiopia. J. Water Clim. Change 2023, 14, 3950–3966. [Google Scholar] [CrossRef]
  60. Ji, J.; Wang, D. Evaluation Analysis and Strategy Selection in Urban Flood Resilience Based on EWM-TOPSIS Method and Graph Model. J. Clean. Prod. 2023, 425, 138955. [Google Scholar] [CrossRef]
  61. Sun, N.; Li, C.; Guo, B.; Sun, X.; Yao, Y.; Wang, Y. Urban Flooding Risk Assessment Based on FAHP–EWM Combination Weighting: A Case Study of Beijing. Geomat. Nat. Hazards Risk 2023, 14, 2240943. [Google Scholar] [CrossRef]
  62. DOST-PAGASA. Climate of the Philippines. Available online: https://www.pagasa.dost.gov.ph/climate/climatological-normals (accessed on 10 September 2022).
  63. Buytaert, W.; Vuille, M.; Dewulf, A.; Urrutia, R.; Karmalkar, A.; Célleri, R. Uncertainties in Climate Change Projections and Regional Downscaling in the Tropical Andes: Implications for Water Resources Management. Hydrol. Earth Syst. Sci. 2010, 14, 1247–1258. [Google Scholar] [CrossRef]
  64. Beck, H.E.; Van Dijk, A.I.J.M.; De Roo, A.; Dutra, E.; Fink, G.; Orth, R.; Schellekens, J. Global Evaluation of Runoff from 10 State-of-the-Art Hydrological Models. Hydrol. Earth Syst. Sci. 2017, 21, 2881–2903. [Google Scholar] [CrossRef]
  65. Huong, O.S.; Le, X.-H.; Van, L.N.; Lee, G.; Sok, T. Convolutional Neural Networks-Driven Bias Correction of Satellite Precipitation Improves Rainfall-Runoff-Inundation Modeling. Int. Soil Water Conserv. Res. 2025, 113260. [Google Scholar] [CrossRef]
  66. Ma, G.; Huang, J.; Zhang, Y.; Zhu, L.; Lim Kam Sian, K.T.C.; Feng, Y.; Yu, T. A Deep Learning-Based Algorithm for Identifying Precipitation Clouds Using Fengyun-4A Satellite Observation Data. Sensors 2023, 23, 6832. [Google Scholar] [CrossRef]
  67. Wang, D.; Yu, C.; Yi, L.; Jiang, G.; Zhang, H. Performance Validation and Bias Correction of IMERG Precipitation Data Under Foggy Meteorological Conditions in Southeast Asia. Atmos. Res. 2026, 327, 108375. [Google Scholar] [CrossRef]
  68. Ande, R.; Pandugula, C.; Mehta, D.; Vankayalapati, R.; Birbal, P.; Verma, S.; Azamathulla, H.M.; Nanavati, N. Understanding Climate Change Impacts on Streamflow by Using Machine Learning: Case Study of Godavari Basin. Water 2025, 17, 1171. [Google Scholar] [CrossRef]
  69. Gacu, J.G.; Monjardin, C.E.F.; Mangulabnan, R.G.T.; Pugat, G.C.E.; Solmerin, J.G. Artificial Intelligence (AI) in Surface Water Management: A Comprehensive Review of Methods, Applications, and Challenges. Water 2025, 17, 1707. [Google Scholar] [CrossRef]
  70. Gacu, J.G.; Monjardin, C.E.F.; de Jesus, K.L.M.; Senoro, D.B. GIS-Based Risk Assessment of Structure Attributes in Flood Zones of Odiongan, Romblon, Philippines. Buildings 2023, 13, 506. [Google Scholar] [CrossRef]
  71. Gacu, J.G.; Monjardin, C.E.F.; Senoro, D.B.; Tan, F.J. Flood Risk Assessment Using GIS-Based Analytical Hierarchy Process in the Municipality of Odiongan, Romblon, Philippines. Appl. Sci. 2022, 12, 9456. [Google Scholar] [CrossRef]
  72. Gacul, L.-A.; Ferrancullo, D.; Gallano, R.; Fadriquela, K.J.; Mendez, K.J.; Morada, J.R.; Morgado, J.K.; Gacu, J. GIS-Based Identification of Flood Risk Zone in a Rural Municipality Using Fuzzy Analytical Hierarchy Process (FAHP). Rev. Int. Géomat. 2024, 33, 295–320. [Google Scholar] [CrossRef]
  73. Mokhtari, E.; Abdelkebir, B.; Djenaoui, A.; Hamdani, N.E.H. Integrated Analytic Hierarchy Process and Fuzzy Analytic Hierarchy Process for Sahel Watershed Flood Susceptibility Assessment, Algeria. Water Pract. Technol. 2024, 19, 453–475. [Google Scholar] [CrossRef]
  74. Tupenaite, L.; Zilenaite, V.; Kanapeckiene, L.; Gecys, T.; Geipele, I. Sustainability Assessment of Modern High-Rise Timber Buildings. Sustainability 2021, 13, 8719. [Google Scholar] [CrossRef]
  75. Trojanowska, M.; Nęcka, K. Selection of the Multiple-Criiater Decision-Making Method for Evaluation of Sustainable Energy Development: A Case Study of Poland. Energies 2020, 13, 6321. [Google Scholar] [CrossRef]
  76. Gacu, J.; Venus, J.A.; Forio, C.F.; Banay, L.; Soledad, E.; Famini, A.; Fajiculay, A.R.; Sim, A.A.; Rufon, J. Development of a Comprehensive Ground Suitability Index for Building Construction: A Case Study. Rev. Int. Geomat. 2025, 34, 235–257. [Google Scholar] [CrossRef]
  77. Li, P.L.; Chen, C.J.; Lin, L.F. Hydrometeorological Assessment of Satellite and Model Precipitation Products over Taiwan. J. Hydrometeorol. 2021, 22, 2897–2915. [Google Scholar] [CrossRef]
  78. Sward, J.A.; Nilson, R.S.; Katkar, V.V.; Stedman, R.C.; Kay, D.L.; Ifft, J.E.; Zhang, K.M. Integrating Social Considerations in Multicriteria Decision Analysis for Utility-Scale Solar Photovoltaic Siting. Appl. Energy 2021, 288, 116543. [Google Scholar] [CrossRef]
  79. Wang, W.; Straffelini, E.; Pijl, A.; Tarolli, P. Sustainable Water Resource Management in Steep-Slope Agriculture. Geogr. Sustain. 2022, 3, 214–219. [Google Scholar] [CrossRef]
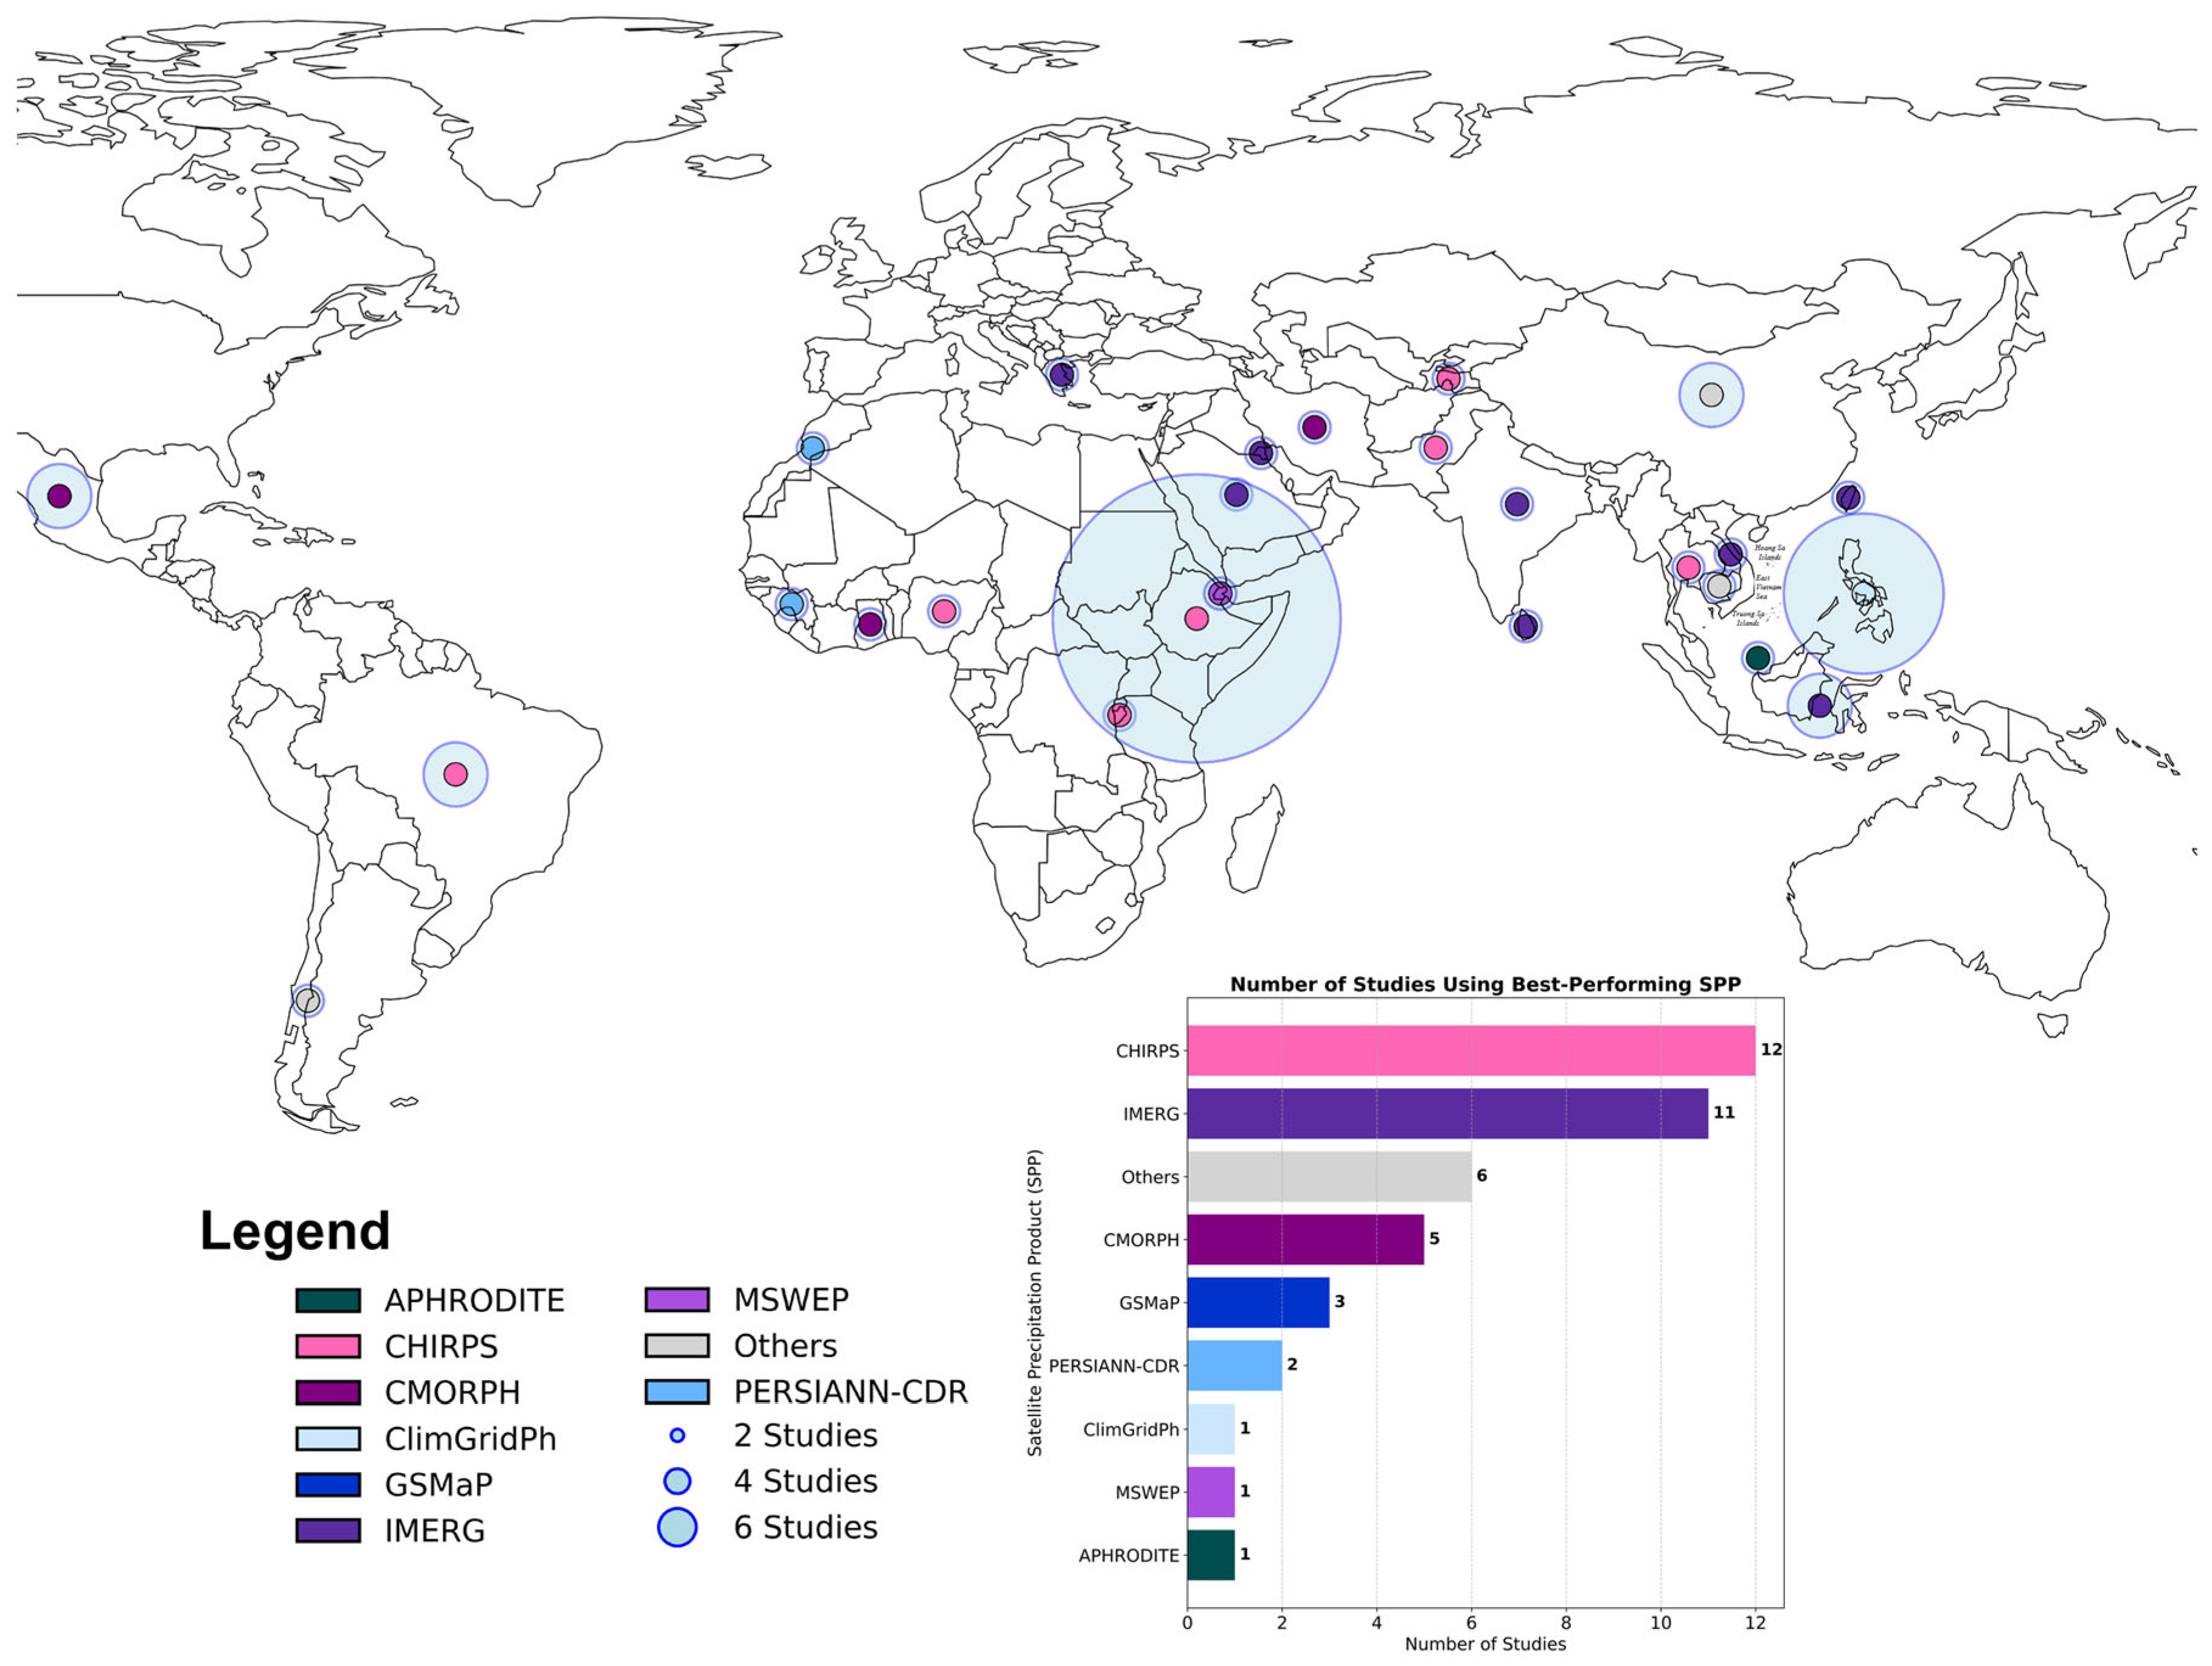
Figure 1. Global distribution of SPP evaluation studies and best-performing products identified across different regions. IMERG and CHIRPS emerge as the most frequently validated and recommended datasets, particularly in data-scarce regions such as East Africa, Southeast Asia, and the Philippines.
Remotesensing 17 03375 g001
Figure 2. Framework for evaluating and selecting the best precipitation products using statistical accuracy, detection skill, bias, and volume metrics, and erosive rainfall characteristics, combined with quantile mapping and MCDA for seasonal and application-based ranking.
Remotesensing 17 03375 g002
Figure 3. Location of the MRB, northern Luzon, Philippines, showing topography, sub-basins, reservoir, and rain gauge stations. The inset maps illustrate its geographic context and seasonal tropical cyclone tracks (1948–2015), highlighting peak typhoon activity from May to October.
Remotesensing 17 03375 g003
Figure 4. Spatial distribution of average annual rainfall (AMR) in the Magat River Basin from nine precipitation products: (a) GSMaP V8, (b) SM2RAIN-ASCAT V2.1.2n, (c) ERA5, (d) ClimGridPh-RR, (e) MSWEP V2.2, (f) CHIRPS V2.0, (g) APHRODITE V1901, (h) PERSIANN-CDR V1.0, and (i) IMERG V07B. Sub-basin AMR values (S1–S7) are shown in mm, with basin-wide averages ranked in the inset.
Remotesensing 17 03375 g004
Figure 5. Observed and satellite-derived precipitation in the Magat River Basin (2000–2024): (a) daily time series, (b) dry season, (c) wet season, and (d) overall averages, with corresponding R2 values summarized in the table.
Remotesensing 17 03375 g005
Figure 6. Seasonal comparison of SPPs in the Magat River Basin using VR and SORS for dry, wet, and overall seasons. The dashed line shows the ideal VR (1.0), and vertical blue lines mark observed rainfall sums.
Remotesensing 17 03375 g006
Figure 7. Seasonal comparison of maximum daily rainfall (MDR, bars) and average rainfall intensity (ARI, line) for each SPP in the Magat River Basin. Observed benchmarks are shown as horizontal lines.
Remotesensing 17 03375 g007
Figure 8. Bubble plot showing the number of precipitation days (≥0.1 mm) by intensity category—Low (LRD), Moderate (MRD), and Heavy (HRD)—across dry, wet, and overall seasons for each SPP, with bubble size and color indicating precipitation frequency.
Remotesensing 17 03375 g008
Figure 9. Lollipop charts show the fixed-order rankings of SPPs for the dry season, wet season, and overall performance. Rankings are based on multi-criteria decision analysis, with lower values indicating better performance.
Remotesensing 17 03375 g009
Figure 10. Normalized performance changes (Corrected–Original) for APHRODITE V1901, SM2RAIN-ASCAT V2.1.2n, CHIRPS V2.0, and ClimGridPh-RR across dry, wet, and overall seasons. Positive values indicate improvement after bias correction, with normalization applied for comparability across metrics.
Remotesensing 17 03375 g010
Figure 11. Seasonal rainfall distribution (mm) across sub-basins (S1–S7) in the MRB from the top four SPPs (APHRODITE V1901, CHIRPS V2.0, SM2RAIN-ASCAT V2.1.2n, ClimGridPh-RR). Upper rows show raw values, lower rows show bias-corrected values, for dry, wet, and overall seasons.
Remotesensing 17 03375 g011
Figure 12. Scatter plots of observed vs. raw (left) and bias-corrected (right) daily rainfall for the MRB across dry, wet, and overall seasons. Rows show the top four SPPs, with the red 1:1 line indicating perfect agreement. Post-correction results demonstrate closer alignment with observations.
Remotesensing 17 03375 g012
Figure 13. Heatmap of SPP rankings across seasonal (dry, wet, overall) and application-specific (drought, flood, water balance, sedimentation) evaluations after bias correction. Lower ranks (lighter colors) indicate better performance.
Remotesensing 17 03375 g013
Table 1. Description of the SPPs used in this study, including their temporal coverage, spatial–temporal resolution, spatial extent, data latency, category, and primary references.
SPPTemporal
Coverage
Resolution (Spatial and Temporal)Spatial
Coverage
LatencyCategoryReferences
APHRODITE V19011951–2025
(2000–2015 used)
0.25°/Daily60°N–60°SN/A
(Historical)
Gauge-based[50]
ERA52000–20240.1°/HourlyGlobal~5 daysReanalysis[51]
MSWEP V2.22000–20130.1°/3-hourly60°N–60°SSeveral daysMerged[52]
SM2RAI-ASCAT V2.1.2n2007–20220.125°/Daily60°N–60°S (land)Historical
(offline)
Satellite-only[53]
GSMaP V82000–20240.1°/Hourly60°N–60°S12–24 hSatellite-only[54]
PERSIANN°CDR V1.01983–present
(2000–2024 used)
0.25°/Daily60°N–60°S~6–12 monthsMerged[55]
CHIRPS V2.02000–20240.05°/Daily50°N–50°S~24 hMerged[56]
IMERG V07B (Final Run)2000–20240.1°/30 min65°N–65°S~3 monthsMerged[57]
ClimGridPh-RR2001–20200.01°DailyPhilippinesFew monthsMerged[15]
Table 2. Metrics used to evaluate SPPs, including their formulas, ideal values, and interpretation. Metrics assess the magnitude of error, strength of correlation, predictive accuracy, and event detection capability relative to ground observations.
GroupMetricFormula and CriteriaIdeal ValuePurpose/
Interpretation
Statistical AccuracyRMSE 1 n i = 1 N ( S P P i O B S i ) 2 0Measures the average magnitude of the error.
MAE 1 n i = 1 N S P P i O B S i 0Measures the average absolute difference.
R2 i = 1 N ( O B S i O B S ¯ ) ( S P P i S P P i ¯ ) i = 1 N ( O B S i O B S ¯ ) 2 i = 1 N ( S P P i S P P i ¯ ) 2 1Indicates the strength and direction of a linear relationship.
NSE 1 i = 1 N ( S P P i O B S i ) 2 i = 1 N ( O B S i O B S i ¯ ) 2
Criterion: ≥0.8 (VG), ≥0.7 (G), ≥0.5 (S)
1Indicates predictive power of SPP vs. observations.
Detection SkillPOD D 11 D 11 + D 01
D11—Number of times both satellite and rain gauge detected precipitation (i.e., hits)
D01—Number of times the rain gauge detected precipitation, but the satellite did not (i.e., misses)
1Measures how well precipitation events are detected.
FAR D 10 D 11 + D 10
D10—Number of times the satellite detected precipitation, but the rain gauge did not (false alarms)
1Measures frequency of false detections.
CSI D 11 D 11 + D 01 + D 10 1Balances hits, misses, and false alarms.
Bias and Volume AccuracyRB S P P ¯ O B S ¯ O B S ¯ 0Measures under- or overestimation in total precipitation.
SORS i = 1 N O B S i Total precipitation observed (used for bias and volume comparisons).
VR i = 1 N S P P i i = 1 N O B S i 1The ratio of estimated to observed total precipitation.
Erosive Precipitation CharacteristicsMDR M a x ( S P P i ) Highest daily precipitation—relevant for flood and erosion.
ARI i = 1 N P i n r
Pi—Daily precipitation on a day, where Pi > 0
Pi—Number of rainy days (i.e., days with precipitation > 0 mm)
Average intensity of precipitation during events.
NRDY C o u n t ( P i > 0   m m ) Days with any measurable precipitation.
NHRD C o u n t ( P i 10   m m ) Days with heavy precipitation linked to flood/sediment risk.
Table 3. Performance parameters selected for each hydrological application, drought, flood, water balance, and sedimentation, along with their justification. Parameters were chosen based on their relevance to accuracy, detection skill, and process-specific hydrological sensitivity.
ApplicationPerformance ParameterJustification/Basis
DroughtRBDetects systematic over- or underestimation in dry conditions
NRDYCaptures precipitation frequency critical for drought detection
VRMeasures agreement in total precipitation volume
MAEReflects the general accuracy of estimation
R2Temporal consistency and seasonality agreement
NSEPredictive skill in modeling low flow thresholds (drought onset)
NHRDDetects missed high-intensity events that affect agricultural drought resilience
FloodMDRKey driver for peak flows and flood simulation
PODAbility to capture actual heavy precipitation events
FARAvoidance of false flood warnings
CSICombined skill measure of detection and false alarm trade-off
NSEOverall predictive power for extreme flows
RMSEPenalizes larger errors (important for extremes)
R2Captures seasonal flood timing alignment
NHRDHigh rainfall counts contribute to threshold exceedance
Water BalanceVRReflects catchment water input estimation accuracy
SORSTotal baseline volume for comparison
MAEAffects soil moisture and baseflow estimation
RMSEPenalizes deviations in total water input
R2Interannual and seasonal flow representation
NSEHydrologic performance proxy in water yield modeling
PODNeeded to reflect daily water input detection
SedimentationNHRDIndicator of erosive precipitation (R-factor component)
ARIDrives detachment and sediment transport
MDRCaptures high-intensity events linked to mass erosion
RBAffects long-term erosion and deposition estimates
VROverestimation of volume can inflate erosion risk predictions
RSMELarge over/underestimates distort suspended sediment transport
CSICaptures correct event-type distributions linked to sediment bursts
Table 4. Seasonal and overall performance metrics of SPPs compared to observed precipitation in the Magat River Basin—metrics calculated separately for dry, wet, and overall seasons. Bolded values indicate the best-performing SPP for each metric and season.
MetricsSeasonAPHRO
-DITE
V1901
SM2RAIN-ASCAT V2.1.2nCHIRPS V2.0ERA5GSMaP V8IMERG V07BMSWEP V2.2PERSI
-ANN
-CDR
V1.0
Clim
-GridPh-RR
Dry9.037.9310.9910.289.8015.1616.3211.3013.56
RSMEWet9.579.6911.2711.4011.0716.5314.8912.5811.19
Overall9.308.8611.1310.8610.4515.8615.6211.9612.43
Dry4.665.515.635.707.295.598.695.935.37
MAEWet5.065.845.865.828.275.588.166.535.20
Overall4.865.685.745.767.785.588.436.235.29
Dry0.230.220.270.130.060.290.000.180.32
R2Wet0.260.210.220.150.070.220.000.110.42
Overall0.240.210.240.140.060.250.000.140.36
Dry−0.040.15−0.58−0.74−3.89−2.00−2.24−0.71−1.39
NSEWet0.150.17−0.26−0.31−3.80−1.72−0.84−0.56−0.11
Overall0.070.16−0.40−0.49−3.84−1.84−1.40−0.62−0.63
Dry0.891.000.631.000.760.820.950.760.82
PODWet0.881.000.630.990.770.810.960.770.82
Overall0.891.000.631.000.770.820.950.760.82
Dry0.210.250.150.270.200.170.330.210.20
FARWet0.230.280.160.290.220.190.320.210.23
Overall0.220.270.150.280.210.180.320.210.21
Dry0.720.750.570.730.640.700.650.630.68
CSIWet0.700.720.560.710.640.680.660.640.66
Overall0.710.730.570.720.640.690.650.630.67
Dry−6.8531.2215.1628.5733.8431.1046.6913.4927.00
RBWet−13.8934.3413.3727.0750.8128.4915.5917.4517.98
Overall−10.4932.7714.2627.8142.4229.7930.1115.5022.33
Table 5. Entropy-derived weights (Wj) of 14 performance metrics for evaluating SPPs under dry, wet, and overall conditions. Metrics with higher variability received greater weights, while those with limited variability were assigned lower weights.
MetricEntropy (Ej)Diversification (Dj)Weight (Wj)
RSME0.0230.9770.085
MAE0.0030.9970.087
R20.0010.9990.087
NSE0.0110.9890.086
POD0.2960.7040.061
FAR0.4380.5620.049
CSI1.0000.0100.001
RB0.0100.9900.086
SORS0.0030.9970.087
VR0.0010.9990.087
MDR0.0620.9380.081
ARI0.0180.9820.085
NRDY0.6250.3750.033
NHRD0.0040.9960.087
Table 6. Post-correction performance metrics for four selected SPPs across dry, wet, and overall seasons. Bold values indicate the best-performing SPP for each metric and season.
MetricsSeasonAPHRODITE V1901SM2RAIN-ASCAT V2.1.2nCHIRPS
V2.0
ClimGridPh
-RR
Ideal/
Observed Value
Dry6.369.177.926.500
RSMEWet12.1511.8410.999.990
Overall9.7010.599.578.430
Dry2.673.293.512.910
MAEWet7.637.486.835.860
Overall5.155.385.164.390
Dry0.410.150.230.411
R2Wet0.170.130.190.341
Overall0.250.170.240.381
Dry−0.01−0.25−0.020.391
NSEWet−0.35−0.28−0.140.101
Overall−0.01−0.20−0.030.251
Dry0.670.680.390.601
PODWet0.930.930.800.951
Overall0.820.820.630.801
Dry0.230.190.250.290
FARWet0.170.120.110.150
Overall0.190.150.150.200
Dry0.560.590.350.481
CSIWet0.780.820.730.811
Overall0.690.720.560.671
Dry−30.62−19.86−16.39−26.750
RBWet17.584.212.779.340
Overall3.17−2.83−2.87−1.590
Dry2528.423037.605004.513532.555696.774
SORSWet10,046.959551.9814,332.9512,134.2913,647.21
Overall12,575.3712,589.5819,337.4615,666.8419,343.98
Dry0.440.530.880.621
VRWet0.740.701.050.891
Overall0.650.651.000.811
Dry68.08172.45150.0574.09172.45
MDRWet172.4578.40172.45172.4581.22
Overall172.45172.45172.45172.45172.45
Dry3.844.578.754.324.92
ARIWet9.499.0710.809.129.1
Overall7.327.3310.187.297.28
Dry600.00608.00572.00740.001068
NRDYWet1030.001022.001327.001298.001456
Overall1630.001630.001899.002038.002524
Dry63.0074.00135.0099.00152
NHRDWet346.00334.00507.00412.00481
Overall409.00408.00642.00511.00633
Table 7. Entropy-derived weights (wj) of performance metrics for evaluating SPPs under two frameworks: (1) seasonal conditions (dry, wet, overall, based on corrected data) and (2) hydrological applications (drought, flood, water balance, sedimentation). The “Overall (Raw)” column shows weights from uncorrected datasets to retain the role of metrics with low post-correction variability. Higher weights indicate greater influence in TOPSIS-based SPP ranking.
MetricsSeasonal (wj) in % Application (wj) in %
DryWetOverallOverall (Raw)DroughtFloodWater BalanceSedimentation
RSME14.8120.916.678.5 15.2914.2819.04
MAE17.6224.1324.658.718.26 14.29
R23.512.781.938.718.2715.5614.29
NSE17.8520.917.958.618.2915.614.29
POD0.920.090.266.1 15.3214.28
FAR15.4214.1422.124.9 15.68
CSI0.820.050.180.1 15.3 19.14
RB18.0213.1213.28.617.75 17.81
SORS1.430.550.758.7 14.29
VR1.430.550.758.718.18 14.2819.09
MDR3.441.7808.1 0.650.92
ARI2.641.110.518.5 16.47
NRDY0.220.310.223.38.28
NHRD1.880.60.838.70.976.53 7.53
Disclaimer/Publisher’s Note: The statements, opinions and data contained in all publications are solely those of the individual author(s) and contributor(s) and not of MDPI and/or the editor(s). MDPI and/or the editor(s) disclaim responsibility for any injury to people or property resulting from any ideas, methods, instructions or products referred to in the content.