Article

Integrated Geomatic Approaches for the 3D Documentation and Analysis of the Church of Saint Andrew in Orani, Sardinia

Department of Civil, Environmental Engineering and Architecture, University of Cagliari, 09123 Cagliari, Italy
*
Author to whom correspondence should be addressed.
Remote Sens. 2025, 17(19), 3376; https://doi.org/10.3390/rs17193376
Submission received: 31 July 2025 / Revised: 26 September 2025 / Accepted: 1 October 2025 / Published: 7 October 2025
(This article belongs to the Section Remote Sensing Image Processing)

Abstract

Highlights

What are the main findings?
  • Panoramic photogrammetry provides centimeter-level accuracy in complex spaces.
  • Apple LiDAR generates reliable 3D models comparable to CRP but with lower density.
What is the implication of the main finding?
  • Panoramic photogrammetry offers a fast, low-cost alternative for cultural heritage surveys.
  • Apple LiDAR enables accessible, accurate 3D documentation of small structures.

Abstract

Documenting cultural heritage sites through 3D reconstruction is crucial and can be accomplished using various geomatic techniques, such as Terrestrial Laser Scanners (TLS), Close-Range Photogrammetry (CRP), and UAV photogrammetry. Each method comes with different levels of complexity, accuracy, field times, post-processing requirements, and costs, making them suitable for different types of restitutions. Recently, research has increasingly focused on user-friendly and faster techniques, while also considering the cost–benefit balance between accuracy, times, and costs. In this scenario, photogrammetry using images captured with 360-degree cameras and LiDAR sensors integrated into Apple devices have gained significant popularity. This study proposes the application of various techniques for the geometric reconstruction of a complex cultural heritage site, the Church of Saint Andrew in Orani, Sardinia. Datasets acquired from different geomatic techniques have been evaluated in terms of quality and usability for documenting various aspects of the site. The TLS provided an accurate model of both the interior and exterior of the church, serving as the ground truth for the validation process. UAV photogrammetry offered a broader view of the exterior, while panoramic photogrammetry from 360° camera was applied to survey the bell tower’s interior. Additionally, CRP and Apple LiDAR were compared in the context of a detailed survey.

1. Introduction

Effective documentation of cultural heritage requires a series of operations to achieve accurate 3D reconstruction of the studied structures, taking into account specific challenges related to the complexity of the sites [1,2]. Indeed, the characteristics of heritage sites, including conservation status, overall layout and dimensions, possible restrictions on accessibility, and the availability of previous datasets, influence the survey settings [3]. Consequently, various geomatic techniques may be applied in this context. On the other hand, the final geometric reconstruction commonly serves as a foundation for any further analysis across different fields, making it essential to clearly define its specific requirements. This clarity leads to the appropriate selection of the geomatic technique [4,5]. A key factor in this selection is the accuracy parameter, which influences both the choice of techniques and their processing phases, affecting the reliability, usability, and metric characteristics of the resulting products. Moreover, heritage documentation should be viewed as transdisciplinary, making it valuable not only for experts but also for cultural dissemination to a broader audience [4,6,7,8]. In some cases, simplicity and accessibility of products may take precedence over absolute quality standards. Lastly, from a more practical point of view, different techniques have varying associated costs, which can differ significantly. The same applies to field and processing times, which strongly impact survey organization and overall costs [9].
For a long time, Terrestrial Laser Scanner (TLS) has been the primary surveying technique across many fields, particularly in cultural heritage, as it provides reliable and accurate models with high spatial resolution [10,11,12]. TLS surveys work effectively for both interior and exterior spaces, and can produce colored models, depending on the instruments used and the site’s conditions. However, this technique requires expensive equipment and entails complex, time-consuming processing that demands highly skilled operators, resulting in huge datasets. Additionally, field operations can be intricate and lengthy, making TLS a challenging method for surveying complex structures [13,14,15,16,17]. Another widely used technique is Close-Range Photogrammetry (CRP), also known as multi-image photogrammetry, which primarily relies on the Structure from Motion (SfM) processing algorithm [18]. This method can produce accurate and detailed 3D models useful for heritage reconstruction, although the scale depends on supplementary techniques [19,20]. To obtain a comprehensive model of heritage sites, Unmanned Aerial Vehicles (UAV) photogrammetry can be employed as a powerful technique that complements models generated from terrestrial methods, particularly TLS [21,22,23,24,25,26,27]. UAV models can indeed provide a broader perspective of cultural and archaeological sites, especially useful for documenting high structures that are difficult to access or observe from the ground.
Recent advancements in digital instrumentation have led to the emergence of a new area of research within cultural heritage studies. This field focuses on developing low-cost and efficient techniques to ease and expedite both surveying operations and the post-processing of collected datasets [28]. One of these techniques involves the use of 360-degree cameras, which capture spherical images that provide a wider field of view in a single shot due to the combination of fish-eye lenses [16,29,30]. These spherical images can be used in photogrammetric processes, both in fisheye format and in spherical panorama format, with the transformation generally integrated into the camera’s software [31]. Hence, it is possible to capture the same scene with significantly fewer images compared to traditional CRP [32]. In the context of heritage documentation, spherical and panoramic photogrammetry can offer several advantages over other geomatic techniques. Indeed, its wider field of view, combined with low costs and simple equipment, makes it particularly suitable for surveying complex and narrow structures [13,29,33,34,35,36]. Another noteworthy technique involves the use of small, low-cost sensors, such as the laser scanning sensor integrated into some Apple devices since 2020. These sensors work in conjunction with dedicated apps to produce point clouds and 3D meshes, with advanced features available in the app’s paid version [37]. As a result, surveys conducted using these sensors are very cost-effective, and their accuracy for 3D modeling in various scenarios, including cultural heritage, has been thoroughly analyzed [38,39,40].
The above-described techniques are highly effective for the surveying and documentation of complex architectural heritage. Established methods such as TLS, CRP, and UAV photogrammetry are widely adopted, with numerous studies in the literature demonstrating their accuracy and potential [21,41]. In contrast, techniques such as panoramic photogrammetry and LiDAR sensors integrated in Apple devices for cultural heritage documentation still present open challenges and require further investigation [1,15]. This study aims to advance research on the application and integration of these methods for 3D surveying and documentation of historical and architectural assets, with particular focus on CRP, panoramic photogrammetry, and Apple-integrated LiDAR sensors, in order to evaluate their accuracy and operational potential.
In particular, we present the 3D documentation of the Church of Saint Andrew in Orani, Sardinia, which is in a general poor state of preservation, except the bell tower. We utilized various datasets acquired from different geomatic techniques to evaluate their performance and usability for documenting different aspects of the site. Notably, the Terrestrial Laser Scanner (TLS) provided an accurate model of both the interior and exterior of the church, effectively capturing all aspects of the site and serving as a reference for validating the products obtained from other techniques. The model created from UAV photogrammetry provided a broader view of the exterior, particularly related to the upper part of the bell tower. We also tested the advantages of other techniques in specific areas of the church. Inside the bell tower, panoramic photogrammetry was applied in a narrow and complex environment. Three distinct image sets were captured and processed in spherical panorama format: two sets acquired from different tripod heights, and a third set combining all images. By assessing the effects of these acquisition configurations on reconstruction accuracy, this study provides an initial evaluation of how practical survey strategies influence the quality of 3D reconstructions. For a more detailed survey of a selected area, a Niche, we tested Close Range Photogrammetry (CRP) and the low-cost and rapid LiDAR sensor integrated into Apple devices.
Each technique is discussed in terms of survey settings, instrumental characteristics, processing parameters, and results obtained. The results include the validation of products from various techniques, in terms of: (i) cloud-to-cloud comparison between the three sets of panoramic images and the TLS model for the bell tower; (ii) cloud-to-cloud comparison between CRP and Apple LiDAR models of the Niche with the reference TLS model; (iii) analysis of horizontal and vertical sections obtained from the different techniques used for surveying the bell tower.
Finally, the tower’s verticality was evaluated using a semi-automatic procedure based on TLS sections and Python scripting, providing a reproducible and quantifiable workflow applicable to other structures.

2. Materials and Methods

2.1. Case Study

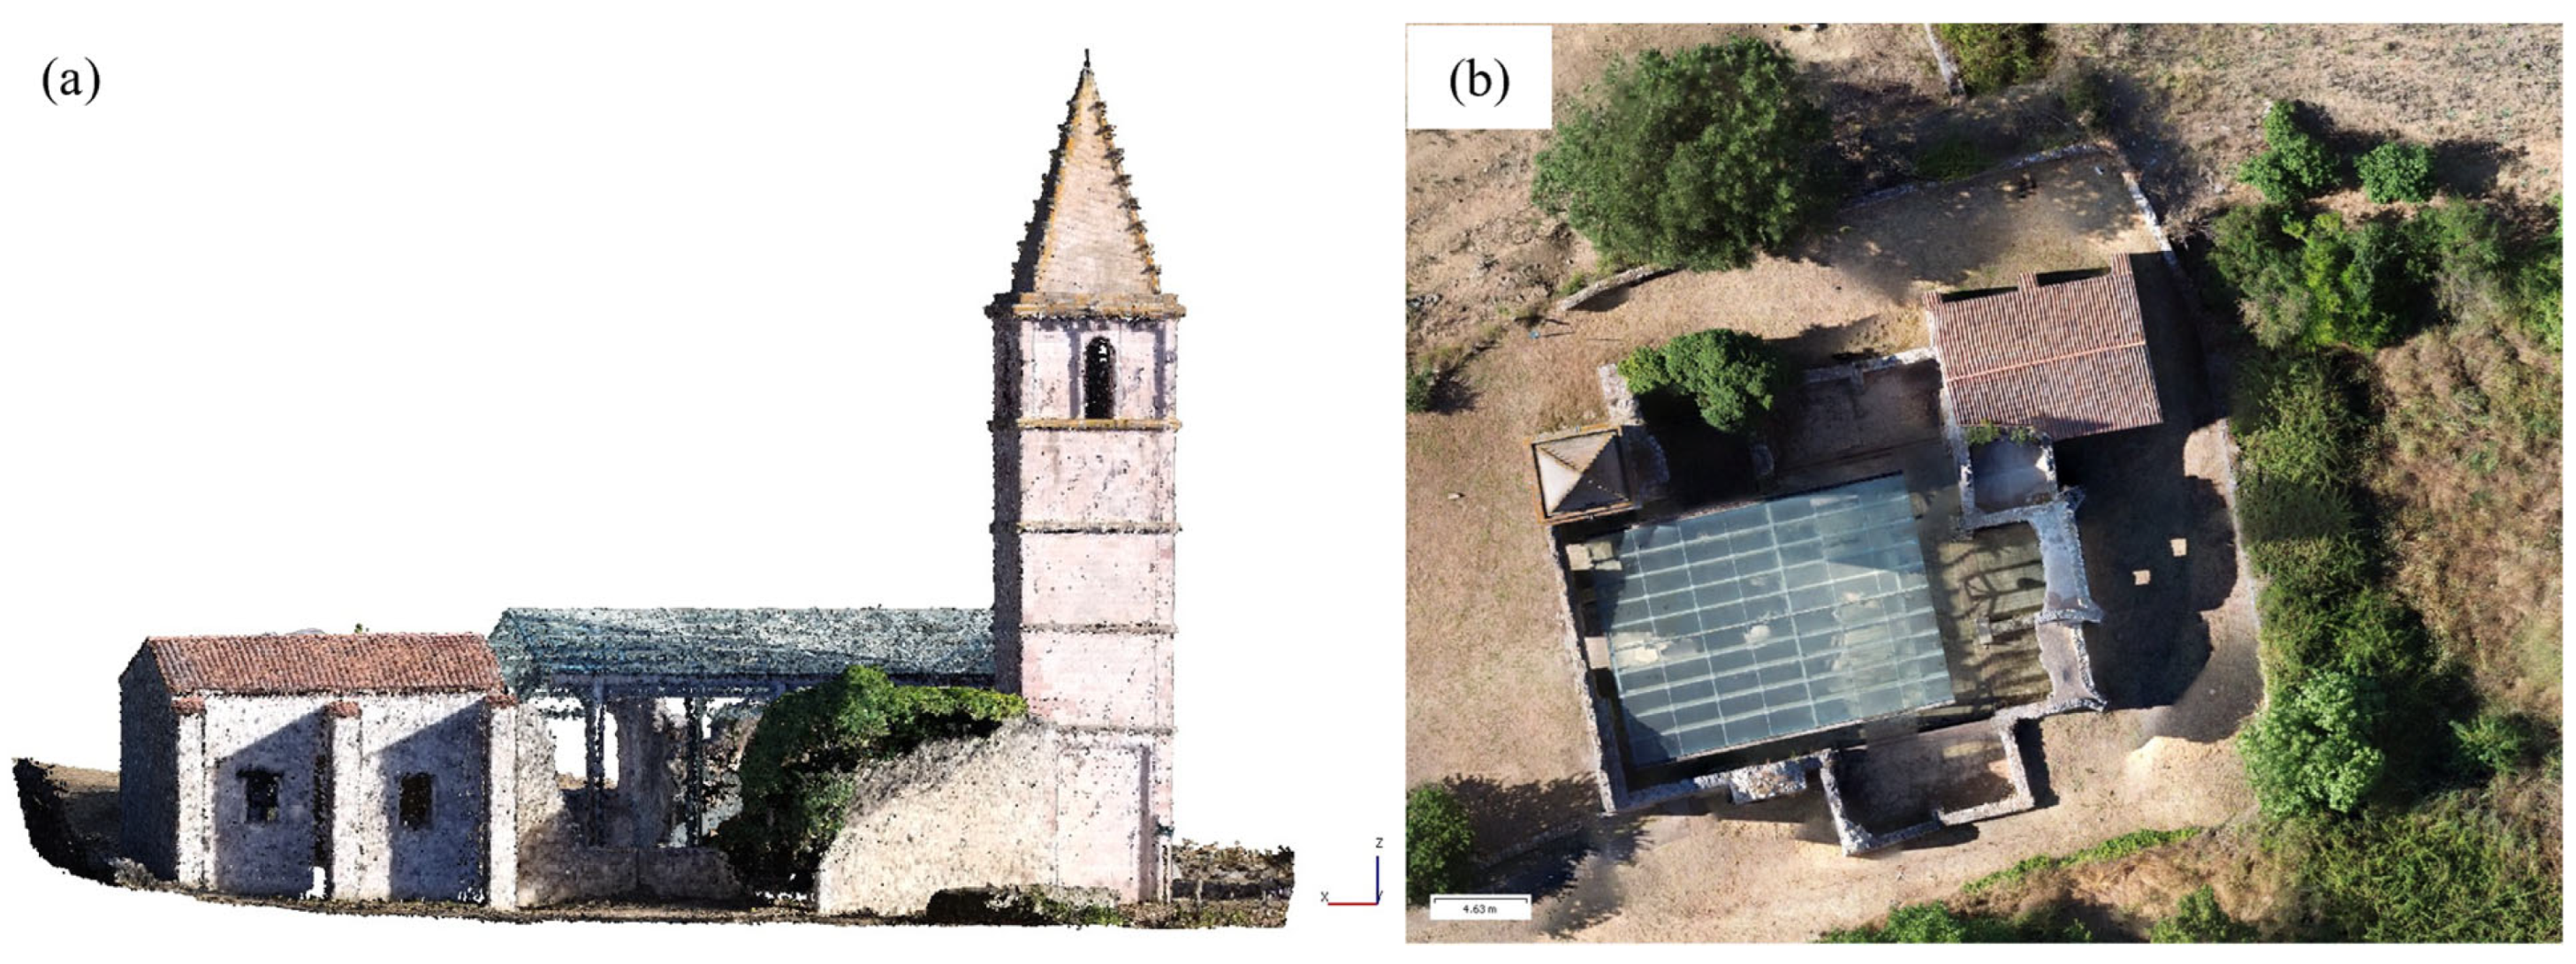
This study focuses on the church of Saint Andrew, a fascinating site located in Orani, a small village in the central region of Sardinia, Italy (Figure 1a) [42]. Originally built as the parish church of the homonymous village (later a “villa” in 1617), the construction fell into disrepair and was abandoned in the 19th century, when a new parish church was erected in the village center. Its poor state of preservation, with much of the structure reduced to ruins, limits detailed knowledge of the church, though evidence suggests it was likely built between the late 16th and early 17th centuries [43,44]. The church was probably designed in a Greek cross layout, reflecting its dedication to St. Andrew, as suggested by some remnants of both barrel-vaulted and cross-vaulted chapels. The structure is composed of mixed stone held together by mortar and covered with plaster, except for the jambs and arch-beams of the side doors, which are made of exposed volcanic stone. Initially, the facade had a sloping design, but it was later modified to feature a flat, crenellated termination, following the architectural trends of the island in the 17th century. In the center, the main portal features a pointed, molded arch containing a carved ashlar that depicts St. Andrew’s cross. At the top of the triangular tympanum, there is a polylobate cross, and windows are positioned at each of the three portals [45,46,47].
The best-preserved part of the building is the bell tower, which is indeed a key focus of this study. Its dimensions are approximately 20 m in height and 1.8 m in width. The tower features a square design and is constructed of squared volcanic stone ashlars. It comprises six levels, decorated with thin molded cornices that culminate in a cathedral-style spire, with the upper section featuring slender single lancet windows.
The central area of the inner courtyard, originally the main part of the church, covers approximately 470 m2 and contains several well-preserved ravines and niches. One particular niche was chosen for a detailed survey employing multiple geomatic techniques (Figure 1b).

2.2. Acquired Data

The following subsections describe the datasets collected using various geomatic techniques, highlighting the differences in instrumental requirements, the intended use of the datasets, and the areas surveyed on-site. As a standard practice, the Terrestrial Laser Scanner (TLS) dataset is used to capture all aspects of the church, including the bell tower and courtyard. Additionally, it serves as the ground truth for validating other data sources. The Unmanned Aerial Vehicle (UAV) was used to provide a broader perspective of the site and to complement the TLS survey. Finally, additional techniques were employed to conduct surveys of targeted areas, assessing their suitability for those specific contexts. In particular, Close-Range Photogrammetry (CRP), 360° digital camera and LiDAR integrated into Apple devices were used.
The areas surveyed using each technique are outlined in the following list:
  • Terrestrial Laser Scanner (TLS): interior and exterior of the bell tower, inner and outer areas of the courtyard.
  • 360° Camera: interior of the bell tower.
  • Unmanned Aerial Vehicle (UAV) photogrammetry: exterior of the bell tower (specifically for the upper parts), open areas of the courtyard and a wider surrounding area.
  • Close range Photogrammetry (CRP): Niche.
  • LiDAR Apple: Niche.

2.2.1. Terrestrial Laser Scanner (TLS)

The Terrestrial Laser Scanner survey was performed with a Leica Laser Scanner HDS 7000 and used as ground reference to validate other data sources. The TLS acquisitions captured both the interior and exterior of the bell tower, along with the inner and outer areas of the courtyard. The complete scheme of the TLS stations is illustrated in Figure 2, with a total of 51 acquisitions, 19 of which were conducted inside the bell tower (Figure 2b). All TLS scans were acquired at normal (3×) quality, which involves averaging three measurements per point. The resolution was set to 1 pt/12.6 mm in open areas and 1/25.1 mm for the interior of the bell tower, at a distance of 10 m.
Five Ground Control Points (GCPs) were uniformly distributed around the exterior of the church, marked by circular targets with a diameter of 0.15 m (Figure 3). The coordinates of these points, used in the georeferencing process, were obtained through a GNSS survey with a Trimble R8 GNSS receiver operating in NRTK (Network Real-time Kinematic) mode, providing an accuracy of approximately 4 cm for planimetric components and 5 cm for the altimetric component. Corrections from the Sardinian SARNET network [48] were applied, aligning the coordinates with the ETRF2000-UTM32N reference system (EPSG: 6707). Ellipsoidal heights were then converted to orthometric heights using ConveRgo Software (version 2.05) [49] and the ITALGEO05 geoid height grid [50].

2.2.2. 360° Digital Camera

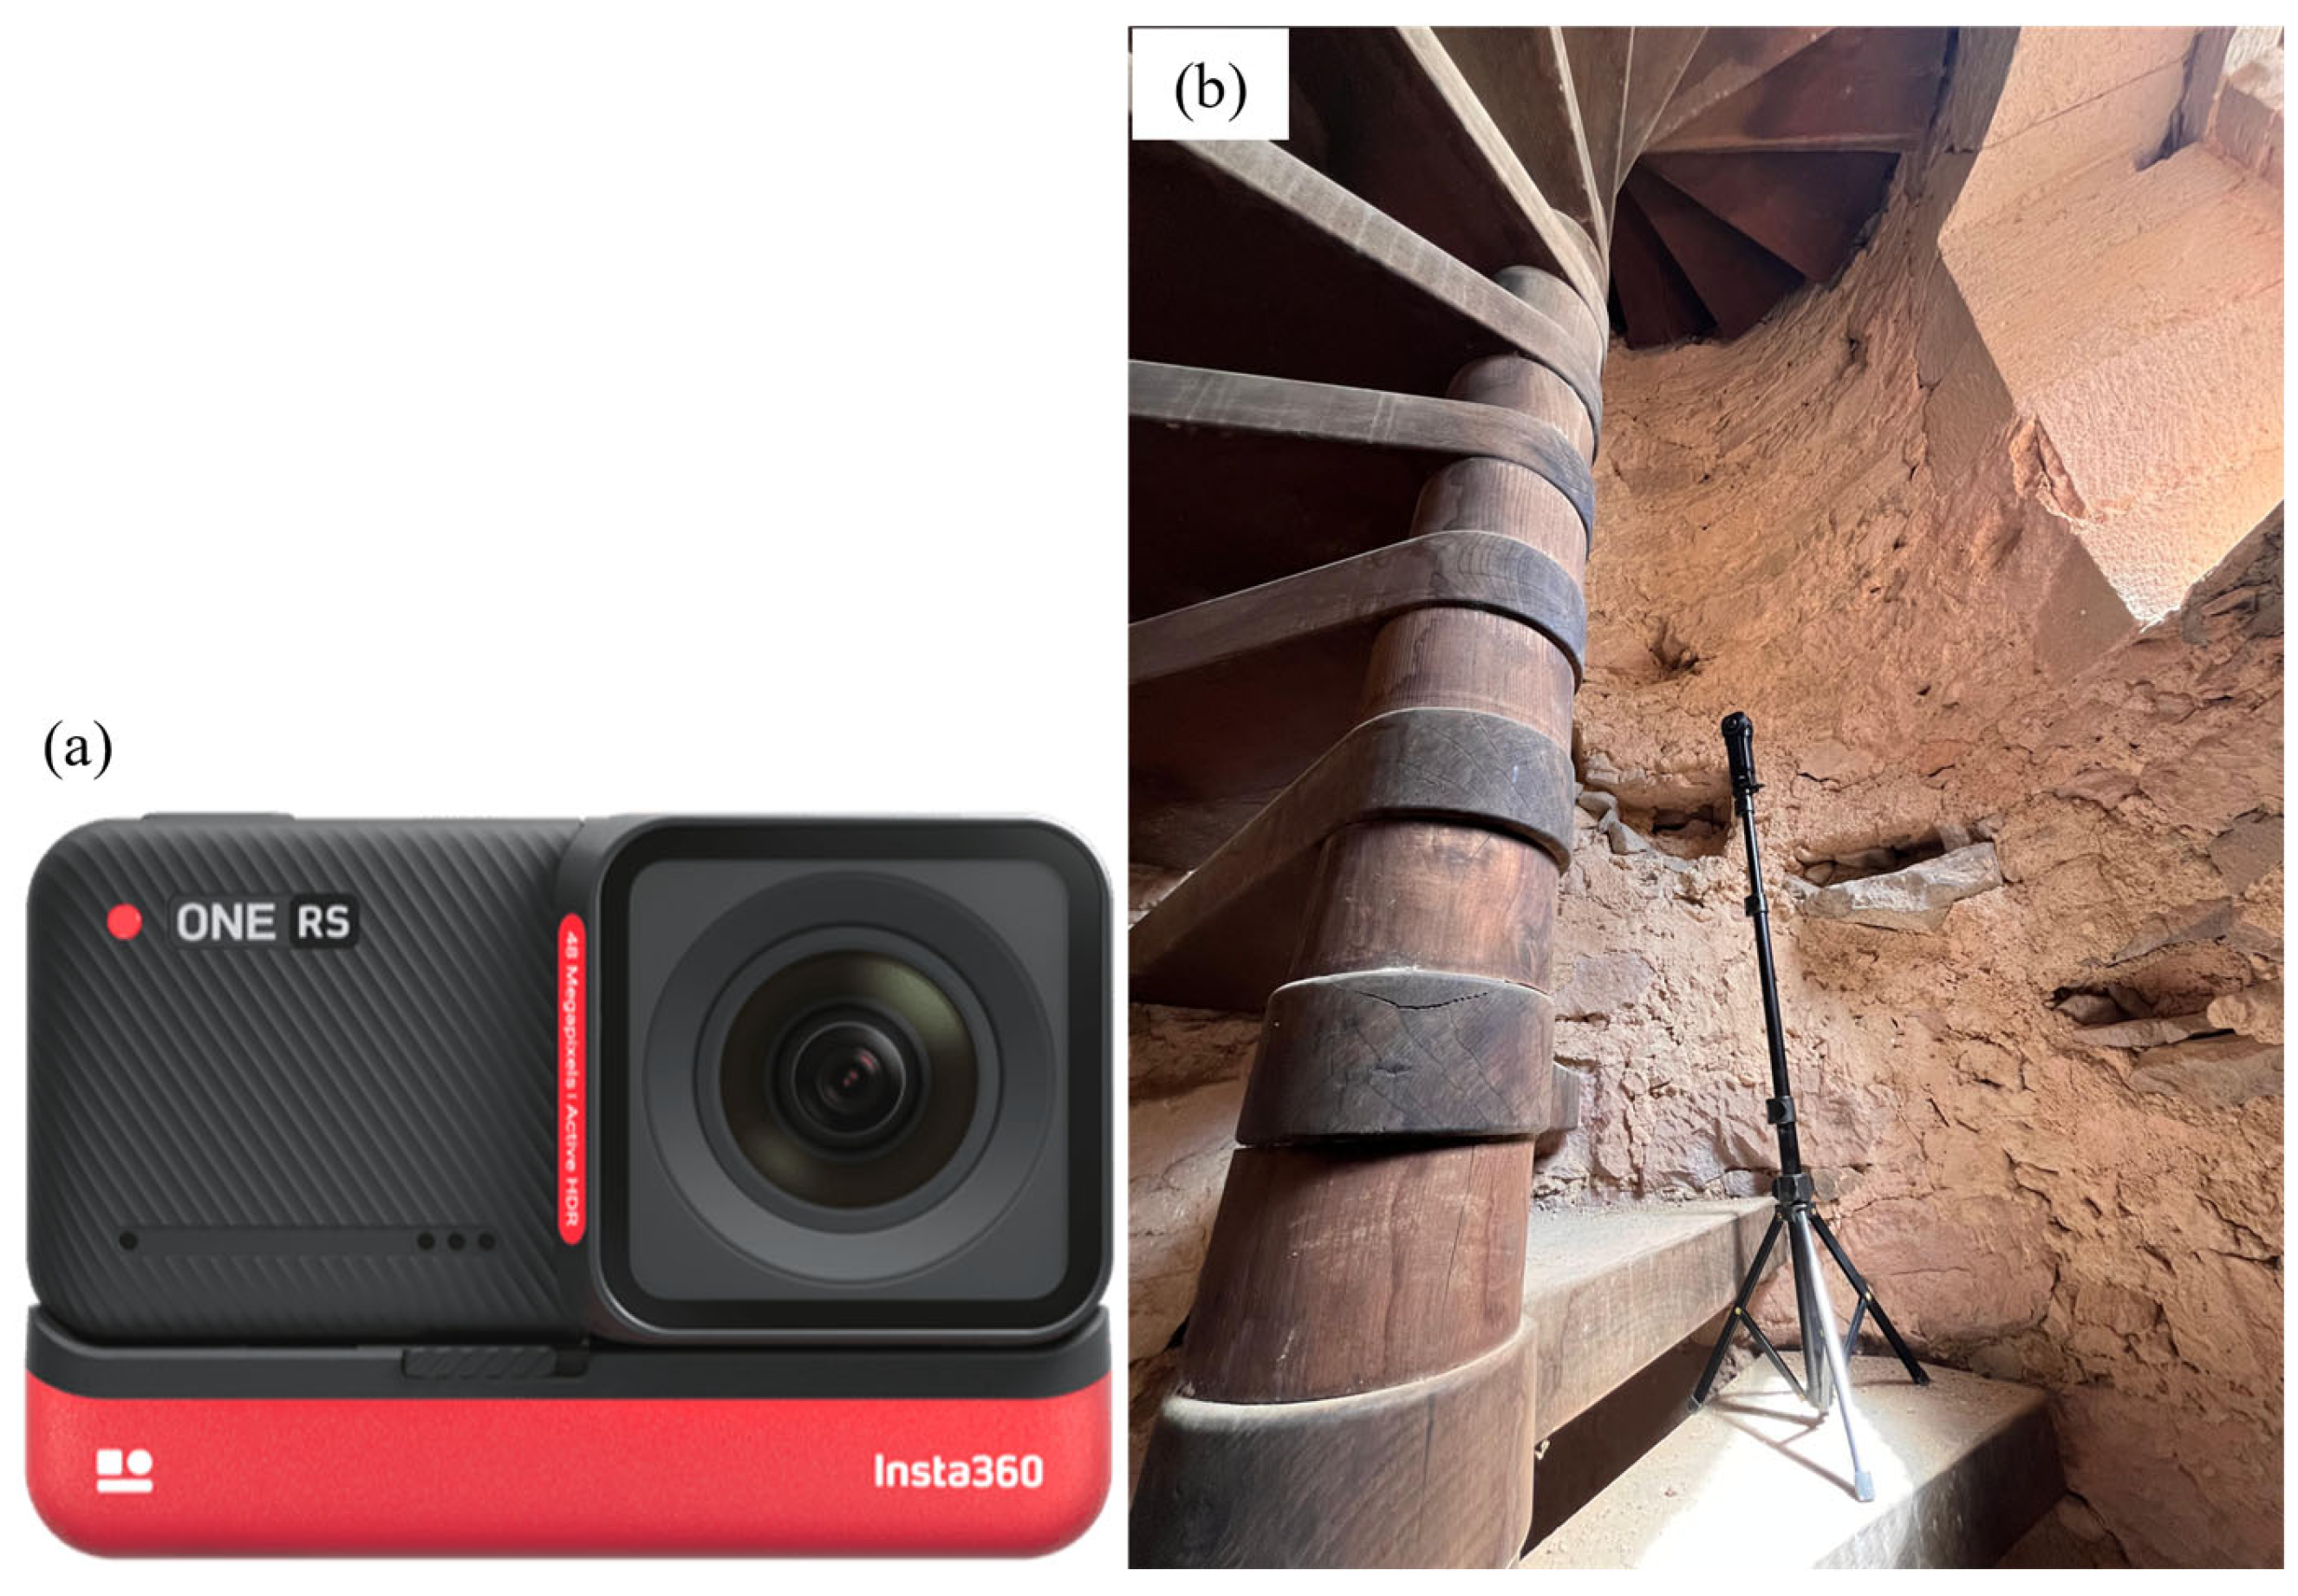
360° images of the bell tower interior were acquired using the consumer-grade Insta360 ONE RS camera and its tripod (Figure 4). The technical specifications of the camera are listed in Table 1.
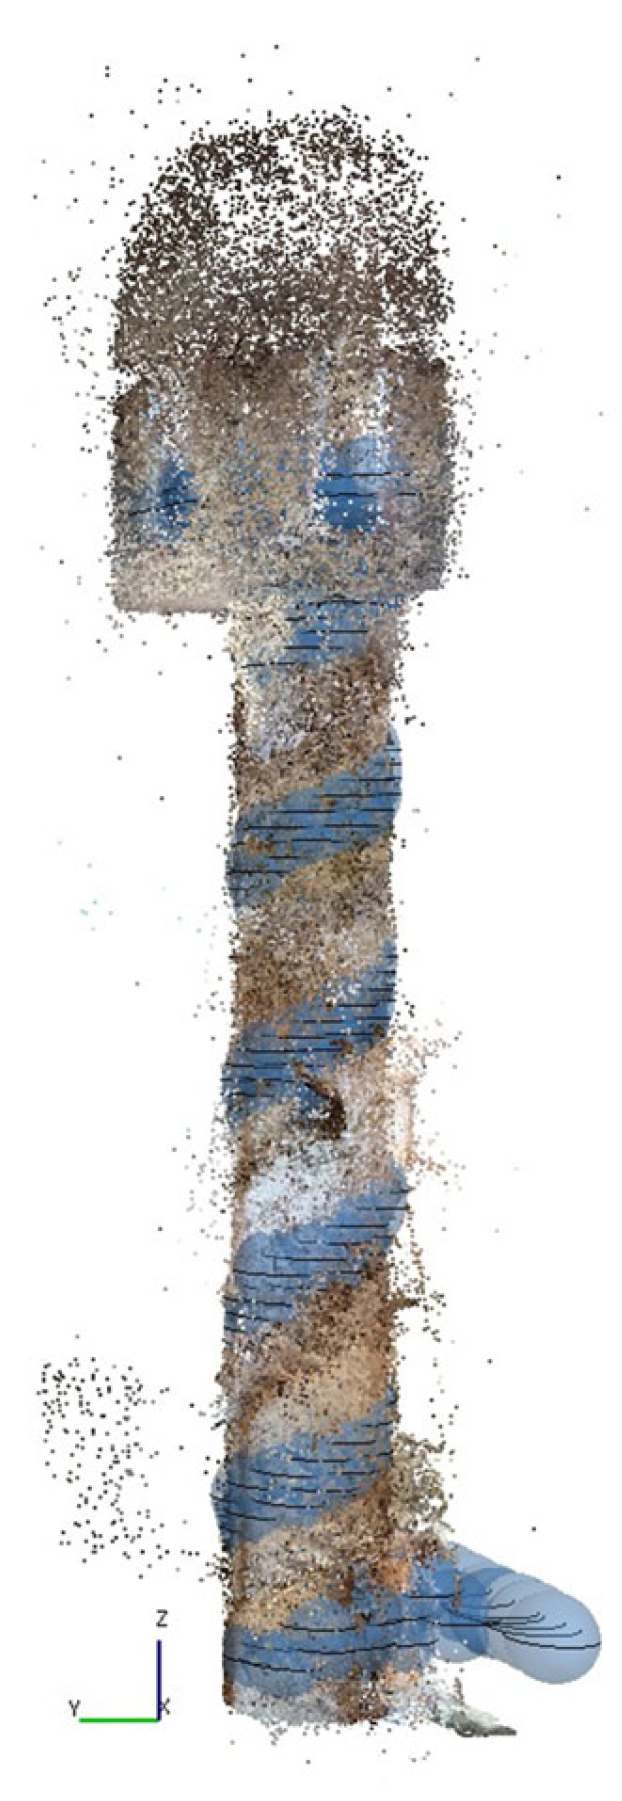
Images were captured at the entrance, the top floor, and at each step throughout the entire height of the tower. Additionally, to evaluate how variations in the number of images and capture height might affect the outcomes of different elaborations, three distinct datasets were created. Images were acquired while ascending and descending the stairs, with two different capture heights: 100 cm for the outward journey (Set I) and 135 cm for the return journey (Set II) (Figure 5). Set I consisted of 102 images, while Set II included 103 images. Some images, such as those of the external entrance, were common to both sets, resulting in a combined dataset of 171 images (Set III). All images were captured in HDR mode, enabling optimal exposure selection using the Insta360 Studio app.

2.2.3. UAV Flight Survey

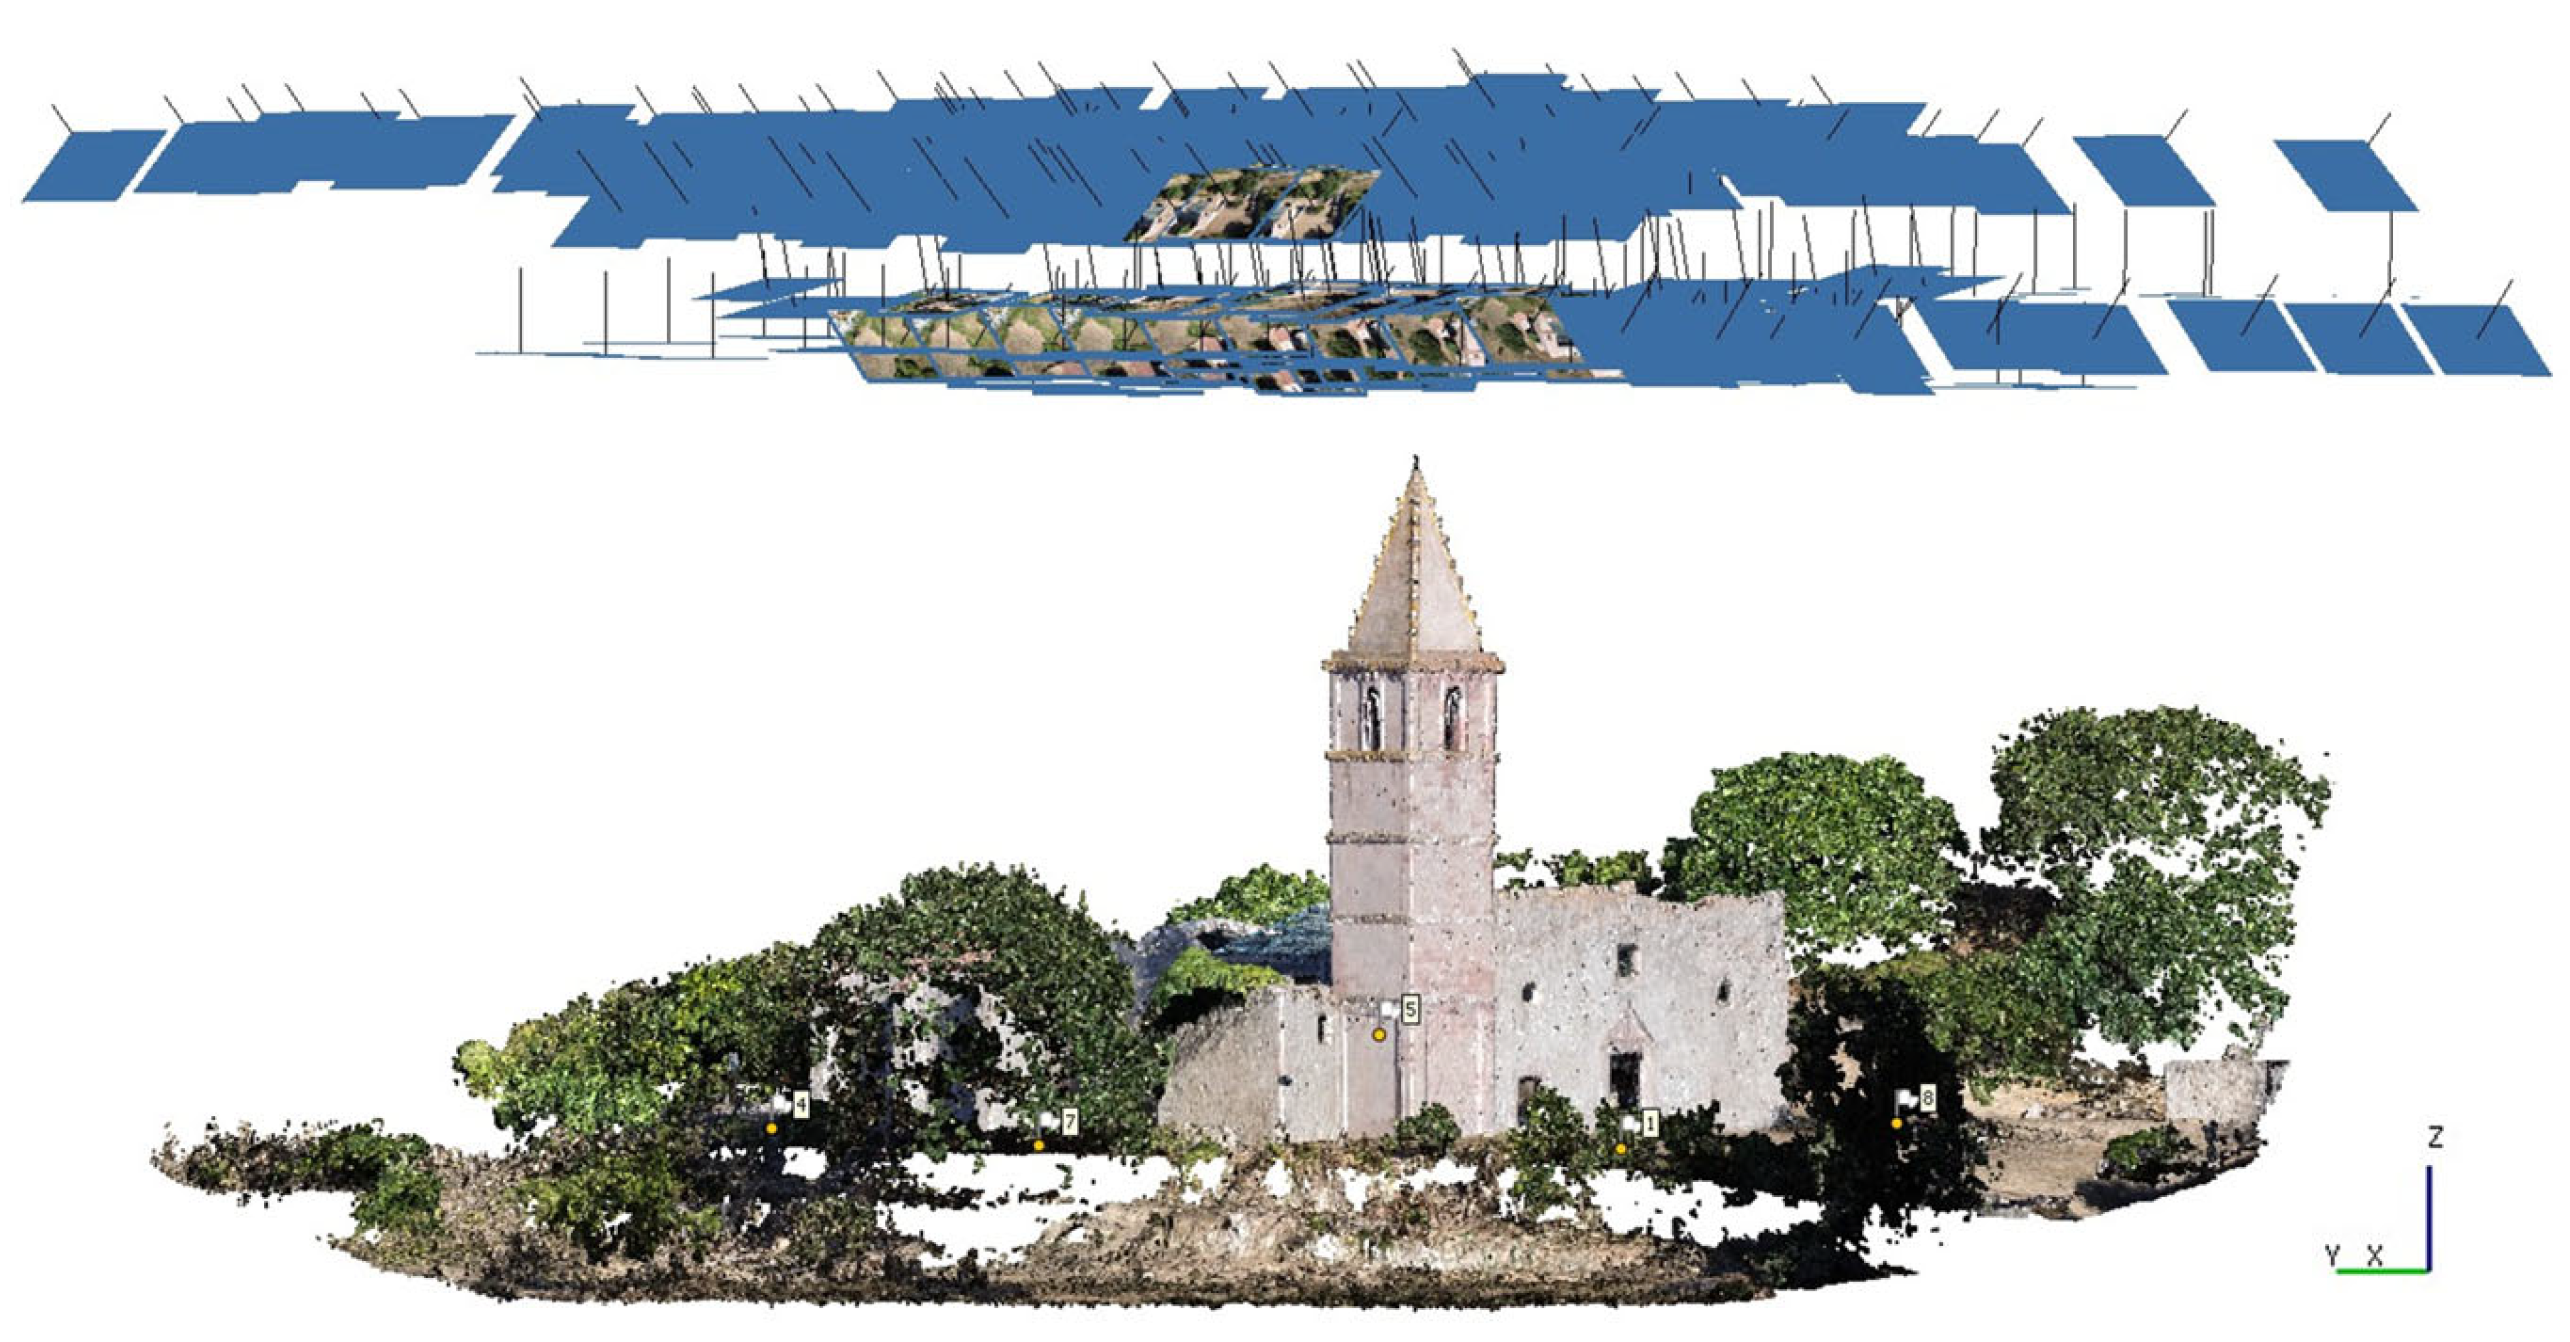
A low-cost Mini 3—DJI drone was utilized for the photogrammetric UAV campaign, capturing a total of 268 images. Nadiral and oblique images, with an inclination angle of 45°, were acquired at a flight altitude ranging from 30 to 50 m. The flight trajectory was designed to ensure sufficient overlap between adjacent images (Figure 6), with the drone operating at very low speed and maintaining a stable hover before each capture, using a short exposure time. The same Ground Control Points used in the TLS survey were also employed during the georeferencing phase of the UAV photogrammetric survey, as detailed in Section 2.2.1.

2.2.4. Close Range Photogrammetry (CRP)

Close-Range Photogrammetry was tested on a niche located on the south wall of the courtyard (Figure 1b) to evaluate the technique’s effectiveness on small and complex architectural features. Image acquisition was performed using a Canon EOS M3 digital camera (Canon Inc., Tokyo, Japan), equipped with a CMOS sensor measuring 22.3 × 14.9 mm, with a pixel size of 3.7 µm. An 18–55 mm EF-S lens was attached, and a focal length of 18 mm was specifically used. The camera provides a resolution of 24.2 megapixels, a Field of View (FoV) of 81.5°, and outputs data in Exif 2.3 (JPEG) and RAW (CR2) formats. A total of 73 images of the Niche were captured with appropriate overlap to ensure photogrammetric accuracy. Due to conservation restrictions, it was not possible to place targets directly on the structure for georeferencing. Instead, the coordinates of five visible points were extracted from the georeferenced TLS model and used as markers in the georeferencing process (see Section 3.4).

2.2.5. Apple LiDAR

In addition to CRP, the Niche was surveyed using the laser scanning sensor (supplied by Sony Corporation, Tokyo, Japan) integrated into Apple devices, specifically the iPhone (starting from the 12 Pro) and the iPad Pro, since 2020 [51]. Technical specifications for this sensor, primarily recommended for Augment Reality (AR) and Virtual Reality (VR), can be found in [52]. Additionally, scientific literature indicates that it consists of a solid-state LiDAR (SSL) [53,54]. This versatile technology enable the creation of 3D models of various objects and environments by combining LiDAR-captured points with RGB information from the camera, offering the advantages of low cost and user-friendly features [38,55]. The use of the Apple LiDAR sensor is possible only through the dedicated apps available on the App Store, which allow users to acquire data and export point clouds and meshes in multiple formats (.las, .ply, and others).
For our survey, the Niche was documented using the LiDAR sensor embedded in the Apple iPad Pro (3rd generation) in combination with the Polycam app (version 2.3.9). Further details on the Polycam app are provided in [37], which reports that this application outperformed other tested options, producing reliable 3D reconstructions of objects.

3. Data Processing

This section describes the processing methods applied for each technique, detailing the relevant parameters and processing steps involved in generating the 3D model.

3.1. TLS Processing

The processing of the TLS datasets was performed using Reconstructor software version 4.4.2 [56]. The TLS acquisitions consisted of 51 different scans that covered both the interior and exterior of the bell tower, as well as the inner and outer areas of the courtyard. This method allowed us to obtain an accurate georeferenced model of the entire church, which can also be used as ground truth for validating other models.
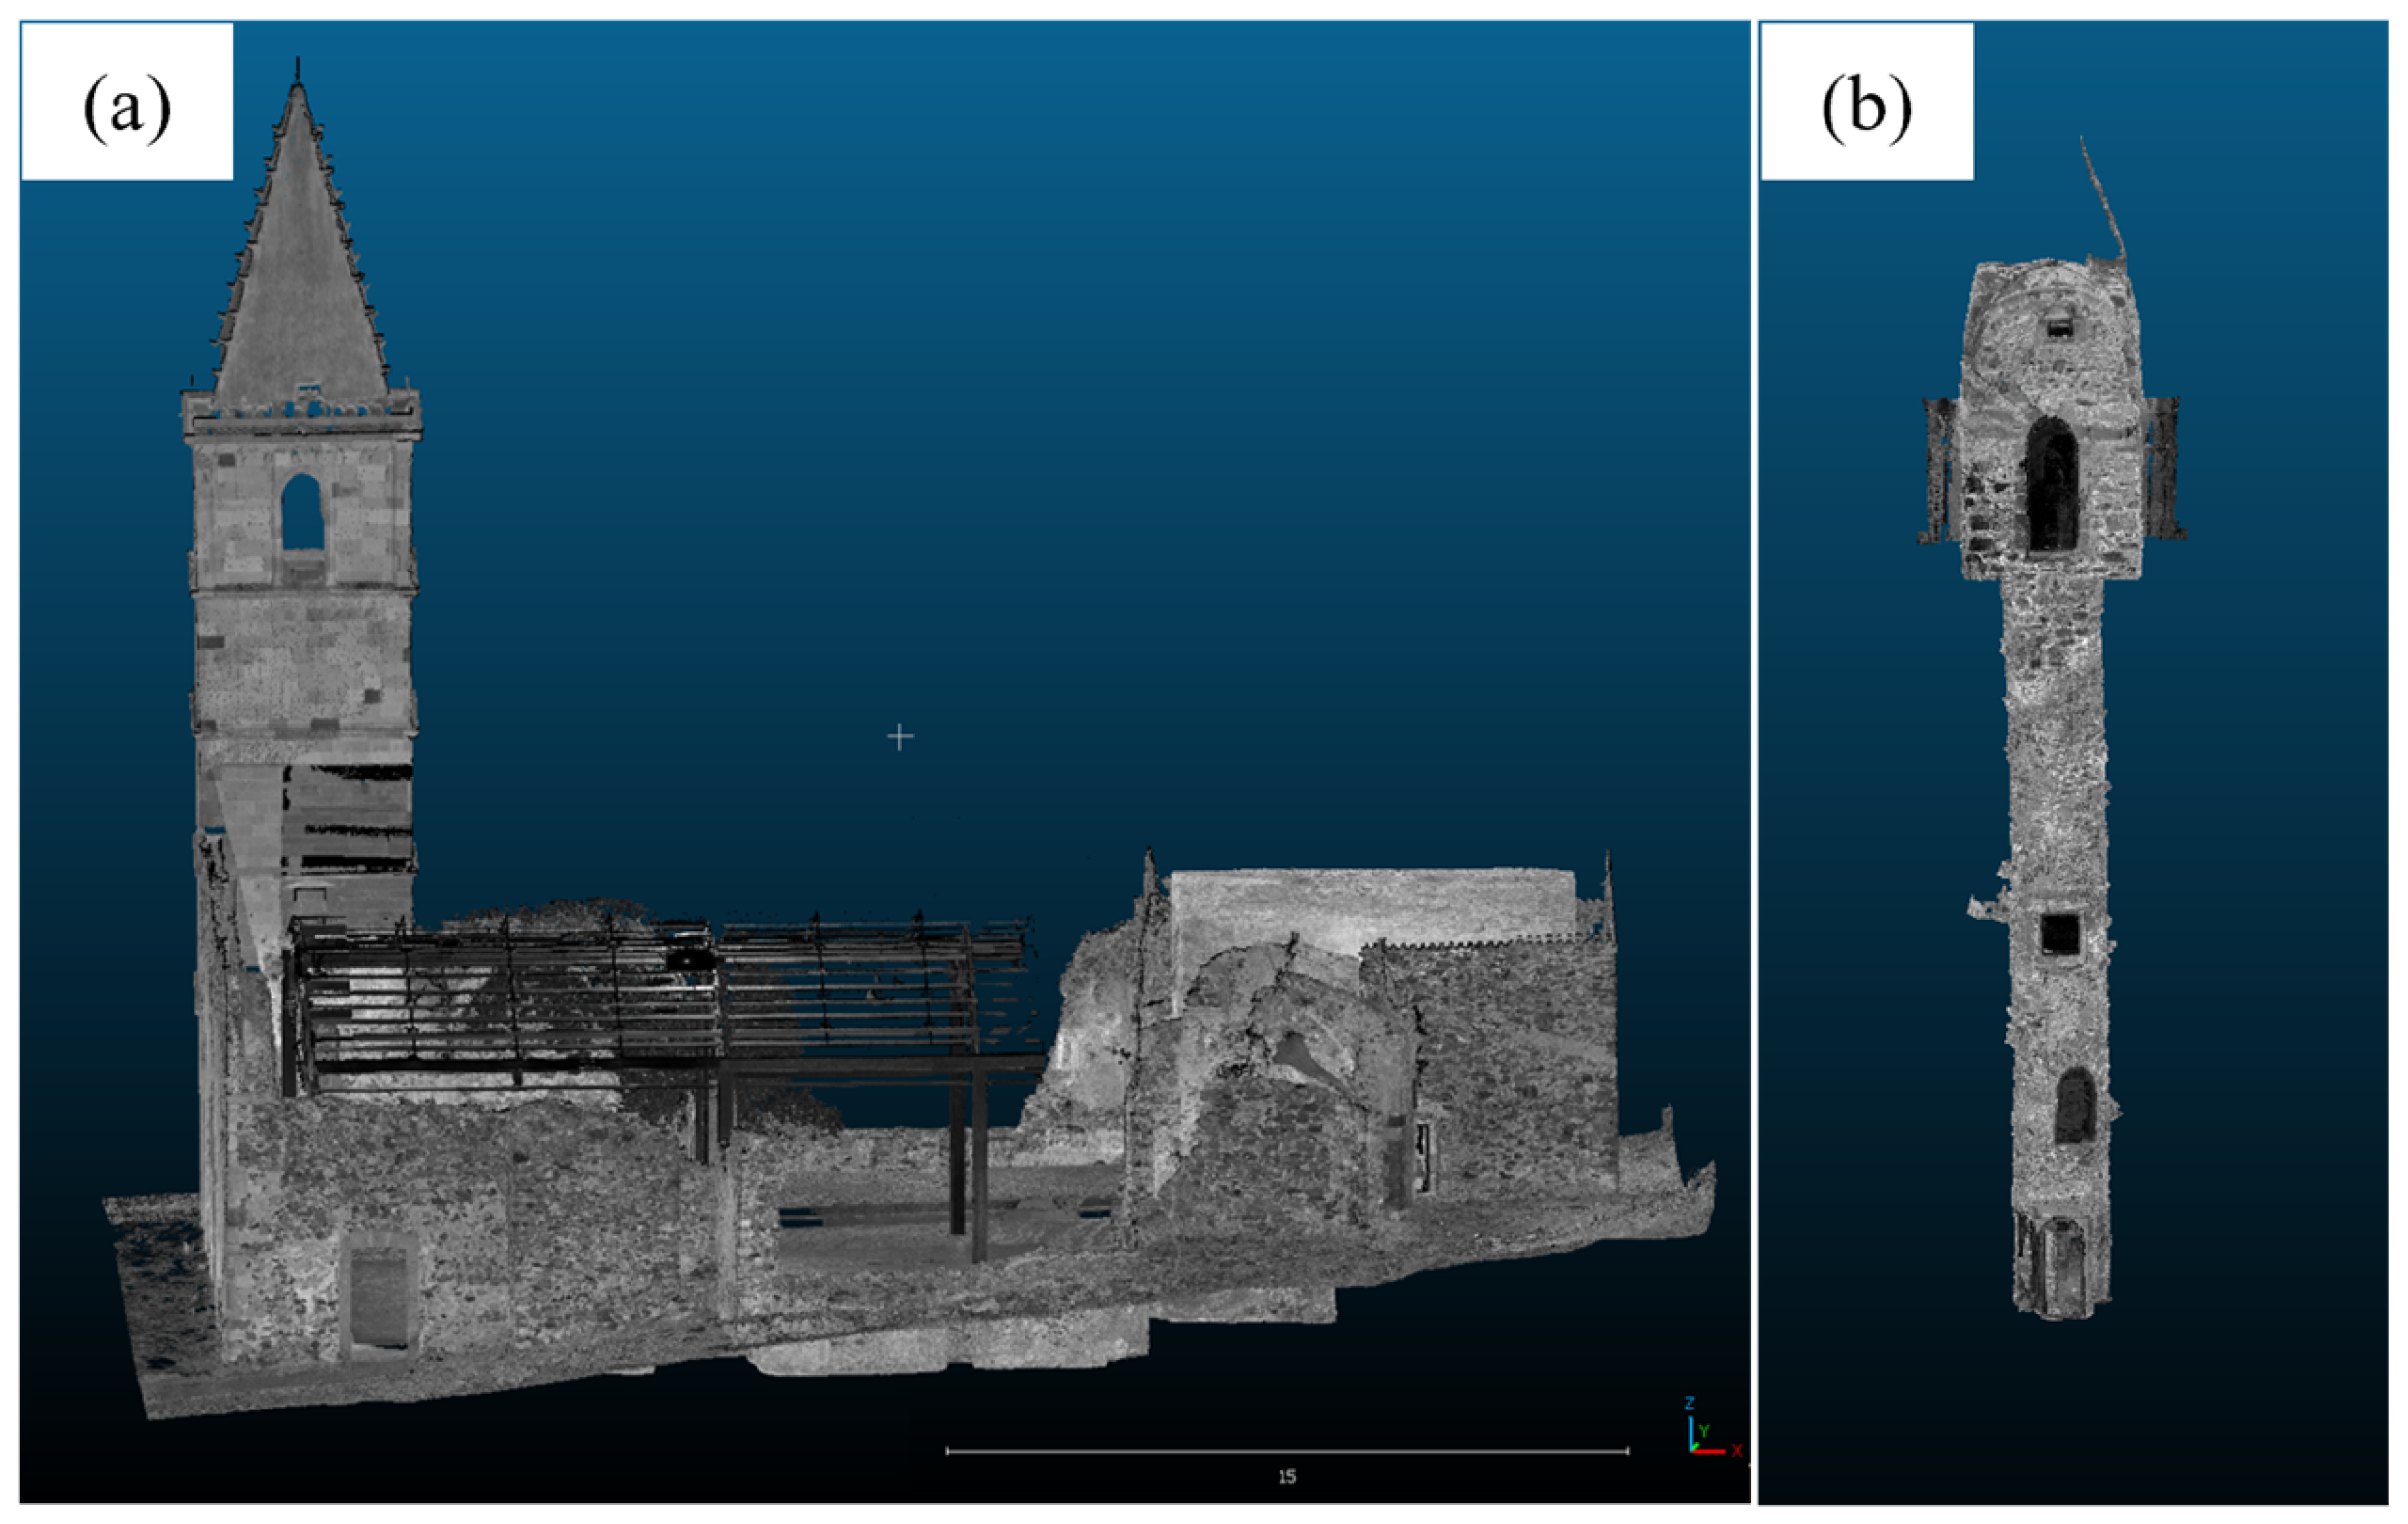
The individual point clouds were co-registered using the Iterative Closest Point (ICP) algorithm [57]. The registration process began with the central scan taken in the inner courtyard to complete that area, followed by aligning the overlapping scans taken from the external walls. The scans inside the bell tower were also aligned by leveraging the overlap with the initial courtyard scan, starting from the tower’s entrance and gradually moving to the upper floors. Thereafter, the resulting comprehensive model was georeferenced, aligning it to the ETRF2000/UTM zone 32N (N-E) reference system using the targets coordinates. Figure 7 illustrates the comprehensive TLS model of the church and bell tower, while Table 2 reports the registration quality in terms of average scan2scan residuals and georeferencing errors.
After decimating the model to a resolution of 1 cm, the TLS point clouds resulted in a total of: 2.0∙107 and 1.5∙107 points for inner and outer areas of the courtyard, and 3.4∙106 for the interior of the bell tower.

3.2. Panoramic Photogrammetry

For the photogrammetric processing of the 360° camera datasets, we directly used the generated images in the spherical panorama format, resulting from the automatic snitching operation of the camera which combines the fisheye lens acquisitions [58]. This dataset was processed with Agisoft Metashape Pro software version 2.1.0 [59], where the Structure from Motion (SfM) algorithm and Multiview stereo (MVS) techniques are currently implemented both on frame and spherical images. The panoramic images exported from Insta 360 Studio were initially masked from artifacts in the lower region due to the use of the tripod and from the environment captured outside the openings. Hence, the workflow included the following steps: image alignment and tie point extraction (which created a sparse point cloud), and optimization of the image alignment, followed by the elaboration of the dense point cloud.
The three distinct sets of images were processed independently using the same parameters: Set (I) lower capture height—outward (1.00 m); Set (II) higher capture height—return (1.35 m); Set (III) images taken at both capture heights. The alignment accuracy was set to “High”, applying masks to the key points, and the dense point cloud was generated with “High” quality and “Moderate” depth filtering. The point clouds related to the different sets had varying numbers of points, specifically 3.5∙107 for Set I, 3.2∙107 for Set II, and 4.3∙107 for Set III.
For the georeferencing process, we selected specific points from the georeferenced TLS model, which were located in easily recognizable positions, and extracted their absolute coordinates (ETRF2000/UTM zone 32N—EPSG 6707) (Figure 8). These points served as reference markers for the three sets of panoramic images.
The georeferencing accuracy of the three different sets is detailed in Table 3, expressed in terms of RMSE values for the three coordinates on both the Control points and the Check points.

3.3. UAV Photogrammetry

Images collected from the UAV platform were processed using the Structure from Motion (SfM) pipeline implemented in Agisoft Metashape Pro software version 2.1.0. Nadir and oblique datasets were processed separately until the generation of the point cloud, with each set aligned and adjusted independently. Image alignments were performed using the High accuracy parameter, and each model was georeferenced using the same set of GCPs. The independent chunks were then combined to create the coherent and comprehensive point cloud within the merged chunk at Ultra High Quality. The georeferencing accuracy is detailed in Table 4, which summarizes the RMSE values derived from both control and check points.
The high-resolution 3D model generated from the UAV survey served as the basis for creating the Digital Surface Model (DSM) and the orthophoto. It was also used to supplement the TLS model in areas that were not captured by that technique’s limited perspective, such as the roof of the tower bell. The georeferenced UAV point cloud is shown in Figure 9a, whereas the orthophoto mosaic, with a resolution of 7.29 mm/pix, is presented in Figure 9b.

3.4. CRP Processing

Image processing was carried out using Agisoft Metashape Pro software version 2.1.0. The same standard SfM pipeline was utilized for the photogrammetric dataset concerning the CRP survey on the Niche, employing the same processing parameters used for the UAV model. For further details, please refer to Section 3.3. The CRP point cloud with the identified GCPs from the TLS model is shown in Figure 10, while Table 5 reports the georeferencing results, specifically the RMSE values calculated from the control points and check points.

3.5. Apple LiDAR Processing

For the LiDAR Apple survey of the Niche, we used the Polycam app. This tool allows users to scan objects by selecting either the LiDAR or ROOM option. The ROOM option not only captures the point cloud of the scanned area but also provides planimetry in DXF format. During the point cloud processing phase, it is possible to choose between several modes: Fast (for quick processing and acquisition verification), Space (optimized for room scans), Object (for scanning individual objects), and Custom. In Custom mode, users can adjust the Depth Range (from 0.1 to 6 m), Voxel Size (ranging from 3 mm to 27 mm), and the percentage of mesh simplification applied. For the scanning of the Niche, the “Space” mode was used. The second step was the registration of the point cloud to ensure a proper comparison with the other georeferenced models of the Niche. This was performed in CloudCompare software, starting with a series of rotations and translations, which were further refined using the Iterative Closest Point (ICP) registration tool based on the Terrestrial Laser Scanning (TLS) model. The model derived from the LiDAR Apple is presented in Figure 11, featuring an average point spacing of 2 mm.

4. Results

This section presents the key results obtained from the various surveying techniques employed during the study. First, the validation of the 360 models of the interior of the bell tower is discussed by comparing the three datasets (Set I, II, and III) to the Terrestrial Laser Scanning (TLS) model. Then, to show the similar dependability of both methods in this particular situation, we compared the outputs produced by Apple LiDAR and Close-Range Photogrammetry with the reference TLS point-cloud for the analysis of the Niche.
Additionally, the geometrical reconstruction of the site is provided through 2D products, including vertical and horizontal sections of the bell tower. Specifically, following the methodology outlined by Lose et al. (2021) [1], these sections were extracted from various sources: the exterior of the tower was obtained from the UAV model, while the interior sections were derived from the TLS and the three datasets of spherical panorama images.

4.1. Validation of the 360 Survey of the Bell Tower Interior

As noted in Section 3.2, we processed three different sets of panoramic images. The datasets validation involved comparing the resulting point cloud with the reference point cloud obtained from Terrestrial Laser Scanning (TLS). The results for these three sets will be presented, focusing on the differences in point cloud density and the statistical parameters derived from the comparisons.
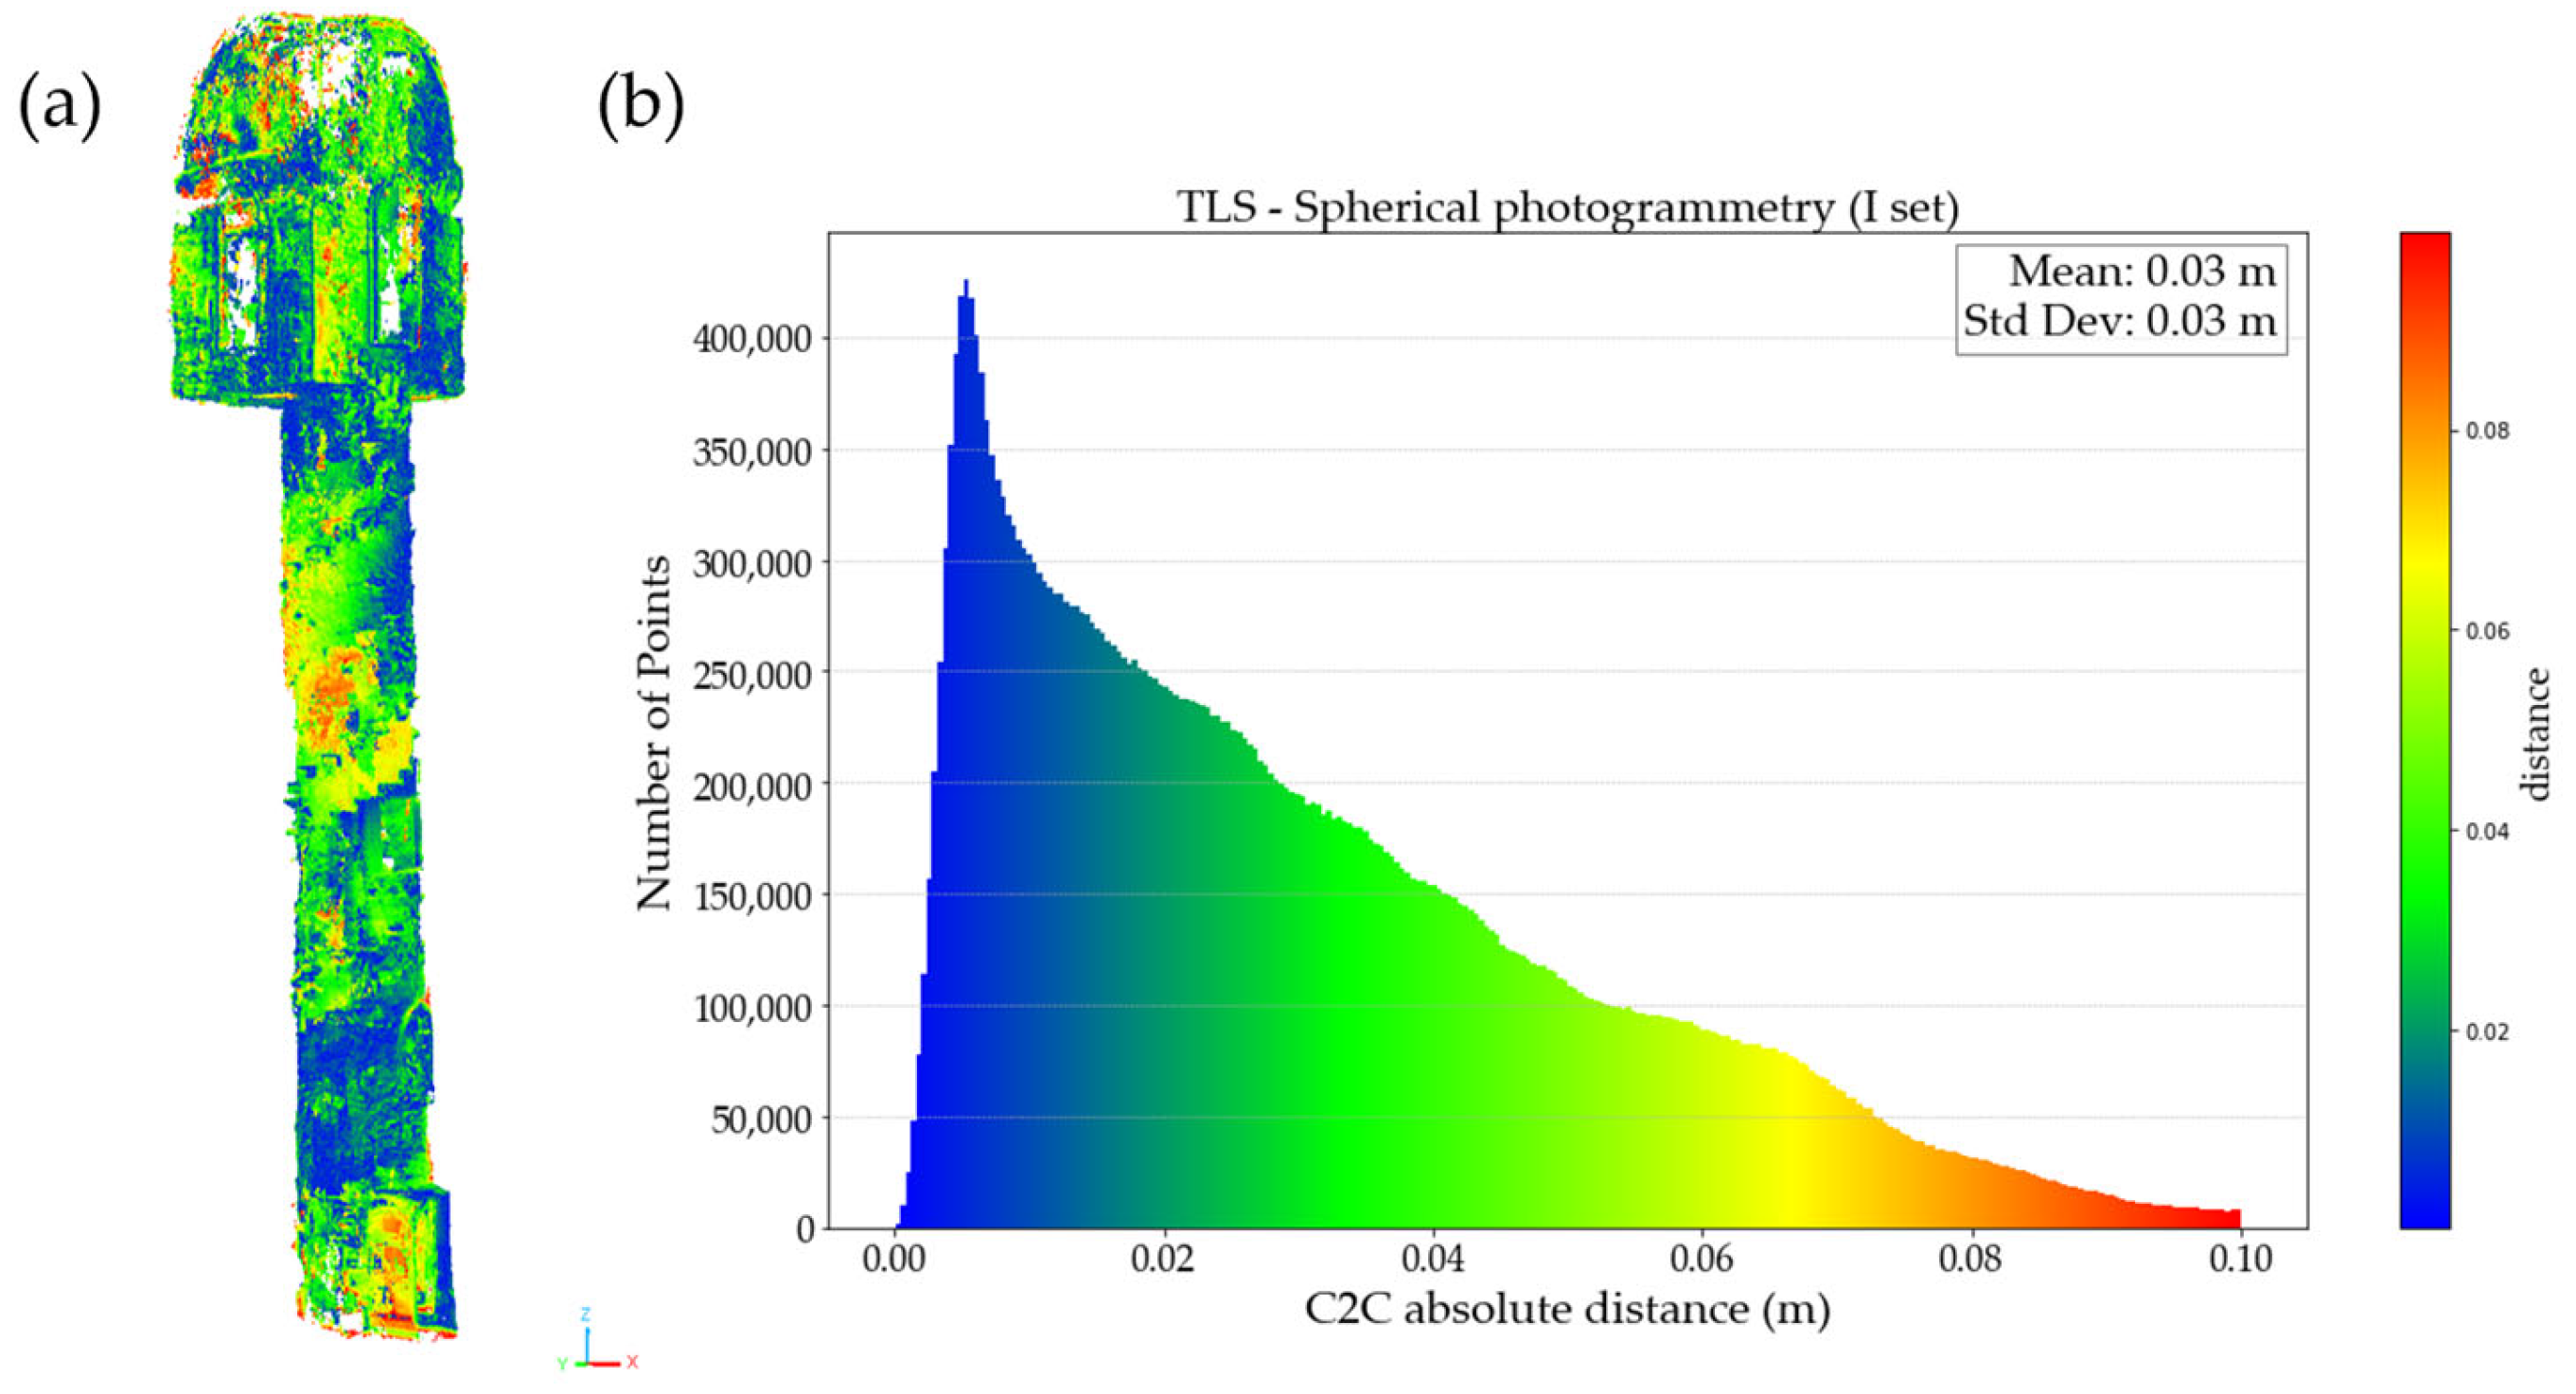
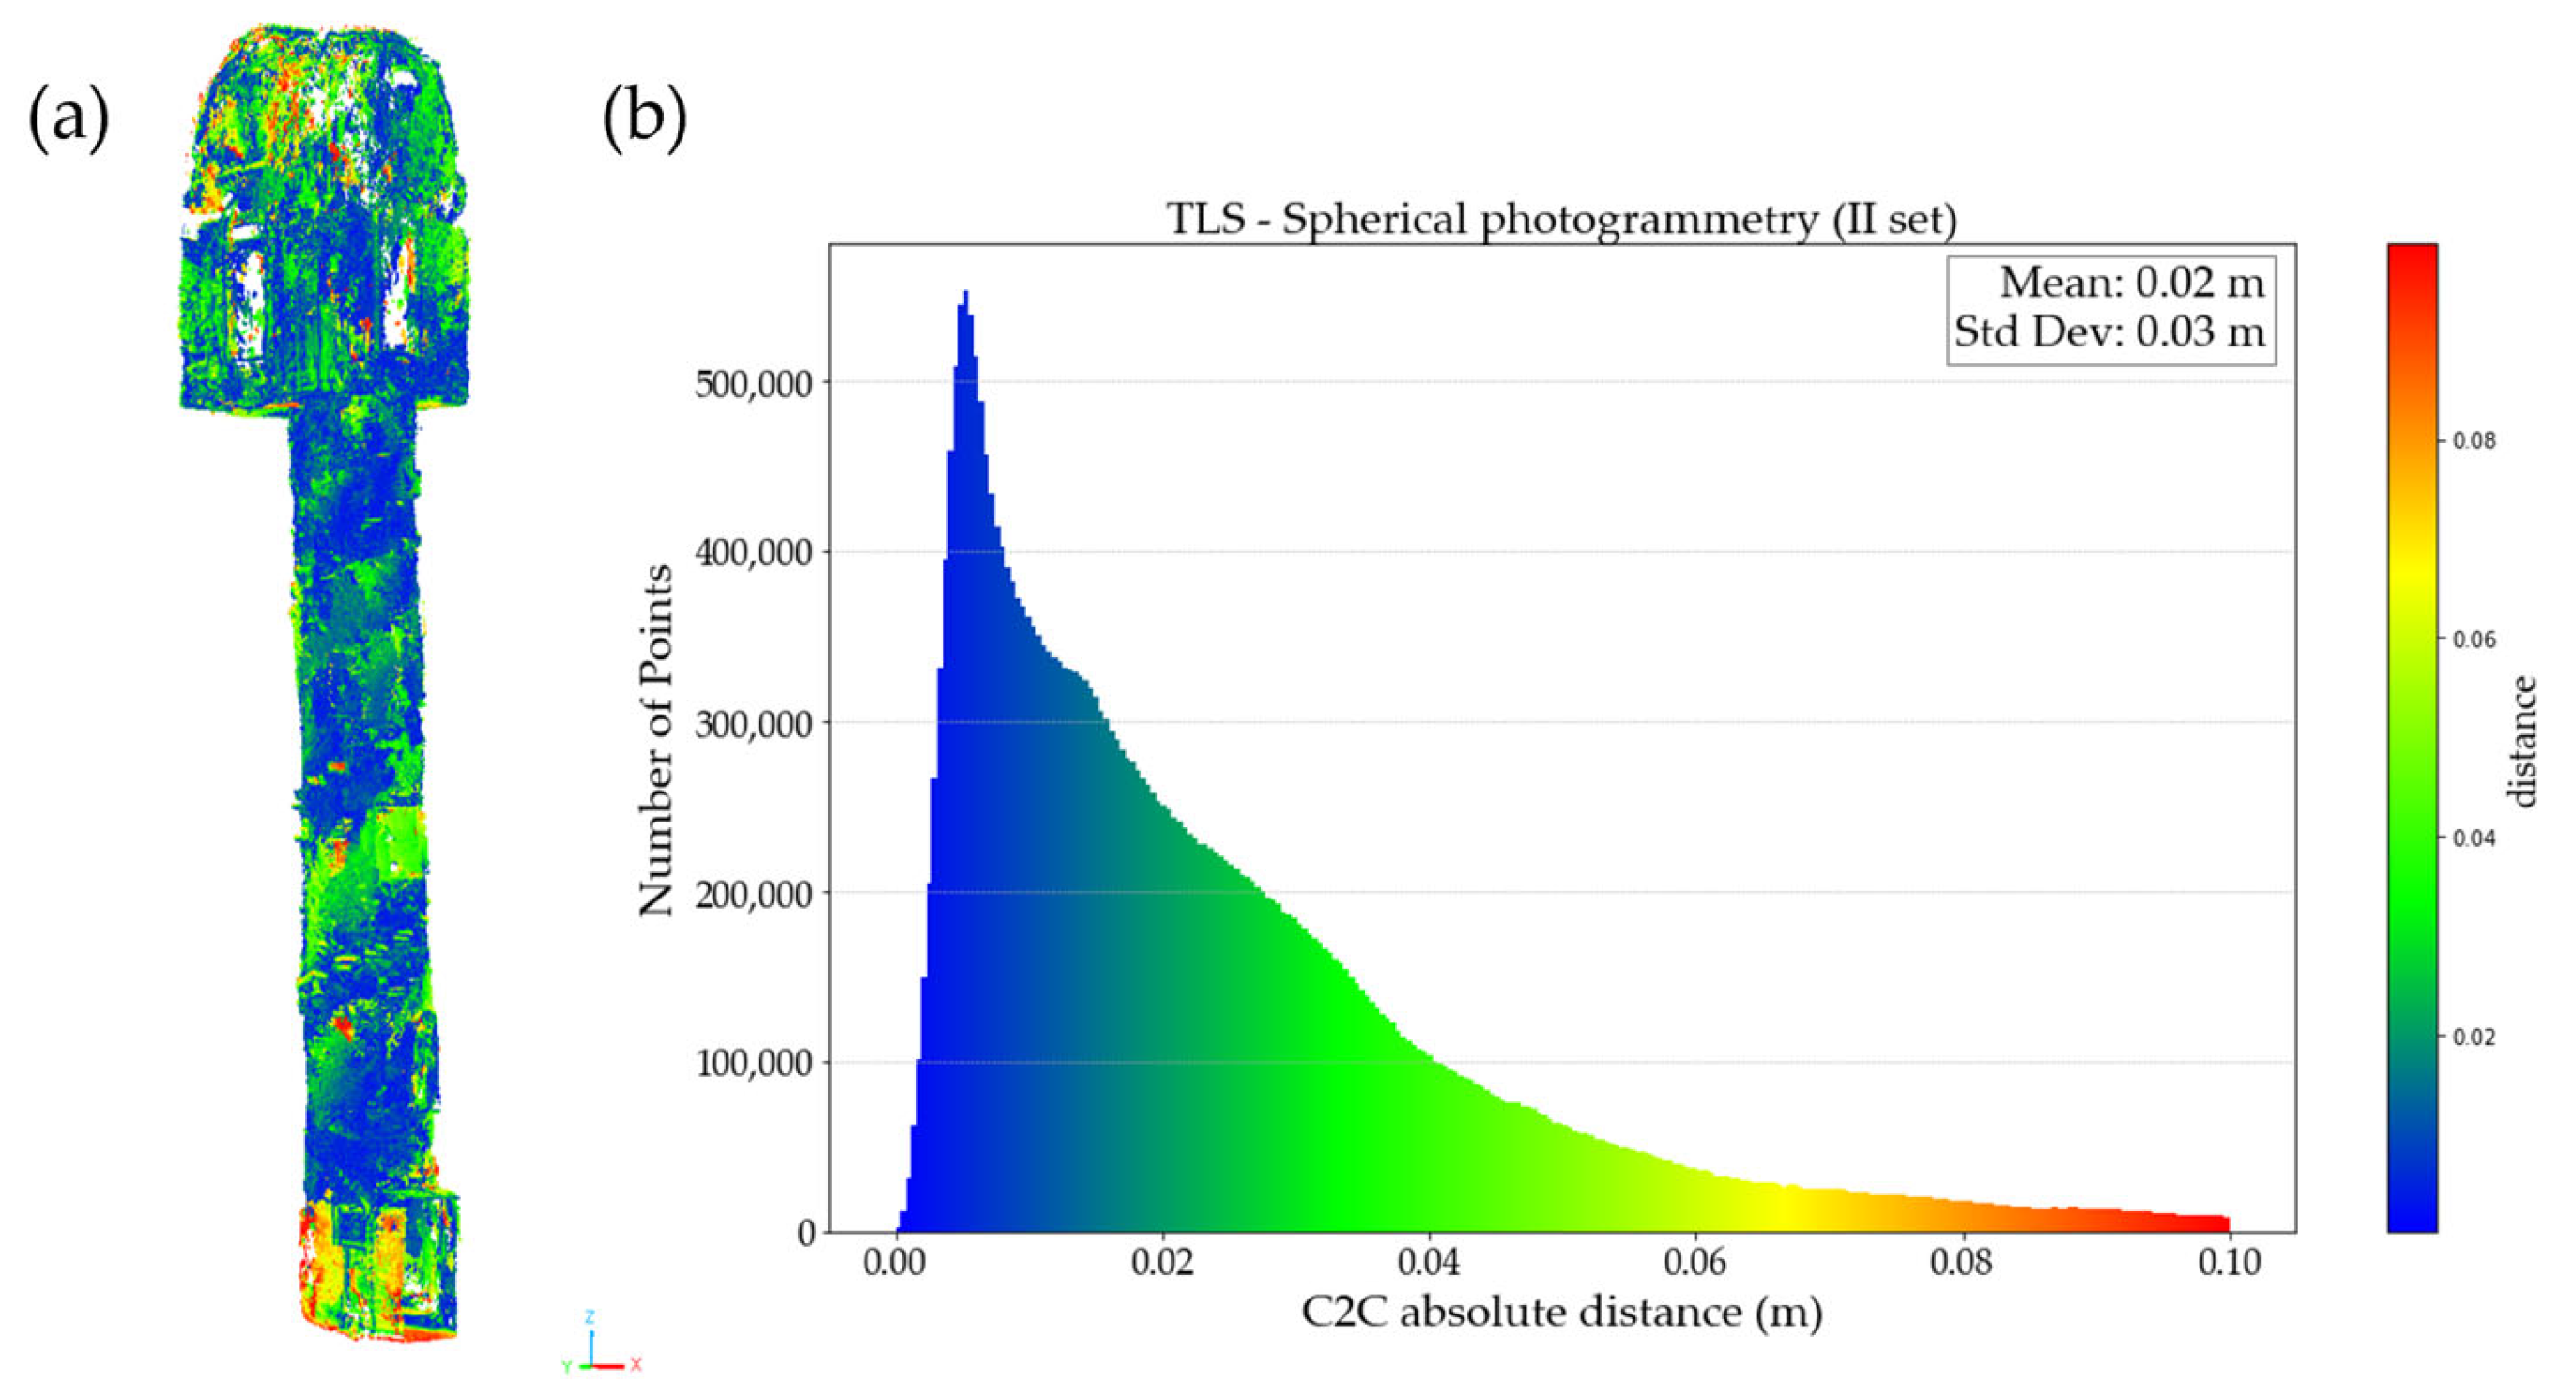
The Cloud-to-Cloud (C2C) distance tool available in Cloud Compare software version 2.14.4 [60] was used for the validation process, setting the TLS model as reference. The results of the C2C analysis considering all components for Sets I, II, and III are shown in Figure 12, Figure 13, and Figure 14, respectively. Each figure displays the colored point cloud (a) and the frequency histogram of the distances with the main statistical parameters (mean and standard deviation) (b). The comparison was performed after cleaning the point clouds and removing isolated points affected by noise during the processing.
By examining the models, color-coded according to C2C distances, critical areas can be identified. The central part of the tower primarily shows distances of up to 3 cm for Sets II and III. However, the model of Set I exhibits some issues in the same area, with distances reaching higher values. Among all the point clouds, the entrance level displays the most significant differences. This is especially evident in Set II, which was conducted at the higher tripod height, potentially missing the lower sections of the floor. Additional issues arise at the top of the tower’s roof. In this area, there is a noticeable lack of density across all three models, which can be attributed to the challenges of capturing the roof from below. This issue is particularly evident in Set I, which was acquired only from a lower tripod height.
Overall, the statistical parameters and frequency histograms indicate that the analyzed datasets consistently align with the TLS model. In particular, the mean value is 3 cm for Set I and III, and 2 cm for Set II.

4.2. Different Surveys on the Niche

The Niche’s point clouds obtained from CRP and Apple LiDAR were compared with the ground-truth TLS model by measuring the Cloud-to-Cloud distance, considering all components, following the same methodology outlined in Section 4.1. Figure 15 illustrates the distribution of values through frequency histograms and presents the key statistical parameters for both Close-Range Photogrammetry (a) and Apple LiDAR (b) models.
The variation in the number of values used for the C2C calculations reflects the differing point densities of the two models: 5 × 10⁶ points for Close-Range Photogrammetry and 3 × 10⁵ points for Apple LiDAR Polycam, representing a difference of one order of magnitude. Besides this, both the shapes of the histograms and the associated statistical parameters indicate very similar scenarios. Notably, the mean differences are 0.9 cm for CRP and 1 cm for Apple LiDAR. The medians are also similar, at 3.0 cm and 2.5 cm, for Close-Range Photogrammetry and Apple LiDAR, respectively. Table 6 shows the percentage of difference values within five bins ranging from 0 to a maximum value of 5 cm. Obtained results further prove the similar level of reliability of the two techniques with respect to the ground truth.

4.3. Sections from Different Techniques

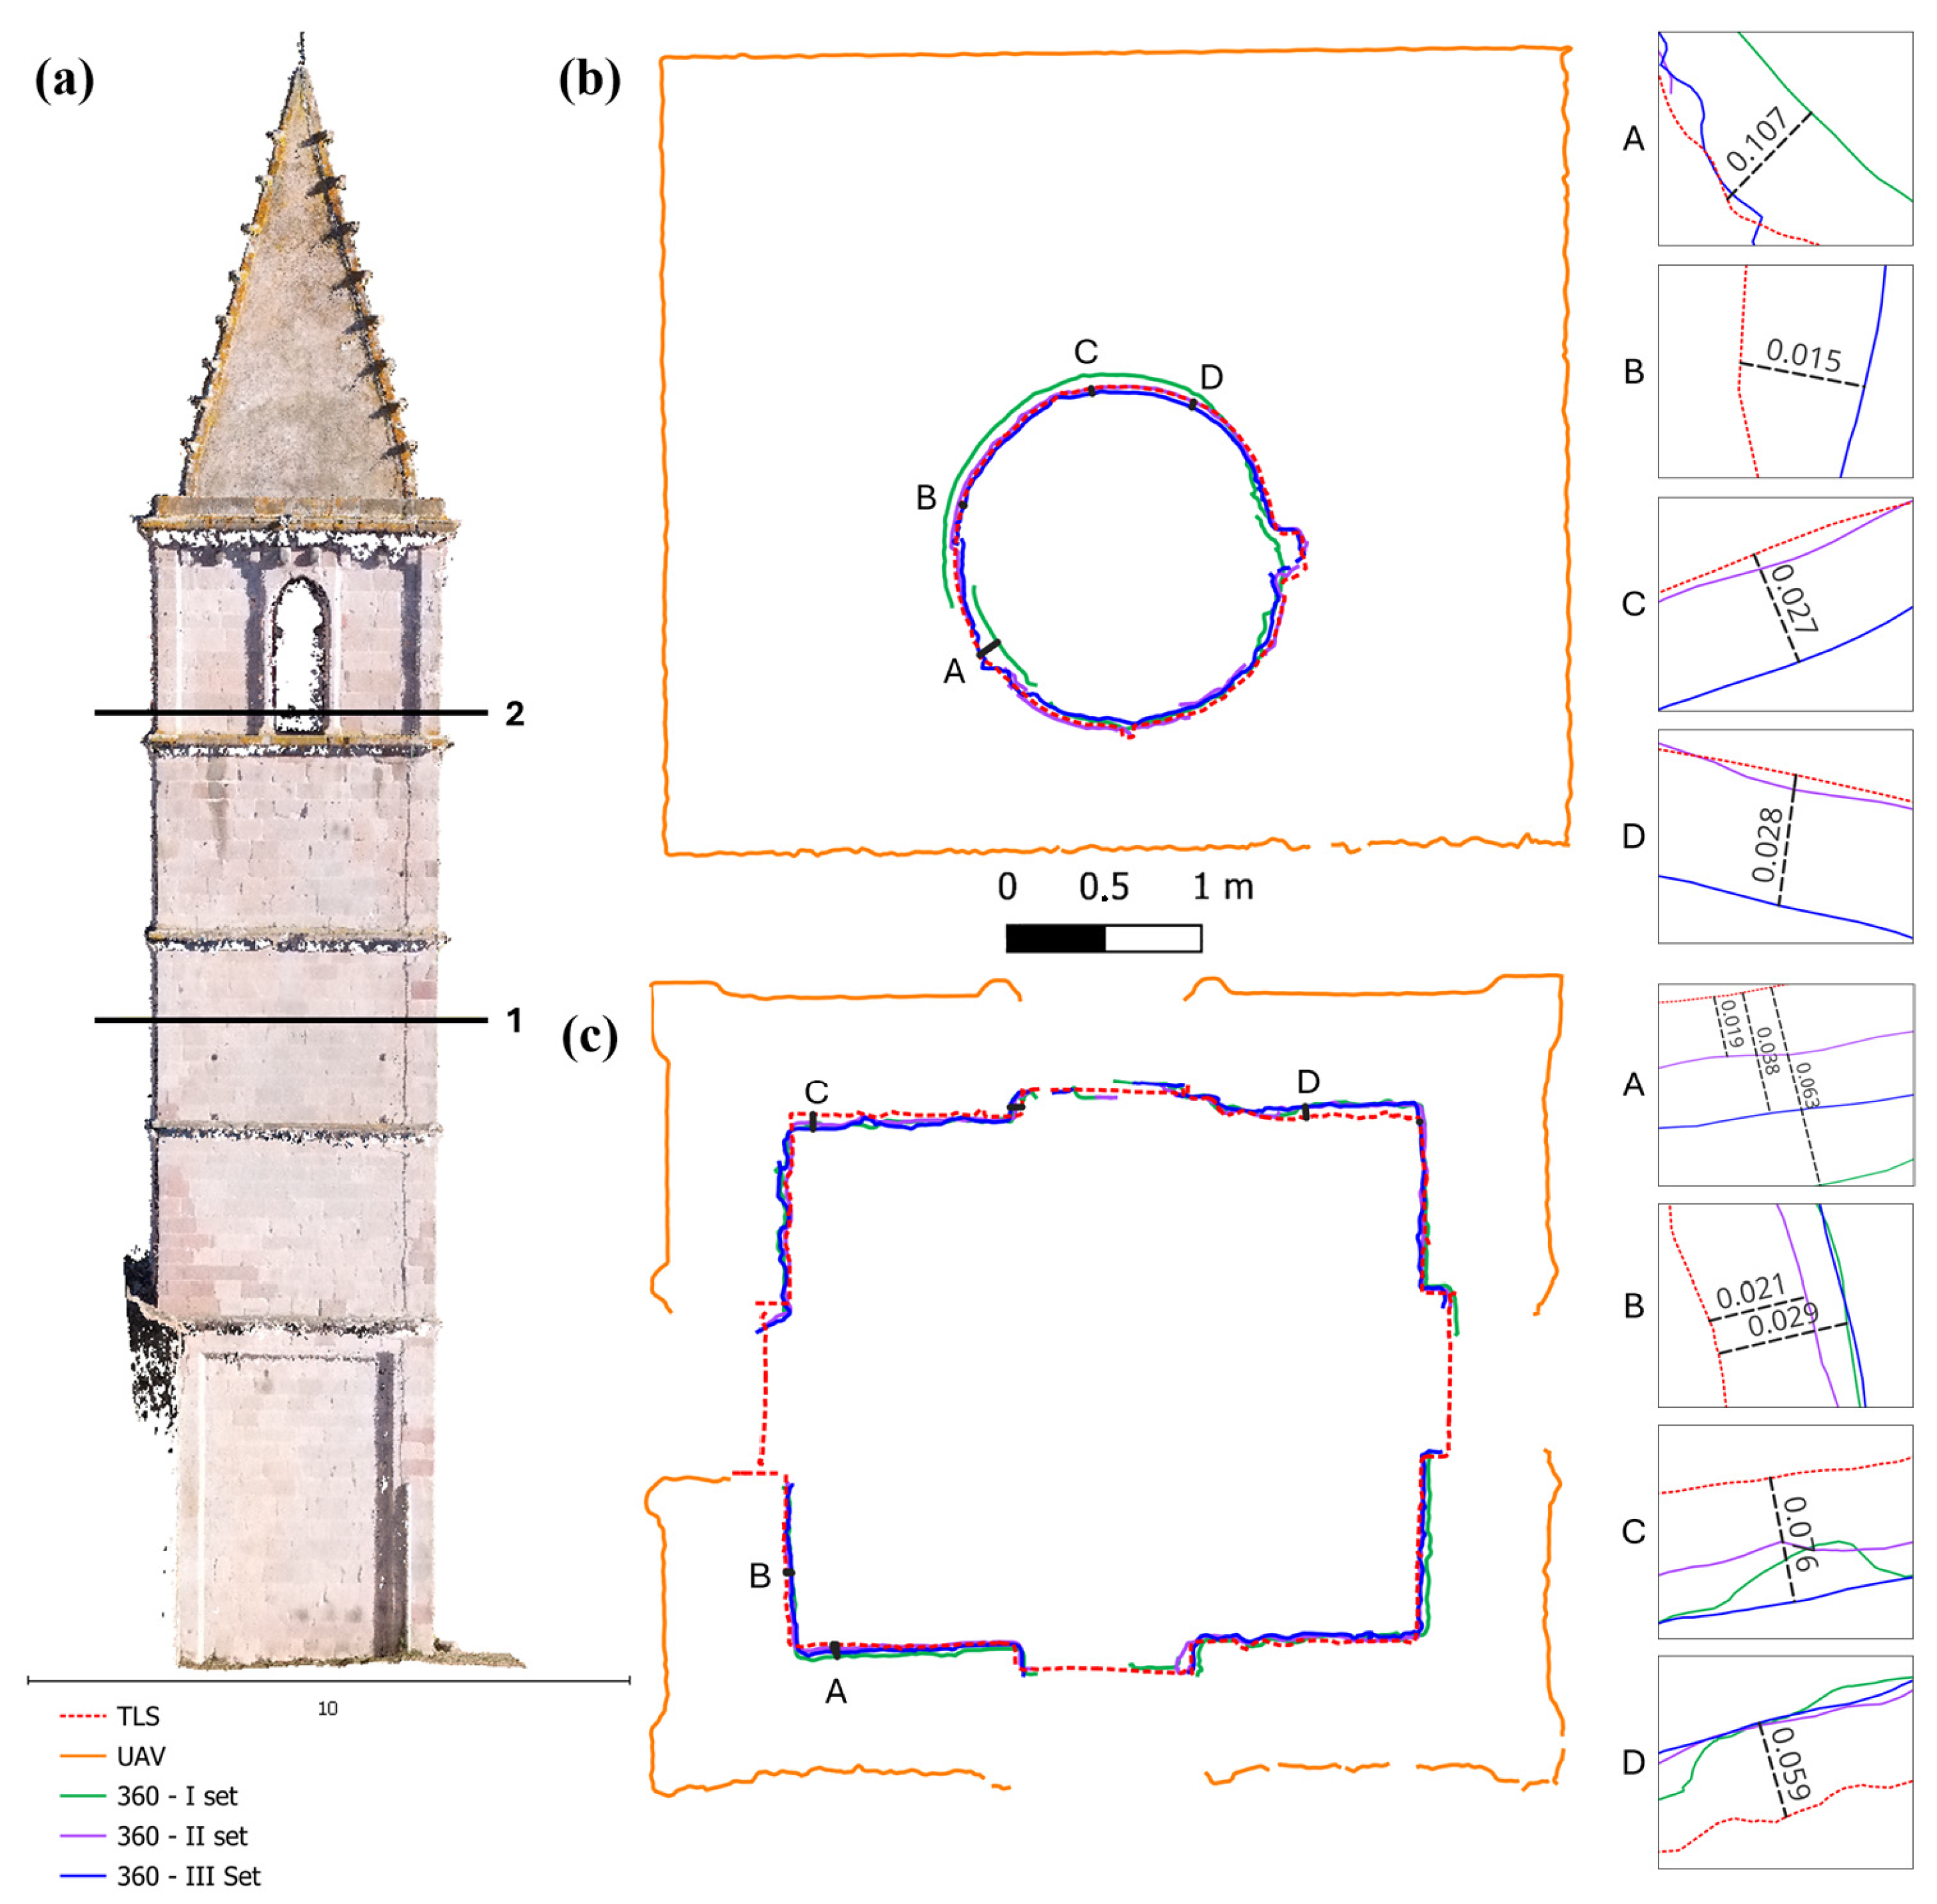
The accuracy of the model obtained from the 360° camera was finally evaluated by extracting horizontal and vertical sections of the bell tower. These sections were extracted from both the Terrestrial Laser Scanning (TLS), the three panoramic datasets, and the UAV model using Reconstructor software. Specifically, two plans at different heights (511.40 m and 516.40 m) were utilized in this phase, resulting in two horizontal sections. Additionally, one vertical cross-section was generated, centered on the external dimensions of the bell tower. Figure 16 illustrates the horizontal sections obtained from different data sources (Figure 16b—Section 1; Figure 16c—Section 2) and indicates the locations of their originating plans on the tower bell (Figure 16a).
In addition to the qualitative objective of this elaboration, which aims to provide a geometric description of the tower bell, we can also quantitatively analyze the distances between the obtained sections. To achieve this, we selected specific points to observe the discrepancies between the TLS and the 360° camera sections, which correspond to the interior of the tower bell. Upon examining Section 1 (Figure 16b), we generally notice that the I set of panoramic images is inconsistent with the others. This section appears incomplete and shows a discrepancy of about 10 cm (point A) in relation to the TLS and the complete 360° camera model (Set III). In contrast, the Set III aligns closely with the TLS model, showing the highest discrepancies of about 2–3 cm at points B, C, and D. Set II performs relatively well overall, though it results in a less complete section compared to Set III.
Similar deductions can be made regarding the higher Section 2 (Figure 16c). In this case, a discrepancy of approximately 6 to 7 cm between the TLS and 360- Set III is observed at isolated points (C, D). However, overall, both Set II and III align well with the TLS. Interestingly, Set II outperforms Set III regarding alignment with the TLS (see points A, B).
The vertical sections are shown in Figure 17. This result also describes a good alignment between the TLS and panoramic sets within the interior of the bell’s tower. However, higher discrepancies (point A) are found at the ground floor (entrance), consistent with the findings described in Section 4.1. In the other areas of the bell tower, the higher observed distances are generally in the range of 5–7 cm (points B, D).
The availability of a detailed georeferenced point-cloud of the bell tower, obtained from the Terrestrial Laser Scanner survey, enabled an additional analysis of its geometric characteristics, particularly regarding the verticality properties [61]. In this context, similar to a plumbline, the ideal vertical direction can be geometrically defined as a line extending from the centroid of the horizontal base section and running parallel to the Z-axis. This vertical line can be used to assess any inclination or lack of verticality in relation to the ideal conditions, by examining its intersection with upper horizontal sections of the structure. Indeed, the condition of verticality is confirmed if the geometric centroid of each horizontal section aligns with the intersections of the reference vertical line with that specific section. Consequently, any deviation between the section’s centroid and the intersection point would suggest a tilt from verticality.
To analyse the configuration of Saint Andrew’s bell tower, ten horizontal sections were extracted from the exterior point cloud using Reconstructor software, by creating horizontal planes at specific height values. The set includes one section at the base (height= 0 m) and additional sections taken at 1 m intervals from 9 m above the base up to 17 m, just below the roof (Figure 18a). The resulting sections were then refined using AutoCAD 2025 to eliminate any anomalies. Subsequently, an automated procedure was developed in Python (version 3.11.5) to perform the analysis, which involves the following steps:
1.
Reading sections as polylines: Sections are analyzed as polylines, and any possible outlier vertices are removed.
2.
Calculating the centroids: The geometric centroid is calculated for each horizontal section, treating it as an enclosed 2D polygon using the Shapely package. The coordinates of the centroids are stored ( N c , E c ). In our georeferenced model, the planimetric coordinates of each centroid are expressed in terms of Northing and Easting, aligned with the ETRF2000-UTM32N reference system.
3.
Establishing the vertical line: The reference vertical line is defined from the centroid of the base section, maintaining the same planimetric coordinates.
4.
Computing intersection points: The intersection point of each horizontal section with the vertical line is calculated using the plane defined by that section, and its coordinates are stored ( N i , E i ).
5.
Assessing the deviation: The differences between each section centroid’s coordinates and the corresponding ideal intersection point on the vertical line are calculated to evaluate any deviations, expressed as (|ΔN|, |ΔE|).
The extracted horizontal sections and the vertical line from the base are shown in Figure 18a. Figure 18b shows the scatter plot of the deviations, with the x and y axes representing the absolute differences (|ΔN|, |ΔE|) in the Easting and Northing coordinates between the centroid of each section and its intersection point with the vertical line. This means that each horizontal section is represented by a point positioned according to the calculated deviation and colored according to its height along the bell tower, with zero corresponding to the base level. All the considered horizontal sections exhibit a similar trend in deviations. However, a notable difference is observed in the magnitude of ΔN and ΔE values: ΔN ranges from 10 to 14 cm, whereas ΔE spans from 0 up to a maximum of approximately 3 cm. No direct correlation is observed between increasing section height and deviation values, which might have suggested a progressive slope of the tower. Considering the height differences between the base and the upper sections, the ΔN values correspond to angular deviations of approximately 0.50°, with an average of 0.62°, while the Easting direction shows a much smaller mean deviation of about 0.02°.

5. Discussion

This study explores the application of various techniques for the geometric reconstruction of a complex cultural heritage site. Indeed, Terrestrial Laser Scanning (TLS) is a well-established method in this field, providing accurate and comprehensive 3D models for both interiors and exteriors. Nevertheless, certain applications may benefit from using complementary techniques.
To achieve high-detail reconstructions in selected enclosed areas, Close Range Photogrammetry and low-cost sensors, such as the LiDAR embedded in Apple devices, were also tested during the survey of a Niche. Cloud-to-cloud (C2C) comparisons using the TLS model as a reference demonstrated excellent alignment for both CRP and Apple LiDAR, with mean distances of approximately 1 cm. While the reliability of both methods was confirmed for this specific context, the CRP point cloud was an order of magnitude denser than the Apple LiDAR model.
These findings align closely with those reported in the literature. In the study by Murtiyoso et al. (2021) [38], the average errors between Apple LiDAR and TLS were reported to range from a few millimeters to a few centimeters, depending on the specific case study. Indoor environments and small objects generally showed average deviations of less than 1 cm, whereas more complex scenarios exhibited higher errors and increased noise due to ambient lighting and geometric complexity [39,40]. In [62], they found an average accuracy of approximately 1.5 cm with a standard deviation of around 3 cm, which are very similar to the values we obtained on the Niche. Overall, our results further support the potential of the Apple LiDAR sensor for capturing medium-sized objects, offering a cost-effective solution with accuracy suitable for architectural documentation [40,63].
For the interior of the bell tower, panoramic photogrammetry was conducted using three image sets: Set I (outward, images captured from a lower tripod height), Set II (return, images from a higher tripod height), and Set III (all images combined). Point clouds and 2D sections were processed for each set to evaluate georeferencing and alignment accuracies. Regarding georeferencing errors, the three image sets provided slightly different results (as seen in Table 3), mainly due to variations in the number of images containing marker projections in Agisoft Metashape. As noted in [1,64], the distribution of GCPs along the acquisition trajectory can significantly influence the final model accuracy. In our observations, Set I generally performed worse than the other sets, whereas Set II exhibited the lowest associated errors.
For the Cloud-to-Cloud (C2C) comparison with the TLS, all three panoramic sets exhibited generally good alignment, with most distances below 5 cm and mean distances of 3 cm for Sets I and III, and 2 cm for Set II. This indicates only minor differences among the sets; however, Set I displayed a wider frequency distribution, reflecting poorer performance. Higher distance values were observed at the entrance and on the roof, particularly for Set I, where the lower tripod height likely made acquisition more challenging. Other elevated distance values may also be attributed to isolated points affected by noise during processing, especially near windows where varying illumination between images impacted both acquisition and processing [1,13].
Comparable studies in cultural heritage applications using low-cost 360° cameras have reported cloud-to-cloud distances of 15–20 cm, and sometimes generating noisy point clouds [15,30,33]. In contrast, high-quality cameras can substantially reduce these errors to the millimeter level [13]
The comparison of the three datasets of panoramic images, acquired from different tripod heights, allows for further analysis in our case. Interestingly, Set III, which combines images from both tripod heights, does not show a significant improvement over the individual sets. This may be explained by the fact that both acquisition heights already captured the majority of the scene geometry with sufficient overlap, so adding additional images from a second height mainly increases redundancy rather than substantially improving coverage or accuracy. There are, however, observable differences among the three sets: Set I generally performs worse overall, while Set II shows slightly higher errors in the lower part of the tower, such as the entrance.
As a final analysis, horizontal and vertical sections were extracted from all the techniques used to survey the bell tower: TLS, UAV, and panoramic photogrammetry (Sets I, II, and III). In this case, the UAV was employed solely to complement the other methods by providing information about the bell tower’s exterior. TLS and 360° camera 2D outputs aligned closely, with the best correspondence seen in Sets II and III. In contrast, as previously noted, Set I produced more incomplete results and exhibited higher discrepancies, reaching up to 10 cm in some areas. Vertical sections allowed precise identification of the issues highlighted by the cloud-to-cloud comparison at the floor level, especially at the entrance of the bell tower. All three panoramic models showed elevated values in this area, indicating alignment problems. Notably, Set I, acquired from a lower tripod height, showed the poorest results, whereas Set II outperformed the set combining all images. In general, this 2D section analysis, following the methodology of [1], confirmed consistent trends in both average discrepancies and localized higher values.
Based on these observations, the optimal configuration of panoramic images lies between Set II and Set III. Since both sets exhibit nearly identical statistical parameters in the cloud-to-cloud comparison with TLS, the choice of the best set can be guided by the completeness of the extracted sections and the point cloud density. In this regard, Set III, which includes all images, produces the densest point cloud, totaling 4.3 × 10⁷ points compared to 3.2 × 10⁷ for Set II.
Future studies on the use of 360° cameras could investigate image sets with varying overlap rates and more distinct acquisition heights, as well as experiments under different lighting conditions, to better understand how these factors affect reconstruction completeness and accuracy.
Moreover, sections from the TLS model were used to assess the verticality of the bell tower, highlighting the importance of these 2D products for multidisciplinary analyses. Leveraging the detailed TLS model, a simple and semi-automatic method was developed to evaluate the verticality. Horizontal sections were manually extracted at regular intervals, and their geometric centroids were then calculated to measure deviations from an ideal vertical line—defined from the base centroid and parallel to the Z-axis. Implemented in Python, this method provides a reproducible means to assess any tilt or deviation from verticality, delivering quantitative data applicable to architectural, structural, and heritage analyses.
Regarding the UAV survey, in this study a photogrammetric approach was employed to supplement the TLS model by capturing the upper floors and roof of the bell tower. Since the model from UAV photogrammetry was not a primary focus of this work, these aspects were not specifically addressed; however, for future developments, testing different flight altitude scenarios, varying image overlap rates, and acquiring oblique images from multiple angles could enhance the methodology and improve data completeness.

6. Conclusions

This study confirms the potential of various geomatic techniques for achieving a comprehensive reconstruction of cultural heritage sites. Panoramic photogrammetry, in particular, can serve as an efficient alternative to TLS for surveying narrow and complex environments, significantly reducing acquisition and processing times. The resulting datasets are also suitable for generating 2D products, which are valuable for producing metric documentation of the structures and can serve as a foundation for further multidisciplinary analyses. However, some limitations arise under low illumination or poor surface texture, which can reduce the quality and completeness of the reconstructed point cloud and potentially affect accuracy. Therefore, while panoramic photogrammetry can be an effective and practical solution, its application should be carefully evaluated based on the specific characteristics of the surveyed environment.
In parallel, Apple LiDAR provides accurate results for capturing limited and highly detailed areas, with a reliability comparable to that of Close-Range Photogrammetry (CRP) in the context of this study.

Author Contributions

Conceptualization, G.V. and E.V.; methodology, G.V. and E.V.; software, E.V.; validation, G.V. and E.V.; formal analysis, E.V.; resources, G.V.; data curation, G.V., E.V.; writing—original draft preparation, E.V.; writing—review and editing, G.V.; supervision, G.V. All authors have read and agreed to the published version of the manuscript.

Funding

This research received no external funding.

Data Availability Statement

The raw data supporting the conclusions of this article will be made available by the authors on request.

Acknowledgments

The authors would like to thank Andrea Dessì and Sergio De Montis for their assistance in conducting the geomatic surveys. Their expertise and dedication significantly contributed to the success of the data acquisition phase.

Conflicts of Interest

The authors declare no conflicts of interest.

References

  1. Teppati Losè, L.; Chiabrando, F.; Giulio Tonolo, F. Documentation of complex environments using 360 cameras. The Santa Marta Belltower in Montanaro. Remote Sens. 2021, 13, 3633. [Google Scholar] [CrossRef]
  2. Letellier, R.; Eppich, R. (Eds.) Recording, Documentation and Information Management for the Conservation of Heritage Places; Routledge: Abingdon, UK, 2015. [Google Scholar]
  3. Pilia, E.; Pirisino, M.S. Towards strategies for the conservation and enhancement of the cultural landscape. The medieval fortified heritage in North-Eastern Sardinia = Strategie per la conservazione e la valorizzazione del paesaggio culturale. Il caso studio del patrimonio fortificato medievale della Sardegna nord-orientale. GRANDI OPERE 2017, 2, 478–483. [Google Scholar]
  4. Grillo, S.M.; Pilia, E.; Vacca, G. Protocols of Knowledge for the Restoration: Documents, Geomatics, Diagnostic. The Case of the Beata Vergine Assunta Basilic in Guasila (Sardinia). In Computational Science and Its Applications–ICCSA 2022 Workshops, Proceedings of the International Conference on Computational Science and Its Applications, Malaga, Spain, 4–7 July 2022; Springer International Publishing: Cham, Switzerland, 2022; pp. 670–685. [Google Scholar]
  5. Georgopoulos, A. Data acquisition for the geometric documentation of cultural heritage. In Mixed Reality and Gamification for Cultural Heritage; Springer: Berlin/Heidelberg, Germany, 2017; pp. 29–73. [Google Scholar]
  6. Delegou, E.T.; Mourgi, G.; Tsilimantou, E.; Ioannidis, C.; Moropoulou, A. A multidisciplinary approach for historic buildings diagnosis: The case study of the Kaisariani monastery. Heritage 2019, 2, 1211–1232. [Google Scholar] [CrossRef]
  7. Vacca, G.; Quaquero, E.; Pili, D.; Brandolini, M. Integrating BIM and GIS data to support the management of large building stocks. Int. Arch. Photogramm. Remote Sens. Spat. Inf. Sci. ISPRS Arch. 2018, 42, 717–724. [Google Scholar] [CrossRef]
  8. Yang, X.; Grussenmeyer, P.; Koehl, M.; Macher, H.; Murtiyoso, A.; Landes, T. Review of built heritage modelling: Integration of HBIM and other information techniques. J. Cult. Herit. 2020, 46, 350–360. [Google Scholar] [CrossRef]
  9. Tobiasz, A.; Markiewicz, J.; Łapiński, S.; Nikel, J.; Kot, P.; Muradov, M. Review of methods for documentation, management, and sustainability of cultural heritage. case study: Museum of king jan iii’s palace at wilanów. Sustainability 2019, 11, 7046. [Google Scholar] [CrossRef]
  10. Alshawabkeh, Y.; El-Khalili, M.; Almasri, E.; Bala’awi, F.; Al-Massarweh, A. Heritage documentation using laser scanner and photogrammetry. The case study of Qasr Al-Abidit, Jordan. Digit. Appl. Archaeol. Cult. Herit. 2020, 16, e00133. [Google Scholar] [CrossRef]
  11. Pritchard, D.; Sperner, J.; Hoepner, S.; Tenschert, R. Terrestrial laser scanning for heritage conservation: The Cologne Cathedral documentation project. ISPRS Ann. Photogramm. Remote Sens. Spat. Inf. Sci. 2017, 4, 213–220. [Google Scholar] [CrossRef]
  12. Napolitano, R.; Hess, M.; Glisic, B. Integrating non-destructive testing, laser scanning, and numerical modeling for damage assessment: The room of the elements. Heritage 2019, 2, 151–168. [Google Scholar] [CrossRef]
  13. Barazzetti, L.; Previtali, M.; Roncoroni, F. Can we use low-cost 360 degree cameras to create accurate 3D models? Int. Arch. Photogramm. Remote Sens. Spat. Inf. Sci. 2018, 42, 69–75. [Google Scholar] [CrossRef]
  14. Furfaro, G.; Tanduo, B.; Fiorini, G.; Guerra, F. Spherical photogrammetry for the survey of historical-cultural heritage: The necropolis of Anghelu Ruju. In Proceedings of the National Conference of Geomatics and Geographic Information ASITA 2022, Genova, Italy, 20–24 June 2022. [Google Scholar]
  15. Herban, S.; Costantino, D.; Alfio, V.S.; Pepe, M. Use of low-cost spherical cameras for the digitisation of cultural heritage structures into 3d point clouds. J. Imaging 2022, 8, 13. [Google Scholar] [CrossRef] [PubMed]
  16. Marcos-González, D.; Álvaro-Tordesillas, A.; López-Bragado, D.; Martínez-Vera, M. Fast and Accurate Documentation of Architectural Heritage with Low-Cost Spherical Panoramic Photographs from 360 Cameras. Int. Arch. Photogramm. Remote Sens. Spat. Inf. Sci. 2023, 48, 1007–1011. [Google Scholar] [CrossRef]
  17. Perfetti, L.; Polari, C.; Fassi, F. Fisheye multi-camera system calibration for surveying narrow and complex architectures. Int. Arch. Photogramm. Remote Sens. Spat. Inf. Sci. 2018, 42, 877–883. [Google Scholar] [CrossRef]
  18. Szeliski, R. Computer Vision: Algorithms and Applications; Springer Nature: Cham, Switzerland, 2022. [Google Scholar]
  19. De Marco, J.; Maset, E.; Cucchiaro, S.; Beinat, A.; Cazorzi, F. Assessing Repeatability and Reproducibility of Structure-from-Motion Photogrammetry for 3D Terrain Mapping of Riverbeds. Remote Sens. 2021, 13, 2572. [Google Scholar] [CrossRef]
  20. Mistretta, F.; Sanna, G.; Stochino, F.; Vacca, G. Structure from motion point clouds for structural monitoring. Remote Sens. 2019, 11, 1940. [Google Scholar] [CrossRef]
  21. Adamopoulos, E.; Rinaudo, F. UAS-based archaeological remote sensing: Review, meta-analysis and state-of-the-art. Drones 2020, 4, 46. [Google Scholar] [CrossRef]
  22. Bitelli, G.; Dellapasqua, M.; Girelli, V.A.; Sanchini, E.; Tini, M.A. 3D Geomatics Techniques for an integrated approach to Cultural Heritage knowledge: The case of San Michele in Acerboli’s Church in Santarcangelo di Romagna. Int. Arch. Photogramm. Remote Sens. Spat. Inf. Sci. 2017, 42, 291–296. [Google Scholar] [CrossRef]
  23. Carraro, F.; Monego, M.; Callegaro, C.; Mazzariol, A.; Perticarini, M.; Menin, A.; Giordano, A. The 3D survey of the roman bridge of San Lorenzo in Padova (Italy): A comparison between SfM and TLS methodologies applied to the arch structure. Int. Arch. Photogramm. Remote Sens. Spat. Inf. Sci. 2019, 42, 255–262. [Google Scholar] [CrossRef]
  24. Georgopoulos, A.; Oikonomou, C.; Adamopoulos, E.; Stathopoulou, E.K. Evaluating unmanned aerial platforms for cultural heritage large scale mapping. Int. Arch. Photogramm. Remote Sens. Spat. Inf. Sci. 2016, 41, 355–362. [Google Scholar] [CrossRef]
  25. Mateus, L.; Fernández, J.; Ferreira, V.; Oliveira, C.; Aguiar, J.; Gago, A.S.; Pernão, J. Terrestrial laser scanning and digital photogrammetry for heritage conservation: Case study of the Historical Walls of Lagos, Portugal. Int. Arch. Photogramm. Remote Sens. Spat. Inf. Sci. 2019, 42, 843–847. [Google Scholar] [CrossRef]
  26. Mateus, L.; Ferreira, V.; Aguiar, J.; Pacheco, P.; Ferreira, J.; Mendes, C.; Silva, A. The role of 3D documentation for restoration interventions. The case study of Valflores in Loures, Portugal. Int. Arch. Photogramm. Remote Sens. Spat. Inf. Sci. 2020, 44, 381–388. [Google Scholar] [CrossRef]
  27. Sestras, P.; Roșca, S.; Bilașco, Ș.; Naș, S.; Buru, S.M.; Kovacs, L.; Sestras, A.F. Feasibility assessments using unmanned aerial vehicle technology in heritage buildings: Rehabilitation-restoration, spatial analysis and tourism potential analysis. Sensors 2020, 20, 2054. [Google Scholar] [CrossRef]
  28. Jiang, S.; You, K.; Li, Y.; Weng, D.; Chen, W. 3D reconstruction of spherical images: A review of techniques, applications, and prospects. Geo-Spat. Inf. Sci. 2024, 27, 1959–1988. [Google Scholar] [CrossRef]
  29. Mandelli, A.; Fassi, F.; Perfetti, L.; Polari, C. Testing different survey techniques to model architectonic narrow spaces. Int. Arch. Photogramm. Remote Sens. Spat. Inf. Sci. 2017, 42, 505–511. [Google Scholar] [CrossRef]
  30. Murtiyoso, A.; Grussenmeyer, P.; Suwardhi, D. Technical considerations in Low-Cost heritage documentation. Int. Arch. Photogramm. Remote Sens. Spat. Inf. Sci. 2019, 42, 225–232. [Google Scholar] [CrossRef]
  31. Fangi, G.; Nardinocchi, C. Photogrammetric processing of spherical panoramas. Photogramm. Rec. 2013, 28, 293–311. [Google Scholar] [CrossRef]
  32. Kwiatek, K.; Tokarczyk, R. Immersive photogrammetry in 3D modelling. Geomat. Environ. Eng. 2015, 9, 51–62. [Google Scholar] [CrossRef]
  33. Janiszewski, M.; Torkan, M.; Uotinen, L.; Rinne, M. Rapid photogrammetry with a 360-degree camera for tunnel mapping. Remote Sens. 2022, 14, 5494. [Google Scholar] [CrossRef]
  34. Pérez-García, J.L.; Gómez-López, J.M.; Mozas-Calvache, A.T.; Delgado-García, J. Analysis of the photogrammetric use of 360-degree cameras in complex heritage-related scenes: Case of the Necropolis of Qubbet el-Hawa (Aswan Egypt). Sensors 2024, 24, 2268. [Google Scholar] [CrossRef]
  35. Perfetti, L.; Spettu, F.; Achille, C.; Fassi, F.; Navillod, C.; Cerutti, C. A Multi-Sensor Approach to Survey Complex Architectures Supported by Multi-Camera Photogrammetry. Int. Arch. Photogramm. Remote Sens. Spat. Inf. Sci. 2023, 48, 1209–1216. [Google Scholar] [CrossRef]
  36. Masciotta, M.G.; Sanchez-Aparicio, L.J.; Oliveira, D.V.; Gonzalez-Aguilera, D. Integration of laser scanning technologies and 360° photography for the digital documentation and management of cultural heritage buildings. Int. J. Archit. Herit. 2023, 17, 56–75. [Google Scholar] [CrossRef]
  37. Vacca, G. 3D Survey with Apple LiDAR Sensor—Test and Assessment for Architectural and Cultural Heritage. Heritage 2023, 6, 1476–1501. [Google Scholar] [CrossRef]
  38. Murtiyoso, A.; Grussenmeyer, P.; Landes, T.; Macher, H. First assessments into the use of commercial-grade solid state lidar for low cost heritage documentation. Int. Arch. Photogramm. Remote Sens. Spat. Inf. Sci. 2021, 43, 599–604. [Google Scholar] [CrossRef]
  39. Luetzenburg, G.; Kroon, A.; Bjørk, A.A. Evaluation of the Apple iPhone 12 Pro LiDAR for an application in geosciences. Sci. Rep. 2021, 11, 22221. [Google Scholar] [CrossRef] [PubMed]
  40. Teppati Losè, L.; Spreafico, A.; Chiabrando, F.; Giulio Tonolo, F. Apple LiDAR sensor for 3D surveying: Tests and results in the cultural heritage domain. Remote Sens. 2022, 14, 4157. [Google Scholar] [CrossRef]
  41. Jo, Y.H.; Hong, S. Three-dimensional digital documentation of cultural heritage site based on the convergence of terrestrial laser scanning and unmanned aerial vehicle photogrammetry. ISPRS Int. J. Geo-Inf. 2019, 8, 53. [Google Scholar] [CrossRef]
  42. Il Portale di Orani. Available online: http://www.orani.it/torre-aragonese-di-orani.php (accessed on 1 February 2025).
  43. Naitza, S. Architettura dal Tardo ‘600 al Classicismo Purista, 1st ed.; Ilisso: Nuoro, Italy, 1992. [Google Scholar]
  44. Scolaro, A.M. Orani; Ex Chiesa di Sant’Andrea: Cesi, Italy, 2015; pp. 147–150. [Google Scholar]
  45. Angius, V. Orani. In Dizionario Geografico Storico-Statistico-Commerciale Degli Stati di S.M. il Re di Sardegna; Casalis, G., Ed.; G. Maspero: Torino, Italy, 1845; Volume XIII, pp. 193–209. [Google Scholar]
  46. Bonfante, A.; Carta, G. Santuari e Chiese Campestri della Diocesi di Nuoro; Ilisso: Nuoro, Italy, 1992; pp. 156–157. [Google Scholar]
  47. Segni Pulvirenti, F.; Sari, A. Architettura Tardogotica e D’influsso Rinascimentale; Ilisso: Nuoro, Italy, 1994. [Google Scholar]
  48. Sarnet. Web Server della Rete di Stazioni Permanenti Della Sardegna. Available online: www.sarnet.it/servizi.html (accessed on 1 January 2025).
  49. Centro Interregionale per I Sistemi Informatici Geografici e Statistici in Liquidazione. Trasformazioni di Coordinate—Il Software ConveRgo. Available online: https://www.cisis.it/?page_id=3214 (accessed on 1 January 2025).
  50. International Service for the Geoid (ISG). Italy (ITALGEO05). Available online: https://www.isgeoid.polimi.it/Geoid/Europe/Italy/italgeo05_g.html (accessed on 1 January 2025).
  51. Polycam Inc. Polycam 3D Scanner [Mobile Application Software]; Polycam Inc.: San Francisco, CA, USA, 2023; Available online: https://www.polycam.com (accessed on 1 September 2025).
  52. Yole Développement. SP20557: Apple iPad Pro LiDAR Module [Flyer]. Available online: https://medias.yolegroup.com/uploads/2020/06/SP20557-Yole-Apple-iPad-pro-Lidar-Module_flyer.pdf (accessed on 1 September 2025).
  53. García-Gómez, P.; Royo, S.; Rodrigo, N.; Casas, J.R. Geometric model and calibration method for a solid-state LiDAR. Sensors 2020, 20, 2898. [Google Scholar] [CrossRef]
  54. Wang, D.; Watkins, C.; Xie, H. MEMS mirrors for LiDAR: A review. Micromachines 2020, 11, 456. [Google Scholar] [CrossRef]
  55. Aijazi, A.K.; Malaterre, L.; Trassoudaine, L.; Checchin, P. Systematic evaluation and characterization of 3d solid state lidar sensors for autonomous ground vehicles. Int. Arch. Photogramm. Remote Sens. Spat. Inf. Sci. 2020, 43, 199–203. [Google Scholar] [CrossRef]
  56. Goldsmith, T.; Smith, J. Reconstructor [Software], Version 4.4.2; DataSoft Solutions: Karachi, Pakistan, 2023. Available online: https://gexcel.it/en/software/reconstructor (accessed on 1 September 2025).
  57. He, Y.; Liang, B.; Yang, J.; Li, S.; He, J. An iterative closest points algorithm for registration of 3D laser scanner point clouds with geometric features. Sensors 2017, 17, 1862. [Google Scholar] [CrossRef]
  58. Szeliski, R.; Shum, H.Y. Creating full view panoramic image mosaics and environment maps. In Seminal Graphics Papers: Pushing the Boundaries; ACM Digital Library: New York, NY, USA, 2023; Volume 2, pp. 653–660. [Google Scholar]
  59. Agisoft LLC. Agisoft Metashape Professional Edition [Software], Version 2.1.0; Agisoft LLC: St. Petersburg, Russia, 2025. Available online: https://www.agisoft.com (accessed on 1 September 2025).
  60. CloudCompare, Version 2.14.4. GPL Software. Telecom ParisTech: Grenoble, France, 2025. Available online: http://www.cloudcompare.org (accessed on 1 January 2025).
  61. Deidda, M.; Vacca, G. Tecniche di rilievo Laser Scanner a supporto del progetto di restauro conservativo dei beni culturali. L’esempio del Castello di Siviller e del campanile di Mores. Boll. Soc. Ital. Fotogramm. Topogr. 2012, 4, 23–39. [Google Scholar]
  62. Abdel-Majeed, H.M.; Shaker, I.F.; Abdel-Wahab, A.M.; Awad, A.A.D.I. Indoor mapping accuracy comparison between the apple devices’ LiDAR sensor and terrestrial laser Scanner. HBRC J. 2024, 20, 915–931. [Google Scholar] [CrossRef]
  63. Abbas, S.F.; Abed, F.M. Revolutionizing Depth Sensing: A Review study of Apple LiDAR sensor for as-built scanning Applications. J. Eng. 2024, 30, 175–199. [Google Scholar] [CrossRef]
  64. Bruno, N.; Perfetti, L.; Fassi, F.; Roncella, R. Photogrammetric survey of narrow spaces in cultural heritage: Comparison of two multi-camera approaches. Int. Arch. Photogramm. Remote Sens. Spat. Inf. Sci. 2024, 48, 87–94. [Google Scholar] [CrossRef]
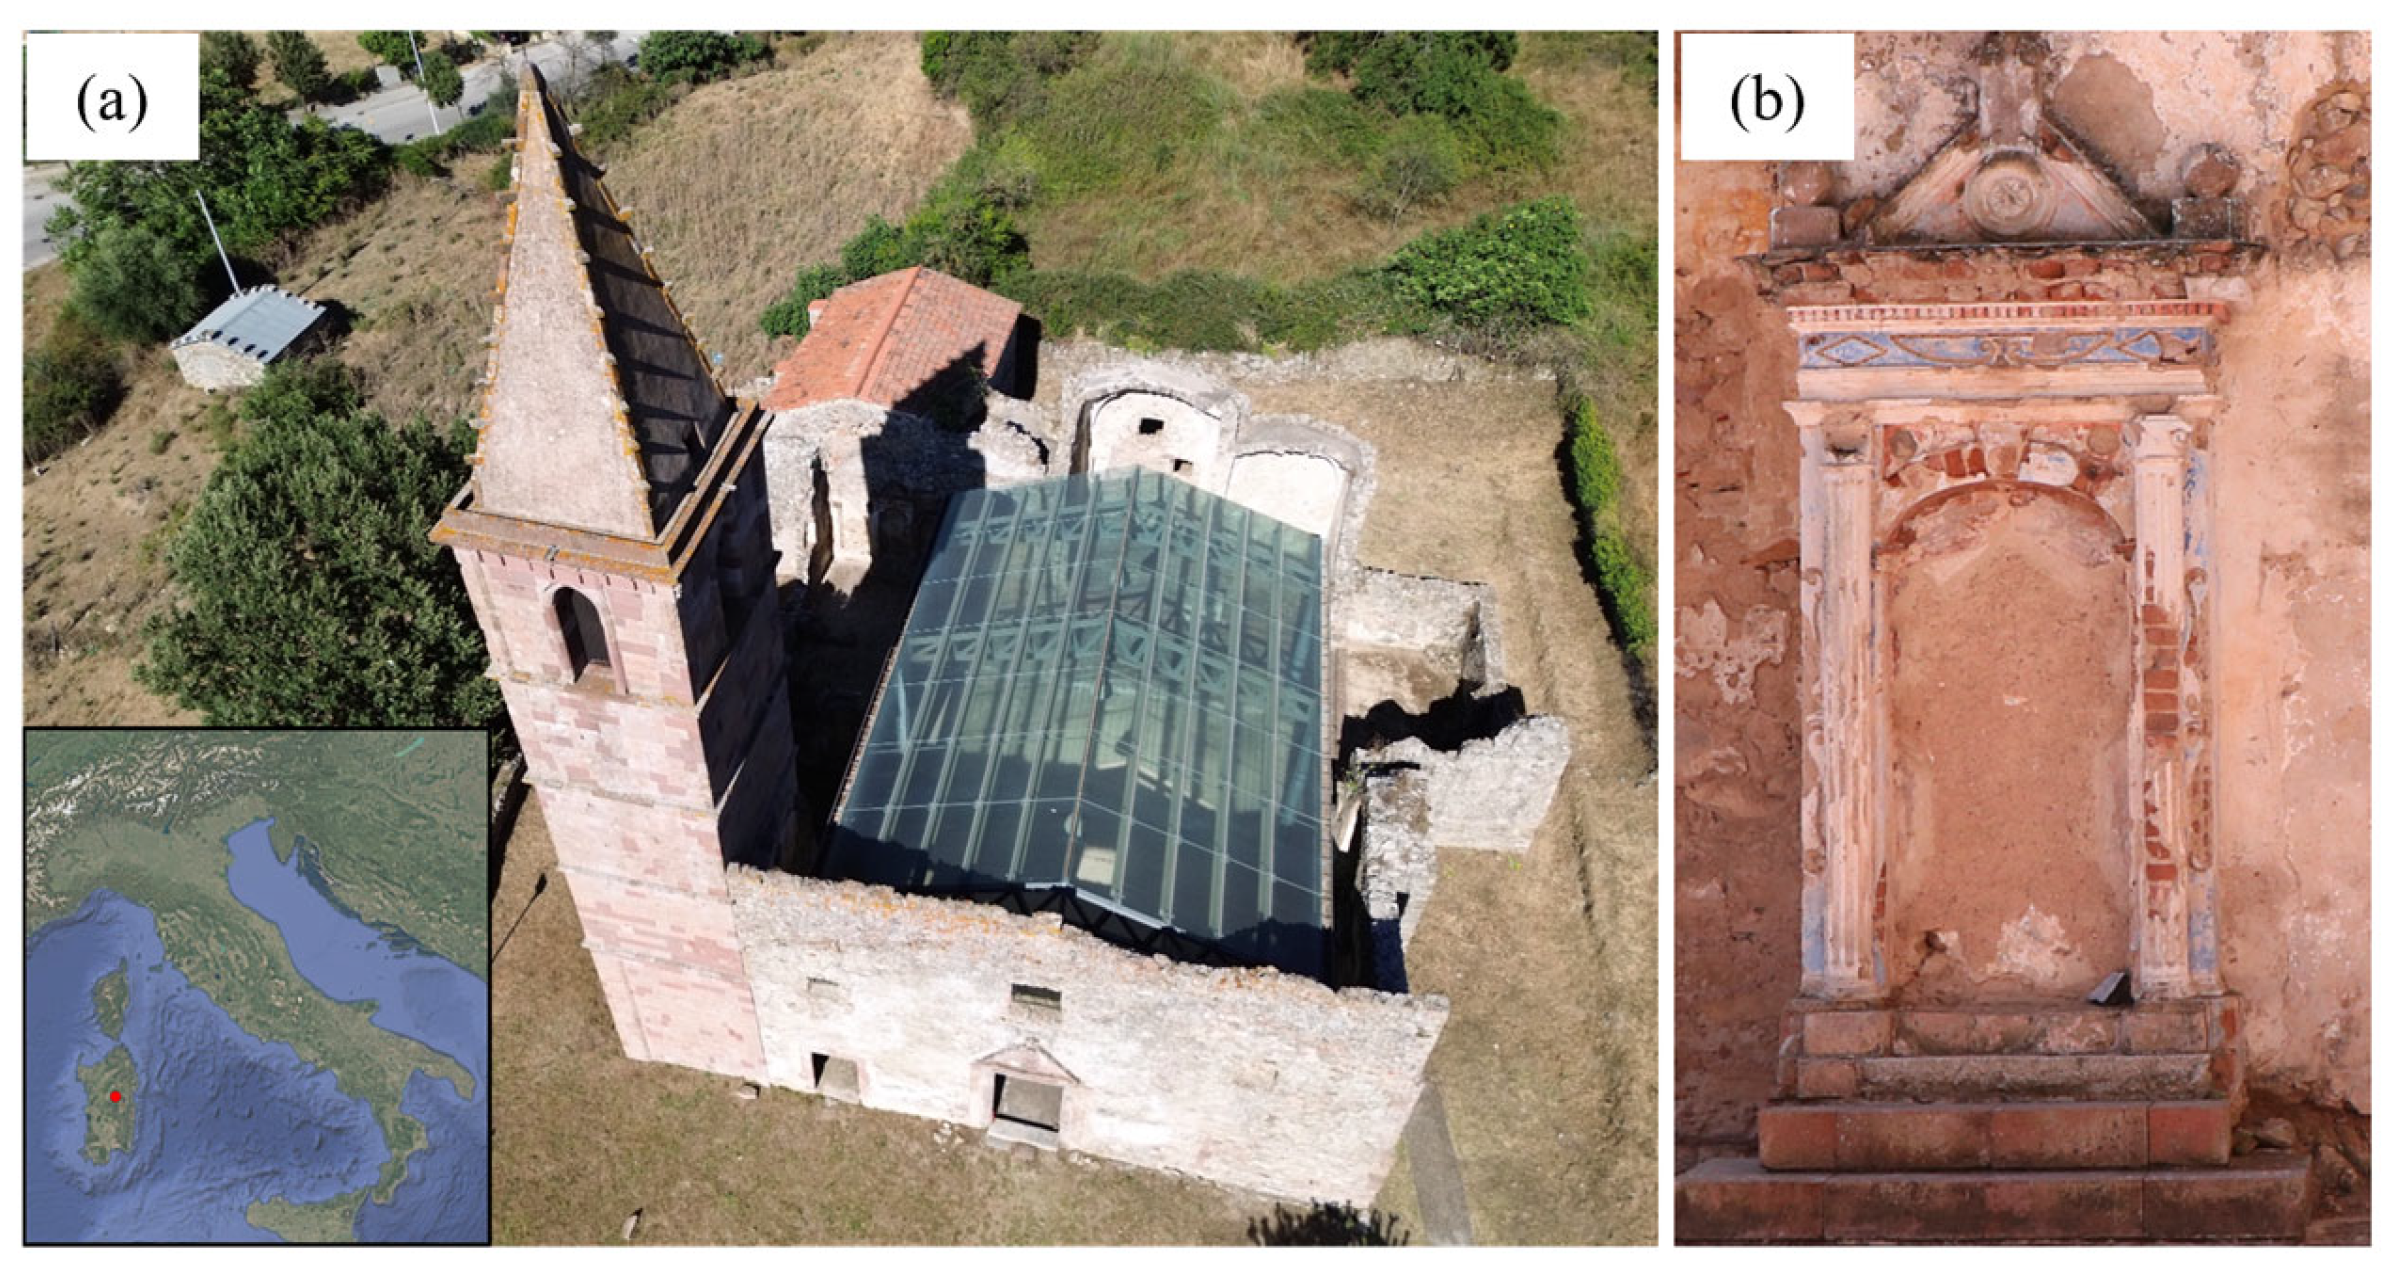
Figure 1. Church of Saint Andrew: aerial view of the site showing the bell tower and the courtyard (a), and the niche (b).
Remotesensing 17 03376 g001
Figure 2. TLS point clouds: scheme and numbers of TLS stations in the entire site (a), and for the bell tower’s interior (b).
Remotesensing 17 03376 g002
Figure 3. Location of the GCPs acquired using GNSS-NRTK for the georeferencing process (a); example of a circular target ((b)—Source: www.lgtech.it/). Grid coordinates aligned to the ETRF2000-UTM32N reference system (EPSG: 6707).
Remotesensing 17 03376 g003
Figure 4. The Insta360 OneRS spherical camera (a); the camera and its tripod inside the bell tower during image acquisition (b).
Remotesensing 17 03376 g004
Figure 5. Survey with the 360° camera: scheme of the camera positions.
Remotesensing 17 03376 g005
Figure 6. Camera locations during the UAV photogrammetric survey.
Remotesensing 17 03376 g006
Figure 7. Comprehensive TLS model of the church (a) and bell tower (b).
Remotesensing 17 03376 g007
Figure 8. 360 Survey of the bell tower: point cloud from Set III of panoramic images with positions of the selected Ground Control Points (flags) and Check Points (pins).
Remotesensing 17 03376 g008
Figure 9. Georeferenced UAV point cloud (a) and orthophoto mosaic (b).
Remotesensing 17 03376 g009
Figure 10. Position of the identified markers on the CRP point cloud.
Remotesensing 17 03376 g010
Figure 11. Point cloud obtained from the LiDAR Apple; scale expressed in meters.
Remotesensing 17 03376 g011
Figure 12. Set I: Results of the C2C analysis in terms of colored point cloud categorized by distance values (a), and frequency histogram (b).
Remotesensing 17 03376 g012
Figure 13. Set II: Results of the C2C analysis in terms of colored point cloud categorized by distance values (a), and frequency histogram (b).
Remotesensing 17 03376 g013
Figure 14. Set III: Results of the C2C analysis in terms of colored point cloud categorized by distance values (a), and frequency histogram (b).
Remotesensing 17 03376 g014
Figure 15. Cloud-to-cloud distance analysis on the Niche: (a) comparison between TLS and CRP; (b) comparison between TLS and Apple LiDAR models. Frequency histograms of the distance values are displayed along with the key related statistics. All values are expressed in centimetres.
Remotesensing 17 03376 g015
Figure 16. Positions of the horizontal plans (a) and extracted sections (b,c) with scale expressed in meters. Distances between sections from different techniques are presented in (AD) with values expressed in meters.
Remotesensing 17 03376 g016
Figure 17. Positions of the vertical plan (a) and extracted sections (b) with scale expressed in meters. Distances between sections from different techniques are presented in (AD) with values expressed in meters.
Remotesensing 17 03376 g017
Figure 18. Extracted horizontal sections of the tower (blue lines) and vertical line from the base (red line) (a); Computed deviation from the verticality (b).
Remotesensing 17 03376 g018
Table 1. Technical characteristics of Insta360 OneRS camera.
SensorImage ResDimensions35 mm Equiv. Focal Length
Dual 1” sensors6528 × 3264 (2:1)52.4 × 48.6 × 49.4 mm7.2 mm
Table 2. Results of the registration of the TLS dataset.
Average scan2scan Residuals (m)Mean Georeferencing Error (m)
0.00150.0186
Table 3. RMSE values for control points and check points in the Panoramic Photogrammetry datasets. X, Y, and Z represent Easting, Northing, and Altitude, respectively. Values are expressed in centimetres.
SetTypenX Error (cm)Y Error (cm)Z Error (cm)Total
(cm)
Image
(pix)
I
outward
Control points202.943.373.825.8811.43
Check points173.454.556.588.716.78
IIControl points202.701.841.403.5513.78
returnCheck points173.163.264.266.2310.83
III
all images
Control points202.152.533.144.5713.54
Check points173.284.006.087.9911.57
Table 4. RMSE values for control points and check points in the UAV dataset. X, Y, and Z represent Easting, Northing, and Altitude, respectively. Values are expressed in centimetres.
TypenX Error (cm)Y Error (cm)Z Error (cm)Total
(cm)
Image
(pix)
Control points40.620.491.471.671.02
Check points11.202.430.902.861.79
Table 5. RMSE values for control points and check points in the CRP dataset. X, Y, and Z represent Easting, Northing, and Altitude, respectively. Values are expressed in millimetres.
TypenX Error (mm)Y Error (mm)Z Error (mm)Total
(mm)
Image
(pix)
Control points54.002.142.715.281.12
Check points15.500.450.815.570.60
Table 6. C2C Analysis: percentages of values within different distance ranges.
RangeCRPApple LiDAR
0–1 cm64.68%55.71%
1–2 cm28.02%34.67%
2–3 cm5.04%7.34%
3–4 cm0.54%0.76%
4–5 cm0.03%0.03%
Disclaimer/Publisher’s Note: The statements, opinions and data contained in all publications are solely those of the individual author(s) and contributor(s) and not of MDPI and/or the editor(s). MDPI and/or the editor(s) disclaim responsibility for any injury to people or property resulting from any ideas, methods, instructions or products referred to in the content.