Article

Final Implementation and Performance of the Cheia Space Object Tracking Radar

1
Department of Devices, Circuits and Electronic Architectures, Faculty of Electronics, Telecommunications, and Information Technology, National University of Science and Technology Politehnica Bucharest, 060042 Bucharest, Romania
2
RARTEL SA Bucharest, 011061 Bucharest, Romania
*
Author to whom correspondence should be addressed.
Remote Sens. 2025, 17(19), 3322; https://doi.org/10.3390/rs17193322 (registering DOI)
Submission received: 27 July 2025 / Revised: 15 September 2025 / Accepted: 18 September 2025 / Published: 28 September 2025

Abstract

Highlights

What are the main findings?
  • Successful retrofit of two 32 m Cassegrain Intelsat antennas into a fully operational C-band LFMCW radar for space object tracking.
  • Demonstrated capability to detect and track objects with radar cross-sections as low as 0.02 m 2 up to 1200 km with 2.5 kW transmitted power, validated through ESA-supervised campaigns.
What is the implication of the main finding?
  • Shows that re-purposing legacy satellite communication infrastructure is a cost-effective approach for EU SST-compliant radar networks.
  • Confirms that LFMCW radar architectures can achieve high accuracy and robustness even in electromagnetically congested environments with adequate digital processing.

Abstract

This paper presents the final implemented design and performance evaluation of the ground-based C-band Cheia radar system, developed to enhance Romania’s contribution to the EU Space Surveillance and Tracking (EU SST) network. All data used for performance analysis are real-time, real-life measurements of true spatial test objects orbiting Earth. The radar is based on two decommissioned 32 m satellite communication antennas already present at the Cheia Satellite Communication Center, that were retrofitted for radar operation in a quasi-monostatic architecture. A Linear Frequency Modulated Continuous Wave (LFMCW) Radar design was implemented, using low transmitted power (2.5 kW) and advanced software-defined signal processing for detection and tracking of Low Earth Orbit (LEO) targets. System validation involved dry-run acceptance tests and calibration campaigns with known reference satellites. The radar demonstrated accurate measurements of range, Doppler velocity, and angular coordinates, with the capability to detect objects with radar cross-sections as low as 0.03 m2 at slant ranges up to 1200 km. Tracking of medium and large Radar Cross Section (RCS) targets remained robust under both fair and adverse weather conditions. This work highlights the feasibility of re-purposing legacy satellite infrastructure for SST applications. The Cheia radar provides a cost-effective, EUSST-compliant performance solution using primarily commercial off-the-shelf components. The system strengthens the EU SST network while demonstrating the advantages of LFMCW radar architectures in electromagnetically congested environments.

1. Introduction

Romania, represented by the Romanian Space Agency (ROSA), is a member of the EU SST consortium and has a significant contribution to the European SST system. ROSA operates the national SST Operational Center that coordinates the contribution of the Romanian sensors within the consortium. The sensor network currently includes several optical telescopes that have already provided timely and valuable data to the EU SST consortium. The choice of adding a tracking radar sensor to the Romanian network for SST was based on its ability to operate in almost all weather conditions, day and night, without sensitivity to atmospheric or light pollution. The data output provided by a tracking radar include the target’s position in polar coordinates (range and angles), as well as its radial velocity for a certain segment of its trajectory, improving the trajectory accuracy. As the majority of space debris around Earth is present in the LEO, this domain represents the priority interest for SST data collection activity. For this reason, the Romanian tracking radar sensor was designed to acquire and track of targets within the LEO domain, i.e., 200–2000 km altitude. The radar was designed and implemented by Rartel SA, a Leonardo company set as a Romanian–Italian joint venture specialized in satellite services and applications. The radar was designed and built through an ESA program (Cheia Antenna Retrofit Phase II), aimed to reuse the 32m parabolic C-band antennas available at the National Satellite Communication Center in Cheia, Prahova County and property of the Romanian Radio Communication Company (RADIOCOM) [1]. The ownership of the radar is currently shared by ROSA and SNR and its usage is defined by the policies of the two companies. This paper presents the final implementation of the radar and an extensive analysis of its capabilities, based on the dry run tests performed for the system acceptance that took place in September 2024. The parameters were confirmed subsequently in measurements and calibration campaigns run for EUSST consortium. The Cheia Satellite Communication Center in Prahova County, Romania, had two decommissioned 32 m diameter Cassegrain antennas originally installed in the late 70 s, positioned at latitude 45°27′24″N and longitude 25°56′48″E, at 900 m altitude. The antennas baseline is 80 m, and each antenna is mounted on top of its own support building. The antennas bandwidth allows their reuse in the ITU radar C band without losses. The reuse of the antennas and of the existing infrastructure provided an important budgetary relief but raised some challenges as well. The site is placed in a depression of a mountainous area, being surrounded by close and high mountains almost all around. Furthermore, there are high firs close to the antennas. This restricts the minimum line of sight to 20° at all azimuths. The primary technical specifications of the Cheia antennas are detailed in Table 1.
The electrical parameters of the antennas were measured and confirmed during design and commissioning phases.
As can be seen, the two antennas have similar electrical parameters but different mechanical ones (different inertial mass, azimuthal track diameter, and subreflector diameter) making the implementation of auto-tracking on both antennas very difficult. The antennas are very close (80 m), Cheia 2 is partly masking Cheia 1 on the N direction at low elevations and a high communication tower is placed between the antennas (Figure 1). This further restricts the tracking in some azimuth-elevation domain. As a supplemental disadvantage, the communication tower is full of microwave antennas and still holds C-band radio links, generating a crowded electromagnetic environment that affects the radar operation and requires special signal processing algorithms.
As can be seen from Table 1, even though decommissioned, the antennas were well conserved (see VSWR and G/T parameters), with the antenna feeders in a perfect state, which provides another significant budgetary advantage. However, this advantage came with the limitation of the transmitted power to 10 kW. To take advantage of the antennas full capabilities including the antenna feeders and mitigate the low transmitted power limitation, the design of an LFMCW radar was almost compulsory. A design of a pulsed radar using very long pulses was also addressed but the reliability constraints imposed by the available solid state power amplifiers (SSPAs) made the solution impossible to implement.
Other radars with FMCW exist, and their public specifications are listed below in Table 2.

2. Materials and Methods

2.1. Radar Implementation

The design of the new SST tracking radar was guided by the following key principles inspired by radar literature [24,25]:
  • Operation with two antennas in quasi-monostatic architecture with an 80 m baseline. In this setup, the Cheia 1 antenna would be used for transmitting (Tx) while the Cheia 2 antenna would be used for receiving (Rx) circular polarized wave. Both Cheia antennas were retrofitted.
  • C-band radar, while the antenna bandwidth allowed operation in both S and C radar bands, the frequency range chosen for radar probing signals was around 6 GHz because, in the C band, the antenna figure of merit is higher and the radar allocated frequency band is close and partly overlapping the antenna C-band specified bandwidth of 5845–6425 MHz.
  • LFMCW using a SSPA power amplifier. The radar design is ready for a pulsed mode as well, but the SSPA does not provide an acceptable reliability when amplifying long pulses.
  • Transmitted power of 2.5 kW. The value (−3 dB from the 5 kW saturation point of the SSPA) was chosen as an optimum value relative to the financial budget and the minimum size of detectable objects (see Equation (1)). The low transmitted power had to be compensated through signal processing
  • Target signal processing performed completely in the frequency domain. This way of processing allows the minimum instantaneous frequency bandwidth and thus, the detection of small objects whith relatively low transmitted power.
  • A software-defined architecture, with the minimum analog signal blocks.
  • Improved velocity of the antenna positioning system: The retrofitted radar antennas are capable of superior speed and acceleration performances, compared to the original ones. The increased angular speed (1°/s as compared to the original 0.3°/s) and the increased angular acceleration (0.5°/s2 as compared to the original 0.3°/s2) are obtained by installing new drive motors and a modern antenna control system.
The system was designed to track all LEO resident objects (200–2000 km) within the tracking capabilities of the antenna that are above the following perigee altitude ( h p ) dependent diameter envelope ( d min ), with h ref = 1400 km , d ref = 10 cm :
d min = max h p 4 h ref 4 d ref 2 , 10 cm

2.2. Radar General Diagram and Operation

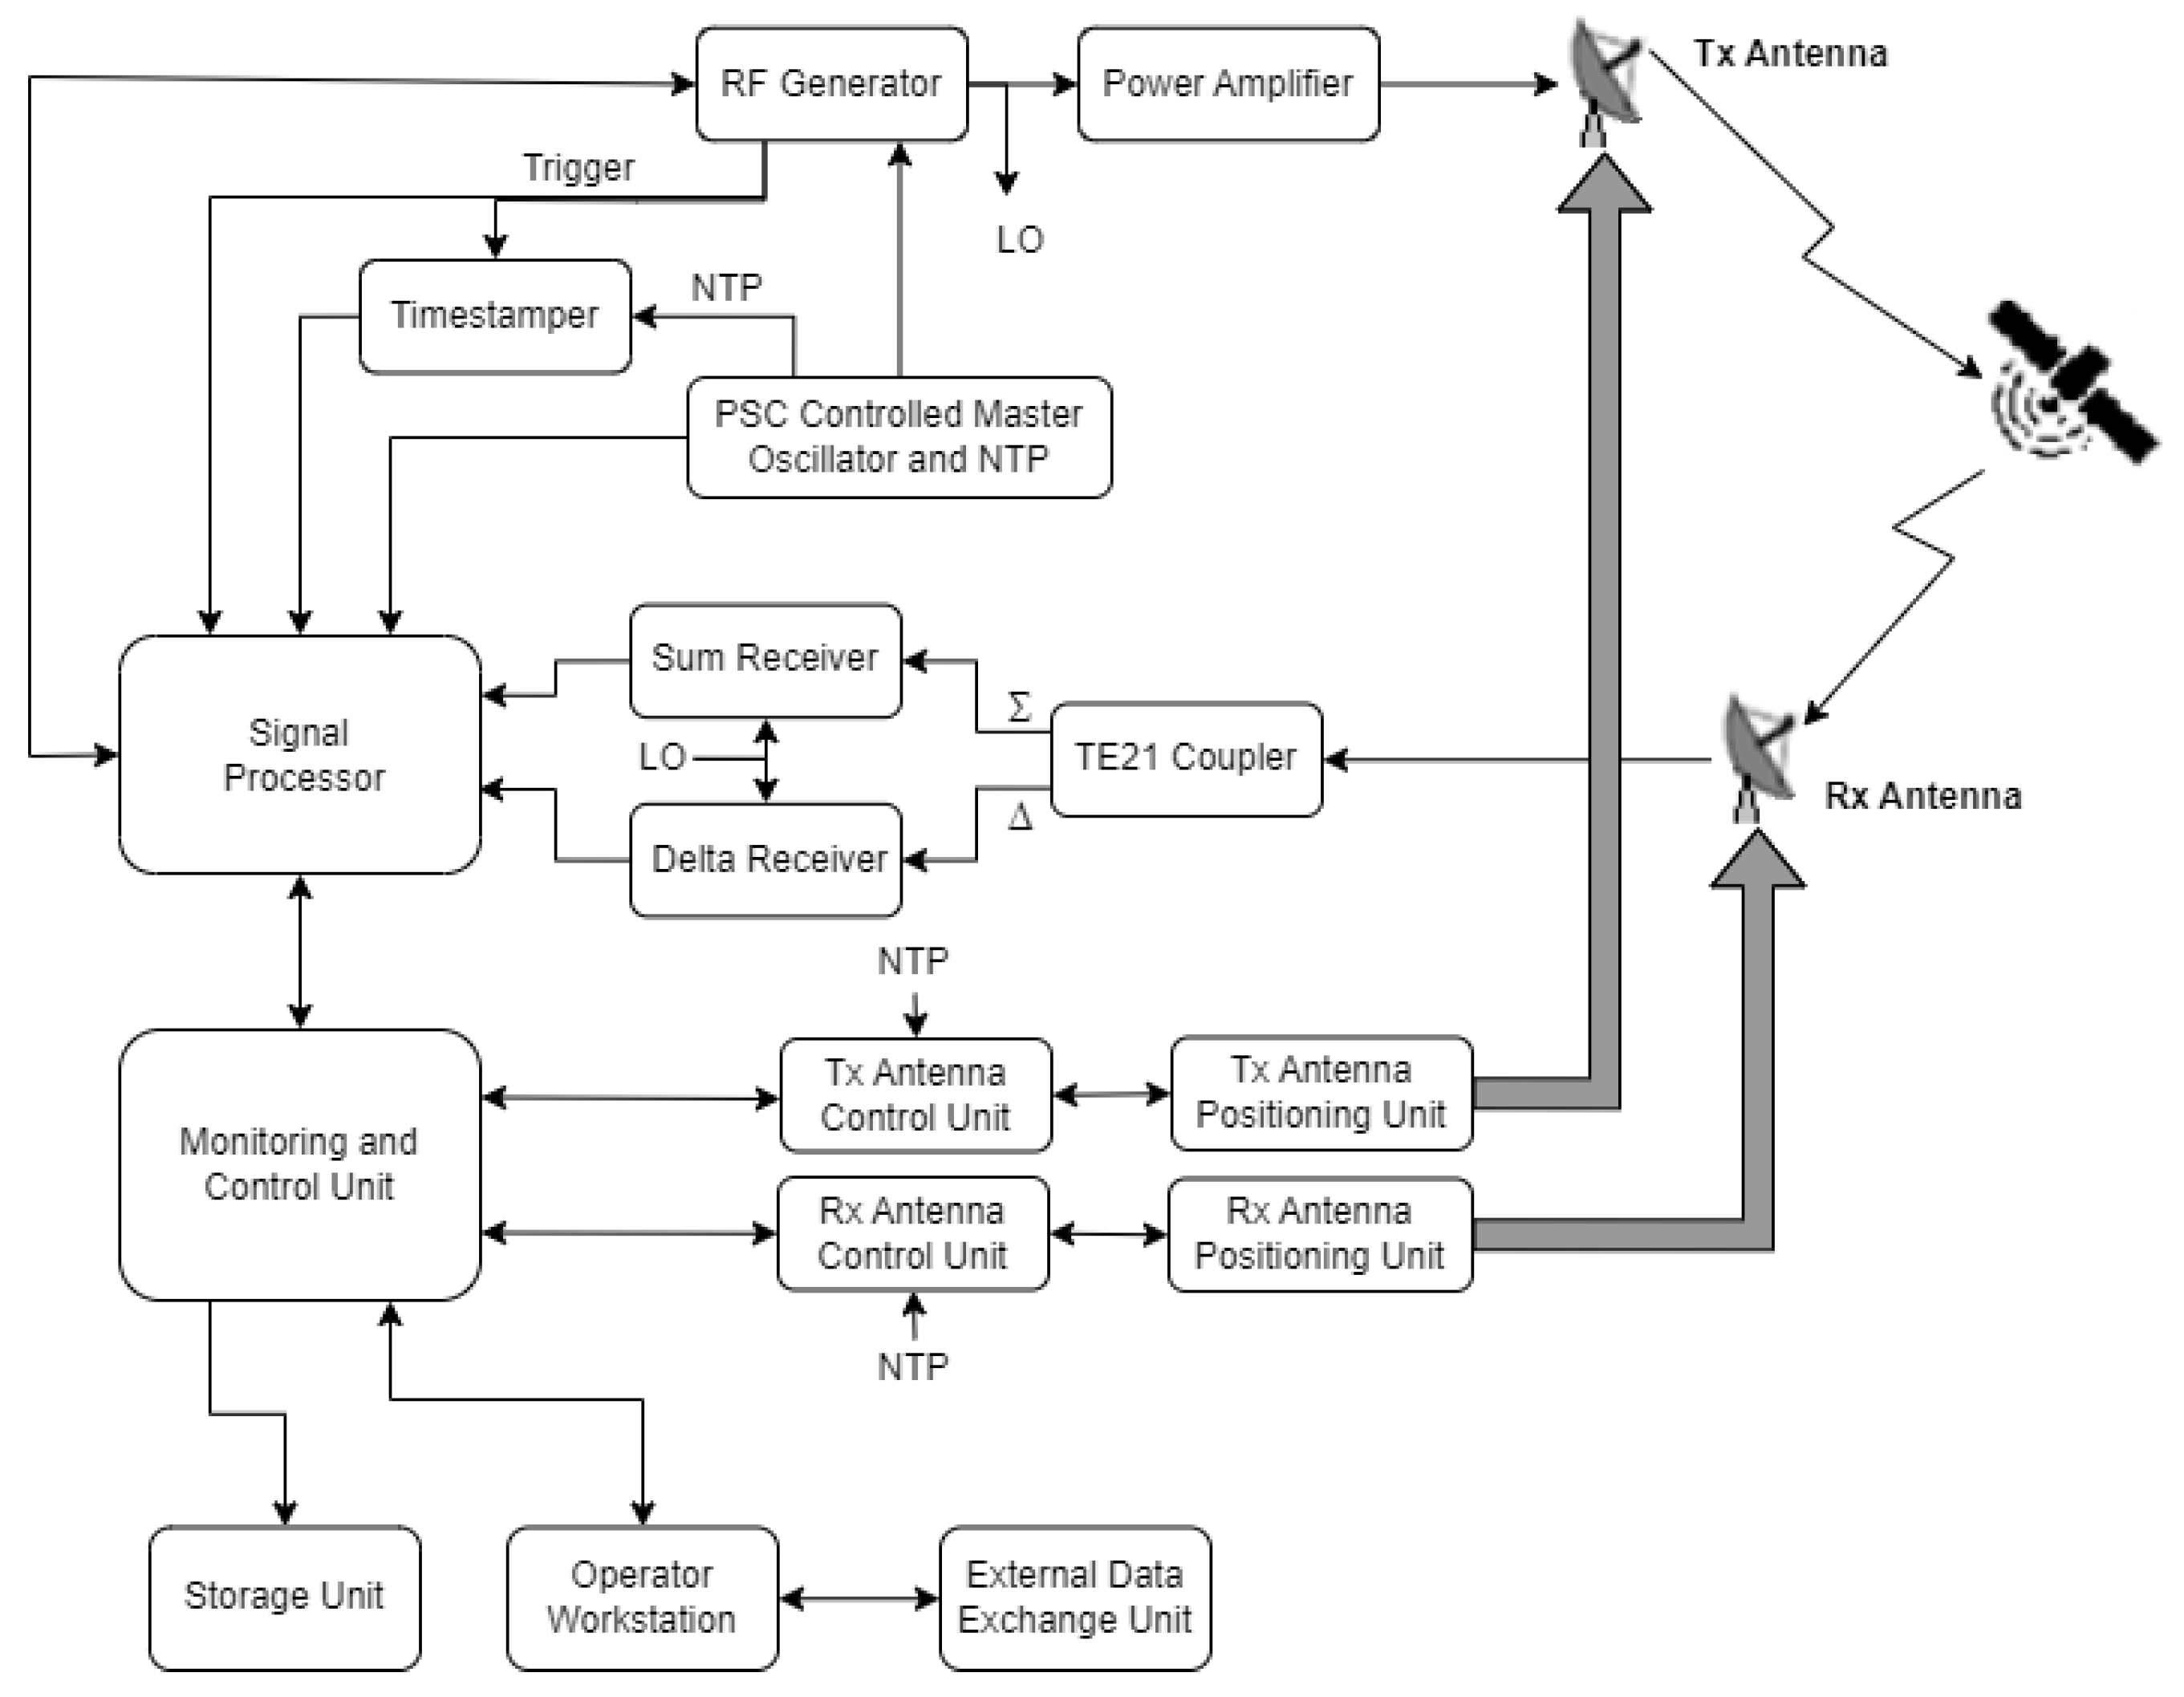
The general diagram of the Cheia radar is presented in Figure 2 and described extensively in paper [2] and paper [26]. The system is an LFMCW ground-based tracking radar integrated with the two existing CHEIA 32m parabolic antennas.

2.3. Transmitter and Signal Generation Architecture

The probing signals are generated by the low noise very versatile RF Generator based on the configuration data received from the Signal Processor (SP) and on the reference signal received from the Positioning System Controlled Master Oscillator (PSC-MO). The generated signals are amplified to the required level (2.5 kW) by the linear SSPA and then applied to the Left Hand Circular Polarization (LHCP) port of the antenna feeder and radiated as LHCP waves through the Transmitter Antenna. The PA stabilizes the transmitted power level to +64 dBm (2.5 kW).
A small portion of the transmitted signal is extracted in order to be used as Local Oscillator (LO) signal in the Receiver. The LO signal is extracted from the output of the RF Generator.
The PSC-MO, the RF generator and the PA are subsystems of the (Tx). The RF generator generates the LFMCW signal and a trigger pulse synchronized with each positive slope of the triangular FM modulating signal. To ensure minimal phase noise of the transmitted signal, the RF generator uses high quality digital frequency synthesis based on an extremely stable 100 MHz external signal reference (MO).
The trigger pulse controls the sampling start in the Signal Processor for both Sum and Delta Receivers signals.
The echo signals are received at the Right Hand Circular Polarization port of the 6 GHz orthomode transducer of the Receiver Antenna, filtered, frequency translated/demodulated to base-band using the LO signal and amplified into the Receiver subsystem, to the level required by an optimal operation of the two ADCs that are part of the (SP).
The Receiver subsystem is composed of the Sum Receiver (SRx) and Delta Receiver (DRx). The SRx processes the Rx Antenna received signal while the DRx processes the signal of the 6 GHz TE21 Tracking Coupler. The receivers’ sensitivity is −149 dBm at Signal-to-Noise and Distortion ratio (SINAD) of 13 dB.
The SP [27] digitizes the amplified analog in-phase (I) and in-quadrature (Q) signals output by the SRx, translates them into the frequency domain as a single complex signal, time stamps and processes it using a Constant False Alarm Rate (CFAR) algorithm, in order to extract the target’s range, Doppler and Signal-to-Noise Ratio (SNR). The Signal-to-Noise Ratio is an indication of the tracked object’s RCS. The target extracted data are sent to the Monitoring and Control Unit (MCU). The beat frequency, associated complex value and SNR are sent to the tracking section of the SP, to assist the extraction of the azimuth (AZ) and elevation (EL) error signals. The digitizing of the SRx and DRx receivers output signals is triggered by the trigger pulse produced by the RF Generator. The trigger pulse ensures a synchronized digitization of the SRx and DRx receivers’ signals and a correct time stamping of the detections. The time-stamping of the detections is performed by a dedicated hardware device synchronized by the trigger pulse, that, in turn, is synchronized with the transmitted signal modulation. To ensure Auto-tracking capabilities, a 6 GHz TE21 Tracking Coupler is inserted into the feeder subsystem of the Rx Antenna. The TE21 Tracking Coupler error signal is a complex composition of the target’s azimuth and elevation deviation angles relative to the electrical axis of the Rx antenna. The TE21 echo signals received at the error output port of the Rx Antenna 6 GHz TE21 Tracking Coupler are filtered, frequency translated/demodulated to base-band using the LO signal and amplified into the DRx to the level required by an optimal operation of the AD Converter that is part of the SP. The Tracking section of the SP digitizes the amplified analog I and Q signals output by the DRx, translates them into the frequency domain as a single complex signal and processes it in order to extract the azimuth and elevation error angles relative to the electrical axis of the Rx Antenna. In the Auto-tracking mode, the target angular error data are sent to the Antenna Control Unit (ACU) of the Rx Antenna as angular error signals. The DRx is identical to the SRx but the processing of its output complex signal into the SP is different. To increase the receivers’ reliability, the radar operates using 4 range scales. The SP decides on the range scale to be used, on the range and Doppler windows to be used for range and speed tracking and on the angular tracking method of the target (Programmed track or Auto track). The Tx Antenna and Rx Antenna movement and position are controlled by the two separate Antenna Positioning Systems (APSs), each composed of an ACU and an Antenna Positioning Unit. The two APSs are synchronized through the M&C [28] or Debug applications. In the auto-track mode, the Rx Antenna’s ACU, is controlled by the SP error signals.
The MCU is a computational system that controls the radar operation through software algorithms and subsystems commands. It is implemented on a dedicated MCU server through the M&C Software that comprises three subsystems. Its operation is designed to minimize the traffic between the radar’s subsystems connected to the radar LAN. The first subsystem, the Campaign preparation, controls the campaign preparation by applying processing algorithms on the input data that designates the targets to be tracked. The second subsystem, the Operation, controls the radar’s operation by loading the object tracking data in the stored sequence decided by the operator. This group is responsible for displaying real-time and final tracking data. The first and second groups are implemented as a Web application. The third subsystem, the Maintenance, implemented through a Windows application is dedicated to the maintenance and configuration of the radar subsystems. This group has a supplemental component that displays the status of the radar system. The component is implemented in the M&C Web application.
The MCU control is effective for antennas positioning in the Programmed Track Mode as long as the auto-track mode is not engaged. Currently, the auto-track mode is not used due to strong interference. To avoid transmitting towards close obstacles of the site, the Tx Antenna’s ACU sends mute signals to the Power Amplifier, inhibiting the radar’s transmission. To ensure the system resolution and low phase noise, all blocks use coherent reference signals generated by the same high stability PSC-MO.
The M&C Software running on the MCU has a software architecture based on microservices. Each microservice has a specialized behavior and is able to work independently. Each equipment is paired with a corresponding equipment microservice and is integrated into the system through configuration. As a result, the radar can be operated either locally or remote using the same interface. The M&C provides a comprehensive user interface displaying the measured target track, the errors relative to the input Two-Line Element set (TLE) and the target’s SNR. The range-azimuth and elevation-azimuth plots are displayed both in rectangular and polar coordinates. Due to the crowded electromagnetic environment the radar operates in, the user interface also contains a tool for removing outliers produced by the interferences.

2.4. Radar Probing Signal and Processing Algorithms

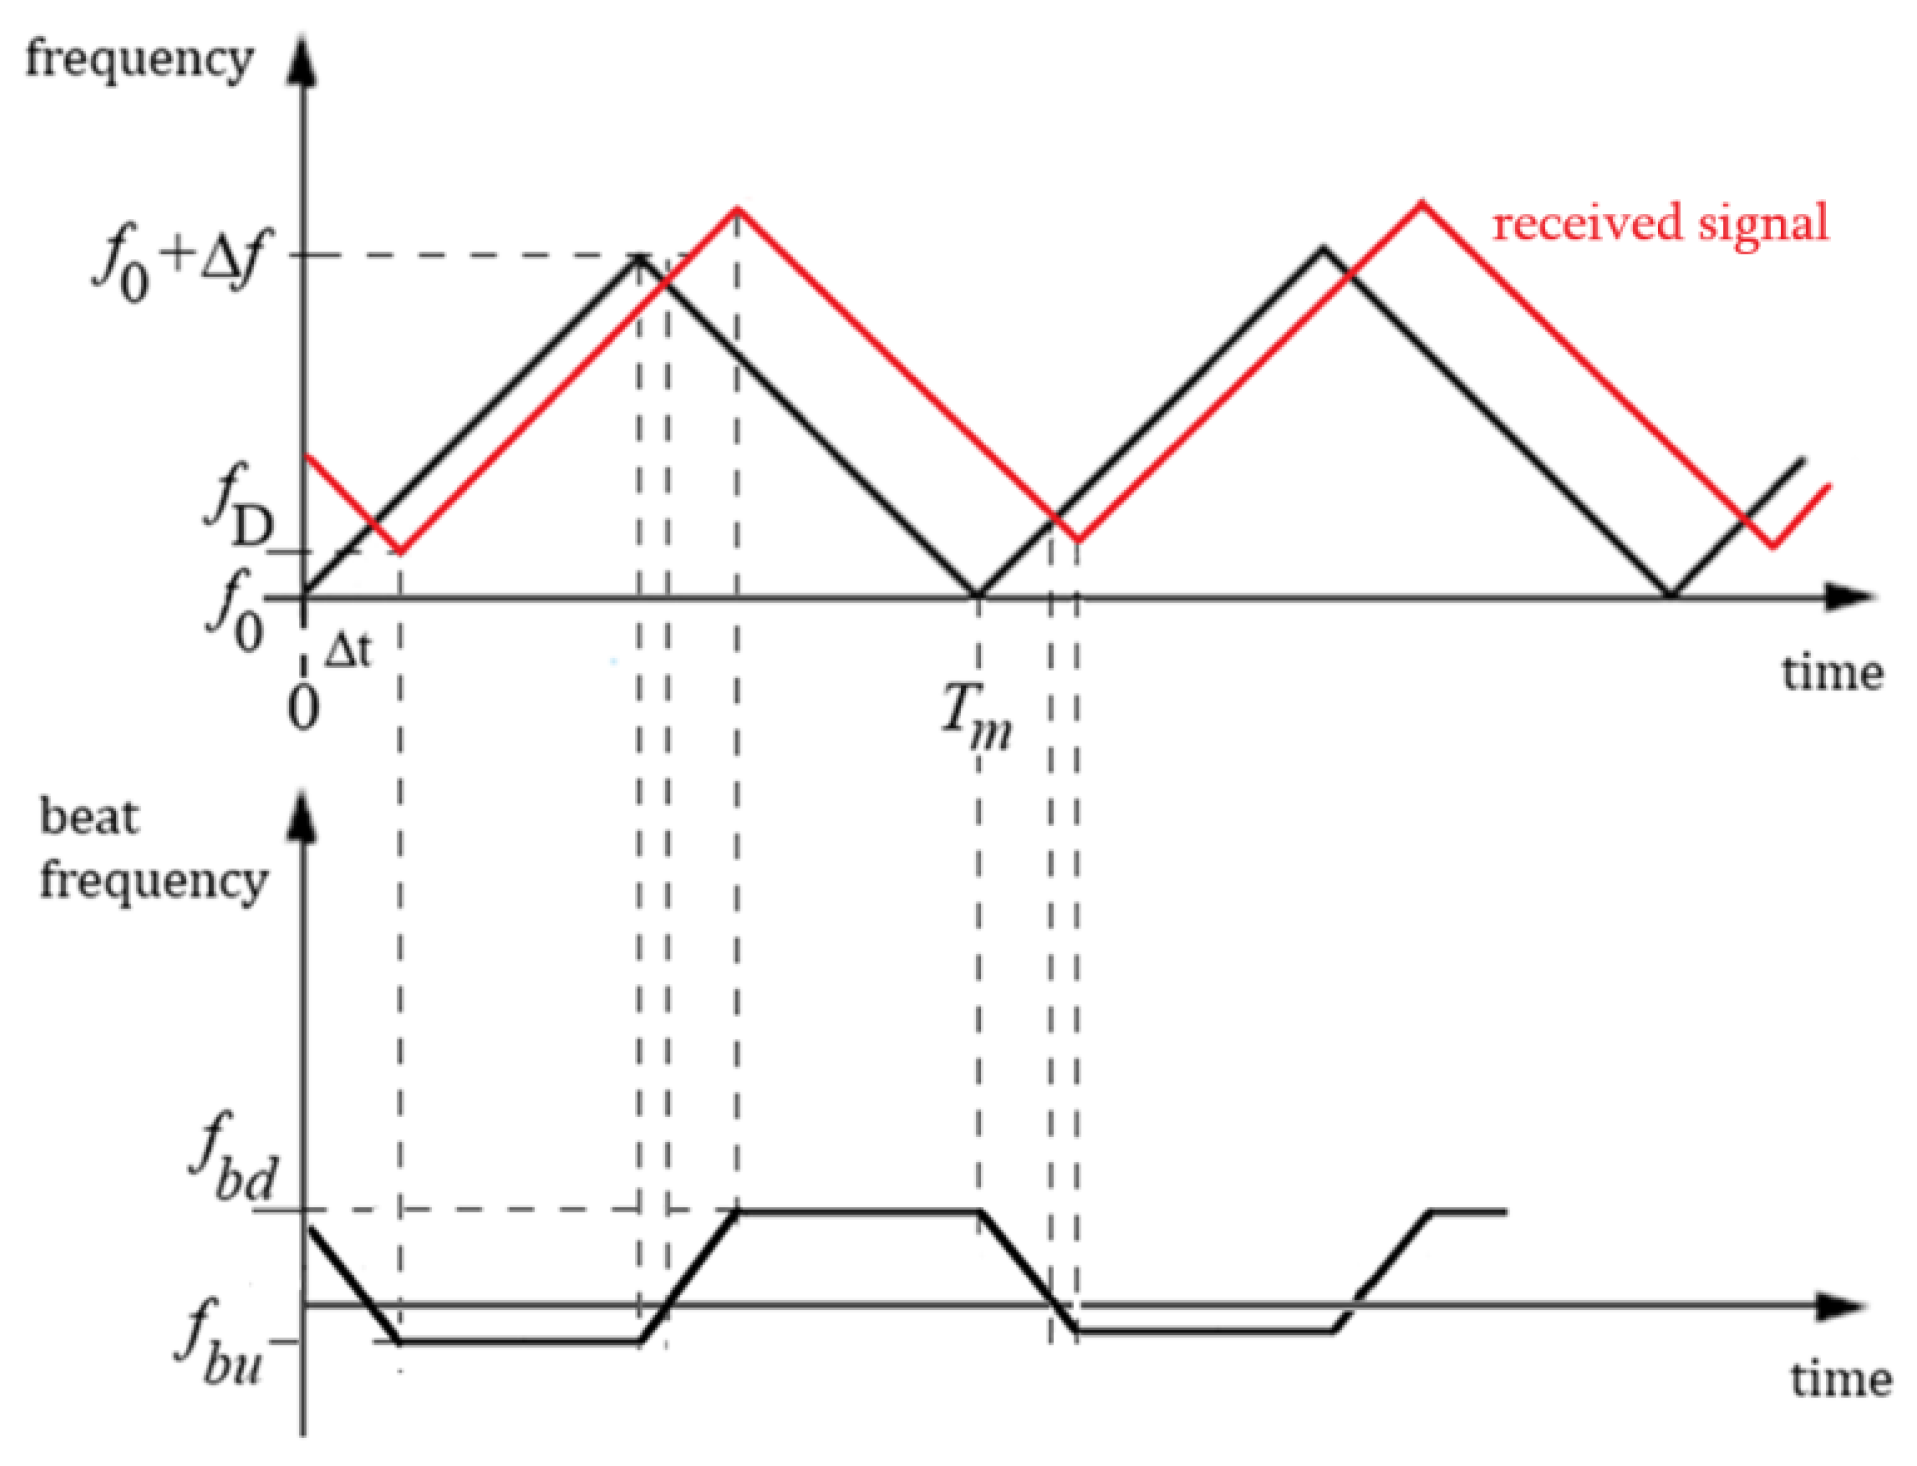
To achieve the required range (50 m) and Doppler (1.5 m/s) resolution, the Cheia radar employs an LFMCW probing signal for its ability to simplify the radar architecture while enabling accurate simultaneous measurements of both range and radial velocity for the minimum transmitted peak power.
The structure of the transmitted, received, and resulting beat signals of the LFMCW is illustrated in Figure 3, where
  • f 0 : LFMCW starting frequency;
  • f 0 + Δ f : LFMCW maximum frequency;
  • f D : Doppler frequency shift;
  • received signal: red line;
  • Δ t : Time delay between transmitted and received signals;
  • T m : Modulation period;
  • f b u : Beat frequency during up modulation period;
  • f b d : Beat frequency during down modulation period.
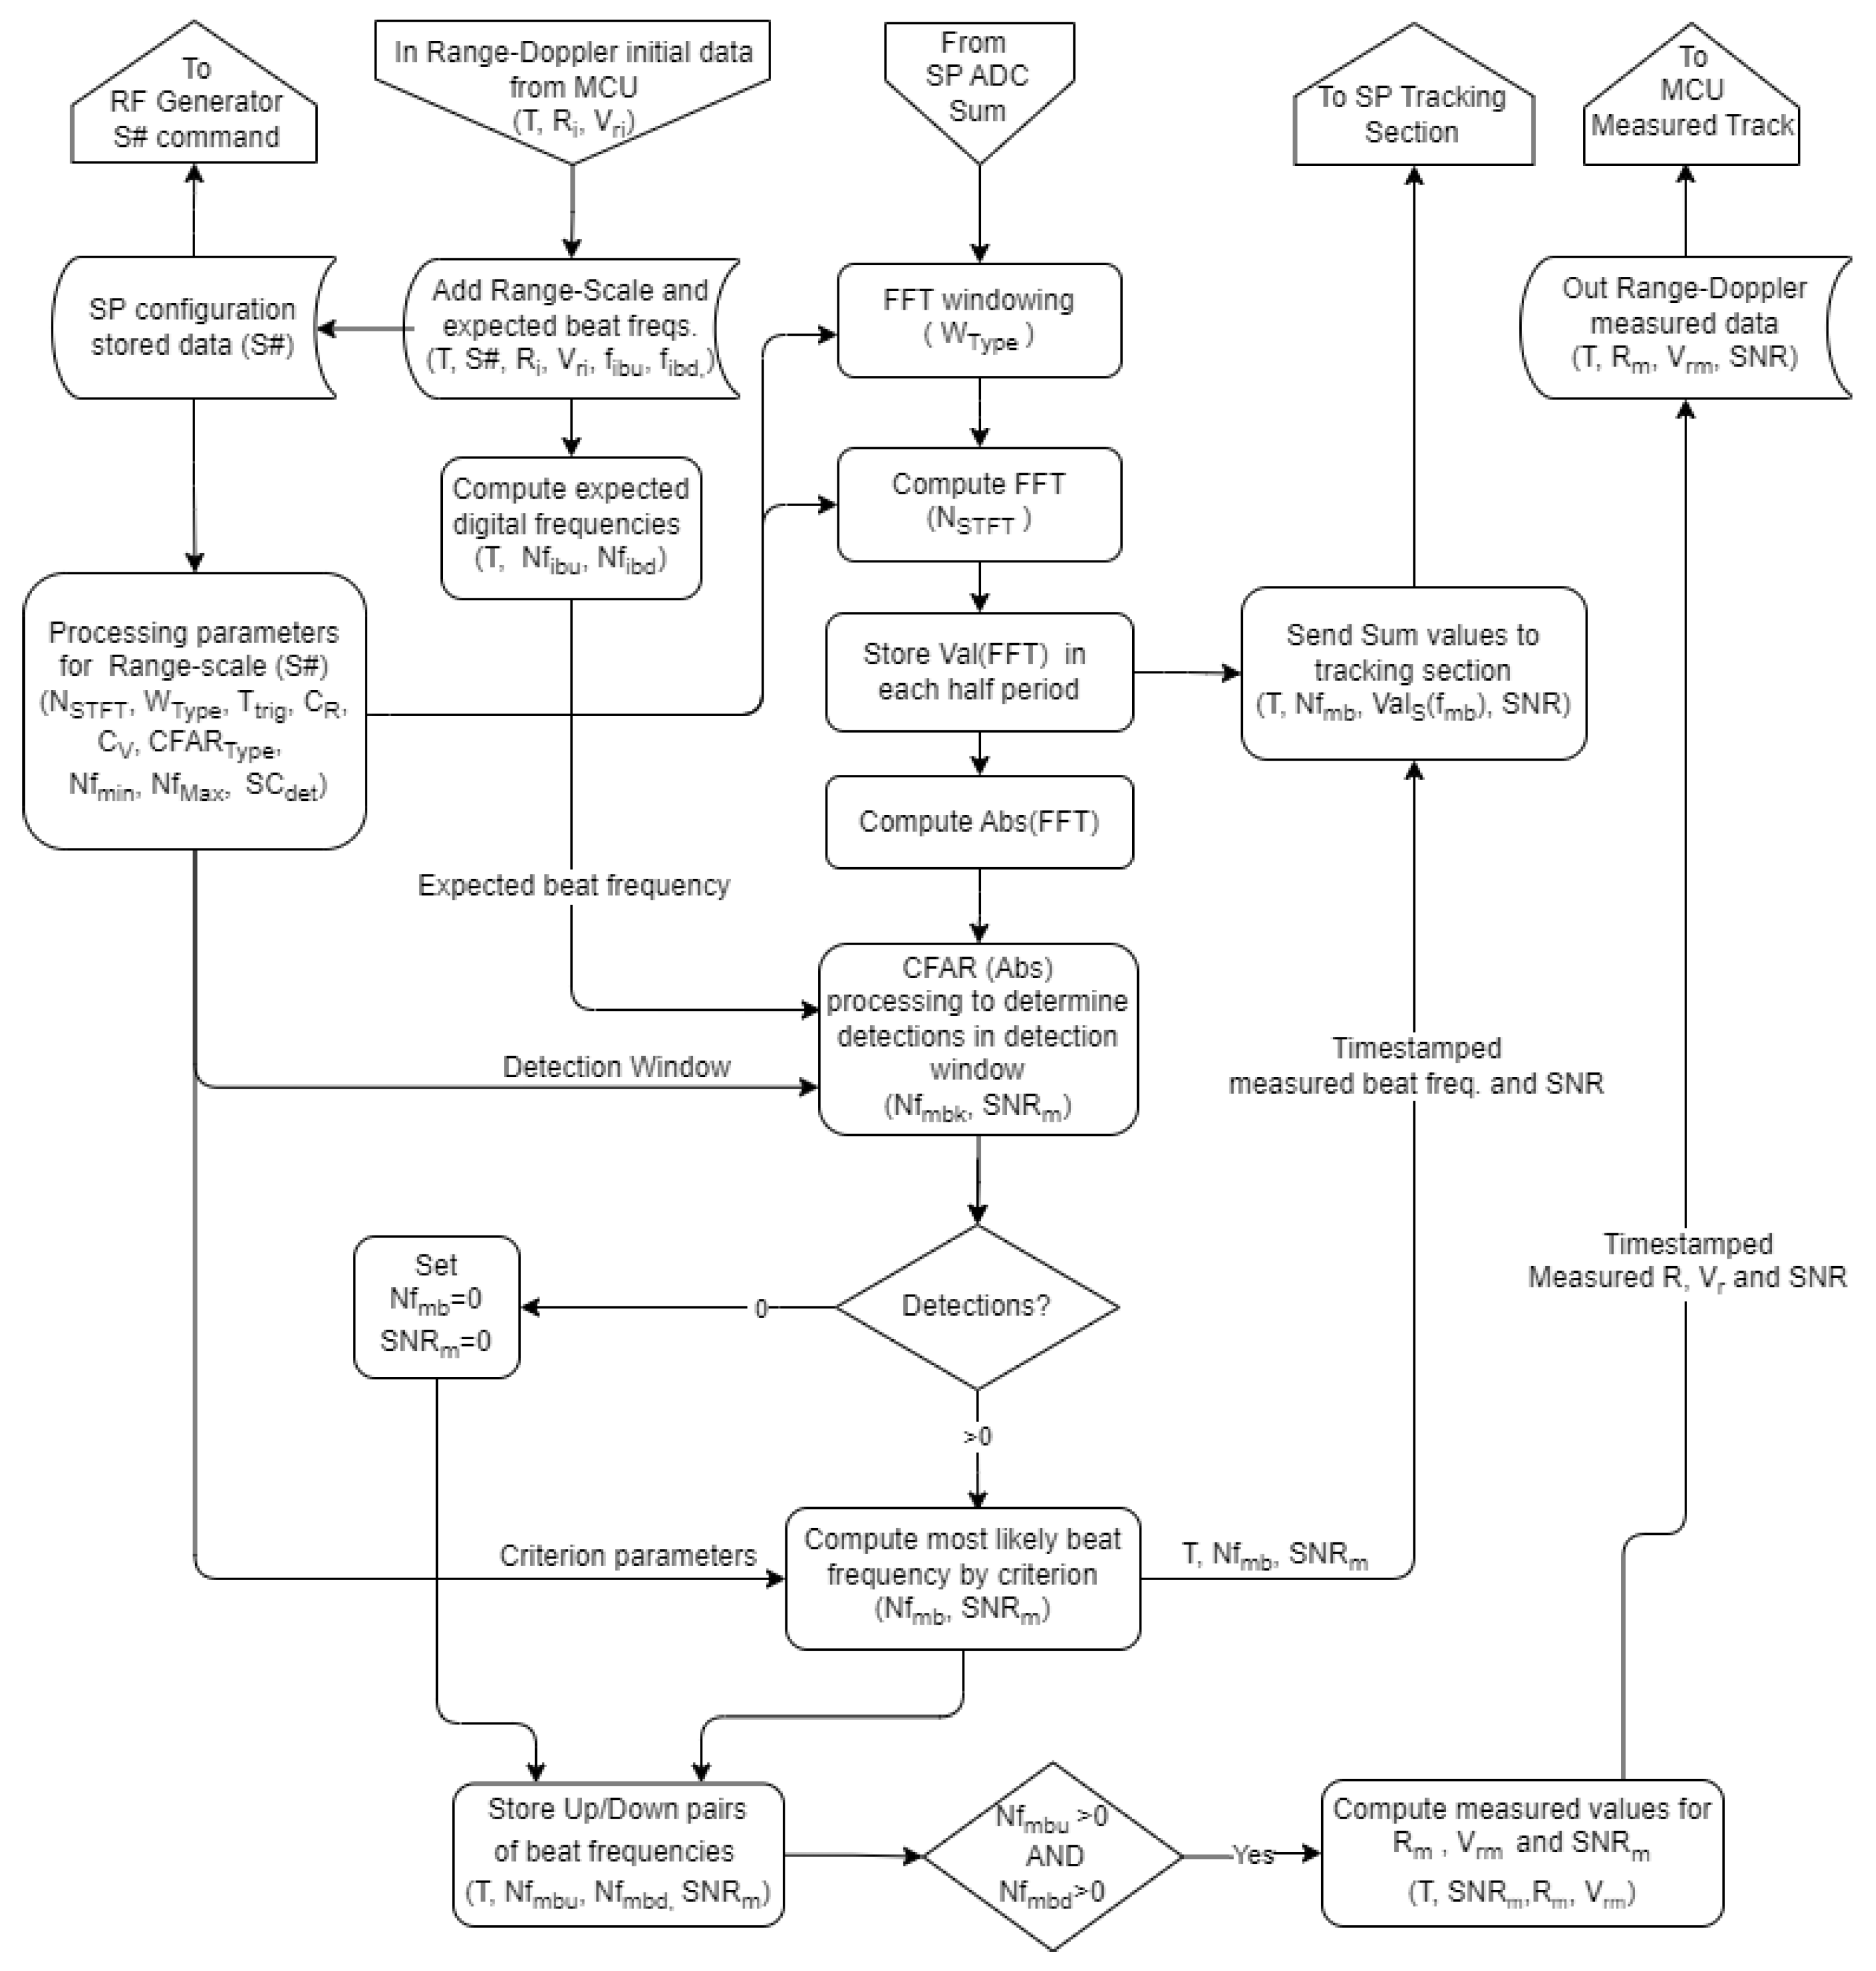
The SP processing algorithm of the CW received signal is presented in Figure 4.
The analog signal received by the Sum Receiver (SRx) is first filtered to suppress transmitter leakage and improve the signal-to-noise ratio (SNR) by 10 dB. It is then amplified to match the input dynamic range of the analog-to-digital converters (ADCs).
The digitized signal is transformed into the frequency domain using a large size (>1 M points) Fast Fourier Transform (FFT), which enhances the effective SNR by more than 50 dB. A Constant False Alarm Rate (CFAR) algorithm is applied to detect the presence of targets in the spectral domain.
Detected beat frequencies from two consecutive half-periods of the triangular frequency modulation are used to compute the target’s range (R) and radial velocity ( V R ) according to the following:
R = C R 1 [ N s ] · f b d + C R 2 [ N s ] · f b u
V R = C V ( f b d f b u )
where Ns is the range scale, CR1, CR2, and CV are radar processing parameters that can be changed through MCU.
According to this algorithm, the target signal processing is performed only in the frequency domain, including target detection and parameter determination.
The Delta processing section, though implemented, is not yet used due to the strong perturbations expected from the C-band radio-link placed on the pylon existing between the antennas.

3. Results

The following results are based on real-time, real-life measurement of true spatial test objects orbiting Earth. The measurements were performed during the final acceptance tests of the radar, under ESA supervision and review.

3.1. Detection Capability

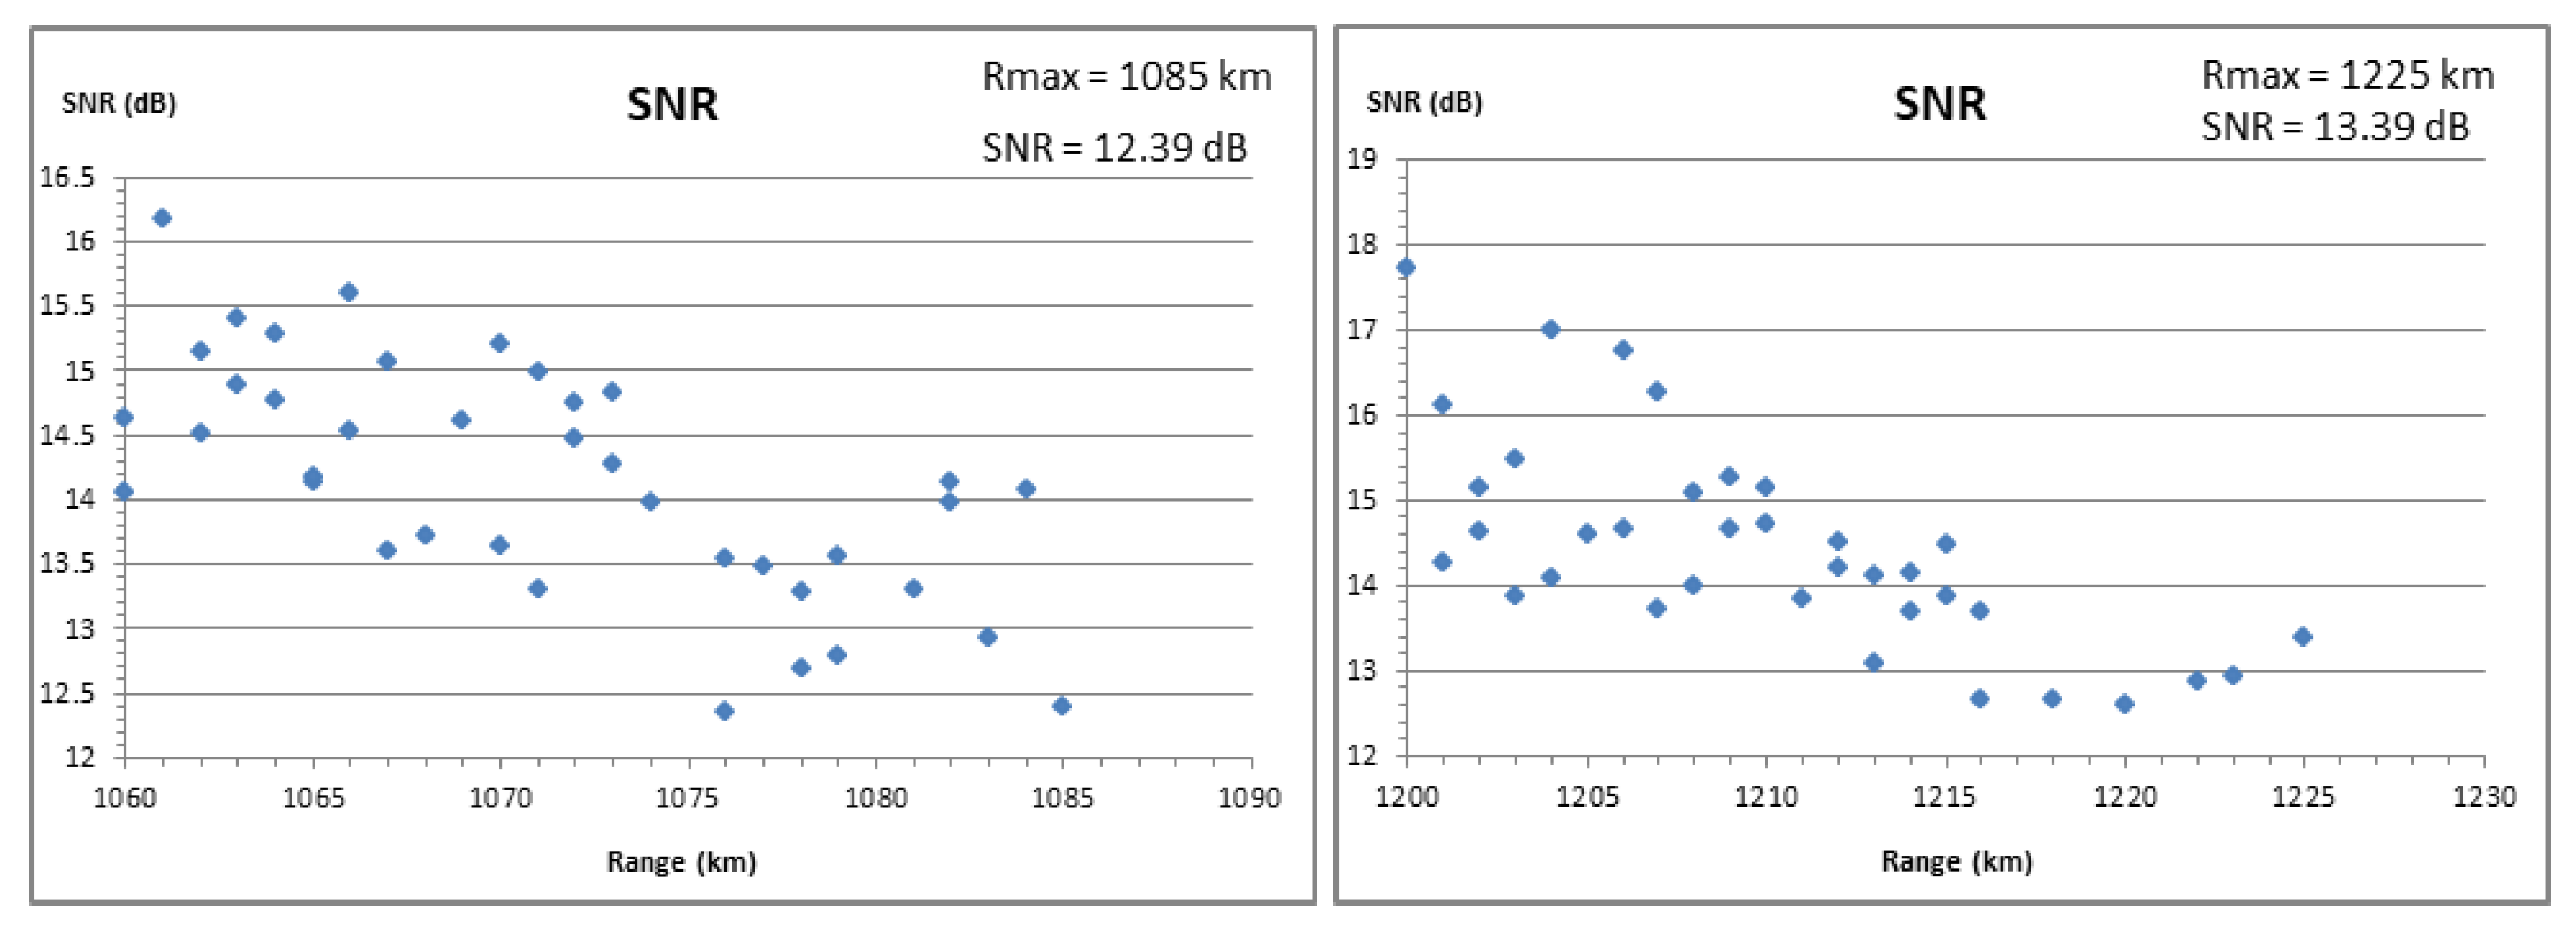
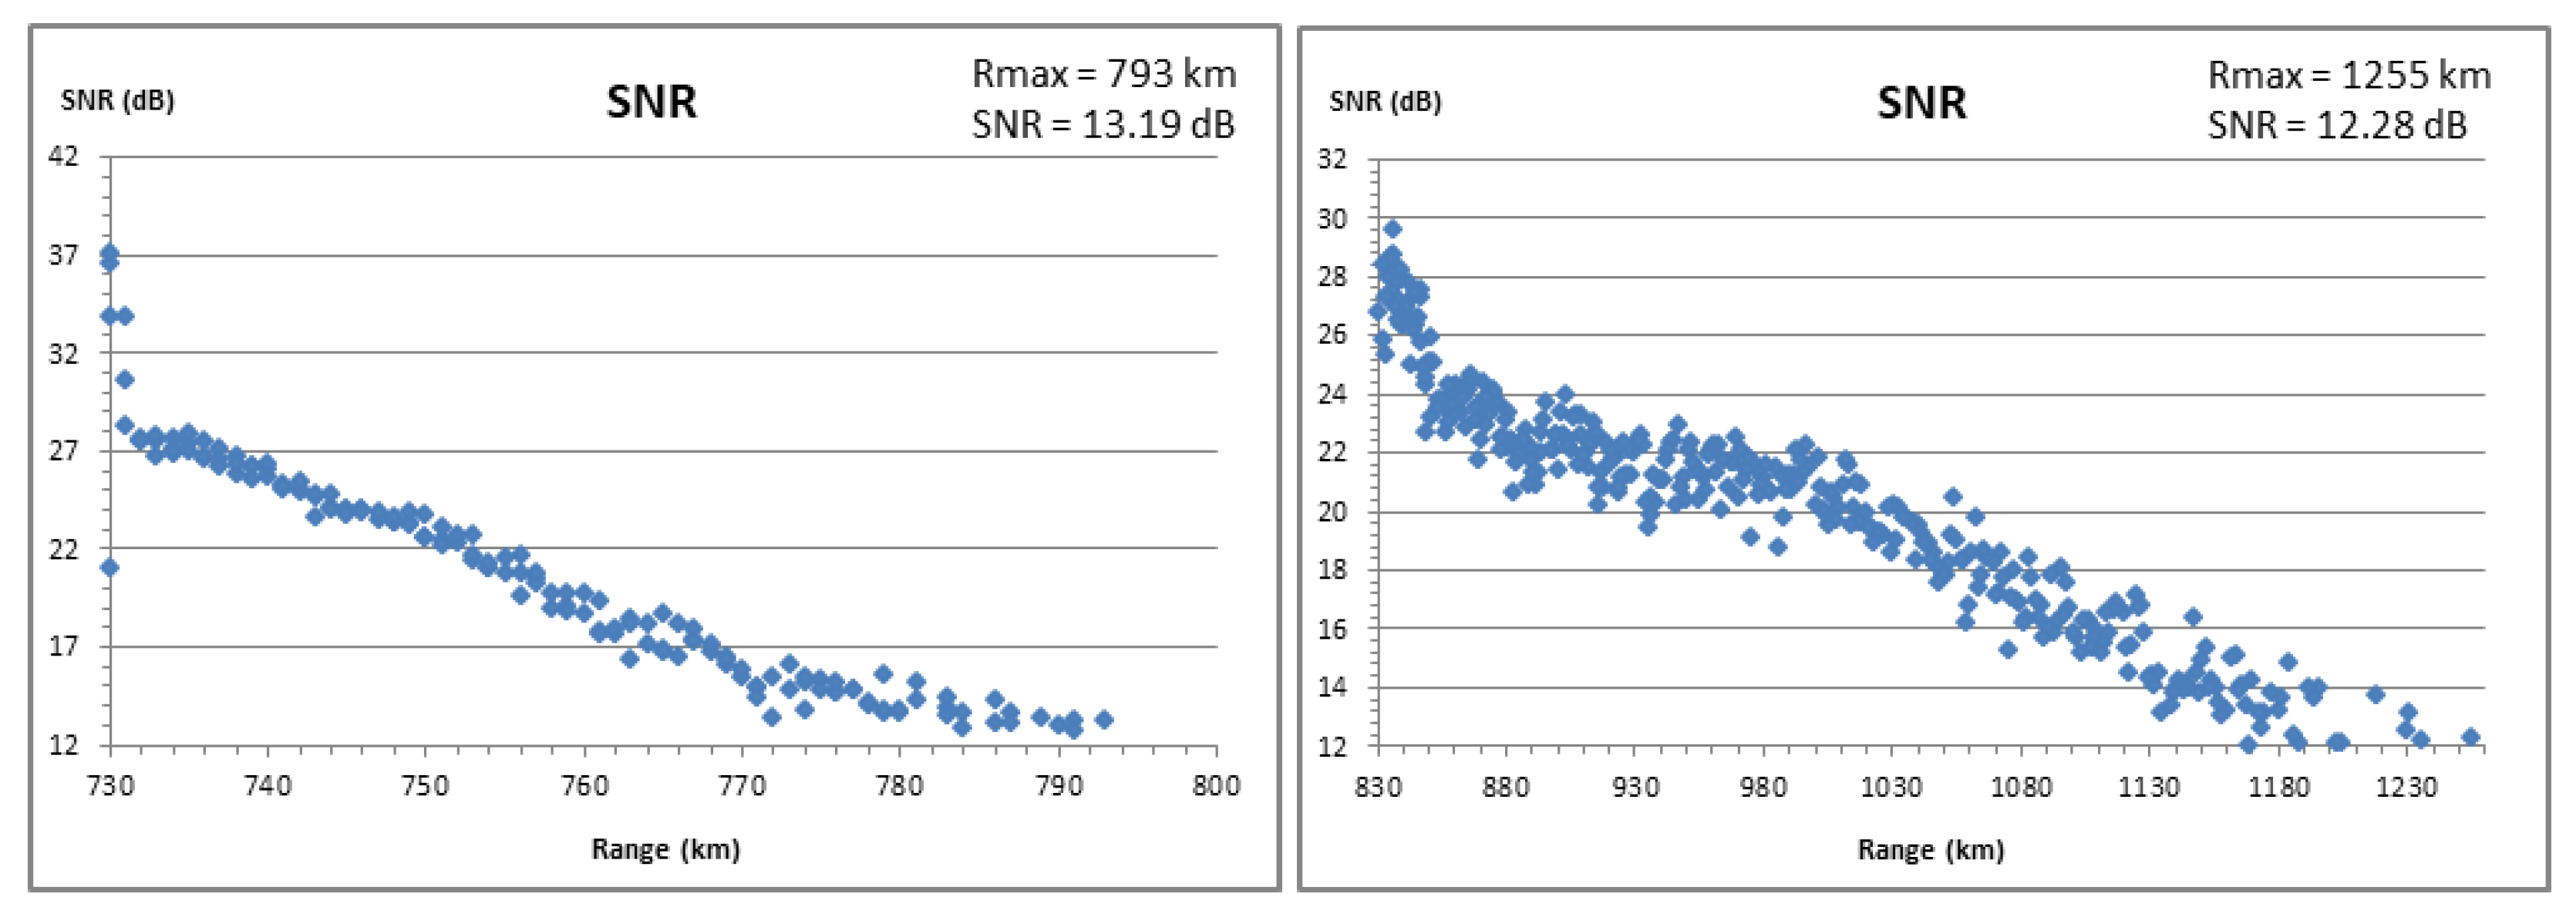
Being a C-band radar, the Cheia radar is sensitive to weather. The high environmental humidity levels, either through fog, rain, snow, thick clouds or just winter with mild temperatures, introduce supplemental attenuation, thus reducing its detection capabilities. To avoid the influence of the RCS directivity, the detection capability was performed on spherical test satellites in different types of weather. The detection capability of the radar was tested in dry weather conditions using several small RCS spherical test satellites. The results of tests performed on Calsphere 1 (Norad ID 900), RCS = 0.0462 m2, Perigee = 965 km, Apogee = 1005 km and Calsphere 4A (Norad ID 1520), RCS = 0.0448 m2, Perigee = 1076 km, Apogee = 1184 km are presented in Figure 5.
The detection capability of the radar was also tested under adverse weather conditions using several medium RCS test satellites. Tests were conducted on Larets (NORAD ID 27944) with an RCS of 0.1347 m2, perigee of 687 km, and apogee of 697 km, as well as on Rigidsphere 2 LCS4 (NORAD ID 5398) with an RCS of 0.9311 m2, perigee of 731.6 km, and apogee of 820.4 km. The results of the test are presented in Figure 6.
Each of the above figures presents the maximum detection range and its corresponding Signal-to-Noise Ratio (SNR).
The minimum trackable target RCS at 1000 km for several tests satellites, computed using the equation below, is presented in Table 3.
R C S 1000 = R C S m e a s 1000 R M a x m e a s 4
Table 3 shows that the radar can detect and track targets having RCS over 0.375 m2 up to 1000 km in any weather conditions, day or night. For higher RCS values, the trackable range increases according to Equation (4). In good weather the detection capability can increase by more than 10 dB. For real targets, some favorable aspect positions allow a further increase. For example, the satellite CanX-1, having an RCS of 0.0073 m2 was tracked up to 900 km slant range under favorable weather and aspect conditions, lowering the RCS equivalent size to 12 cm.

3.2. Measurement Accuracy

The accuracy of the radar measurements was tested using the calibration satellite EGS-Ajisai by comparing the radar-measured positions with the satellite’s precise positions (<1 m accuracy) measured by optical means and published periodically by EUROLAS Data Center (EDC) [29]. Ajisai is a passive spherical satellite of 2.15 m diameter and a mass of 685.2 kg, carrying 318 mirrors and 120 laser retroreflector assemblies (1436 corner cube reflectors) for precise satellite laser ranging (SLR) measurements from ground-based laser ranging stations. It is especially destined for precision orbit determination and is generally used for geodedic purposes. It has a near-circular orbit with a perigee of approximately 1490 km, eccentricity 0.001, inclination 50° and period of 116 min.
The measured data were compared to the precise post-factum data based on the one published by EDC [30] for the same epoch. The comparison was made for the range, Doppler, and angular data separately.
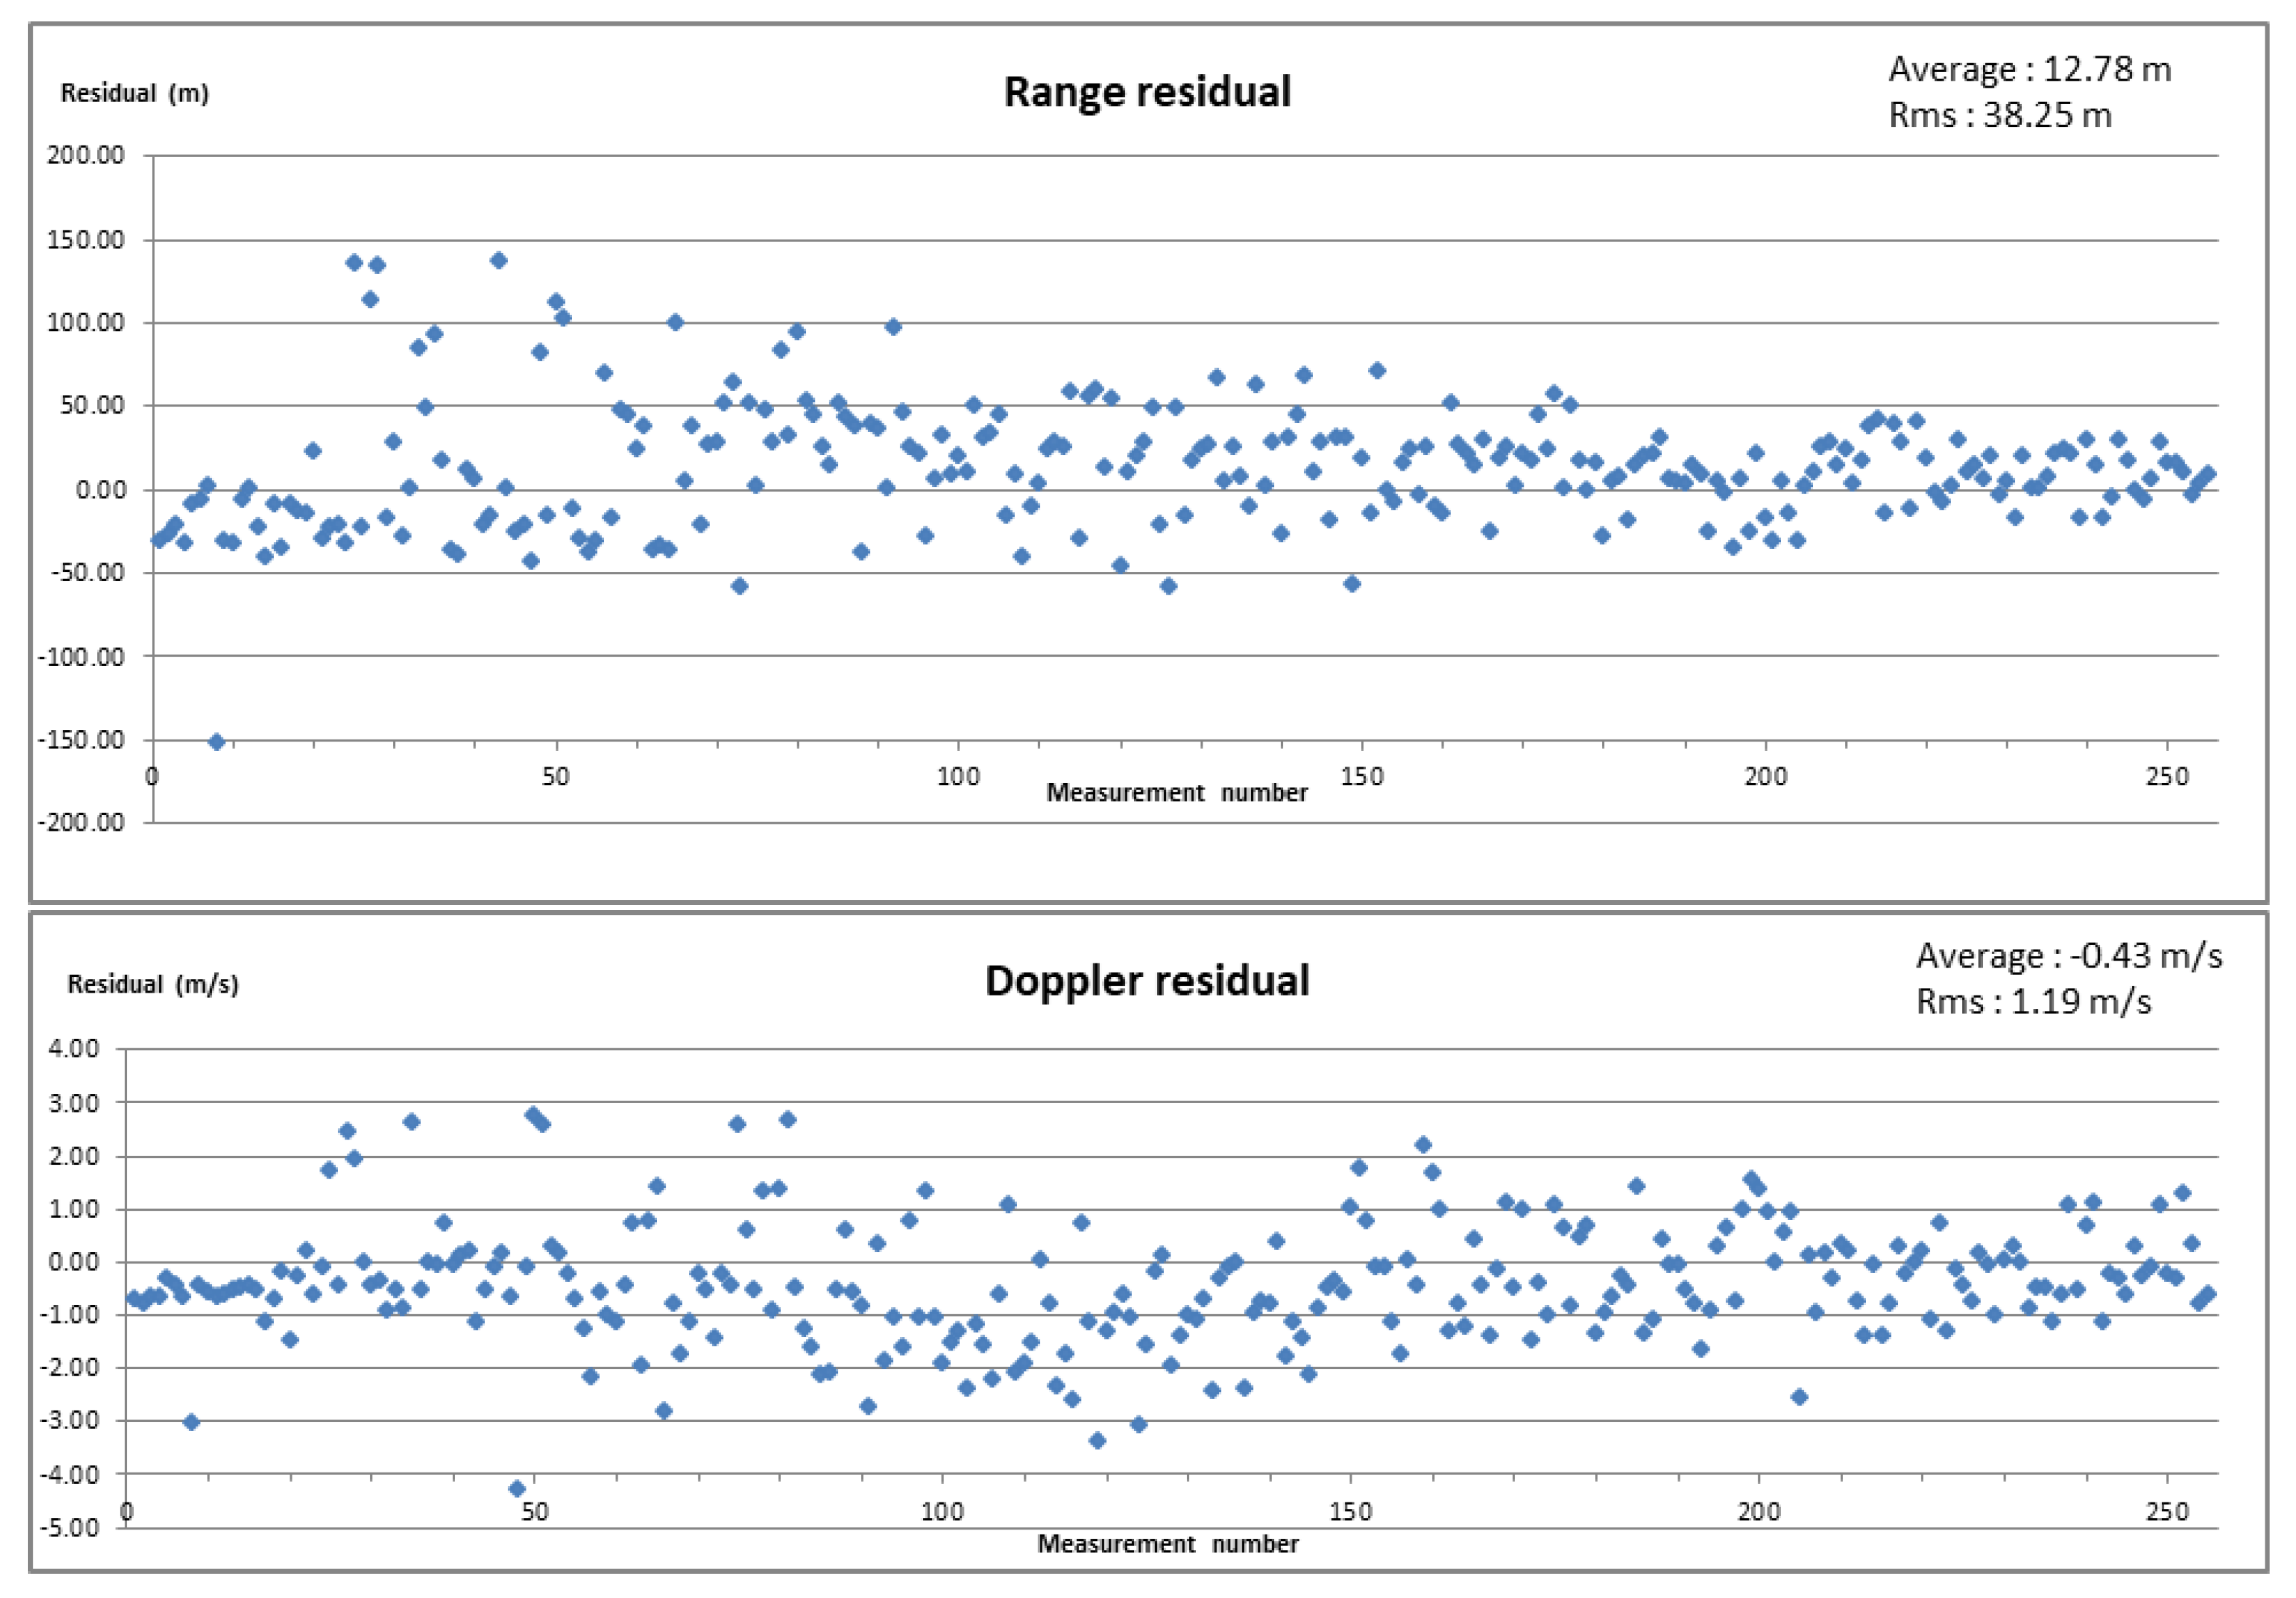
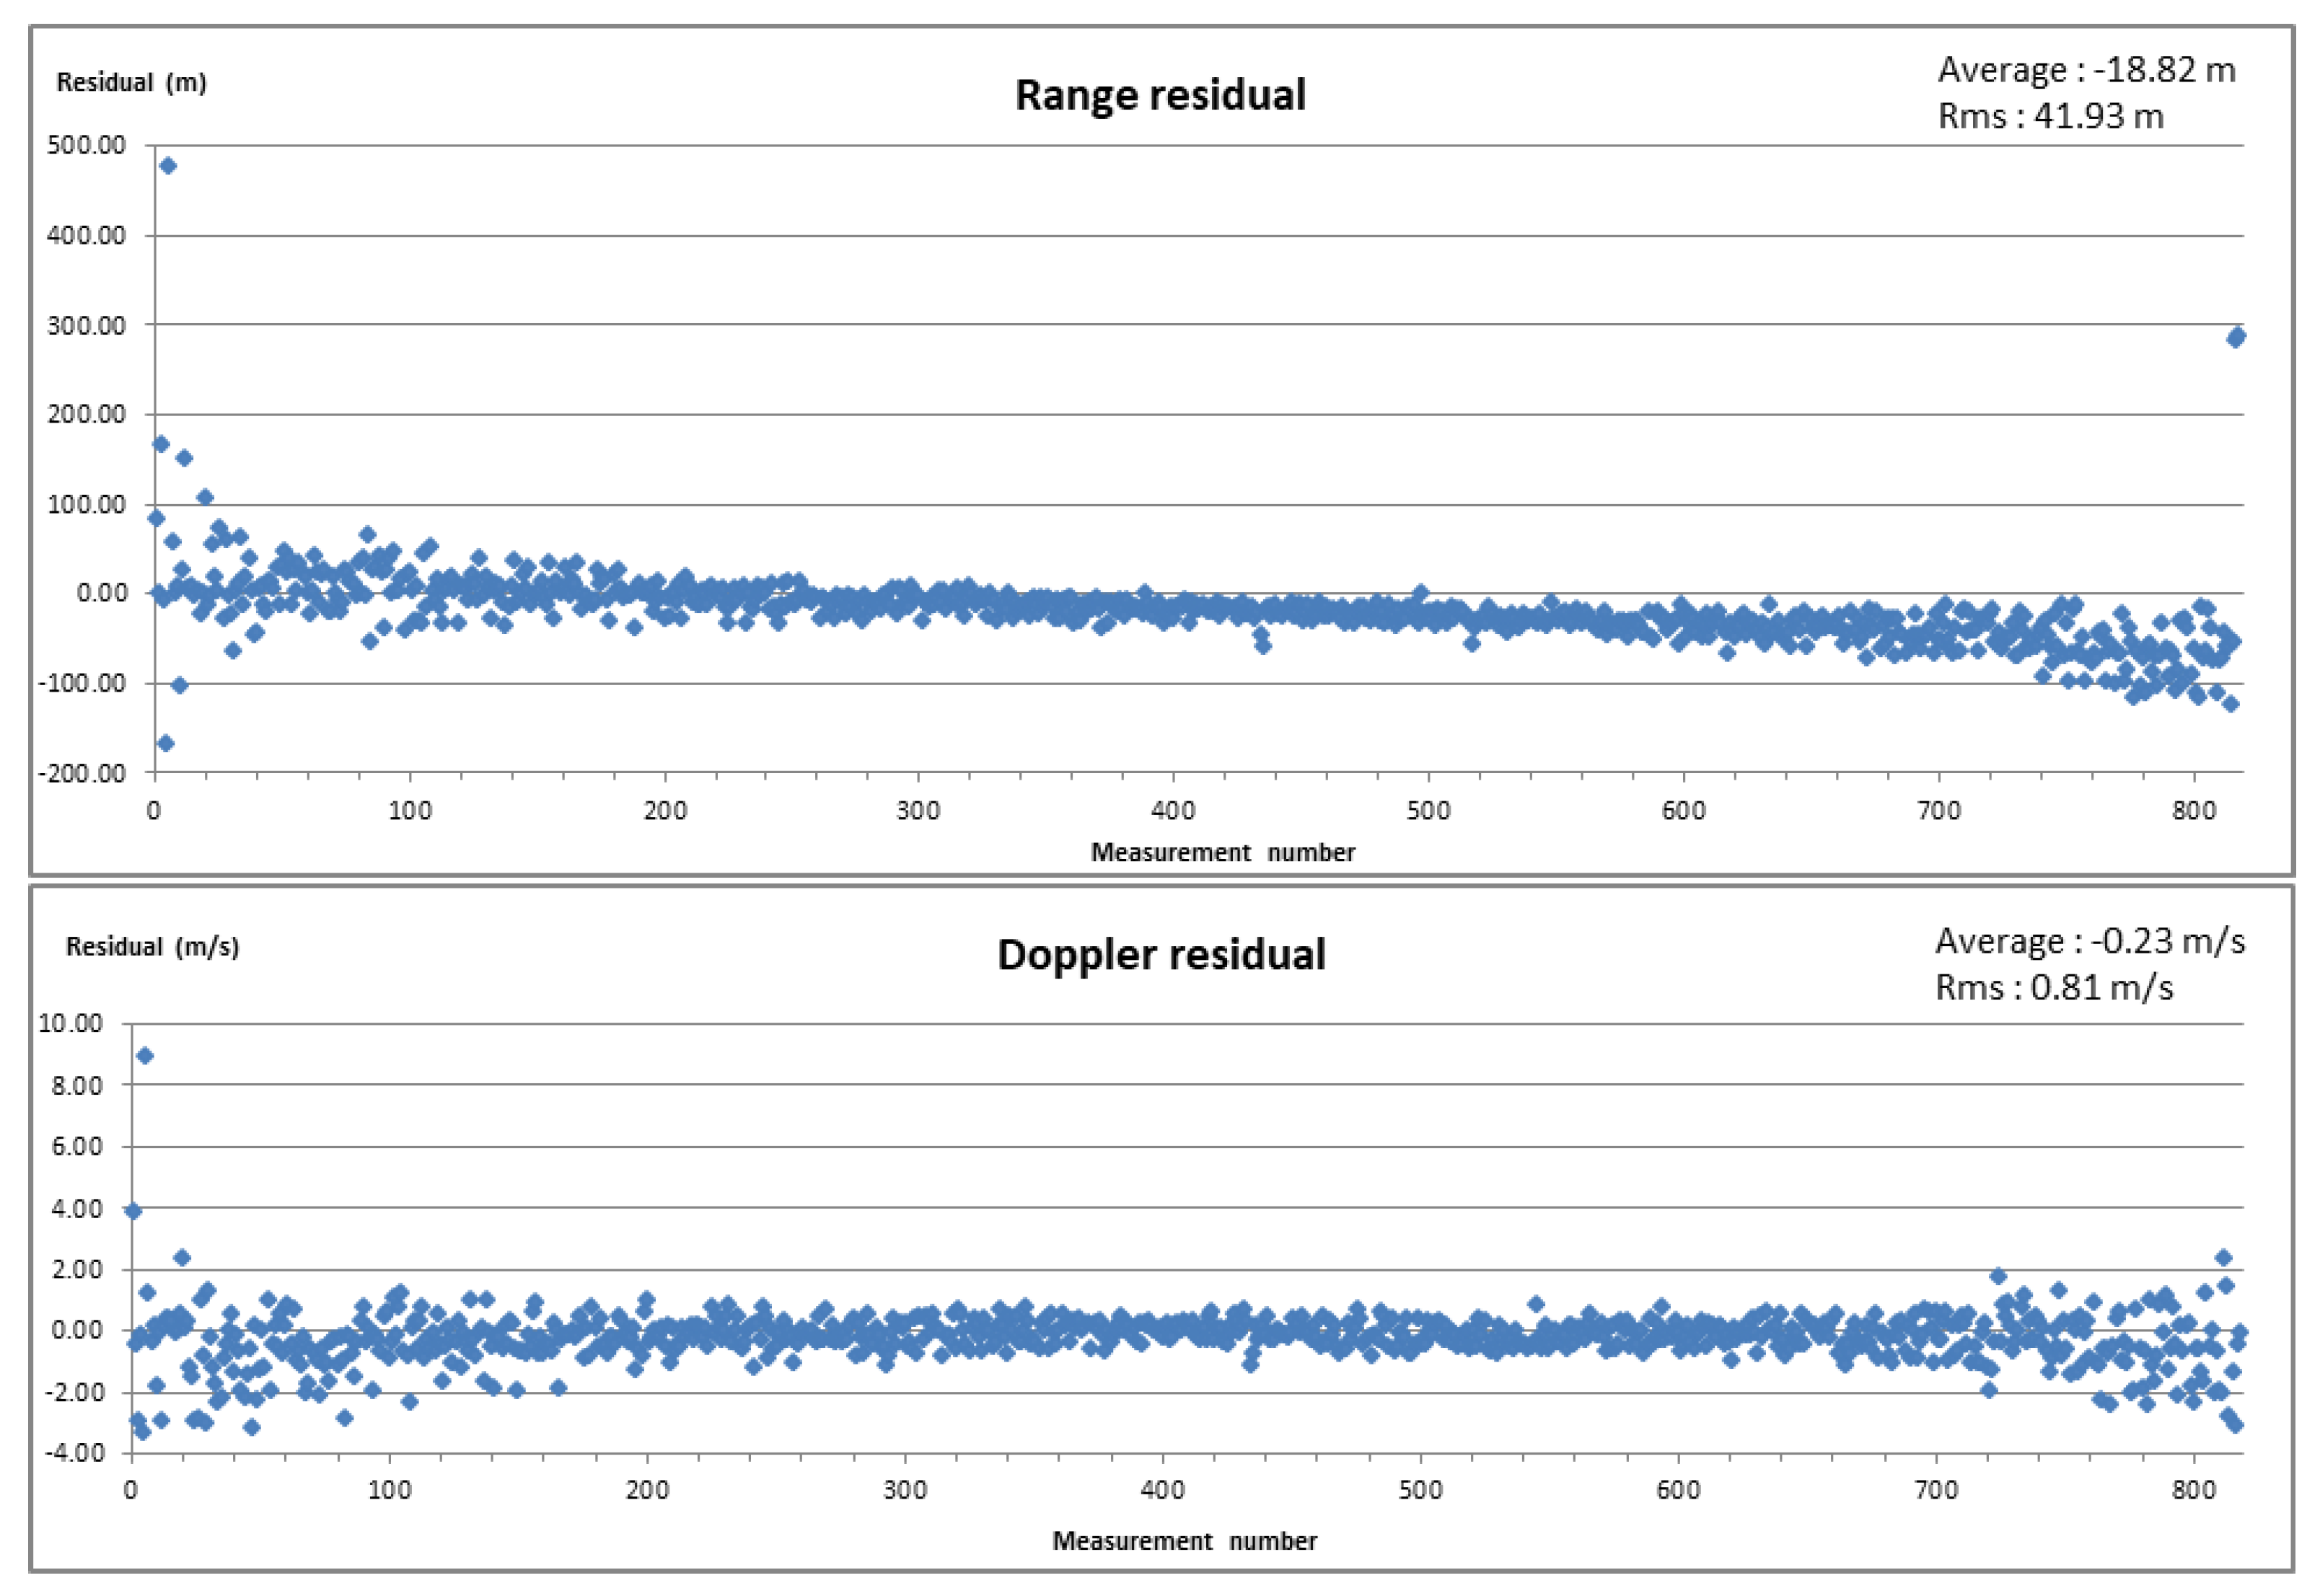
Figure 7 presents the range and Doppler residuals, in meters relative to the slant range, for the radar measurements in the visibility window starting at 21 August 2024 06:26:49 UTC, while Figure 8 presents the range and Doppler residuals, in meters relative to the slant range, for the radar measurements in the visibility window starting at 20 August 2024 09:26:35 UTC. The outliers are produced by the environmental interferences. The tracks have between 255 and 818 measuring points (samples).
Figure 7 and Figure 8 present the measurements relative to the measurement number (which is in fact, timestamps), to better suggest the unbiased computation of average and rms values.
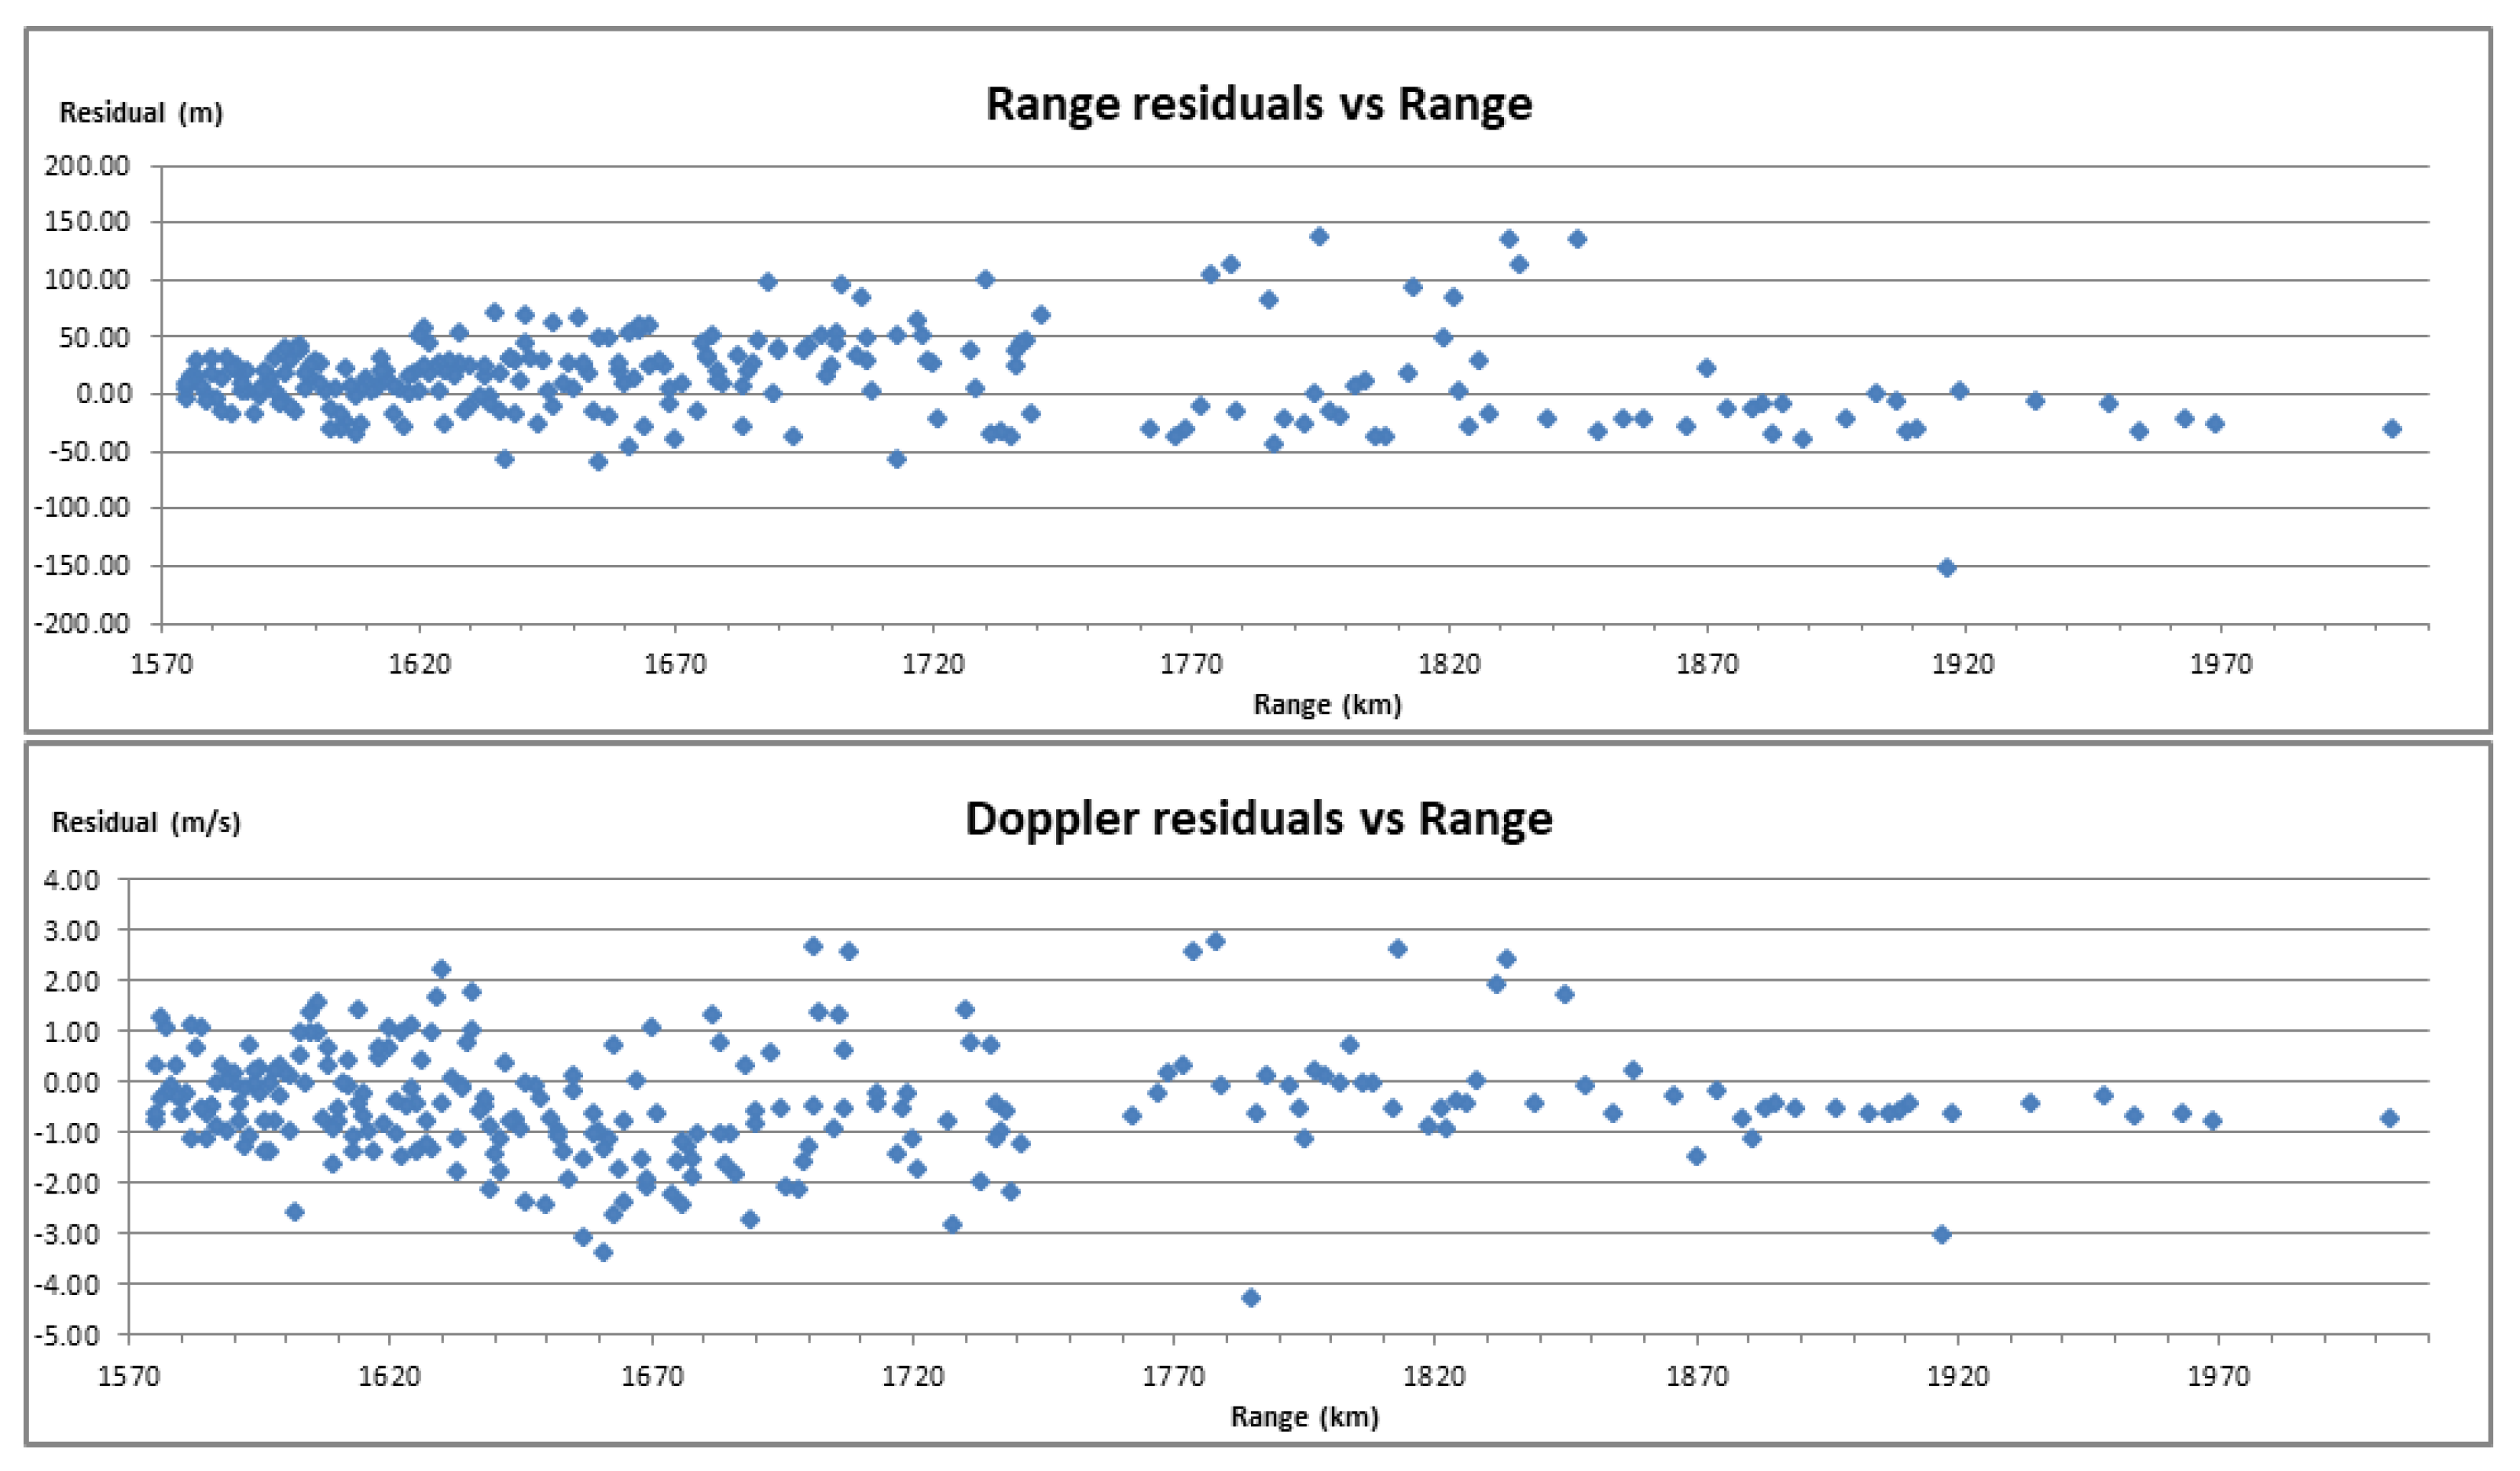
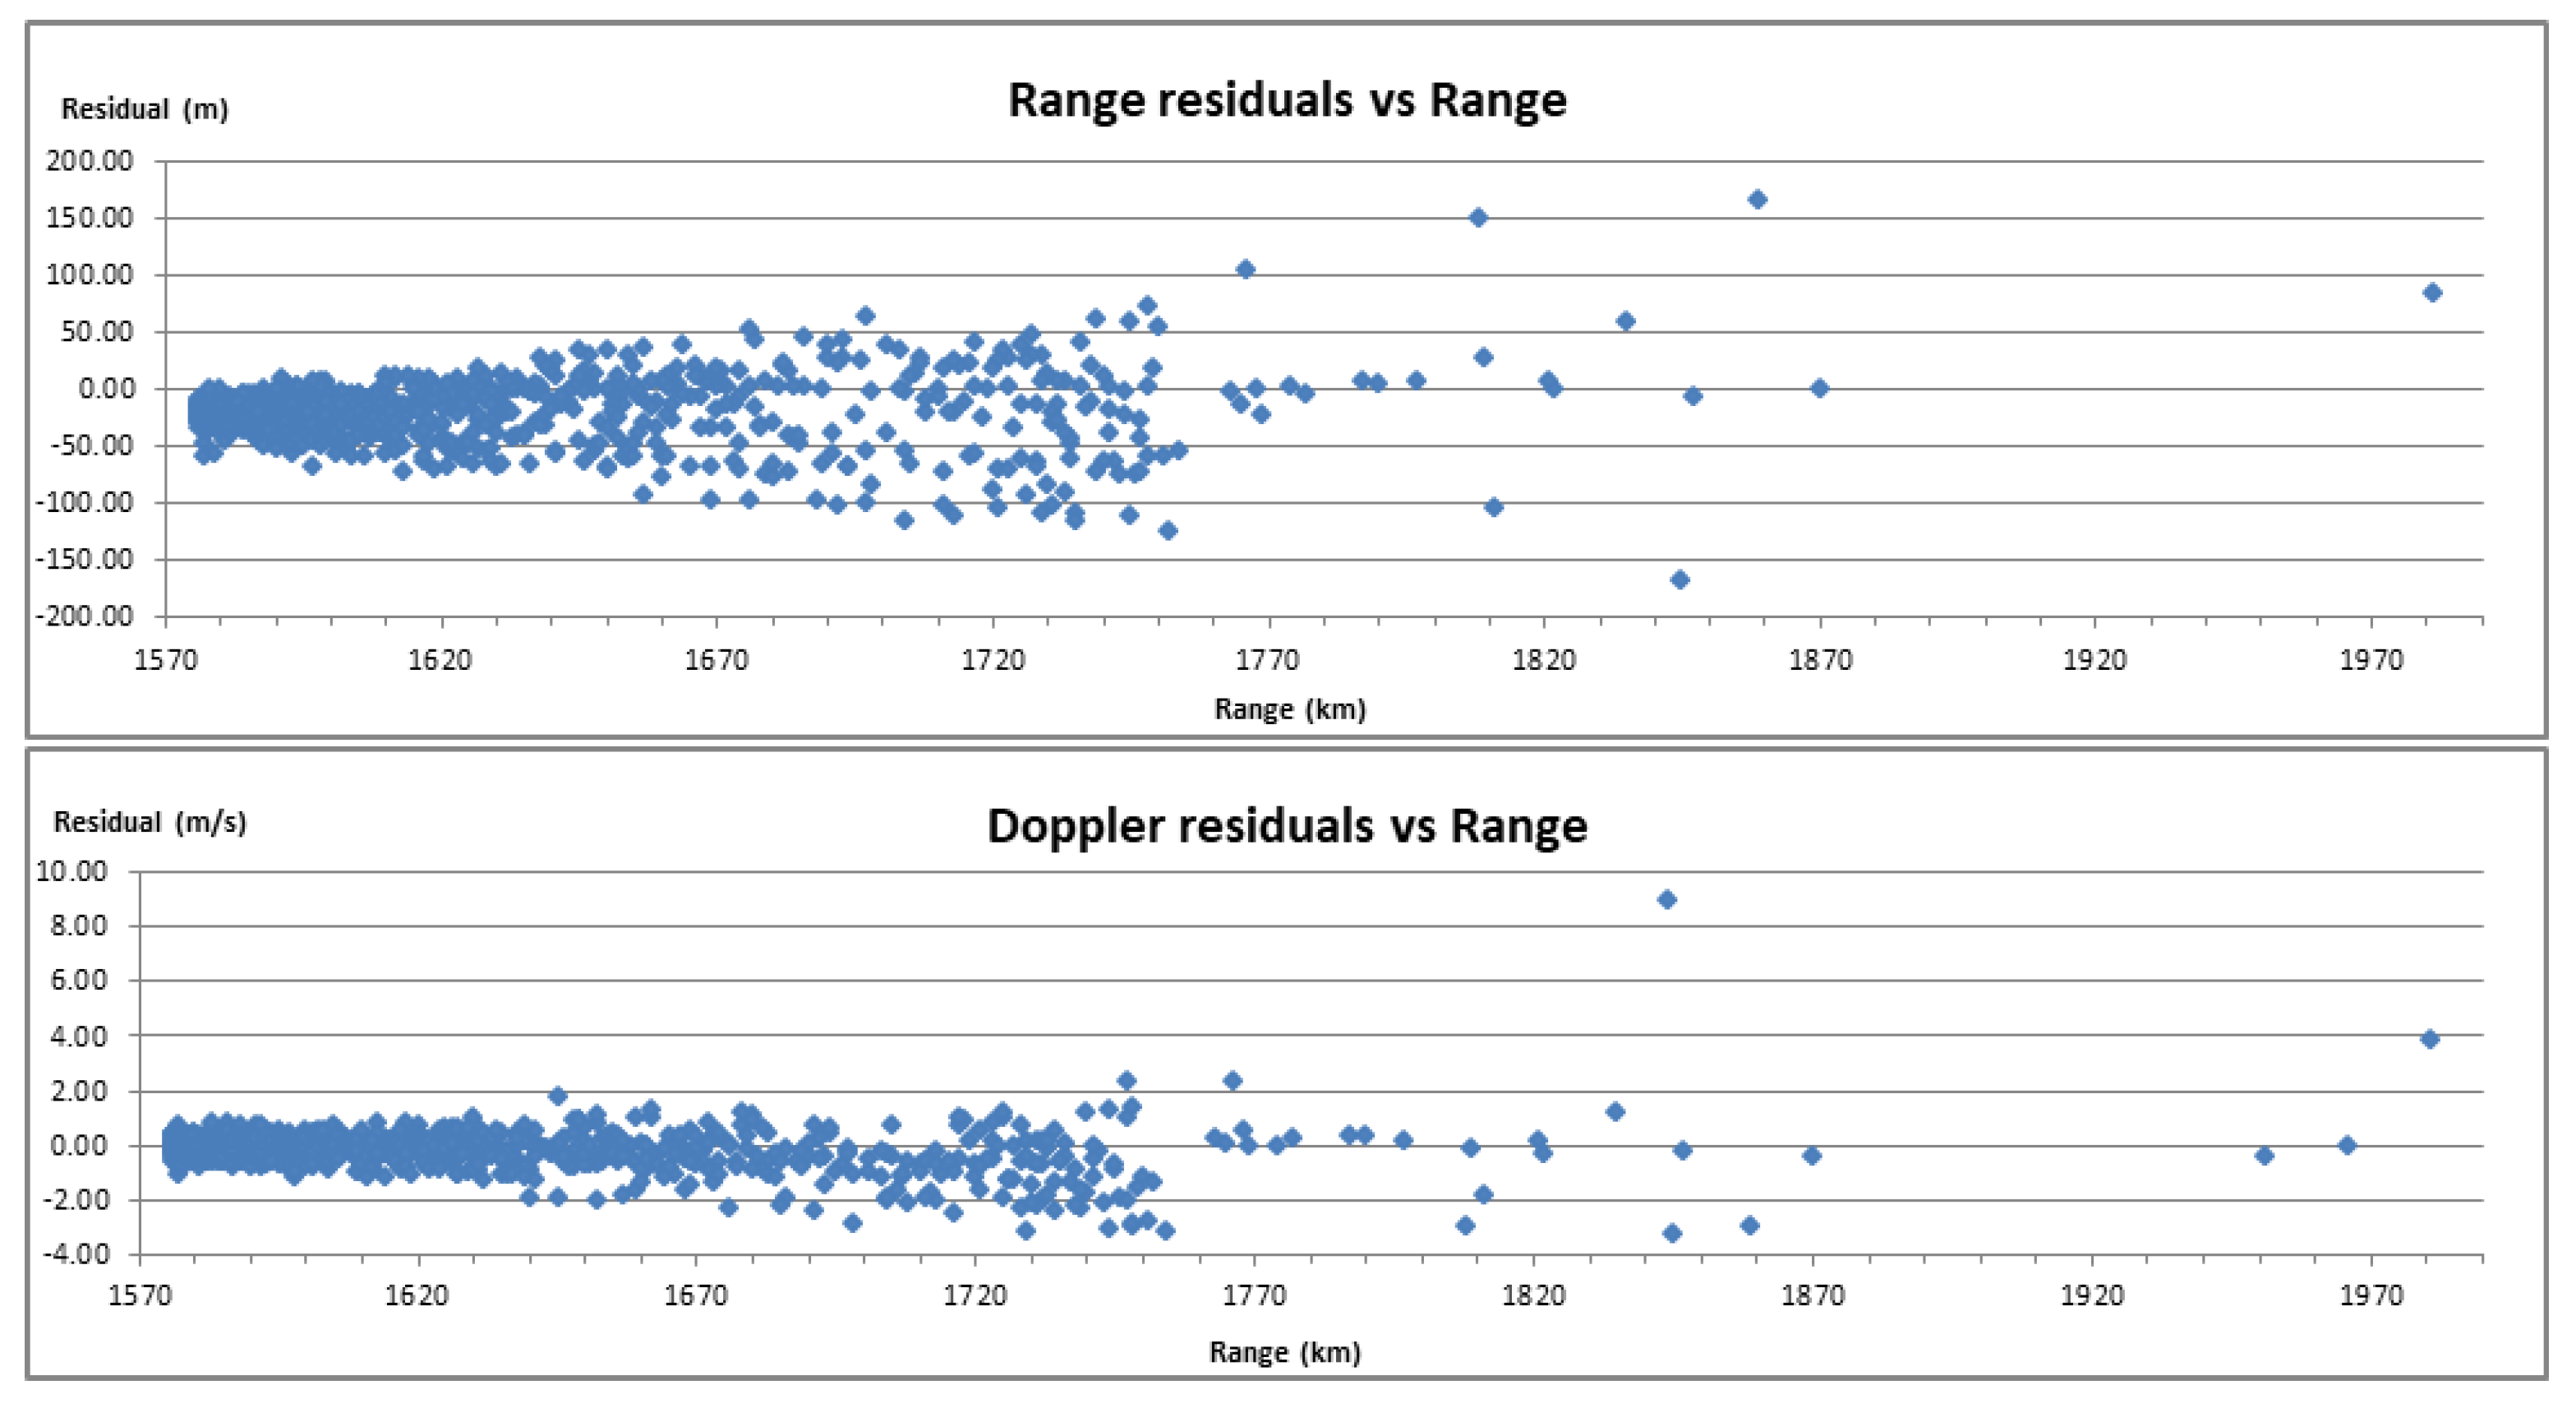
Figure 9 and Figure 10 present the same as Figure 7 and Figure 8 but relative to the radar slant range. They are intended to present the range distribution density of the measurements relative to the radar range.
The range distributions of the residuals show similar outliers at ranges of 1970 km and 1620 Km. This suggests that the radar has far better potential accuracy, the errors being produced by the environmental perturbations, produced by the radio link, rather than by the noise. As the radar distance to the satellite decreases further, the outliers become less prominent, since the target signal to perturbations ratio (SINAD) increases. The prevalence of the environmental perturbation suggests that the detection capability is also reduced by the phase noise produced by the radio link. The average and accuracy (rms of the errors) values for several measurements are presented in Table 4 and Table 5.
Data in the table accounts for all measured data, including the outliers. Measurements 2 and 5 are strongly affected by outliers produced by the radio link placed on the tower between the antennas. This suggests that the accuracy can be seriously improved by removing outliers. Each measurement can be considered as a sample of the total process defining the radar behavior. As a result, the total population consisting of the sum of the measurement points can be studied to better characterize the accuracy of the radar. The behavior of the process, analyzed using the whole 6926 samples and large subsets obtained by removing the large outliers outside a certain interval (expressed as factors of initial range dispersion) is presented in Table 6 and Table 7.
The tables show that an AI-based outliers reduction algorithm would be able to substantially increase radar range and Doppler accuracy with acceptable data loss. For example, by setting the limit to 2.0 sigma, the accuracy is improved by 32% while losing only 4.2% of data. Currently, the outliers reduction is performed manually.

3.3. Angular Accuracy

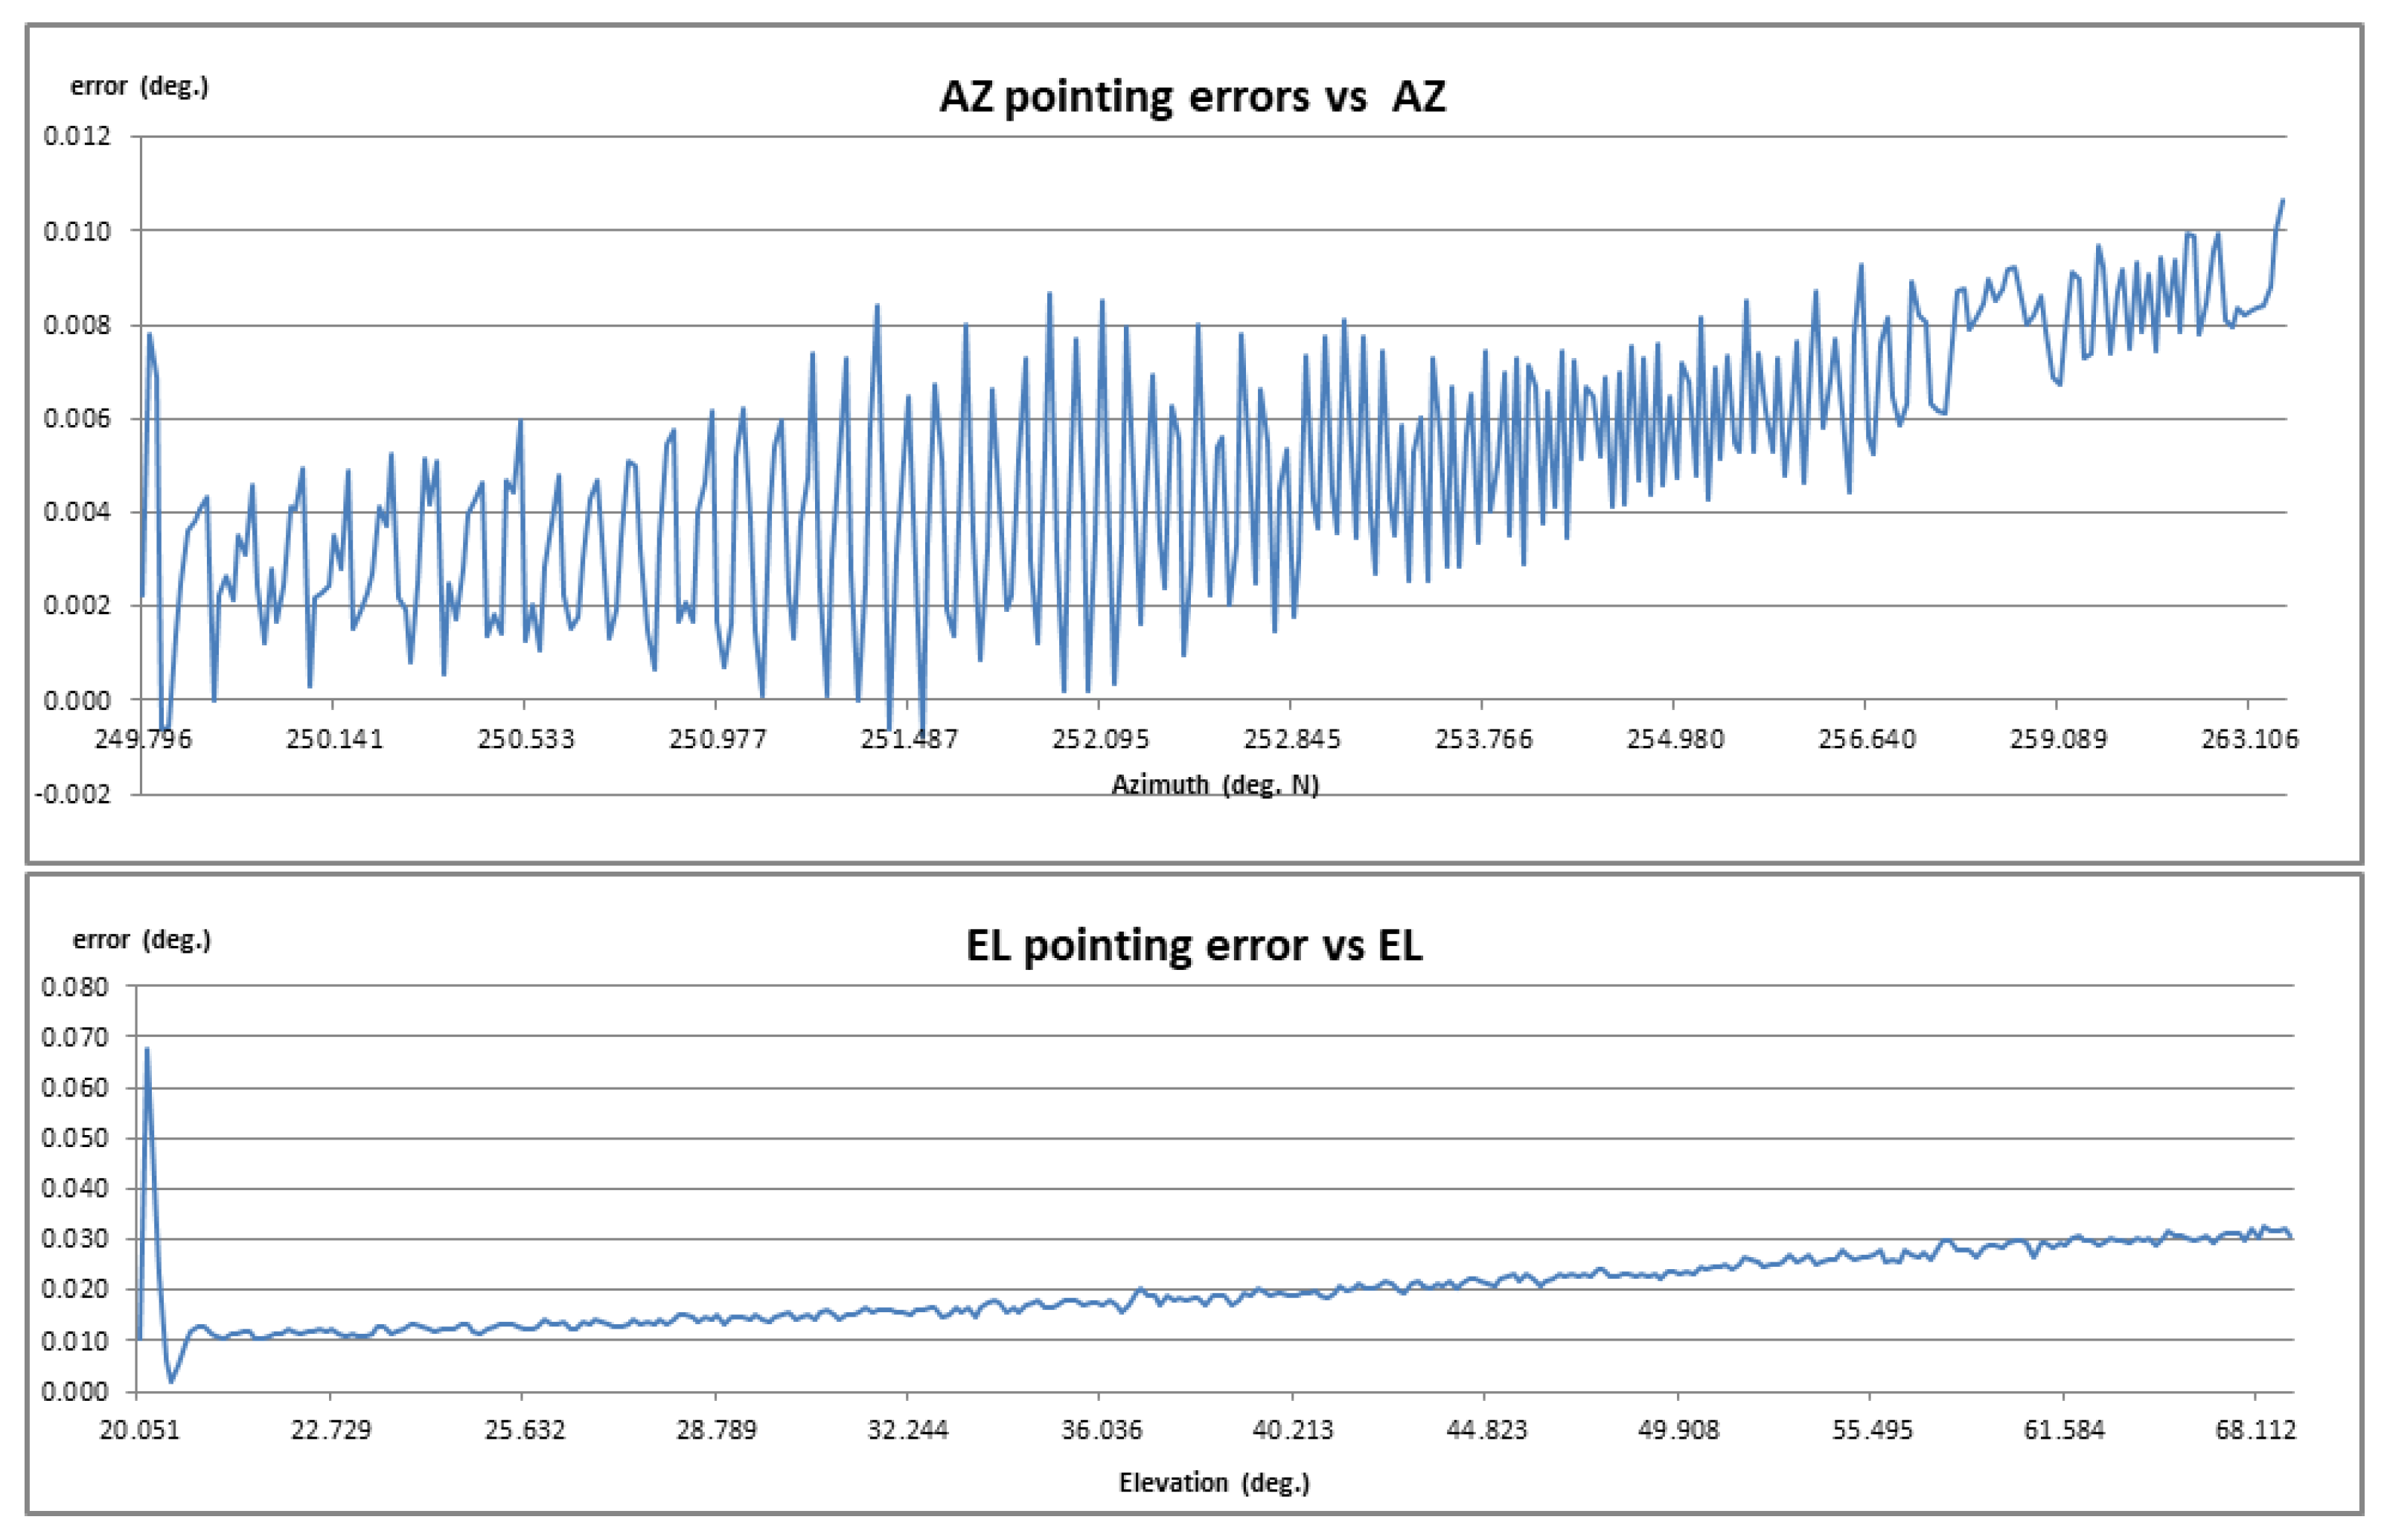
The azimuth ( δ A Z ) and elevation ( δ E L ) errors of the measurements, that are really the TLE data confirmed by the radar, are computed as differences between the radar antenna position and the testing satellite real angular positions. It is to be noted that the radar measures in spherical coordinates, thus the azimuth ( ϵ A Z ) and elevation ( ϵ E L ) pointing errors are derived from the azimuth ( δ A Z ) and elevation ( δ E L ) positioning errors as follows:
ϵ A Z = δ A Z · cos ( E L )
ϵ E L = δ E L
Figure 11 shows the azimuth and elevation pointing errors for Ajisai on 21 August 2024, window at 06:26:49 UTC (real trajectory reference). The shape of the error suggests that the antennas movement is not entirely smooth, due to their considerable age. Note that the retrofit of the antennas comprised only of upgrading the positioning system (electrical and electronic parts), whereas the mechanical parts (azimuth rail, elevation tooth wheel, antenna reflect-array panels and feeder) were kept unchanged.
Figure 12 shows the azimuth and elevation pointing errors for Ajisai on 20 August 2024, window at 06:26:35 UTC. Even though strong periodic wind gusts are present, the incurring errors are far below 0.055 degrees, which is the halfpower beamwidth of the antenna.
The maximum angular pointing errors for several measurements are presented in Table 8.
The maximum pointing errors are small, far below 0.055 degrees, which is the halfpower beamwidth of the antenna. As a result, the measurements could be performed without an auto-tracking feature, except for the satellites maneuvering during measurement.

4. Discussion

It is feasible to retrofit pairs of legacy high-gain satellite communication antennas for use as space surveillance radars. Compared to adapting an antenna for radio astronomy; however, the retrofit process is more complex. Most of the required hardware can be implemented with commercial off-the-shelf (COTS) or modified-COTS components, with only a few fully custom modules needed—primarily the receiver, time-stamping unit, and signal processor software.
If the antennas are operated within their original design bandwidth, retrofitting of the feeders is not necessary. The antennas need not be co-located, but they do require a dedicated, latency-controlled communication link between them.
Conversion into an LFMCW radar is particularly attractive: former communication antennas typically have modest transmit power capability but very high-quality feed systems. Moreover, LFMCW radars maintain good performance even in electromagnetically polluted environments—an important advantage since most of these antenna sites are in areas with significant RF pollution. For very high range accuracy (<10 m), obstacles in the near-field beam must be cleared, electromagnetic interference must be mitigated, and ionospheric dispersion effects considered.
Achieving both high range and Doppler accuracy (<50 m and <1.5 m/s, respectively) requires a dedicated time-stamping system synchronized to a low-latency, high-quality time reference and to the modulation of the transmitted signal. Detection performance can be enhanced without raising transmit power by improving the electromagnetic isolation of the antennas and/or by increasing modulation bandwidth. For example, the Cheia radar operates at only 2.5 kW yet can detect and track targets as small as 16 cm at 1000 km altitude. Similarly, use of an RF generator with very low phase noise can also increase detection capability without higher transmit power.
The system includes a multimode auto-tracking function, but this has not been employed due to strong interference (from reflections and transmissions) introduced by the radiolink installed on the tower between the two antennas. Because the antennas are mechanically dissimilar, the auto-track error signal is expected to be useful only on the receiving antenna, given differences in inertia and pointing accuracy.
At present, the radar operates in programmed-tracking mode: the antennas follows: precomputed trajectories derived from Two-Line Elements (TLEs). This approach has proven sufficiently accurate to keep tracked objects within the antennas’ beamwidths.
Finally, paper [31] expands on the lessons learned.

Author Contributions

Conceptualization, C.B. and L.I.; methodology, L.I.; software, C.B. and R.H.; validation, C.B., L.I. and R.H.; formal analysis, L.I.; investigation, C.B. and L.I.; resources, C.B., L.I. and R.H.; data curation, L.I.; writing—original draft preparation, L.I.; writing—review and editing, C.B. and R.H.; visualization, C.B. and L.I.; supervision, L.I.; project administration, L.I.; funding acquisition, C.B. and L.I. All authors have read and agreed to the published version of the manuscript.

Funding

The research and development activities described in this paper were carried out within a series of three contracts financed by the European Space Agency (ESA) and awarded to a consortium led by RARTEL S.A., Bucharest, Romania: SSA for Romania, Contract No. 4000108671/13/D/MRP; SSA P3-SST-IV-CHEIA PHASE 1; SSA P3-SST-V-CHEIA PHASE 2. The data presented in this study are available on request from the corresponding author. The APC was funded by National University of Science and Technology POLITEHNICA Bucharest. Author L.I. was working as a self-employed person under contract with RARTEL SA during the development of the radar. The calibration data was collected during the acceptance tests and was presented publicly on different occasions. Even though the author is currently a RARTEL SA employee, the data processing and analysis performed by the author throughout this paper is not related to the company.

Data Availability Statement

The data are not publicly available due to the clauses of the previously mentioned contracts.

Acknowledgments

We would like to thank RARTEL’s, Silicon Acuity’s, and Ad Hoc Telecom Solution’s employees for their hard work in making the project, and therefore, this paper, possible. In addition, we would like to thank the POLITEHNICA Bucharest for supporting us by funding various taxes for conferences and journals, therefore making our scientific journey, possible.

Conflicts of Interest

Author L.I. was working as a self-employed person under contract with RARTEL SA during the development of the radar. The calibration data was collected during the acceptance tests and was presented publicly on different occasions. Even though the author is currently a RARTEL SA employee, the data processing and analysis performed by the author throughout this paper is not related to the company. The authors declare no conflicts of interest. The funders had no role in the writing of the manuscript or in the decision to publish the results.

References

  1. Societatea Naţională de Radiocomunicaţii, S.A.; (RADIOCOM). Centrul de Comunicaţii Prin Satelit CHEIA. Available online: https://radiocom.ro/servicii/transmisii-de-date/comunicatii-prin-satelit/ (accessed on 2 February 2021).
  2. Ionescu, L.; Rusu-Casandra, A.; Bira, C.; Tatomirescu, A.; Tramandan, I.; Scagnoli, R.; Istriteanu, D.; Popa, A.E. Development of the Romanian Radar Sensor for Space Surveillance and Tracking Activities. Sensors 2022, 22, 3546. [Google Scholar] [CrossRef]
  3. Muntoni, G.; Montisci, G.; Pisanu, T.; Andronico, P.; Valente, G. Crowded Space: A Review on Radar Measurements for Space Debris Monitoring and Tracking. Appl. Sci. 2021, 11, 1364. [Google Scholar] [CrossRef]
  4. Flohrer, T.; Krag, H.; Klinkrad, H.; Kuusela, J.; Leushacke, L.; Schildknecht, T.; Plöner, M. Orbit Determination from Combined Radar and Optical Tracks during XMM Contingency Operations. In Proceedings of the 5th European Conference on Space Debris, Darmstadt, Germany, 30 March–2 April 2009. ESASP–672. [Google Scholar]
  5. Albrecht, M.; Reising, C.; Behrendt, D.; Rudrappa, M.T.; Müller, P.; Gilles, M.; Käske, M.; Knauf, C. Improvements of GESTRA—A Phased-Array Radar Network for the Surveillance of Resident Space Objects in Low-Earth Orbit. In Proceedings of the 2nd NEO and Debris Detection Conference (NEOSST2), Darmstadt, Germany, 24–26 January 2023. [Google Scholar]
  6. Neuberger, N.; Kollecker, S.; Käske, M.; Horstmann, S.; Prünte, L. GESTRA: First Results of LEO Object Parameter Estimation. In Proceedings of the 2nd NEO and Debris Detection Conference (NEOSST2), Darmstadt, Germany, 24–26 January 2023. [Google Scholar]
  7. Wilden, H.; Kirchner, C.; Peters, O.; Bekhti, N.B.; Kohlleppel, R.; Brenner, A.; Eversberg, T. GESTRA—Technology Aspects and Mode Design for Space Surveillance and Tracking. In Proceedings of the 7th European Conference on Space Debris (SDC7), Darmstadt, Germany, 18–21 April 2017. [Google Scholar]
  8. Fröhlich, A.; et al. Overview and Outlook of Space Surveillance Systems at Fraunhofer FHR. PAF Workshop Presentation. 2022. Available online: https://research.csiro.au/ratechnologies/wp-content/uploads/sites/295/2022/11/PAFAR2022-Froelich-Space_Surveillance_Systems.pdf (accessed on 24 September 2025).
  9. Markkanen, J.; Postila, M.; Huuskonen, A.; Lehtinen, M. Small-size Space Debris Data Collection with the EISCAT UHF Radar. In Proceedings of the 4th European Conference on Space Debris (ESA SP-587), Darmstadt, Germany, 18–20 April 2005. [Google Scholar]
  10. EISCAT Scientific Association. European Incoherent Scatter (EISCAT) Scientific Association Annual Report 2010; Technical Report; EISCAT Scientific Association: Kiruna, Sweden, 2011. [Google Scholar]
  11. Markkanen, J.; Postila, M.; Lehtinen, M. Real-time Small-Size Space Debris Detection with EISCAT; Executive Summary for ESOC Contract No. 16646/02/D/HK(CS); EISCAT Scientific Association: Kiruna, Sweden, 2005. [Google Scholar]
  12. Markkanen, J.; Postila, M.; van Eyken, A. Small-Size Space Debris Data Collection with the EISCAT UHF Radar (Slides); Final Report of ESOC Contract No. 18575/04/D/HK(SC); EISCAT Scientific Association: Kiruna, Sweden, 2006. [Google Scholar]
  13. Ruiz, G.; Leushacke, L.; Rosebrock, J. Algorithms for Multi-Beam Receiver Data Analysis. In Proceedings of the 4th European Conference on Space Debris (ESA SP-587, SDC4), Darmstadt, Germany, 18–20 April 2005. [Google Scholar]
  14. Letsch, K.; Leushacke, L.; Rosebrock, J.; Jehn, R.; Krag, H.; Keller, R. First Results from the Multibeam Bistatic Beampark Experiments at FGAN. In Proceedings of the 5th European Conference on Space Debris (ESA SP-672, SDC5), Darmstadt, Germany, 30 March–2 April 2009. [Google Scholar]
  15. Marto, S.; Vasile, M.; Riofrio, S.D.; Ilioudis, C.; Clemente, C. Survey of Manoeuvre Detection Methods and their Application to Multi-Static Radar. In Proceedings of the AMOS Conference 2022, Adelaide, Australia, 28 November–2 December 2022. [Google Scholar]
  16. Lincoln Laboratory, Massachusetts Institute of Technology. Haystack Ultra-wideband Satellite Imaging Radar (HUSIR). 2014. Available online: https://www.ll.mit.edu/r-d/projects/haystack-ultrawideband-satellite-imaging-radar (accessed on 24 September 2025).
  17. Nakamura, S.; Tajima, T.; Kudoh, N.; Abe, J.; Someya, K.; Ono, K.; Kameyama, M.; Adachi, G.; Aoki, S. System Performance Evaluation and Improvement by Using KSGC Radar Data of Space Debris Observations. In Proceedings of the 6th European Conference on Space Debris (ESA SP-723), Darmstadt, Germany, 22–25 April 2013. [Google Scholar]
  18. JAXA. Space Situational Awareness System in Japan. 2020. Available online: https://global.jaxa.jp/projects/ssa/index.html (accessed on 24 September 2025).
  19. Kibe, S.; Kawamoto, S.; Nakajima, T.; Toda, S. Space Debris Related Activities in Japan—Past, Present, and Future. In Proceedings of the 3rd European Conference on Space Debris (ESA SP-473), Darmstadt, Germany, 19–21 March 2001. [Google Scholar]
  20. Lizia, P.D.; Massari, M.; Losacco, M.; Bianchi, G.; Mattana, A.; Pupillo, G.; Bortolotti, C.; Roma, M.; Morselli, A.; Armellin, R.; et al. Performance Assessment of the Multibeam Radar Sensor BIRALES for Space Surveillance and Tracking. In Proceedings of the 7th European Conference on Space Debris (ESA SP-820), Darmstadt, Germany, 18–21 April 2017. [Google Scholar]
  21. Pisanu, T.; Muntoni, G.; Schirru, L.; Ortu, P.; Urru, E.; Montisci, G. Recent Advances of the BIRALET System about Space Debris Detection. Aerospace 2021, 8, 86. [Google Scholar] [CrossRef]
  22. Perez Hernandez, C.; Ramos Prada, M.A.; Alessandrini, M.; Cano Mañanes, D.; Siminski, J.; Pelorossi, F.; Besso, P.; Pinna, G.; Casado Gómez, R.; Martínez-Villa Salmerón, J. Operational review and analysis of the S3T surveillance radar. In Proceedings of the 8th European Conference on Space Debris, Darmstadt, Germany, 20–23 April 2021. [Google Scholar]
  23. Gómez, R.C.; Besso, P.; Pinna, G.M.; Alessandrini, M.; Salmerón, J.M.; Prada, M.A. Initial operations of the breakthrough Spanish Space Surveillance and Tracking Radar (S3TSR) in the European Context In Proceedings of the 1st NEO and Debris Detection Conference (NEOSST-1), Darmstadt, Germany, 22–24 January 2019.
  24. Wehner, D.R. High-Resolution Radar, 2nd ed.; Artech House Radar Library; Artech House: Norwood, MA, USA, 1994. [Google Scholar]
  25. Barton, D.K. Modern Radar System Analysis; Artech House: Norwood, MA, USA, 1988. [Google Scholar]
  26. Ionescu, L.; Scagnoli, R.; Istriteanu, D.; Turcu, V. Cheia antennas retrofit to a space tracking radar. In Proceedings of the 1st NEO and Debris Detection Conference, ESA Space Safety Programme Office, Darmstadt, Germany, 22–24 January 2019. [Google Scholar]
  27. Bîră, C.; Ionescu, L.; Rusu-Casandra, A. The Radar Signal Processor of the First Romanian Space Surveillance Radar. Remote Sens. 2023, 15, 3630. [Google Scholar] [CrossRef]
  28. Tramandan, I.; Rusu-Casandra, A. Real-Time Monitoring and Command System for the Cheia Space Surveillance and Tracking Radar. In Proceedings of the ISETC 2022 Conference, Timisoara, Romania, 10–11 November 2022. [Google Scholar]
  29. EUROLAS Data Center (EDC). EUROLAS Orbits. 2025. Available online: https://edc.dgfi.tum.de/pub/slr/products/orbits/ (accessed on 24 July 2025).
  30. EUROLAS Data Center (EDC). EUROLAS Orbits for Ajisai. 2025. Available online: https://edc.dgfi.tum.de/pub/slr/products/orbits/ajisai/240821 (accessed on 24 July 2025).
  31. Ionescu, L.; Scagnoli, R.; Bira, C.; Hobincu, R.; Bostan, D. Cheia Tracking Radar, Measurement Results and Lessons Learned. In Proceedings of the 9th European Conference on Space Debris, Bonn, Germany, 1–4 April 2025. [Google Scholar]
Figure 1. Cheia SST Radar antennas.
Remotesensing 17 03322 g001
Figure 2. Radar general diagram.
Remotesensing 17 03322 g002
Figure 3. Frequencies of the transmitted, received, and beat signals.
Remotesensing 17 03322 g003
Figure 4. Processing diagram of the CW signal in the Sum Receiver.
Remotesensing 17 03322 g004
Figure 5. Detection range for Calsphere1 on 11 December 2023 (left) and Calsphere 4A on 21 November 2023 (right).
Remotesensing 17 03322 g005
Figure 6. Detection range for Larets on 31 July 2024 (left) and Rigidsphere 2 LCS4 on 8 December 2023 (right).
Remotesensing 17 03322 g006
Figure 7. Range and Doppler residuals for Ajisai on 21 August 2024, window at 06:26 UTC.
Remotesensing 17 03322 g007
Figure 8. Range and Doppler residuals for Ajisai on 20 August 2024, window at 09:26 UTC.
Remotesensing 17 03322 g008
Figure 9. Range and Doppler residuals range distribution for Ajisai on 21 August 2024, 06:26 UTC (same average and rms as Figure 7).
Remotesensing 17 03322 g009
Figure 10. Range and Doppler residuals range distribution for Ajisai on 20 August 2024, 09:26 UTC (same average and rms as Figure 8).
Remotesensing 17 03322 g010
Figure 11. Azimuth and elevation pointing errors for Ajisai on 21 August 2024, window at 06:26 UTC (real trajectory reference).
Remotesensing 17 03322 g011
Figure 12. Azimuth and elevation errors for Ajisai on 20 August 2024, window at 09:26 UTC (real trajectory reference).
Remotesensing 17 03322 g012
Table 1. Main technical specifications of the high-gain antennas in Cheia Communications Center.
ParameterCheia 1Cheia 2
ModelIntelsat Standard A EarthIntelsat Standard A
Station Mark IVStation Mark IV
ManufacturerNippon Electric Co.,Nippon Electric Co.,
Ltd. (NEC), Tokio, JapanLtd. (NEC), Tokio, Japan
Diameter32 m32 m
Year of installation19761979
Originally usedIntelsat IS—905 at 335.5°EIntelsat IS—904 at 60.0°E
Total weight309 ton260 ton
Azimuthal track diameter16.97 m14.58 m
Subreflector diameter2.25 m1.98 m
Azimuth scanning−170°  ÷ +360°−170° ÷ +360°
(relative to N, after retrofit)
Elevation scanning0°–92°0°–92°
Tracking speed1°/s1°/s (after retrofit)
(after retrofit)
Tracking acceleration0.5°/s2 (after retrofit)0.5°/s2 (after retrofit)
Bandwidth3.6–6.4 GHz3.6–6.4 GHz
Antenna gain @6.0 GHz>63 dBi (@6.0 GHz)>63 dBi (@6.0 GHz)
G/T factor (EL > 20°) *>41>41
Beamwidth0.11°0.11°
PolarizationDual circularDual circular
Isolation between antennas>93 dB>93 dB
Orthogonal port isolation>25 dB>25 dB
VSWR @6.0 GHz (RH/LH port) *1.016/1.0161.013/1.009
Maximum power @6.0 GHz10 kW10 kW
* measured for the feasibility study and reconfirmed during implementation.
Table 2. Ground-based radars employing FM for LEO debris tracking: Tx power and min. detectable RCS. For more details and comparisons with other radars, see paper [2].
RadarBand/RoleTx PowerMin. RCS @ 1000 km
TIRA (FHR) [3,4]L-band tracking∼1 MW (L)∼2 cm
(Wachtberg, Germany)Ku-band imaging13 kW (Ku)∼1 cm bistatic
GESTRA (FHR) [5,6,7,8]L-band FM tracking≥1 kW per module>14 cm at 256 kW
(Koblenz, Germany) estimated
EISCAT [9,10,11,12]VHF/UHF FM1–2 MW (VHF)2.9 cm
(Tromsø, Norway) 100 s kW (UHF)
Effelsberg [3,13,14,15]S/X-band bistatic imagingPassive Rx (Tx from TIRA)∼1 cm (bistatic)
(Bad Münstereifel, Germany)
HUSIR  [16]X-band FM∼700 kW peakunder 1 cm
(Lexington, MA, USA) 36 kW avg.
JAXA Testbeds [17,18]X-band FM exp.Tens of kW (prototype)cm-class under 100 km
(Tsukuba Science City, Japan) (monostatic)
MU [19]VHF1 MW peakunder 32 cm
(Shigaraki, Japan) estimated
BIRALES [20] (Italy)VHF/L survey radar10 kW∼10 cm
(Tx: Salto di Quirra, Italy)
(Rx: Medicina, Italy)
BIRALET [21] (Italy)L-band bistatic tracking10 kW∼30–50 cm
(Tx: Salto di Quirra, Italy)
(Rx: San Basilio, Italy)
S3TSR [22,23]L-band phased-arrayMW-class∼50 cm
(Seville, Spain)SST radar
Cheia (this work)C-band FMCW tracking2.5 kW16 cm (crowded 
(Cheia, Romania) electromagnetic env)
Table 3. Detection capability of the Cheia radar.
Satellite/DateParametersValuesWeather
Calspere 4A
21 November 2023
Max Range (km)1225Fair
Elevation Max Range66.0
SNR max (dB)13.39
RCS 1000 ( m 2 )0.020
RCS equivalent size (cm)16
Calspere 1
11 December 2023
Max Range (km)1085Fair
Elevation Max Range65.8
SNR max (dB)12.39
RCS 1000 ( m 2 )0.033
RCS equivalent size (cm)19
Rigidsphere 2 LCS4
13 December 2023
Max Range (km)1485Intermediate
Elevation Max Range24.8
SNR max (dB)12.46
RCS 1000 ( m 2 )0.191
RCS equivalent size (cm)49
Larets
15 December 2023
Max Range (km)1040Intermediate
Elevation Max Range37.4
SNR max (dB)12.35
RCS 1000 ( m 2 )0.135
RCS equivalent size (cm)41
Larets
16 December 2023
Max Range (km)881Intermediate
Elevation Max Range49.5
SNR max (dB)13.11
RCS 1000 ( m 2 )0.224
RCS equivalent size (cm)53
Larets
31 July 2024
Max Range (km)793Bad
Elevation Max Range59.3
SNR max (dB)13.19
RCS 1000 ( m 2 )0.346
RCS equivalent size (cm)66
Rigidsphere 2 LCS4
8 December 2023
Max Range (km)1255Bad
Elevation Max Range33.8
SNR max (dB)12.28
RCS 1000 ( m 2 )0.375
RCS equivalent size (cm)67
Rigidsphere 2 LCS4
12 December 2023
Max Range (km)1324Bad
Elevation Max Range31.7
SNR max (dB)13.63
RCS 1000 ( m 2 )0.303
RCS equivalent size (cm)62
Table 4. Average and accuracy (rms) for calibration measurements 1 to 7.
Measurement nr.1234567
Range average (m)12.2984.14−3.01−22.16−12.4−24.7−32.78
Range accuracy (m)42.12129.6832.7639.5156.1731.048.69
Doppler average (m/s)−0.030.28−0.430.27−0.210.00−0.07
Doppler accuracy (m/s)0.880.761.160.711.570.610.93
Measurement points38578203774370699258
Table 5. Average and accuracy (rms) for calibration measurements 8 to 14.
Measurement nr.891011121314
Range average (m)−26.77−16.62−18.99−18.824.1412.78−24.57
Range accuracy (m)33.7537.3639.1641.9333.1338.2532.12
Doppler average (m/s)−0.13−0.14−0.12−0.23−0.10−0.430.11
Doppler accuracy (m/s)0.550.931.170.810.791.190.53
Measurement points625844813818844255620
Table 6. Measuring process behavior when reducing outliers outside an interval (light reduction).
IntervalNone6.0 σ 5.5 σ 5.0 σ 4.5 σ 4.0 σ
Data reduction (%)00.270.350.480.701.0
Range average (m)−13.85−14.71−14.82−15.11−15.15−15.30
Range accuracy (m)40.6937.5037.0136.2635.1533.90
Range dispersion (m)38.2634.4933.9232.9631.7230.26
Doppler average (m/s)−0.07−0.064−0.065−0.065−0.068−0.068
Doppler accuracy (m/s)0.8870.8160.8160.8140.8110.803
Doppler dispersion (m/s)0.8840.8130.8130.8110.8080.800
Table 7. Measuring process behavior when reducing outliers outside an interval (strong reduction)).
Interval3.5 σ 3.0 σ 2.5 σ 2.0 σ 1.5 σ 1.0 σ
Data reduction (%)1.52.12.94.26.916.7
Range average (m)−15.60−15.70−15.88−15.71−14.89−12.51
Range accuracy (m)32.2030.6529.2427.5525.4321.02
Range dispersion (m)28.1726.3224.5522.6320.6116.89
Doppler average (m/s)−0.064−0.064−0.066−0.071−0.066−0.05
Doppler accuracy (m/s)0.7850.7640.7430.7090.6830.64
Doppler dispersion (m/s)0.7830.7610.7400.7060.6800.64
Table 8. Maximum azimuth and elevation errors across different measurements (expressed in millidegrees).
Measurement nr.123456789101112
Max AZ error (mdeg)2112191818172952081129
Max EL error (mdeg)17141915158211533153351
Disclaimer/Publisher’s Note: The statements, opinions and data contained in all publications are solely those of the individual author(s) and contributor(s) and not of MDPI and/or the editor(s). MDPI and/or the editor(s) disclaim responsibility for any injury to people or property resulting from any ideas, methods, instructions or products referred to in the content.