Article

Surface Urban Heat Island Risk Index Computation Using Remote-Sensed Data and Meta Population Dataset on Naples Urban Area (Italy)

by
Massimo Musacchio
1,*,
Alessia Scalabrini
1,
Malvina Silvestri
1,
Federico Rabuffi
2 and
Antonio Costanzo
1
1
Istituto Nazionale di Geofisica e Vulcanologia, Osservatorio Nazionale Terremoti, Via di Vigna Murata 605, 00143 Rome, Italy
2
Jet Propulsion Laboratory, California Institute of Technology, Pasadena, CA 91109, USA
*
Author to whom correspondence should be addressed.
Remote Sens. 2025, 17(19), 3306; https://doi.org/10.3390/rs17193306
Submission received: 17 June 2025 / Revised: 10 September 2025 / Accepted: 23 September 2025 / Published: 26 September 2025

Abstract

Highlights

What are the main findings?
  • The use of a freely accessible satellite through a data remote computing platform reduces hardware and software requirements.
  • The method includes the integration of population-related information (welfare and other statistical information) and Local Climate Zone (LCZ) classification.
What is the implication of the main finding?
  • The use of long historical data series ensures more robust analysis over time, identifying areas most susceptible to extreme thermal events.
  • This study may provide hints for the relevant authorities in terms of the sustainable development of cities, supporting pollution reduction.

Abstract

Extreme climate events such as heatwaves are becoming more frequent and pose serious challenges in cities. Urban areas are particularly vulnerable because built surfaces absorb and release heat, while human activities generate additional greenhouse gases. This increases health risks, making it crucial to study population exposure to heat stress. This research focuses on Naples, Italy’s most densely populated city, where intense human activity and unique geomorphological conditions influence local temperatures. The presence of a Surface Urban Heat Island (SUHI) is assessed by deriving high-resolution Land Surface Temperature (LST) in a time series ranging from 2013 to 2023, processed with the Statistical Mono Window (SMW) algorithm in the Google Earth Engine (GEE) environment. SMW needs brightness temperature (Tb) extracted from a Landsat 8 (L8) Thermal InfraRed Sensor (TIRS), emissivity from Advanced Spaceborne and Thermal Emission Radiometer Global Emissivity Database (ASTERGED), and atmospheric correction coefficients from the National Center for Environmental Prediction and Atmospheric Research (NCEP/NCAR). A total of 64 nighttime images were processed and analyzed to assess long-term trends and identify the main heat islands in Naples. The hottest image was compared with population data, including demographic categories such as children, elderly people, and pregnant women. A risk index was calculated by combining temperature values, exposure levels, and the vulnerability of each group. Results identified three major heat islands, showing that risk is strongly linked to both population density and heat island distribution. Incorporating Local Climate Zone (LCZ) classification further highlighted the urban areas most prone to extreme heat based on morphology.

1. Introduction

An increase in climate extremes is determined by local exchanges in heat, moisture, and other related quantities (thermodynamic changes) and those associated with atmospheric and oceanic motions (dynamic changes). While thermodynamic and dynamic processes are interconnected, considering them separately helps to disentangle the roles of different processes contributing to changes in climate extremes [1]. In July 2023, the world experienced the hottest month on record, with widespread heatwaves across many countries. Moreover, temperature extremes on land will increase even faster compared to the increase in global mean temperature due to climate change from human activities [2]. Evidence of anthropogenic climate change is based on surface temperature, upper ocean heat content, sea level, Arctic Sea ice extent, Northern Hemisphere snow cover, large-scale precipitation patterns, and temperature extremes [3]. Temperature extremes are one of the most dangerous effects of climate change and have been growing in recent years. An increase in the concentration of greenhouse gases (GHG) in the atmosphere leads to the warming of tropospheric air and, consequently, the Earth’s surface. This direct thermodynamic effect leads to warmer temperatures around the globe, with an increase in the frequency and intensity of warmer extremes and a decrease in the frequency and intensity of cold extremes [4]. Extreme temperatures within cities have become more frequent in the last few years. Temperature increases are coupled with the growth of urban areas and populations, which enhances exposure to high temperatures [5]. Periods where local excess heat accumulates over sweltering days and nights are associated with the heatwave phenomena [4]. Southern European countries (i.e., Spain, France, Italy, and Greece) experienced a strong heatwave during the summer of 2003. This episode was directly associated with approximately 40.000 extra deaths, particularly those of elderly Europeans [6]. Heatwaves have adverse health effects, especially in vulnerable groups, affecting human health through heat stress and exacerbating underlying conditions that can increase mortality; additionally, population aging is an important factor in the vulnerability to heat [5,7,8]. Heatwaves are defined as three (or more) consecutive days with daily temperature measures exceeding a specific threshold; they are associated with stationary domes of high pressure that produce clear skies, light winds, warm air, and prolonged hot conditions on the surface [1,8,9,10]. Human-induced GHG is the main driver of the observed changes in hot and cold extremes on a global scale. The effect of enhanced GHG concentrations on extreme temperatures is moderate or amplified at the regional scale by regional processes such as soil moisture and by regional forcing from land use and land cover changes [11]. Cities are blamed for GHG emissions and are a dynamic part of global culture and the main social and economic development engine [11,12]. Urban energy consumption is mainly due to the building sector, and it is influenced by several factors such as building characteristics and occupant activities; however, the most important factor is the ambient temperature because most energy consumption is due to buildings’ cooling/heating systems [12,13]. Extreme temperature events have been identified as one of the most significant drivers of building energy consumption [12]. Urban ecosystems can be broadly characterized by two land cover types: impervious and vegetated surfaces. These two elements are extremely important Land Surface Temperature (LST) predictors. Impervious surfaces determine an increase in LST and tree drought stress through the absorption and storage of solar energy during the day; on the other hand, vegetation has a cooling effect, especially through daytime evapotranspiration [14,15]. This conformation makes the urban center subject to the absorption of a greater amount of solar radiation than the surrounding rural areas, contributing to the increasing temperature in the cities rather than the surroundings, and creating the phenomenon defined as an Urban Heat Island (UHI) [15,16,17]. UHIs occur when urban areas are hotter than their rural or suburban counterparts, due to both retained daytime heat by dense materials and the failure to dissipate heat overnight [18]. There are two different types of UHI: atmospheric UHI (AUHI) and surface UHI (SUHI). SUHI forms when hard and dry surfaces, such as asphalt and concrete, are heated by solar and terrestrial radiation [19]. It is widely recognized that SUHI has significant impacts on vegetation, air quality, energy policy, and public health [1,10,20,21]. As urbanization continues to grow globally [22], a notable amount of the population must face this phenomenon. Some population categories are more sensitive to SUHI, depending mainly on age and health conditions, such as elderly people or children. Illness caused by exposure to high temperatures includes heat cramps, fainting, heat exhaustion, heatstroke, and occasionally death [20,21,23]. Heat exhaustion is the most common response to prolonged exposure to high outdoor temperatures and is characterized by intense thirst, heavy sweating, dizziness, fatigue, faintness, nausea, and headache [8,20,21,23]. The SUHI effect caused by urban overheating is one of the main results of rising urbanization; the population living in the urban areas is the main casualty of this overheating. For this reason, studies like this one, which aim to study the LST trend and analyze the risk index to heat stress, may become fundamental in the coming years with regard to sustainable urban development.

1.1. Aim of the Work

In this paper, nocturnal LST images are computed to define where permanent SUHIs are in the 10 years of the time series considered (from 2013 until 2023). In QGIS, the analysis of 64 cloud-free nocturnal LST images is computed by extracting the isotherms used in the definition of SUHIs. From these results, a permanent SUHI is highlighted in the urban center. Considering the time series, the hottest LST image (9 July 2023) is used to calculate the Risk Index Rn to SUHI for each population category within Naples. Several studies define the risk concept based on Crichton’s Risk Triangle [24,25,26,27]. Following this concept, heat risk is described as a function of hazard, exposure, and vulnerability [24]. Here, the hazard is represented by the LST, the exposure is indicated by a population density dataset provided by Humanitarian Data Exchange (HDX) Data for Good at Meta, and vulnerability will be defined as a scale from 0–1 indicating the sensitive grade to heat stress of the population depending on age, according to medical bibliographies.

1.2. Study Area

Naples (40°50′09″N 14°14′55″E) covers an area of 117 km2 on the southwest coast of Italy, facing the Tyrrhenian Sea (Figure 1). It is the third largest city in Italy (after Rome and Milan), with about 1.5 million inhabitants, and is the most densely populated city in the country with 7744 inhabitants per km2. The region shows structural highs depending on the two nested calderas related to the Phlegrean Fields, located in the western part in the proximity of Pozzuoli. Mt. Vesuvius characterizes the eastern part (not present in Figure 1); the steep scarps generated by this conformation affect the incoming solar radiation and generate important temperature variations [28]. The city’s disposition is strictly dependent on the location of those two volcanoes, with the western part not heavily urbanized due to the presence of the Phlegrean Fields craters and the industrial part in the northeastern part of the city. The urban center is in the southern part, near the coast, and it is characterized by narrow streets, alleys, and tall and closely spaced buildings that limit the Sky View Factor (SVF). This implies that the incoming solar radiation is reduced because of the presence of buildings. The decreased natural ventilation creates difficulties in air management and heat exchange [29]. The low SVF, plus a high percentage of cemented surfaces due to high building density and pavements, scarce urban greenery, and high vehicular traffic, make Naples an excellent case study for defining Rn for different population categories [18,29].

2. Materials and Methods

To perform the SUHI, LST was estimated using remotely-sensed data, retrieving brightness temperature, emissivity values, and atmosphere parametrization. The satellite data are provided by the Landsat Thermal Infrared Sensor (TIRS) [28,30,31,32,33,34] and the Advance Spaceborne Thermal Emission Radiometer Global Emission Dataset (ASTERGED) [28], while the atmosphere parametrization are given by the National Center for Atmospheric Research (NCAR) and the National Center for Environmental Prediction (NCEP) [28,30,32,35]. This paper is focused on the Rn to UHI definition; for this reason, population datasets in the Naples area are also required. Population datasets are provided by the HDX Meta population dataset. HDX is a platform that lets users, for research and management purposes, access socioeconomic data mostly collected by Meta through Data for Good [30,35,36,37].

2.1. Data

2.1.1. Satellite Data

Since 1972, Landsat satellites have gathered imagery of the Earth’s surface, building unparalleled historical archives [28,33,34]. L8 was launched in February 2013; for this reason, the authors decided to focus on the temporal window ranging from 2013 to 2023. To thicken the historical series, images from Landsat 9 (L9, launched in 2021, with the same characteristics as L8) were also used. L8 presents sixteen days of temporal resolution and incorporates two primary sensors: The Operational Land Imager (OLI) and Thermal InfraRed Sensor (TIRS) [33,34]. OLI operates from visible to shortwave infrared wavelengths and is characterized by eight different bands, with a spatial resolution of 30 m and a wide range of 185 km. An additional panchromatic band with 15 m of resolution is incorporated in OLI, while TIRS operates in the infrared region with two bands, band 10 and band 11. Because of technical issues due to calibration uncertainties, the United States Geological Society (USGS) released a notice regarding the utilization of band 11 [28,33,34], for this reason, band 10 is used in this work. Infrared bands present a spatial resolution of 100 m. Still, for easier use by the users, the USGS performed a resampling with cubic convolution to 30 m to coincide with the OLI and TIRS spatial resolution [28,32,33,34].

2.1.2. Emissivity Data

Emissivity is an intrinsic property of a material, often regarded as an indicator of material composition, and can be derived from the emitted radiance measured from space [28,32,38,39]. Surface emissivity is mandatory data in the LST retrieval, and the ASTERGED emissivity data may be downloaded directly from the USGS website [38,39]. Emissivity data products are generated by using clear sky pixels of ASTER images acquired from 2000 to 2008 with an original spatial resolution of 100 m [28,35]. To combine them with TIRS spatial resolution, ASTERGED emissivity is appropriately resized to 30 m. The decision to use the emissivity values provided by ASTERGED is driven by the necessity to compute LST images in the nighttime, when the main source of energy is the one emitted by the Earth, to avoid compliance with the emissivity estimation in the absence of solar radiation [28]. Indeed, during the day, surface heating is strongly influenced by direct solar radiation, shadowing, albedo differences, and building orientation. At night, the absence of solar radiation reduces these shortwave effects, meaning that thermal emissions primarily reflect stored heat in urban materials. This makes nighttime images more reliable for detecting LST in urban areas. Furthermore, nighttime data may be less affected by atmospheric scattering from dust and aerosols compared to the daytime; at night, shading plays a negligible role, making LST estimation more uniform and representative of surface thermal conditions and using nighttime data allows more consistent temporal comparisons of UHI, providing a stable basis for long-term UHI trend analysis, as proposed in this paper’s use of nighttime LST. It is important to note that ASTER’s emissivity can be directly used as TIRS’s emissivity due to spectral similarity, since their spectral settings are very similar. As reported above, from the Landsat collection, we have used band 10, which is located at about 10.90 μm, and ASTERGED band 13, located at about 10.50 μm.

2.1.3. Atmospheric Correction

Information about atmospheric water vapor content is required to better account for the atmospheric contribution in the TIR observation [28,32]. Information about Total Column Water Vapor (TCWV) content is provided by NCEP and NCAR, where atmospheric water vapor data are used to define the Total Precipitable Water (TPW) which is the product that represents the total integrated moisture in the atmospheric column from the surface to the Top of Atmosphere (TOA) [32]. For every daily and temporal interval, a precise value of TPW has been assigned on a scale of 10 classes (from 0 to 9) with an interval of 6 cm of water vapor column [28,32,35].

2.1.4. Population Dataset

Information about people living in the studied area (Figure 1) is provided by HDX Data for Good at Meta, a computer vision method based on machine learning to create population density maps from satellite imagery and mobile Global Navigation Satellite System (GNSS) tracking at a global scale, with a spatial sensitivity at building scale [35,38]. Satellite data are combined with census data at the municipality scale to retrieve raster maps for 18 countries in the world [40]. HDX aims to access high-resolution population density maps, estimating the number of people living within 30 m grid tiles. The dataset also provides insights into the distribution of specific population groups, divided into children under 5, women of reproductive age, the elderly population, and the population of men and women [40,41] and can be downloaded, for free, directly from the HDX web page (https://data.humdata.org/organization/meta?q=population%20density&sort=score%20desc%2C%20last_modified%20desc&ext_page_size=25 (accessed on 4 September 2025). From there, Italian high-resolution population density maps (in GeoTiff format) are downloaded for each population category from the following link: https://data.humdata.org/dataset/italy-high-resolution-population-density-maps-demographic-estimates (accessed on 4 September 2025). These maps were then cropped according to the Naples study area and they allowed us to determine how Naples’ population is distributed in the urban area, permitting the identification of the geographic regions most impacted by UHI [37,40,41]. No single user private/public Facebook account has been used in the project; therefore, the data used contains no personally identifiable information [41]. The final datasets provide insights into the distribution of specific population groups in individual countries, including the number of children under 5, elderly people over 60, men and women, and women of reproductive age in GeoTiff and CSV format. The population dataset is related to 2020 with the latest modification dating to 2022 [40].
To better understand where the population is more concentrated, the neighbourhoods making up Naples’ municipality are imported and identified according to Table 1.

2.2. Processing

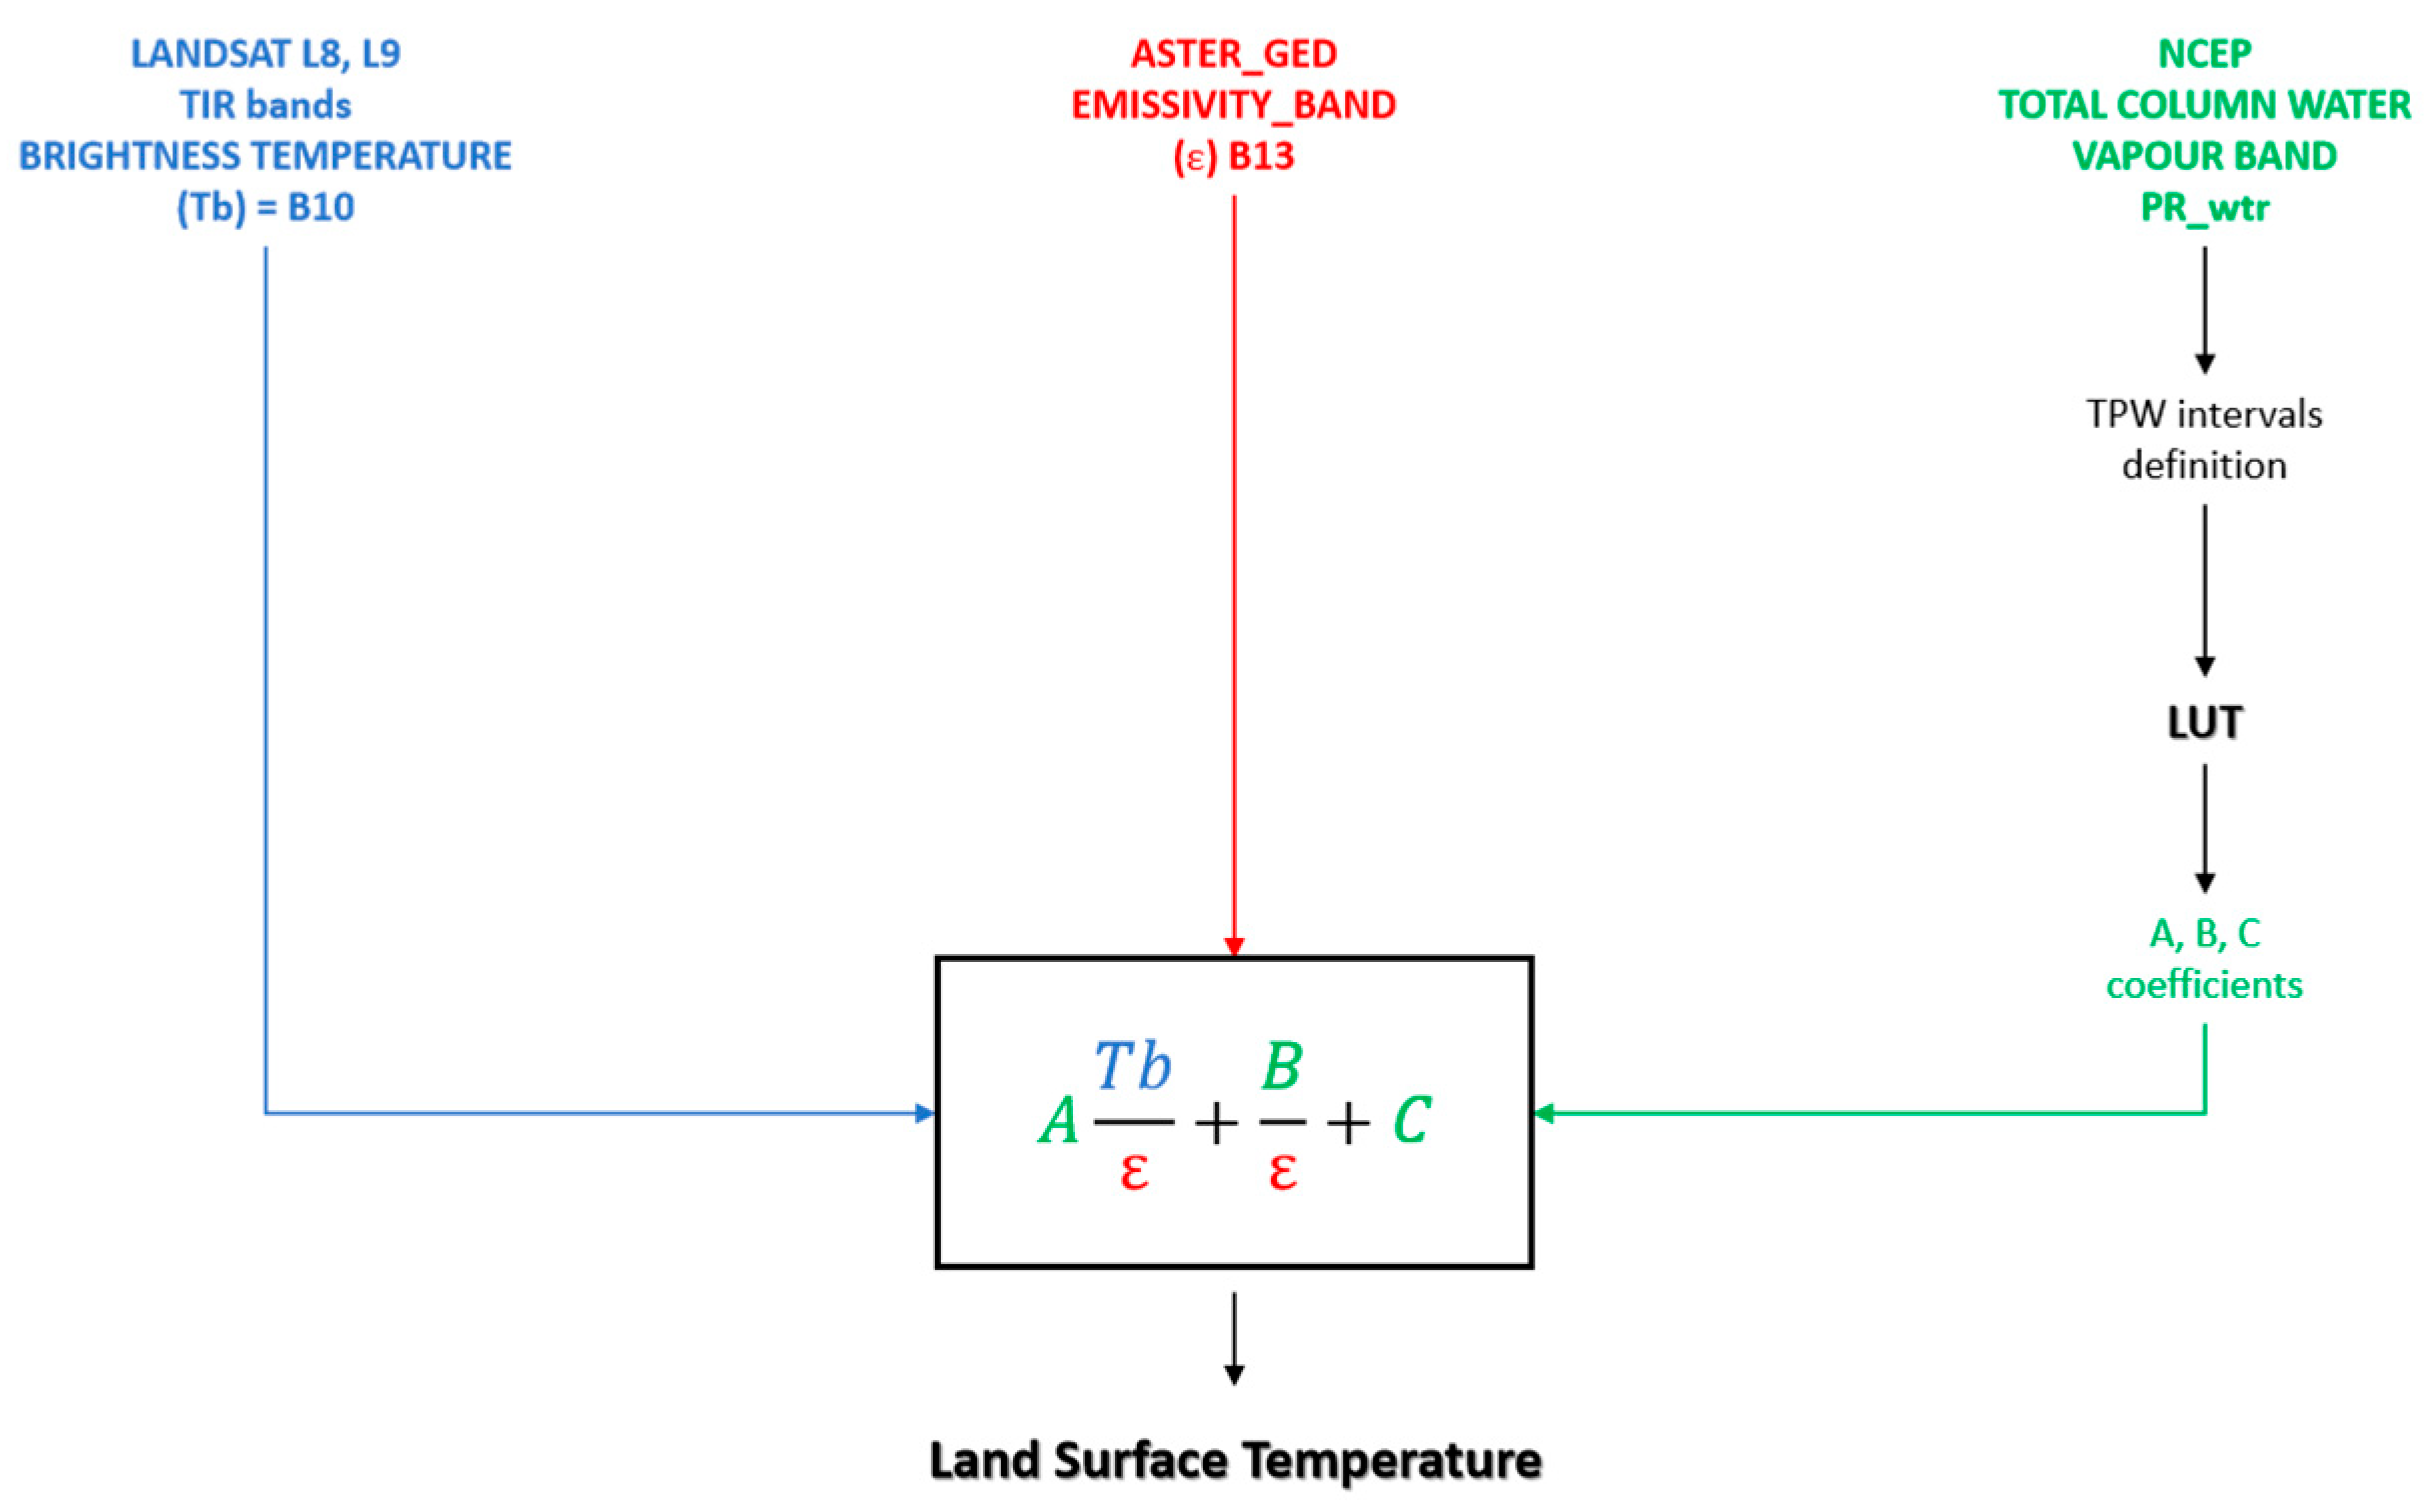
Determining the LST over the Naples area is the first step in retrieving Rn. The LST estimation is computed in the Google Earth Engine (GEE) platform, following the Statistical Mono Window (SMW) algorithm for the nighttime images, as described in [28] and its bibliography. In Figure 2, a flowchart of the SMW algorithm is shown [28].
According to the GEE procedure, a total of 213 nighttime LST images from 2013 to 2023 were nominally acquired by the Landsat mission. Despite this huge number of images, a reduced number of acquisitions have been processed. Such a reduced number is dependent on (1) the unpredictable low data quality and (2) cloud presence. By taking these limitations into account, only 64 nighttime images were suitable for the analysis. These images were downloaded and imported into QGIS to evaluate the permanent SUHIs in the Naples territory. Images present a half-pixel shift. For this reason, to pile up the images and build a unique stack, the “coregistration” plug in was used in QGIS version 3.40, considering a random image as a reference [28]. SUHIs are determined by extracting the isotherms to highlight areas with high temperature values for the entire time series according to Equation (2). To rely on the LST derived by EO data, we refer to [42], where satellite temperature values obtained by L8, and L9, and ASTER data are compared with temperature values acquired from the Permanent Thermal Surveillance Network (TIRNet) located on the ground in the area of the Solfatara vent and in the Naples urban area. The comparison among temperature time series extracted from satellite and TIRNet analysis areas evidenced that temperatures estimated by satellite data are reliable compared with values extracted from ground measurements provided by TIRNet frames acquired at different spatial scales, used for validation purposes.

2.3. Risk Evaluation

The evaluation of SUHI-related risk is grounded in the framework proposed by Crichton [24], which conceptualizes risk through the Risk Triangle. Within this framework, risk (R) is defined as the probability of a loss (likelihood of adverse outcomes), expressed as a function of three components: hazard (H), vulnerability (V), and exposure (E). This is according to the following formula [24,43]:
R   =   H     V     E
Each component is thoroughly explicated below.

2.3.1. Exposure

Exposure represents the number of people or goods/assets that are at risk from a SUHI event [43]. In the context of population risk from Urban Heat Islands, exposure refers to the assets or individuals exposed/subjected to a specific phenomenon. In this work, E is represented by the spatial distribution of the population within the study area, derived from the Meta dataset, which classifies individuals into five categories: elderly, children, women of reproductive age, women, and men. A higher concentration of a given population category (i) corresponds to greater exposure. On the contrary, if the exposure is null, one of the sides of Crichton’s Risk Triangle is missing, resulting in a risk value of zero. A preliminary finding of this analysis is that SUHI-related risk is directly associated with population density distribution.

2.3.2. Hazard

In the context of Urban Heat Islands, hazard (H) refers to elevated ambient temperatures in urban areas, caused by human activities and the built environment, which may pose risk to human health and well-being [43]. Therefore, H is represented by the LST. Based on the LST trend analysis conducted using the methodology described in Section 2.2, isotherms with 1 °C intervals were extracted to detect SUHIs, with the main SUHI identified in the city centre of Naples. The threshold temperature defining the occurrence of SUHI condition was calculated by applying the formula proposed in [44] and reported in equation below (Equation (2)):
S U H I = L S T   >   μ   +   0.5   σ
where μ   is the mean temperature of the image selected for the analysis and σ  is the standard deviation of that image. Within the time series, the hottest image (dated 17 July 2023) was selected as H, as it represents the maximum spatial extent of the SUHI calculated at 37 °C following Equation (2) (Figure 3). It is important to note that July 2023 was an anomalous hot period with respect to the standard weather conditions, as also reported by the local paper [45].

2.3.3. Vulnerability

Vulnerability is defined as the degree of sensitivity of assets exposed to risk [28]. In the context of the population’s sensitivity to heat stress, vulnerability depends on information related to the health status and socio-economic conditions of the exposed population. Since such information is not provided by HDX, a scale from 0 to 1 has been defined based on medical literature [46,47,48,49,50,51,52], in order to assess population sensitivity to heat according to age and physical condition. It should be noted that the extreme values (0 and 1) were excluded as no population group can be considered either completely insensitive of fully sensitive to heat stress. As in Table 2, the elderly constitute the most vulnerable population group to heat, due to a reduced ability in thermoregulation. Children are also considered a vulnerable category because of their metabolic condition and high body surface area-to-weight ratio (BSA/weight). Pregnant women are classified a vulnerable category because of hormonal and cardiovascular alterations. Their physiology allows them to tolerate heat more effectively. However, specific conditions—such as outdoor occupations or athletic activity—can increase their vulnerability [46,47,50]. Table 2 summarizes the R definition for all population categories as classified in the Meta dataset.
After presenting all components contributing to heat stress risk for each population category, R can be calculated according to Equation (1), where, as described above, E correspond to the population density, H to LST, and V to the vulnerability values reported in Table 2.
Once the R has been defined according to the components just described, the final normalize risk index (Rn) for each population class is obtained following the minimum maximum normalization of equation (Equation (1)):
R n = ( R     R   m i n ) ( R   m a x     R   m i n )  

3. Results

This section presents the results of the Rn distribution, analyzed in relation to population location and building structures. After that, a statistical summary will be reported and discussed in the following section.

3.1. Local Climate Zones

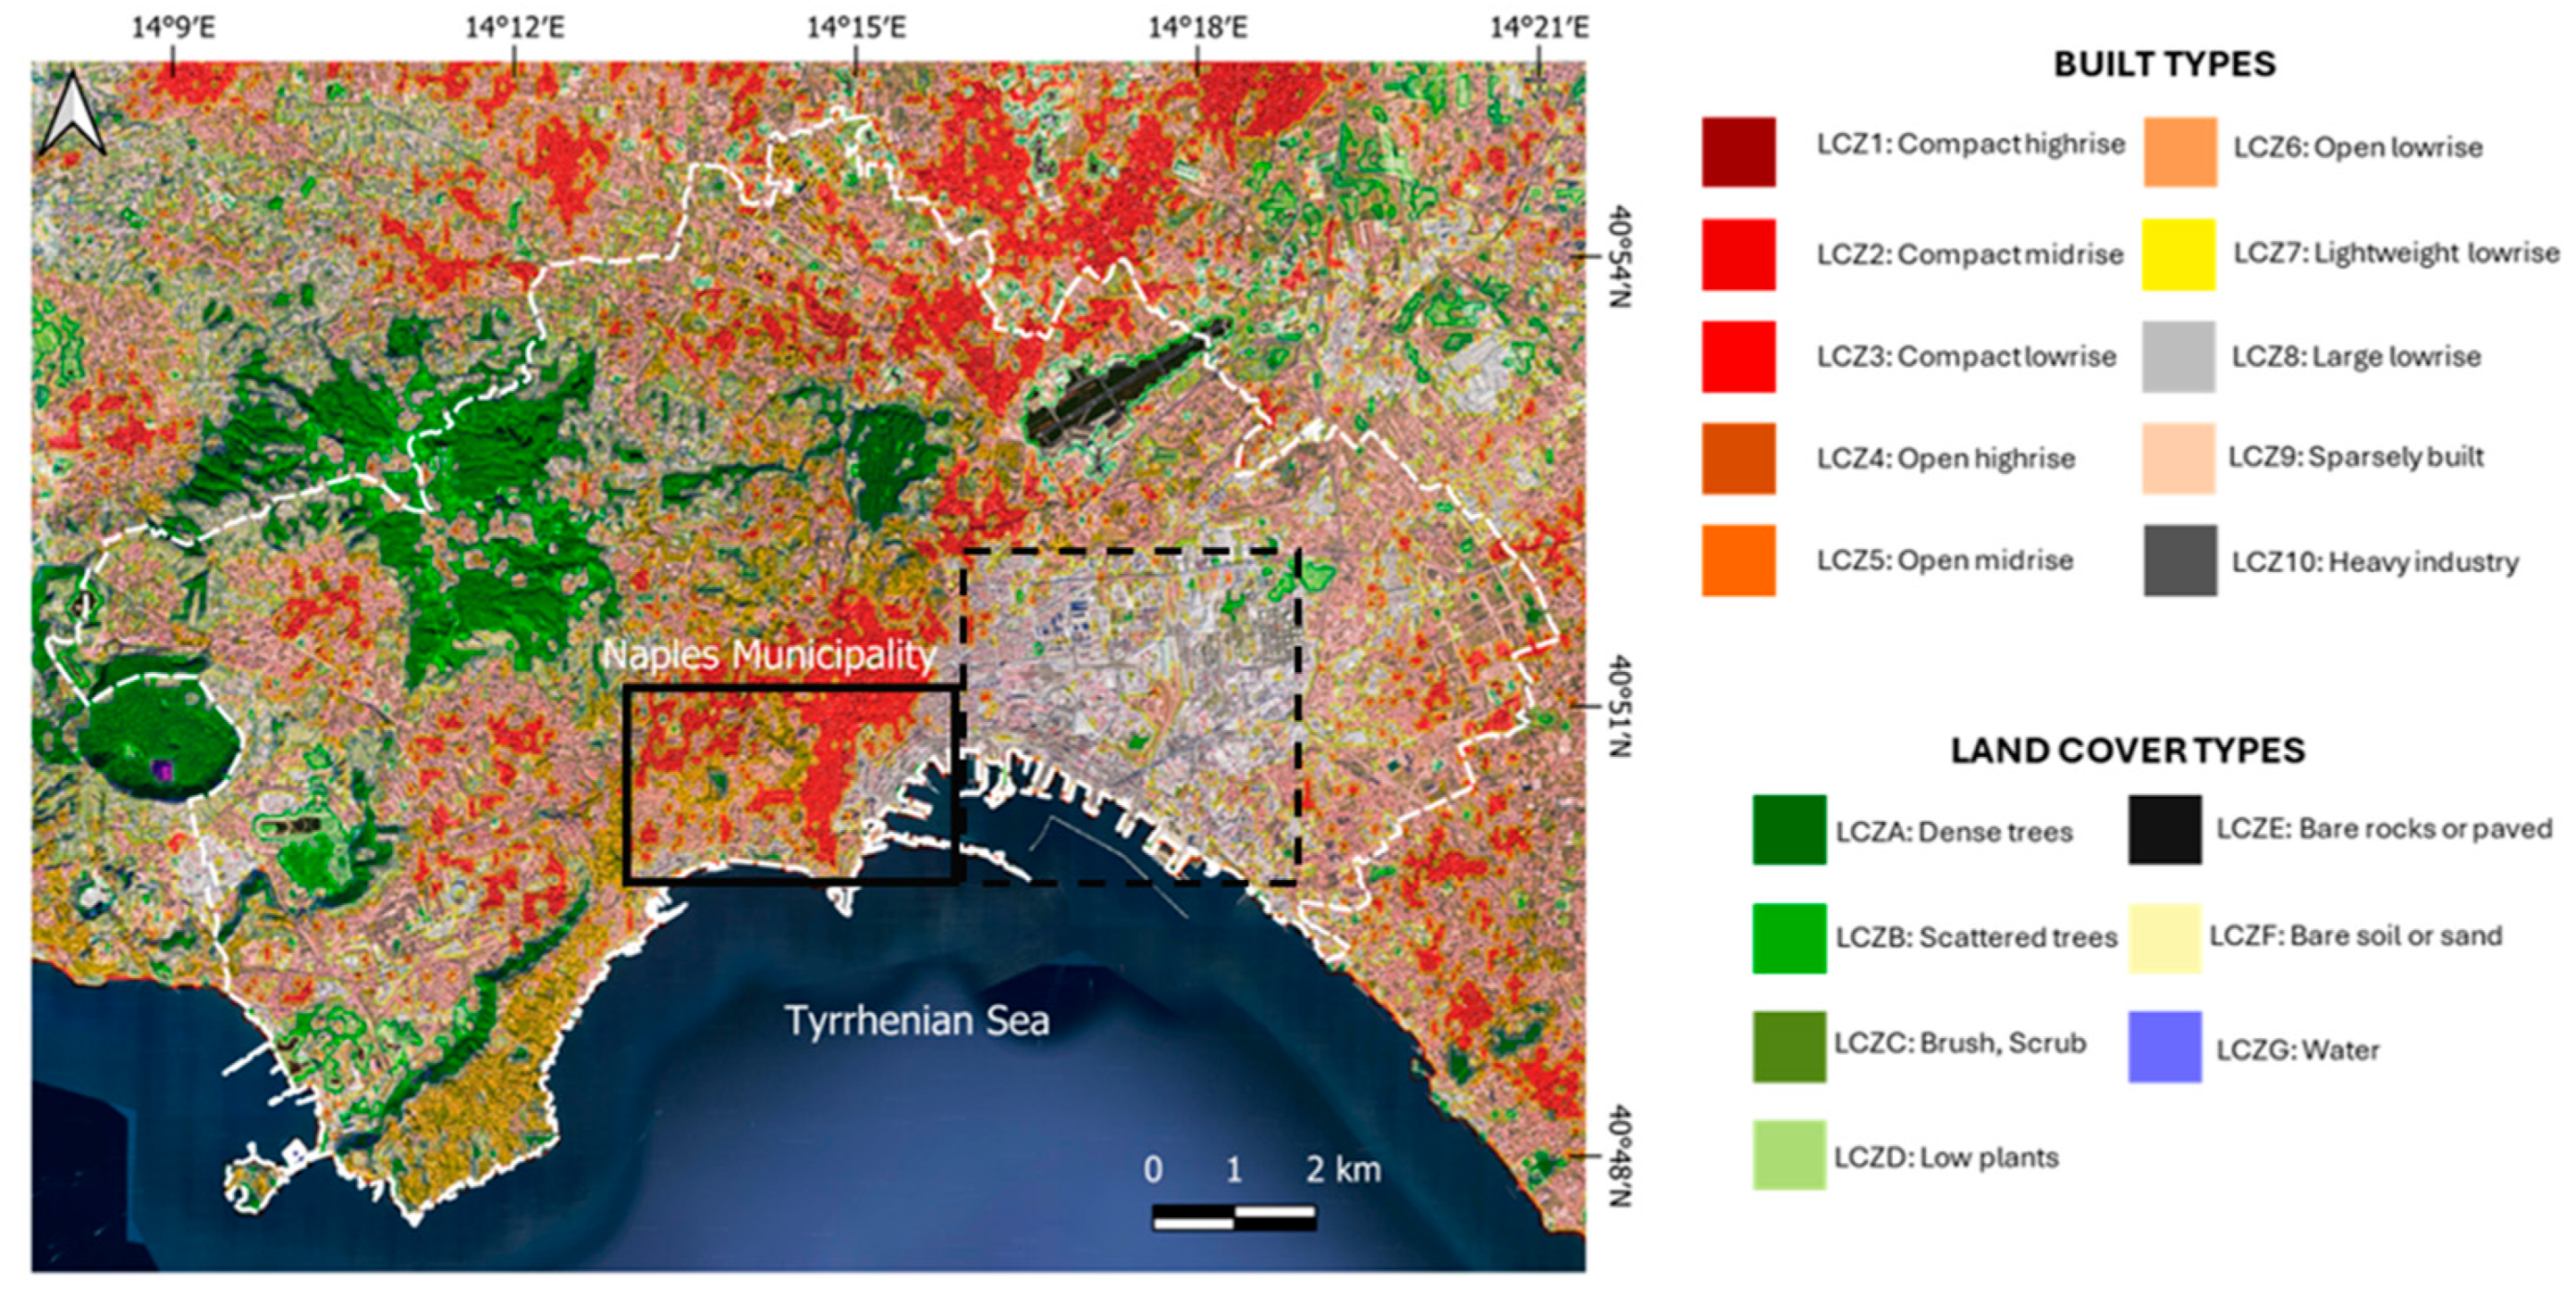
To better constrain the spatial extent of SUHI and their impacts on the population, the Local Climate Zone (LCZ) classification has been adopted. The methodological approach is detailed in [53] and references therein. The LCZ classification system is adopted in this approach due to its categorization of urban environments according to their physical and climatic characteristics. This structured framework enables the climate profiles within cities to be distinguished more effectively. When combined with surface temperature data, LCZ classification enhances the ability to pinpoint zones that are particularly vulnerable to extreme heat. The LCZ classes are formally defined as regions of uniform surface cover and human activity, characterized by a typical screen height temperature regime that is most apparent over dry surfaces; on calm, clear nights; and in areas of simple relief [53,54]. This scheme divides urban surfaces into 17 categories with different geometric structures, land covers, and surface materials [54]. LCZ classifies the built types on a scale from 1 to 9, where class 1 represents the compact high-rise, with a dense mix of tall buildings and few or no trees. In contrast, class 9 represents a sparsely built area with a sparse arrangement of small or medium sized buildings in a natural setting. An additional class, class 10, is present in the description of the build types and refers to areas of heavy industry with low-rise and mid-rise industrial structures and land cover mostly paved. Another classification in LCZ refers to the land cover types with a class scale from A to G. A refers to areas characterized by a heavily wooded landscape. In contrast, G refers to water bodies [55,56,57]. Using LCZ classification instead of LC in the UHI analysis facilitates an exploration of how urban geometry and land use impact the patterns of LST and UHI, providing a novel perspective for urban planning [58]. In Figure 4, a general view of Naples’ LCZ is reported.
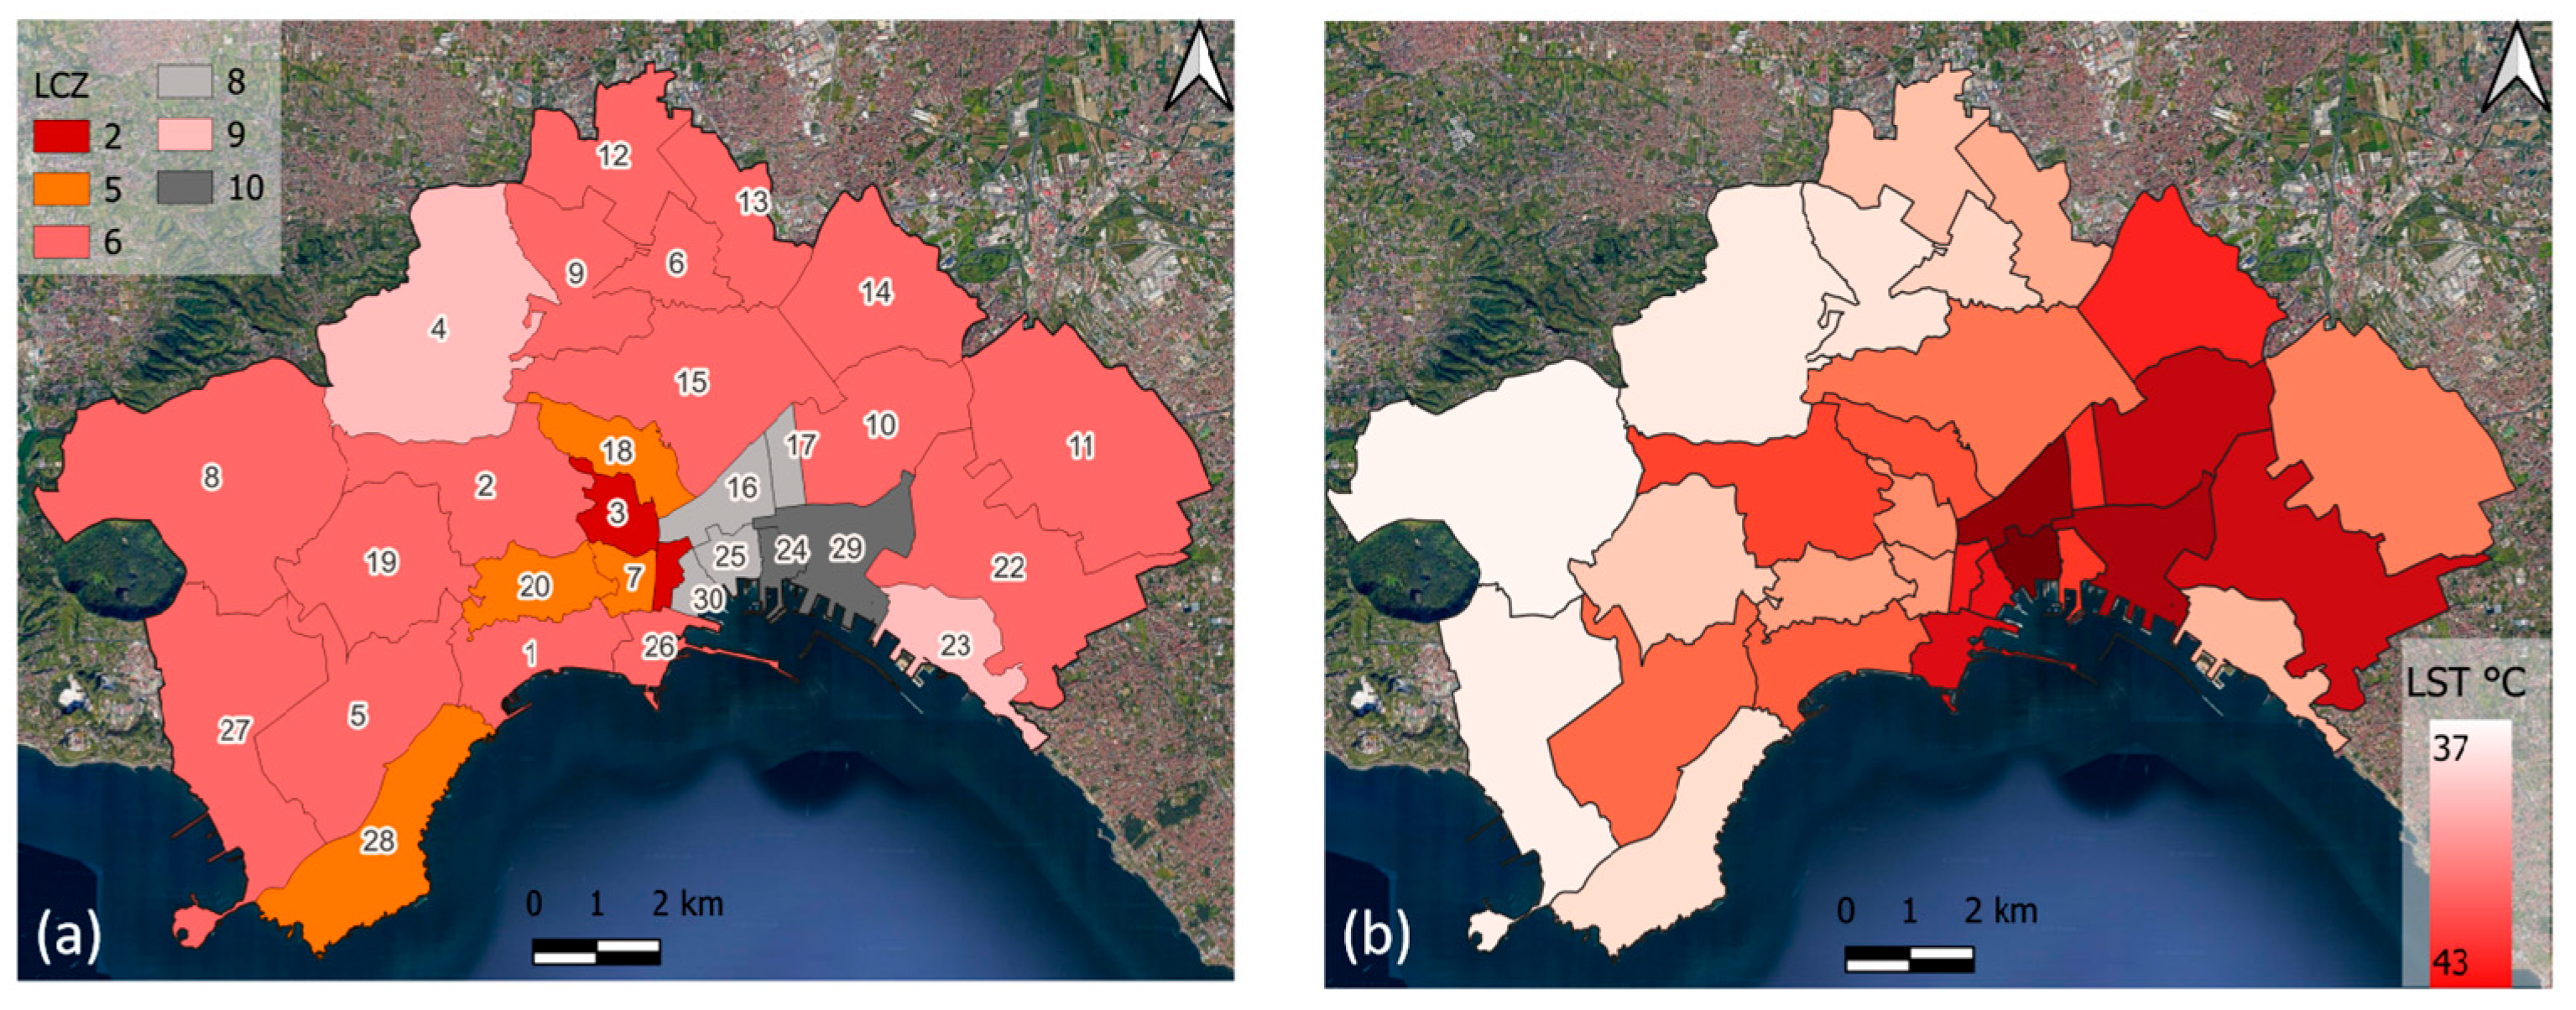
Using the zonal statistic tool in QGIS, the median value of LCZ for each neighbourhood is extracted for the Naples area. The results in Figure 5a show that the most common LCZ classes are 2, 5, 6, 8, 9, and 10, while the maximum temperature recorded in those LCZ is reported in Figure 5b.
A comparison between the population dataset provided by Meta and the LCZ permits a description of the studied area in terms of urban landscape and social distribution, confirming that the main exposure of the population depends on the “morphological” urban model. Indeed, the urban population’s risk to extreme urban climate is emphasized in the areas with LCZ 2, 6, 8, and 10, high-rise and low-rise buildings with no vegetation around, and the industrial area. A focus on the principal neighbourhoods making up the urban centre, according to Figure 4, shows that the historical area (Figure 4 black square) is characterized by LCZs 2, 5, and 6. In these LCZs, the buildings are mainly compact mid-rise and compact low-rise, hence there is a dense mix of mid and low-rise buildings, on average of five storeys, and rare urban vegetation. The surface is mostly paved, and the most common materials are stone, brick, and concrete. The presence of these low albedo materials, which are characterized by significant absorption of solar radiation and a slow release of heat during the night, together with intense anthropogenic activity, creates the conditions for a significant increase in temperature and the formation of SUHIs in this area. The eastern part (dashed line in Figure 4) is characterized by offices and factories; therefore, according to Figure 5a, the LCZs are 6, 8, and 10. Those LCZs are typified by open arrangements and different heights of buildings, from one storey to more than ten storeys. The vegetation in these areas is dispersed and typically composed of bushes and scattered trees. By comparing the LCZs distribution and LST distribution, the mid-rise and low-rise structures, in both compact and open buildings, show higher temperature values, identifying the placement of the SUHIs.

3.2. Risk Indices with Reference to Each Population Category Distribution

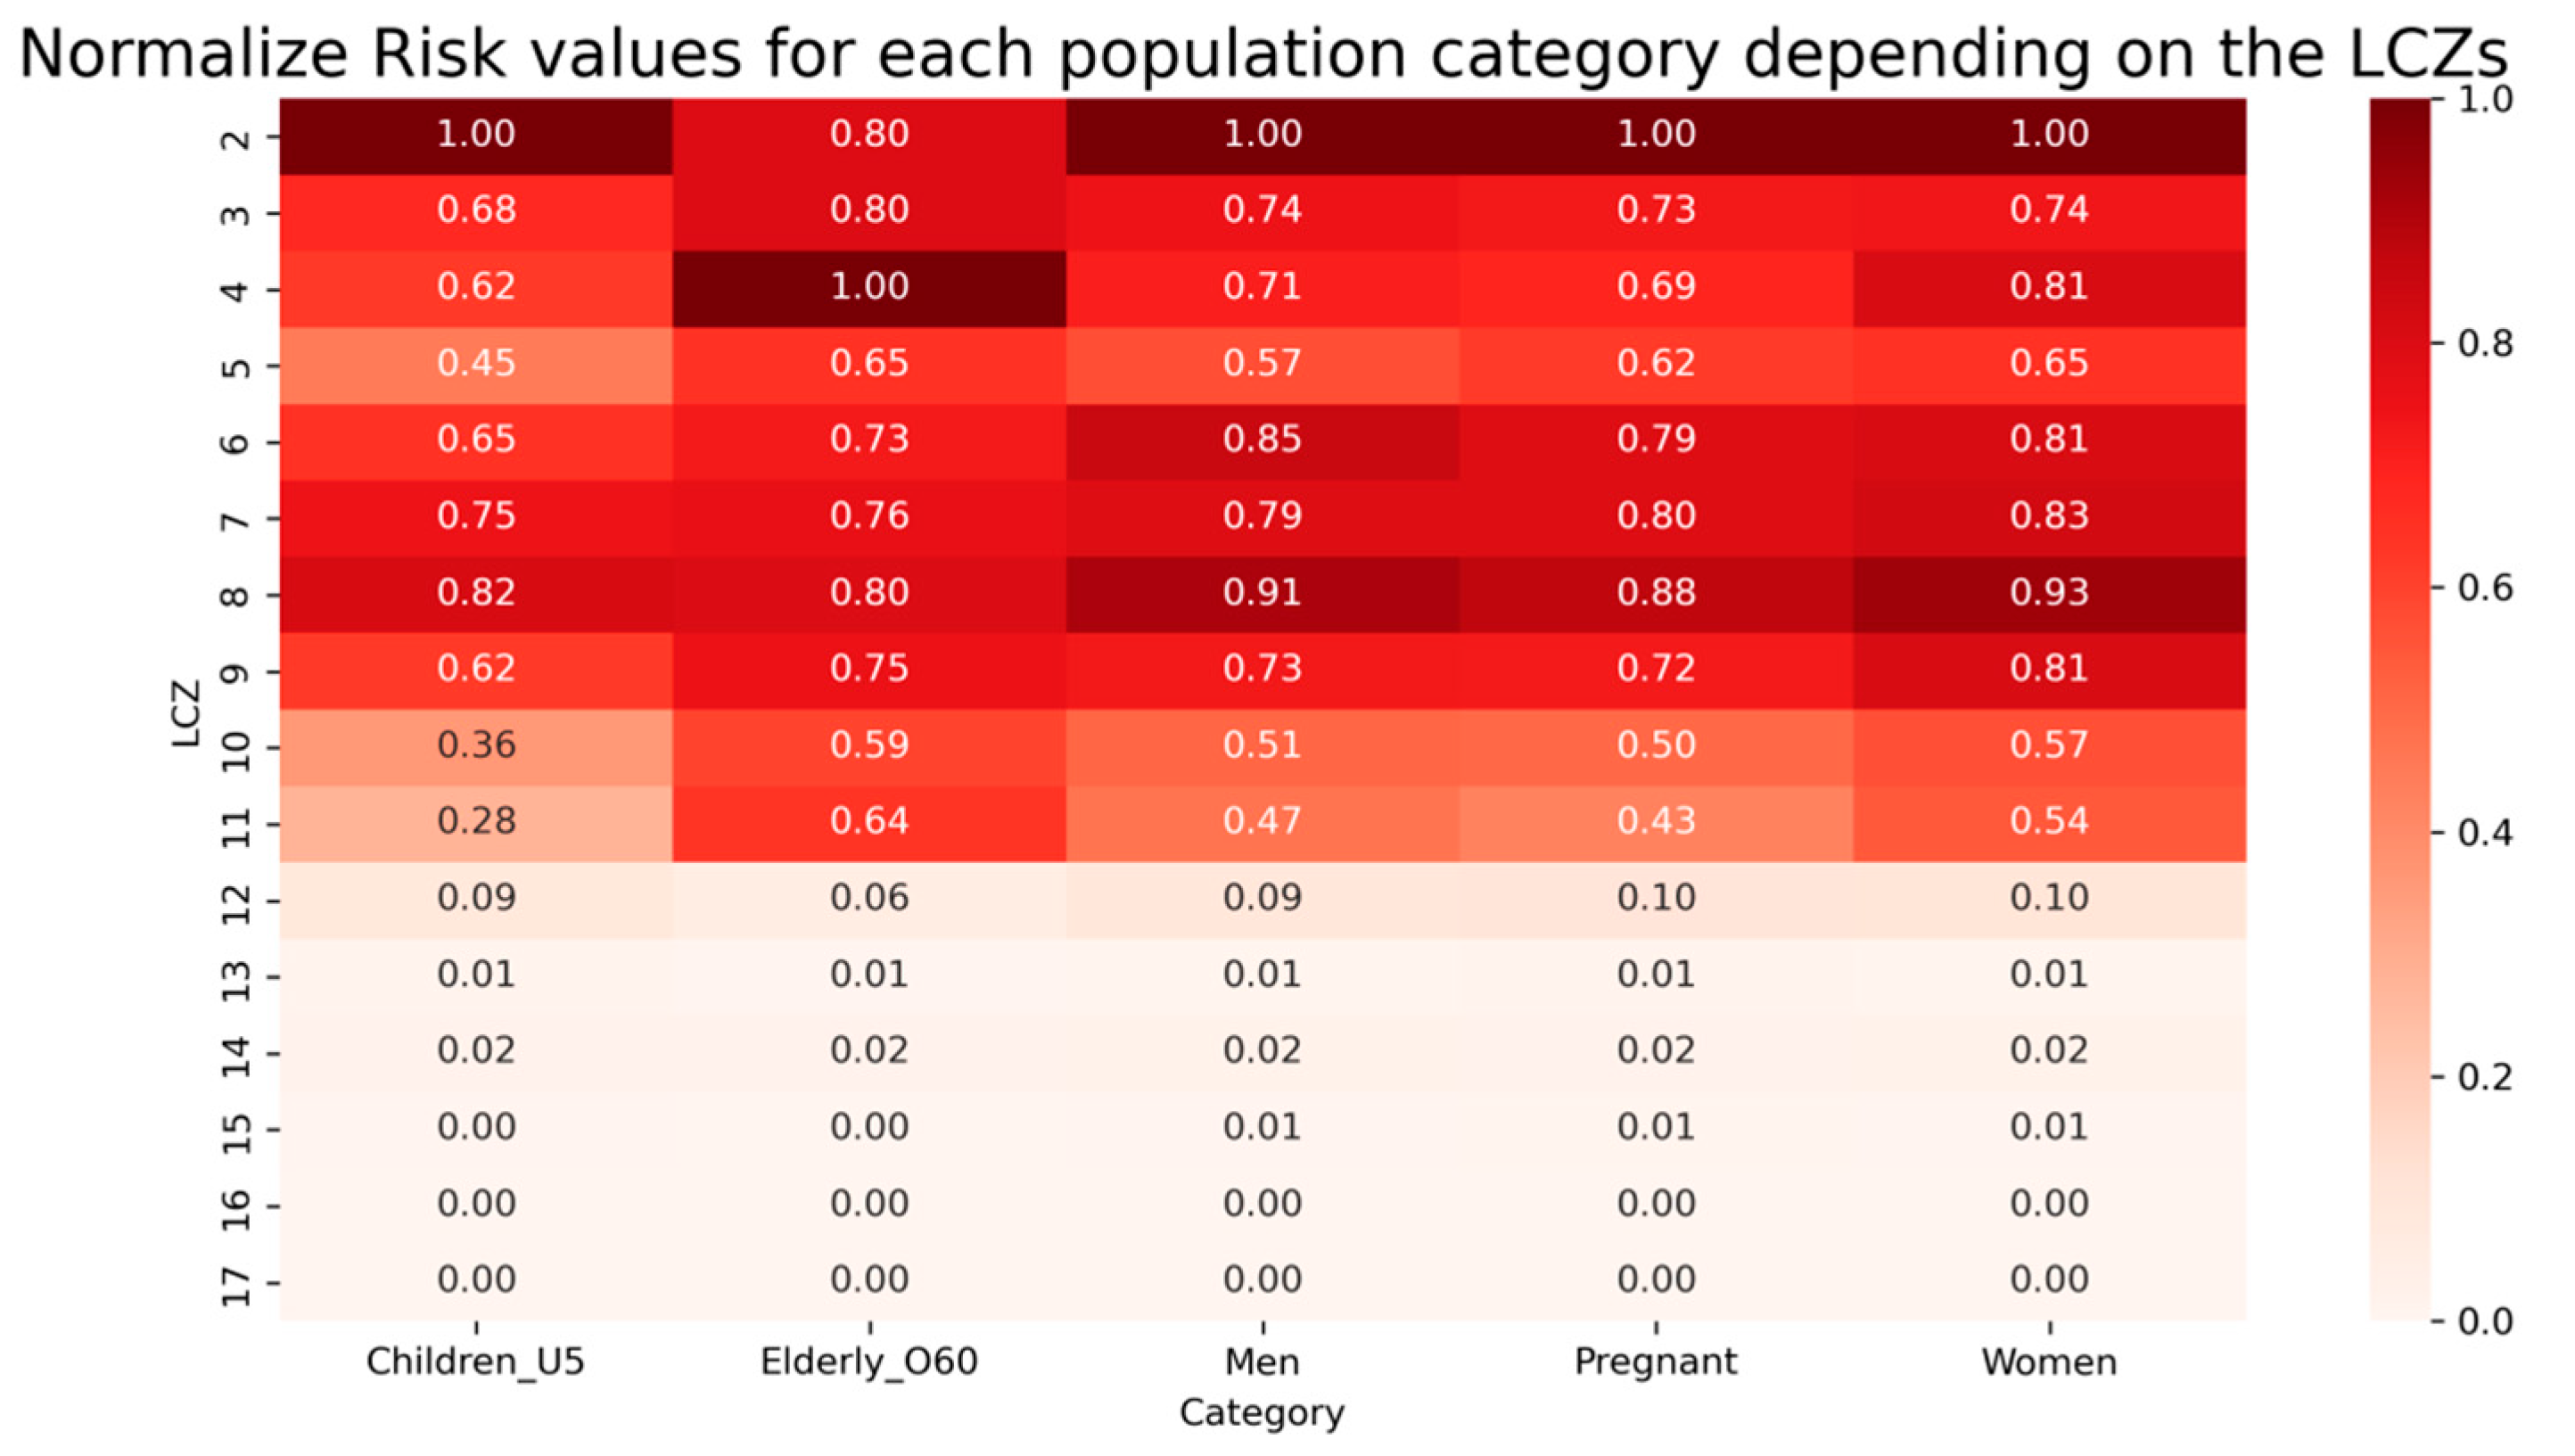
According to the LCZ distribution presented in the previous section, the Rn distribution for each population category, in relation to LCZs and SUHI areas, is reported at the neighbourhood scale. Figure 6 shows a heat map of Rn values for each demographic class in relation to LCZs with the colour bar indicating the magnitude of Rn.
Figure 6 demonstrates that the highest Rn are observed for elderly people in LCZs 2, 3, and 6, predominantly located in the urban centre, with Vn values ranging from 0.73 for LCZ 6 to 0.80 for LCZs 2 and 3. Elevated Rn values are also observed in LCZ 3 for men, women, and pregnant women (0.73–0.74). Rn exceeding 0.80 are reported for men (0.85) and women (0.81) in LCZ 6, the most common LCZ in the Naples area (Figure 5a). This likely reflects that the higher representation of men and women in the population, confirming that Rn is directly proportional to the population density. LCZ 8 exhibits the highest Rn values across all the demographic classes, ranging from 0.80 for elderly people to 0.93 for women. This LCZ, characterized by large low-rise buildings with minimal vegetation (Figure 4 legend), also corresponds to areas with the highest temperature (Figure 5a,b). The lowest Rn values for all demographic class are observed in vegetated areas (LCZs 11 to 17, corresponding to LCZs A to G in Figure 4). LCZ 11 occupies a small portion of the northwestern part of Naples, where elderly population density is relatively high, further confirming that Rn depends on population density. The remaining vegetated LCZs (12–17) have Rn values close to 0, as these areas are unpopulated. Rn values of 1.00 were excluded from the analysis because they result from a calibration error in HDX Data for Good at Meta, which contained abnormal density values.
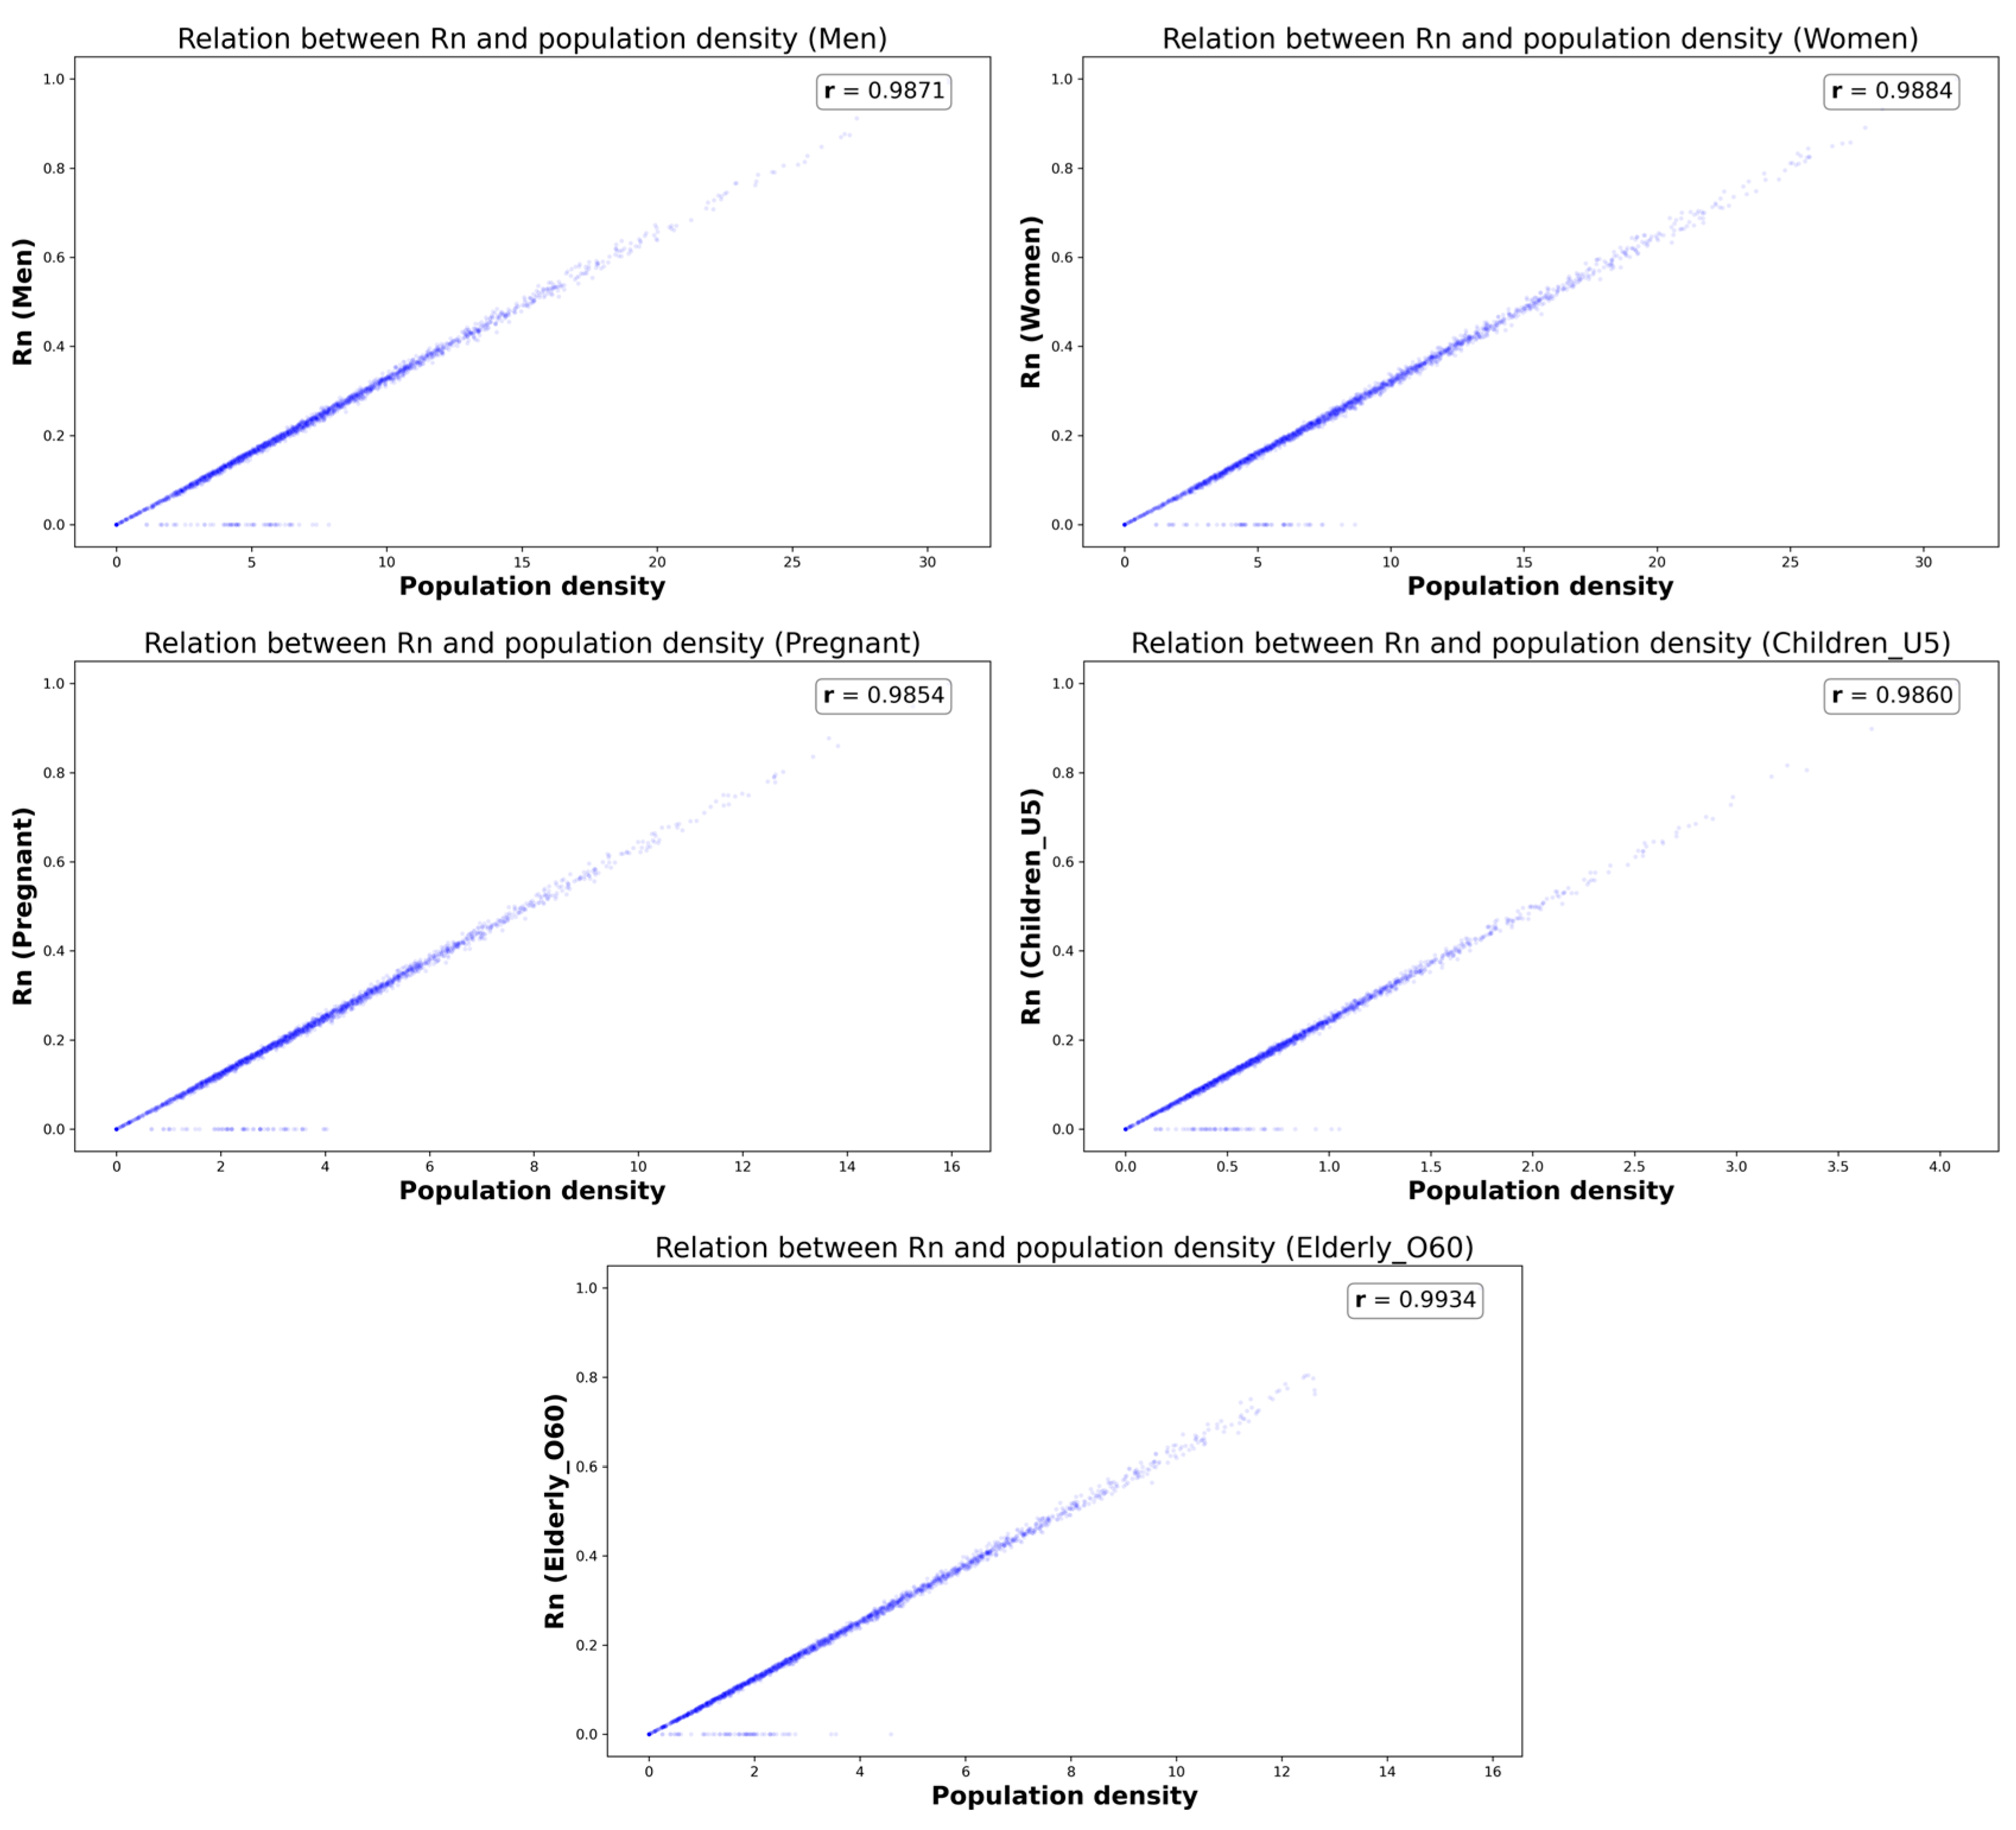
Figure 5a,b and Figure 6 indicate that Rn is related to the LCZ, with the highest Rn values observed LCZ 2, 6, and 8, corresponding to areas of high population density in the city centre and industrial zones. These results support the relationship between Rn and population density. Figure 7 shows the correlation between Rn and population density.
As shown in Figure 7, Rn is strongly correlated with population density as this variable represents the E in Equation (1); thus, an increase in E correspond to an increase in R. Population density is represented on a different scale depending on the general values provided by the HDX Data for Good at Meta, showing a predominance of women and men (5–15 individual/km2) and a lower density of children under 5 (0.5–2 individuals/km2). It is important to note that these represent average population densities across the entire Naples area and do not precisely reflect the distribution of residents in specific neighbourhoods. The correlation coefficient is proximal to 1 for all population categories (0.98–0.99), indicating an almost perfect correlation between population density and actual heat stress risk in SUHI areas.
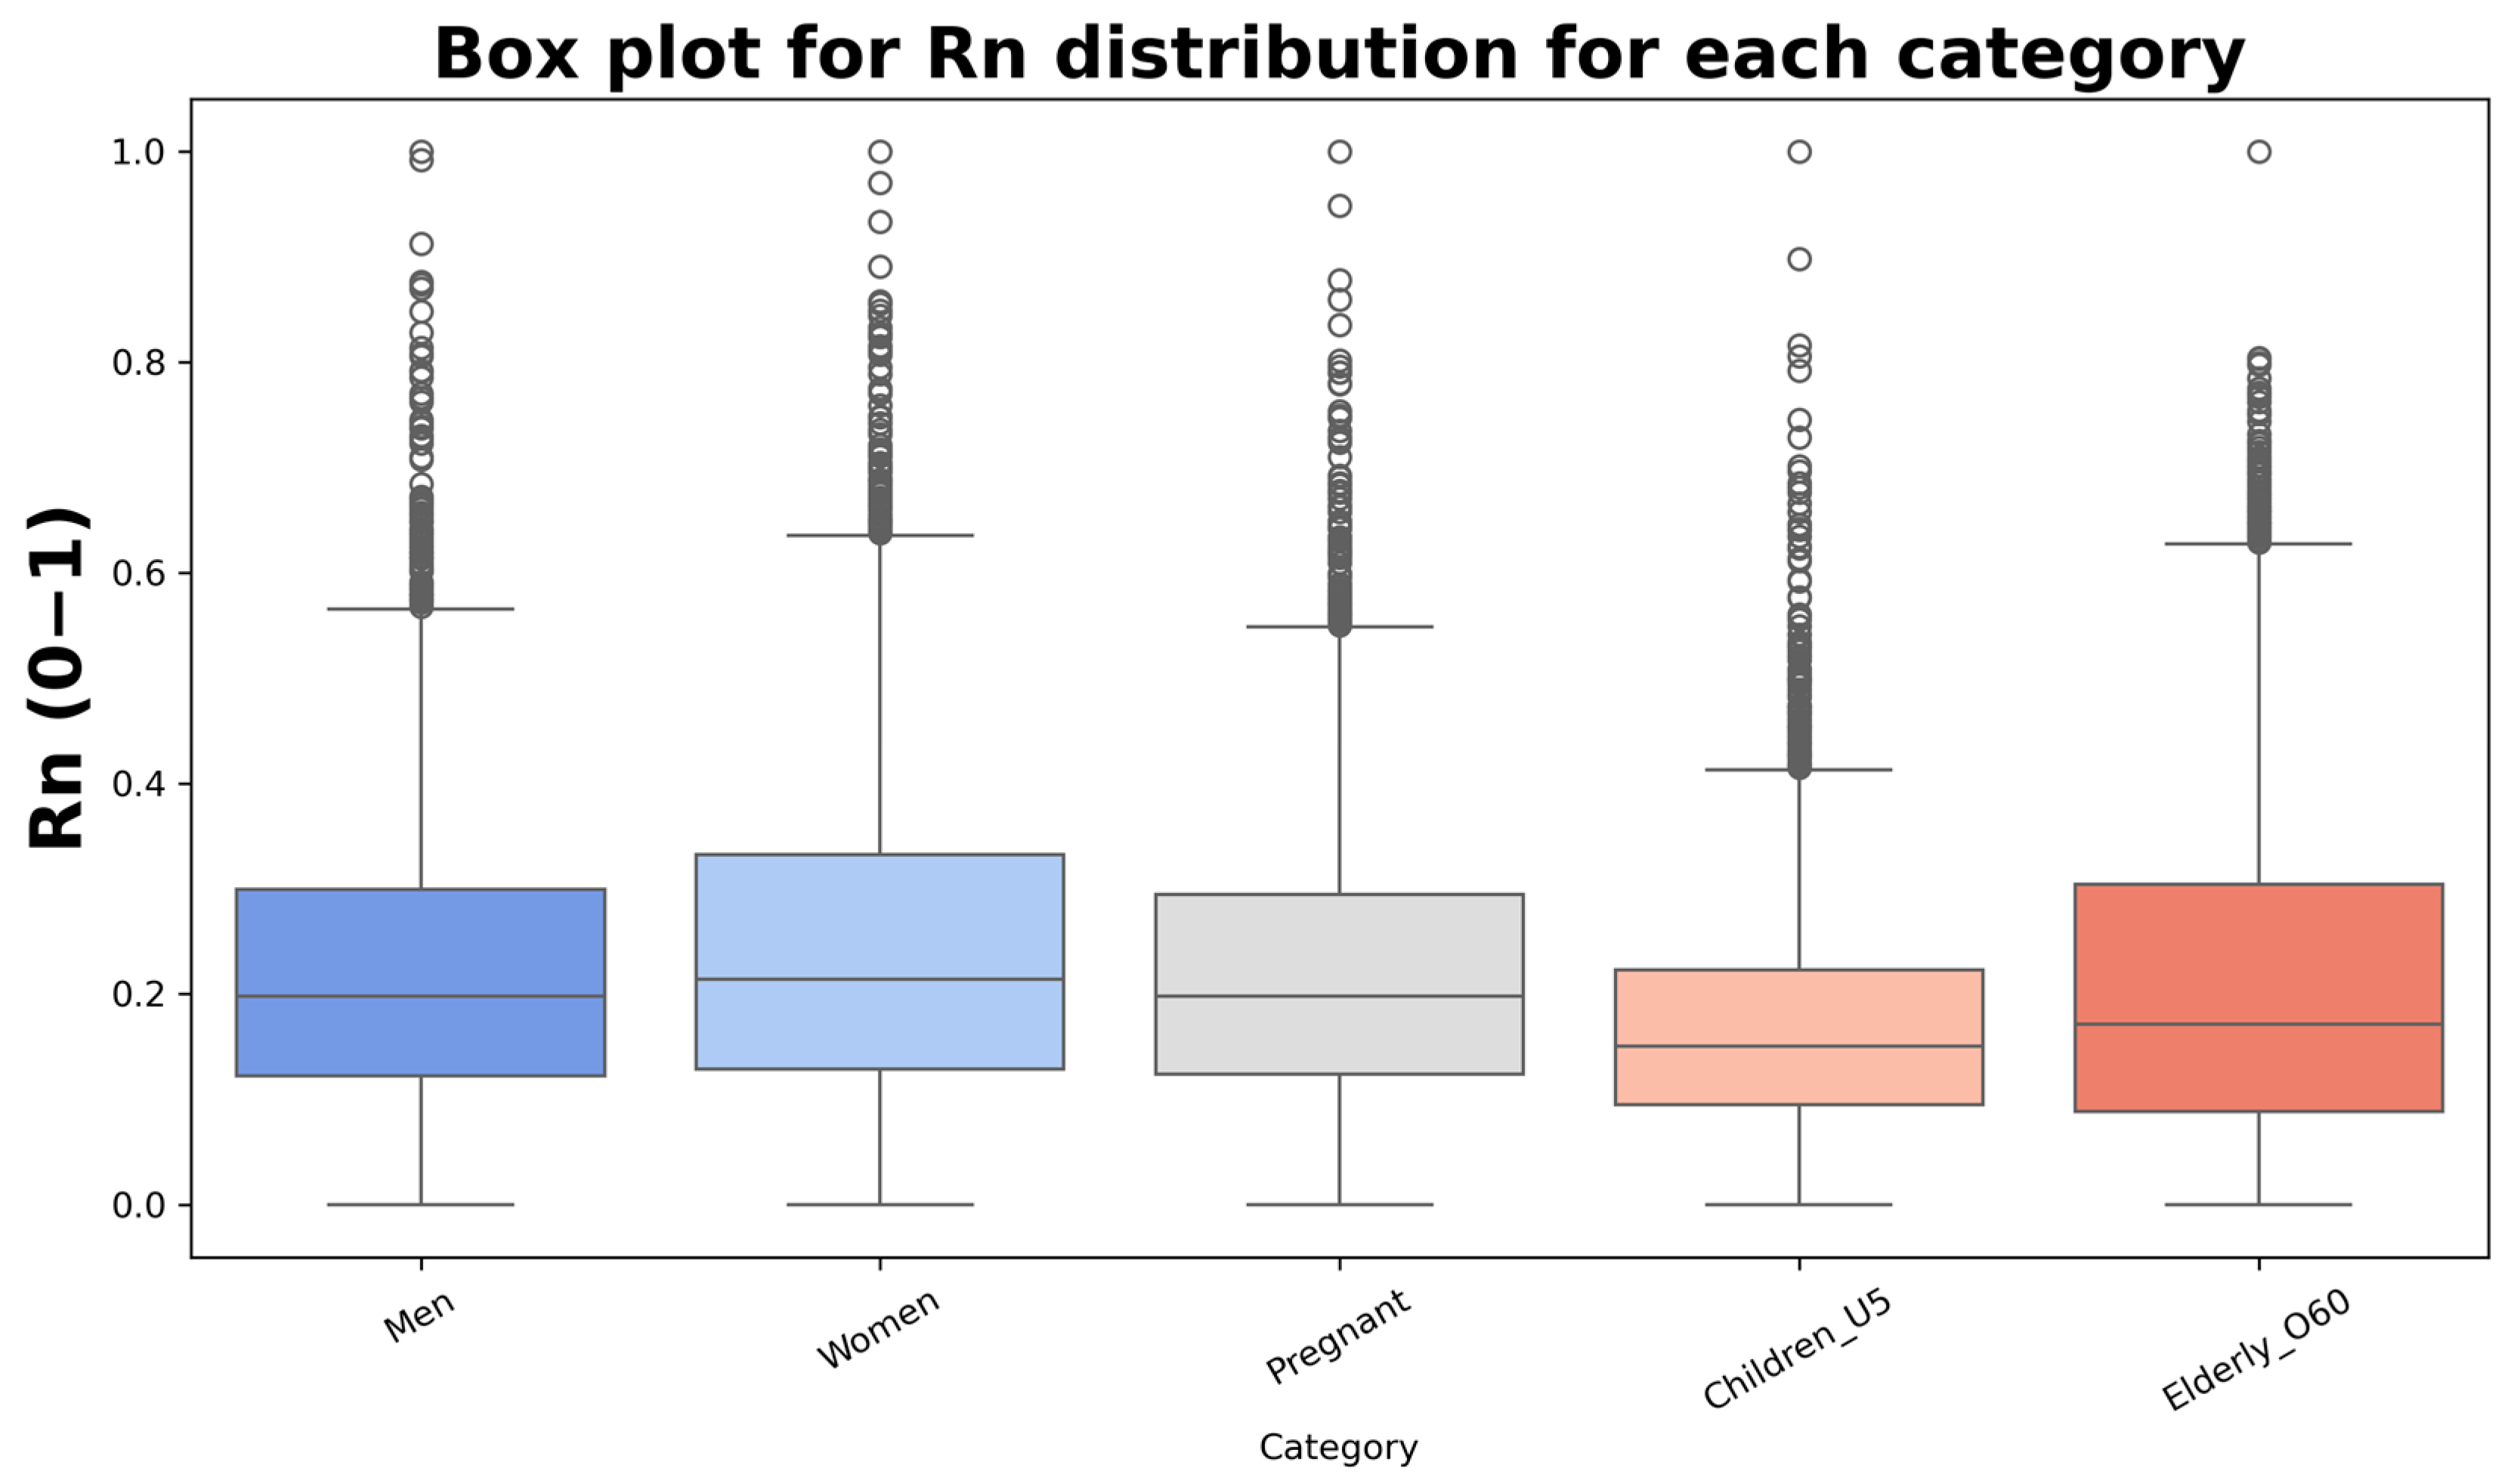
Finally, a general summary of Rn values for each demographic class is reported in Figure 8.
Here, the Rn distribution is presented for each demographic category. Specifically, children under 5 and elderly people over 60 exhibit a low median value compared to other categories, but their Rn ranges (i.e., the box lengths) are particularly high. Both categories also display a greater number of outliers, indicating that these two categories (especially the elderly) present the highest Rn values, while children under 5 show a high variability in the Rn distribution, as shown from the outliers. Generally, men, women, and pregnant women show a similar trend, with a median Rn of 0.2 and a minimum maximum range from 0.1 to 0.3.

3.3. Risk Indices Referring to the LST

This section presents the Rn distribution for each demographic category in relation to LST.
Figure 9 shows the Rn distribution as a function of LST for all demographic class.
These charts confirm a quite good–moderate dependency of Rn on LST across all the categories. Specifically, all categories exhibit a dense concentration of Rn (≈0.2) from 35 to 37 °C, corresponding to the that is the SUHI boundary (Figure 3). Some outliers occur within the SUHI temperature range (37–40 °C), while Rn concentrations notably decrease at higher temperatures, indicating SUHI areas with high vulnerability. The r was calculated for each population category to assess the relationship between Rn and LST. Results indicate a moderate correlation, with r values ranging from 0.38–0.40 for the elderly and children (the two categories showing greatest variability in Figure 8) to higher values of 0.42 for men, women, and pregnant women (confirming the similar Rn trend in Figure 8).

4. Discussion and Conclusions

This work analyses the issue of population risk to heat stress during the SUHI period by combining computational solutions such as GEE and consolidating algorithms (SMW) for remote-sensed data analysis to show a versatile procedure for SUHI identification and monitoring. The LST derives from L8 and L9 satellites using the methodology have already been presented in [28].
Although numerous studies use satellite-derived LST to study the urban thermal environment, it is important to remember that LST is derived exclusively from thermal radiation emitted by the Earth’s surface; its ability to accurately represent the impacts of high-temperature events on urban residents must be integrated with other data and parameters to improve performance. Beside these considerations, the limitations of satellite spatial resolution should also be considered. A new incoming operational mission will deliver suitable data with finer GSD but, for now, the spatial resolution must be considered when attempting more localized analyses. Satellite measurements help show that the evaluation of SUHI permits the mapping of hotspots and identifies higher heat risk areas with associated sensitive communities. The LST nocturnal data are provided by remote sensing imagery for a time series from 2013 to 2023. LST images were analysed to determine the location of permanent SUHIs in the study area, such as the one in the urban centre. From the LST time series, the hottest image was chosen and analysed together with the population dataset provided by HDX Data for Good at Meta to compute the Rn for the population categories subdivided into men and women, women of reproductive age, children under 5, and elderly people over 60. The results showed that the most sensitive population classes are the elderly, children under 5, and men. Elderly and children present a high value of R (0.8 and 0.6, respectively) due to their physical condition, but men present a low value of V (0.2); for this reason, the high Rn may be associated with the high percentage of men in Naples. The elderly are the most sensitive to heat stress, with an Rn ranging from 0.6 to 0.8 in several LCZs, because of reduced mobility and predisposition to dehydration due to the reduction of thirst sensitivity. Another population category particularly vulnerable to heat stress is children under the age of 5, with an Rn from 0.2 to 0.8. Infants and young children are at greater risk of dehydration than adults because of their higher surface area/volume ratio and greater daily fluid turnover, with greater fluid losses even under healthy conditions. Pregnant women also present a notably elevated Rn (with a maximum value of 0.88 in LCZ 8) due to their reduced thermoregulatory capacity. In conclusion, each category presents a grade of Rn to heat stress in SUHI areas directly proportional to temperature values and demographic density. At the end of this paragraph, Table 3 presents a general résumé of this concept. According to Table 1, the average LCZ and Rn values for all the categories were reported for each neighbourhood. It is important to highlight that in some neighbourhoods, some mean Rn values are 0 because some of the variables used to compute the effective risk (so H, E or V) are quite close to 0 and as such were not used for the computation. Studies concerning assessing the effect of SUHIs are critical to identifying risk areas and optimizing mitigation interventions to improve people’s quality of life.
The strength of the proposed approach is the exportability, nominally worldwide or at least in any area where a long time series is available. Indeed, this code permits the retrieval of the high-resolution LST in different contexts and climatic conditions, dependent only on the availability of the input data concerning, in particular, the TIR bands (in this case the L8 B10 (10.60–11.19 μm) used to extract the Tb and the emissivity (10.25–10.95 μm ASTERGED B13) that are used to compute the LST for the nocturnal image stack. On the other hand, limitations of this approach can be found in its reduced dataset, which greatly decreases the reliability of the results. The algorithm requires only the LST retrieval by applying SMW procedure and the auxiliary files needed.
This approach integrates (1) satellite data and the estimation of LST according to [32] and validation measurements in the Solfatara area as well as (2) data from censuses to define the population living in the study area also considering the analysis computed in [30].
This study enables the evaluation of the impacts of extreme temperature at a local scale and could also be used to support the development of mitigation measures to counteract the rising temperatures in urban areas.

Author Contributions

Conceptualization, M.M. and A.S.; methodology, M.M. and A.S.; software, A.S.; validation, M.S. and A.C.; formal analysis, A.C. and F.R. investigation, M.M.; data curation, M.S.; writing—original draft preparation, M.M., A.S., and F.R.; writing—review and editing, M.M. and A.S.; visualization, M.M.; supervision, F.R. All authors have read and agreed to the published version of the manuscript.

Funding

This research received no external funding.

Acknowledgments

This work was supported by the ASI SpaceItUp contract N. 2024-5-E.0, CUP I53D24000060005., SPOKE 5 activities. Federico Rabuffi was supported by the Jet Propulsion Laboratory, California Institute of Technology, under a contract with the National Aeronautics and Space Administration (80NM0018D0004) © 2025. All rights reserved.

Conflicts of Interest

The authors declare no conflicts of interest.

References

  1. Seneviratne, S.I.; Zhang, X.; Adnan, M.; Badi, W.; Dereczynski, C.; Di Luca, A.; Ghosh, S.; Iskander, I.; Kossin, J.; Lewis, S.; et al. Weather and Climate Extreme Events in a Changing Climate. In Climate Change 2021: The Physical Science Basis. Contribution of Working Group I to the Sixth Assessment Report of the Intergovernmental Panel on Climate Change; Masson-Delmotte, V., Zhai, P., Pirani, A., Connors, S.L., Péan, C., Berger, S., Caud, N., Chen, Y., Goldfarb, L., Gomis, M.I., et al., Eds.; Cambridge University Press: Cambridge, UK; New York, NY, USA, 2021; pp. 1513–1766. [Google Scholar] [CrossRef]
  2. Yang, M.; Ren, C.; Wang, H.; Wang, J.; Feng, Z.; Kumar, P.; Cao, S.J. Mitigating urban heat island through neighboring rural land cover. Nat. Cities 2024, 1, 522–532. [Google Scholar] [CrossRef]
  3. Shepherd, T.G. Atmospheric circulation as a source of uncertainty in climate change projections. Nat. Geosci. 2014, 7, 703–708. [Google Scholar] [CrossRef]
  4. IPCC. Sections. In Climate Change 2023: Synthesis Report. Contribution of Working Groups I, II and III to the Sixth Assessment Report of the Intergovernmental Panel on Climate Change; Core Writing Team, Lee, H., Romero, J., Eds.; IPCC: Geneva, Switzerland, 2023; pp. 35–115. [Google Scholar] [CrossRef]
  5. Masselot, P.; Mistry, M.N.; Rao, S.; Huber, V.; Monteiro, A.; Samoli, E.; Gasparrini, A. Estimating future heat-related and cold-related mortality under climate change, demographic and adaptation scenarios in 854 European cities. Nat. Med. 2025, 31, 1294–1302. [Google Scholar] [CrossRef]
  6. García-Herrera, R.; Díaz, J.; Trigo, R.M.; Luterbacher, J.; Fischer, E.M. A review of the European summer heat wave of 2003. Crit. Rev. Environ. Sci. Technol. 2010, 40, 267–306. [Google Scholar] [CrossRef]
  7. Ebi Kristie, L.; Gerald, M. The heat is on: Climate change and heatwaves in the midwest. In Regional Impacts of Climate Change: Four Case Studies in the United States; Pew Center on Global Climate Change: Washington, DC. USA, 2007; Available online: https://n2t.org/ark:/85065/d79w0gvw (accessed on 5 September 2025).
  8. Mayrhuber, E.A.-S.; Dückers, M.L.; Wallner, P.; Arnberger, A.; Allex, B.; Wiesböck, L.; Wanka, A.; Kolland, F.; Eder, R.; Hutter, H.-P.; et al. Vulnerability to heatwaves and implications for public health interventions—A scoping review. Environ. Res. 2018, 166, 42–54. [Google Scholar] [CrossRef]
  9. Changnon; Stanley, A.; Kunkel, K.E.; Reinke, B.C. Impacts and responses to the 1995 heat wave: A call to action. Bull. Am. Meteorol. Soc. 1996, 77, 1497–1506. [Google Scholar] [CrossRef]
  10. Palecki, M.A.; Changnon, S.A.; Kunkel, K.E. The Nature and Impacts of the July 1999 Heat Wave in the Midwestern United States: Learning from the Lessons of 1995. Bull. Am. Meteorol. Soc. 2001, 82, 1353–1367. [Google Scholar] [CrossRef]
  11. Althor, G.; Watson, J.E.M.; Fuller, R.A. Global mismatch between greenhouse gas emissions and the burden of climate change. Sci. Rep. 2016, 6, 20281. [Google Scholar] [CrossRef]
  12. Li, X.; Zhou, Y.; Yu, S.; Jia, G.; Li, H.; Li, W. Urban heat island impacts on building energy consumption: A review of approaches and findings. Energy 2019, 174, 407–419. [Google Scholar] [CrossRef]
  13. Filonchyk, M.; Peterson, M.P.; Zhang, L.; Hurynovich, V.; He, Y. Greenhouse gases emissions and global climate change: Examining the influence of CO2, CH4, and N2O. Sci. Total. Environ. 2024, 935, 173359. [Google Scholar] [CrossRef]
  14. Morabito, M.; Crisci, A.; Guerri, G.; Messeri, A.; Congedo, L.; Munafò, M. Surface urban heat islands in Italian metropolitan cities: Tree cover and impervious surface influences. Sci. Total. Environ. 2021, 751, 142334. [Google Scholar] [CrossRef]
  15. Magli, S.; Lodi, C.; Lombroso, L.; Muscio, A.; Teggi, S. Analysis of the urban heat island effects on building energy consumption. Int. J. Energy Environ. Eng. 2015, 6, 91–99. [Google Scholar] [CrossRef]
  16. Wei, L.; Sobrino, J.A. Surface urban heat island analysis based on local climate zones using ECOSTRESS and Landsat data: A case study of Valencia city (Spain). Int. J. Appl. Earth Obs. Geoinf. 2024, 130, 103875. [Google Scholar] [CrossRef]
  17. Pearsall, H. Staying cool in the compact city: Vacant land and urban heating in Philadelphia, Pennsylvania. Appl. Geogr. 2017, 79, 84–92. [Google Scholar] [CrossRef]
  18. Kim, J.; Lee, D.-K.; Brown, R.D.; Kim, S.; Kim, J.-H.; Sung, S. The effect of extremely low sky view factor on land surface temperatures in urban residential areas. Sustain. Cities Soc. 2022, 80, 103799. [Google Scholar] [CrossRef]
  19. Deng, X.; Yu, W.; Shi, J.; Huang, Y.; Li, D.; He, X.; Zhou, W.; Xie, Z. Characteristics of surface urban heat islands in global cities of different scales: Trends and drivers. Sustain. Cities Soc. 2024, 107, 105483. [Google Scholar] [CrossRef]
  20. Zhang, W.; Zheng, C.; Chen, F. Mapping heat-related health risks of elderly citizens in mountainous area: A case study of Chongqing, China. Sci. Total Environ. 2019, 663, 852–866. [Google Scholar] [CrossRef]
  21. Ballester, J.; Quijal-Zamorano, M.; Turrubiates, R.F.M.; Pegenaute, F.; Herrmann, F.R.; Robine, J.M.; Basagaña, X.; Tonne, C.; Antó, J.M.; Achebak, H. Heat-related mortality in Europe during the summer of 2022. Nat. Med. 2023, 29, 1857–1866. [Google Scholar] [CrossRef]
  22. Available online: https://www.un.org/development/desa/en/news/population/2018-revision-of-world-urbanization-prospects.html (accessed on 5 September 2025).
  23. Gauer, R.; Meyers, B.K. Heat-related illnesses. Am. Fam. Physician 2019, 99, 482–489. [Google Scholar]
  24. Crichton, D. The Risk Triangle; Tudor Rose: London, UK, 1999. [Google Scholar]
  25. Buscail, C.; Upegui, E.; Viel, J.F. Mapping heatwave health risk at the community level for public health action. Int. J. Health Geogr. 2012, 11, 38. [Google Scholar] [CrossRef]
  26. Chen, Q.; Ding, M.; Yang, X.; Hu, K.; Qi, J. Spatially explicit assessment of heat health risk by using multi-sensor remote sensing images and socioeconomic data in Yangtze River Delta, China. Int. J. Health Geogr. 2018, 17, 15. [Google Scholar] [CrossRef]
  27. Baker, C.J.; Thornes, J.E.; Chapman, L.; Tomlinson, C.J. Including the urban heat island in spatial heat health risk assessment strategies: A case study for Birmingham, UK. Int. J. Health Geogr. 2011, 10, 42. [Google Scholar] [CrossRef]
  28. Scalabrini, A.; Musacchio, M.; Silvestri, M.; Rabuffi, F.; Buongiorno, M.F.; Salvini, F. Satellite Time-Series Analysis for Thermal Anomaly Detection in the Naples Urban Area, Italy. Atmosphere 2014, 15, 523. [Google Scholar] [CrossRef]
  29. Gaudioso, D.; Giordano, F.; Taurino, E. Focus Sulle Città e la Sfida dei Cambiamenti Climatici; ISPRA: Rome, Italy, 2014. [Google Scholar]
  30. Orusa, T.; Viani, A.; Moyo, B.; Cammareri, D.; Borgogno-Mondino, E. Risk assessment of rising temperatures using landsat 4–9 LST time series and meta® population dataset: An application in Aosta Valley, NW Italy. Remote Sens. 2023, 15, 2348. [Google Scholar] [CrossRef]
  31. Li, Z.L.; Wu, H.; Wang, N.; Qiu, S.; Sobrino, J.A.; Wan, Z.; Tang, B.H.; Yan, G. LSE retrieval from satellite data. Int. J. Remote Sens. 2013, 34, 3084–3127. [Google Scholar] [CrossRef]
  32. Ermida, S.L.; Soares, P.; Mantas, V.; Gottsche, F.; Trigo, I. Google Earth Engine Open-Source Code for Land Surface Temperature Estimation from the Landsat Series. Remote Sens. 2020, 12, 1471. [Google Scholar] [CrossRef]
  33. Landsat 8. Available online: https://landsat.gsfc.nasa.gov/landsat-8/ (accessed on 30 November 2023).
  34. USGS. Landsat 8 OLI and TIRS Calibration Notices. Available online: https://www.usgs.gov/land-resources/nli/landsat/landsat-8-oli-and-tirs-calibration-notices (accessed on 30 November 2023).
  35. Duan, S.B.; Li, Z.L.; Wang, C.; Zhang, S.; Tang, B.H.; Leng, P.; Gao, M.F. Land-surface temperature retrieval from Landsat 8 single-channel thermal infrared data in combination with NCEP reanalysis data and ASTER GED product. Int. J. Remote Sens. 2019, 40, 1763–1778. [Google Scholar] [CrossRef]
  36. Available online: https://data.humdata.org/organization/74ad0574-923d-430b-8d52-ad80256c4461 (accessed on 5 September 2025).
  37. Available online: https://dataforgood.facebook.com/dfg/docs/high-resolution-population-density-maps-demographic-estimates-documentation (accessed on 5 September 2025).
  38. Hulley, G.; Hook, S. The Aster Global emissivity database. Geophys. Res. Lett. 2015, 42, 7966–7976. [Google Scholar] [CrossRef]
  39. ASTER Global Emissivity Dataset GED. Available online: https://lpdaac.usgs.gov/products/ag100v003/ (accessed on 30 November 2023).
  40. Verhulst, S.; Ramesh, A.; Young, A.; Zahuranec, A.J. Where Is Everyone? The Importance of Population Density Data: A Data Artefact Study of the Facebook Population Density Map; Elsevier: Amsterdam, The Netherlands, 2021. [Google Scholar]
  41. Facebook Connectivity Lab and Center for International Earth Science Information Network—CIESIN—Columbia University. High Resolution Settlement Layer (HRSL); Palgrave Macmillan: Cham, Switzerland, 2016; Source imagery for HRSL © 2016 DigitalGlobe. [Google Scholar]
  42. Caputo, T.; Bellucci Sessa, E.; Silvestri, M.; Buongiorno, M.F.; Musacchio, M.; Sansivero, F.; Vilardo, G. Surface temperature multiscale monitoring by thermal infrared satellite and ground images at Campi Flegrei volcanic area (Italy). Remote Sens. 2019, 11, 1007. [Google Scholar] [CrossRef]
  43. Yoo, C.; Im, J.; Weng, Q.; Cho, D.; Kang, E.; Shin, Y. Diurnal urban heat risk assessment using extreme air temperatures and real-time population data in Seoul. iScience 2023, 26, 108123. [Google Scholar] [CrossRef]
  44. Guha, S.; Govil, H.; Mukherjee, S. Dynamic analysis and ecological evaluation of urban heat islands in Raipur city, India. J. Appl. Remote Sens. 2017, 11, 036020. [Google Scholar] [CrossRef]
  45. Available online: https://www.napolitoday.it/cronaca/caldo-allerta-19-20-luglio-2023.html (accessed on 5 September 2025).
  46. IPCC. Climate Change 2014: Synthesis Report. Contribution of Working Groups I, II and III to the Fifth Assessment Report of the Intergovernmental Panel on Climate Change; Core Writing Team, Pachauri, R.K., Meyer, L.A., Eds.; IPCC: Geneva, Switzerland, 2014; p. 151. [Google Scholar]
  47. van Daalen, K.R.; Tonne, C.; Semenza, J.C.; Rocklöv, J.; Markandya, A.; Dasandi, N.; Jankin, S.; Achebak, H.; Ballester, J.; Bechara, H.; et al. The 2024 Europe report of the Lancet Countdown on health and climate change: Unprecedented warming demands unprecedented action. Lancet Public Health 2014, 9, e495–e522. [Google Scholar] [CrossRef]
  48. Fierro, P.; Loria, S.; Duca, P.; Loffredo, L. Sviluppare conoscenza attraverso la partecipazione. Il Referto Epidemiologico Comunale (REC). Recent. Prog. Med. 2022, 113, 749–751. [Google Scholar] [CrossRef]
  49. Available online: https://www.who.int/health-topics/heatwaves#tab=tab_1 (accessed on 5 September 2025).
  50. Available online: https://www.eea.europa.eu/en/analysis/publications/the-impacts-of-heat-on-health#:~:text=For%20example%2C%20for%202022%2C%20it,et%20al.%2C%202024) (accessed on 5 September 2025).
  51. Piano Nazionale di Prevenzione degli Effetti del Caldo Sulla Salute, Linee di Indirizzo per la Prevenzione. 2019. Available online: https://cipesalute.org/cedo/allegati/8520-allegato7519094.pdf (accessed on 17 September 2025).
  52. Kestens, Y.; Brand, A.; Fournier, M.; Goudreau, S.; Kosatsky, T.; Maloley, M.; Smargiassi, A. Modelling the variation of land surface temperature as determinant of risk of heat-related health events. Int. J. Health Geogr. 2011, 10, 7. [Google Scholar] [CrossRef]
  53. Pappaccogli, G.; Esposito, A.; Buccolieri, R. Summer Diurnal LST Variability Across Local Climate Zones Using ECOSTRESS Data in Lecce and Milan. Atmosphere 2025, 16, 377. [Google Scholar] [CrossRef]
  54. Morabito, M.; Crisci, A.; Gioli, B.; Gualtieri, G.; Toscano, P.; Di Stefano, V.; Orlandini, S.; Gensini, G.F. Urban-hazard risk analysis: Mapping of heat-related risks in the elderly in major Italian cities. PLoS ONE 2015, 10, e0127277. [Google Scholar] [CrossRef]
  55. Feng, W.; Liu, J. A Literature Survey of Local Climate Zone Classification: Status, Application, and Prospect. Buildings 2022, 12, 1693. [Google Scholar] [CrossRef]
  56. Huang, F.; Jiang, S.; Zhan, W.; Bechtel, B.; Liu, Z.; Demuzere, M.; Huang, Y.; Xu, Y.; Ma, L.; Xia, W.; et al. Mapping local climate zones for cities: A large review. Remote Sens. Environ. 2023, 292, 113573. [Google Scholar] [CrossRef]
  57. Bechtel, B.; Alexander, P.J.; Böhner, J.; Ching, J.; Conrad, O.; Feddema, J.; Mills, G.; See, L.; Stewart, I. Mapping local climate zones for a worldwide database of the form and function of cities. ISPRS Int. J. Geo-Inf. 2015, 4, 199–219. [Google Scholar] [CrossRef]
  58. Stewart, I.D.; Oke, T.R. Local climate zones for urban temperature studies. Bull. Am. Meteorol. Soc. 2012, 93, 1879–1900. [Google Scholar] [CrossRef]
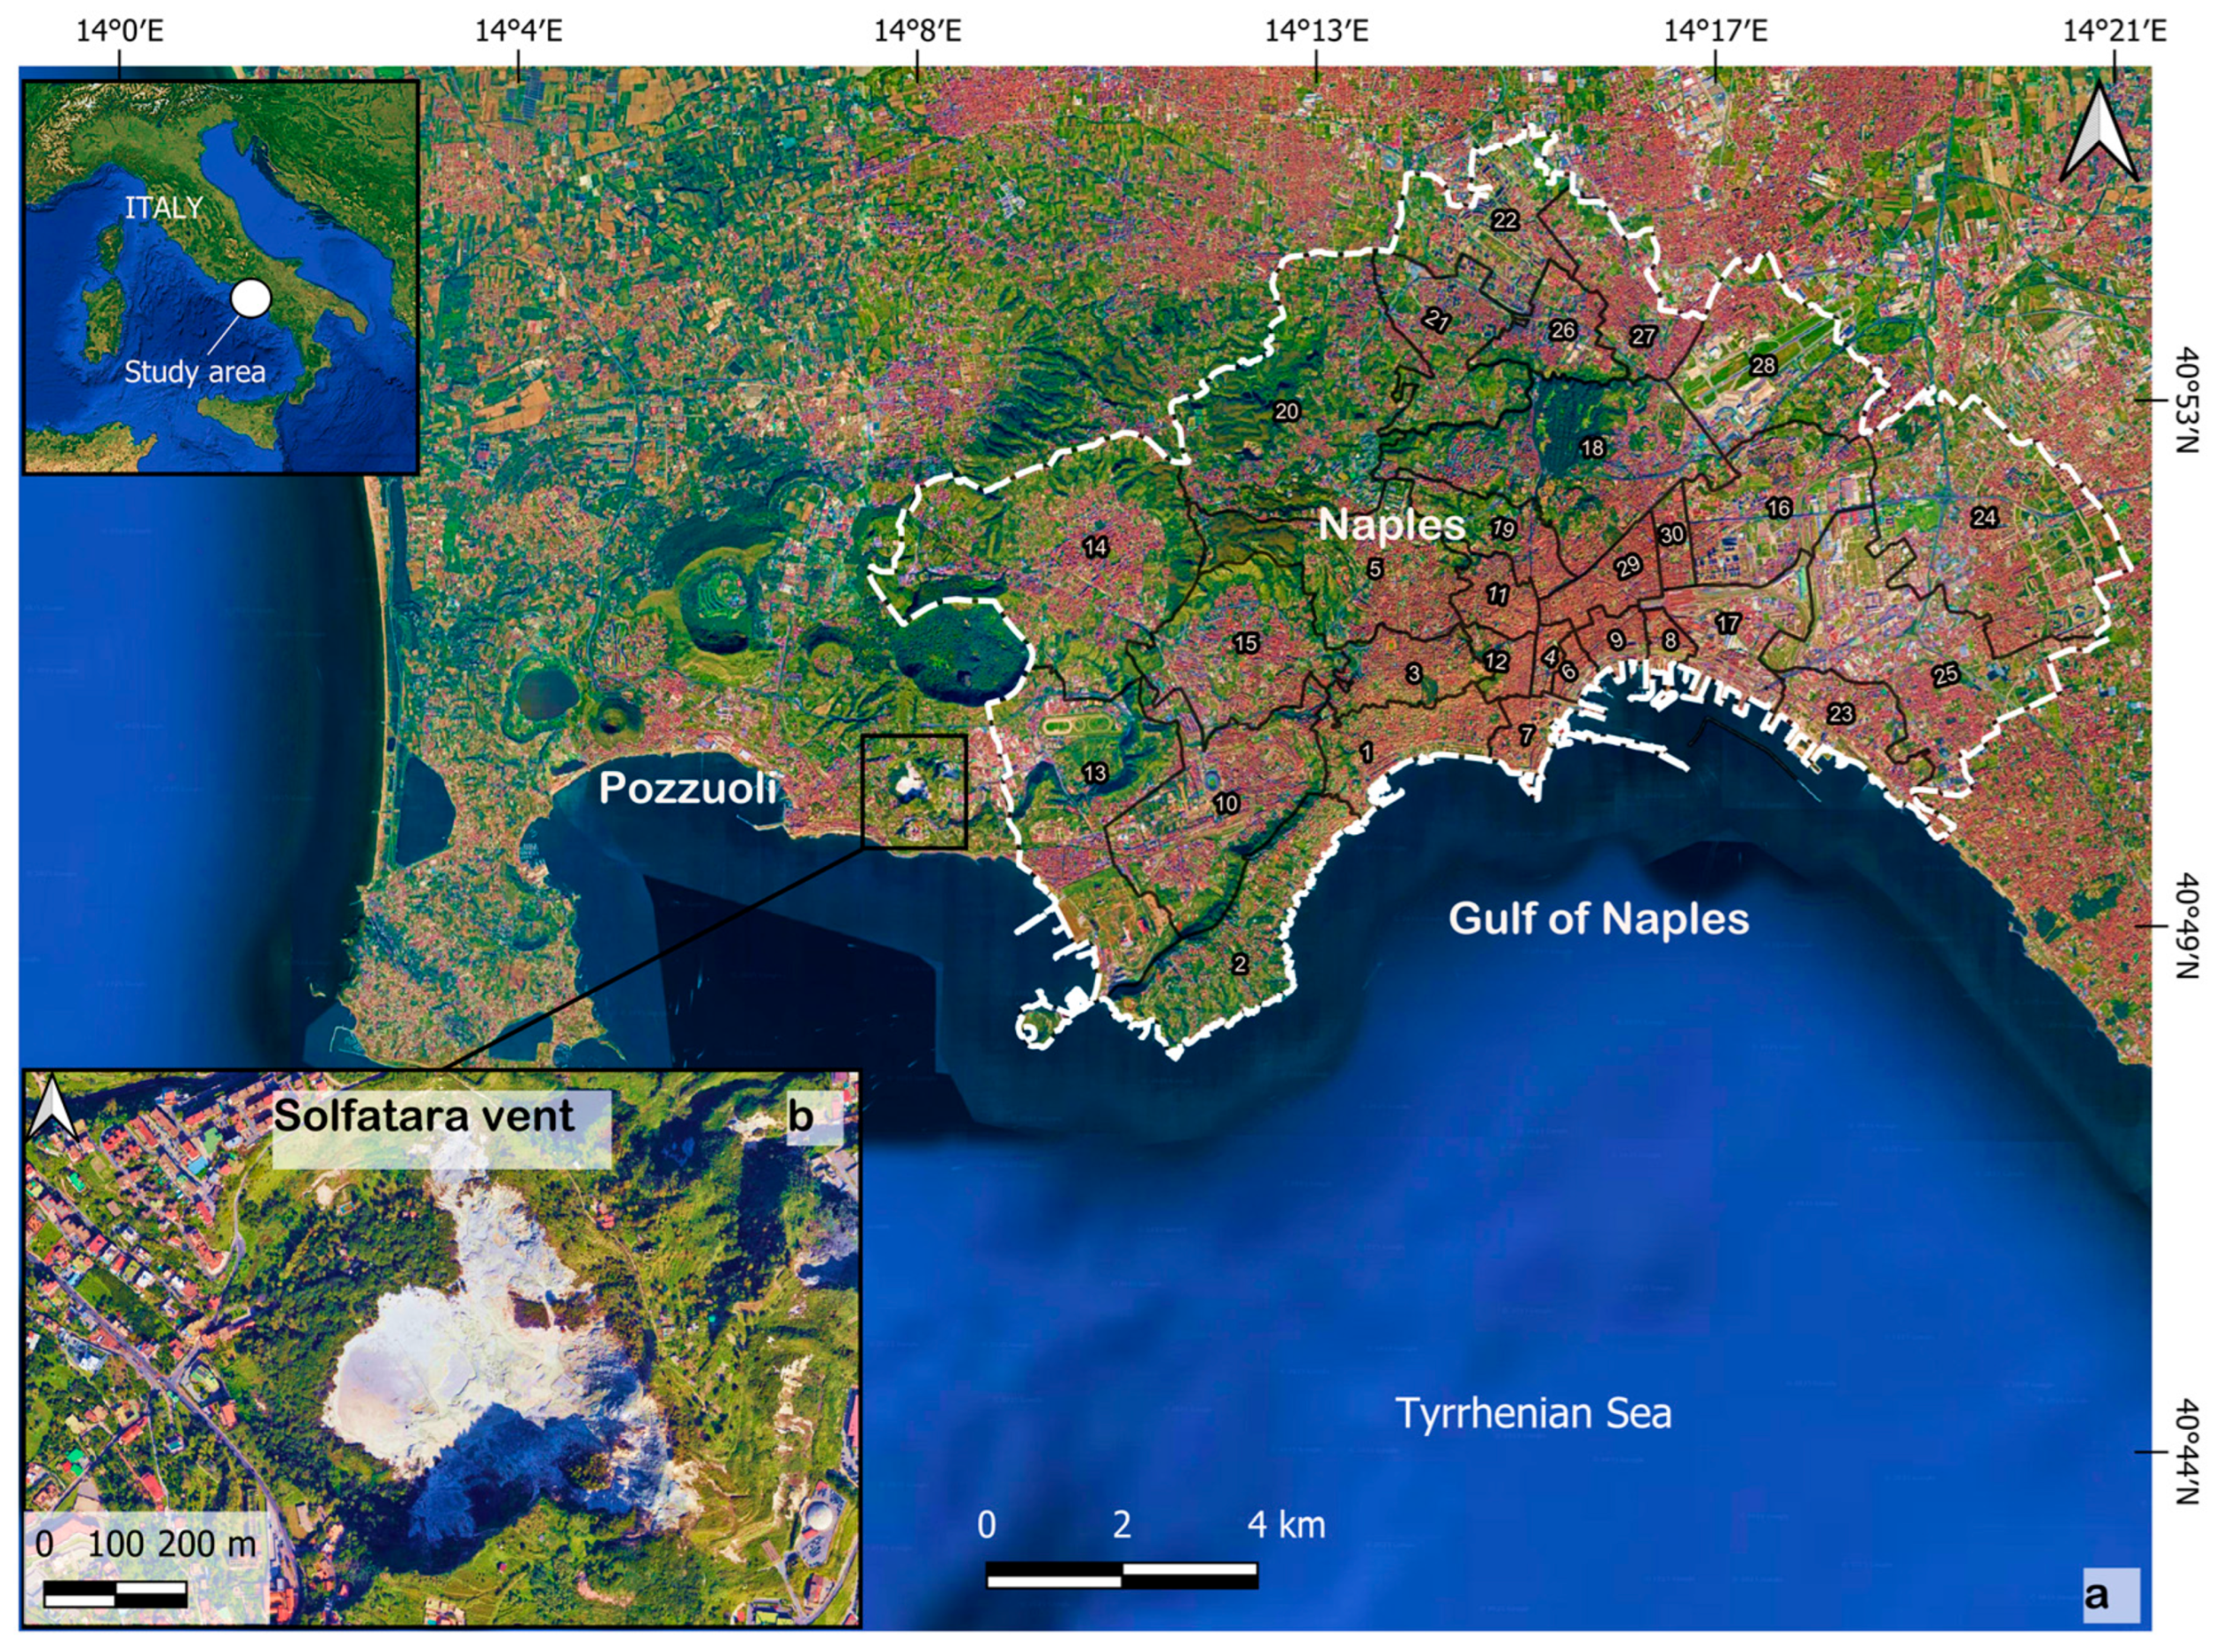
Figure 1. Study area. (a) Naples’ territory. The dashed line represents the boundary of the Naples Municipality, and the numbers indicate the corresponding neighborhoods, as listed in Table 1. On the west, (b) represents a zoom of the Solfatara vent; this area is used as the LST validation site. Source: Google Satellite.
Remotesensing 17 03306 g001
Figure 2. Workflow applied in the GEE procedure to retrieve the LST [28], where the variables are as follows: Tb = brightness temperature, which is derived from L8 TIRS data by using the thermal channel centered at 11 μm, which corresponds to band 10; ε = emissivity. Emissivity values are necessary for LST computation from Tb images; A, B, C = atmospheric correction coefficients. These are required to constrain the atmospheric contributions in the TIR observations.
Remotesensing 17 03306 g002
Figure 3. SUHI isotherm of 17 July 2023 settled at 37 °C; it represents the temperature boundary above which SUHI is verified, with the temperature recorded as reported in the figure, and the black dashed square represents the harbor area where the maximum temperature is recorded.
Remotesensing 17 03306 g003
Figure 4. LCZ in Naples; the legend is based on [57]. The black square represents the historical center of Naples, while the dashed line represents the industrial area.
Remotesensing 17 03306 g004
Figure 5. (a) Median of all the LCZs for each neighbourhood (represented according to “Number” in Table 1). (b) Maximum temperature value recorded in each neighbourhood for the representative LCZ.
Remotesensing 17 03306 g005
Figure 6. Heat map showing Rn values for each population category in each LCZ.
Remotesensing 17 03306 g006
Figure 7. Scatter plot representing the correlation between Rn and population density for each demographic category.
Remotesensing 17 03306 g007
Figure 8. Box plot representing Rn distribution for all the demographic classes.
Remotesensing 17 03306 g008
Figure 9. Rn distribution according to the LST.
Remotesensing 17 03306 g009
Table 1. Identification number for each neighborhood shown Figure 1.
NeighborhoodNumbersNeighborhoodNumbersNeighborhoodNumbers
Chiaia1Ponticelli11San Giuseppe21
Arenella2Scampia12Barra22
Avvocata3Secondigliano13San Giovanni a Teduccio23
Chiaiano4San Pietro a Patierno14Mercato24
Fuorigrotta5San Carlo all’Arena15Pendino25
Miano6San Lorenzo16San Ferdinando26
Montecalvario7Vicaria17Bagnoli27
Pianura8Stella18Posillipo28
Piscinola9Soccavo19Zona Industriale29
Poggioreale10Vomero20Porto30
Table 2. R values for each population category. The 0.2 step has been used to define the index from 0 to 1. Note that the minimum and maximum outliers, 0 and 1, are not considered because no class is completely immune or fully at risk to heat stress.
Population ClassRisk (R)
Over 600.8
Children under 50.6
Pregnant women0.4
Adults Women0.2
Adults Men0.2
Table 3. Résumé table of LCZ, rates, and mean Rn values of each population category for each neighbourhood according Table 1.
NeighborhoodsNumbersRates 2021 (EUR)LCZMean Rn MenMean Rn WomenMean Rn Pregnant WomenMean Rn Children Under 5Mean Rn over 60
Chiaia149,97860.0770.0880.0630.0380.109
Arenella229,02560.0610.0700.0480.0280.093
Avvocata320,54620.1370.1490.1170.0710.149
Chiaiano416,241900000
Fuorigrotta521,40360.0550.0600.0440.0260.080
Miano615,63060.0010.0010.00100.001
Montecalvario720,40650.2010.2010.1630.1120.175
Pianura818,29260.0010.0010.0010.0010.001
Piscinola916,241600000
Poggioreale1017,27460.0310.0320.0250.0170.037
Ponticelli1115,76360.0270.0270.0220.0170.024
Scampia1216,241600000
Secondigliano1315,63060.0010.0010.00100.001
San Pietro a Patierno1415,63060.0040.0040.0030.0030.004
San Carlo all’Arena1516,84260.0370.0390.0300.0210.048
San Lorenzo1613,84280.1610.1660.1360.0940.163
Vicaria1713,84280.1120.1180.0920.0610.143
Stella1816,84250.0660.0690.0580.0410.070
Soccavo1918,29260.0410.0420.0320.0210.050
Vomero2038,39360.1130.1320.0900.0520.180
San Giuseppe2134,75720.0640.0710.0490.0340.096
Barra2215,76360.0260.0250.0210.0160.028
San Giovanni a Teduccio2315,90690.0600.0630.0500.0410.058
Mercato2422,290100.0840.0890.0680.0530.090
Pendino2522,29080.1210.1280.1030.0760.135
San Ferdinando2624,70460.0890.0950.0730.0450.114
Bagnoli2719,31960.0070.0070.0050.0040.008
Posillipo2848,16150.0150.0170.0130.0080.021
Zona Industriale2917,274100.0140.0140.0120.0100.016
Porto3024,81380.0620.0590.0460.0250.064
Disclaimer/Publisher’s Note: The statements, opinions and data contained in all publications are solely those of the individual author(s) and contributor(s) and not of MDPI and/or the editor(s). MDPI and/or the editor(s) disclaim responsibility for any injury to people or property resulting from any ideas, methods, instructions or products referred to in the content.