Article

High-Frequency Monitoring and Short-Term Forecasting of Surface Water Temperature Using a Novel Hyperspectral Proximal Sensing System

1
Key Laboratory of Lake and Watershed Science for Water Security, Nanjing Institute of Geography and Limnology, Chinese Academy of Sciences, Nanjing 211135, China
2
Taihu Laboratory for Lake Ecosystem Research, State Key Laboratory of Lake Science and Environment, Nanjing Institute of Geography and Limnology, Chinese Academy of Sciences, Nanjing 211135, China
3
University of Chinese Academy of Sciences, Beijing 100049, China
4
College of Nanjing, University of Chinese Academy of Sciences, Nanjing 211135, China
5
Nanjing Zhongke Deep Insight Technology Research Institute Co., Ltd., Nanjing 211899, China
*
Author to whom correspondence should be addressed.
Remote Sens. 2025, 17(19), 3303; https://doi.org/10.3390/rs17193303
Submission received: 31 July 2025 / Revised: 15 September 2025 / Accepted: 22 September 2025 / Published: 26 September 2025

Abstract

Highlights

What are the main findings?
  • A high-precision lake surface water temperature (LSWT) inversion model was developed using a novel hyperspectral proximal sensing system (HPSs) and a DNN algorithm, achieving an R2 = 0.99, an RMSE = 0.92 °C, and an MAE = 0.64 °C.
  • A short-term LSWT forecasting model based on the LSTM algorithm and HPSs data was established, providing accurate 1–3-day predictions (R2 > 0.985).
What is the implication of the main finding?
  • The approach enables the real-time, ultra-high-frequency monitoring of lake thermal dynamics, enhancing the detection of rapid temperature fluctuations and extreme events.
  • This study provides a practical early warning and management tool to mitigate harmful algal blooms and safeguard drinking water security under climate change.

Abstract

The lake surface water temperature (LSWT) is one of the key indicators for monitoring and predicting changes in lake ecosystems, as it regulates numerous physical and biogeochemical processes. However, current LSWT measurements mainly rely on infrared thermometry and traditional in situ sensors, and lack effective short-term LSWT forecasting and early warning capabilities. To overcome these limitations, we established a high-frequency, real-time, and accurate monitoring and forecasting method for the LSWT based on a novel hyperspectral proximal sensing system (HPSs). An LSWT inversion method was constructed based on a deep neural network (DNN) algorithm with a satisfactory accuracy of R2 = 0.99, RMSE = 0.92 °C, MAE = 0.64 °C. An analysis of data collected from October 2021 to December 2023 revealed distinct seasonal fluctuations in the LSWT in the northern region of Lake Taihu, with the LSWT ranging from 2.61 °C to 38.52 °C. The hourly LSWT for the next three days was forecasted based on a long short-term memory (LSTM) model, with the accuracy having an R2 = 0.99, an RMSE = 1.01 °C, and an MAE = 0.87 °C. This study complements lake water quality monitoring and early warning systems and supports a deeper understanding of dynamic processes within lake physical systems.

1. Introduction

The lake surface water temperature (LSWT), denoting the water temperature of the uppermost layer (0–1 m) of a lake [1,2], stands as a vital metric for assessing climate changes, water quality, and the ecosystem health of lakes. It plays a vital role in the biogeochemical cycle of biogenic elements, energy exchanges, and information transfer [3,4,5]. The LSWT directly influences key physical processes—including water-vapor exchange, thermal dynamics, and energy fluxes [6,7]—and it indirectly regulates critical ecological processes such as nutrient cycling, community structure, and ecosystem functioning [8,9,10]. It significantly modulates the water-vapor interface by altering evaporation rates, heat and gas exchanges, the water density stratification, and local wind patterns [6,11]. Lake warming reduces dissolved oxygen (DO) concentrations in surface waters and enhances thermal stratification, particularly in deep lakes [12,13]. Additionally, an elevated temperature accelerates the transformation of dissolved organic carbon (DOC) accompanied by oxygen consumption, which exacerbates anoxic conditions at the bottom of lakes and affects the survival of benthic organisms [14,15]. Notably, an increased LSWT also exacerbates eutrophication effects by stimulating algal growth and promoting harmful algal blooms through strengthened thermal stratification, reduced vertical mixing, and enhanced reproductive conditions [16,17,18]. Hence, the accurate monitoring and forecasting of the LSWT and its temporal dynamics are of great significance for understanding lake biogeochemical processes, mitigating harmful algal blooms, and reducing risks to lake ecosystem health.
Traditionally, manual field measurements provide accurate LSWT data, but are limited by their labor-intensive nature, time consumption, spatiotemporal discontinuity, and high costs over the long term [19,20,21]. Satellite remote sensing, with the characteristics of being rapid, large-scale, periodic, and cost-effective, has emerged as a valuable tool for LSWT estimation in inland waters. Currently, satellites used for quantitative estimations of the LSWT can be divided into two main categories: thermal infrared and microwave remote sensing. MODIS and the Landsat series have become the primary data sources for estimating the LSWT using thermal infrared bands. While they provide accurate data across diverse spatiotemporal scales, these methods remain susceptible to atmospheric interference, including heavy cloud cover and aerosol contamination, which often result in data gaps. Additionally, uncertainties in atmospheric correction can further compromise the measurement accuracy [22,23]. Moreover, microwave remote sensing offers all-weather capabilities, but is hindered by difficulties in retrieving accurate water temperature data due to surface roughness from waves [24,25]. The hyperspectral proximal sensing system (HPSs) enables continuous daytime monitoring at 20 s intervals, and it has been widely used to measure water quality parameters, including chlorophyll-a (Chl-a), transparency, and suspended matter [26,27]. However, HPSs applications for LSWT monitoring remain unexplored. To address this gap, we developed an HPSs-based approach for high-frequency LSWT monitoring.
Various approaches have been developed for the inversion of the LSWT, including numerical simulation models, empirical statistical methods, and machine learning algorithms. For example, Hulley et al. [28] used an optimized split-window method to perform an LSWT inversion on 169 inland water bodies worldwide. The results showed that, compared with MODIS products, the IWbST root mean squared error (RMSE) for the Salton Sea was reduced by 0.4 K, and compared with the results obtained using AATSR windowing coefficients, the IWbST RMSE for Tahoe was reduced by 0.36 K. Huang et al. [29] used the FLake model to estimate the LSWT for 96 Chinese great lakes, and the results showed that the RMSE of the LSWT estimation decreased from 3.64 ± 1.54 °C to 1.97 ± 0.72 °C. Yu et al. [30] utilized MODIS imagery and developed a hybrid prediction model (ε-SVR-AHP-BPANN) to estimate and simulate the LSWT of 11 lakes on the Yunnan–Guizhou Plateau from January 2018 to December 2019. The results demonstrated a strong predictive performance, with a low error and a high generalization ability (coefficient of determination, R2: 0.77 for daytime and 0.90 for nighttime; RMSE: 0.11 °C for daytime and 0.10 °C for nighttime). Compared to conventional methods, machine learning algorithms offer distinct advantages for LSWT inversions: (1) the ability to capture complex nonlinear relationships between the spectral reflectance and the LSWT; (2) an enhanced robustness in handling noisy or incomplete data; and (3) improved generalization across diverse aquatic environments [31].
Moreover, reliable forecasts of the LSWT are essential for risk assessments, prevention, and the protection of lake ecosystem health. Current forecasts of the LSWT focus more on long-term changes to quantify and characterize the long-term impacts of climate change and natural disasters [32], while short-term forecasts for early warnings of extreme LSWT events have received comparatively little attention. The high-frequency continuous monitoring capability of the HPSs offers strong potential to address this gap in short-term LSWT forecasting. LSWT forecasts have employed various approaches in recent years, including statistical methods, physically based models, and machine learning techniques. Traditional statistical models like the autoregressive integrated moving average (ARIMA) are effective for linear temporal patterns, but often struggle with nonlinear dynamics [33]. Physically based models, such as the estuary and lake computer model (ELCOM) [34], simulate the LSWT using hydrodynamic principles, but require extensive parameterization and computational resources, limiting real-time applications. In contrast, machine learning models offer a powerful alternative by learning complex patterns directly from data. For example, the long short-term memory (LSTM) network has proven to be an effective forecasting tool with a high accuracy [35], especially due to its ability to bridge long time lags, a critical feature for seasonal data [36]. LSTM is superior to the ARIMA in modeling nonlinear temporal relationships and integrating multivariate inputs without manual feature engineering, while remaining robust to noisy or incomplete data. Additionally, compared to physics-based models like the ELCOM, LSTM avoids complex assumptions and parameterization, making it ideal for data-rich environments with intricate or poorly understood mechanisms. Once trained, LSTM enables efficient real-time forecasting, unlike computationally intensive physical models. These advantages make LSTM particularly well suited for forecasting short-term LSWT variations, especially in scenarios where data are abundant, but the underlying processes remain complex. Compared to other machine learning methods such as support vector regression (SVM) and random forest (RF), LSTM is specifically designed to handle sequential and time-dependent data, giving it a distinct advantage in modeling temporal dependencies [36].
The aim of this work was to develop a high-precision inversion model and a short-term forecasting method for the LSWT in inland waters based on the HPSs and in situ LSWT data. The objectives of this study were to (1) establish and validate a high-precision LSWT inversion model based on a large dataset of HPSs data and coincident in situ LSWT data using machine learning and deep learning methods; (2) analyze the temporal dynamics of the LSWT in the northern part of Lake Taihu during 2021–2023; (3) establish and validate a forecasting model for short-term forecasts of the LSWT based on different time series of the LSWT; and (4) evaluate the advantages of establishing LSWT high-frequency monitoring and the necessity of short-term LSWT forecasting for lake management.

2. Materials and Methods

2.1. Study Area

Lake Taihu, situated in the southeastern region of the Yangtze River Delta (30°55′40″–31°32′58″N, 119°52′32″–120°36′10″E), is the third largest freshwater lake, with an area of 2338 km2 and a mean depth of 1.9 m (Figure 1a) [37,38]. As an important freshwater source, it supplies drinking water for over 30 million people and plays a vital role in supporting local tourism, agriculture, and fisheries [39,40]. However, over the past 40 years, the LSWT in Lake Taihu has increased rapidly by an annual mean of 0.37 °C per decade, increasing the occurrences and frequency of heatwaves [41,42], which cause profound negative impacts on the lake’s ecology, such as educed DO and a reduced biodiversity [43]. Additionally, the climate-warming-induced LSWT increases and human activities have been attributed as the main reasons for Lake Taihu’s eutrophication and harmful algae blooms since the 1980s [44,45]. Hence, the accurate and frequent monitoring and forecasting of LSWT changes play an important role in preventing harmful algal blooms, ensuring drinking water safety and lake management.

2.2. In Situ Water Quality Measurement

In situ water quality data, including the LSWT, DO, turbidity, and pH, were collected at the Taihu Laboratory for Lake Ecosystem Research (TLLER), which is located in Meiliang Bay in the northern region of Lake Taihu (Figure 1a). Specifically, all the in situ data were measured at the surface of the lake (0–0.2 m below the water surface) using YSI 6600 V2. The measurements were at an interval of 30 min from 21 October 2021 to 13 September 2023 from 8:00 to 17:00.

2.3. HPS Reflectance Measurements

The HPSs was jointly developed by the Nanjing Institute of Geography and Limnology and the Nanjing Zhongke Deep Insight Technology Research Institute Co., Ltd. The HPSs consists of a hyperspectral imager that is 4 m higher than the water surface and a video camera for 24 h water quality monitoring daily (Figure 1b). The real-time reflectance of 400–1000 nm (with a spectral resolution of 1 nm) was collected at a high frequency of 20 s from 8:00 to 17:00 daily. However, only the hyperspectral reflectance data of 420–820 nm was selected as the effective band due to low relative errors of 3%. The hyperspectral data between 420 and 820 nm were utilized at their full spectral resolution of 1 nm, resulting in 401 contiguous bands for analysis. Each band had a nominal bandwidth of 1 nm. To minimize the influence of the skylight and solar angle, four strategies were adopted, including an observation angle of 53°, polarizer filters, and a convolutional neural network-based correction algorithm, as well as normalization. The 232 HPSs spectra showed a high linear agreement with the synchronized reference spectra collected using a FieldSpec 4 Hi-Res ASD (ASD LLC, Longmont, CO, USA) under complex weather (including clear, cloudy, and overcast conditions) with a slope and R2 of 0.98 and 0.997, respectively, which demonstrated the accuracy and stability of the HPSs spectra. In this study, HPSs spectral data were collected from the optical deep-water zone located 240 m from the shore, where the water depth was approximately 1.75 m. The spectral processing of the HPSs data is shown in Supplementary Material S1.

2.4. Matchup of the Data and LSWT Inversion Modeling

The matching criteria for the HPSs spectral data and the in situ LSWT measurements were set to a time window of ≤1 min. In the end, a total of 11,774 sets of measured LSWT data were matched with the spectral data.
For the modeling of the LSWT inversion, this study employed three algorithms: extreme gradient boosting (XGBoost), a deep neural network (DNN), and k-nearest neighbors (KNN). Prior to model training, the dataset was normalized using the StandardScaler module from the Python (version 3.12.4) scikit-learn library and subsequently partitioned into subsets. The 11,774 sets were divided into 3 sets: a training set, a testing set, and a validation set. Specifically, 10% of the total dataset was selected as an independent validation set, while the remaining 90% was further split into the training set and testing set in a 3:1 ratio (Table 1). For modeling, hyperspectral proximal sensing (HPS) reflectance data were used as the inputs and the LSWT data were used as the outputs.
XGBoost, a scalable machine learning algorithm based on gradient boosting, utilizes decision trees as base learners to iteratively minimize a specified loss function [46,47]. In this study, the XGBoost algorithm was implemented using the Python (version 3.12.4) xgboost package (https://xgboost.readthedocs.io/, accessed on 28 July 2025). Hyperparameter optimization was conducted using the GridSearchCV method, yielding the following configuration: n_estimators = 150, max_depth = 16, learning_rate = 0.06, gamma = 1, and subsample = 0.8. These hyperparameters were selected to achieve an optimal trade-off between the model complexity and the predictive accuracy, ensuring both robustness and precision.
A DNN is an artificial neural network designed to capture complex, nonlinear relationships through multiple layers of interconnected nodes [48]. In this study, the DNN was implemented using the Python (version 3.12.4) tensorflow and keras libraries. Hyperparameter optimization was conducted using the GridSearchCV method. The architecture comprised three hidden layers, each employing the rectified linear unit (ReLU) activation function to facilitate faster convergence and efficient gradient propagation. The output layer utilized a linear activation function to enable precise predictions of continuous target variables. Model optimization was guided by the mean absolute error (MAE) [49] as the loss function, which quantifies the average magnitude of the prediction errors, ensuring interpretability and robustness. Training was performed using the Adam optimizer. The learning rate was initially set to 0.001 for the early stages of training to encourage convergence and was subsequently reduced to 0.00001 during the fine-tuning phase to enhance the stability and performance. This configuration was designed to maximize the predictive accuracy while ensuring computational efficiency.
The KNN algorithm is an effective machine learning method that classifies or predicts values based on the proximity of data points in the feature space [50]. In this study, the KNN model was implemented using the Python (version 3.12.4) scikit-learn library. Hyperparameter optimization was conducted using the GridSearchCV method. The model was configured with the following parameters: n_neighbors = 2, weights = ‘uniform’, p = 2, and metric = ‘minkowski’, corresponding to the Euclidean distance metric when p = 2. This configuration was chosen to ensure that the predictions were determined by the two nearest neighbors with equal influence, providing a straightforward, yet robust, approach to regression tasks.

2.5. LSWT Forecast Modeling

The hourly LSWT data used for forecast modeling were derived from high-frequency retrievals of the HPSs, which were aggregated into hourly averages. Due to HPSs equipment commissioning and power failures, missing data occurred on some days in March, April, and November of 2022, as well as January, February, July, October, November, and December of 2023. To address this issue, the hourly average LSWT data were subsequently smoothed using the Savitzky–Golay filter and then reconstructed by linear interpolation to fill in the missing values. The Savitzky–Golay filter was selected for data smoothing due to its recognized efficacy in preserving critical temporal trends and reducing high-frequency noise in environmental time series data [51], while linear interpolation was chosen for gap-filling owing to its computational efficiency and reliable performance in reconstructing missing values under the assumption of short-term linear variation in the LSWT [52]. The LSWT tends to fluctuate with seasonal changes, while the day of the year (DOY) can show seasonal fluctuations in the form of data [53]. Consequently, the DOY was used as an input along with the hourly LSWT for the forecasting model construction [3]. The data processed as above were then standardized and divided into training and test sets in the ratio of 7:3.
The LSTM model was implemented using the Python (version 3.12.4) Keras library. The architecture of the model was manually adjusted and consisted of an LSTM layer with 128 cells that was set up to return sequences to capture temporal dependencies, followed closely by a 20% dropout layer to mitigate the risk of overfitting. The model then contained an LSTM layer with one output unit, which was responsible for generating the final regression prediction. Finally, the predictions were output through a fully connected (dense) layer with a single neuron. The model was trained using the mean squared error as a loss function to evaluate the prediction performance. To determine the optimal learning rate, we conducted a systematic hyperparameter tuning process. Specifically, for each forecasting horizon (1, 2, and 3 days ahead), we evaluated three candidate learning rates (0.1, 0.01, and 0.001) through controlled experiments on a subset of the training data, selecting the value that yielded the lowest mean squared error. Finally, the model was first trained for 60 training cycles using an Adam optimizer with a learning rate of 0.001 for the forecasts of 1 and 2 days in the future, and 0.01 for the forecast of 3 days in the future. The model was constructed based on integer multiples of the number of forecast days. Forecasts were made for 1, 2, and 3 days ahead using hourly LSWT data from the past 1–10 days, respectively, for each forecast horizon. The data features used for model construction are shown in Table S1.

2.6. Statistical Analysis

In this research, three metrics were adopted to assess the accuracy of the models, namely the R2, MAE, and RMSE. When p ≤ 0.01, the metric was defined as statistically significant. Correlations were evaluated using Pearson’s correlation coefficient (r), which measures the linear relationship between two continuous variables. All the data analyses, including the maximum, average, minimum, and standard deviation values, were performed using IBM SPSS Statistics (version 26.0). All figures were made by ArcGIS (version 10.2) and OriginLab 2024.
R 2 = 1 i = 1 n M e a s i E s t i i 2 i = 1 n M e a s i M e a s i ¯ 2
M A E = 1 n × i = 1 n M e a s i E s t i i
R M S E = i = 1 n M e a s i E s t i i 2 n
In Equations (1)–(3), Measi represents the data measured in the laboratory, Estii represents the predicted data, and n represents the number of samples.
r = i = 1 n x i x ¯ y i y ¯ i = 1 n x i x ¯ 2 i = 1 n y i y ¯ 2
In Equation (4), xi and yi are the individual sample points, x ¯ and y ¯ are the sample means, and n is the sample size.

3. Results

3.1. Analysis of Hyperspectral Sensitivity

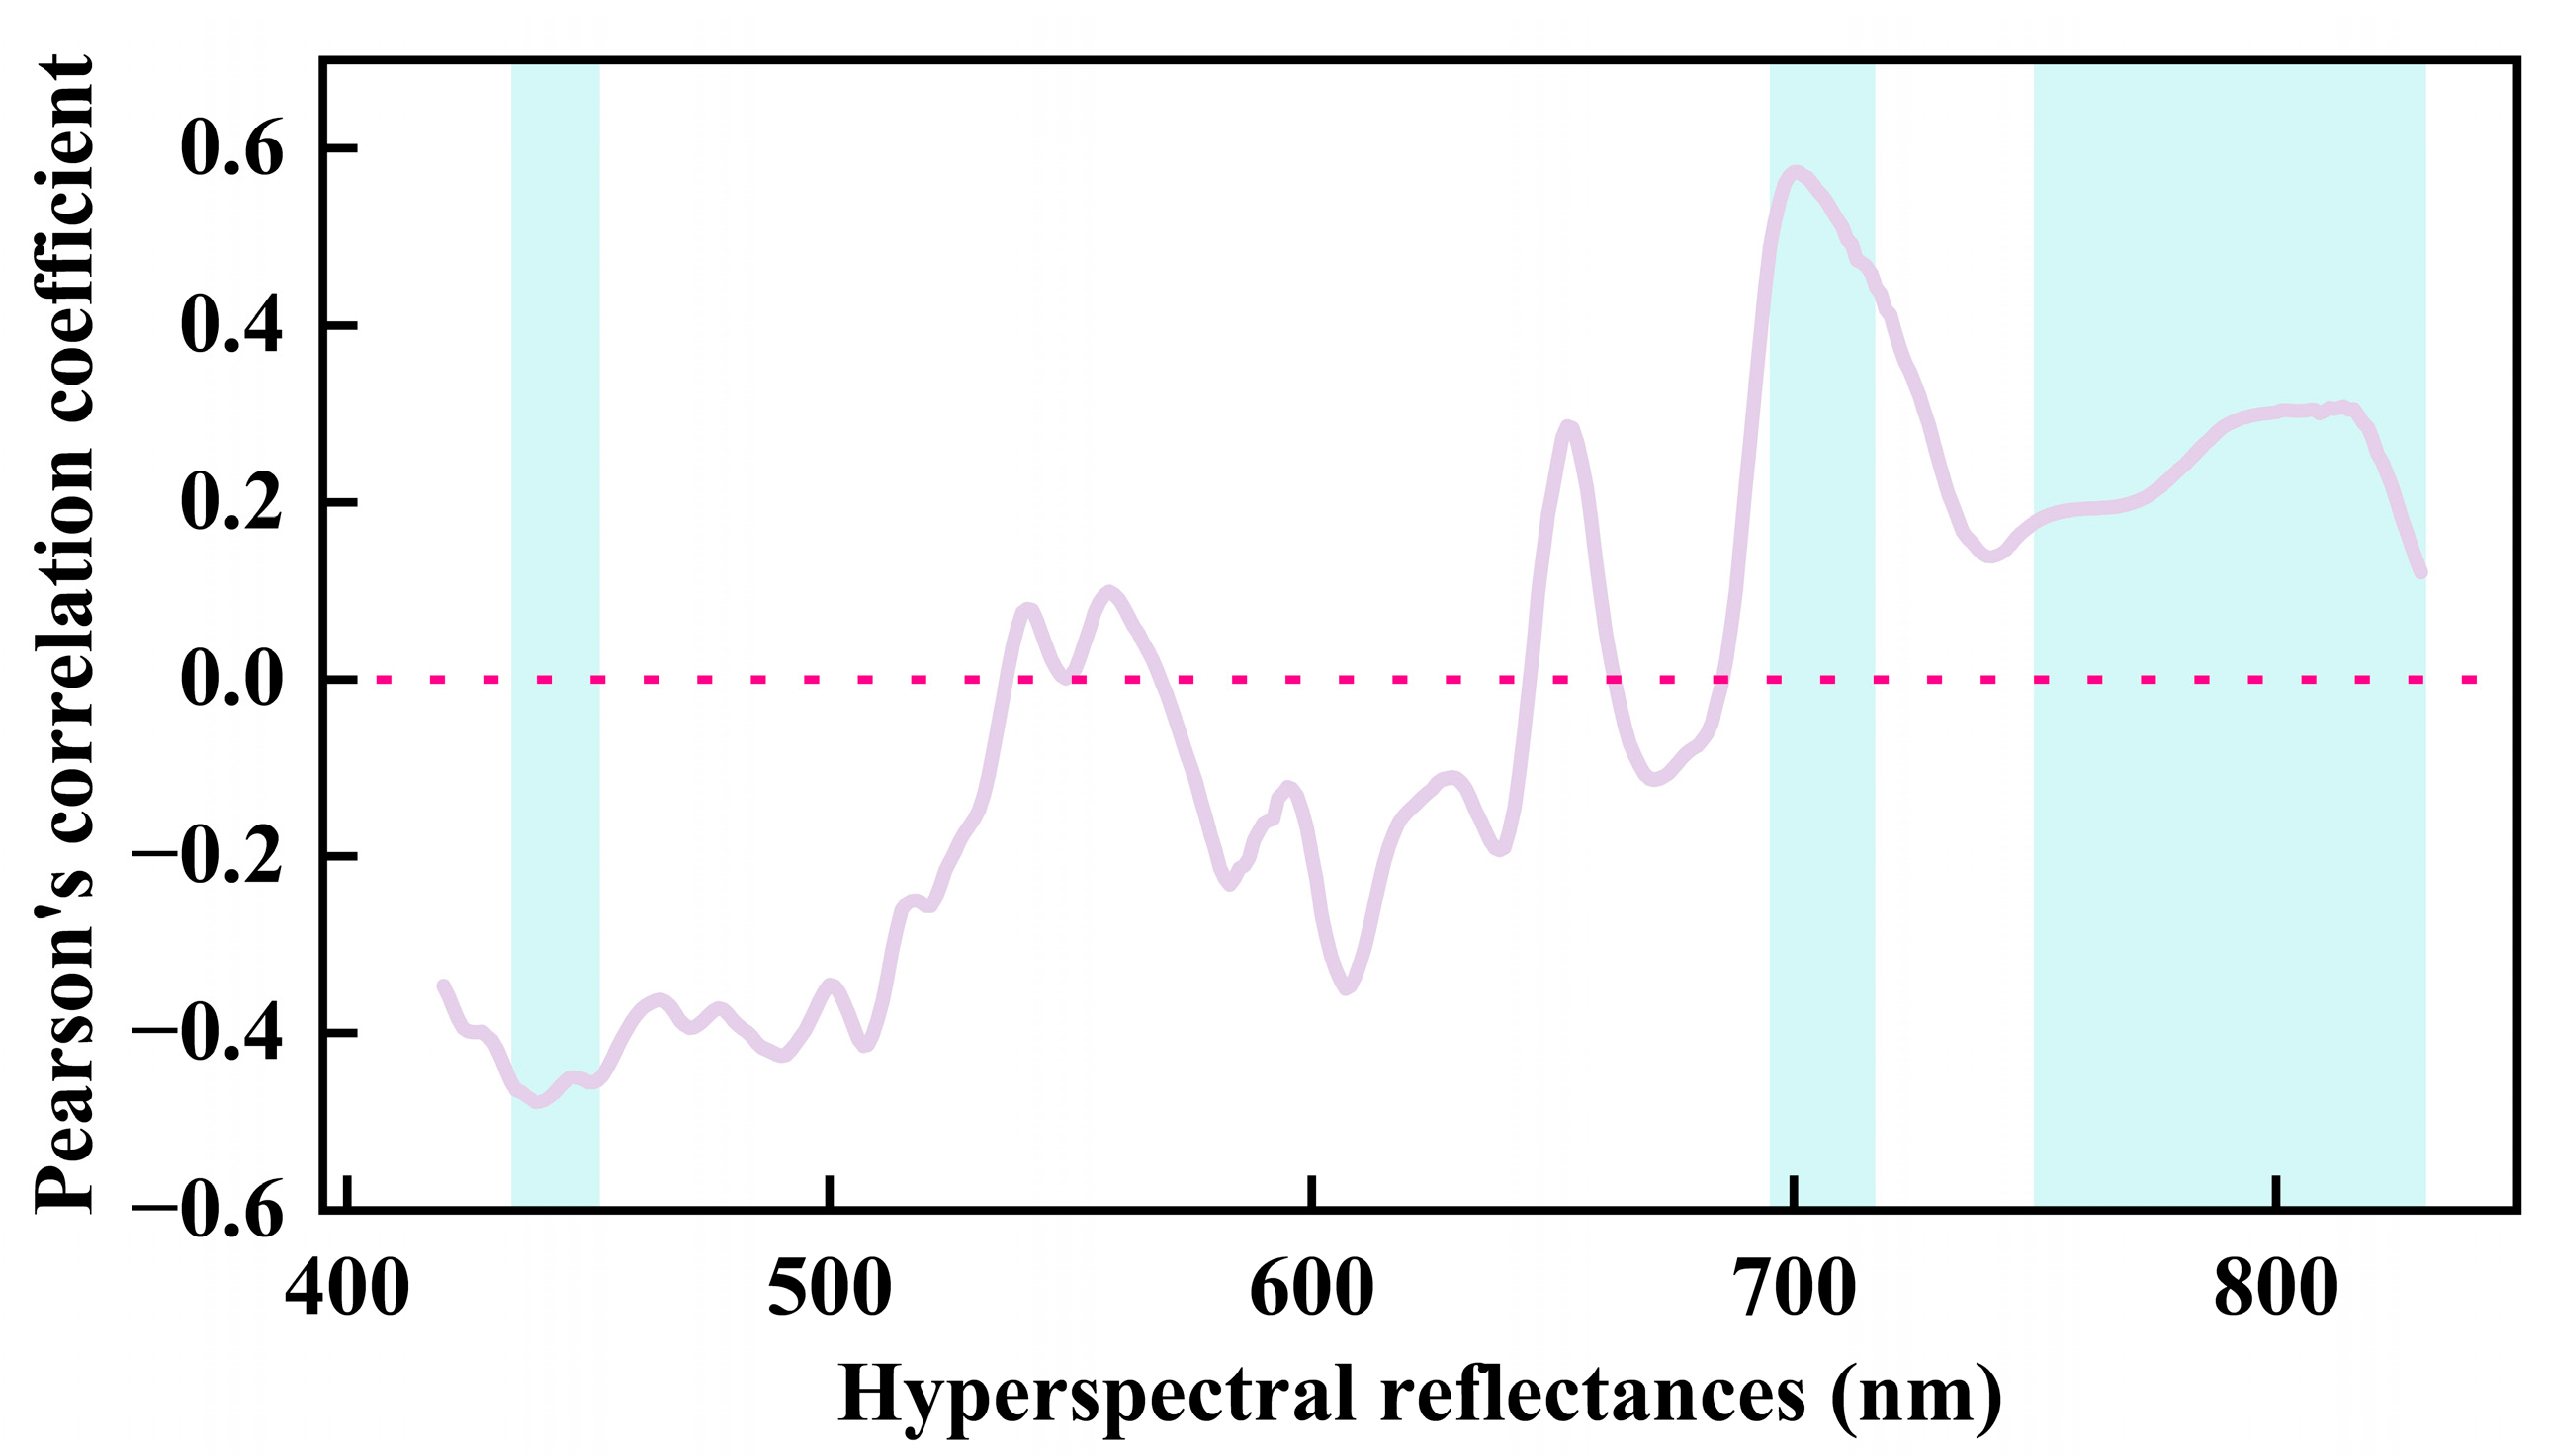
To develop a high-precision LSWT inversion model and to reduce the interference of uncorrelated features, a spectral sensitivity analysis of the HPSs was conducted for the LSWT using Pearson’s correlation coefficient (Figure 2). The results showed that the LSWT responded well to hyperspectral reflectance. Specifically, a significant negative correlation between the HPS reflectance of 434–452 nm and the LSWT was observed with a Pearson’s correlation coefficient of lower than -0.45 (p ≤ 0.01). Pearson’s correlation coefficient between the HPS reflectance of 695–716 nm and the LSWT was higher than 0.45, which was a significant positive correlation (p ≤ 0.01). The wavelength at 701 nm had the highest Pearson’s correlation coefficient with an LSWT of 0.57. Ultimately, the HPS reflectance values of 434–452 nm, 695–716 nm, and 750–830 nm (1 nm resolution) were selected as the inputs for the LSWT inversion, as these bands are sensitive to colored dissolved organic matter (CDOM) and Chl-a, which are closely related to the water temperature.

3.2. Development and Validation of LSWT Inversion Models

The accuracies of the LSWT inversion models were evaluated based on the training, testing, and validation sets (Figure 3). Based on the performance on the training set, the XGboost model outperformed the RF model and the DNN model. The XGboost model achieved the best performance, with an R2 value of 0.998, an RMSE of 0.44 °C, and an MAE of 0.32 °C, followed by the DNN model with an R2 value of 0.995, an RMSE of 0.63 °C, and an MAE of 0.41 °C. The KNN model had the lowest fitting performance, with an R2 value of 0.93, an RMSE of 2.45 °C, and an MAE of 1.45 °C.
Taking the testing set accuracy as the primary reference for evaluating the model generalization ability, the models were ranked in descending order of performance as follows: DNN, XGBoost, and KNN. Specifically, the DNN model achieved an R2 value of 0.990, an RMSE of 0.92 °C, and an MAE of 0.64 °C; the XGBoost model achieved an R2 value of 0.88, an RMSE of 3.10 °C, and an MAE of 2.04 °C; and the KNN model achieved an R2 value of 0.75, an RMSE of 4.50 °C, and an MAE of 2.92 °C. The R2 of the DNN model on the testing set was 32.0% higher than that of the KNN model, while the RMSE of the DNN model was 79.6% lower than that of the KNN model.
In addition, the validation set performance further confirmed the superiority of the DNN model. The DNN achieved an R2 value of 0.987, an RMSE of 1.05 °C, and an MAE of 0.66 °C; XGBoost achieved an R2 value of 0.87, an RMSE of 3.31 °C, and an MAE of 2.15 °C; and KNN achieved an R2 of 0.76, an RMSE of 4.52 °C, and an MAE of 2.90 °C. The DNN’s validation R2 was 13.4% higher than that of XGBoost and 29.9% higher than that of KNN. In the test and independent validation sets, the high R2 and low RMSE of the DNN model indicate a higher accuracy, stability, and robustness for the LSWT estimation. Hence, considering all factors comprehensively, the DNN model was finally chosen to invert the high-frequency LSWT.

3.3. Development of LSWT Forecasting Models

According to the theory of spatiotemporal proximity, two objects that are closer in time and space imply a higher degree of correlation. This provides a theoretical basis for using a time series of the LSWT within a certain time window to forecast the future LSWT. However, a previous study demonstrated that longer input sequences do not necessarily enhance the stability and performance of a prediction model based on an LSTM algorithm [54]. Excessively long sequences can introduce challenges such as uncertainty, gradient vanishing, or explosion, which hinder the model’s ability to effectively capture long-term dependencies and ultimately degrade the forecasting performance. Therefore, identifying an optimal input sequence length is critical. In this study, the input LSWT sequences were derived from the hourly averaged data obtained through the DNN model inversion. Overall, a total of thirty forecasting models were developed to forecast the hourly LSWT for the next one, two, and three days, utilizing data from the previous one to ten days.
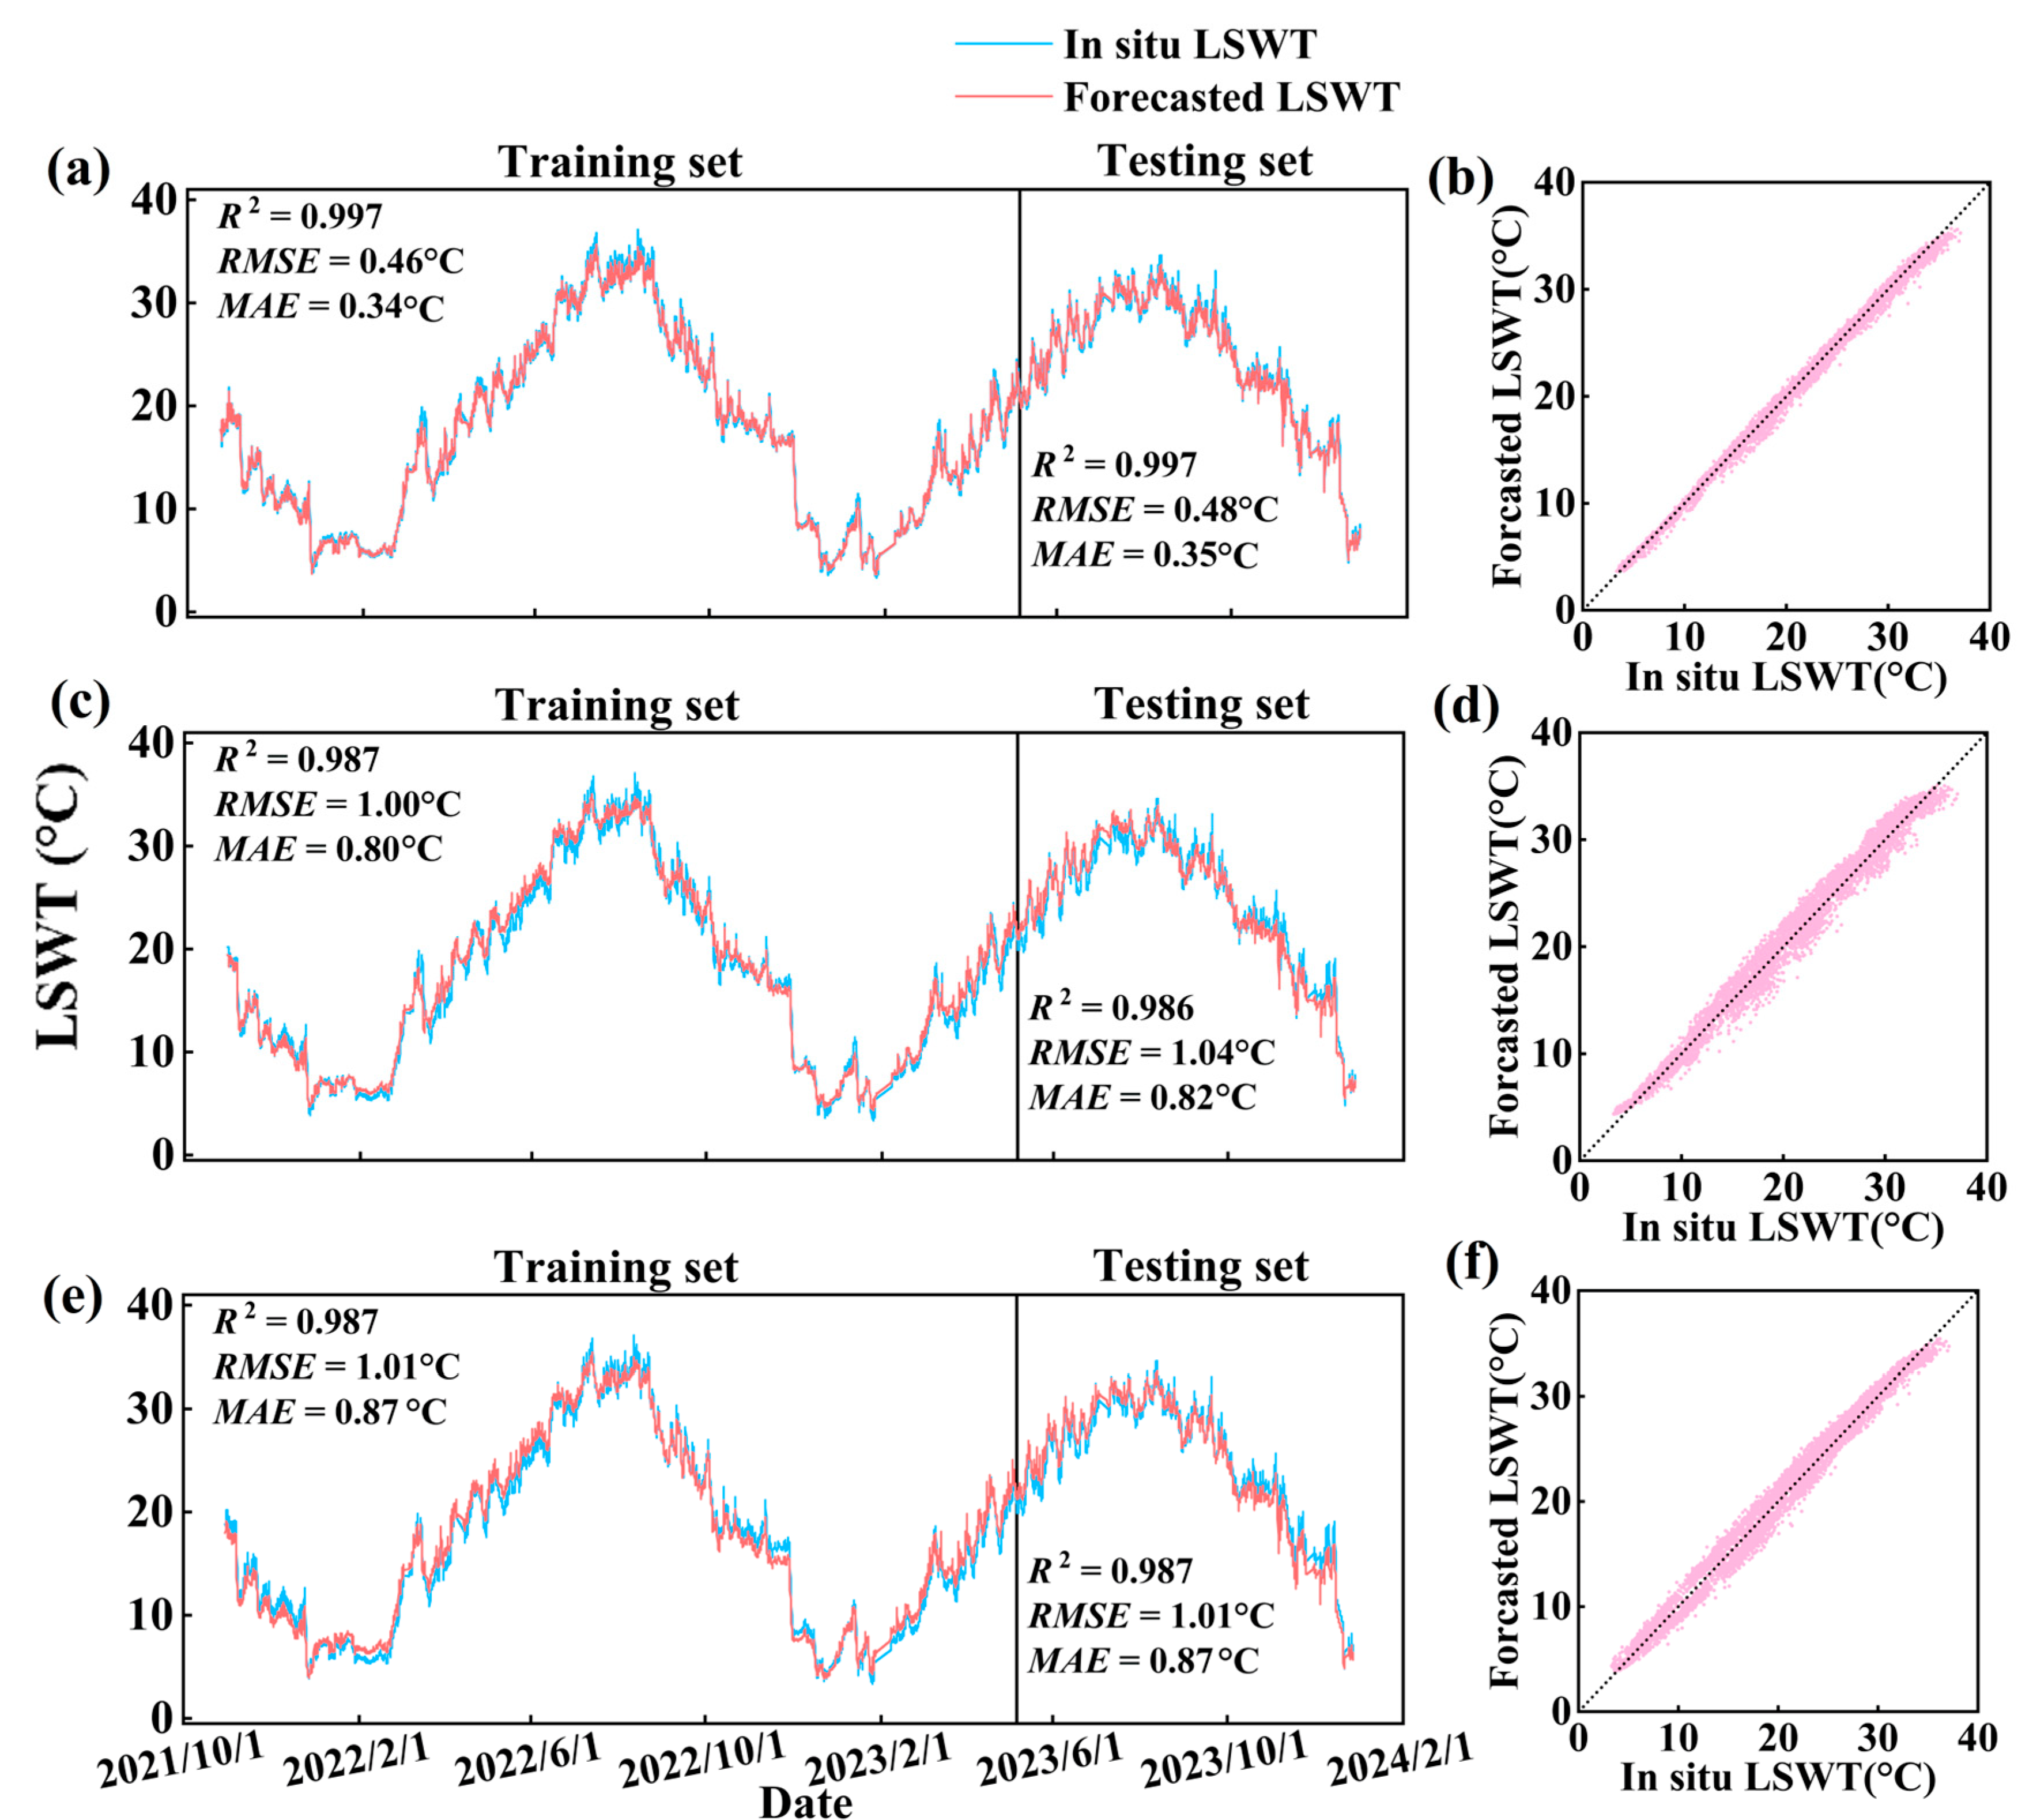
The accuracy of the forecasting models for different future time horizons was compared (Table 2). Overall, the differences in the accuracies across the various input–output scenarios were relatively minor. Specifically, the highest accuracy was achieved by using the LSWT over the previous three days as the input to forecast the LSWT over the next one day, with a training set R2 value of 0.997, RMSE of 0.46 °C, and MAE of 0.34 °C and a testing set R2 value of 0.997, RMSE of 0.48 °C, and MAE of 0.35 °C. The lowest performance was achieved by using the LSWT of the previous eight days as the input to forecast the LSWT over the next three days, with a training set R2 value of 0.973, RMSE of 1.45 °C, and MAE of 1.16 °C and a testing set R2 value of 0.973, RMSE of 1.45 °C, and MAE of 1.17 °C. Notably, the testing set revealed a narrow performance gap between best and worst models, with differences of 0.024 in R2, 0.97 °C in the RMSE, and 0.82 °C in the MAE.
Specifically, for one-day-ahead LSWT forecasting, the highest performance was achieved using data from the previous three days as the input. The model exhibited a high degree of goodness-of-fit in the training set R2 value of 0.997, RMSE of 0.46 °C, and MAE of 0.34 °C, and in the testing set R2 value of 0.997, RMSE of 0.48 °C, and MAE of 0.35 °C (Figure 4a). In contrast, the poorest performance of the one-day-ahead LSWT forecasting model using data from the previous four days as the input was observed with an R2 value of 0.993, an RMSE of 0.72 °C, and an MAE of 0.58 °C for the training set and an R2 value of 0.993, an RMSE of 0.73 °C, and an MAE of 0.58 °C for the testing set.
For two-day-ahead LSWT forecasting, the optimal model was constructed using data from the previous nine days as the input. This configuration achieved a training set R2 value of 0.987, RMSE of 1.00 °C, and MAE of 0.80 °C, and a testing set R2 value of 0.986, RMSE of 1.04 °C, and MAE of 0.82 °C (Figure 4c). A comparable level of forecast performance was obtained using data from two days as the input, which achieved a testing set R2 value of 0.985, RMSE of 1.07 °C, and MAE of 0.80 °C. The lowest forecast accuracy in this scenario occurred with data over the previous four days as the input, with a training set R2 value of 0.982, RMSE of 1.18 °C, and MAE of 0.89 °C, and a testing set R2 value of 0.982, RMSE of 1.19 °C, and MAE of 0.90 °C.
For three-day-ahead LSWT forecasting, the model performance demonstrated an increased variability and a heightened sensitivity to the length of the input data. The best results were obtained when using data from the previous seven days as the input, achieving a consistent accuracy across both the training and testing sets (training set: R2 value of 0.987, RMSE of 1.01 °C, and MAE of 0.87 °C; testing set: R2 value of 0.987, RMSE of 1.01 °C, and MAE of 0.87 °C) and indicating a robust generalizability (Figure 4e). In contrast, models trained with the input sequences over 2, 4, 5, 8, or 9 days achieved a reduced forecast accuracy, with the training set R2 values falling below 0.985 and the RMSE increasing up to 1.45 °C (e.g., 5-day input: R2 = 0.973, RMSE = 1.44 °C, and MAE = 1.14 °C), while the corresponding testing set R2 values dropped below 0.98 and the RMSE values rose up to 1.45 °C. These findings demonstrate the feasibility of short-term LSWT forecasting, with promising implications for operational lake management and early warning systems.

3.4. Temporal Variations in the LSWT in the Northern Part of Lake Taihu

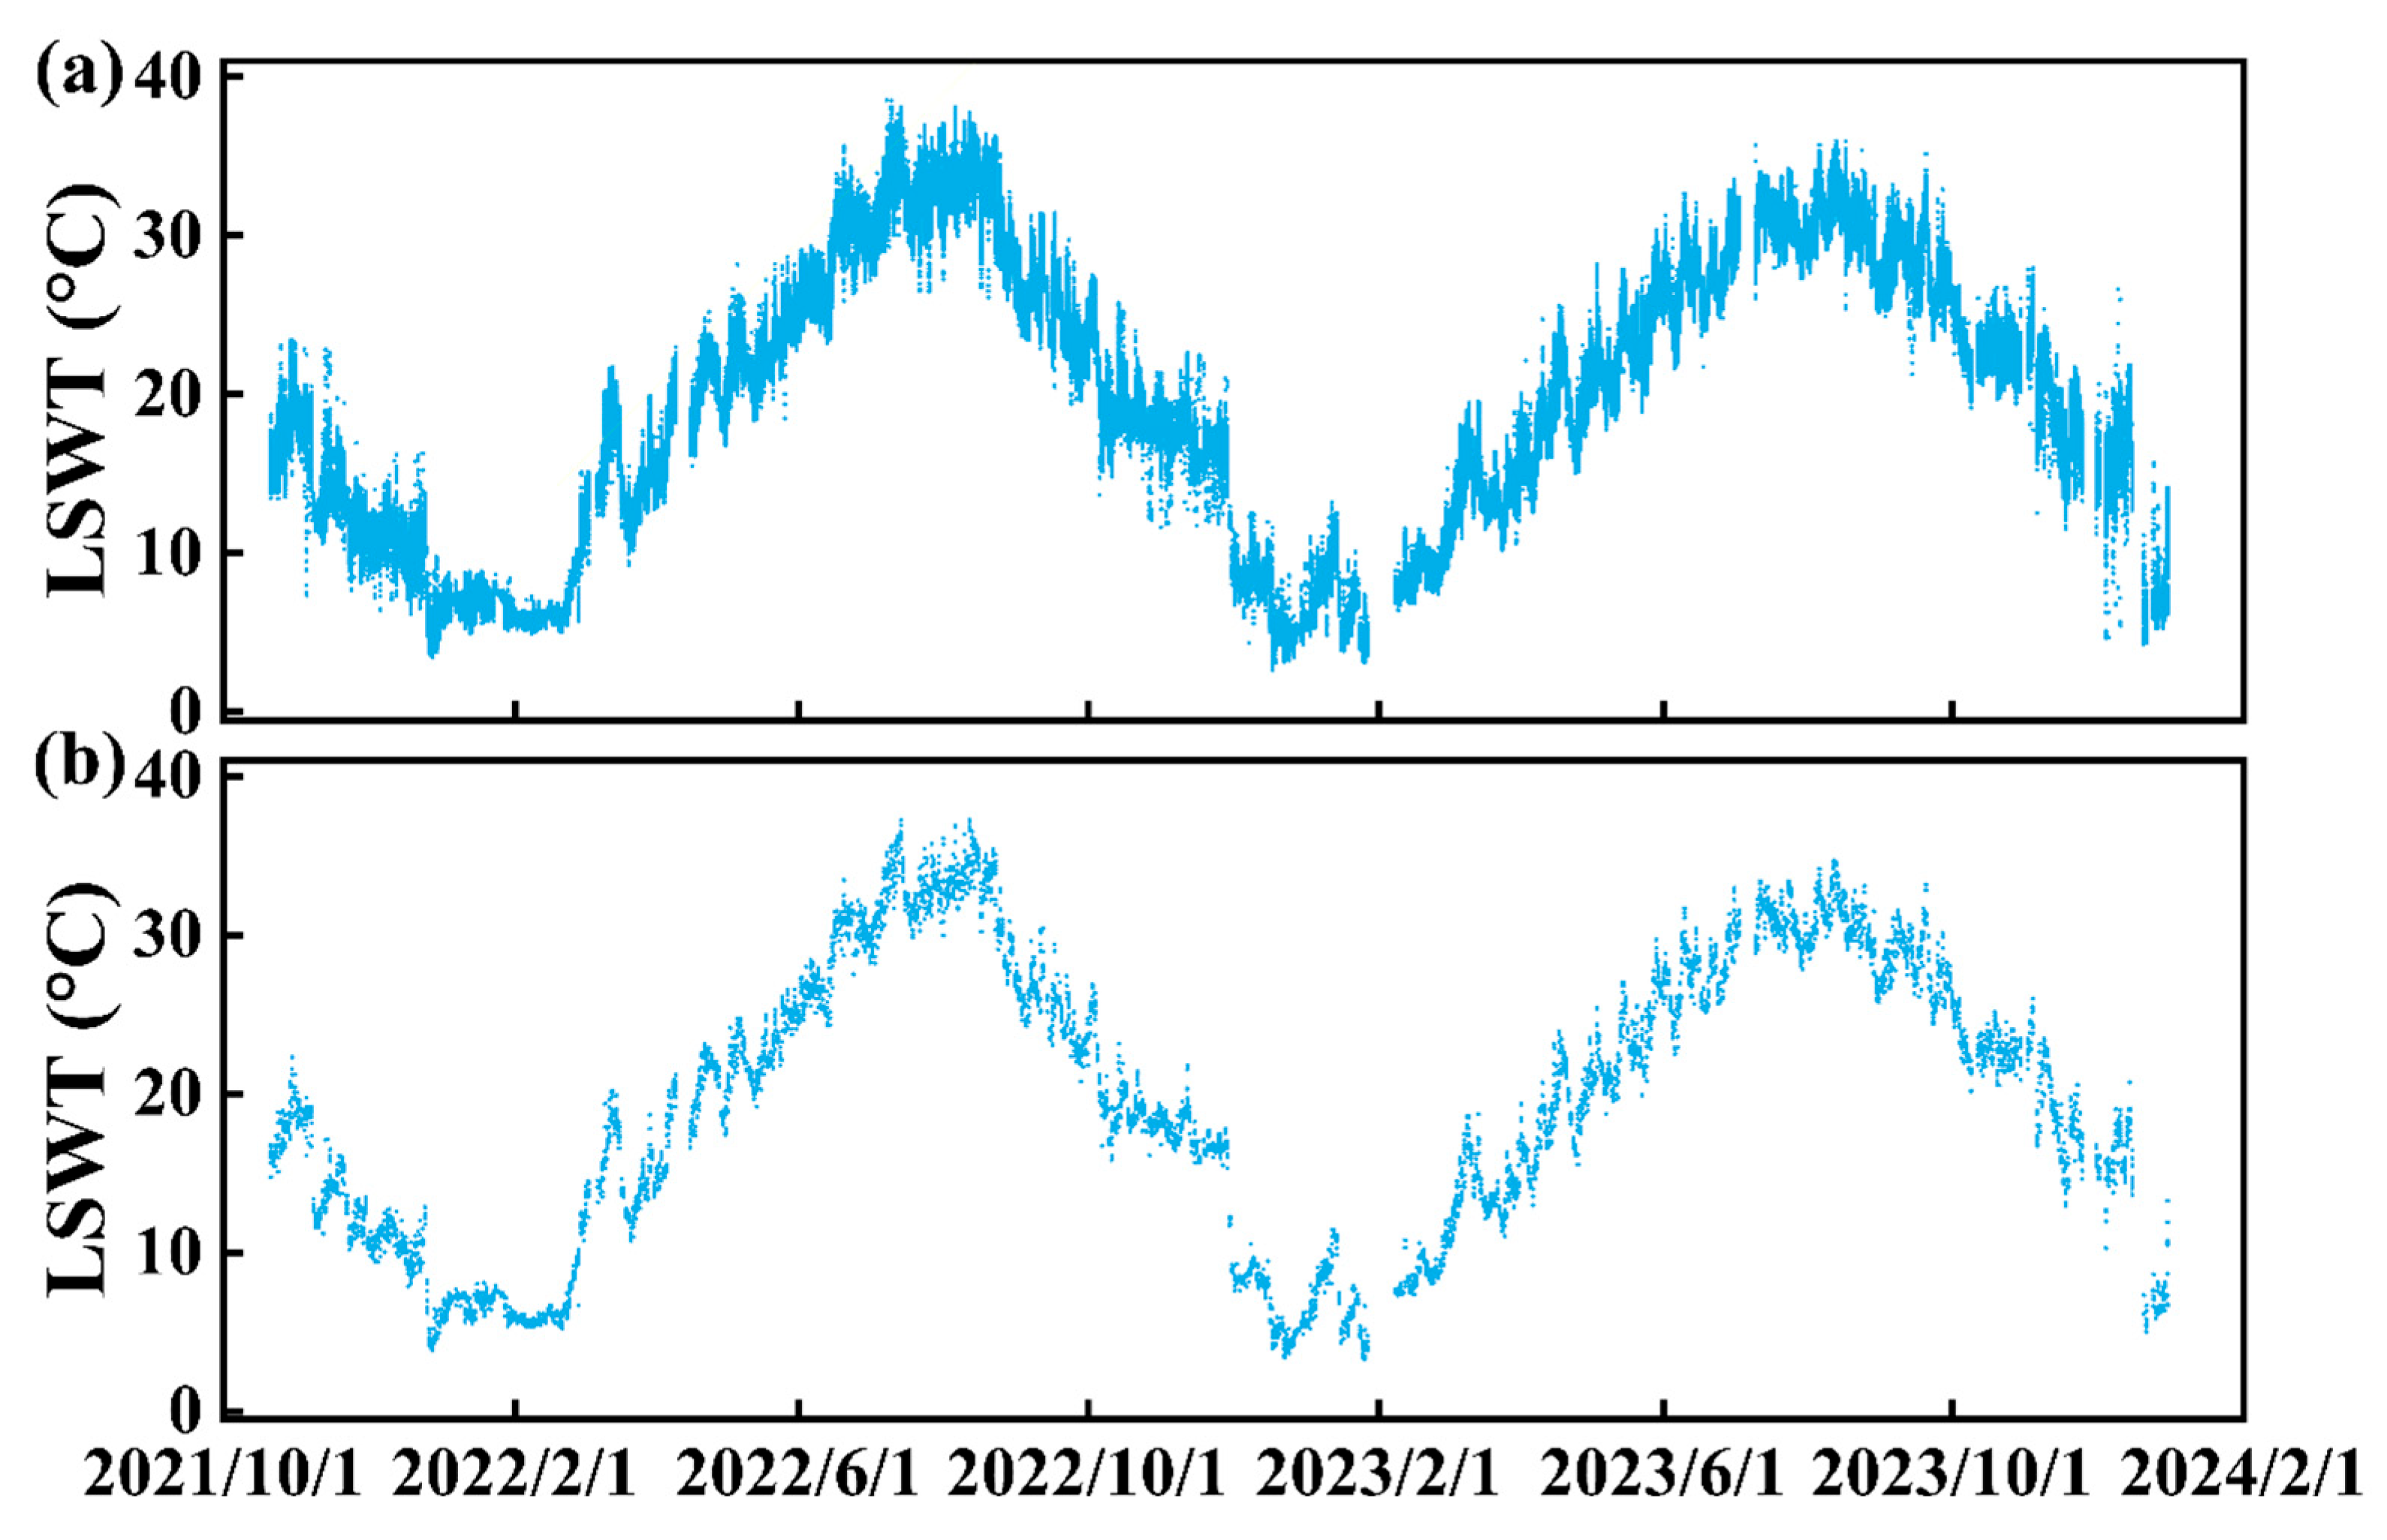
Continuous high-frequency LSWT monitoring enables the analysis of long-term temporal variability and facilitates the detection of ultra-high-frequency fluctuations in the LSWT. Using a combination of high-frequency spectral data and a DNN-based LSWT model, a time series of the LSWT was generated for the northern region of Lake Taihu from October 2021 to December 2023, covering daily observations from 8:00 to 17:00. Then, minute-averaged and hour-averaged LSWT datasets were subsequently produced by temporally aggregating the original high-frequency records (Figure 5). Generally, the LSWT in northern Lake Taihu fluctuated significantly with the seasonal periodicities (Figure S1). The seasonal averages were 18.63 ± 4.24 °C in spring, 30.40 ± 2.82 °C in summer, 20.09 ± 3.80 °C in autumn, and 8.44 ± 2.83 °C in winter. The highest summer LSWT was recorded in 2022, at 31.25 ± 3.01 °C, while the lowest winter LSWT was recorded in the same year, at 6.68 ± 1.34 °C. These results highlight significant seasonal and interannual variability in the thermal regime of the lake.
Specifically, an analysis of the minute-averaged results revealed substantial variability in the northern region of Lake Taihu’s LSWT (Figure 5a). A statistically significant increasing trend (p ≤ 0.01) was observed from 19 February to 15 August 2022 and from 13 January to 13 August 2023, whereas a distinct decreasing trend occurred between 16 August 2022 and 12 January 2023 (p ≤ 0.01). Notably, the minimum LSWT recorded was 2.61 ± 0.32 °C at 8:08 on 18 December 2022, while the maximum reached 38.52 °C at 9:19 on 8 September 2022. The maximum value exceeded the minimum by 1375.9%. For the hourly-averaged results (Figure 5b), the peak LSWT was 37.26 ± 0.39 °C at 14 on 12 August 2022, compared to the minimum of 3.26 ± 0.10 °C at 9 on 26 January 2023. The former was 34.00 °C higher than the latter.

4. Discussion

4.1. Significance of High-Frequency Monitoring and Short-Term Forecasting of LSWT in Lakes

Climate warming has led to an increase in the frequency, extent, and duration of lake heatwaves, which have dramatic and profound impacts on aquatic environments and ecosystems [42]. Against the backdrop of climate warming, the accurate monitoring and forecasting of the LSWT is fundamental to understanding lake biogeochemical processes, preventing harmful algal blooms, and investigating the response of aquatic environments to climate change.
To evaluate the monitoring accuracy, high-frequency HPSs measurements were compared with buoy-based data (30 min interval) in the northern region of Lake Taihu (2021–2023). Overall, the analysis revealed systematic observational biases. The high-temporal-resolution HPSs recorded a wider LSWT range of 2.61–38.52 °C with a mean value of 19.21 ± 9.10 °C, compared to the buoy measurements, which showed a range of 3.05–37.58 °C and mean value of 16.50 ± 9.36 °C. This represents a 16.4% underestimation of the mean LSWT by the buoy system.
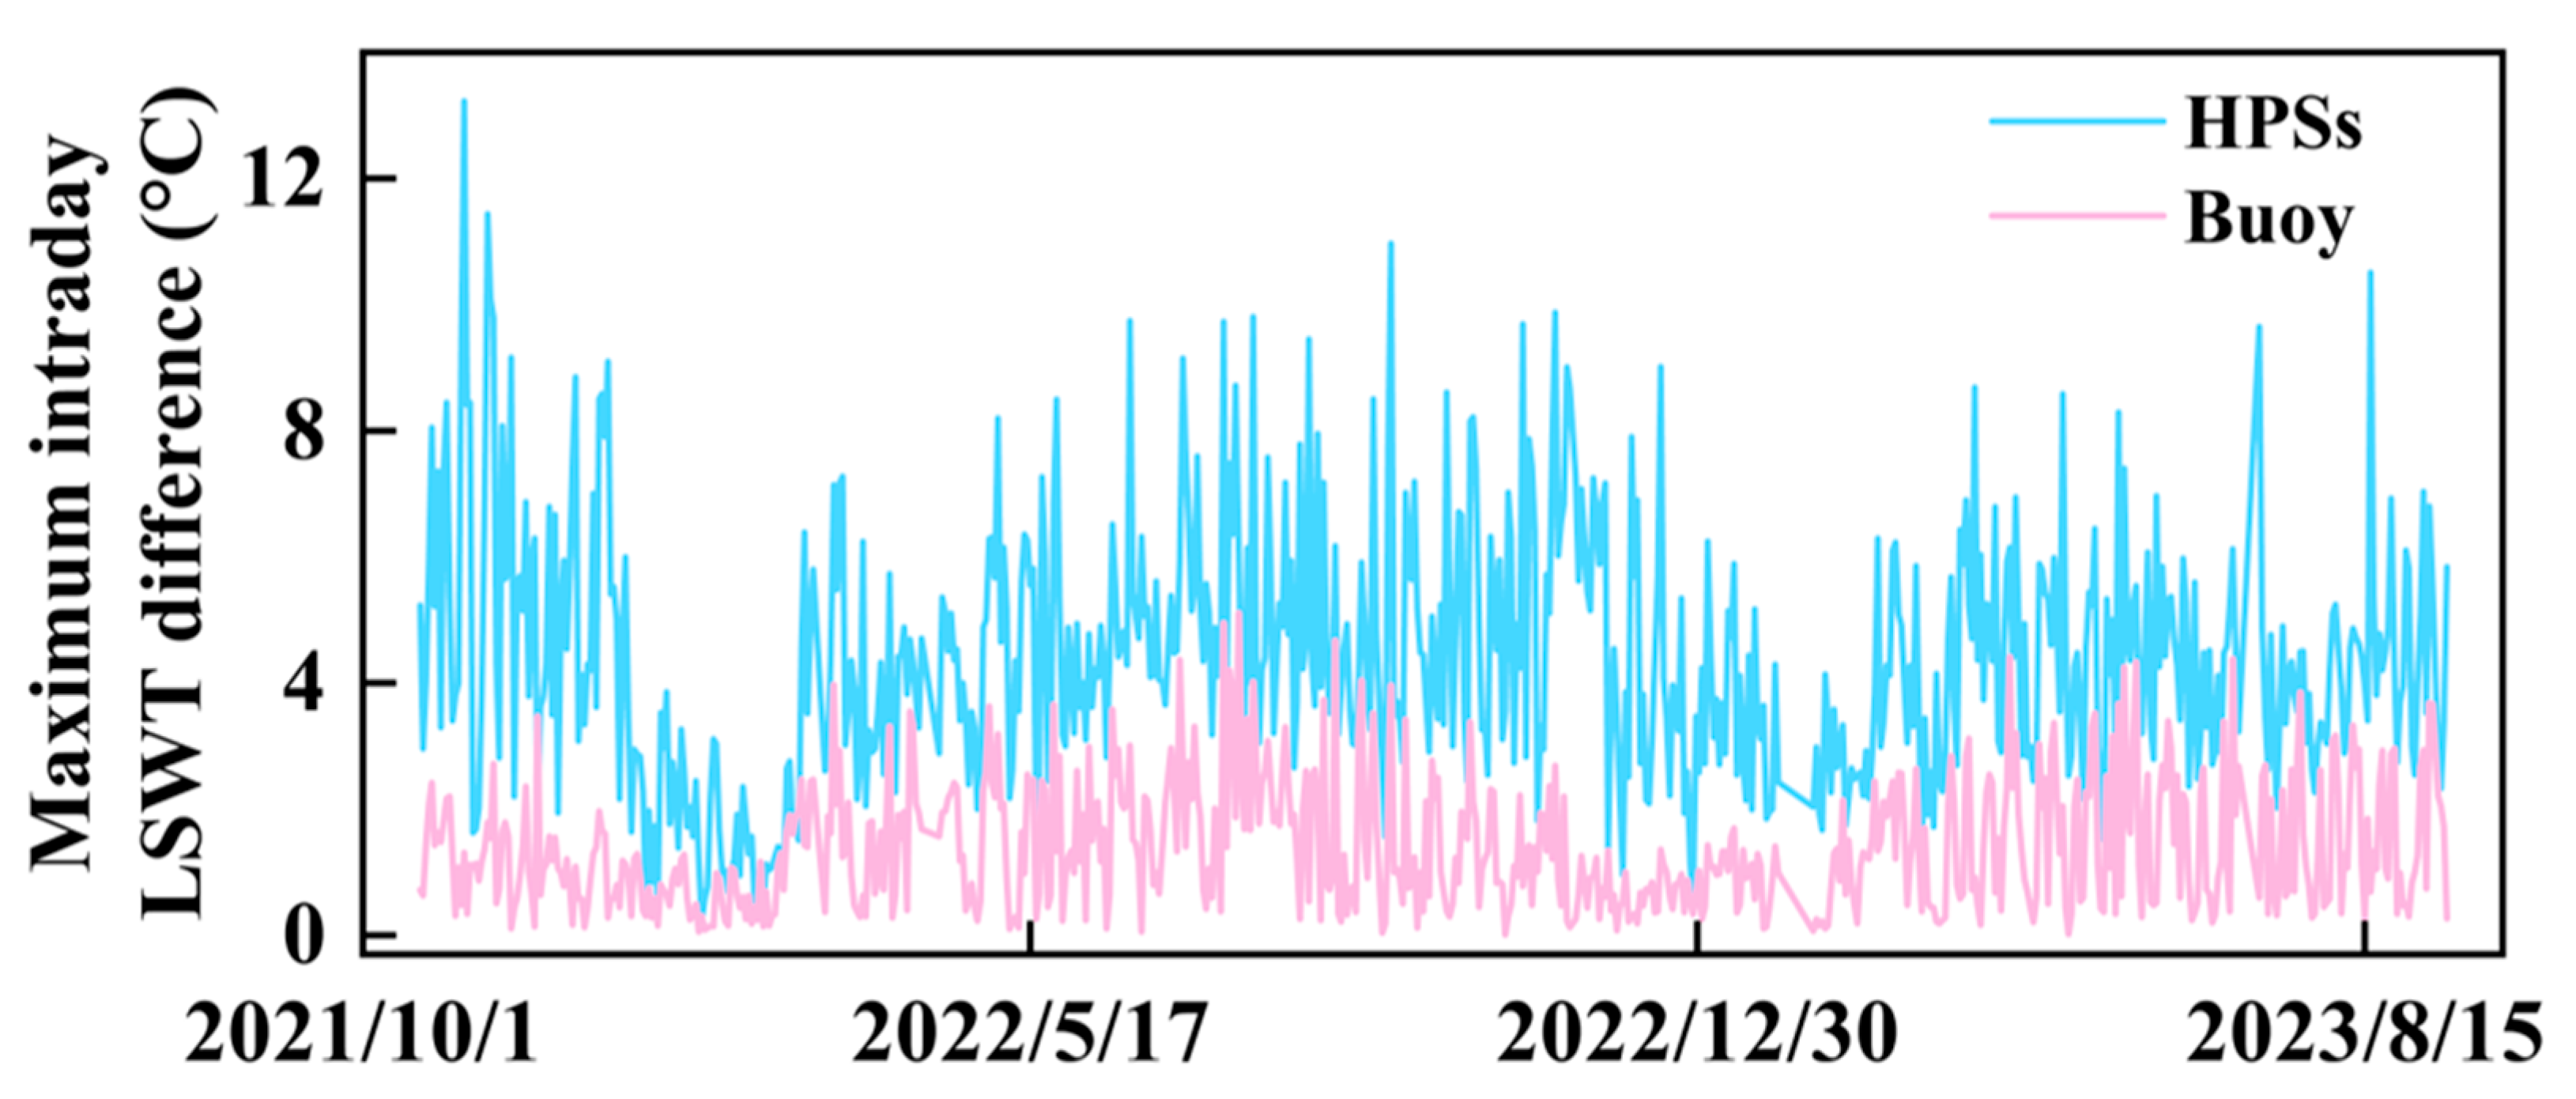
Furthermore, the LSWT can vary considerably throughout the day due to differences in meteorological conditions such as the wind speed and the light intensity/angle [55]. The intraday maximum LSWT differences calculated in two different ways from 21 October 2021 to 12 September 2023 were compared (Figure 6). The results showed that, for 658 of the 664 days counted, the intraday maximum LSWT difference calculated based on minute-by-minute LSWT data monitored by the HPSs was greater than that calculated based on half-hourly interval LSWT data monitored by buoy data. The maximum of these differences occurred on 5 November 2021, with a maximum intraday LSWT difference of 1.31 °C from the buoy monitoring and 13.23 °C from the HPSs monitoring, the latter being 11.92 °C higher than the former. The calculated maximum intraday LSWT difference for the minute-by-minute LSWT data based on the HPSs was, on average, 2.99 °C higher than that based on the buoy half-hourly data. It can be shown that monitoring the ultra-high frequency of the LSWT helps to capture and understand the intraday volatility changes and thermodynamics.
In addition, short-term LSWT forecasting serves as a critical early warning system for impending extreme temperature events in aquatic ecosystems. By capturing rapid thermal fluctuations that often precede ecological crises, this approach enables timely interventions for proactive management and the mitigation of adverse impacts. The forecasting system provides three key protective functions: (1) predicting dangerous heatwaves like the extreme value of 38.52 °C recorded in this study (Figure 5), thus allowing preemptive measures to prevent mass mortality events; (2) forecasting sudden cold shocks like the 2.61 °C event also observed (Figure 5), which can disrupt sensitive biological processes [56]; and (3) anticipating cascading ecological impacts resulting from thermal extremes, including deoxygenation and harmful algal bloom formation. This forecasting capacity is particularly valuable for safeguarding vulnerable life stages of aquatic species and preserving essential ecosystem services during episodes of thermal stress.

4.2. Strengths and Drawbacks of Models

In this study, a high-accuracy LSWT inversion model was developed using HPSs data and a DNN algorithm. Its performance can be attributed to four main factors. First, the time window for matching the in situ LSWT with spectral data was constrained to within one minute, minimizing temporal mismatch errors caused by rapid environmental variations, such as changes in the sunlight, wind, or surface conditions [57]. Second, when performing spatial scale matching, the measured probe data adjacent to the HPSs equipment was used for matching, which ensured the consistency of the points. Third, the model was trained on a dataset that encompassed diverse hydrological conditions, significantly enhancing its robustness and generalizability to lakes with comparable water quality characteristics. Specifically, the in situ data show the following: the LSWT varies from 3.05 to 37.58 °C (mean: 16.50 ± 9.36 °C), the pH varies from 7.11 to 9.38 (mean: 7.91 ± 0.31), the turbidity varies from 0.97 to 2195.00 NTU (mean: 73.73 ± 145.68 NTU), and the DO concentrations vary from 2.00 to 16.49 mg/L (mean: 9.48 ± 2.94 mg/L). Eventually, several machine learning and deep learning algorithms were compared and the most effective inversion model among them was selected. Machine learning and deep learning algorithms can make better use of large volumes of data for learning and applications compared to linear regression or empirical models, and they are highly migratory, making pre-trained deep networks well suited to the desired domain [58,59].
Although the LSWT is not an optically active parameter, it influences optically detectable components in lake water. The blue spectral region (434–452 nm) is highly sensitive to variations in the CDOM in lakes [60]. CDOM concentrations are often affected by the LSWT, as higher temperatures can enhance microbial activity and organic matter decomposition, which, together, modulate CDOM dynamics in the water column [61]. The 695–716 nm and 750–830 nm ranges span the red and near-infrared regions, respectively, and are commonly used to estimate the Chl-a concentration [62], a key proxy for phytoplankton biomass that is strongly regulated by water temperature [43]. These temperature-driven biogeochemical processes leave detectable signatures in the water’s spectral reflectance, which can be effectively learned by neural network models. The RF-based variable importance analysis further quantified the contribution of each spectral region to the LSWT estimation: 434–452 nm contributed 7.9%, 695–716 nm contributed 56.2%, and 750–830 nm contributed 35.9%. This distribution confirms that all three spectral bands provide meaningful input to the model. Therefore, the selection of the 434–452 nm, 695–716 nm, and 750–830 nm ranges for the LSWT estimation is both mechanistically justified and empirically supported.
In addition, the strong performance of the DNN-based LSWT inversion model stems from its ability to capture complex, non-linear spectral patterns that are not discernible through a univariate correlation analysis [63]. Although individual bands exhibited only a moderate linear correlation with the LSWT, the DNN effectively integrates multi-band spectral information to achieve a high predictive accuracy. This was further validated through a series of model ablation experiments designed to test the necessity of specific spectral bands by systematically altering the model’s input combinations. The results confirmed the critical role of the 750–830 nm band (Table S4). Pairing it with either the 695–716 nm or the 434–452 nm band increased the validation RMSE by only 9.5% compared to the full model. In contrast, an input containing only the 434–452 nm and 695–716 nm bands caused a severe accuracy decline, with the validation RMSE increasing by 84.8%. These results demonstrate that the DNN leverages synergistic spectral interactions beyond linear correlations, enabling robust LSWT retrieval from hyperspectral data.
The inversion model performed well in the study area. However, its portability to other regions may be limited due to differences in the optical properties of water bodies. Parameters such as the turbidity, CDOM, and phytoplankton concentrations affect the water’s inherent and apparent optical properties, which in turn influence the spectral response. As a result, models trained in optically complex, shallow lakes like Lake Taihu may not perform well in optically clear or stratified lakes. Deployment across different locations within the same water body also necessitates site-specific revalidation using local measurements to account for spatial heterogeneity in optically active constituents. In addition, while the current LSWT monitoring approach based on optical proximal sensing provides high-frequency and accurate LSWT data, it is fundamentally limited in capturing vertical temperature gradients caused by thermal stratification. Optical methods are inherently limited to the surface layer, and therefore, they cannot monitor bottom-layer temperatures, particularly in stratified or deep lakes. Since Lake Taihu is a relatively shallow and well-mixed lake, this limitation has less of an impact here; however, in deeper or seasonally stratified lakes, the model may need to be revalidated or reconstructed.
This study also developed an LSTM-based LSWT forecasting model, which demonstrated a high short-term accuracy and practical utility as an early warning tool. However, at this stage, the model is only capable of forecasting the hourly LSWT for the next three days. As indicated in Table S3, the LSTM performance depends strongly on the availability of extensive training data. Since the HPSs was only deployed in October 2021, the current training dataset remains limited. This is particularly constraining for forecasting extreme temperature events, as only 0.7% and 1.8% of the training samples represent LSWTs above 32 °C and below 5 °C, respectively. To better assess the model performance under critical conditions during 3-day forecasts, the error metrics were specifically evaluated for extreme temperatures. For an LSWT below 5 °C, the RMSE and MAE were 0.56 °C and 0.39 °C, respectively; for an LSWT above 32 °C, the RMSE and MAE were 0.74 °C and 0.57 °C, respectively. These results highlight the need to enhance the collection of LSWT data under extreme conditions in future research. Moreover, the model’s sensitivity to meteorological drivers—such as air temperature, solar radiation, and wind speed—should be considered. These factors strongly influence LSWT dynamics, especially in small- and medium-sized shallow lakes, where atmospheric forcing can rapidly impact the surface and subsurface temperatures [64]. Although the LSTM captures short-term patterns effectively, its performance is tied to the quality and resolution of meteorological inputs, and the model lacks physical interpretability, particularly under extreme events, abrupt changes, or data-scarce scenarios. To improve the forecasting range and real-world reliability, future work could explore hybrid approaches that integrate advanced deep learning architectures—such as transformer networks or a temporal fusion transformer—with process-based modeling. By incorporating temporal attention mechanisms and explicit structural components, these models could enhance both the long-range forecasting accuracy and the model interpretability [65]. Future studies could also consider adopting different combinations of spectral bands as model inputs to develop more lightweight and efficient architectures. Despite these limitations, the forecasting model is self-evolving. With continuous data acquisition from the HPSs system, the model accuracy is expected to improve progressively, enhancing its long-term reliability and application potential.

4.3. Advantages of HPSs for Water Quality Monitoring and Management

The HPSs introduces several key innovations for the real-time, high-frequency monitoring of the LSWT. As the core module of the entire system, the LSWT inversion and forecasting framework developed in this study provides critical technical support for the full implementation of the HPSs. Installed approximately 4 m above the water surface, the system captures strong water-leaving radiance with minimal atmospheric interference, eliminating the need for an atmospheric correction. This unique optical positioning enables the development of more accurate water quality inversion models. In addition, the HPSs operates in a non-contact manner, avoiding the direct exposure of sensors to the water body and thereby reducing risks of corrosion and biofouling. It can be flexibly deployed both along the shore and on the lake, supporting scalable configurations from point-based measurements to full surface coverage. Once calibrated, the system operates fully automatically, requiring no on-site personnel, and it produces high-quality data suitable for direct application in modeling, analyses, and management.
Built upon high-precision, real-time monitoring capabilities, the HPSs enhances the integrated space–air–ground water quality observation network. Its sub-minute sampling frequency enables the early detection of thermal anomalies in freshwater bodies. Real-time temperature monitoring facilitates the detection of temperature-induced algal growth signals, offering scientifically-grounded support for environmental decision making [66]. In addition, the high-resolution LSWT data provided by this system serves as critical inputs for the multi-scale forecasting of water quality [67]. These forecasts enable managers to proactively identify high-risk periods of algal proliferation and adjust water intake strategies or treatment processes accordingly, thereby helping to prevent drinking water source obstruction and subsequent public water supply shortages caused by algal blooms. This significantly enhances the operational relevance and policy applicability of the research.

5. Conclusions

In this study, based on a novel HPSs, we proposed a high-precision LSWT estimation model and a short-term forecasting model using a deep learning algorithm, and clarified the temporal variation in the LSWT in the northern region of Lake Taihu from 2021 to 2023. We found the following:
(1)
A DNN-based inversion model was developed using HPSs data, achieving the high-precision inversion of the LSWT with an R2 of 0.990, an RMSE of 0.92 °C, and an MAE of 0.64 °C.
(2)
An analysis of high-frequency data from 2021–2023 revealed strong seasonal LSWT variations in northern Lake Taihu. The minute-averaged data exhibited extremes ranging from 2.61 °C to 38.52 °C, while the hourly-averaged data ranged from 3.26 °C to 37.26 °C.
(3)
The LSTM forecasting model provided reliable 1–3-day forecasts (R2 > 0.985), offering valuable insights for lake ecosystem management.
The ultra-high temporal resolution of the monitoring system enables the detection of rapid thermal fluctuations, thus capturing more detailed dynamic processes. These advancements address the key limitations of traditional monitoring approaches and establish a transformative framework for understanding lake thermal behavior in a changing climate. This capability has significant implications for improving water quality management and enhancing early warning systems.

Supplementary Materials

The following supporting information can be downloaded at: https://www.mdpi.com/article/10.3390/rs17193303/s1, Supplementary Material S1: Spectral processing of HPSs data; Figure S1: Seasonal mean LSWT variations in the northern part of Lake Taihu from 2021 to 2023; Table S1: Statistical characteristics of in situ LSWT of LSTM forecasting model for all datasets; Table S2: Full dataset accuracy of the best models for the three scenarios; Table S3: The distribution of the LSTM modeling data; Table S4: Performance comparison of DNN models with different spectral band combinations.

Author Contributions

Conceptualization, Y.Z. (Yunlin Zhang); methodology, X.L., N.L. and Y.Z. (Yunlin Zhang); software, X.L., N.L. and Y.Z. (Yibo Zhang); investigation, X.L., N.L. and Y.Z. (Yibo Zhang); resources, K.S., B.Q. and G.Z.; data curation, X.L. and N.L.; writing—original draft preparation, X.L.; writing—review and editing, N.L. and Y.Z. (Yunlin Zhang); visualization, X.L.; supervision, Y.Z. (Yunlin Zhang); funding acquisition, K.S., B.Q. and G.Z. All authors have read and agreed to the published version of the manuscript.

Funding

This work was jointly funded by the Industry Prospect and Key Core Technology Project of Jiangsu Province [grant number BE2022152], the Ecological Environment Research Project of Jiangsu Province of China [grant number No. 2023003], the National Natural Science Foundation of China [grant number 42271120], the Jiangsu Funding Program for Excellent Postdoctoral Talent, and the Social Development Foundation of Jiangsu Province [grant number BE2022857].

Data Availability Statement

The data presented in this study are available on request from the corresponding author due to privacy.

Conflicts of Interest

Authors Boqiang Qin and Guangwei Zhu were employed by the company Nanjing Zhongke Deep Insight Technology Research Institute Co. The remaining authors declare that the research was conducted in the absence of any commercial or financial relationships that could be construed as a potential conflict of interest.

References

  1. Li, D.; Dorber, M.; Barbarossa, V.; Verones, F. Global characterization factors for quantifying the impacts of increasing water temperature on freshwater fish. Ecol. Indic. 2022, 142, 109201. [Google Scholar] [CrossRef]
  2. Adrian, R.; O’Reilly, C.M.; Zagarese, H.; Baines, S.B.; Hessen, D.O.; Keller, W.; Livingstone, D.M.; Sommaruga, R.; Straile, D.; Van Donk, E.; et al. Lakes as sentinels of climate change. Limnol. Oceanogr. 2009, 54, 2283–2297. [Google Scholar] [CrossRef]
  3. Wang, W.; Shi, K.; Wang, X.; Zhang, Y.; Qin, B.; Zhang, Y.; Woolway, R.I. The impact of extreme heat on lake warming in China. Nat. Commun. 2024, 15, 70. [Google Scholar] [CrossRef]
  4. Woolway, R.I.; Tong, Y.; Feng, L.; Zhao, G.; Dinh, D.A.; Shi, H.; Zhang, Y.; Shi, K. Multivariate extremes in lakes. Nat. Commun. 2024, 15, 4559. [Google Scholar] [CrossRef] [PubMed]
  5. Du Plessis, A. Persistent degradation: Global water quality challenges and required actions. One Earth 2022, 5, 129–131. [Google Scholar] [CrossRef]
  6. Gronewold, A.D.; Stow, C.A. Water Loss from the Great Lakes. Science 2014, 343, 1084–1085. [Google Scholar] [CrossRef]
  7. Maberly, S.C.; O’Donnell, R.A.; Woolway, R.I.; Cutler, M.E.J.; Gong, M.; Jones, I.D.; Merchant, C.J.; Miller, C.A.; Politi, E.; Scott, E.M.; et al. Global lake thermal regions shift under climate change. Nat. Commun. 2020, 11, 1232. [Google Scholar] [CrossRef]
  8. Pekel, J.-F.; Cottam, A.; Gorelick, N.; Belward, A.S. High-resolution mapping of global surface water and its long-term changes. Nature 2016, 540, 418–422. [Google Scholar] [PubMed]
  9. Yang, K.; Yu, Z.; Luo, Y.; Yang, Y.; Zhao, L.; Zhou, X. Spatial and temporal variations in the relationship between lake water surface temperatures and water quality—A case study of Dianchi Lake. Sci. Total Environ. 2018, 624, 859–871. [Google Scholar] [PubMed]
  10. Woolway, R.I.; Dokulil, M.T.; Marszelewski, W.; Schmid, M.; Bouffard, D.; Merchant, C.J. Warming of Central European lakes and their response to the 1980s climate regime shift. Clim. Chang. 2017, 142, 505–520. [Google Scholar] [CrossRef]
  11. Qin, B.; Huang, Q. Evaluation of the Climatic Change Impacts on the Inland Lake—A Case Study of Lake Qinghai, China. Clim. Chang. 1998, 39, 695–714. [Google Scholar] [CrossRef]
  12. Zhang, Y.; Shi, K.; Woolway, R.I.; Wang, X.; Zhang, Y. Climate warming and heatwaves accelerate global lake deoxygenation. Sci. Adv. 2025, 11, eadt5369. [Google Scholar] [CrossRef] [PubMed]
  13. Jane, S.F.; Hansen, G.J.A.; Kraemer, B.M.; Leavitt, P.R.; Mincer, J.L.; North, R.L.; Pilla, R.M.; Stetler, J.T.; Williamson, C.E.; Woolway, R.I.; et al. Widespread deoxygenation of temperate lakes. Nature 2021, 594, 66–70. [Google Scholar] [CrossRef] [PubMed]
  14. Zhang, Y.L.; Wu, Z.X.; Liu, M.L.; He, J.B.; Shi, K.; Zhou, Y.Q.; Wang, M.Z.; Liu, X.H. Dissolved oxygen stratification and response to thermal structure and long-term climate change in a large and deep subtropical reservoir (Lake Qiandaohu, China). Water Res. 2015, 75, 249–258. [Google Scholar] [CrossRef] [PubMed]
  15. Verburg, P.; Hecky, R.E.; Kling, H. Ecological Consequences of a Century of Warming in Lake Tanganyika. Science 2003, 301, 505–507. [Google Scholar] [CrossRef]
  16. Qin, B.Q.; Deng, J.M.; Shi, K.; Wang, J.; Brookes, J.; Zhou, J.; Zhang, Y.L.; Zhu, G.W.; Paerl, H.W.; Wu, L. Extreme climate anomalies enhancing cyanobacterial blooms in eutrophic Lake Taihu, China. Water Resour. Res. 2021, 57, e2020WR029371. [Google Scholar] [CrossRef]
  17. He, S.; Zhang, Y.; Li, N.; Shi, K.; Zhang, Y.; Qin, B.; Zhu, G.; Liu, M.; Shao, K. Summer heatwaves promote harmful algal blooms in the Fuchunjiang Reservoir, an important drinking water source. J. Environ. Manag. 2024, 359, 121056. [Google Scholar] [CrossRef]
  18. Johnk, K.D.; Huisman, J.; Sharples, J.; Sommeijer, B.; Visser, P.M.; Stroom, J.M. Summer heatwaves promote blooms of harmful cyanobacteria. Glob. Change Biol. 2008, 14, 495–512. [Google Scholar] [CrossRef]
  19. Jungkeit-Milla, K.; Pérez-Cabello, F.; de Vera-García, A.V.; Galofré, M.; Valero-Garcés, B. Lake Surface Water Temperature in high altitude lakes in the Pyrenees: Combining satellite with monitoring data to assess recent trends. Sci. Total Environ. 2024, 933, 173181. [Google Scholar] [CrossRef]
  20. Duan, S.-B.; Li, Z.-L.; Zhao, W.; Wu, P.; Huang, C.; Han, X.-J.; Gao, M.; Leng, P.; Shang, G. Validation of Landsat land surface temperature product in the conterminous United States using in situ measurements from SURFRAD, ARM, and NDBC sites. Int. J. Digit. Earth 2021, 14, 640–660. [Google Scholar] [CrossRef]
  21. Yvon-Durocher, G.; Montoya, J.M.; Trimmer, M.; Woodward, G. Warming alters the size spectrum and shifts the distribution of biomass in freshwater ecosystems. Glob. Change Biol. 2011, 17, 1681–1694. [Google Scholar] [CrossRef]
  22. Wang, P.; Bayram, B.; Sertel, E. A comprehensive review on deep learning based remote sensing image super-resolution methods. Earth Sci. Rev. 2022, 232, 104110. [Google Scholar] [CrossRef]
  23. Liu, G.; Ou, W.; Zhang, Y.; Wu, T.; Zhu, G.; Shi, K.; Qin, B. Validating and Mapping Surface Water Temperatures in Lake Taihu: Results From MODIS Land Surface Temperature Products. IEEE J. Sel. Top. Appl. Earth Obs. Remote Sens. 2015, 8, 1230–1244. [Google Scholar] [CrossRef]
  24. Kawanishi, T.; Sezai, T.; Ito, Y.; Imaoka, K.; Takeshima, T.; Ishido, Y.; Shibata, A.; Miura, M.; Inahata, H.; Spencer, R.W. The Advanced Microwave Scanning Radiometer for the Earth Observing System (AMSR-E), NASDA’s contribution to the EOS for global energy and water cycle studies. IEEE Trans. Geosci. Remote Sens. 2003, 41, 184–194. [Google Scholar] [CrossRef]
  25. Chelton, D.B.; Esbensen, S.K.; Schlax, G.; Thum, N.; Freilich, M.H.; Wentz, F.J.; Gentemann, C.L.; McPhaden, M.J.; Schopf, P.S. Observations of coupling between surface wind stress and sea surface temperature in the eastern tropical Pacific. J. Clim. 2001, 14, 1479–1498. [Google Scholar] [CrossRef]
  26. Li, N.; Zhang, Y.L.; Shi, K.; Zhang, Y.B.; Sun, X.; Wang, W.J.; Huang, X. Monitoring water transparency, total suspended matter and the beam attenuation coefficient in inland water using innovative ground-based proximal sensing technology. J. Environ. Manag. 2022, 306, 114477. [Google Scholar] [CrossRef] [PubMed]
  27. Wang, W.J.; Shi, K.; Zhang, Y.B.; Li, N.; Sun, X.; Zhang, D.; Zhang, Y.L.; Qin, B.Q.; Zhu, G.W. A ground-based remote sensing system for high-frequency and real-time monitoring of phytoplankton blooms. J. Hazard. Mater. 2022, 439, 129623. [Google Scholar] [CrossRef]
  28. Hulley, G.C.; Hook, S.J.; Schneider, P. Optimized split-window coefficients for deriving surface temperatures from inland water bodies. Remote Sens. Environ. 2011, 115, 3758–3769. [Google Scholar] [CrossRef]
  29. Huang, L.; Wang, X.; Sang, Y.; Tang, S.; Jin, L.; Yang, H.; Ottlé, C.; Bernus, A.; Wang, S.; Wang, C.; et al. Optimizing Lake Surface Water Temperature Simulations Over Large Lakes in China With FLake Model. Earth Space Sci. 2021, 8, e2021EA001737. [Google Scholar] [CrossRef]
  30. Yu, Z.; Yang, K.; Luo, Y.; Shang, C.; Zhu, Y. Lake surface water temperature prediction and changing characteristics analysis—A case study of 11 natural lakes in Yunnan-Guizhou Plateau. J. Clean. Prod. 2020, 276, 122689. [Google Scholar] [CrossRef]
  31. Zhu, M.; Wang, J.; Yang, X.; Zhang, Y.; Zhang, L.; Ren, H.; Wu, B.; Ye, L. A review of the application of machine learning in water quality evaluation. Eco-Environ. Health 2022, 1, 107–116. [Google Scholar] [CrossRef] [PubMed]
  32. Virdis, S.G.P.; Kongwarakom, S.; Juneng, L.; Padedda, B.M.; Shrestha, S. Historical and projected response of Southeast Asian lakes surface water temperature to warming climate. Environ. Res. 2024, 247, 118412. [Google Scholar] [CrossRef]
  33. Su, J.; Lin, Z.Y.; Xu, F.W.; Fathi, G.; Alnowibet, K.A. A hybrid model of ARIMA and MLP with a Grasshopper optimization algorithm for time series forecasting of water quality. Sci. Rep. 2024, 14, 23927. [Google Scholar] [CrossRef] [PubMed]
  34. Vilhena, L.C.; Hillmer, I.; Imberger, J. The role of climate change in the occurrence of algal blooms: Lake Burragorang, Australia. Limnol. Oceanogr. 2010, 55, 1188–1200. [Google Scholar] [CrossRef]
  35. Van Houdt, G.; Mosquera, C.; Nápoles, G. A review on the long short-term memory model. Artif. Intell. Rev. 2020, 53, 5929–5955. [Google Scholar] [CrossRef]
  36. Kreuzer, D.; Munz, M.; Schlüter, S. Short-term temperature forecasts using a convolutional neural network—An application to different weather stations in Germany. Mach. Learn. Appl. 2020, 2, 100007. [Google Scholar] [CrossRef]
  37. Xu, H.; Paerl, H.W.; Qin, B.; Zhu, G.; Gaoa, G. Nitrogen and phosphorus inputs control phytoplankton growth in eutrophic Lake Taihu, China. Limnol. Oceanogr. 2010, 55, 420–432. [Google Scholar] [CrossRef]
  38. Qin, B.Q.; Zhu, G.W.; Gao, G.; Zhang, Y.L.; Li, W.; Paerl, H.W.; Carmichael, W.W. A Drinking Water Crisis in Lake Taihu, China: Linkage to Climatic Variability and Lake Management. Environ. Manag. 2010, 45, 105–112. [Google Scholar] [CrossRef]
  39. Yan, X.; Xia, Y.; Ti, C.; Shan, J.; Wu, Y.; Yan, X. Thirty years of experience in water pollution control in Taihu Lake: A review. Sci. Total Environ. 2024, 914, 169821. [Google Scholar] [CrossRef]
  40. Yang, S.-Q.; Liu, P.-W. Strategy of water pollution prevention in Taihu Lake and its effects analysis. J. Great Lakes Res. 2010, 36, 150–158. [Google Scholar] [CrossRef]
  41. Zhang, Y.L.; Qin, B.Q.; Zhu, G.W.; Shi, K.; Zhou, Y.Q. Profound Changes in the Physical Environment of Lake Taihu From 25 Years of Long-Term Observations: Implications for Algal Bloom Outbreaks and Aquatic Macrophyte Loss. Water Resour. Res. 2018, 54, 4319–4331. [Google Scholar] [CrossRef]
  42. Woolway, R.I.; Jennings, E.; Shatwell, T.; Golub, M.; Pierson, D.C.; Maberly, S.C. Lake heatwaves under climate change. Nature 2021, 589, 402–407. [Google Scholar] [CrossRef]
  43. Paerl, H.W.; Huisman, J. Blooms Like It Hot. Science 2008, 320, 57–58. [Google Scholar] [CrossRef]
  44. Luo, J.; Li, X.; Ma, R.; Li, F.; Duan, H.; Hu, W.; Qin, B.; Huang, W. Applying remote sensing techniques to monitoring seasonal and interannual changes of aquatic vegetation in Taihu Lake, China. Ecol. Indic. 2016, 60, 503–513. [Google Scholar] [CrossRef]
  45. Huisman, J.; Codd, G.A.; Paerl, H.W.; Ibelings, B.W.; Verspagen, J.M.H.; Visser, P.M. Cyanobacterial blooms. Nat. Rev. Microbiol. 2018, 16, 471–483. [Google Scholar] [CrossRef]
  46. Chen, T.; Guestrin, C. XGBoost: A Scalable Tree Boosting System. In Proceedings of the 22nd ACM SIGKDD International Conference on Knowledge Discovery and Data Mining, San Francisco, CA, USA, 13–17 August 2016. [Google Scholar]
  47. Bentéjac, C.; Csörgo, A.; Martínez-Muñoz, G. A comparative analysis of gradient boosting algorithms. Artif. Intell. Rev. 2021, 54, 1937–1967. [Google Scholar] [CrossRef]
  48. Zhang, H.C.; Huang, S.H. Applications of Neural Networks in Manufacturing—A State of the Survey. Int. J. Prod. Res. 1995, 33, 705–728. [Google Scholar] [CrossRef]
  49. Honda, T.; Kotsuki, S.; Lien, G.-Y.; Maejima, Y.; Okamoto, K.; Miyoshi, T. Assimilation of Himawari-8 All-Sky Radiances Every 10 Minutes: Impact on Precipitation and Flood Risk Prediction. J. Geophys. Res. Atmos. 2018, 123, 965–976. [Google Scholar] [CrossRef]
  50. Bidder, O.R.; Campbell, H.A.; Gómez-Laich, A.; Urgé, P.; Walker, J.; Cai, Y.Z.; Gao, L.L.; Quintana, F.; Wilson, R.P. Love Thy Neighbour: Automatic Animal Behavioural Classification of Acceleration Data Using the K-Nearest Neighbour Algorithm. PLoS ONE 2014, 9, e88609. [Google Scholar] [CrossRef]
  51. Xu, L.L.; Li, B.L.; Yuan, Y.C.; Gao, X.Z.; Zhang, T. A Temporal-Spatial Iteration Method to Reconstruct NDVI Time Series Datasets. Remote Sens. 2015, 7, 8906–8924. [Google Scholar] [CrossRef]
  52. Bautista, P.M.; Duka, M.A.; Delos Reyes, A.; Sobremisana, A.G. Water temperature modeling through regression and artificial neural network using short-term data for a Philippine River. Water Pract. Technol. 2024, 19, 4178–4191. [Google Scholar] [CrossRef]
  53. Cazzaniga, I.; Zibordi, G.; Alikas, K.; Kratzer, S. Temporal changes in the remote sensing reflectance at Lake VänernNature Reviews Earth and Environment. J. Great Lakes Res. 2023, 49, 357–367. [Google Scholar] [CrossRef]
  54. Lindemann, B.; Müller, T.; Vietz, H.; Jazdi, N.; Weyrich, M. A survey on long short-term memory networks for time series prediction. Procedia CIRP 2021, 99, 650–655. [Google Scholar] [CrossRef]
  55. Woolway, R.I.; Kraemer, B.M.; Lenters, J.D.; Merchant, C.J.; O’Reilly, C.M.; Sharma, S. Global lake responses to climate change. Nat. Rev. Earth Environ. 2020, 1, 388–403. [Google Scholar] [CrossRef]
  56. Chu, P.; Wang, S.; Yu, W.; Wang, A.; Zong, Y.; Yin, S.; Zhao, C.; Wang, T. The impact of extremely low-temperature changes on fish: A case study on migratory bony fishes (Takifugu fasciatus). Aquaculture 2024, 579, 740155. [Google Scholar] [CrossRef]
  57. Kayastha, P.; Dzialowski, A.R.; Stoodley, S.H.; Wagner, K.L.; Mansaray, A.S. Effect of Time Window on Satellite and Ground-Based Data for Estimating Chlorophyll-a in Reservoirs. Remote Sens. 2022, 14, 846. [Google Scholar] [CrossRef]
  58. Mishra, R.K.; Reddy, G.Y.S.; Pathak, H. The Understanding of Deep Learning: A Comprehensive Review. Math. Probl. Eng. 2021, 2021, 5548884. [Google Scholar] [CrossRef]
  59. Zhang, W.; Gu, X.; Tang, L.; Yin, Y.; Liu, D.; Zhang, Y. Application of machine learning, deep learning and optimization algorithms in geoengineering and geoscience: Comprehensive review and future challenge. Gondwana Res. 2022, 109, 1–17. [Google Scholar] [CrossRef]
  60. Griffin, C.G.; Finlay, J.C.; Brezonik, P.L.; Olmanson, L.; Hozalski, R.M. Limitations on using CDOM as a proxy for DOC in temperate lakes. Water Res. 2018, 144, 719–727. [Google Scholar] [CrossRef]
  61. Du, Y.; Chen, F.; Xiao, K.; Song, C.; He, H.; Zhang, Q.; Zhou, Y.; Jang, K.-S.; Zhang, Y.; Xing, P.; et al. Water Residence Time and Temperature Drive the Dynamics of Dissolved Organic Matter in Alpine Lakes in the Tibetan Plateau. Glob. Biogeochem. Cycles 2021, 35, e2020GB006908. [Google Scholar] [CrossRef]
  62. Gurlin, D.; Gitelson, A.A.; Moses, W.J. Remote estimation of chl-a concentration in turbid productive waters—Return to a simple two-band NIR-red model? Remote Sens. Environ. 2011, 115, 3479–3490. [Google Scholar] [CrossRef]
  63. Guo, H.W.; Tian, S.; Huang, J.; Zhu, X.T.; Wang, B.; Zhang, Z.J. Performance of deep learning in mapping water quality of Lake Simcoe with long-term Landsat archive. ISPRS J. Photogramm. Remote Sens. 2022, 183, 451–469. [Google Scholar] [CrossRef]
  64. Donchyts, G.; Winsemius, H.; Baart, F.; Dahm, R.; Schellekens, J.; Gorelick, N.; Iceland, C.; Schmeier, S. High-resolution surface water dynamics in Earth’s small and medium-sized reservoirs. Sci. Rep. 2022, 12, 13776. [Google Scholar] [CrossRef] [PubMed]
  65. Huang, F.; Ochoa, C.G.; Li, Q.; Shen, X.; Qian, Z.; Han, S.; Zhang, N.; Yu, M. Forecasting environmental water availability of lakes using temporal fusion transformer: Case studies of China’s two largest freshwater lakes. Environ. Monit. Assess. 2024, 196, 152. [Google Scholar] [CrossRef] [PubMed]
  66. Qian, J.; Qian, L.; Pu, N.; Bi, Y.; Wilhelms, A.; Norra, S. An Intelligent Early Warning System for Harmful Algal Blooms: Harnessing the Power of Big Data and Deep Learning. Environ. Sci. Technol. 2024, 58, 15607–15618. [Google Scholar] [CrossRef] [PubMed]
  67. Duan, H.; Yang, K.; Zhou, X.; Luo, Y. Temporal and Spatial Dynamics of Surface Water Temperature Changes in China’s Major Lakes. Water Resour. Res. 2025, 61, e2024WR038855. [Google Scholar] [CrossRef]
Figure 1. (a) Location of Lake Taihu and TLLER and (b) the actual scene layout of the HPSs platform at TLLER.
Remotesensing 17 03303 g001
Figure 2. Pearson’s correlation coefficient between the hyperspectral reflectance and the LSWT (the cyan-blue blocks represent the hyperspectral reflectance values selected as the inputs of the LSWT inversion model: 434–452 nm, 695–716 nm, and 750–830 nm, the red dashed line represents a Pearson’s correlation coefficient of 0).
Remotesensing 17 03303 g002
Figure 3. Comparison of predicted and in situ values of the DNN (a), XGBoost (b), and KNN (c) models for the inversion of LSWT (the three subplots from left to right represent the training dataset, testing dataset, and validation dataset).
Remotesensing 17 03303 g003
Figure 4. Comparison of true values and predicted values of the best LSTM model for hourly forecasts based on the training set and validation set for one day (a), two days (c), and three days (e), along with a comparison for one day (b), two days (d), and three days (f) using the entire dataset.
Remotesensing 17 03303 g004
Figure 5. Minute-by-minute (a) and hourly (b) LSWT dynamics of the northern Lake Taihu from 21 October 2021 to 31 December 2023 between 8:00 and 17:00 daily.
Remotesensing 17 03303 g005
Figure 6. Distinction between LSWT of HPSs and buoy from 21 October 2021 to 12 September 2023.
Remotesensing 17 03303 g006
Table 1. Statistical characteristics of in situ LSWT for LSWT inversion model training, testing, and validation datasets.
Inversion
Model
Training DatasetTesting DatasetValidation Dataset
Min–MaxMean ± S.D.NMin–MaxMean ± S.D.NMin–MaxMean ± S.D.N
LSWT (°C)3.18–37.5819.14 ± 9.1479463.34–37.5219.33 ± 9.0726493.25–37.3219.50 ± 9.151178
Table 2. LSWT forecasting accuracy based on different input–output configurations for training and testing datasets.
Training DatasetTesting Dataset
Input–Output (Days)R2RMSE (°C)MAE (°C)R2RMSE (°C)MAE (°C)
1–10.9960.560.430.9960.570.44
2–10.9950.630.480.9950.630.48
3–10.9970.460.340.9970.480.35
4–10.9930.720.580.9930.730.58
5–10.9950.620.500.9950.620.51
6–10.9950.630.500.9950.610.49
7–10.9970.490.370.9970.500.37
8–10.9950.610.470.9950.610.48
9–10.9940.680.530.9940.700.54
10–10.9970.500.400.9970.500.40
1–20.9851.090.870.9841.110.88
2–20.9851.080.800.9851.070.80
3–20.9831.130.880.9821.170.91
4–20.9821.180.890.9821.190.90
5–20.9841.120.880.9841.120.87
6–20.9821.170.900.9821.180.89
7–20.9841.110.910.9831.120.91
8–20.9831.150.910.9831.150.90
9–20.9871.000.800.9861.040.82
10–20.9841.100.880.9831.160.92
1–30.9831.150.930.9831.140.93
2–30.9801.270.960.9801.260.96
3–30.9801.230.980.9811.210.95
4–30.9741.401.110.9751.401.12
5–30.9731.441.140.9731.451.16
6–30.9841.120.940.9831.130.94
7–30.9871.010.870.9871.010.87
8–30.9731.451.160.9731.451.17
9–30.9801.251.010.9801.261.02
10–30.9821.200.980.9801.241.01
Disclaimer/Publisher’s Note: The statements, opinions and data contained in all publications are solely those of the individual author(s) and contributor(s) and not of MDPI and/or the editor(s). MDPI and/or the editor(s) disclaim responsibility for any injury to people or property resulting from any ideas, methods, instructions or products referred to in the content.