Article

Warm-Season Precipitation in the Eastern Pamir Plateau: Evaluation from Multi-Source Datasets and Elevation Dependence

1
Institute of Desert Meteorology, China Meteorological Administration, Urumqi 830002, China
2
Field Scientific Experiment Base of Akdala Atmospheric Background, China Meteorological Administration, Akdala 830002, China
3
Key Laboratory of Tree-Ring Physical and Chemical Research, China Meteorological Administration, Urumqi 830002, China
*
Author to whom correspondence should be addressed.
Remote Sens. 2025, 17(19), 3302; https://doi.org/10.3390/rs17193302
Submission received: 21 August 2025 / Revised: 20 September 2025 / Accepted: 24 September 2025 / Published: 26 September 2025
(This article belongs to the Section Atmospheric Remote Sensing)

Abstract

Highlights

What are the main findings?
  • In Eastern Pamir, CRA40/Land shows the best overall performance, while TPHiPr accurately captures the elevation-dependent precipitation.
  • The skill-weighted ensemble mean dataset enhances precipitation assessment performance and captures the elevation-dependent precipitation.
What is the implication of the main finding?
  • The results provide the applicable options for multi-source precipitation datasets in complex terrain areas from the perspective of elevation dependence.
  • This study provides a more reliable estimation scheme for precipitation research in complex terrain areas by integrating the advantages of multi-source datasets.

Abstract

As the Pamir Plateau is known as the “Water Tower of Central Asia”, accurate precipitation dataset is essential for the study of climate and hydrology in this region. Based on the monthly precipitation observations from 268 meteorological stations in the Eastern Pamir Plateau (EPP) during the April-to-September warm season of 2010–2024, this paper comprehensively evaluates the applicability of eight multi-source precipitation datasets in complex terrains by using statistical indicators, constructs a skill-weighted ensemble mean dataset (Skill-Ens), and analyzes the elevation-dependent characteristics of precipitation in the EPP. The research findings are as follows: (1) The warm-season precipitation in the EPP shows a significant elevation-dependent feature, with the maximum precipitation altitude (MPA) in the range of 2400–2800 m. Precipitation is reduced above this elevation range, but a second MPA may appear in the glacier area above 4000 m. (2) Among the studied eight datasets, the first-generation Chinese Global Land-surface Reanalysis (CRA40/Land) performs the best overall. A long-term (1979–2020) high-resolution (1/30°) precipitation dataset for the Third Pole region (TPHiPr) can most accurately capture the elevation-dependent characteristics of precipitation, while the satellite datasets are relatively poor in this respect. (3) The skill-weighted ensemble mean dataset (Skill-Ens) constructed in this study can significantly improve precipitation estimation (DISO = 0.35), especially in the MPA region, and can accurately depict the elevation-dependent characteristics of precipitation as well (CC = 0.92). In a word, this paper provides the applicable options for precipitation data in complex terrain areas. With the Skill-Ens, the limitation of the individual dataset has been compensated for, which is of significant application value in improving the accuracy of hydrological simulations in high-elevation mountainous areas.

1. Introduction

The Pamir Plateau (PP), as a key component of the western edge of the Qinghai–Tibet Plateau, is a high-elevation area highly sensitive to global climate change [1]. It is the birthplace of many rivers, including the Indus River, the Amu Darya, the Tarim River, the Kashgar River, and the Yarkand River. Known as the “Water Tower of Central Asia” [2], this region is characterized by a distinctive hydrological cycle, with a large amount of water resources stored in the form of glaciers and snow cover in the alpine areas. Atmospheric precipitation and the melting of glaciers and snow provide the main runoff for the surrounding rivers [3]. Precipitation can directly affect the river runoff and the sustainable development of ecology and economy in the downstream regions, thus playing a decisive role in the ecological security and sustainable utilization of water resources in the arid regions of Central Asia [4].
The Pamir Plateau (PP) is located at the intersection of the Asian monsoon system and the mid-latitude westerlies [5,6], with a unique topography and complex climate-hydrological patterns, forming a distinctive spatio-temporal distribution pattern of precipitation [7]. High-resolution numerical simulation reveals that the annual precipitation is over 1000 mm in the PP [8]. There exist obvious seasonal and latitudinal differences in precipitation, which means that precipitation in this region is concentrated in winter and spring, decreasing from west to east [9,10]. Additionally, the precipitation mechanism in the PP region shows significant elevation dependence and differences in water vapor sources. The winter and spring precipitation in the western PP is mainly dominated by water vapor transport from the westerly wind, while the summer precipitation in the eastern PP (EPP) is closely associated with the moisture from the Indian Ocean monsoon [11,12,13,14]. With global warming, the hydrological processes in the PP, the most important glacier area in the middle and low latitudes, change dramatically [15,16]. These processes not only directly affect the mass balance of glaciers [17] but also possibly exert cascading effects on the downstream ecosystem and socio-economic system by causing the occurrence of extreme hydrological events (such as mountain torrents and mudslides). Therefore, accurately quantifying the precipitation characteristics in this region has significant scientific and practical significance.
However, the existing precipitation observation system is facing big challenges. Traditional rain gauges are affected by the low capture efficiency of solid precipitation (with an error rate of 30–50%) and wind field disturbances [18], and the meteorological observation stations are mostly distributed in river valley areas [19], so it is difficult for the observation data to reflect the true precipitation conditions in high-elevation areas. Similarly, constrained by the complex terrain and harsh environment, meteorological stations in the PP region are sparse and unevenly distributed, failing to obtain accurate precipitation amounts. Such observation gaps seriously restrict the accuracy of water resource assessment and the early warning capability for disasters. Therefore, an accurate precipitation dataset is of great significance for water resource utilization, climate-hydrological research, and ecological protection in this region [20,21,22].
At present, precipitation datasets mainly involve the following types: (1) satellite remote sensing dataset, which covers a wide range with continuous images in space and time, but is limited by terrain and algorithms [23]; (2) reanalysis dataset, which integrates the multi-source observations but relies on the physical parameterization of models [24]; (3) observation-based grid dataset, which has high accuracy and produces small errors, but has low spatial resolution; and (4) new fused dataset, such as a long-term (1979–2020) high-resolution (1/30°) precipitation dataset for the Third Pole region (TPHiPr) and the High Asia Refined analysis version2 (HARv2), which improves the representation ability of complex terrain areas through multi-source data assimilation [25], and can provide more precise geographical and temporal information. Previous studies have shown that grid observations and satellite precipitation datasets tend to underestimate the precipitation in high-elevation mountainous areas [8]. However, the fused dataset performs differently at various spatial and temporal scales [26,27] and its applicability in complex terrain areas still needs to be verified [28,29].
In addition, the precipitation pattern in the Pamir Plateau has a significant topographic effect. Sun et al. [30] found a notable spatial divergence in precipitation–elevation relationships across the Third Pole region: precipitation decreases with increasing elevation in monsoon-dominated basins (eastern TP), while it increases with elevation in westerly-dominated basins (western TP). In westerly-influenced basins, this phenomenon is closely related to the decrease in the condensation elevation with elevation and the increase in convective available potential energy with elevation. This complex elevation dependence makes it difficult for traditional assessment methods based on regional averages to accurately capture the spatial distribution characteristics of actual precipitation. Therefore, an assessment framework considering elevation differentiation needs to be established. The Eastern Pamir Plateau (EPP) serves as a transition zone from summer-type precipitation to winter-type precipitation [31], with warm-season precipitation being dominant. The harsh environment at high elevations leads to a continuous lack of solid precipitation observations in the cold season; thus, this observational asymmetry severely restricts the accurate characterization of precipitation features throughout the year.
Fortunately, in recent years, there have been relatively more observations collected by automatic weather stations in the EPP, which have partially compensated for the scarcity of precipitation observation data in some high-elevation areas. With these previous observation data, we can systematically assess the applicability of multi-source precipitation datasets, construct reliable precipitation datasets, reveal the elevation-dependent characteristics of precipitation in this region, and provide relatively reliable factual information on the spatial distribution of precipitation across the EPP to provide a scientific basis for hydroclimatic research and water resource management in the High Asia region and offer new insights into the precipitation mechanism in complex terrains. For this purpose, in this study, we integrate the observation data from 268 meteorological stations located within the range of 1000–4700 m in the EPP and address the three key scientific issues as follows: (1) to systematically evaluate the comprehensive performance of eight precipitation datasets, including Integrated Multi-satellitE Retrievals for GPM (IMERG), Global Satellite Mapping/Gauge-calibrated Rainfall Product (GSMaP), ECMWF Reanalysis v5-Land (ERA5-Land), the first-generation Chinese Global Land-surface Reanalysis (CRA40/Land), the Global Precipitation Climatology Centre (GPCC), TPHiPr, HARv2, and the China Meteorological Forcing Dataset v2.0 (CMFD v2.0); (2) to construct a skill-weighted ensemble mean dataset and evaluating it; and (3) to reveal the elevation dependence of precipitation in the complex terrain of the EPP.

2. Materials and Methods

2.1. Study Area

The study area is the eastern part of the Pamir Plateau, located in the southwest of Xinjiang, China. It borders India and Pakistan to the west and is adjacent to the Tarim Basin and the West Kunlun Mountains. Its geographical location is 36.5–41.0°N and 73.5–79.5°E (Figure 1). This area is widely covered with glaciers and has numerous rivers and lakes, mainly including the major tributaries of the Tarim River, the Kashgar River Basin, and the Yarkant River Basin. Among them, the Tashkurgan River is one of the sources of the Yarkant River, with an average elevation of over 4000 m. The terrain and landforms in the study area are complex and diverse. Due to the interaction of complex terrain with the westerlies and monsoons, there are significant differences in the distribution patterns of precipitation.

2.2. Data

2.2.1. Rain Gauge Data

In this paper, the daily precipitation observation data provided by the China Meteorological Administration (CMA) from 2010 to 2024 are used to assess the accuracy of various precipitation datasets. A month with no more than 50% missing values in the daily precipitation records is considered a valid month, and a warm season without missing values in the monthly precipitation records is regarded as a valid warm season. A total of 268 meteorological stations are selected. As shown in Figure 2c, the validity periods of valid stations are from 2 to 15 years, with most being around 9 years. The elevations of the meteorological stations range from 1000 to 4700 m (Figure 2a). To study the variation in precipitation at different elevations, the elevation range is set to be 400 m, and the number of stations in different elevation ranges is shown in Figure 2b. The stations are mainly concentrated within the elevation of 1200–1600 m, and fewer stations are built at higher elevation areas. The research period of this article is the warm season from April to September.

2.2.2. Precipitation Datasets

Eight kinds of precipitation datasets are utilized in this study, including satellite-based, reanalysis, observed gridded, and fused datasets. IMERG (0.1°) and GSMaP (0.1°) are satellite remote sensing products, based on GPM satellite constellation fusion inversion and multi-source satellite–rain gauge joint calibration, respectively. ERA5-Land (0.1°) and CRA40/Land (0.25°) represent reanalysis data derived from the ECMWF Land Reanalysis System and China’s first-generation Global Land Assimilation System, respectively. GPCC (0.25°) is a global rain gauge interpolation product constructed using the World Meteorological Organization station network. Fusion datasets include TPHiPr (1/30°), HARv2 (10 km), and CMFD v2.0 (0.1°). TPHiPr integrates WRF downscaling with machine learning-corrected ERA5 precipitation data, HARv2 employs WRF dynamic downscaling, and CMFD v2.0 combines ERA5 reanalysis with ground station observations while incorporating high-resolution radiation and precipitation products derived from artificial intelligence inversion. All datasets cover the period 2010–2020 or longer. The unit of the precipitation datasets is mm mon−1. The specific information of the eight precipitation datasets is presented in Table 1.

2.3. Evaluation Methods

The nearest neighbor method is used to temporally and spatially match the eight gridded precipitation datasets with the corresponding surface observation data. The grid point data closest to each station are selected as the representative precipitation data for each precipitation dataset at that station.

2.3.1. Conventional Evaluation Metrics

Three commonly used evaluation metrics are employed to comprehensively assess the accuracy of precipitation datasets, including the Pearson correlation coefficient (CC), root mean square error (RMSE), and relative bias (Rbias) (Table 2).

2.3.2. DISO Index

The Distance between Indices of Simulation and Observation (DISO) is a new comprehensive performance index of the model that quantifies the distance between different statistical indices based on the Euclidean method and represents the distance between the simulation index and the observation index. The smaller the DISO value, the better the simulation performance. The DISO values for the whole study area and different elevation ranges are denoted as DISO-All and DISO-Elevation, respectively. The formula is as follows:
D I S O = ( N C C 1 ) 2 + N R M S E 2 + N R b i a s 2
where NCC, NRMSE, and NRbias are normalized metrics, and the formula is as follows:
N M i = M i m i n ( M ) m a x ( M ) m i n M
NMi is the normalized metric value of the i-th precipitation dataset (such as NCC, RMSE, NRbias), Mi is the original index value of the i-th dataset (such as CC, RMSE, Rbias), min (M) is the minimum value of this index in all datasets, and max (M) is the maximum value of this index in all datasets.

2.4. Skill Weightings for Reanalysis Dataset Ensemble Mean

This study adopts the skill-based non-equal-weighted ensemble mean scheme proposed by Sanderson et al. [40,41] to improve the traditional equal-weighted averaging method. This scheme allocates weights in accordance with the performance differences in each precipitation dataset relative to station observations: the better the performance (i.e., the smaller the distance from observations), the higher the weight. Previous studies have mostly used RMSE as the distance metric [42,43], but other skill scores can also be used [44]. This study uses the multi-metric DISO value as the performance distance metric, which integrates RMSE, CC, and Rbias evaluation metrics to provide a more comprehensive dataset performance assessment than using RMSE alone, constructs a new weighted ensemble mean, and evaluates its performance in precipitation simulation in complex terrain areas of EPP. The formula for calculating the skill weight of the precipitation dataset is as follows:
w q i = A e ( δ i D q )
where w q i represents the weighting coefficient of the i-th precipitation dataset, and δ i represents the DISO value of the i-th precipitation dataset relative to the observed data, reflecting its skill level. D q is the neighborhood radius parameter, which can adjust the sensitivity of the performance of the precipitation datasets and determine the degree to which datasets with poorer performance should be down-weighted. In this study, D q is equal to the average DISO value of the eight precipitation datasets. A is the normalization factor, which can ensure that the sum of the weights of all precipitation datasets is 1.
After the weighting of each precipitation dataset is determined, the grid data of the eight precipitation datasets in the common period of 2010–2020 in the study area are subjected to a unique spatial resolution of 0.1°. Then, the datasets are weighted and ensembled. At the same time, an equal-weighted ensemble mean is constructed for comparison. The formula is as follows:
P f u s i o n = i w q ( i ) × P ( i )
where P f u s i o n is the ensemble mean of the precipitation datasets, w q i represents the weighting coefficient of the i-th dataset, and P ( i ) represents the precipitation amount of the i-th dataset.

3. Results

3.1. Spatial and Temporal Characteristics of Precipitation

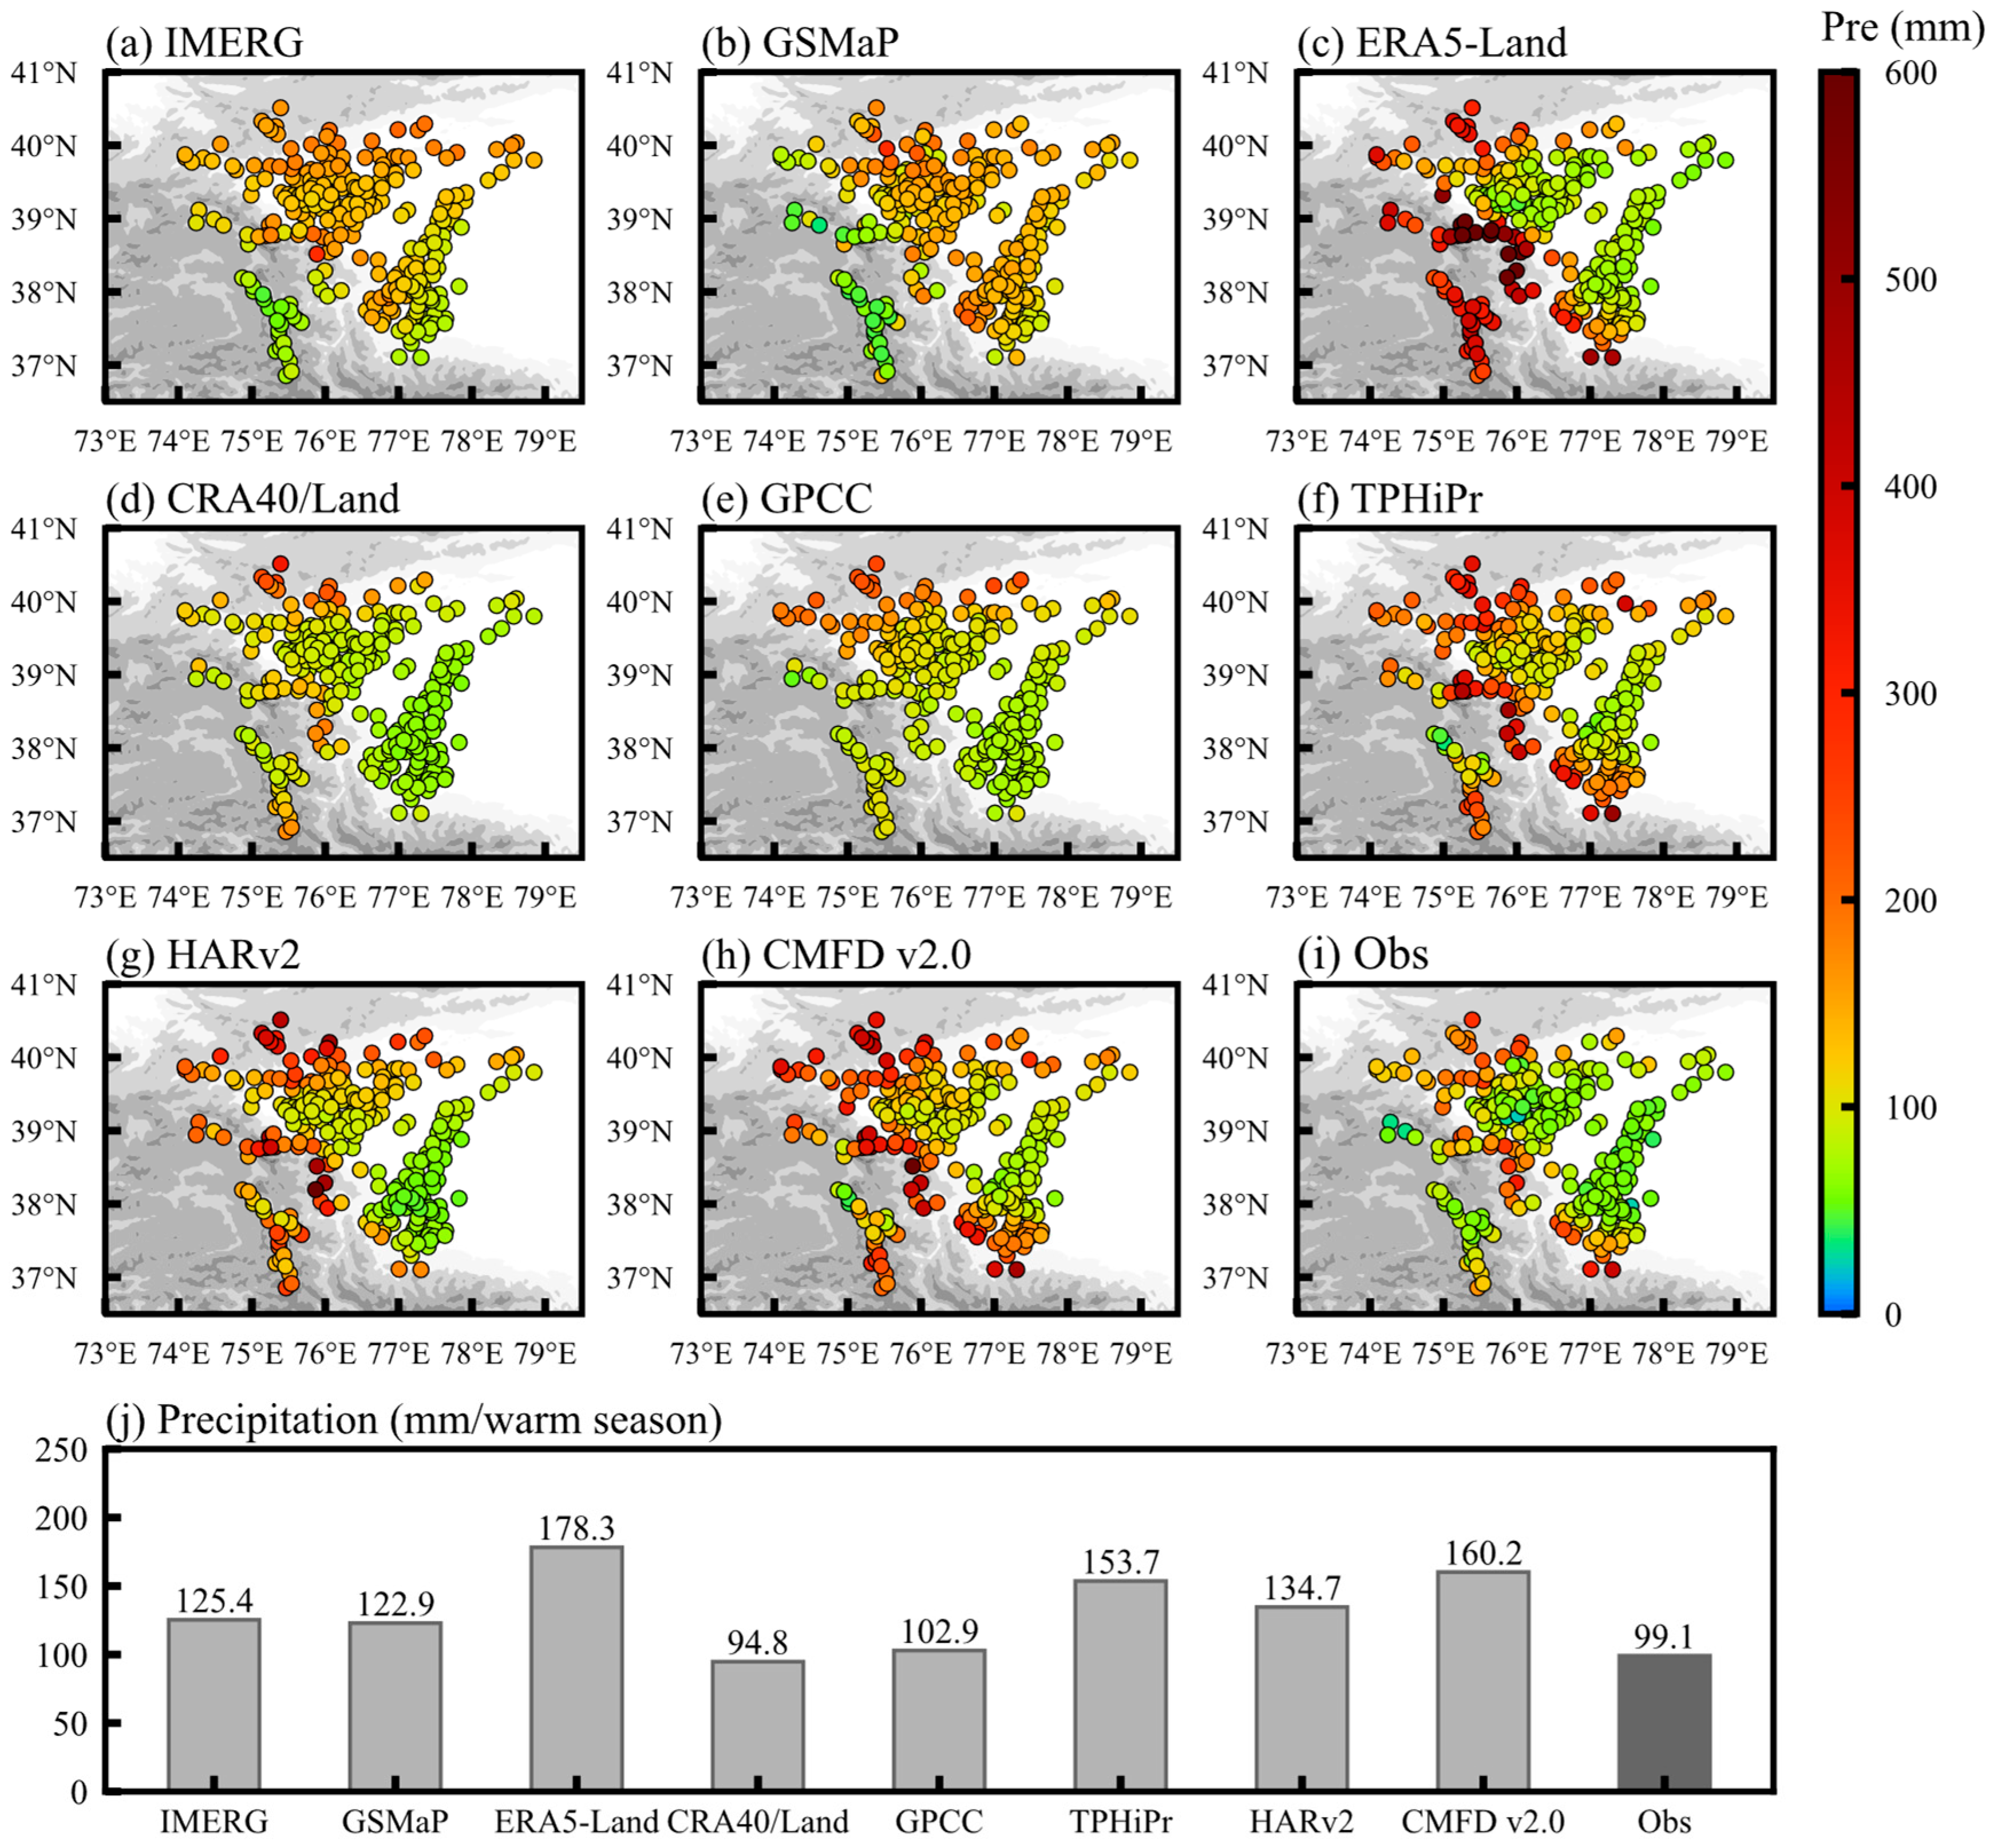
The distribution pattern of warm-season precipitation averaged over multiple years from eight precipitation datasets and meteorological station observations is given in Figure 3. Observations show that the spatial distribution of precipitation exhibits a significant altitudinal gradient feature, that is, the precipitation first increases with the rise in elevation, reaches the maximum value in the mid-mountain zone, and then decreases with the decrease in elevation. Among the different precipitation datasets, satellite datasets (IMERG and GSMaP) have significant differences from the observations in the spatial distribution of precipitation, characterized by more precipitation in the basin and less in the mountainous area, and the high-value area of precipitation in the mid-mountain zone is not obvious. The spatial distribution of precipitation in reanalysis datasets (ERA5-Land and CRA40/Land) is similar to that previously observed. However, the precipitation in ERA5-Land is significantly higher in mountainous areas, while the simulation of high-value precipitation areas in the mid-mountain zone by CRA40/Land is not significant. The fused datasets (TPHiPr, HARv2, CMFD v2.0) also show a spatial distribution consistent with the observations, but the precipitation in mountainous areas is overestimated. In terms of the magnitude of precipitation reflected by the datasets, the observed warm-season precipitation is 99.1 mm. The precipitation of the CRA40/Land and GPCC datasets is closest to the observations, followed by that of IMERG and GSMaP datasets, which is approximately 120.0 mm. The precipitation in the CMFD v2.0, TPHiPr, and HARv2 datasets is relatively higher (160.2 mm, 153.7 mm, 134.7 mm), while the average value of ERA5-Land (178.3 mm) is significantly higher than that of the other datasets.
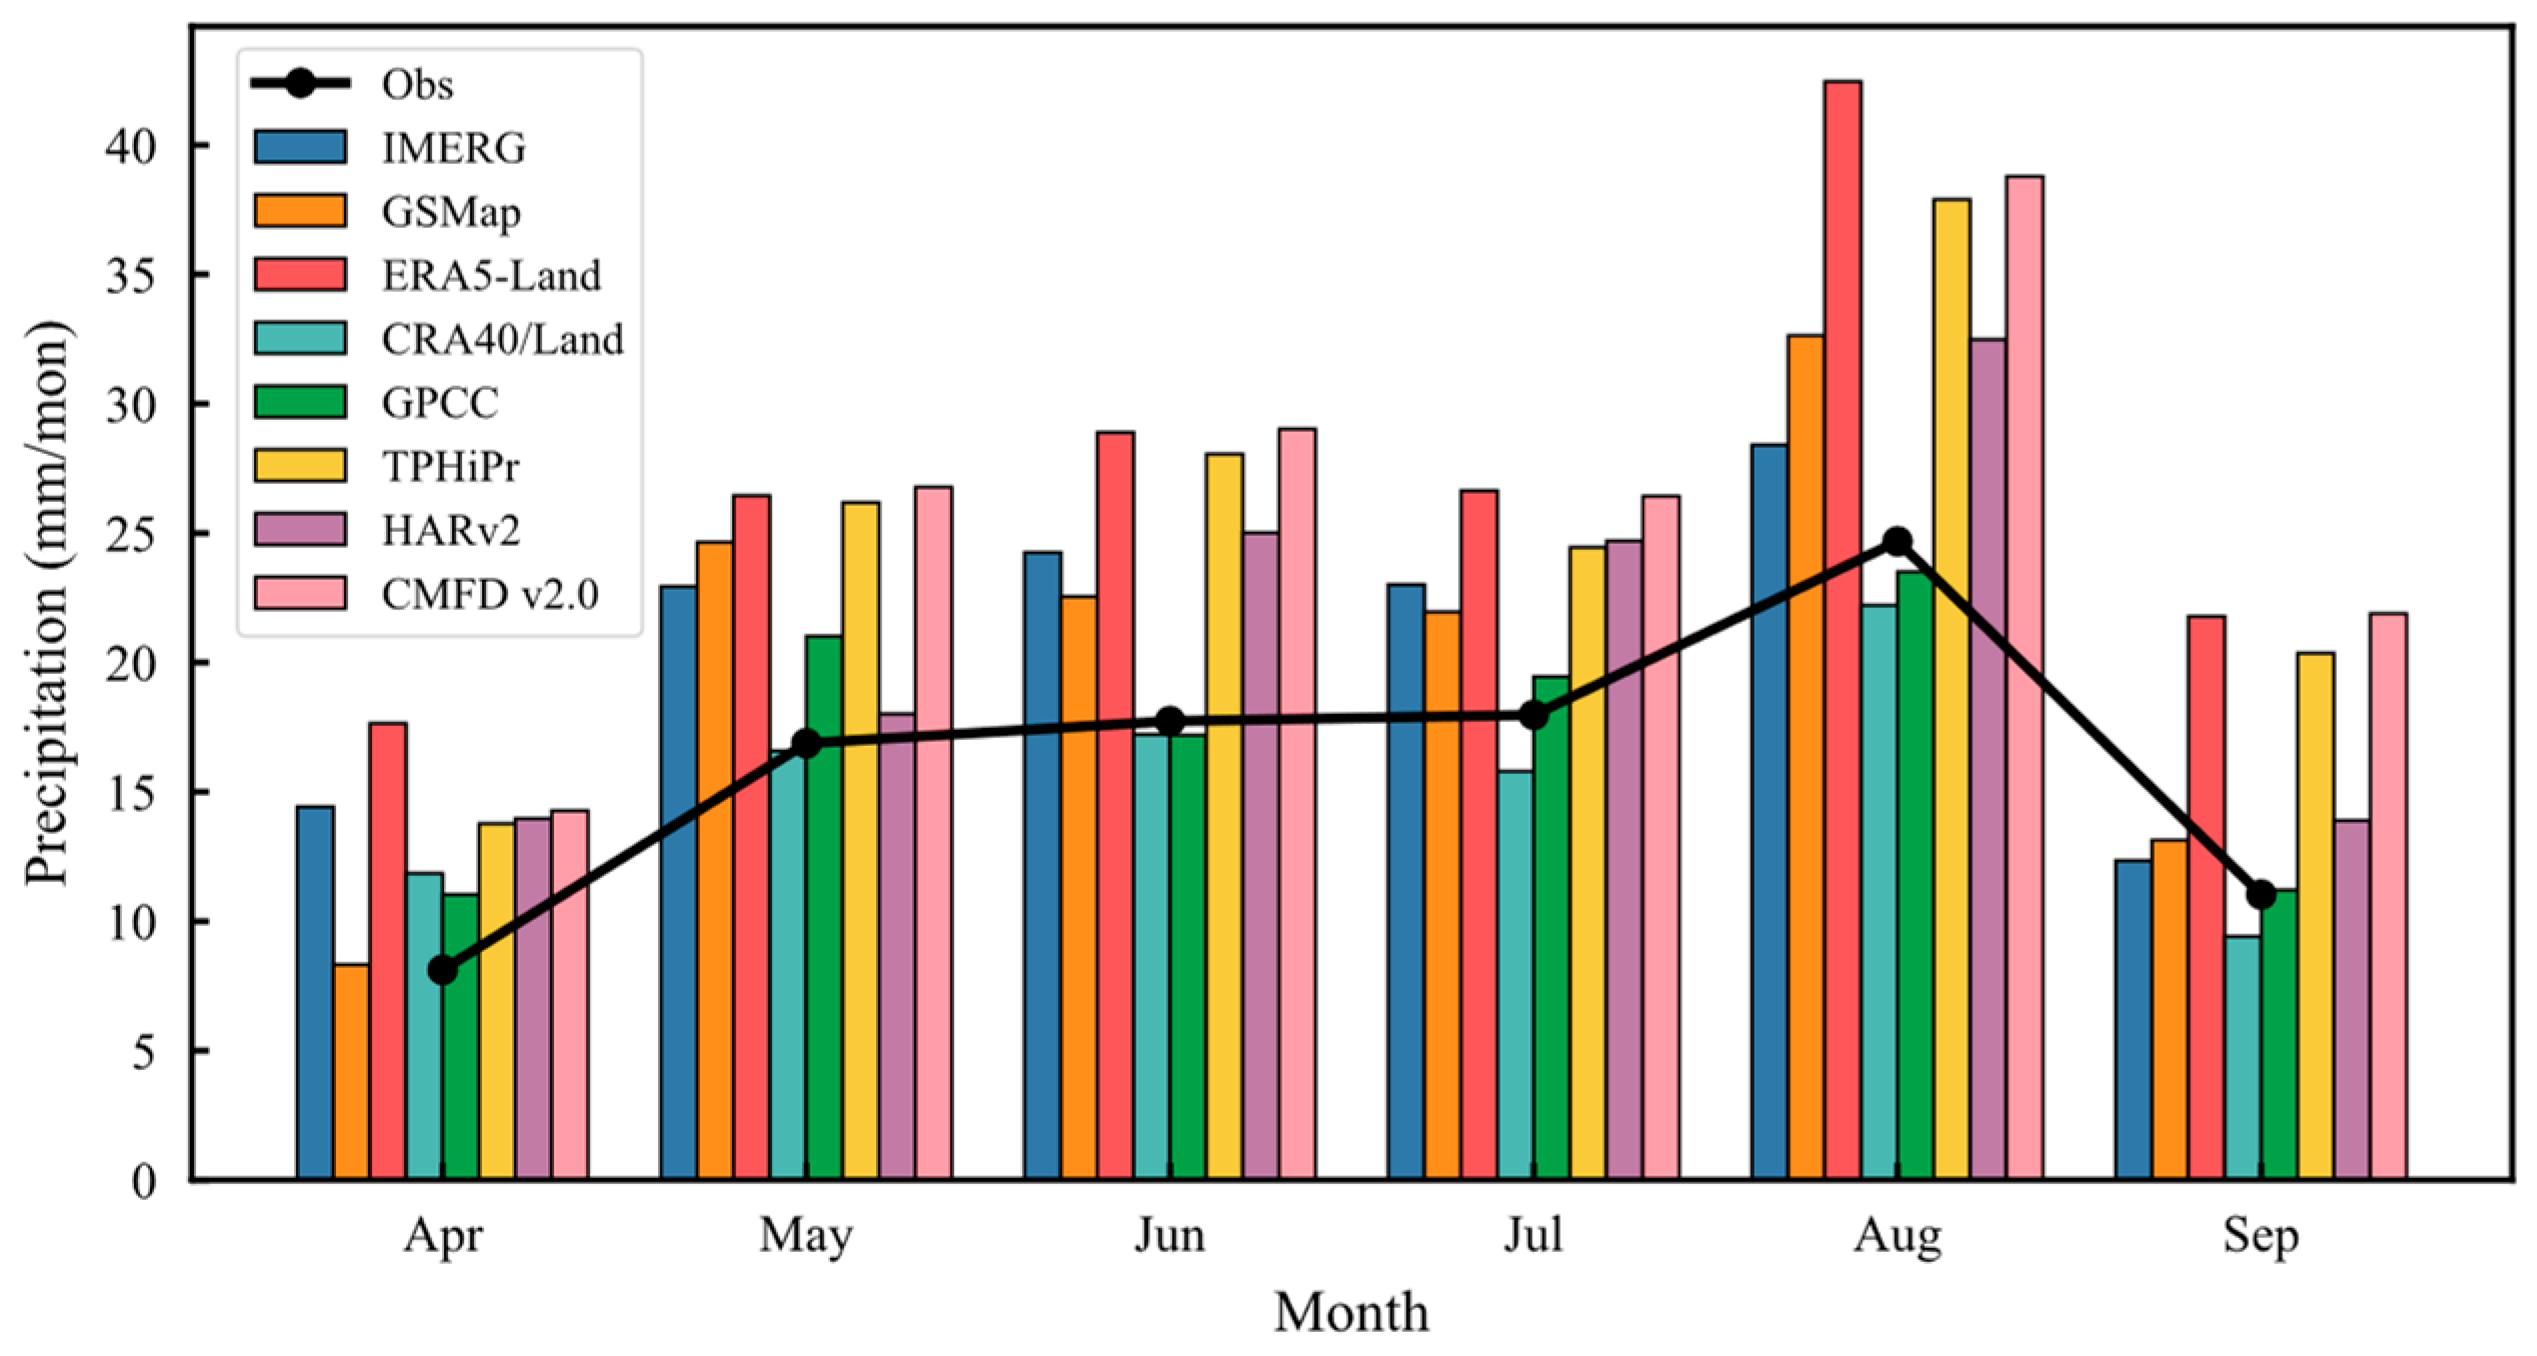
Figure 4 shows the distribution of monthly average precipitation in the warm season from eight datasets and observations. The observed warm-season precipitation in EPP is more in May–August, and the maximum value appears in August. Among these datasets, GPCC and CRA40/Land are the closest to observations, and ERA5-Land is higher in general. The three fused datasets are slightly higher than the observations, and the satellite data is higher from May to August.

3.2. Evaluation of the Precipitation Datasets

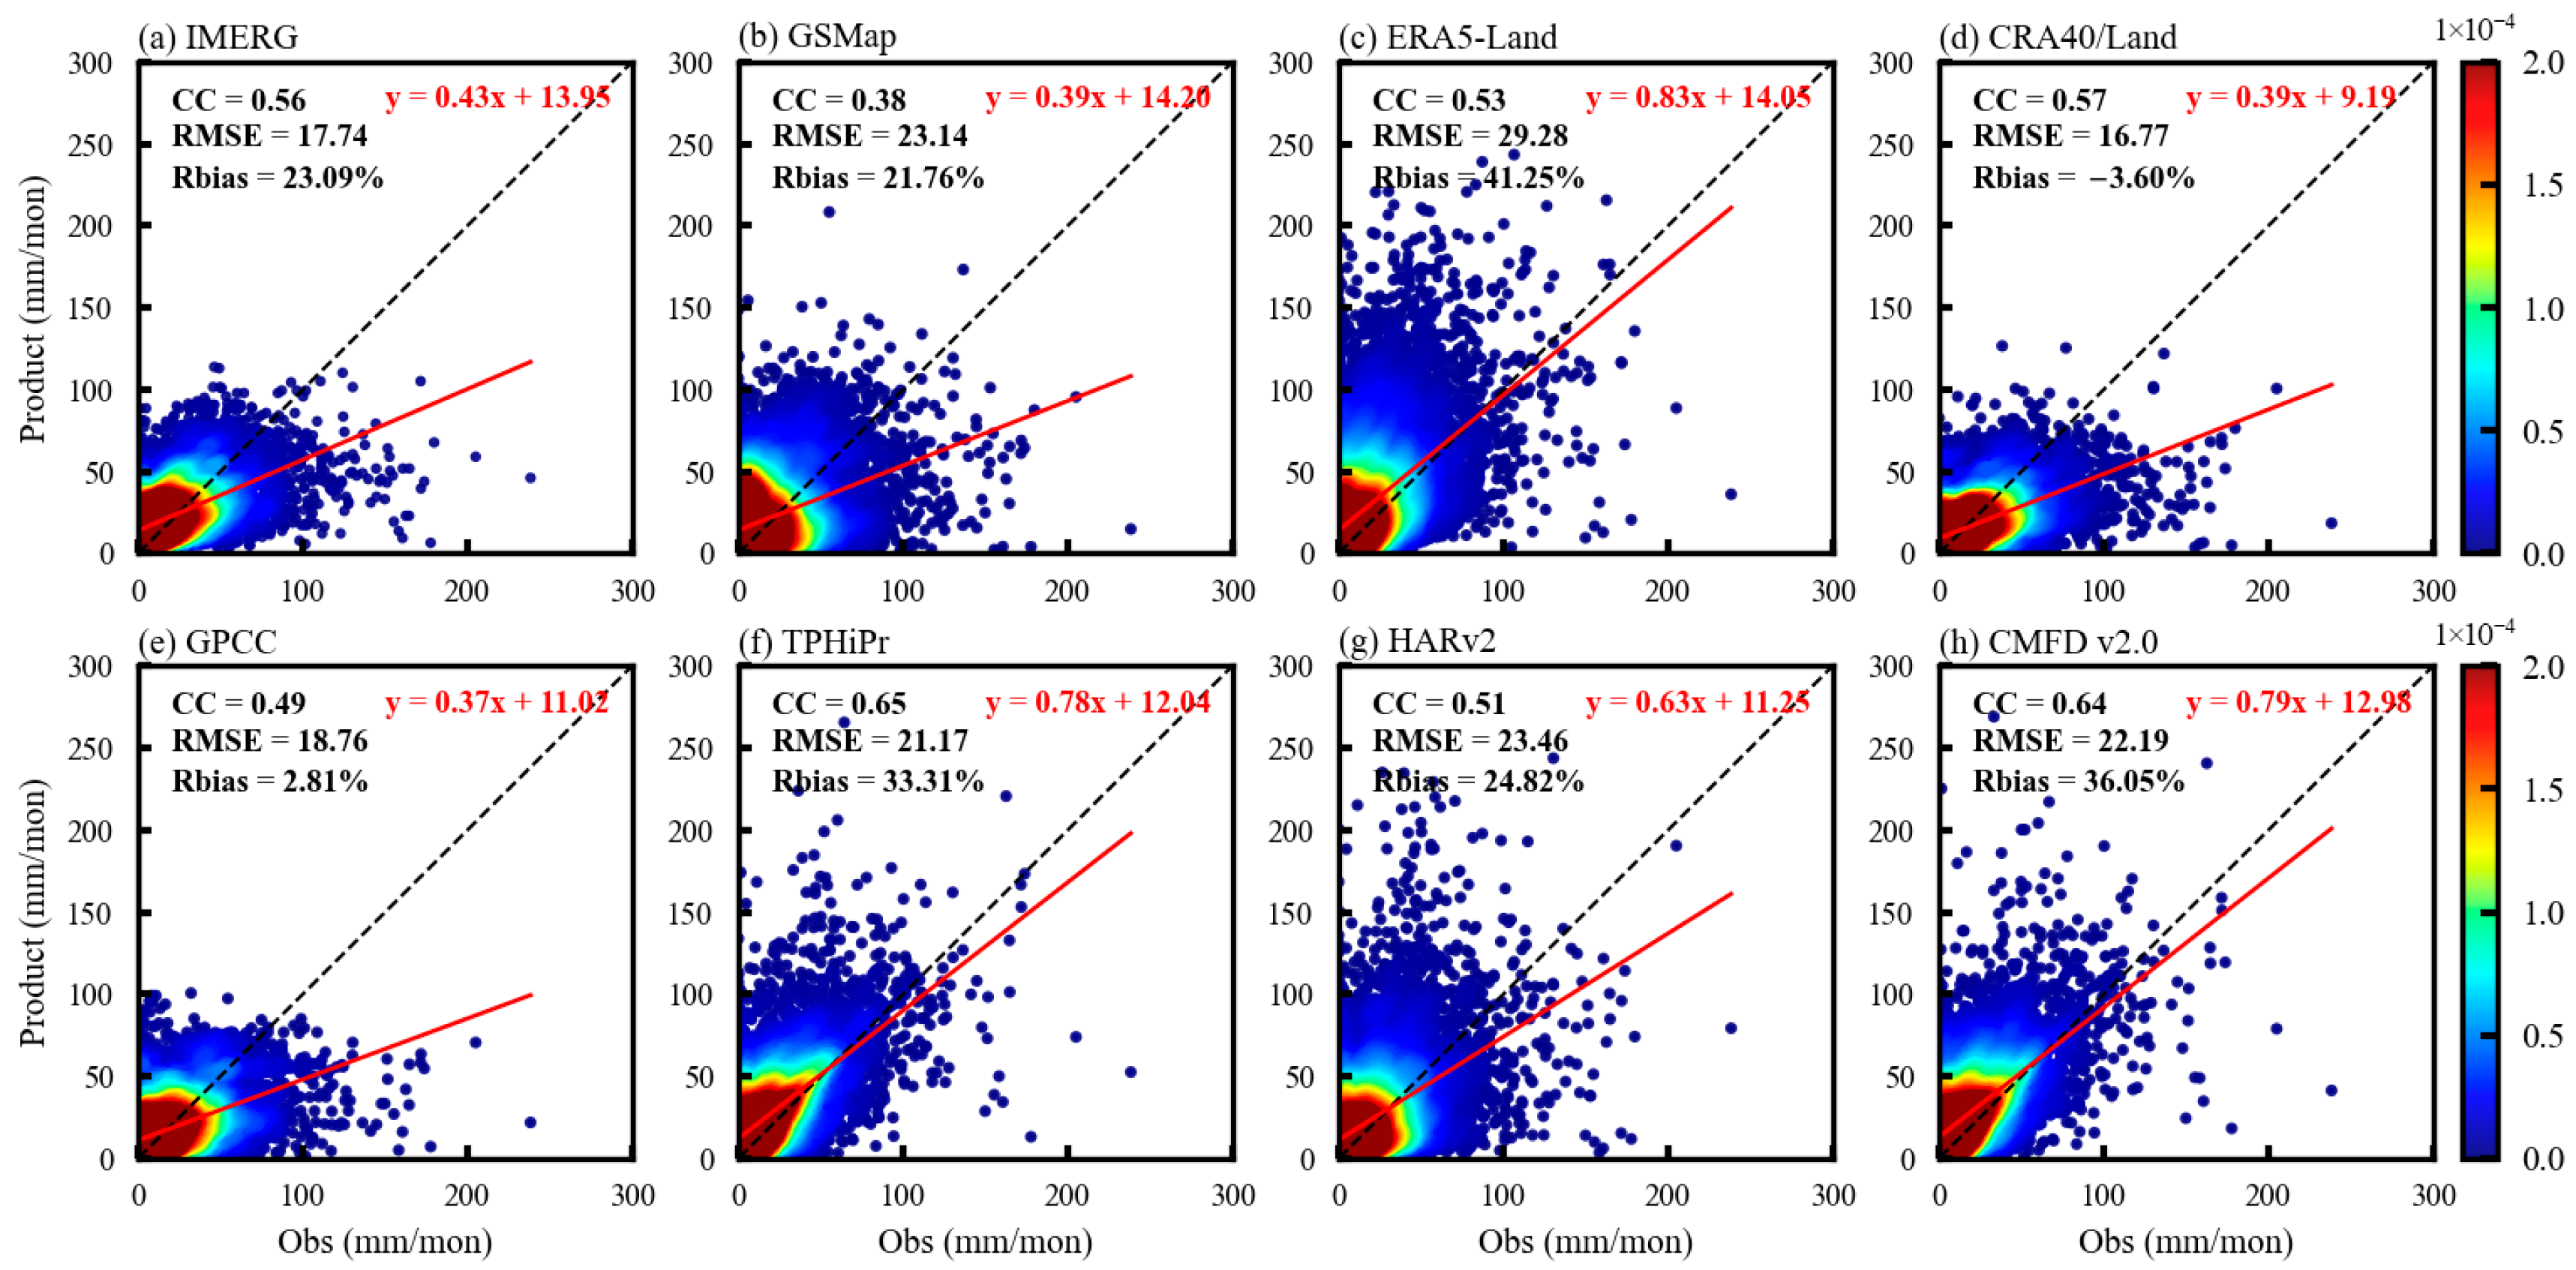
To evaluate the performance of the eight precipitation datasets in the EPP region, the scatter density of monthly precipitation from the datasets against observations is presented in Figure 5. Overall, IMERG, CRA40/Land, and GPCC datasets have relatively small errors (RMSE < 20.00 mm). CRA40/Land and GPCC show the smallest Rbias; GPCC has a slight overestimation of 2.81%, and CRA40/Land underestimates it by −3.60%. The other datasets overestimate the monthly precipitation by an Rbias ranging from 21% to 41%. Regarding the two satellite datasets (GSMaP and IMERG), their performance differences are not obvious, among which the CC of GSMaP is lower (0.38), while the CC of IMERG is higher (0.56), but the Rbias is larger (23.09%). For the reanalysis datasets (ERA5-Land and CRA40/Land), the overall performance of CRA40/Land is better than that of ERA5-Land, because the ERA5-Land dataset has the largest error and overestimates precipitation, with RMSE being 29.28 mm and Rbias 41.25%, which is consistent with the study by Zhou et al. [45]. GPCC outperforms the other datasets in both RMSE and Rbias, but its lower CC (0.49) indicates limitations in capturing precipitation variability. It is worth noting that the CC values of the three fused datasets (TPHiPr, HARv2 and CMFD v2.0) are relatively high, ranging from 0.51 to 0.65, among which the CC values of TPHiPr and CMFD v2.0 are the highest. This may be related to the inclusion of observation data in these datasets. However, influenced by ERA5 as the background field, much larger RMSE and Rbias values could be possible.
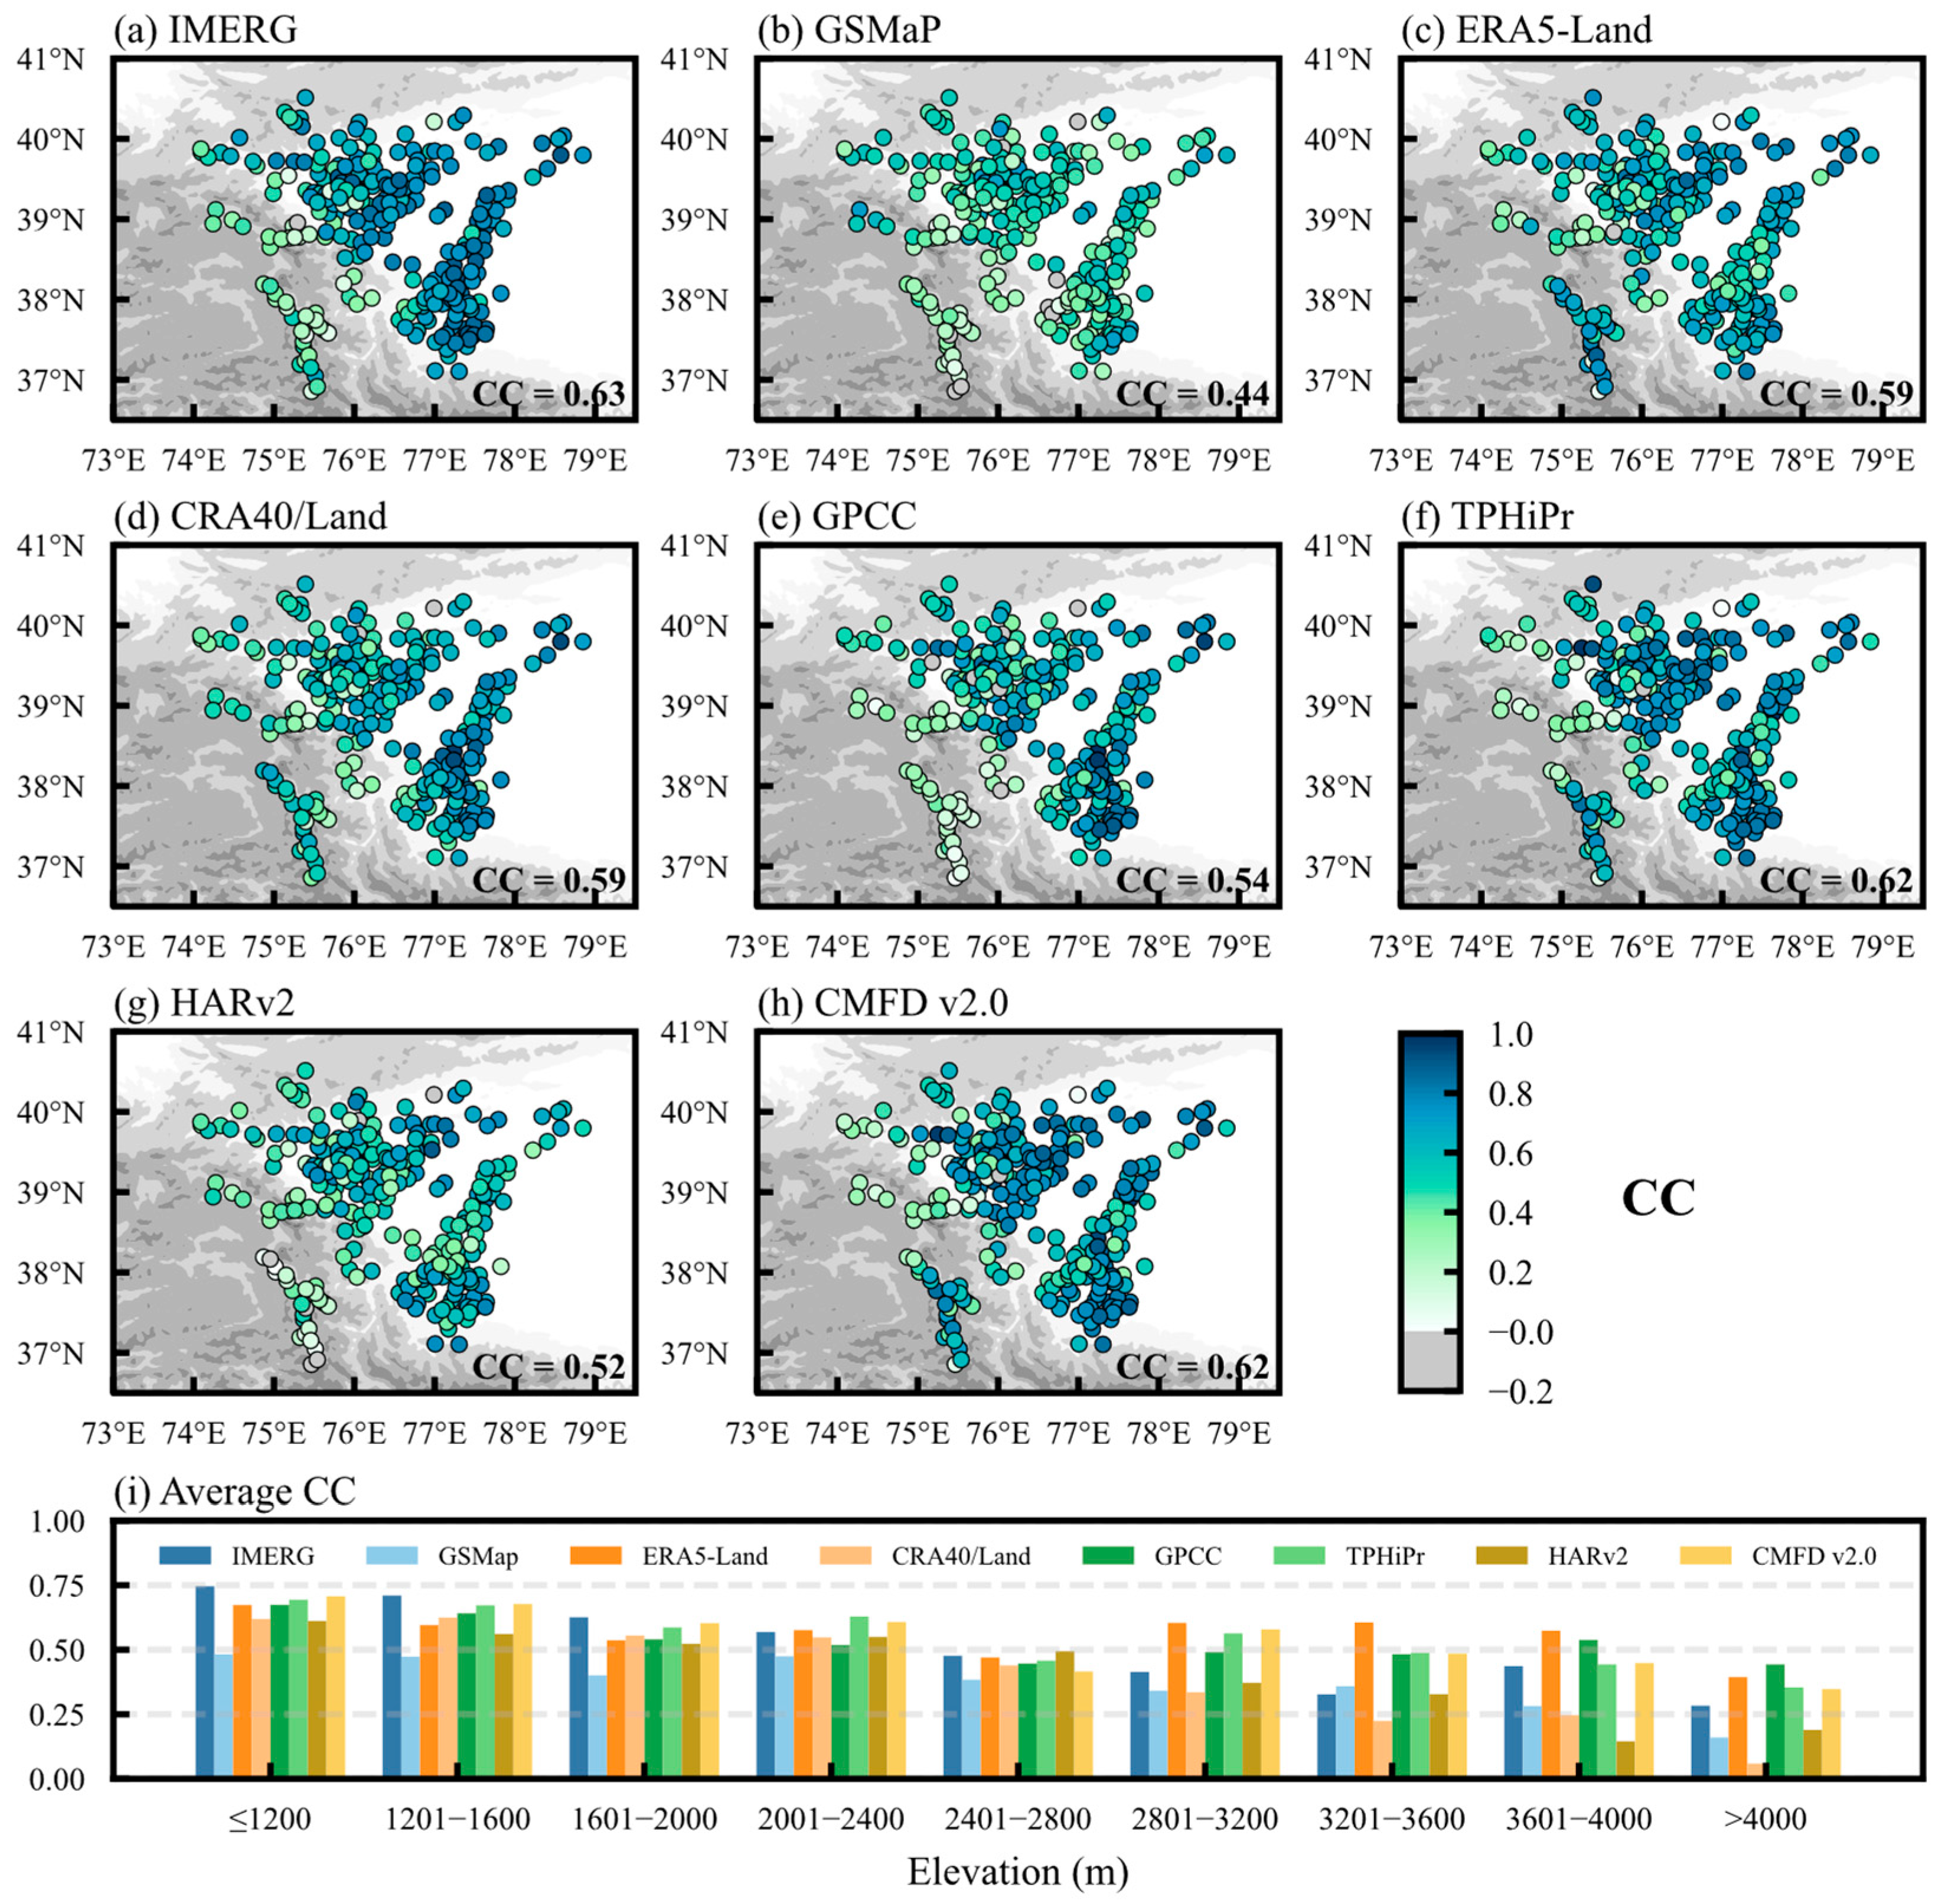
To reveal the spatial differences in different assessment metrics in the EPP region, the CC, RMSE, and Rbias between the monthly precipitation datasets based on meteorological stations and the observed data are calculated. It can be seen from the spatial distribution of the correlation coefficients between precipitation datasets and observed precipitation (Figure 6a–h) that all precipitation datasets show significant positive correlations at over 90% of the stations (p < 0.05) (Figure S1). IMERG, TPHiPr, and CMFD v2.0 show the best correlation (regional mean CC > 0.60), followed by the CCs of CRA40/Land, GPCC, and HARv2 (CC = 0.52–0.59), and the poorest coefficient correlation (CC = 0.44) is GSMaP. In terms of spatial distribution, the correlations between different precipitation datasets and observations vary in plains and mountainous areas. Except for GSMaP, all precipitation datasets have good positive correlations in plain areas, while in mountainous areas, most datasets have lower CCs, with only ERA5-Land showing a significant positive correlation. From the perspective of the variation in CC with elevation (Figure 6i and Figure S2a), most precipitation datasets have good correlations below 2400 m (CC ≈ 0.50), among which IMERG performs the best (CC > 0.50). Above 2400 m, the CCs of all datasets start to decrease, but ERA5-Land, CRA40/Land, TPHiPr, and CMFD v2.0 exhibit CC recovery to >0.40 at ultra-high elevations (>2800 m), still inferior to their low-elevation performance, which infers that the above-mentioned precipitation datasets have poor simulation capabilities in the mid-mountain zone (2400–2800 m).
The spatial distribution of RMSE (Figure 7a–h) indicates that CRA40/Land, IMERG, and GPCC have relatively low mean errors (regional mean < 18 mm), of which the RMSE of CRA40/Land is 15.62 mm. This indicates that CRA40/Land monthly precipitation simulations are closest to observations. In contrast, the mean errors of ERA5-Land, HARv2, and GSMaP are relatively larger, with the RMSE of ERA5-Land reaching as high as 25.55 mm. Spatially, the RMSE values are generally low (<15.00 mm) in the plain area, while increasing significantly in the mid-mountain zones, particularly for ERA5-Land and HARv2. The RMSE variation with elevation (Figure 7i and Figure S2b) further reveals that most datasets have large errors in the mid-mountain zone from 2400 m to 2800 m. Although errors slightly decrease in high-altitude regions (>2800 m), they remain higher compared to plains, likely attributable to precipitation mechanisms under complex topographic conditions at high elevations.
For Rbias (Figure 8a–h), CRA40/Land and GPCC show smaller Rbias values in the EPP region (regional mean Rbias < 50%), while the Rbias of ERA5-Land is the largest (>95%). Spatially, all datasets have obvious spatial variability, with overestimation in the plain areas (Rbias > 0%). In contrast, mountainous regions show divergent patterns: ERA5-Land, TPHiPr, and CMFD v2.0 overestimate precipitation (Rbias > 0%) in the mid-mountain zones, while the rest of the datasets underestimate precipitation (Rbias < 0%). In the alpine zone, except for two satellite precipitation datasets, the biases of other datasets are positive at most stations, especially ERA5-Land, which exhibits overestimations (Rbias > 500%). Combined with the variation characteristics of Rbias with elevation (Figure 8i and Figure S2c), it is found that the Rbias values of ERA5-Land, TPHiPr, HARv2, and CMFD v2.0 vary significantly with elevation, especially within the range of 2400–4000 m; these datasets overestimate precipitation significantly (Rbias > 100%). The remaining datasets do not change significantly with elevation in their Rbias values, showing relatively smaller biases in general. Figure S2c shows that all datasets have negative Rbias values of precipitation in 2000–2800 m, indicating that precipitation in the mid-mountain zone is underestimated.
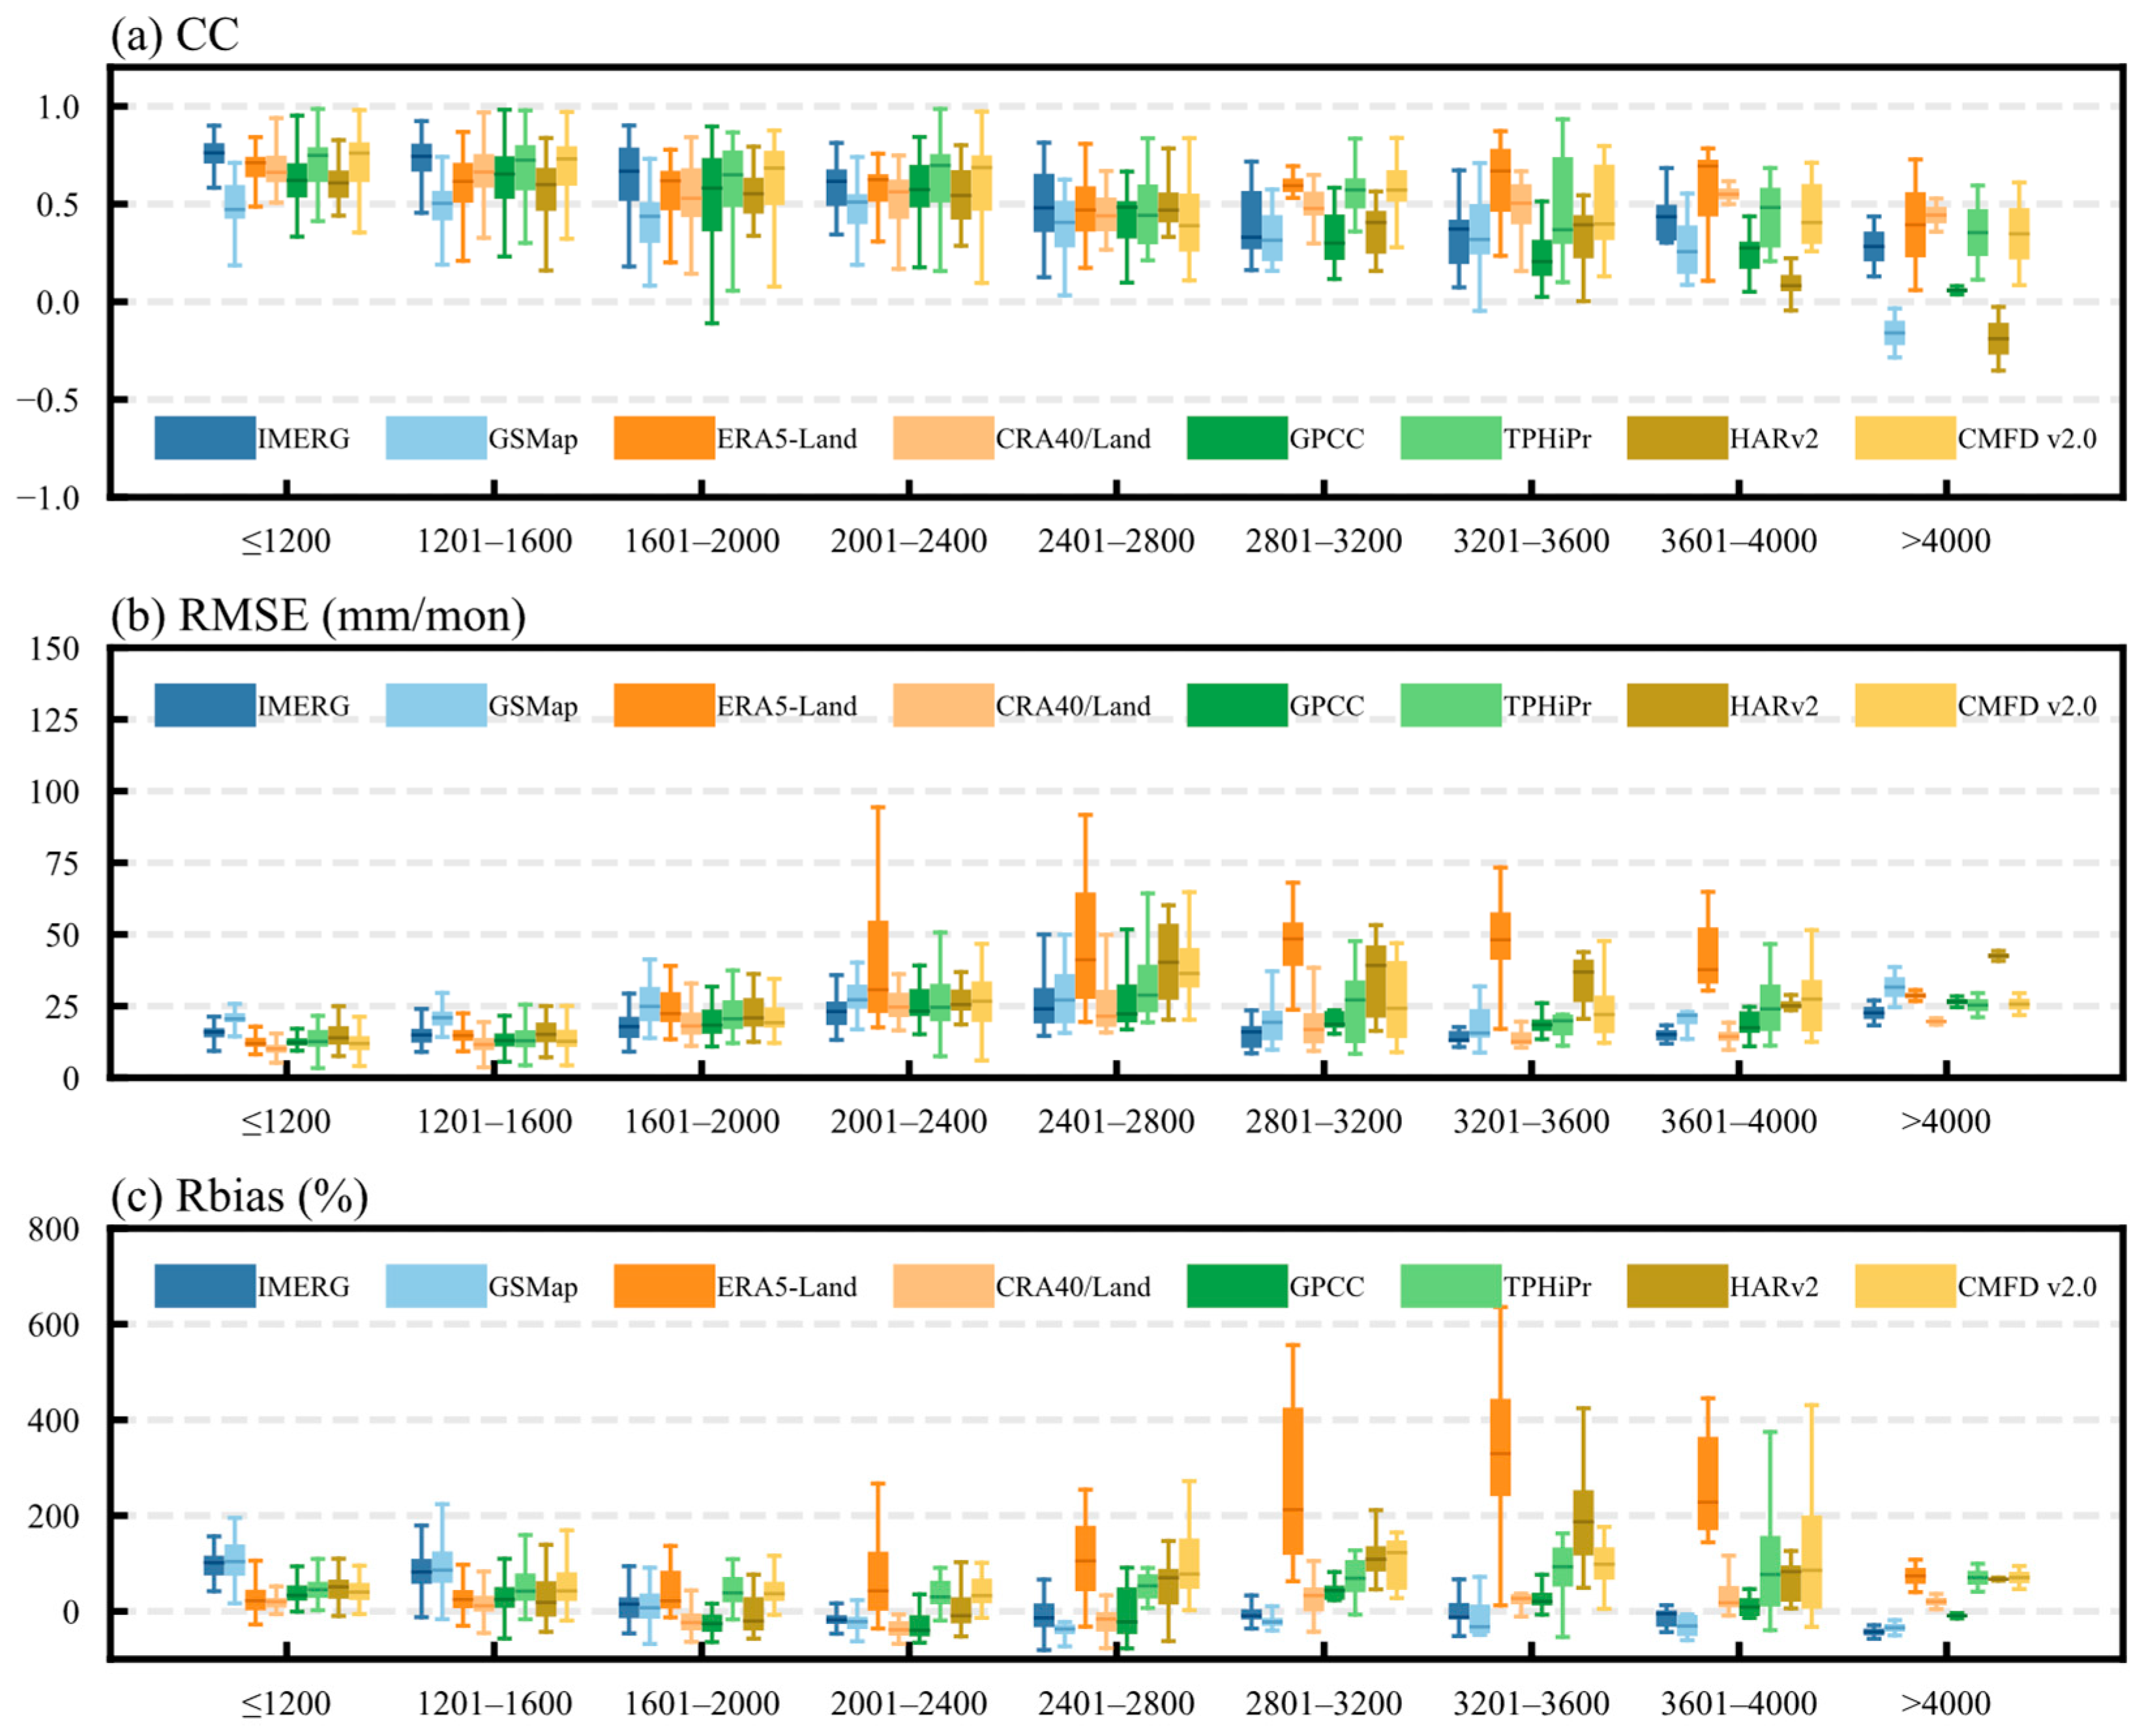
Figure 9 shows the statistical indicators of the eight precipitation datasets in different elevation ranges. TPHiPr and CMFD v2.0 datasets have a good CC with observed precipitation at all elevation gradients (Figure 9a), with IMERG having a high correlation at low elevations and ERA5-Land at high elevations. When it is beyond 4000 m, GSMaP and HARv2 show negative correlations with the observed precipitation. In terms of RMSE (Figure 9b), IMERG, CRA40/Land, and GPCC all demonstrate good performance at all elevation gradients (RMSE < 50.00 mm), though RMSE in the mid-elevation zone (2400–2800 m) is generally higher than in low-altitude areas. For Rbias (Figure 9c), ERA5-Land, TPHiPr, HARv2, and CMFD v2.0 maintain overestimation above 2000 m, while other datasets underestimate precipitation (the median of Rbias < 0%) in the 2000–2800 m range. This elevation-dependent Rbias likely stems from inadequate parameterization of orographic cloud microphysical processes.
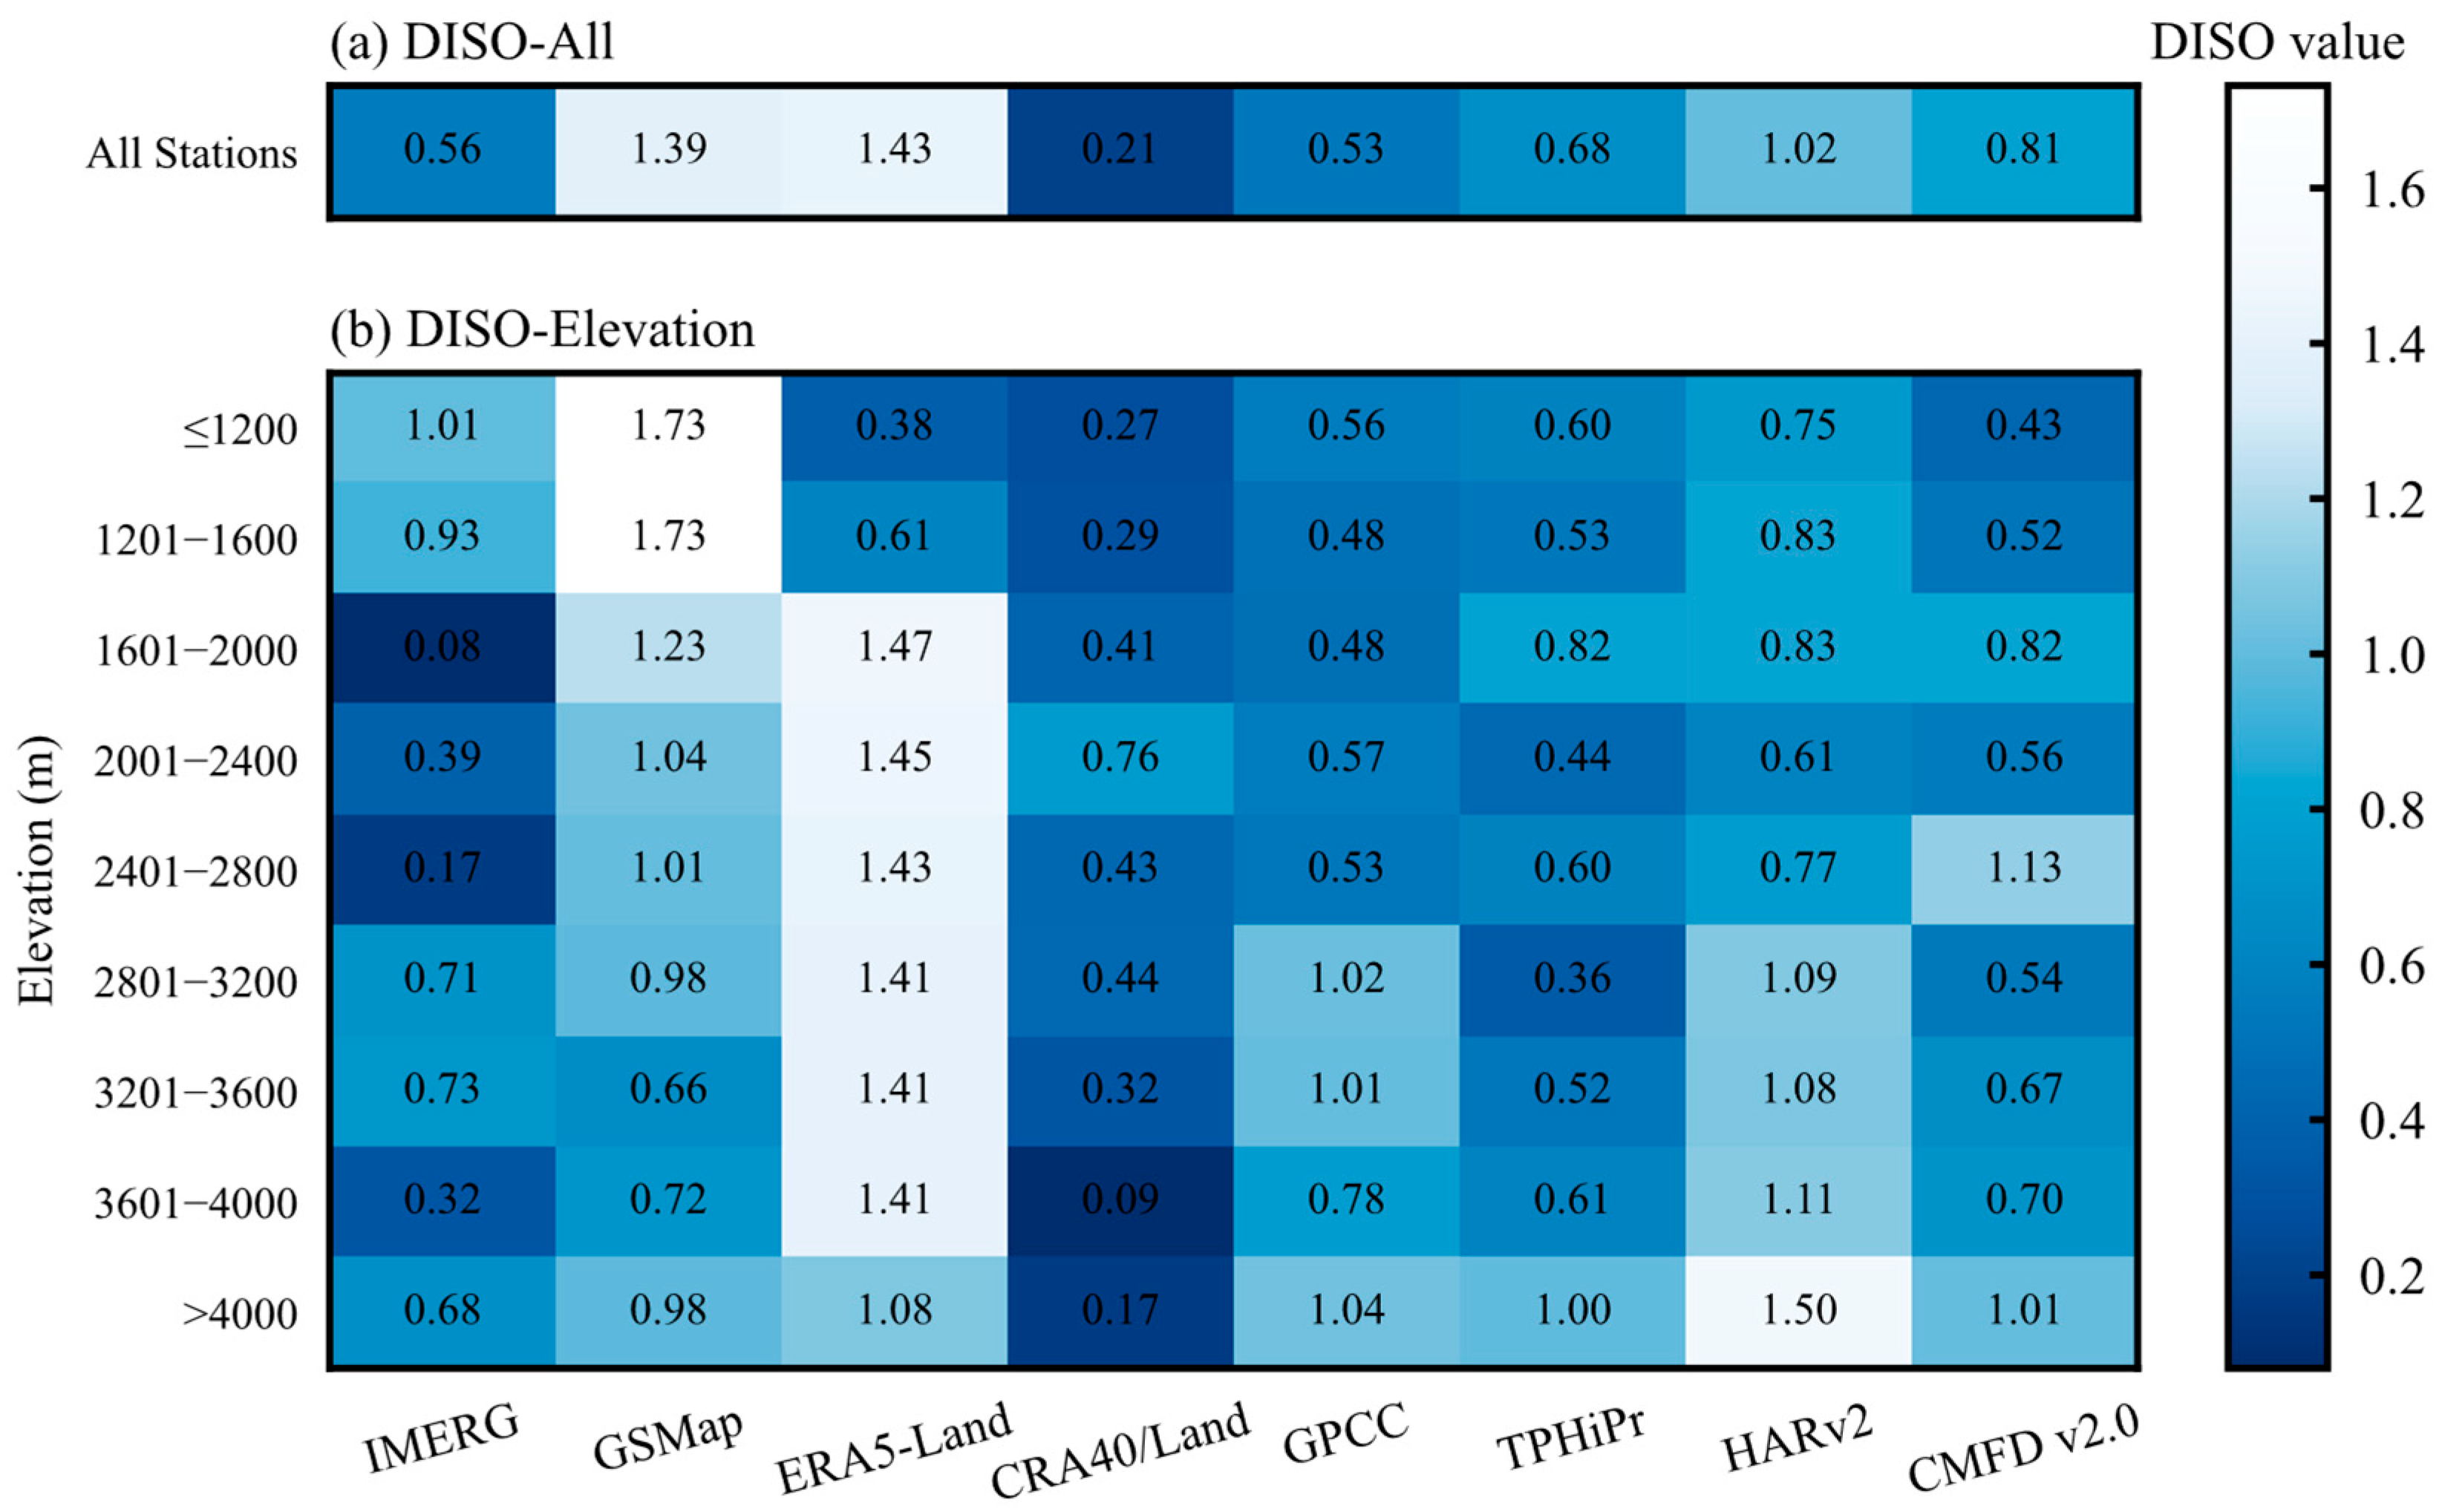
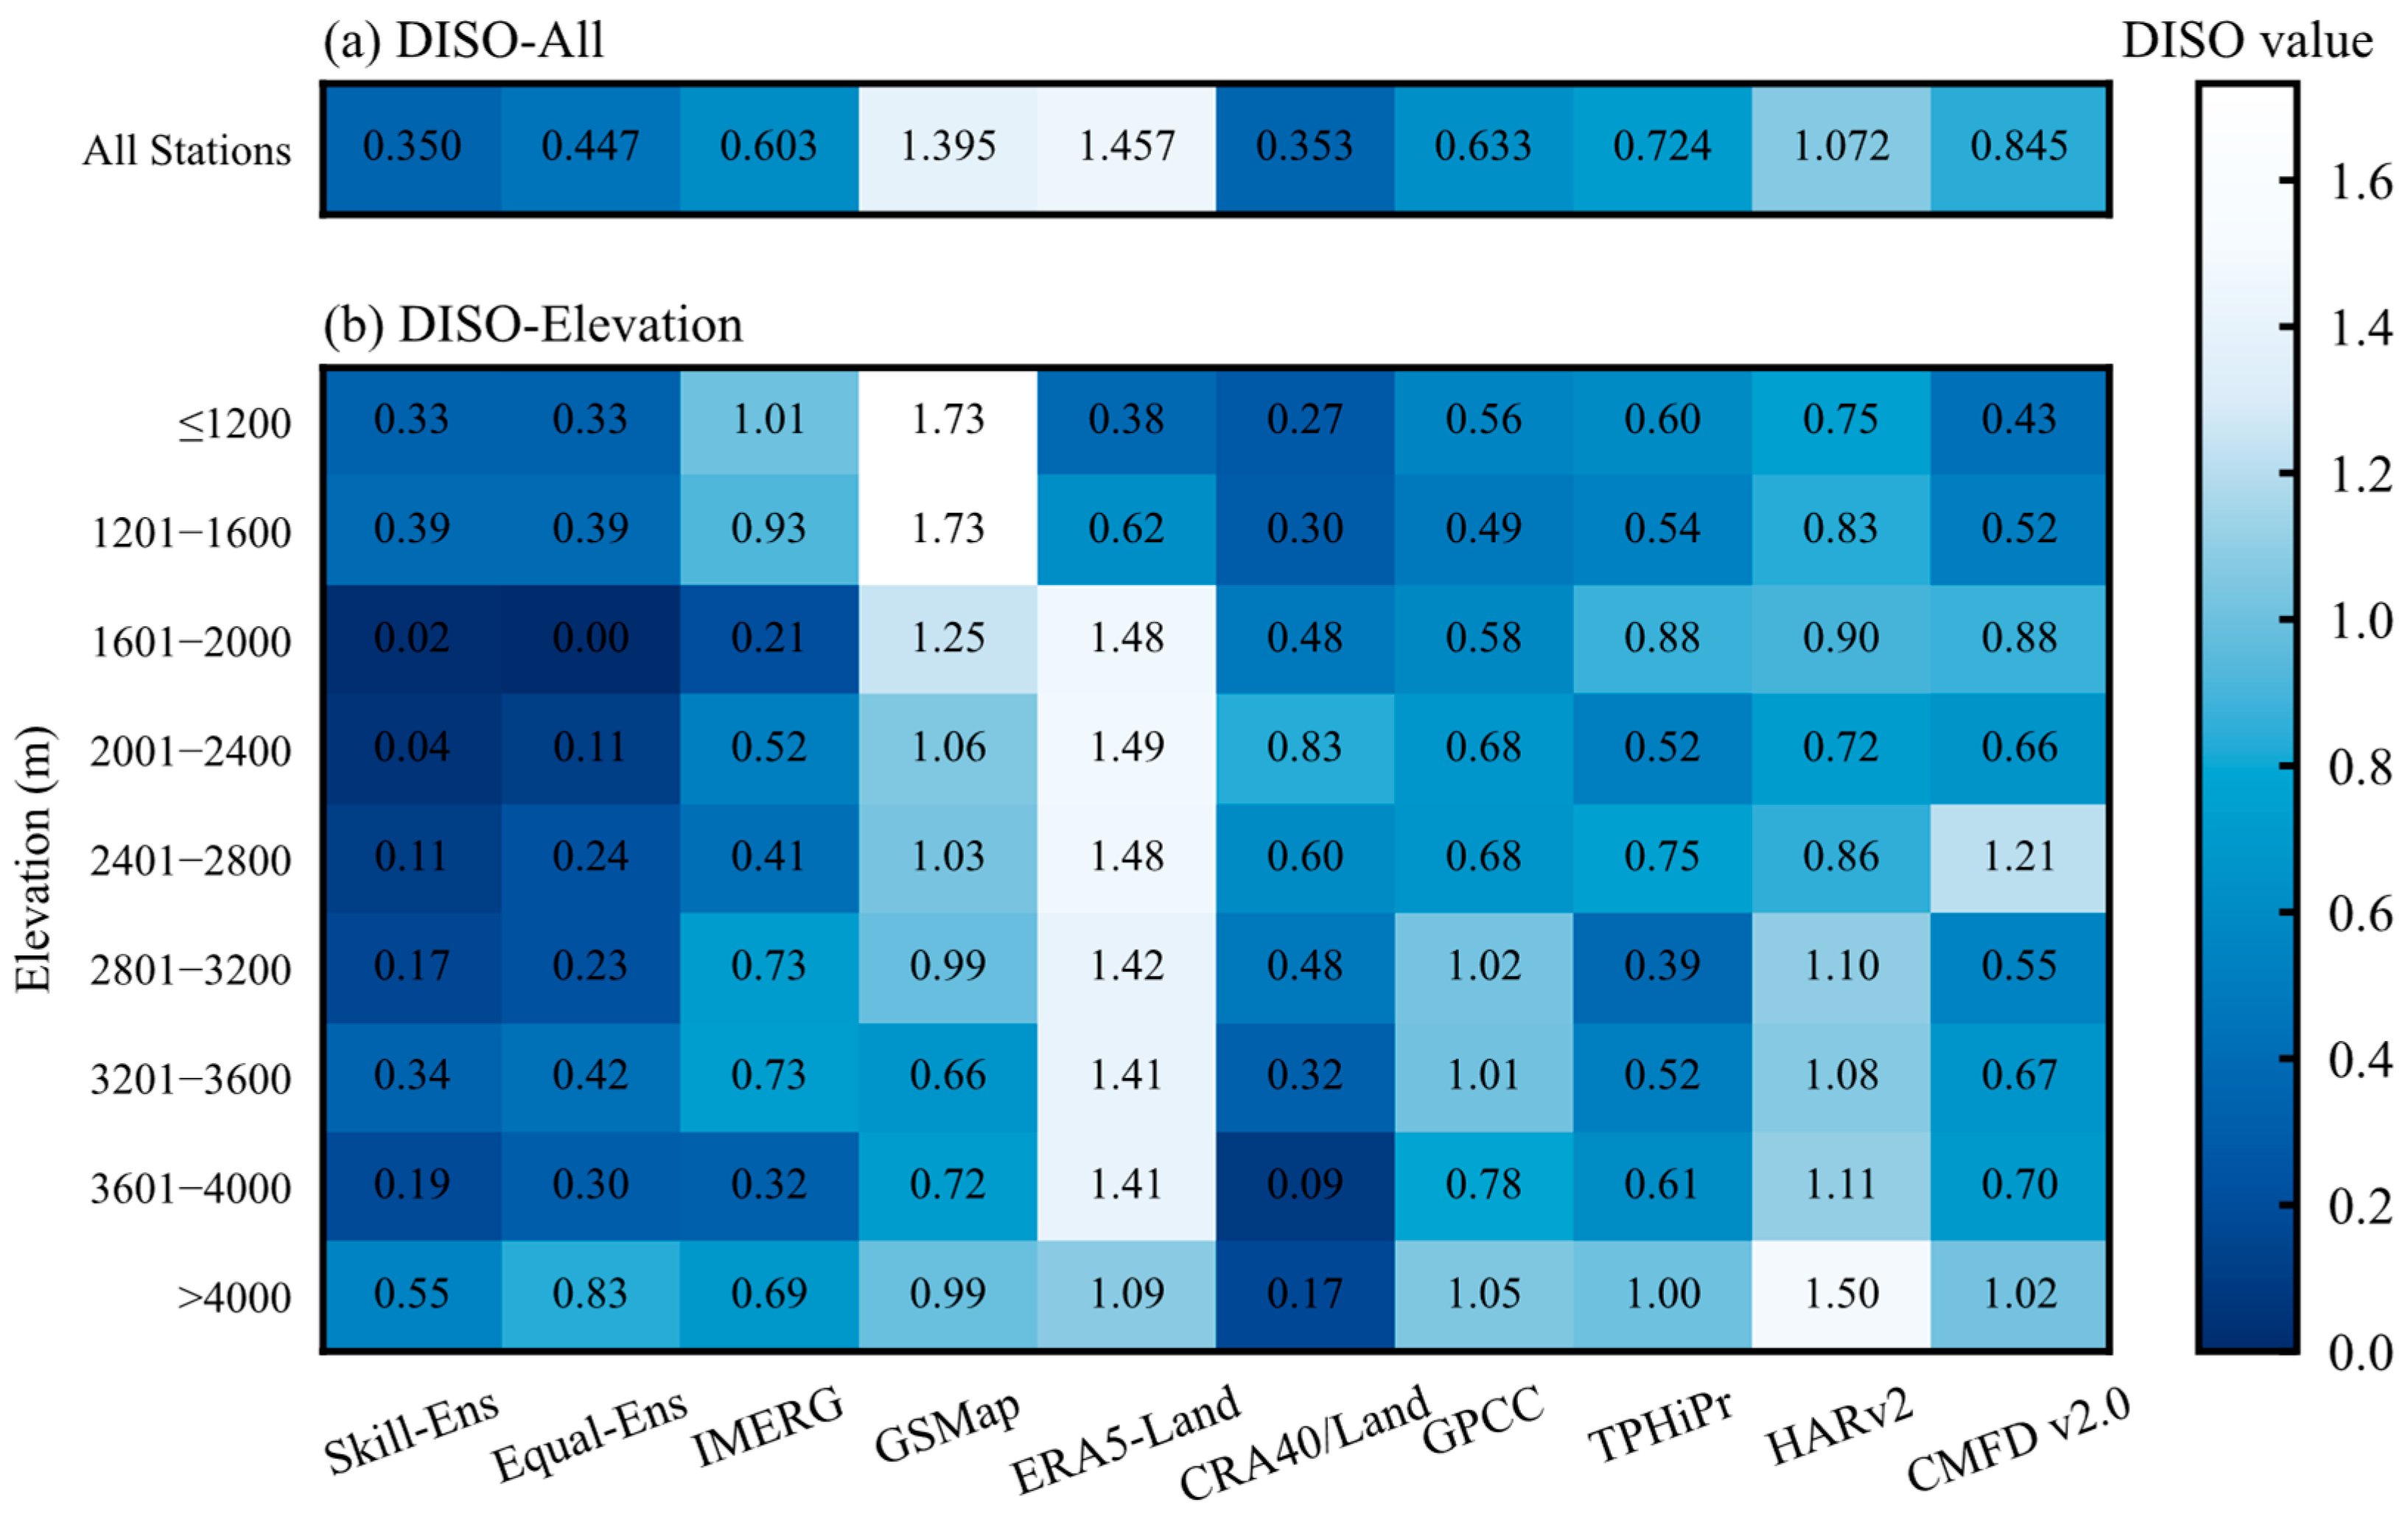
Figure 10 presents the DISO index of eight precipitation datasets calculated based on meteorological stations, covering the entire study area and different elevation intervals. For the entire EPP region (Figure 10a), the comprehensive performance of the datasets is ranked as follows: CRA40/Land > GPCC > IMERG > TPHiPr > CMFD v2.0 > HARv2 > GSMaP > ERA5-Land, among which CRA40/Land (0.21), GPCC (0.53), and IMERG (0.56) perform better than other datasets, with CRA40/Land having the best overall performance. GSMaP (1.39) and ERA5-Land (1.43) perform the worst, which is related to the fact that satellite datasets are prone to interference and increased errors when there are clouds. Moreover, ERA5-Land has a significant systematic overestimation in high-elevation areas. Among the three fused precipitation datasets, TPHiPr (0.68) performs the best, and the use of ERA5 as the background field makes these fused datasets have a systematic overestimation [25].
The precipitation datasets show different advantages in different elevation regions (Figure 10b). Among the satellite datasets, IMERG performs relatively well, with the best performance in the range of 1600 to 2800 m, and relatively good performance in high-elevation areas. However, the overall performance of GSMaP is poor. Of the reanalysis datasets, CRA40/Land performs relatively well, but is slightly inferior at elevations ranging from 2000 to 2400 m, while the comprehensive performance of the ERA5-Land dataset is poor at middle and high elevations. Among the three fused datasets, TPHiPr has the best relative performance, with a better performance within 2000–4000 m. CMFD v2.0 comes second, but it is the worst at the elevation of 2400–2800 m. HARv2 has a better performance below 2800 m. Therefore, when using precipitation datasets, it is necessary to comprehensively consider the performance of the datasets at different elevations to select a more suitable precipitation dataset.

3.3. Skill-Weighted Ensemble Mean of Precipitation Datasets

According to the above comprehensive evaluation and analysis, different precipitation datasets have their own advantages and disadvantages in different aspects, and there is no absolute optimal precipitation dataset. Considering the differing performances of multi-source precipitation datasets across evaluation metrics, giving them equal weights in constructing the ensemble mean dataset is not reasonable. The performance of individual precipitation datasets in EPP should be considered, and those with datasets performing poorly will be down-weighted. Furthermore, the DISO index employed in this study integrates multiple evaluation metrics (CC, RMSE, Rbias) into a single overall performance measure, providing a more comprehensive assessment than any single metric (e.g., RMSE alone). This is particularly advantageous in complex terrain–atmosphere interactions like the EPP, where the performance of datasets can vary across different evaluation metrics. Using DISO as a skill metric for weighting ensures the ensemble mean datasets that perform well across all these aspects. For this reason, based on the skill-weighted ensemble mean method [40,41,42] and taking the average of DISO values of eight precipitation datasets as neighborhood radius parameters Dq, we in this study reconstruct a skill-weighted ensemble mean dataset (Skill-Ens) and simultaneously construct an equally weighted ensemble mean dataset (Equal-Ens) for comparative analysis (for details of the methods, see Section 2.4). The skill weightings w q of all precipitation datasets are displayed in Table 3, which show that CRA40/Land has the highest w q of 0.27115, followed by GPCC and IMERG, with w q being 0.19046 and 0.18229, respectively. The w q of GSMaP and ERA5-Land ranks last, close to 0.01.
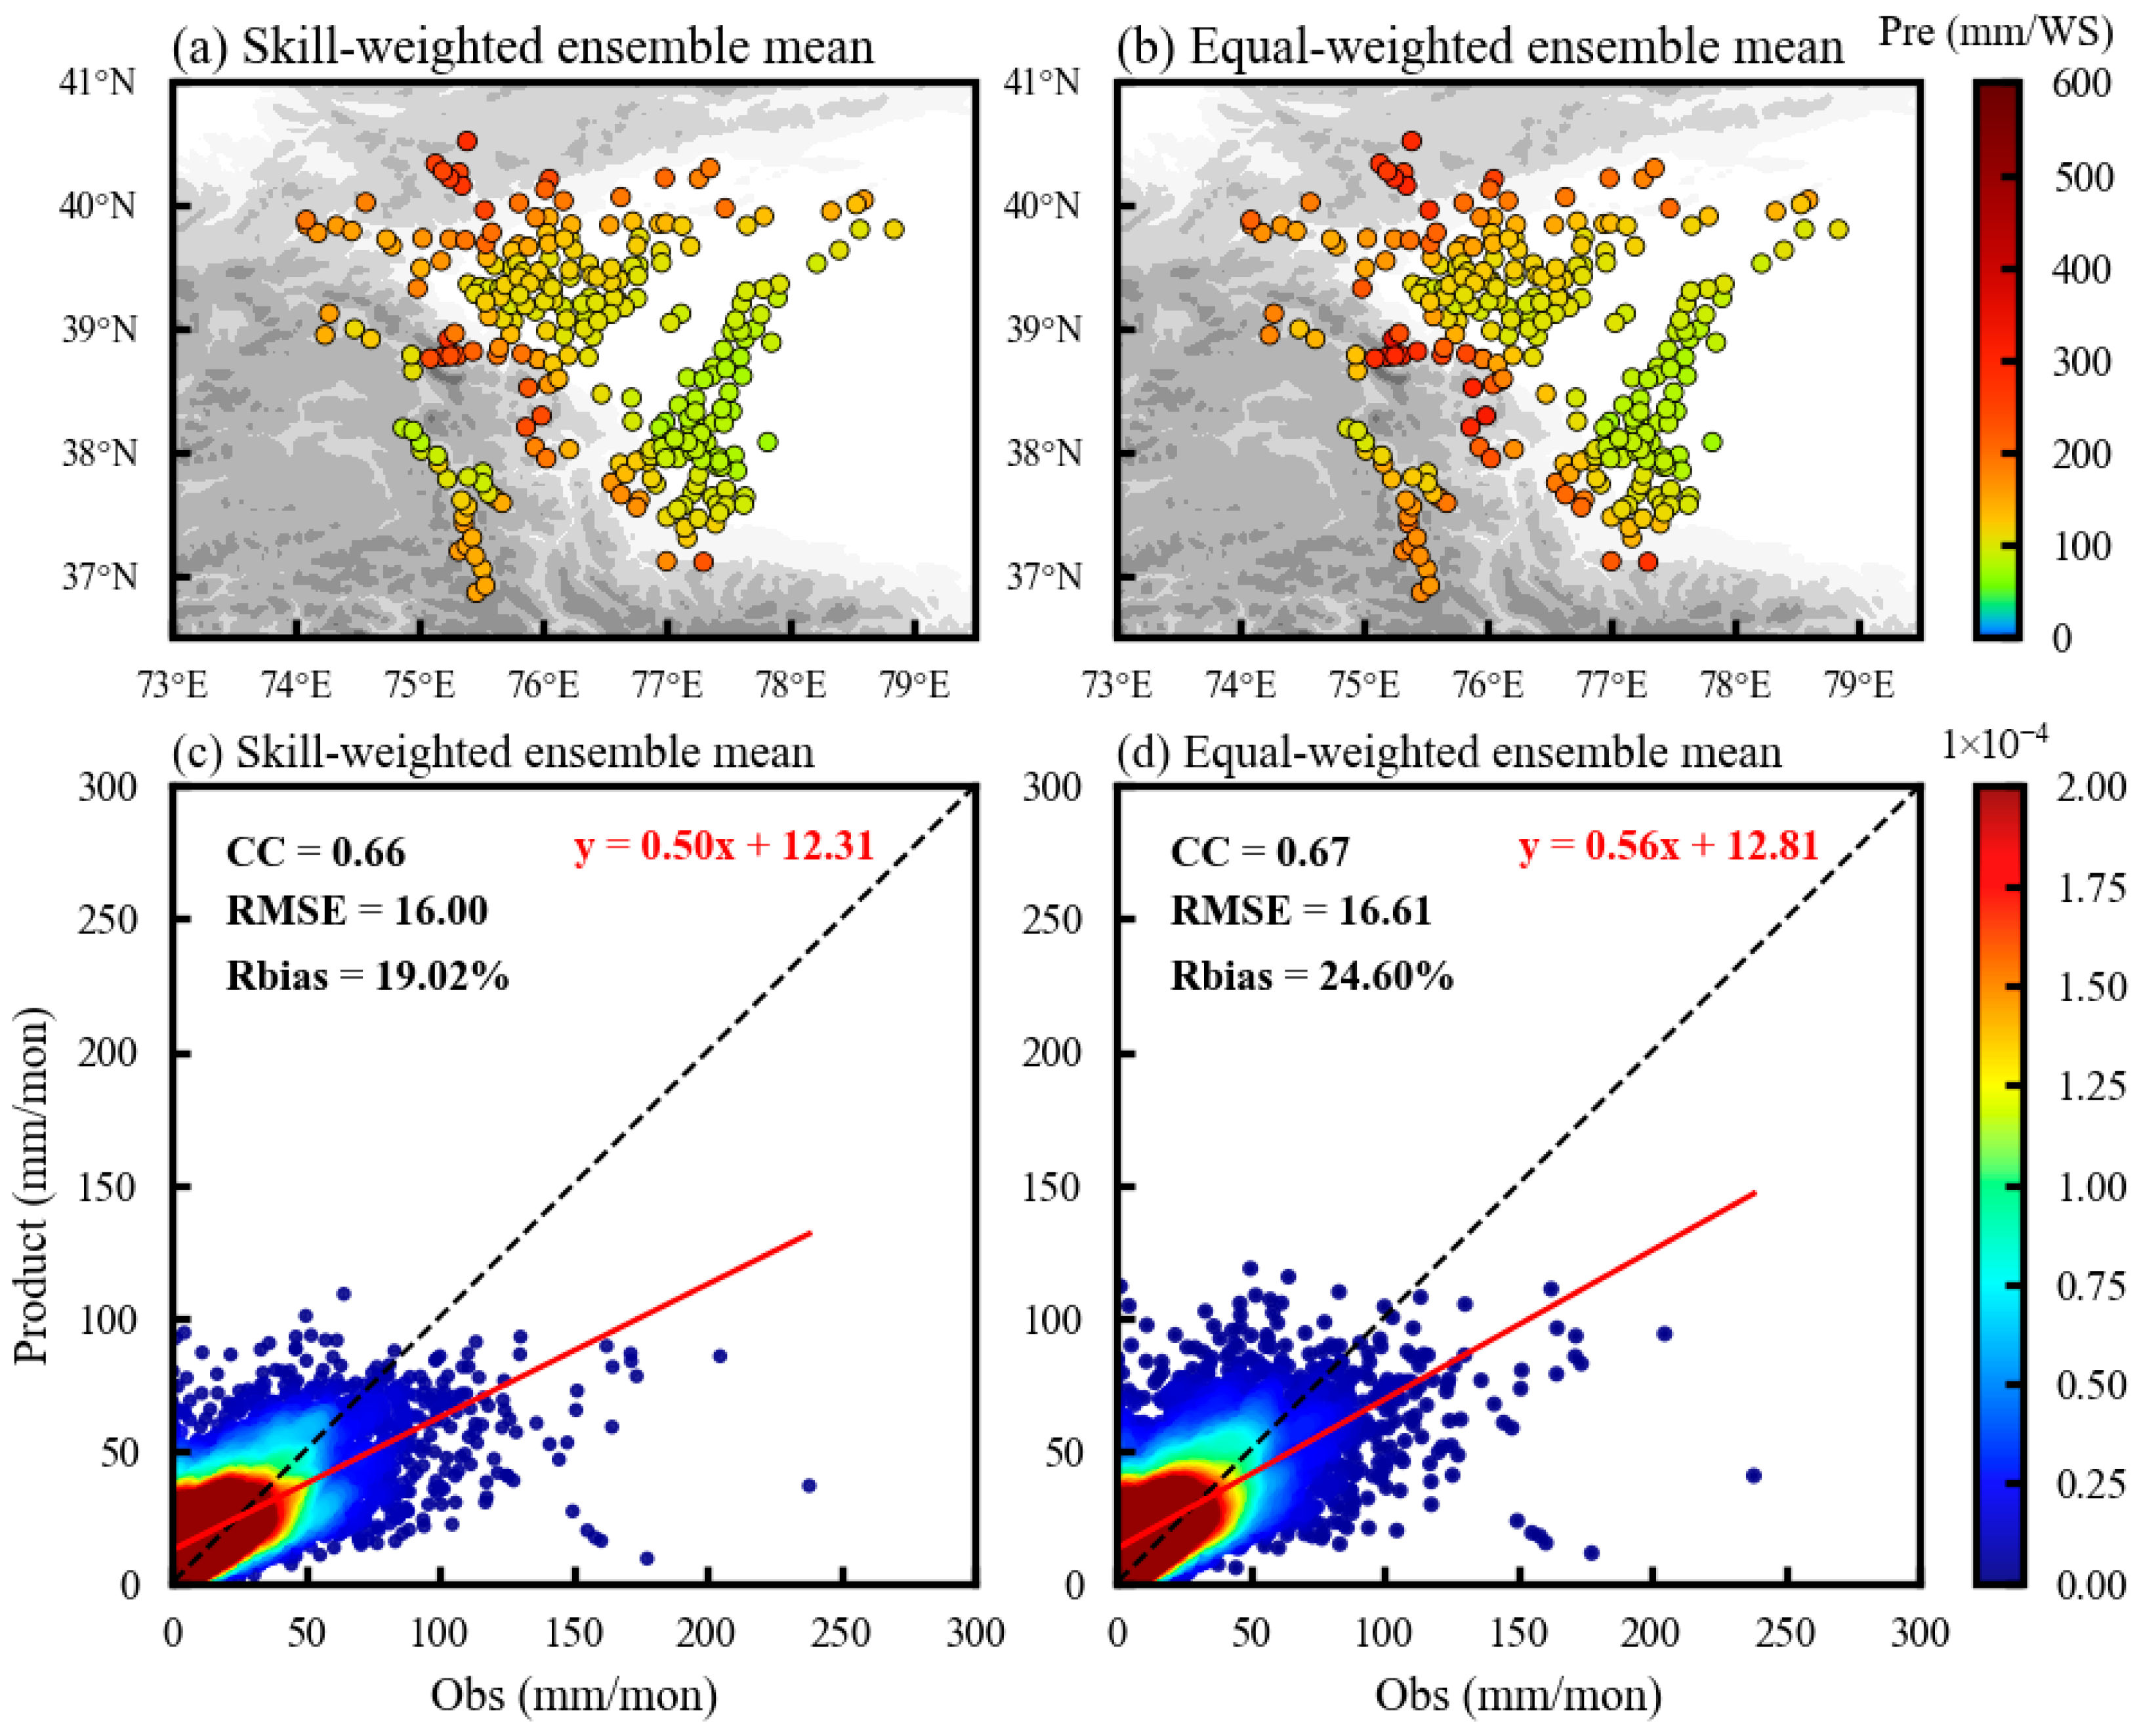
Seen from the multi-year average warm-season precipitation in Skill-Ens and Equal-Ens (Figure 11a,b), the spatial distribution of the two ensemble mean precipitation datasets is similar to the observations, and the high-value areas are concentrated in the mid-mountain zone. The CC and RMSE values of the two ensemble mean datasets are superior to those of the eight individual precipitation datasets, showing much higher CC values (0.66, 0.67) and much lower RMSE values (16.00 mm, 16.61 mm), and the Rbias also outperforms most datasets. In particular, the Rbias value of Skill-Ens is relatively even lower, being 19.02%. The ensemble mean datasets have higher precision and accuracy than individual precipitation datasets.
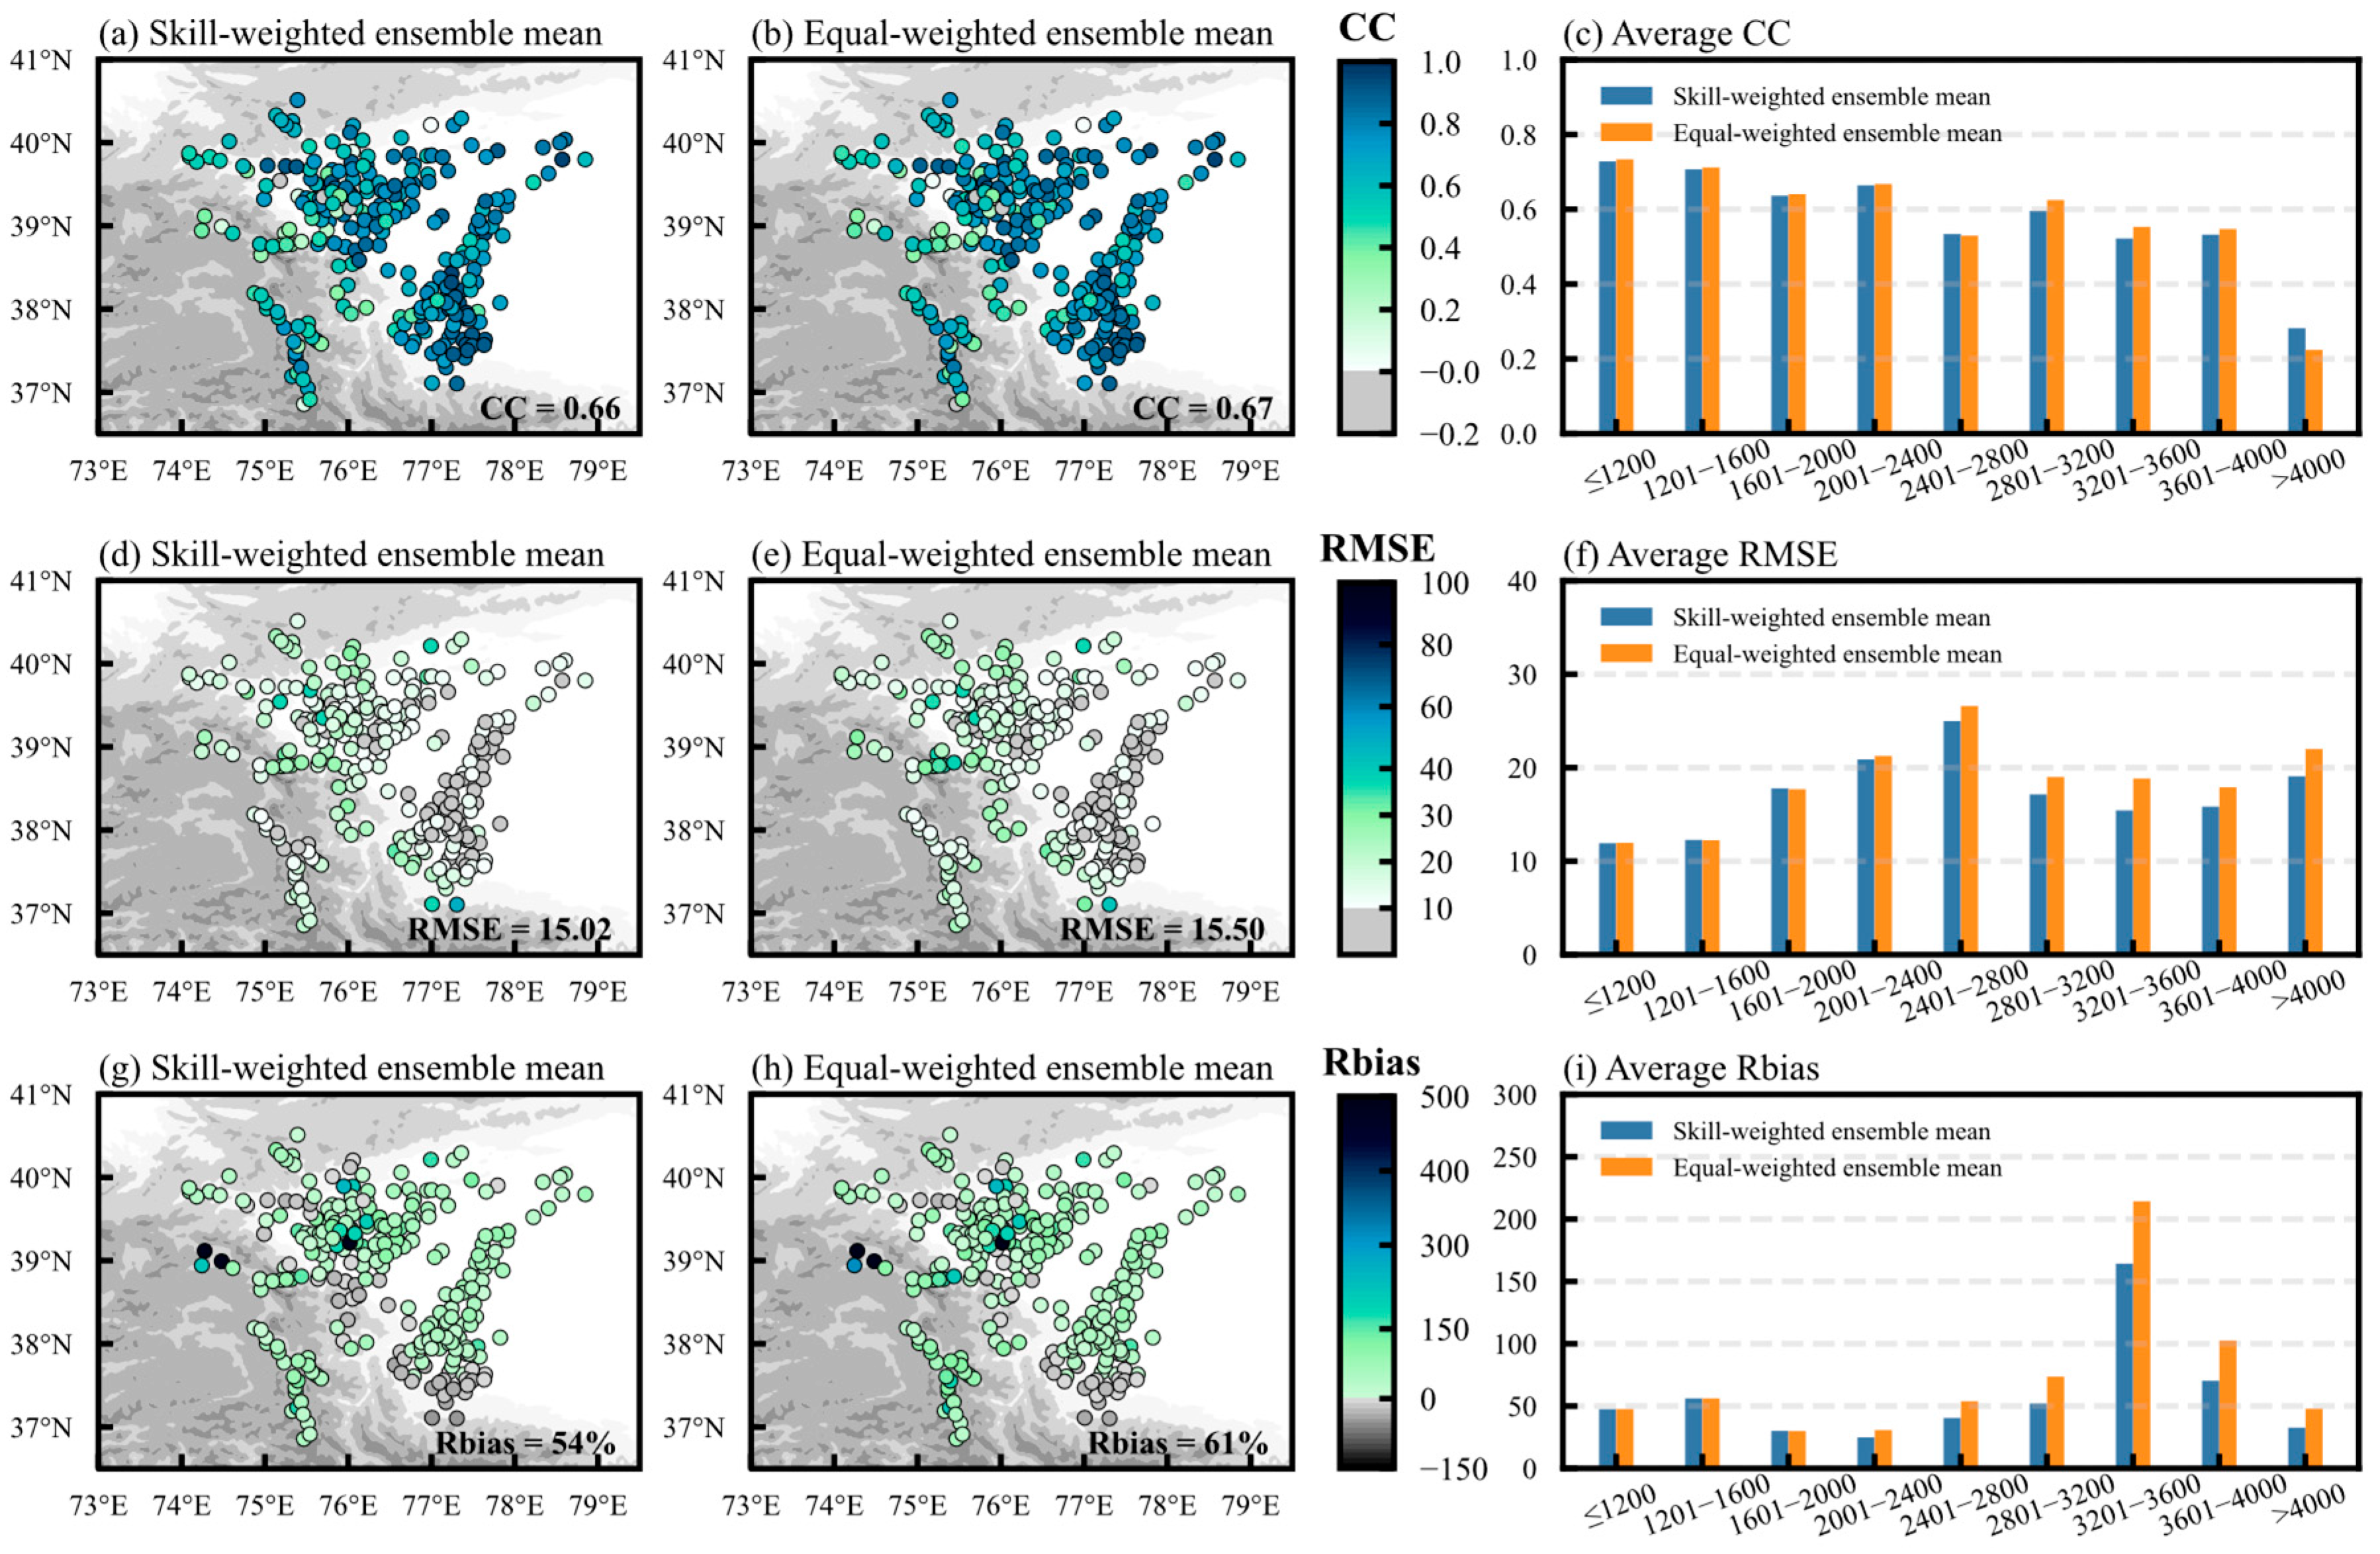
Figure 12 shows the spatial distribution of the evaluation indicators of Skill-Ens and Equal-Ens. Generally speaking, the performance of Skill-Ens is slightly better than that of Equal-Ens and also superior to the individual precipitation dataset. Compared with the eight precipitation datasets, the CC of the two ensemble mean datasets increases significantly in the alpine zone, RMSE decreases significantly in the mid-mountain zone, and Rbias decreases throughout the EPP region. This indicates that the ensemble mean dataset exhibits better performance in regions where the performance of a single precipitation dataset is poor. The variation characteristics of the three evaluation indicators with elevation show that, except at the elevation above 4000 m, the CC performance has increased at all elevations compared to that of an individual precipitation dataset. However, the values of RMSE and Rbias are reduced significantly in the vast majority of elevations.
Based on the DISO index, Skill-Ens, Equal-Ens, and the eight precipitation datasets are comprehensively evaluated (Figure 13). For the EPP region (Figure 13a), their comprehensive performance ranking is as follows: Skill-Ens > CRA40/Land > Equal-Ens > IMERG > GPCC > TPHiPr > CMFD v2.0 > HARv2 > GSMaP > ERA5-Land. Thus, it can be seen that the performance of Skill-Ens (0.350) and CRA40/Land (0.353) surpasses that of the other datasets. Figure 13b shows the DISO indices of all datasets at different elevation ranges, from which we see that in different elevation regions, both ensemble mean datasets (Skill-Ens and Equal-Ens) perform well in almost all elevation gradients, especially in the mid-mountain zone, where they outperform all precipitation datasets. Regarding the eight precipitation datasets, CRA40/Land is the best one of them all. In summation, for the two ensemble mean datasets, the overall performance of Skills-ENS is better than Equal-Ens in the EPP region and can make up for the performance deficiency of a single precipitation dataset in the mid-mountain zone. Therefore, it is a better choice to use the skill-weighted ensemble mean values for the study of spatial distribution characteristics of precipitation in the EPP region.

3.4. Elevation Dependence of Precipitation

In the high-elevation mountainous regions of the Third Pole, the variation in precipitation with elevation is influenced by complex terrain and atmospheric circulation [46,47,48,49,50,51,52]. Previous studies have shown that in the vertical profile of mountainous areas, there is a specific elevation range where the precipitation is much higher than that in the surrounding elevations. The elevations at which the maximum precipitation occurs are called the maximum precipitation altitude (MPA) band [53,54].
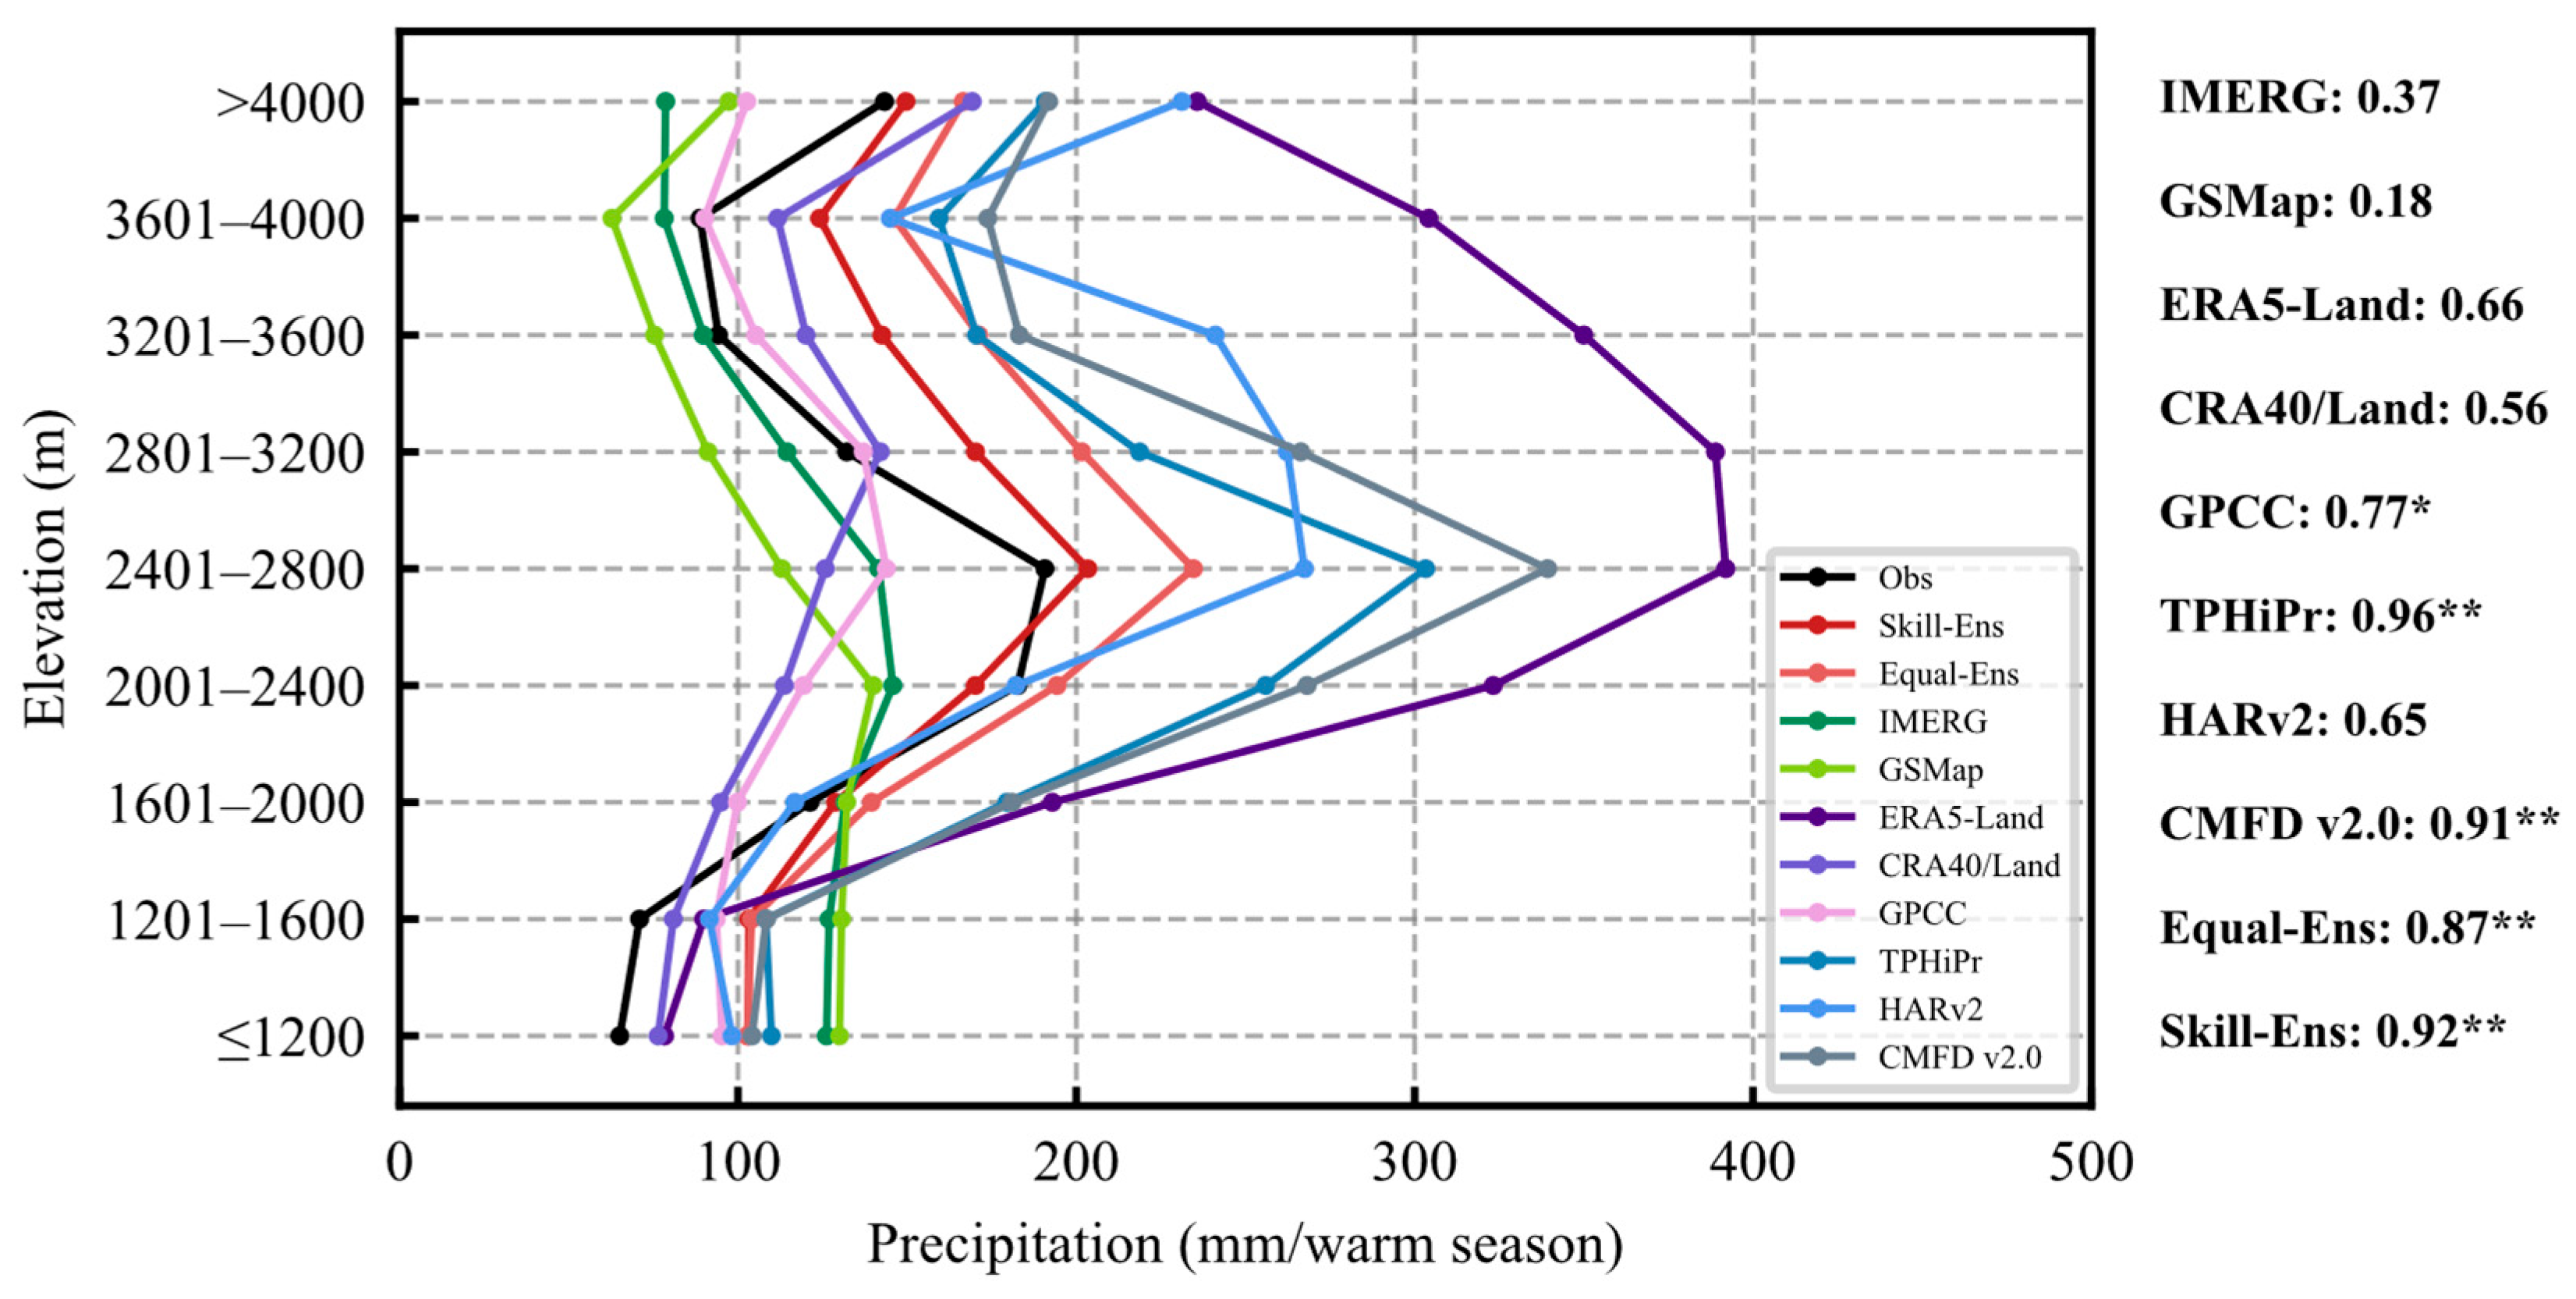
To perform the elevation-dependent precipitation characteristics, the long-term mean warm-season precipitation was first calculated for each station. Stations were then grouped into 400 m elevation ranges, and the precipitation average value of these station-based means was computed for each range. Finally, precipitation variations across different elevation ranges were examined. This study further analyzes the relationship between precipitation and elevation for observed precipitation, two ensemble mean methods, and eight precipitation datasets. The observation results (Figure 14) show that the MPA in the EPP is located at 2400–2800 m. Below this elevation zone, precipitation increases with elevation, while above it, precipitation decreases with elevation. Additionally, above 4000 m, precipitation increases again with elevation, which may be correlated to the existence of a second MPA in the EPP alpine glacier snow cover area [55,56]. Among the eight precipitation datasets, the three fused datasets (TPHiPr, HARv2, and CMFD v2.0) can reasonably simulate the elevation dependence of precipitation in high-elevation areas, especially the two high-resolution datasets (TPHiPr, HARv2), whose precipitation-with-elevation characteristics are even closer to observations, indicating that high-resolution datasets can achieve the simulation of the influence of complex terrain on precipitation. Moreover, relative to other datasets, TPHiPr can more accurately simulate the relationship between precipitation and elevation (CC = 0.96), which is consistent with the findings by Li et al. [16], but the precipitation of TPHiPr is significantly higher than the observed. The elevation dependence of GPCC is relatively strong, and the precipitation information it provides is more similar to the observations. Other precipitation datasets reflect a relatively weak elevation dependence of precipitation, especially satellite datasets (IMERG and GSMaP). Similarly, Skill-Ens and Equal-Ens both have a strong elevation dependence of precipitation, especially Skill-Ens, which has a better correlation with elevation (CC = 0.92). This demonstrates that the skill-weighted ensemble mean values can reasonably simulate the relationship between precipitation and elevation.

4. Discussion

4.1. Performance of Multi-Source Precipitation Datasets in Complex Terrain

In this study, the simulation performance of eight common precipitation datasets (IMERG, GSMaP, ERA5-Land, CRA40/Land, GPCC, TPHiPr, HARv2, and CMFD v2.0) against the monthly precipitation amount during the warm season in the Eastern Pamir Plateau (EPP) is assessed. Overall, the performance of CRA40/Land, IMERG, and GPCC is superior to that of other precipitation datasets. In the mid-to-high elevation regions of the EPP, the existing datasets are not good enough to simulate the precipitation in the mountainous areas, where the maximum precipitation altitude (MPA) band precisely exists during the warm season. This may be because the existing reanalysis and satellite datasets fail to fully capture the local uplift enhancement effect in the mid-elevation region, where there is a persistent underestimation bias, as shown in Figure 9c, and it is also related to the local circulation under possibly complex terrain [57]. Satellite datasets can also be disturbed by changes in cloud cover, thereby increasing Rbias.
This study has found that IMERG shows a good applicability in complex terrain areas, but GSMaP has poor applicability, which is consistent with previous research results [26,58]. As a global reanalysis dataset, the CRA40/Land dataset integrates some meteorological observation data of the EPP region, so it performs relatively well in this region [45]. However, ERA5-Land has a significant overestimation in the mid-to-high elevation regions [24,59]. The fused datasets TPHiPr, HARv2, and CMFD v2.0 take ERA5 reanalysis data as their background field, thus also having systematic overestimations [25,37,38,39]. What is more, the CMFD v2.0 dataset is combined with the TPHiPr dataset, so the two datasets are similar. The TPHiPr and HARv2 datasets have higher horizontal resolutions (1/30°, 10 km) and can provide a more detailed spatial distribution of precipitation in the EPP.

4.2. The Impact of Complex Terrain and Limited Observation on Precipitation Dataset Accuracy

The results indicate that multi-source datasets perform most poorly in the MPA zone. As Chen et al. [57] demonstrated in the northern Qilian Mountains, the distribution of MPA is significantly influenced by the interaction between orographic uplift, moisture transport pathways, and local circulation systems. Moreover, the complex terrain influences precipitation through glacier–atmosphere feedback and valley circulations. These processes impact the accuracy of precipitation dataset estimates in complex terrain regions.
The temporal continuity and accuracy of observational data can affect the accuracy of precipitation datasets. Due to the complex terrain of the EPP, the ability to detect precipitation accurately in complex terrain is currently limited, and there is observational uncertainty in high-elevation areas. For example, the scarcity of meteorological stations above 4000 m and the distribution density of meteorological stations (each station covers an average of 22,000 km2) is obviously lower than the minimum station density recommended by the World Meteorological Organization (WMO), and the spatial and elevation distribution of meteorological stations is highly uneven. These observational gaps and systematic errors in rain gauges can inevitably lead to a certain deviation between precipitation dataset and ground observation, especially in high-elevation glacierized regions where precipitation phase partitioning is critical. Moreover, the study considered only warm-season precipitation (April to September), excluding cold-season processes, which are equally crucial for water resource assessment in this glacier region. The characteristics of solid precipitation may differ significantly from those of liquid precipitation. The study period (2010–2024, warm-season) also failed to capture the decadal-scale climate variability and long-term precipitation trends in the EPP region.

4.3. Advantages of Skill-Weighted Ensemble Mean Method

Multi-source precipitation datasets exhibit significant variations in EPP, facing challenges from complex terrain and limited observation. It is urgent to develop dataset fusion methods to enhance precipitation estimation accuracy. Precipitation datasets are being added continuously, so optimizing the fusion weights of multi-source datasets to reduce estimation errors is crucial [60,61,62]. In this study, we have used the multi-metric DISO value as the performance distance metric, fused eight precipitation datasets according to the skill-weighted ensemble mean methods, forming the two datasets of Skill-Ens and Equal-Ens for comparison.
Traditional equal-weighting ensemble mean methods that rely on single-metric skill weighting (e.g., based on RMSE), the DISO index integrates the correlation coefficient (CC), root mean square error (RMSE), and relative bias (Rbias) into a single metric, serving as the basis for weight calculation, comprehensively evaluating the performance of datasets. The results show that Skill-Ens performs excellently in the whole study area (EPP) and in each elevation zone, effectively integrating the advantages of each dataset and improving the simulation ability for the large-value area of precipitation in the MPA zone (CC = 0.92). The reliable precipitation inputs provided by Skill-Ens enhance the accuracy of hydrological simulations in mountainous regions, holding significant implications for water resource management. This methodology can be extended to other complex topography areas, offering a reference framework for precipitation studies in global high-mountain regions.

5. Conclusions

Based on the data from 268 meteorological stations in the Eastern Pamir Plateau (EPP) from 2010 to 2024, we have systematically assessed the applicability of eight precipitation datasets (IMERG, GSMaP, ERA5-Land, CRA40/Land, GPCC, TPHiPr, HARv2, and CMFD v2.0) in this region in the warm season by using statistical indicators including correlation coefficient (CC), root mean square error (RMSE), relative bias (Rbias), and the comprehensive performance index (DISO). The main conclusions are as follows:
(1)
Observations show that the precipitation in the EPP warm season increases with the rise in elevation and gradually decreases after reaching its maximum value in the mid-mountain zone. The datasets CRA40/Land, TPHiPr, HARv2 and CMFD v2.0 show the same spatial distribution as the observed, while ERA5-Land overestimates the precipitation in mountainous areas.
(2)
The evaluation of statistical indicators reveals that CRA40/Land, GPCC and IMERG perform best overall. In the satellite datasets, IMERG (CC = 0.56) is superior to GSMaP (CC = 0.44), but both overestimate precipitation. The fused datasets (TPHiPr, CMFD v2.0) are highly correlated to observations with CC varying between 0.51 and 0.65, but their RMSE and Rbias are relatively large. The CC of most datasets and observations gradually decreases with the increase in elevation, while the RMSE is the largest in mid-and high-elevation areas, and almost all datasets have the largest RMSE value at 2000–2800 m.
(3)
The comprehensive evaluation of the DISO index indicates that different precipitation datasets show significant performance differences in different elevation zones. The optimal performance is found in CRA40/Land, GPCC and IMERG, with CRA40/Land having a distinctly absolute advantage at all elevations, IMERG performing outstandingly at 1600–2800 m, and TPHiPr being relatively optimal at the 2000–4000 m mid-to-high elevations.
(4)
The newly constructed skill-weighted ensemble mean datasets can significantly improve the accuracy of precipitation estimation in the EPP. In particular, Skill-Ens shows excellent performance in multiple evaluations. This dataset not only compensates for the limitations of individual datasets at different elevations but also provides a more reliable estimation scheme for precipitation research in complex terrain areas by integrating the advantages of multi-source data.
(5)
The observed precipitation in the EPP warm season is obviously elevation-dependent, and the maximum precipitation altitude (MPA) band is formed at 2400–2800 m. There are significant differences in the reproduction ability of precipitation elevation dependence among different precipitation datasets. Among them, the high-resolution fusion datasets TPHiPr, HARv2 can capture the relationship between precipitation and elevation most accurately (CC = 0.96), while capability of satellite datasets are relatively poor. Particularly important is that the Skill-Ens dataset constructed in this study can also simulate the relationship between precipitation and elevation (CC = 0.92) well and has application value in the study of the vertical distribution of precipitation in complex terrains.
This study could provide an important basis for the selection of precipitation datasets in complex terrain areas. Future research should focus on the following directions. First, conduct refined evaluations of precipitation data at different scales, extending the evaluation from the monthly scale to the hourly scale, especially to test the ability of existing datasets to capture extreme precipitation events. Second, systematically evaluate the performance of precipitation datasets in both warm and cold seasons, and develop a precipitation assessment framework applicable to all seasons in alpine mountainous areas. Finally, seek a multi-source data fusion method under complex terrain based on AI technology, and address the simulation bias problem of the maximum precipitation height band by integrating high-resolution geographic information, glacier and snow cover, hydro-meteorological and radar data, etc. The breakthroughs in these issues would profoundly reveal the refined distribution characteristics of precipitation in complex terrain areas, and provide more reliable scientific support for the water resource management of the “Water Tower of Central Asia”.

Supplementary Materials

The following supporting information can be downloaded at: https://www.mdpi.com/article/10.3390/rs17193302/s1, Figure S1: Spatial distribution of (ah) eight precipitation datasets’ CC significance. p < 0.01 and p < 0.05 indicate the CC values which have passed the significance test at levels of 0.01 and 0.05, respectively; Figure S2: Scatter density plots of (a) CC, (b) RMSE, and (c) Rbias of the eight precipitation datasets with elevation.

Author Contributions

Conceptualization, M.Y. and J.Y.; methodology, M.Y., J.Y., and W.M.; software, M.Y.; validation, W.M. and J.Y.; formal analysis, M.Y.; investigation, M.Y.; resources, J.C.; data curation, J.C.; writing—original draft preparation, M.Y.; writing—review and editing, J.Y.; visualization, M.Y.; supervision, W.M. and J.Y.; project administration, J.Y.; funding acquisition, W.M. and J.Y. All authors have read and agreed to the published version of the manuscript.

Funding

This research was funded by the China Desert Meteorological Science Research Foundation (Grant No. Sqj2022003), National Natural Science Foundation of China, (Grant No. 4217103), Shanghai Cooperation Organization Science and Technology Partnership and International S&T Cooperation Program (Grant No. 2023E01022), Key R&D Program of Xinjiang Uygur Autonomous Region (Grant No. 2022B03021-1), and supported by the S&T Development Fund of CAMS (Grant No. 2021KJ034).

Data Availability Statement

The monthly rain gauge observations used in this study can be downloaded from the official website of the China Meteorological Administration (https://data.cma.cn/, accessed on 22 November 2024). The multi-source precipitation datasets used in this study are the Integrated Multi-satellitE Retrievals for GPM/Final Precipitation L3 V07 (https://disc.gsfc.nasa.gov/datasets/GPM_3IMERGM_07/, accessed on 20 January 2025), the Global Satellite Mapping/Gauge-calibrated Rainfall Product V8 (https://sharaku.eorc.jaxa.jp/ GSMaP, accessed on 3 February 2025), ECMWF Reanalysis v5-Land (https://cds.climate.copernicus.eu/, accessed on 21 March 2024), the first-generation Chinese Global Land-surface Reanalysis (https://data.cma.cn/, accessed on 4 February 2025), the Global Precipitation Climatology Centre/Full Data Monthly Version (https://psl.noaa.gov/data/gridded/data.gpcc.html, accessed on 4 February 2025), a long-term (1979–2020) high-resolution (1/30°) precipitation dataset for the Third Pole region (https://data.tpdc.ac.cn/, accessed on 28 January 2025), the High Asia Refined analysis version2 (https://www.tu.berlin/klima/forschung/regionalklimatologie/hochasien/har, accessed on 28 November 2024), and the China Meteorological Forcing Data v2.0 (https://data.tpdc.ac.cn/, accessed on 20 March 2025).

Acknowledgments

The authors would like to thank the China Meteorological Administration of rain gauge observations and CRA40/Land, GPM satellite constellation of IMERG, JAXA Global Rainfall Watch of GSMaP, European Center for Medium Range Weather Forecasts for providing the data of ERA5-Land, Global Precipitation Climatology Centre of GPCC, the Technical University of Berlin of HARv2, Institute of Tibetan Plateau Research Chinese Academy of Sciences of TPHiPr, and CMFD v2.0 for providing precipitation datasets. The authors would also like to acknowledge the reviewers for their thorough comments that helped to improve the manuscript.

Conflicts of Interest

The authors declare no conflicts of interest.

References

  1. Aichner, B.; Makhmudov, Z.; Rajabov, I.; Zhang, Q.; Pausata, F.S.R.; Werner, M.; Heinecke, L.; Kuessner, M.L.; Feakins, S.J.; Sachse, D.; et al. Hydroclimate in the Pamirs was driven by changes in precipitation-evaporation seasonality since the last glacial period. Geophys. Res. Lett. 2019, 46, 13972–13983. [Google Scholar] [CrossRef]
  2. Pohl, E.; Gloaguen, R.; Seiler, R. Remote sensing-based assessment of the variability of winter and summer precipitation in the Pamirs and their effects on hydrology and hazards using harmonic time series analysis. Remote Sens. 2015, 7, 9727–9752. [Google Scholar] [CrossRef]
  3. Immerzeel, W.W.; Bierkens, M.F.P. Seasonal prediction of monsoon rainfall in three Asian river basins: The importance of snow cover on the Tibetan Plateau. Int. J. Climatol. 2010, 30, 1835–1842. [Google Scholar] [CrossRef]
  4. Wang, N.; Yao, T.; Xu, B.; Chen, A.; Wang, W. Spatiotemporal pattern, trend, and influence of glacier change in Tibetan Plateau and surroundings under global warming. Bull. Chin. Acad. Sci. 2019, 34, 1220–1232. [Google Scholar]
  5. Aizen, E.M.; Aizen, V.B.; Melack, J.M.; Nakamura, T.; Ohta, T. Precipitation and atmospheric circulation patterns at mid-latitudes of Asia. Int. J. Climatol. 2001, 21, 535–556. [Google Scholar] [CrossRef]
  6. Tian, L.; Yao, T.; Macclune, K.; White, J.W.C.; Schilla, A.; Vaughn, B.; Vachon, R.; Ichiyanagi, K. Stable isotopic variations in west China: A consideration of moisture sources. Geophys. Res. Lett. 2007, 112, 10112. [Google Scholar] [CrossRef]
  7. Yao, T.; Thompson, L.; Yang, W.; Yu, W.; Gao, Y.; Guo, X.; Pu, J. Different glacier status with atmospheric circulations in Tibetan Plateau and surroundings. Nat. Clim. Change 2012, 2, 663–667. [Google Scholar] [CrossRef]
  8. Li, D.; Yang, K.; Tang, W.; Li, X.; Zhou, X.; Guo, D. Characterizing precipitation in high altitudes of the western Tibetan plateau with a focus on major glacier areas. Int. J. Climatol. 2020, 40, 5114–5127. [Google Scholar] [CrossRef]
  9. Miehe, G.; Winiger, M.; Böhner, J.; Zhang, Y. The climatic diagram map of High Asia: Purpose and concepts. Erdkunde 2001, 55, 94–97. [Google Scholar] [CrossRef]
  10. Williams, M.W.; Konovalov, V.G. Central Asia Temperature and Precipitation Data, 1879–2003, 1st ed.; National Snow and Ice Data Center Boulder (NSIDC): Boulder, CO, USA, 2008. [Google Scholar]
  11. Dai, X.; Li, W.; Ma, Z.; Wang, P. Water–vapor source shift of Xinjiang region during the recent twenty years. Prog. Nat. Sci. 2007, 17, 569–575. [Google Scholar]
  12. Zhao, Y.; Huang, A.; Zhou, Y.; Zhao, Y.; Huang, A.; Zhou, Y.; Huang, D.; Yang, Q.; Ma, Y.; Wei, G. Impact of the middle and upper tropospheric cooling over Central Asia on the summer rainfall in the Tarim Basin, China. J. Clim. 2014, 27, 4721–4732. [Google Scholar] [CrossRef]
  13. Yang, L.; Liu, J. Some advances of water vapor research in Xinjiang. J. Nat. Disasters 2018, 27, 1–13. [Google Scholar]
  14. Mao, X.; Xing, L.; Shang, W.; Li, S.; Duan, K. Moisture sources for precipitation over the Pamirs Plateau in winter and spring. Q. J. R. Meteorol. Soc. 2014, 150, 820–833. [Google Scholar] [CrossRef]
  15. Zeng, L.; Yang, T.; Tian, H. Response of glacier variations in the eastern Pamirs Plateau to climate change, during the last 40 years. J. Arid Land Resour. Environ. 2013, 27, 144–150. [Google Scholar]
  16. Li, Z.; Gui, J.; Wang, X.; Feng, Q.; Zhao, T.; Ouyang, C.; Guo, X.; Zhang, B.; Shi, Y. Water resources in inland regions of central Asia: Evidence from stable isotope tracing. J. Hydrol. 2019, 570, 1–16. [Google Scholar] [CrossRef]
  17. Farinotti, D.; Immerzeel, W.W.; de Kok, R.J.; Quincey, D.J.; Dehecq, A. Manifestations and mechanisms of the Karakoram glacier Anomaly. Nat. Geosci. 2020, 13, 8–16. [Google Scholar] [CrossRef]
  18. Rasmussen, R.; Baker, B.; Kochendorfer, J.; Meyers, T.; Landolt, S.; Fischer, A.P.; Black, J.; Thériault, J.M.; Kucera, P.; Gochis, D. How Well Are We Measuring Snow: The NOAA/FAA/NCAR Winter Precipitation Test Bed. Bull. Am. Meteorol. Soc. 2012, 93, 811–829. [Google Scholar] [CrossRef]
  19. Miao, C.; Immerzeel, W.W.; Xu, B.; Yang, K.; Duan, Q.; Li, X. Understanding the Asian water tower requires a redesigned precipitation observation strategy. Proc. Natl. Acad. Sci. USA 2024, 121, e2403557121. [Google Scholar] [CrossRef] [PubMed]
  20. Tong, K.; Su, F.; Yang, D.; Zhang, L.; Hao, Z. Tibetan Plateau precipitation as depicted by gauge observations, reanalyses and satellite retrievals. Int. J. Climatol. 2014, 34, 265–285. [Google Scholar] [CrossRef]
  21. Wortmann, M.; Bolch, T.; Menz, C.; Tong, J.; Krysanova, V. Comparison and correction of high-mountain precipitation data based on glacio-hydrological modeling in the Tarim River headwaters (High Asia). J. Hydrometeorol. 2018, 19, 777–801. [Google Scholar] [CrossRef]
  22. Wang, L.; Chen, R.; Song, Y.; Yang, Y.; Liu, J.; Han, C.; Liu, Z. Precipitation–altitude relationships on different timescales and at different precipitation magnitudes in the Qilian Mountains. Theor. Appl. Climatol. 2018, 134, 875–884. [Google Scholar] [CrossRef]
  23. Sun, W.; Chen, R.; Wang, L.; Wang, Y.; Han, C.; Huai, B. How do GPM and TRMM precipitation products perform in alpine regions? A case study in northwestern China’s Qilian Mountains. J. Geogr. Sci. 2022, 32, 913–931. [Google Scholar] [CrossRef]
  24. Jiao, D.; Xu, N.; Yang, F.; Xu, K. Evaluation of spatial-temporal variation performance of ERA5 precipitation data in China. Sci. Rep. 2021, 11, 17956. [Google Scholar] [CrossRef]
  25. Jiang, Y.; Yang, K.; Qi, Y.; Zhou, X.; He, J.; Lu, H.; Li, X.; Chen, Y.; Li, X.; Zhou, B.; et al. TPHiPr: A long-term (1979–2020) high-accuracy precipitation dataset (1/30°, daily) for the Third Pole region based on high-resolution atmospheric modeling and dense observations. Earth Syst. Sci. 2023, 15, 621–638. [Google Scholar] [CrossRef]
  26. Jia, J.; He, Y.; Zhang, B.; Huo, Z.; Tang, Z.; Wang, S.; Yu, H.; Guan, X. Evaluation of hourly summer precipitation products over the Tibetan Plateau: A comparative analysis of IMERG, CMORPH, and TPHiPr. Atmos. Res. 2025, 316, 107955. [Google Scholar] [CrossRef]
  27. Cheng, Y.; Zhang, X.; Wang, K.; Zhang, Y.; Guo, Y.; Shen, Y.J. Multidimensional evaluation of satellite-based and reanalysis-based precipitation datasets in the Tibetan Plateau. J. Hydrol. 2025, 660, 133364. [Google Scholar] [CrossRef]
  28. Gao, Y.; Xu, J.; Chen, D. Evaluation of WRF Mesoscale Climate Simulations over the Tibetan Plateau during 1979–2011. J. Clim. 2015, 28, 2823–2841. [Google Scholar] [CrossRef]
  29. Sun, M.; Liu, A.; Zhao, L.; Wang, C.; Yang, Y. Evaluation of Multi-Source Precipitation Products in the Hinterland of the Tibetan Plateau. Atmosphere 2024, 15, 138. [Google Scholar] [CrossRef]
  30. Sun, H.; Su, F.; Huang, J.; Yao, T.; Luo, Y.; Chen, D. Contrasting precipitation gradient characteristics between westerlies and monsoon dominated upstream river basins in the Third Pole. Chin. Sci. Bull. 2020, 65, 91–104. [Google Scholar] [CrossRef]
  31. Palazzi, E.; Von Hardenberg, J.; Provenzale, A. Precipitation in the Hindu–Kush Karakoram Himalaya: Observations future scenarios. J. Geophys. Res. Atmos. 2013, 118, 85–100. [Google Scholar] [CrossRef]
  32. Huffman, G.J.; Stocker, E.F.; Bolvin, D.T.; Nelkin, E.J.; Tan, J. GPM IMERG Final Precipitation L3 1 Day 0.1 Degree × 0.1 Degree V07; Savtchenko, A., Ed.; Goddard Earth Sciences Data and Information Services Center (GES DISC): Greenbelt, MD, USA, 2023. [Google Scholar]
  33. Kubota, T.; Aonashi, K.; Ushio, T.; Shige, S.; Takayabu, Y.N.; Kachi, M.; Arai, Y.; Tashima, T.; Masaki, T.; Kawamoto, N.; et al. Global Satellite Mapping of Precipitation (GSMaP) Products in the GPM Era; Satellite precipitation measurement; Springer: Cham, Switzerland, 2020. [Google Scholar]
  34. Muñoz-Sabater, J. ERA5-Land Monthly Averaged Data from 1981 to Present; Copernicus Climate Change Service (C3S) Climate Data Store (CDS): Reading, UK, 2019. [Google Scholar]
  35. Liu, Z.Q.; Jiang, L.P.; Shi, C.X.; Zhang, T.; Zhou, Z.J.; Liao, J.; Yao, S.; Liu, J.W.; Wang, M.Y.; Wang, H.Y.; et al. CRA-40/Atmosphere—The first-generation Chinese atmospheric reanalysis (1979–2018): System description and performance evaluation. J. Meteorol. Res. 2023, 37, 1–19. [Google Scholar] [CrossRef]
  36. Schneider, U.; Hänsel, S.; Finger, P.; Rustemeier, E.; Ziese, M. GPCC Full Data Monthly Product Version 2022 at 0.25°: Monthly Land-Surface Precipitation from Rain-Gauges Built on GTS-Based and Historical Data; Global Precipitation Climatology Centre: Offenbach am Main, Germany, 2022. [Google Scholar]
  37. Yang, K.; Jiang, Y. A Long-Term (1979–2020) High-Resolution (1/30°) Precipitation Dataset for the Third Polar Region (TPHiPr); National Tibetan Plateau/Third Pole Environment Data Center: Beijing, China, 2022. [Google Scholar]
  38. Hamm, A.; Arndt, A.; Kolbe, C.; Wang, X.; Thies, B.; Boyko, O.; Reggiani, P.; Scherer, D.; Bendix, J.; Schneider, C. Intercomparison of Gridded Precipitation Datasets over a Sub-Region of the Central Himalaya and the Southwestern Tibetan Plateau. Water 2020, 12, 3271. [Google Scholar] [CrossRef]
  39. He, J.; Yang, K.; Li, X.; Tang, W.; Shao, C.; Jiang, Y.; Ding, B. China Meteorological Forcing Dataset v2.0 (1951–2020); National Tibetan Plateau/Third Pole Environment Data Center: Beijing, China, 2024. [Google Scholar]
  40. Sanderson, B.M.; Knutti, R.; Caldwell, P. A representative democracy to reduce interdependency in a multimodel ensemble. J. Clim. 2015, 28, 5171–5194. [Google Scholar] [CrossRef]
  41. Sanderson, B.M.; Wehner, M.; Knutti, R. Skill and independence weighting for multi-model assessments. Geosci. Model Dev. 2017, 10, 2379–2395. [Google Scholar] [CrossRef]
  42. Jiang, J.; Zhou, T.; Zhang, W. Evaluation of satellite and reanalysis precipitable water vapor data sets against radiosonde observations incentral Asia. Earth Space Sci. 2019, 6, 1129–1148. [Google Scholar] [CrossRef]
  43. Zhao, J.Z.; He, S.P.; Fan, K.; Wang, H.J.; Li, F. Projecting Wintertime Newly Formed Arctic Sea Ice through Weighting CMIP6 Model Performance and Independence. Adv. Atmos. Sci. 2024, 41, 1465–1482. [Google Scholar] [CrossRef]
  44. Perkins, S.E.; Pitman, A.J.; Holbrook, N.J.; McAneney, J. Evaluation of the AR4 Climate models’ simulated daily maximum temperature, minimum temperature, and precipitation over Australia using probability density functions. J. Clim. 2007, 20, 4356–4376. [Google Scholar] [CrossRef]
  45. Zhou, Z.; Chen, S.; Li, Z.; Luo, Y. An Evaluation of CRA40 and ERA5 Precipitation Products over China. Remote. Sens. 2023, 15, 5300. [Google Scholar] [CrossRef]
  46. Alpert, P. Mesoscale indexing of the distribution of orographic precipitation over high mountains. J. Appl. Meteorol. Climatol. 1986, 25, 532–545. [Google Scholar] [CrossRef]
  47. Bookhagen, B.; Burbank, D.W. Topography, relief, and TRMM-derived rainfall variations along the Himalaya. Geophys. Res. Lett. 2006, 33, 153–172. [Google Scholar]
  48. Wang, N.; He, J.; Jiang, X.; Song, G.; Pu, J.; Wu, X.; Chen, L. Study on the zone of maximum precipitation in the north slopes of the central Qilian mountains. J. Glaciol. Geocryol. 2009, 31, 395–403. [Google Scholar]
  49. Houze, R.A., Jr. Orographic effects on precipitating clouds. Rev. Geophy. 2012, 50. [Google Scholar] [CrossRef]
  50. Immerzeel, W.W.; Petersen, L.; Ragettli, S.; Pellicciotti, F. The importance of observed gradients of air temperature and precipitation for modeling runoff from a glacierized watershed in the Nepalese Himalayas. Water Resour. Res. 2014, 50, 2212–2226. [Google Scholar] [CrossRef]
  51. Shrestha, D.; Singh, P.; Nakamura, K. Spatiotemporal variation of rainfall over the central Himalayan region revealed by TRMM Precipitation Radar. J. Geophys. Res. Atmos. 2012, 117. [Google Scholar] [CrossRef]
  52. Pan, X.; Fu, Y.; Yang, S.; Gong, Y.; Li, D. Diurnal Variations of Precipitation over the Steep Slopes of the Himalayas Observed by TRMM PR and VIRS. Adv. Atmos. Sci. 2021, 38, 641–660. [Google Scholar] [CrossRef]
  53. Barry, R.G. Mountain Weather and Climate; Cambridge University Press: Cambridge, UK, 2008; pp. 251–443. [Google Scholar]
  54. Immerzeel, W.W.; Wanders, N.; Lutz, A.F.; Shea, J.M.; Bierkens, M.F. Reconciling high-altitude precipitation in the upper Indus basin with glacier mass balances and runoff. Hydrol. Earth Syst. Sci. 2015, 19, 4673–4687. [Google Scholar] [CrossRef]
  55. Yang, Z.; Liu, X.; Zeng, Q.; Chen, Z. Hydrology in Cold Regions of China; Science Press: Beijing, China, 2000; pp. 8–12. [Google Scholar]
  56. Shen, Y.P.; Liang, H. High precipitation in glacial region of high mountains in High Asia: Possible case. J. Glaciol. Geocryol. 2004, 26, 806–809. [Google Scholar]
  57. Chen, R.; Han, C.; Liu, J.; Yang, Y.; Liu, Z.; Wang, L.; Kang, E. Maximum precipitation altitude on the northern flank of the Qilian Mountains, northwest China. Hydrol. Res. 2018, 49, 1696–1710. [Google Scholar] [CrossRef]
  58. Lei, H.; Li, H.; Zhao, H.; Ao, T.; Li, X. Comprehensive evaluation of satellite and reanalysis precipitation products over the eastern Tibetan plateau characterized by a high diversity of topographies. Atmos. Res. 2021, 259, 105661. [Google Scholar] [CrossRef]
  59. Wu, X.; Su, J.; Ren, W.; Lü, H.; Yuan, F. Statistical comparison and hydrological utility evaluation of ERA5-Land and IMERG precipitation products on the Tibetan Plateau. J. Hydrol. 2023, 620, 129384. [Google Scholar] [CrossRef]
  60. Hong, Z.; Han, Z.; Li, X.; Long, D.; Tang, G.; Wang, J. Generation of an improved precipitation dataset from multisource information over the Tibetan Plateau. J. Hydrometeorol. 2021, 22, 1275–1295. [Google Scholar]
  61. Yang, Y.; Chen, R.; Ding, Y.; Qing, W.; Li, H.; Han, C.; Liu, Z.; Liu, J. Evaluation of 12 precipitation products and comparison of 8 multi-model averaging methods for estimating precipitation in the Q-ilian Mountains, Northwest China. Atmos. Res. 2023, 296, 107075. [Google Scholar] [CrossRef]
  62. Yang, L.; Jiang, Y.; Yang Xia Ye, X.; Zhao, W.; Tang, H. Applicability assessment of multi-source precipitation fusion products in the warm season in Xinjiang. Desert. Oasis. Meteor. 2025, 19, 37–46. [Google Scholar]
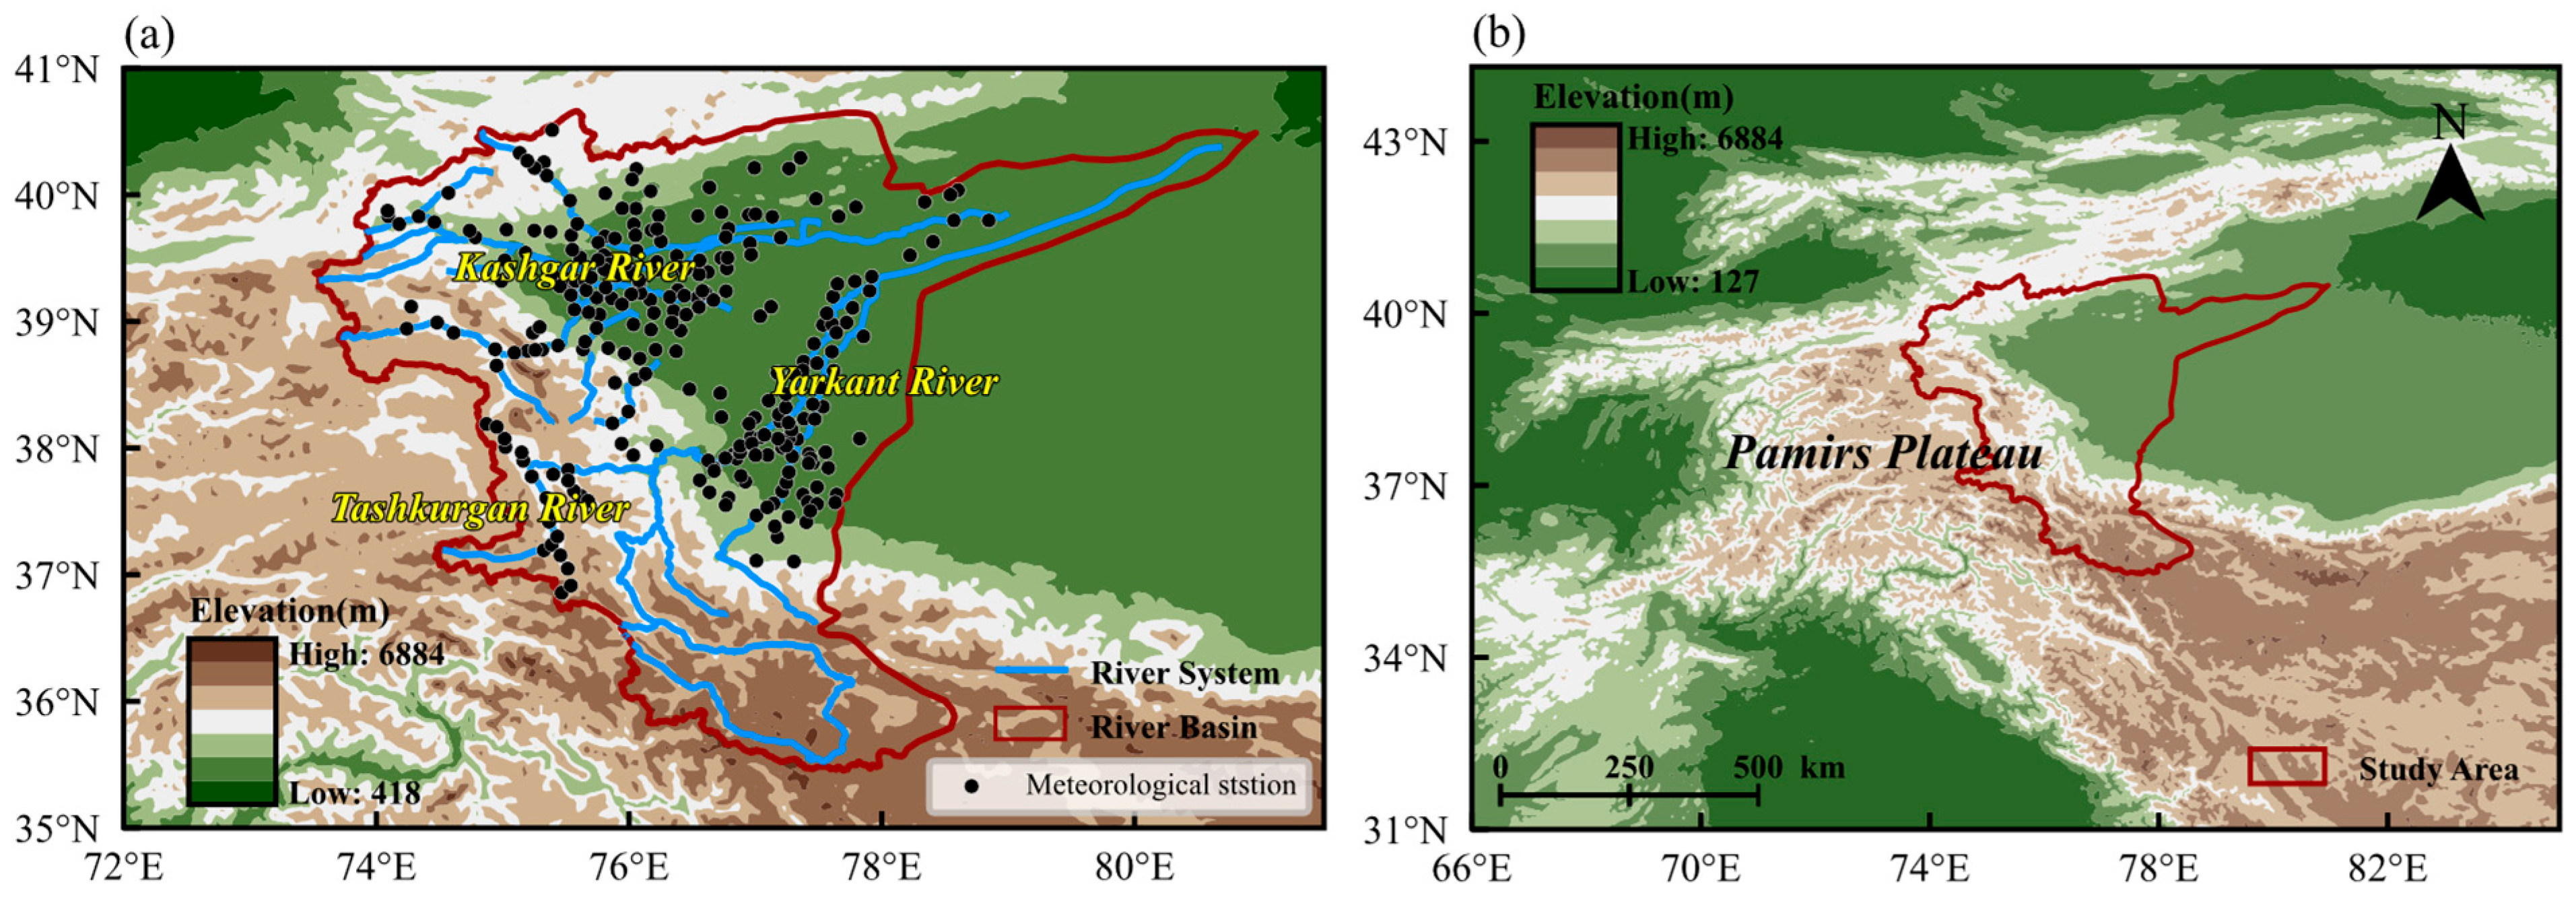
Figure 1. (a) Spatial distribution of meteorological stations and river basins in the study area, and (b) the geographical location of the Eastern Pamir Plateau (EPP) study area (red polygon), with shading indicating elevation.
Remotesensing 17 03302 g001
Figure 2. (a) Spatial pattern of 268 meteorological stations’ elevations in the study area, with stations’ elevations grouped into nine elevation ranges at 400 m; dot colors represent different elevation ranges, (b) the histogram of station numbers within the elevation ranges, and (c) the histogram of station numbers with valid data year records during the warm season from 2010 to 2024.
Remotesensing 17 03302 g002
Figure 3. Spatial patterns of warm-season precipitation averaged over multiple years; (ah) based on eight precipitation datasets, (i) observations, and (j) histogram of regional average precipitation for each dataset and observations.
Remotesensing 17 03302 g003
Figure 4. Histogram of regional average monthly precipitation during the warm season based on eight precipitation datasets (bars) and the observations (black line).
Remotesensing 17 03302 g004
Figure 5. Scatter density plots of monthly precipitation from (ah) eight precipitation datasets versus gauge observations, with linear regression equations and evaluation metrics (CC, RMSE, and Rbias) indicated for each dataset and observations.
Remotesensing 17 03302 g005
Figure 6. (ah) Spatial distribution of CC between eight precipitation datasets and observed precipitation, with the number in the lower right corner representing the regional average CC value, and (i) the histogram of average CC values of eight datasets in different elevation ranges (400 m bins).
Remotesensing 17 03302 g006
Figure 7. (ah) Spatial distribution of RMSE of eight precipitation datasets, with the number in the lower right corner representing the regional average value of RMSE, and (i) the histogram of RMSE average values of eight datasets in different elevation ranges (400 m bins).
Remotesensing 17 03302 g007
Figure 8. (ah) Spatial distribution of Rbias of eight precipitation datasets, with the number in the lower right corner representing the regional average value of Rbias, and (i) the histogram of Rbias average values of eight datasets in different elevation ranges (400 m bins).
Remotesensing 17 03302 g008
Figure 9. Box plots of (a) CC, (b) RMSE, and (c) Rbias of the eight precipitation datasets and observed precipitation in different elevation ranges (400 m bins).
Remotesensing 17 03302 g009
Figure 10. Comprehensive evaluation of the performance of eight precipitation datasets with DISO values for (a) overall performance over the whole study area and (b) performance across different elevation ranges (400 m bins). DISO-All is the mean value of the whole study area stations, and DISO-Elevation is the mean value of the different elevation range stations.
Remotesensing 17 03302 g010
Figure 11. (a,b) Spatial distribution of multi-year average warm-season precipitation based on Skill-Ens and Equal-Ens, and (c,d) scatter density plots of monthly precipitation with observations based on Skill-Ens and Equal-Ens, with linear regression equations and evaluation metrics (CC, RMSE, and Rbias) indicated for each dataset and observations.
Remotesensing 17 03302 g011
Figure 12. Spatial distributions of (a,b) CC, (d,e) RMSE, and (g,h) Rbias of Skill-Ens and Equal-Ens, and the number in the lower right corner represents the regional average value; (c,f,i) histogram of the average assessment indicators of Skill-Ens and Equal-Ens in different elevation ranges (400 m bins).
Remotesensing 17 03302 g012
Figure 13. Comprehensive evaluation performance using the DISO index of Skill-Ens, Equal-Ens, and eight precipitation datasets: (a) overall performance over the whole study area and (b) performance across different elevation ranges (400 m bins). DISO-All is the mean value of the whole study area stations, and DISO-Elevation is the mean value of the different elevation range stations.
Remotesensing 17 03302 g013
Figure 14. Comparison between the elevation dependence of precipitation from Skin-Ens, Equal-Ens, and eight precipitation datasets and that from observation data. The lines show the average precipitation at the stations within the elevation range (400 m bins). The numbers give the correlations of the lines between observations and precipitation datasets. The ** and * indicate that the correlations have passed the significance test at levels of 0.01 and 0.05, respectively.
Remotesensing 17 03302 g014
Table 1. Information introduction to the eight precipitation datasets in this study.
TypeDatasetFull Name/VersionPeriodSpatial ResolutionReferences
Satellite
dataset
IMERGIntegrated Multi-satellitE Retrievals for GPM/Final Precipitation L3 V072010–20240.1°Huffman et al. [32]
GSMaPGlobal Satellite Mapping/Gauge-calibrated Rainfall Product (V8)2010–20240.1°Kubota et al. [33]
Reanalysis datasetERA5-LandECMWF Reanalysis v5-Land2010–20230.1°Muñoz-Sabater et al. [34]
CRA40/LandThe first-generation Chinese Global Land-surface Reanalysis2010–20240.25°Liu et al. [35]
Gridded
dataset
GPCCThe Global Precipitation Climatology Centre/Full Data Monthly Version2010–20200.25°Schneider et al. [36]
Fused
dataset
TPHiPrA long-term (1979–2020) high-resolution (1/30°, daily) precipitation dataset for the Third Pole region2010–20201/30°Yang et al. [37]
HARv2The High Asia Refined analysis version22010–202310 kmHamm et al. [38]
CMFD v2.0China Meteorological Forcing Dataset v2.02010–20200.1°He et al. [39]
Table 2. Calculation formula and perfect value of statistical metrics for evaluation in this study.
MetricsFormulaPerfect Value
Correlation Coefficient (CC) C C = i = 1 n M i M ¯ ( ( O ¯ ) i = 1 n M i M ¯ 2 i = 1 n O i O ¯ 2 1
Root Mean Square Error (RMSE) R M S E = 1 n i = 1 n M i O i 2 0
Relative Bias (Rbias) R b i a s = i = 1 n M i O i i = 1 n O i × 100 % 0
Note: n represents the number of samples, i is for each sample, and M and O represent the estimated precipitation of the precipitation dataset and observed precipitation, respectively. M ¯ is the average value of the estimated precipitation in each dataset, and O ¯ refers to the average value of the observed precipitation.
Table 3. Weightings based on the DISO index for eight precipitation datasets.
WeightingIMERGGSMaPERA5-LandCRA40/LandGPCCTPHiPrHARv2CMFD v2.0
w q 0.182290.017400.014560.271150.190460.148190.064070.11188
Disclaimer/Publisher’s Note: The statements, opinions and data contained in all publications are solely those of the individual author(s) and contributor(s) and not of MDPI and/or the editor(s). MDPI and/or the editor(s) disclaim responsibility for any injury to people or property resulting from any ideas, methods, instructions or products referred to in the content.