Article

Detection of Aguadas (Ponds) Through Remote Sensing in the Bajo El Laberinto Region, Calakmul, Campeche, Mexico

by
Alberto G. Flores Colin
1,*,
Nicholas P. Dunning
2,
Armando Anaya Hernández
1,
Christopher Carr
2,
Felix Kupprat
3,
Kathryn Reese-Taylor
4 and
Demián Hinojosa-Garro
5
1
Laboratorio de Geomática, Centro de Estudios de Desarrollo Sustentable y Aprovechamiento de la Vida Silvestre (CEDESU), Universidad Autónoma de Campeche, Campeche 24079, Mexico
2
Department of Geography and GIS, University of Cincinnati, Cincinnati, OH 45221, USA
3
Instituto de Investigaciones Antropológicas, Universidad Nacional Autónoma de Mexico, Ciudad de Mexico 04510, Mexico
4
Department of Anthropology, University of Calgary, Calgary, AB T2N 1N4, Canada
5
Laboratorio de Ecología Acuática y Monitoreo Ambiental, Centro de Estudios de Desarrollo Sustentable y Aprovechamiento de la Vida Silvestre (CEDESU), Universidad Autónoma de Campeche, Campeche 24079, Mexico
*
Author to whom correspondence should be addressed.
Remote Sens. 2025, 17(19), 3299; https://doi.org/10.3390/rs17193299 (registering DOI)
Submission received: 24 April 2025 / Revised: 11 September 2025 / Accepted: 13 September 2025 / Published: 25 September 2025

Abstract

Highlights

What are the main findings?
  • Lidar-derived Digital Elevation Models and Infrared high-definition imagery from satellites constitute the most efficient tools for identifying aguadas (ponds) in regions covered by dense forest.
  • Three hundred fifty aguadas were identified in the Calakmul Biosphere Reserve.
What is the implication of the main finding?
  • Lidar-derived Digital Elevation Model and Infrared high-definition satellite images and supplementary sources can be combined to enhance the identification of minor water bodies in densely wooded regions.
  • Ponds in the Calakmul Biosphere Reserve exceed the number that has previously documented, and their identification is highly relevant for conservation and archeological studies.

Abstract

This study explores the detection and classification of aguadas (ponds) in the Bajo El Laberinto region, in the Calakmul Biosphere Reserve, Campeche, Mexico, using remote sensing techniques. Lidar-derived digital elevation models (DEMs), orthophotos and satellite imagery from multiple sources were employed to identify and characterize these water reservoirs, which played a crucial role in ancient Maya water management and continued to be vital for contemporary wildlife. By comparing different visualization techniques and imagery sources, the study demonstrates that while lidar data provides superior topographic detail, satellite imagery—particularly with nominal 3 m, or finer, spatial resolution with a near-infrared band—offers valuable complementary data including present-day hydrological and vegetative characteristics. In this study, 350 aguadas were identified in the broader region. The shapes, canopy cover, and topographic positions of these aguadas were documented, and the anthropogenic origin of most features was emphasized. The paper’s conclusion states that combining various remote sensing datasets enhances the identification and understanding of aguadas, providing insights into ancient Mayan adaptive strategies and contributing to ongoing archaeological and ecological research.

1. Introduction

In the Elevated Interior Region (EIR), the central spine of the Yucatan Peninsula, aguadas (ponds), are common features, many of which were built by the ancient Mayas as reservoirs and are typically associated with their settlements. In this seasonally waterless region, where perennial water sources are extremely scarce, reservoirs were essential for year-round occupation of towns and cities.
Aguadas possess a biocultural significance due to their strong association with ancient Mayan settlements [1] and their critical role in the modern forest as an essential source of drinking water for wildlife [2,3,4]. Consequently, comprehending their distribution is essential for analyzing settlement patterns, the management of hydraulic systems by the Maya, and for the conservation of fauna dependent on these bodies of water.
Documenting aguadas is challenging due to their remote locations deep within the forest, lacking access roads and proximity to populated areas. Moreover, given their abundance, it is nearly impossible to visit all of them, which is why turning to remote sensing techniques is the most efficient means to ascertain and comprehend their distribution.
To date, only García et al. [5] have recorded the aguadas at a regional scale inside the tropical forest of the Calakmul Biosphere Reserve (CBR) in Campeche, Mexico, utilizing aerial images captured by an aircraft. New remote sensing technologies, including satellite imagery and lidar, have proven more effective in documenting surface features, offering an opportunity to evaluate their efficacy while augmenting the record of aguadas in the region, thus enhancing archaeological and biological research.
This paper examines methods for the detection of aguadas using a combination of satellite images and lidar-derived digital elevation models (DEMs), focusing on the Bajo El Laberinto region, an area formerly densely populated by the ancient Maya situated in the southern part of the Calakmul Biosphere Reserve (CBR), an area presently devoid of permanent human occupation and heavily forested.

1.1. The Bajo El Laberinto Region and Its Significance in Maya History

Bajos, local karst landscape depressions, are a characteristic geomorphological feature of the EIR. These low-lying areas originate from a combination of limestone dissolution and faulting and range in size from smaller (one to several square kilometers or “pocket bajos”) to sprawling giants of over several hundred square kilometers, receiving runoff from surrounding areas of higher elevation and resulting in seasonal flooding [6,7,8]. These features are also sometimes called “poljes” in the geological literature [9,10,11].
The Bajo El Laberinto is located in the southeastern part of the state of Campeche and is one of the largest bajos in the EIR (Figure 1). The climate of the Bajo El Laberinto region is sub-humid tropical with an average annual temperature of 27 °C, with average extremes of 20 and 34 °C [12]. Mean annual rainfall is between 1200 and 1500 mm, most of which falls between June and November, during which time aguadas typically refill with water. However, inter-annual variation can be considerable, driven in part by the occurrence of tropical cyclonic storms and droughts that occur frequently.
In general terms, the vegetation of the Calakmul region has been classified as “moist semi tropical forest” [13] and “high to medium evergreen forest” [14], both of which recognize the profound effect played on plant growth by the wet–dry precipitation regime. Following ground surveys that included the identification of 1537 plant species, Martínez and Galindo-Leal [15] proposed a detailed classification of the vegetation of the CBR based on dominant species assemblages.
Using a combination of remote sensing imagery and ground survey, Vázquez-Alonso et al. [16] proposed a simpler classification that identified four types of forest: Upland, Transition, Lowland, and Wetland. Upland forest corresponds with well-drained limestone uplands, Lowland with bajos, and Transition with gradients between these two, whereas Wetlands correspond largely to aguadas and represent a small percentage (<1%) of the forest cover.
The Bajo El Laberinto is surrounded by numerous archaeological sites of varying size, including Calakmul, one of the largest sites in the Maya Lowlands [17,18,19,20], the large site of Yaxnohcah [21], and numerous smaller sites such as El Laberinto, Pared de los Reyes, Olvidado, and Los Tambores, among others [22,23,24]. In this study, two lidar-derived DEMs covering the Yaxnohcah-Pared de los Reyes and Calakmul areas along the northwest and southeast margins of Bajo El Laberinto were analyzed, covering a total of 252 km2, along with satellite imagery spanning some 1197 km2, covering the entire bajo and surrounding areas (Figure 1).
Bajo El Laberinto is thought to have played a major role in the early political-economic organization of the Maya Lowlands because of its potential use as an artery of trans-peninsular trade, a factor that may help account for the high density of ancient Maya communities in the region as well as the establishment of the powerful Kanu’l dynasty at Calakmul in the Late Classic period (550–800 CE) [25,26,27,28].

1.1.1. Overview of the Yaxnohcah-Pared De Los Reyes Area

This area has been investigated by the Yaxnohcah Archaeological Project beginning in 2011. More recently, the project has expanded its study area to include the entire Bajo El Laberinto region and changed its name to the Bajo El Laberinto Archaeological Project (PABEL by its initials in Spanish). Lidar was flown over 100 km2 in 2014 and includes the area of Yaxnohcah and the region around Pared de los Reyes [29] (see Figure 1). A key deliverable of the lidar data collection was a digital elevation model (DEM) of the ground surface under the jungle vegetation cover. Notable settlement features include large and small Preclassic (800 BCE–200 CE) triadic groups, pyramids, causeways, hundreds of residential patio groups, and dozens of aguadas, among other features.
Initial work focused on Yaxnohcah, a large site featuring numerous nodes of Preclassic monumental architecture, many of which were connected by causeways. Yaxnohcah continued to be occupied through the Classic period with at least some settlement in the Postclassic (900–1500 CE) [21,30,31,32,33,34,35]. One of the long-term research interests of the project has been the study of the regional physical-biotic environment and the long-term adaptive strategies of its inhabitants. As part of this investigation, the strategies used to obtain water have been an important focus.
These investigations included ground visits to aguadas identified on the DEM followed by excavations or sediment coring in some of these features [36,37]. Furthermore, GIS analysis was employed to identify smaller closed depressions visible on the Digital Elevation Model (DEM) as potential water-collecting and -storage features. Subsequent excavations revealed that many of these depressions had been modified to retain water, thereby functioning as “household reservoirs.” It is hypothesized that these domestic reservoirs originated as limestone quarries utilized for the production of construction materials [38,39].
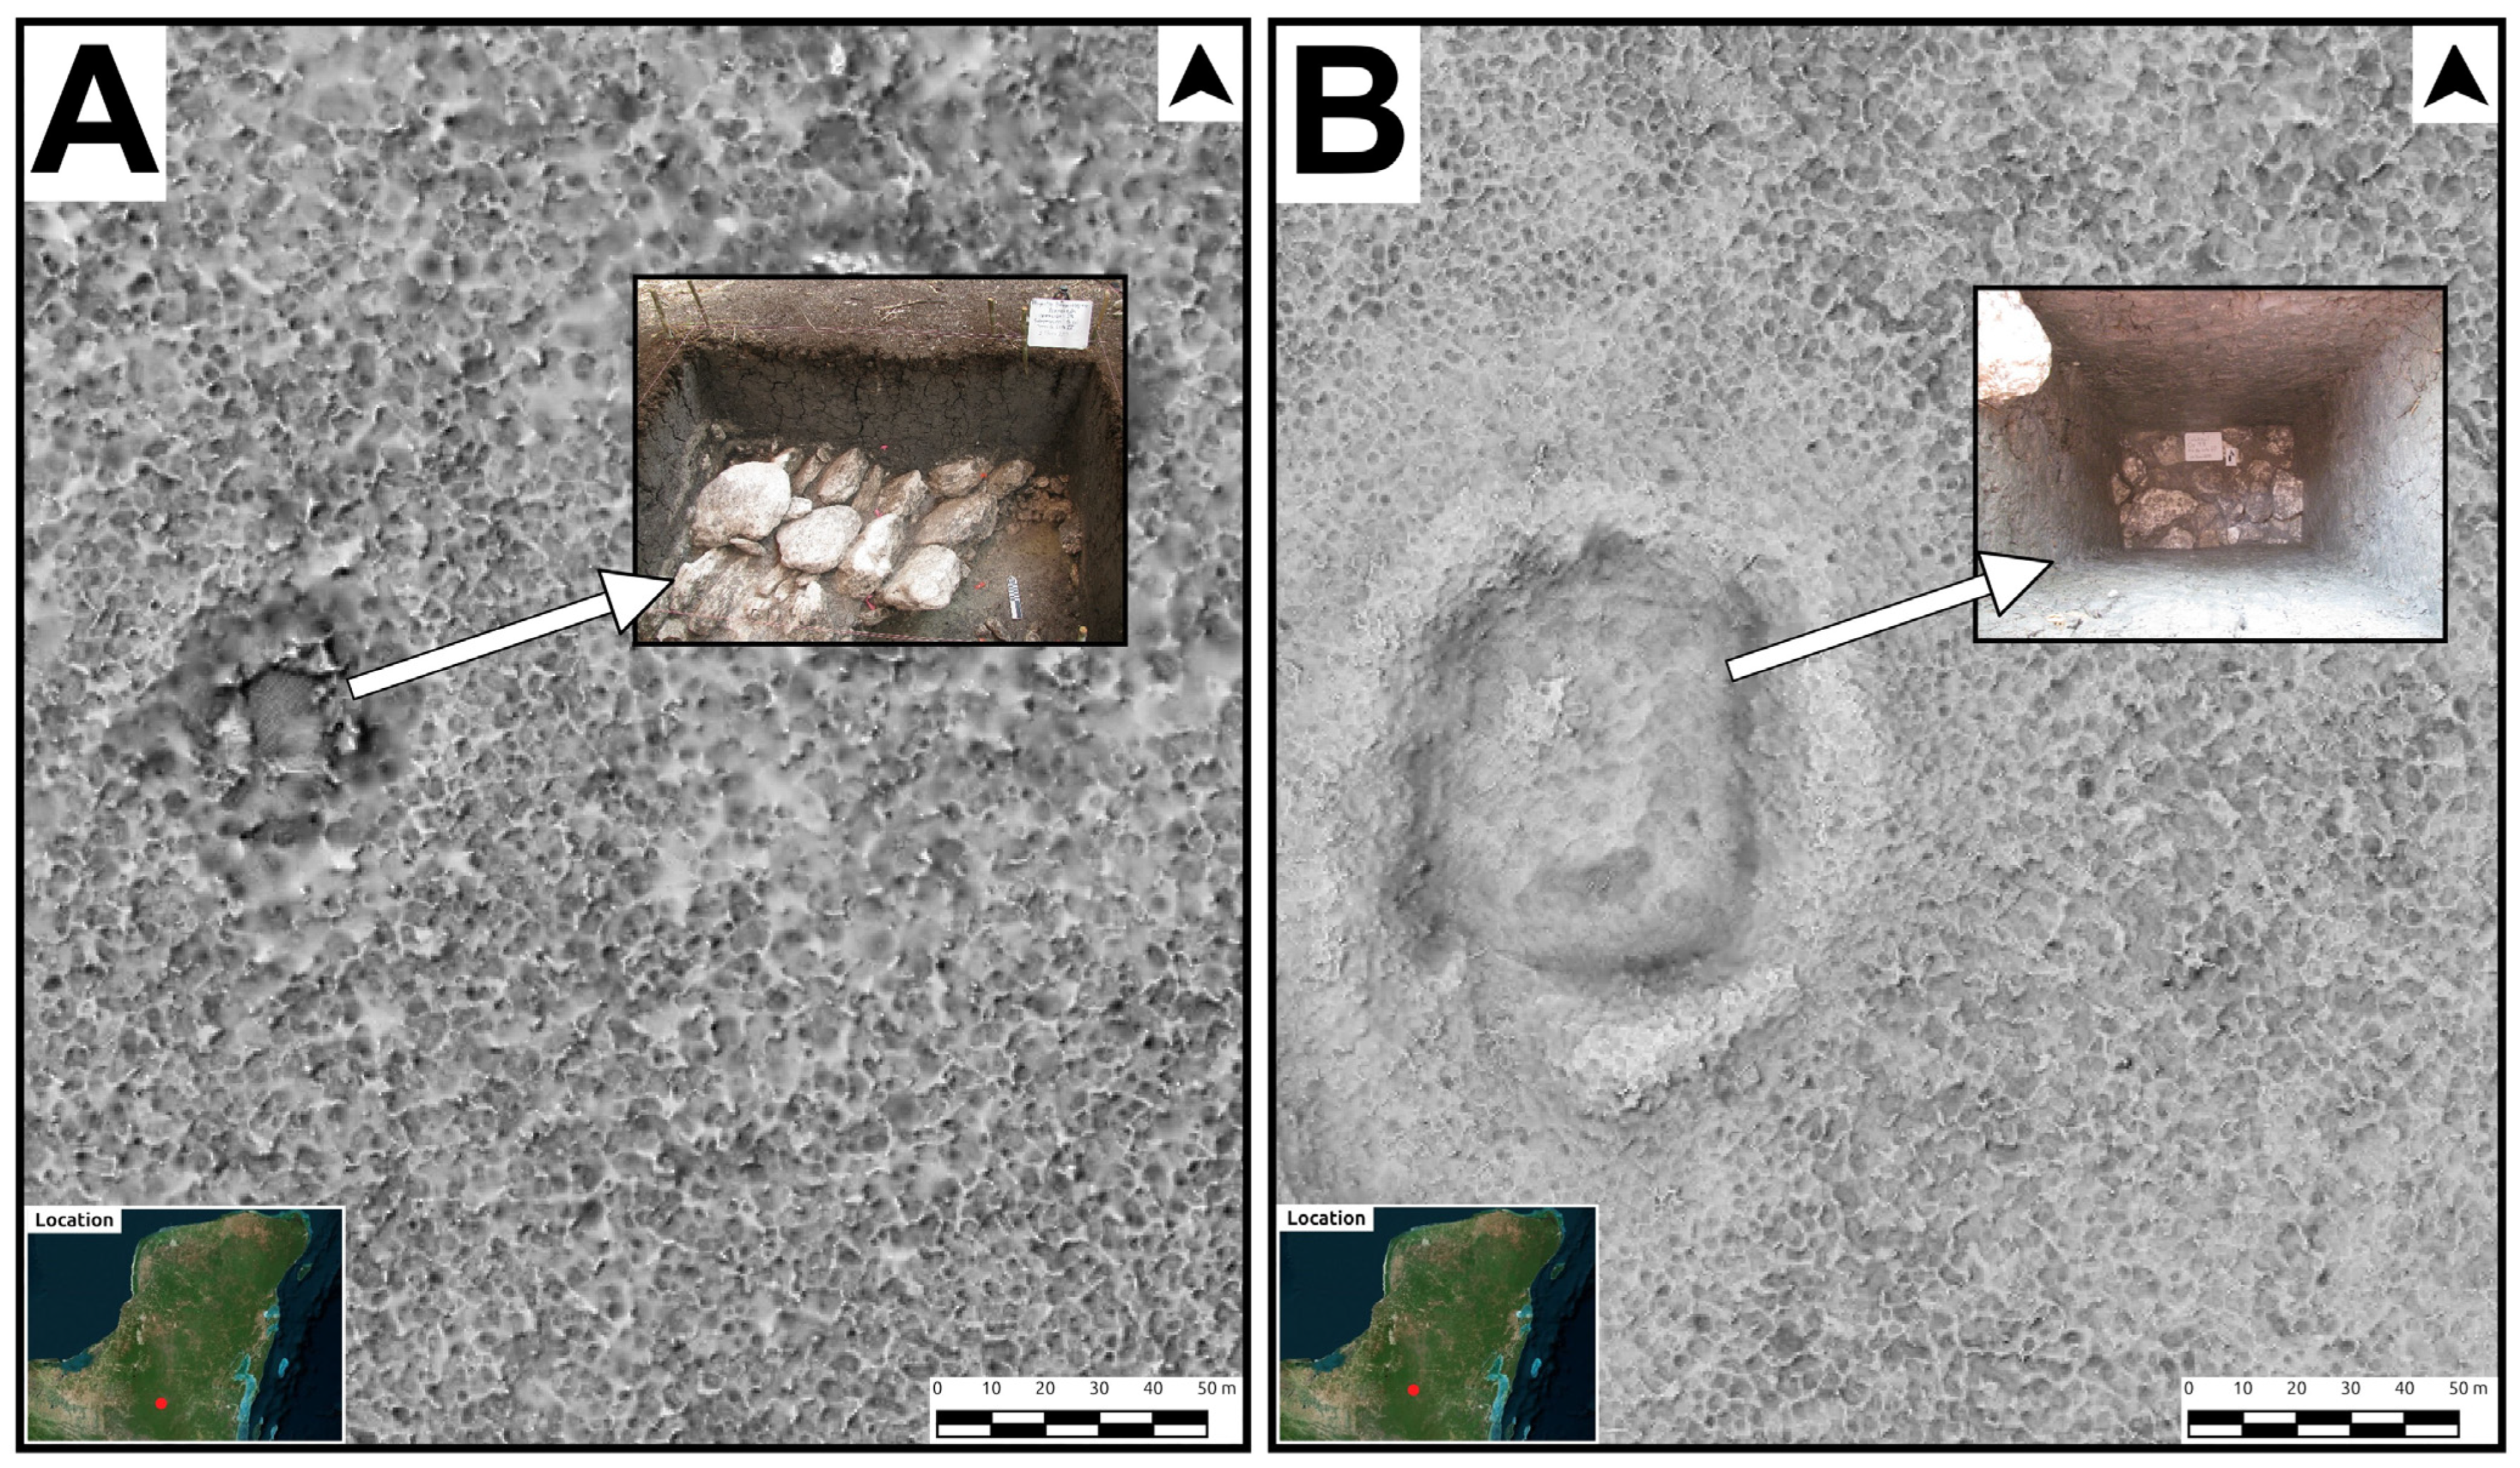
Excavations and coring in seven large aguadas at Yaxnohcah by the project revealed that while these features may have originated as natural low spots in bajos, they were all heavily modified by human activity that included quarrying of bedrock, deepening of interior tanks, and enclosure within surrounding berms with periodic maintenance, especially dredging, also evident [40,41]. In short, these aguadas were largely anthropogenic in origin (Figure 2A).

1.1.2. Overview of the Calakmul Area

The second Lidar dataset used in this study encompasses the northwest margin of Bajo El Laberinto, where the primary site of Calakmul was established. This center was one of the largest cities of the Classic Maya, and has been the subject of several in-depth investigations, including excavations and architectural restorations for many years and across different projects [17,18,19,42].
Calakmul’s aguadas were investigated by Ávila and Folan [18], who carried out an inventory of these reservoirs based on information provided by chicleros, men who ventured into the forest to tap the sap of sapodilla (gum) trees. Domínguez and Folan [18] and Folan et al. [43] subsequently conducted excavations in several of these reservoirs and proposed a classification system based on their topographic position and water storage capacity. Currently, the PABEL is investigating several aguadas at the site through field inspection, lidar-based analysis, and excavations (Figure 2B).
The second Calakmul-focused lidar-derived DEM used in this research was more recently obtained in 2022 and covers roughly 150 km2 along the northwest flank of the Bajo El Laberinto (Figure 1). The DEM encompasses not only the central area of Calakmul but also its surroundings, where numerous archaeological features, including causeways, platforms, terraces, field walls, and dozens of aguadas, have been identified. These elements reveal the extensive and complex modification of the landscape made by the ancient inhabitants of this region.
The PABEL is continuing efforts to identify, classify, and functionally analyze the region’s aguadas. An important part of this research is the initial identification of aguadas on both lidar and other imagery for areas for which lidar is not currently available, as described here.

1.2. Aguadas: Primary Characteristics and Definitions

The existence of aguadas and their anthropogenic nature was first brought to the attention of the outside world by John Lloyd Stephens in the mid-19th century as a result of his explorations of the Puuc and Chenes regions in the northern reaches of the EIR [44]. Other early outside visitors to the EIR noted the ubiquity of aguadas around ancient Maya sites, including Ruppert and Denison [24] in their explorations in southern Campeche. Such early archaeological explorers were often taken to sites for the first time by chicleros who depended on aguadas for water to survive during their dry season collection of chicle sap from the chico zapote tree.
In recognition of their importance to understanding the ancient Maya occupation of the EIR, archaeologists have been increasingly addressing aguadas and other water management features (e.g., [7,8,18,40,45,46,47,48,49,50]). The results of these works have shown that while some aguadas had a natural origin, they were highly modified, reflecting the hydraulic engineering skills of the ancient Maya, whereas others were clearly built entirely by Ancient Maya settlers.
Investigations of aguadas that have included excavations have ranged from the southernmost part of the EIR around Tikal [7,51] and El Zotz [52] to the region’s northern limits in the Puuc region at Uxmal, Xuch, and Xcoch [53,54,55,56]. These investigations have collectively documented the huge investment that the ancient Maya of the EIR made in the procurement of water, its storage, and cleanliness that was an integral part of their towns and cities. Thus, to better understand the distribution of ancient settlements, the identification of aguadas across the region is essential.
The Dictionary of the Royal Spanish Academy [57] defines an aguada as “Sitio en que hay agua potable a propósito para surtirse de ella” (place where there is drinking water with the purpose of storing it). This definition implies both the presence of clean water and the intentionality of the creation of these features. However, in its most common usage in the Maya Lowlands, aguada simply means a pond that contains water for at least part of the year. Across the low-lying coastal plains of northern parts of the states of Yucatan and Campeche, the term “aguada” is also used to refer to natural karst sinkholes, or “cenotes,” with contain water and feature clay-sediment plugged bottoms. For the purposes of this study, we exclude those areas on the coast and the north of Yucatán and focus on the water-bearing ponds of the EIR. Researchers have used a variety of definitions for aguadas within the EIR, as outlined in Table 1.
Aguadas have various forms (rectangular, circular, rhomboid, irregular) and may be in several topographical contexts such as “bajo margin,” “in pocket bajo,” or “in bajo.” The variability in size and volume is also significant, ranging from a few square meters to 4 hectares for the largest reported case (Aguada 1 of Calakmul). Furthermore, it is possible to differentiate between open and closed canopy types.
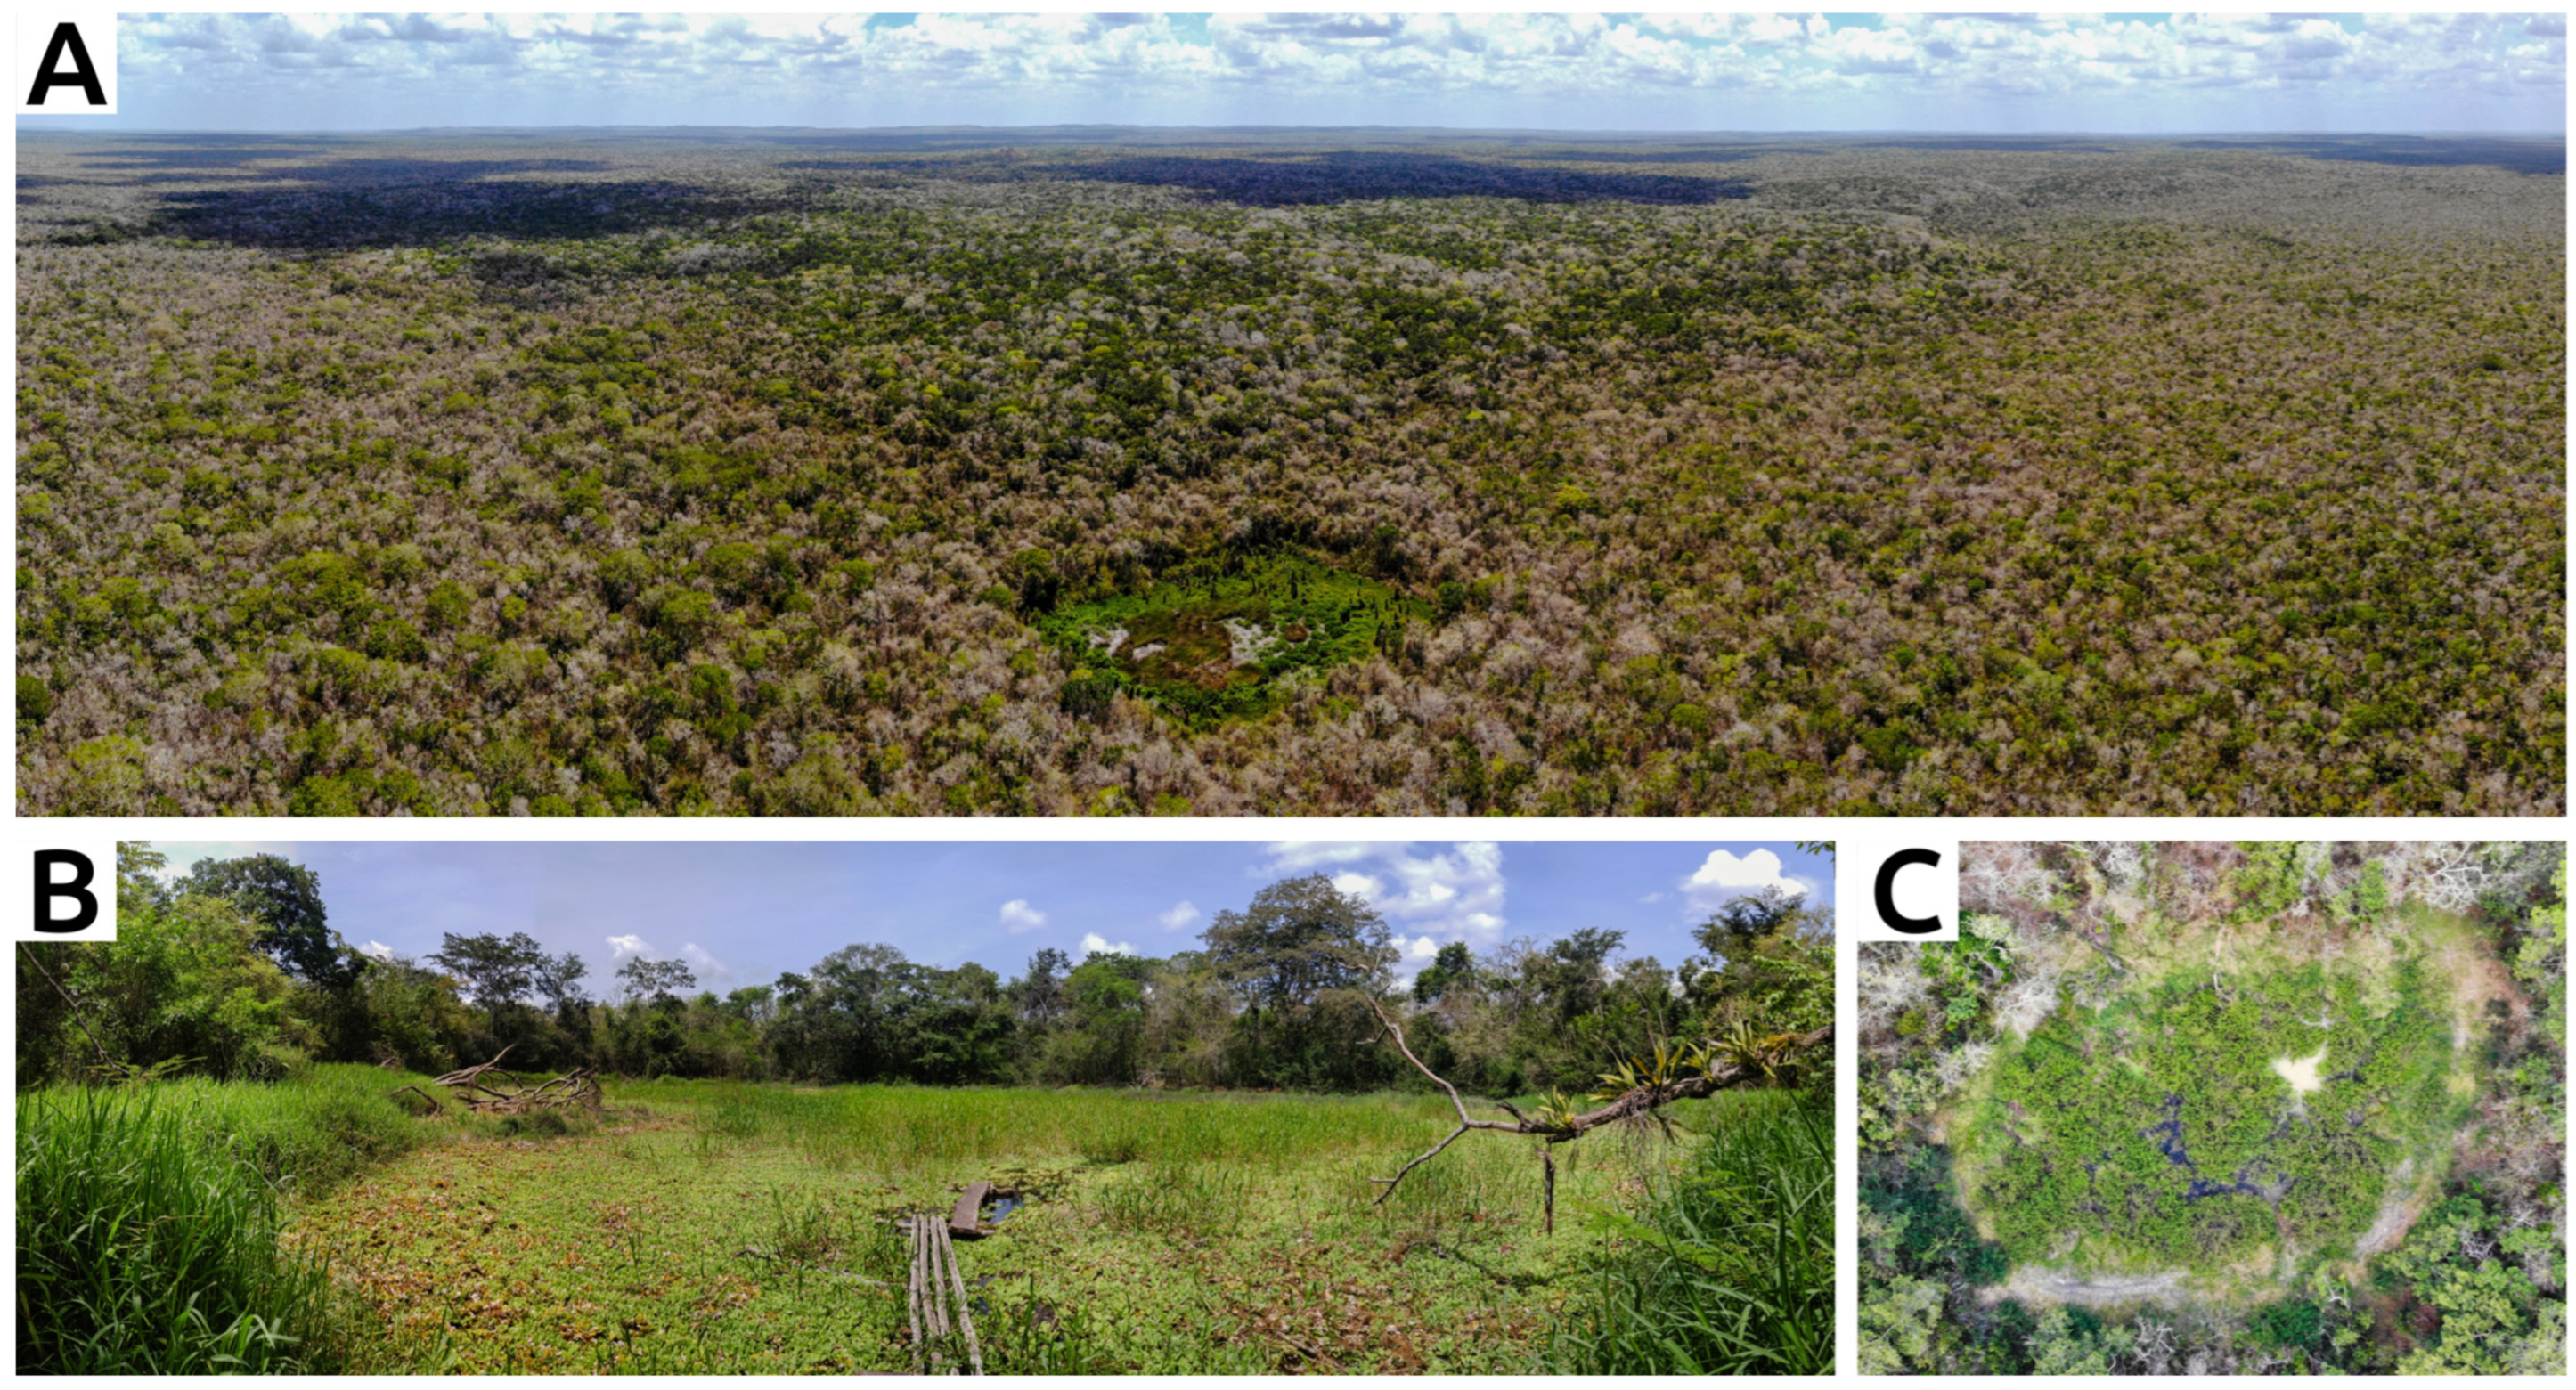
Open canopy aguadas comprise a region of open space that, contingent upon the timing of image acquisition, may exhibit a visible pool of open water or sparse, herbaceous vegetation. The “open space” is characterized by a gap in the forest canopy, indicating an absence of trees in or above the water-holding area (Figure 3). In contrast, closed canopy aguadas have tree foliage that is sufficiently dense to obscure the visibility of any or most water.

1.3. Location of Aguadas and Remote Sensing

Traditionally in Mayan archaeology, aguadas have been identified chiefly via ground survey, either via systematic mapping or by guidance by local informants [25,57]. Domínguez and Folan [18] recorded 494 aguadas for the southern area of the Calakmul Reserve, based on local informants including former chicleros, though the archaeologists only confirmed a small number of these features via site visits.
An extensive study carried out by García and his team [5], sponsored by the National Commission for the Knowledge and Use of Biodiversity of Mexico, CONABIO by its initials in Spanish [63], used a wide sample of aerial photographs to examine geomorphological and hydrological characteristics, land utilization, and conservation status of the CBR. This study constitutes the first investigation throughout the entire CBR region (including northern and southern segments), identifying a total of 1353 possible aguadas.
The original photographs used by these researchers are unavailable; however, the survey findings can be accessed and downloaded from the CONABIO online database [63]. This geographic database of water bodies will thereafter be employed to compare the findings presented in this research.
The application of lidar technology has revolutionized archaeology around the world [64,65]. In the Maya Lowlands, this technology has revealed the intricacies of ancient settlements, the spatial organization of sites, and the natural landscape, as well as the modifications made by the ancient Maya to the landscape, including roadways, agricultural terraces, canals, and water reservoirs, among other features.
An example of this technology’s application is the research conducted by Šprajc et al. [66], which employed a 230 km2 lidar-derived digital elevation model (DEM) of Chactún in the northern Calakmul Reserve to identify 94 aguadas, although none were excavated. In the Pared de los Reyes area, Dunning et al. [36] conducted a survey of aguadas employing a combination of the lidar-derived DEM, satellite imagery, ground visits, and sediment sampling. Additionally, Flores is conducting a supplementary survey involving field visits to aguadas near the Yaxnocah and Calakmul site core regions [37].
Conversely, satellite imagery also has been used to identify aguadas in the Maya area, as is the work of Thomas [67], who identified a series of aguadas in the northern part of Tikal National Park (Guatemala), using IKONOS and AirSAR satellite images and the application of filters and visualizations.
The variety of shapes, locations, and sizes of aguadas requires the comparison of multiple remote sensing information sources to determine the most effective method for locating them and enhancing the observation of their main characteristics.

2. Materials and Methods

For this study, we utilized four types of remote sensing data: a lidar-derived digital elevation model (DEM) with a spatial resolution of 50 cm per pixel, covering two areas around the Bajo El Laberinto; a collection of orthophotos derived from aerial photography captured by the Mexican Institute of Geography and Statistics, or INEGI as it is known by its Spanish initials [68]; satellite-derived web mosaics from Bing Maps (Microsoft, 2024) [69], ESRI (2024) [70], and Google Earth (Google, 2024) [71]; and satellite multispectral images from Planet (2024) [72] and the European Space Agency (ESA, 2024) [73].
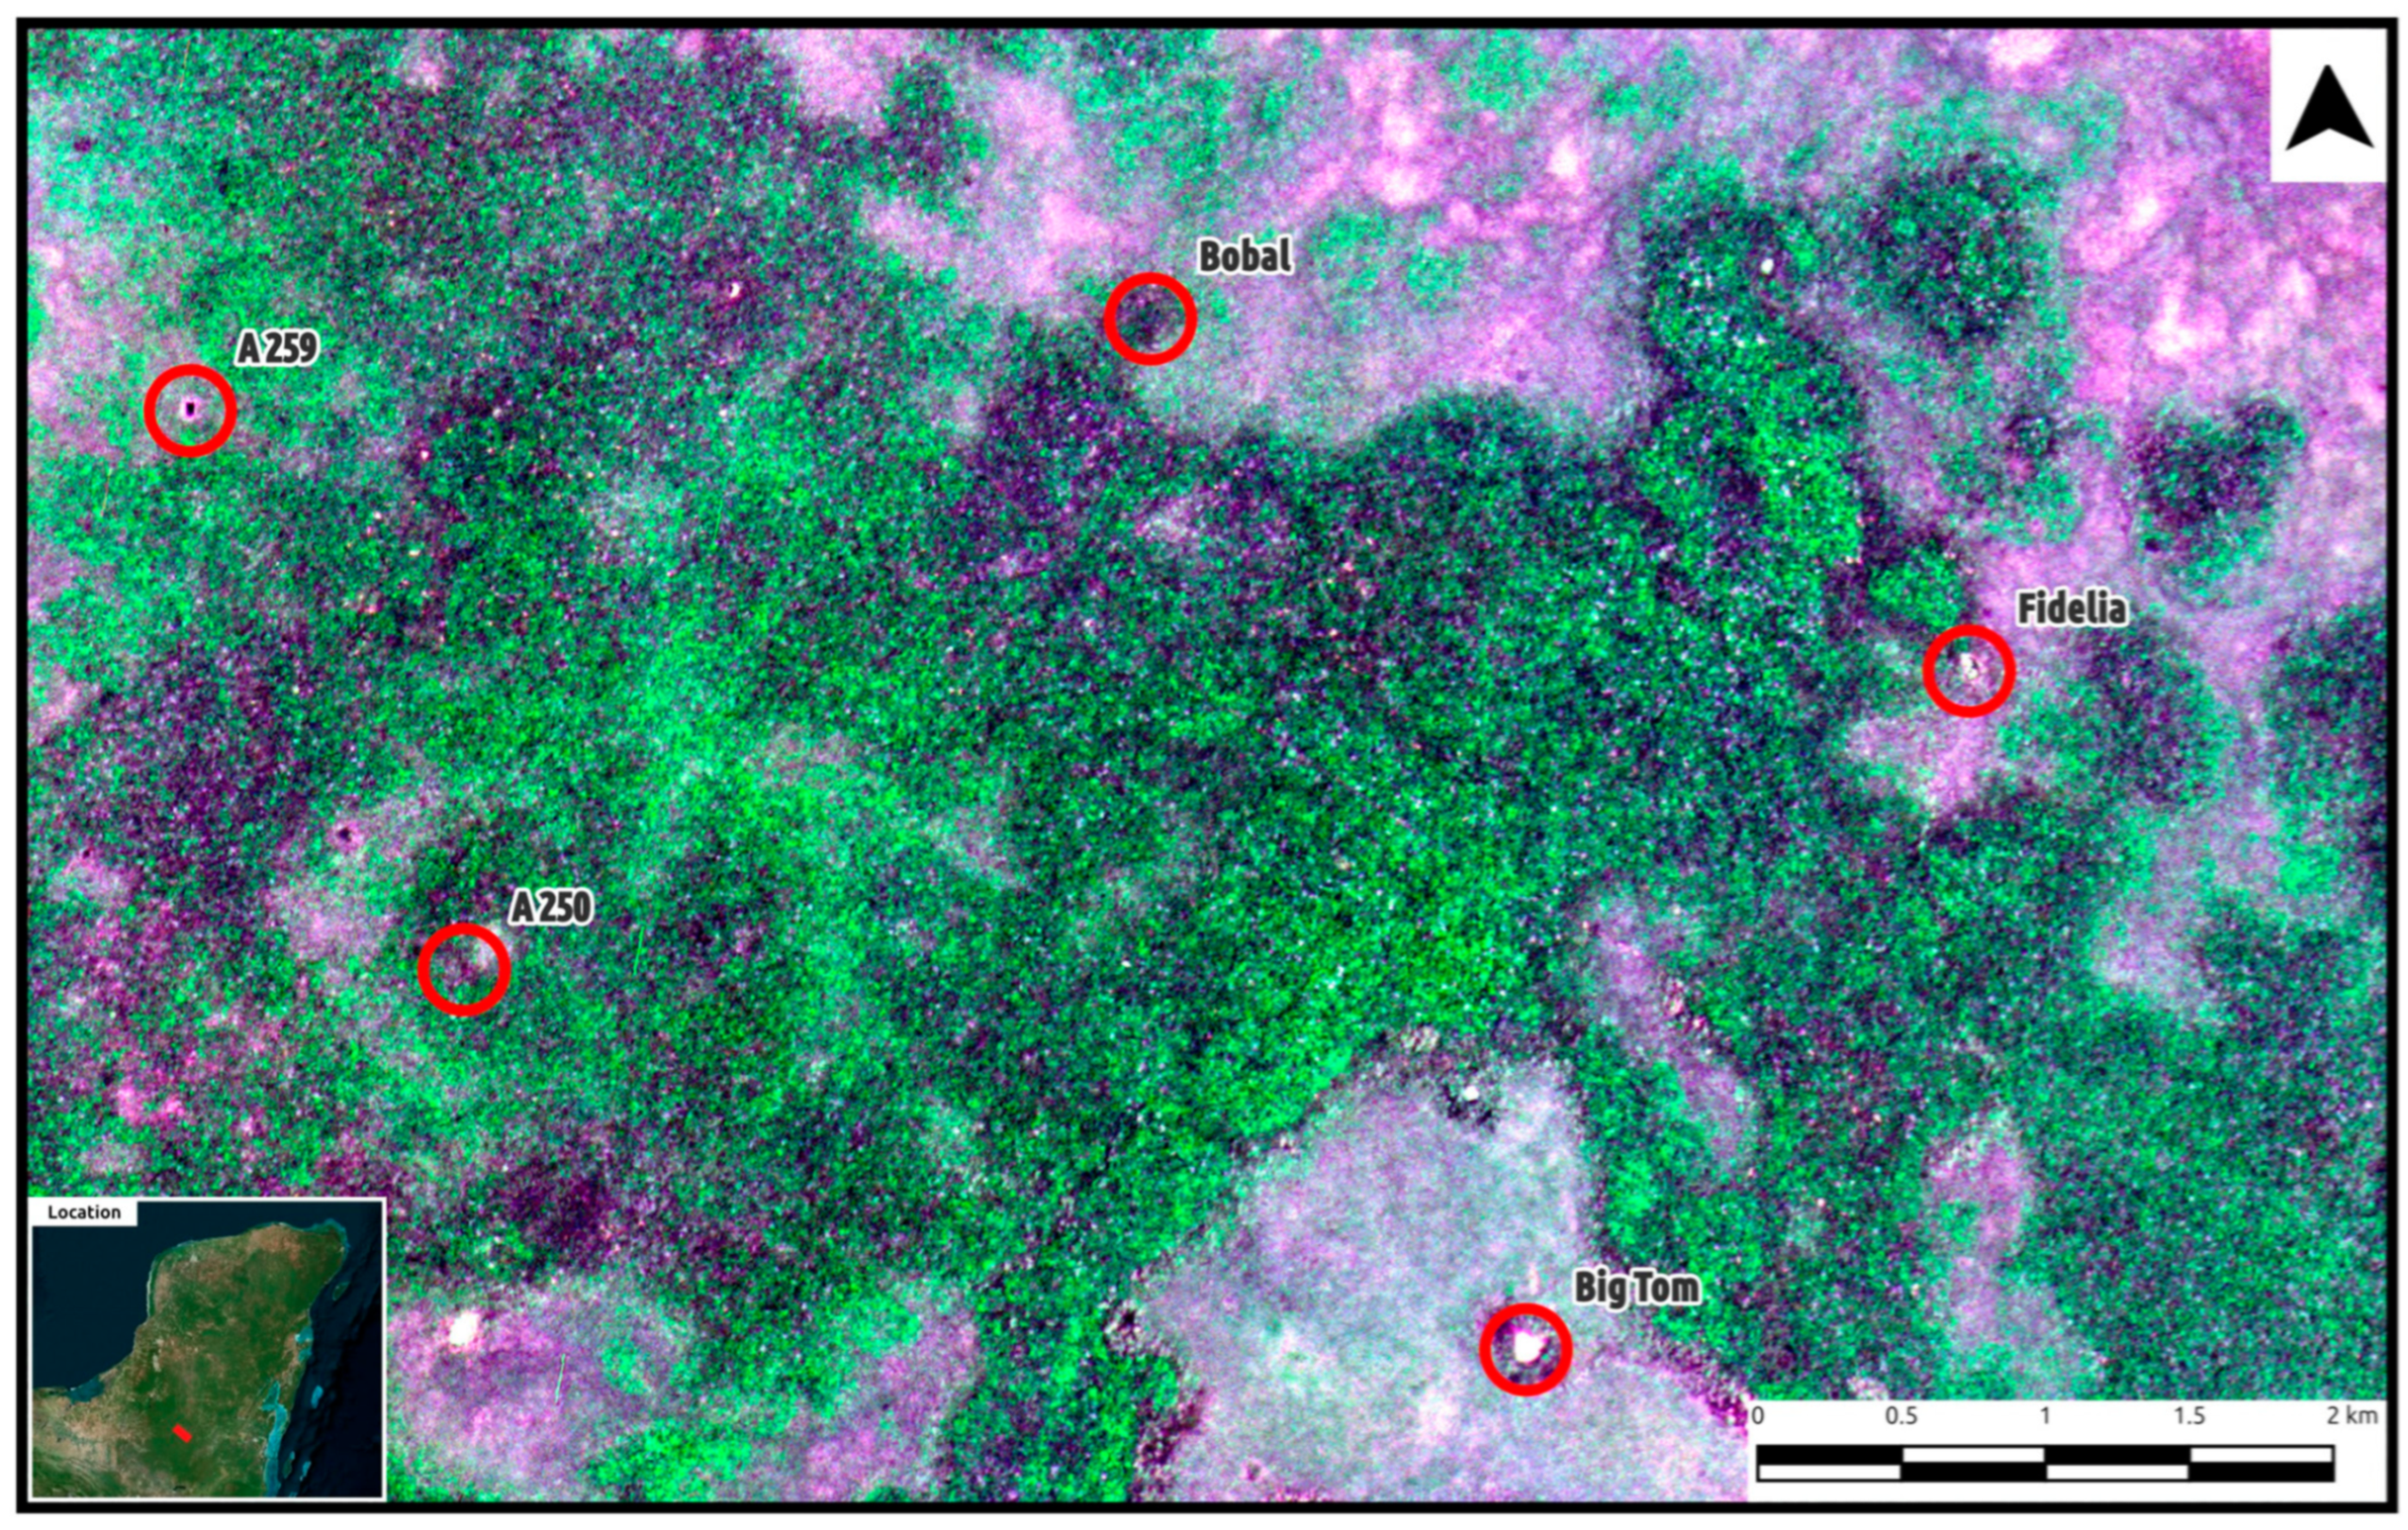
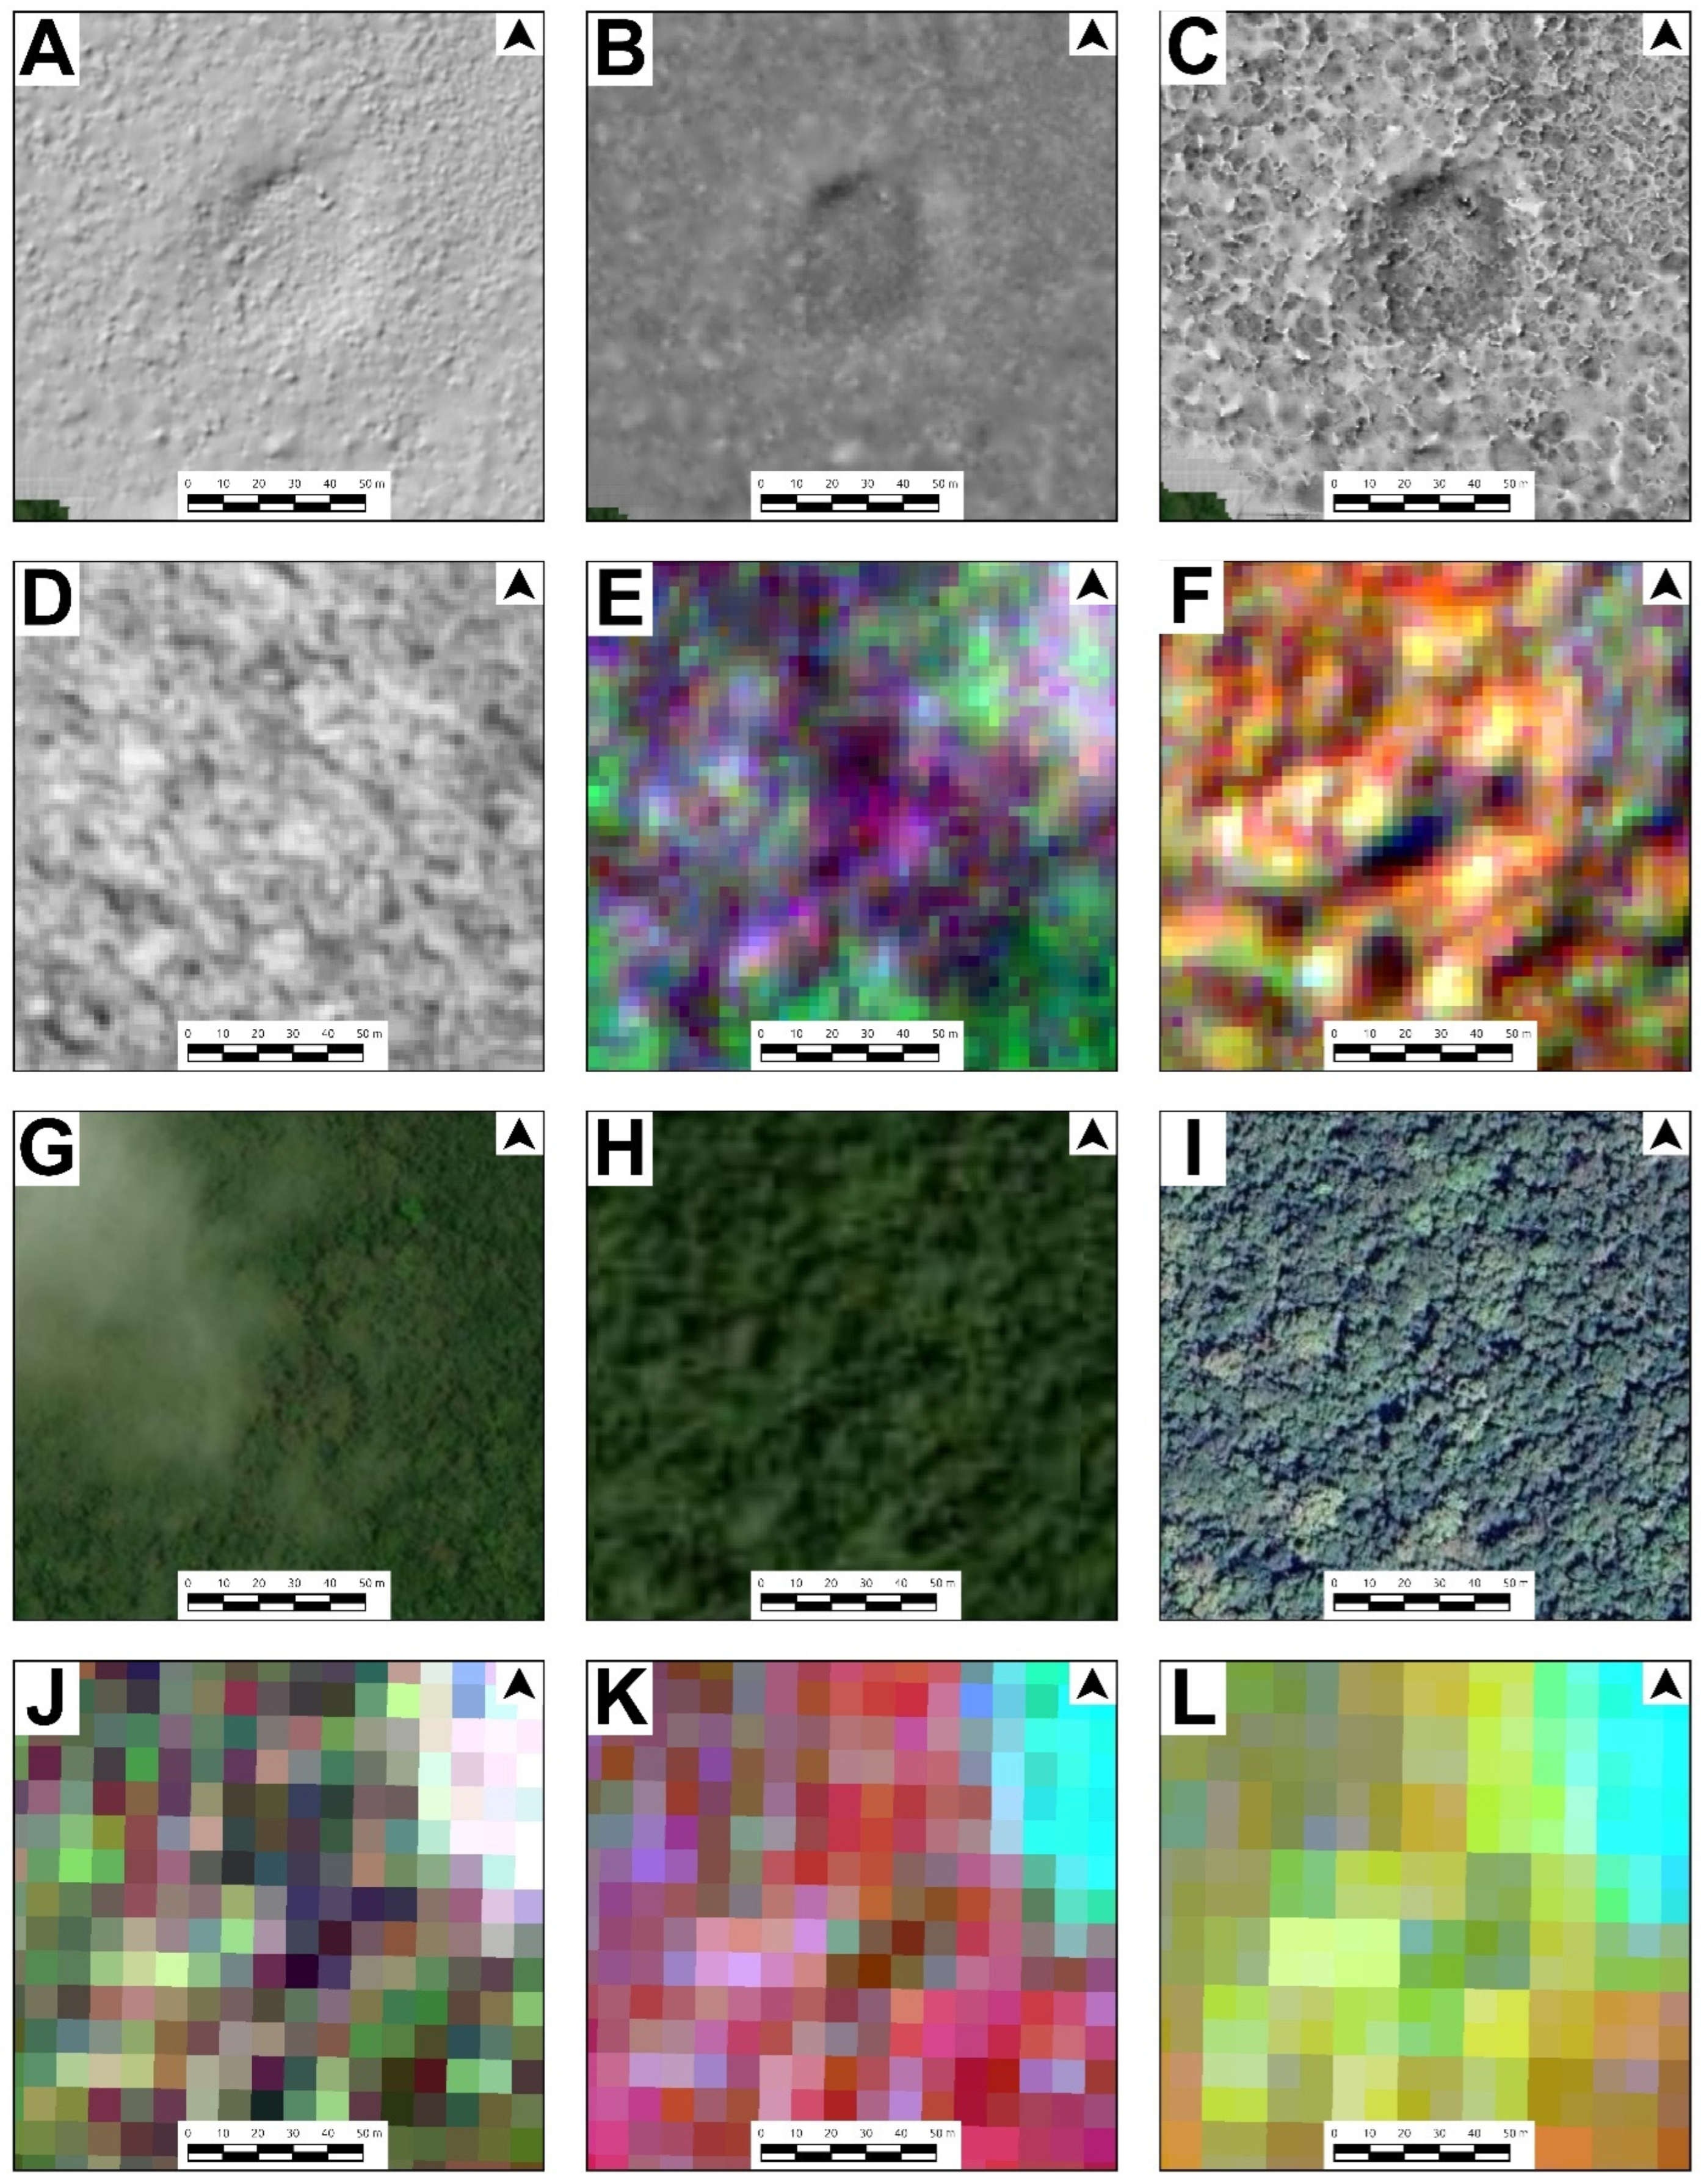
This study employs multiple visualizations to compare and assess which images deliver better information for identifying aguadas and to determine their respective limitations. To illustrate the effectiveness of each source, we utilized five aguadas with varying types of vegetation as an example of the comparison process we conducted in this work (Figure 4).
Lidar-based imagery offers intricate detail and accuracy in topographic relief due to its ability to remove the vegetation and show the “bare earth”. Nonetheless, the costs associated with lidar data collection limit its utilization. Orthophotos are a significant source of remote sensing data due to their nationwide coverage and free accessibility. These monochromatic photos document the surface as it appeared at the moment of capture, including the vegetation and clouds present during the recording.
As a supplementary resource, satellite imagery has become increasingly cost-effective recently while also improving its spatial, spectral, and temporal resolutions. As a result, it has become a valuable source for identifying aguadas, as well as visualizing environmental changes over time. Although satellite imagery can be obstructed by objects such as clouds or vegetation, resulting in limited visibility of ground features, specific visualizations and bands (such as infrared) can overcome these limitations to a large degree.
Lidar, aerial photographs (orthophotos) and satellite imagery are acquired via fundamentally different technologies, each with its own set of pros and cons. By combining these three data sets and utilizing various visualizations, it is possible to find far more aguadas than in previous studies, such as the Garcia et al. survey [5], whose database is hosted on the CONABIO website [63]. In the subsequent section, we compare different image types and visualizations employed to construct a regional aguada database.

2.1. Lidar DEM and Visualization Techniques

The lidar digital elevation model (DEM) of the Yaxnohcah-Pared de los Reyes and the Calakmul region cover a total area of approximately 240 square kilometers with a spatial resolution of 50 cm. These DEMs underwent additional processing utilizing QGIS’s Relief Visualization Toolbox (RVT) plugin, which has been described in detail by Kokalj and colleagues [74,75,76]. RVT enables the automated generation of a variety of visualizations to enhance the identification of features and emphasize terrain characteristics that are not easily visible through conventional shading techniques like unidirectional hillshading.
Although each of the visualizations can be useful for identifying some features within the DEM, in many cases the combination of several provides better results for the identification of topographic features, buildings, and other elements of the landscape [68]. For the identification of aguadas, in addition to the basic hillshade visualization, we used a Simple Local Relief Model (SLRM) and Visualization for Archaeological Topography (VAT).
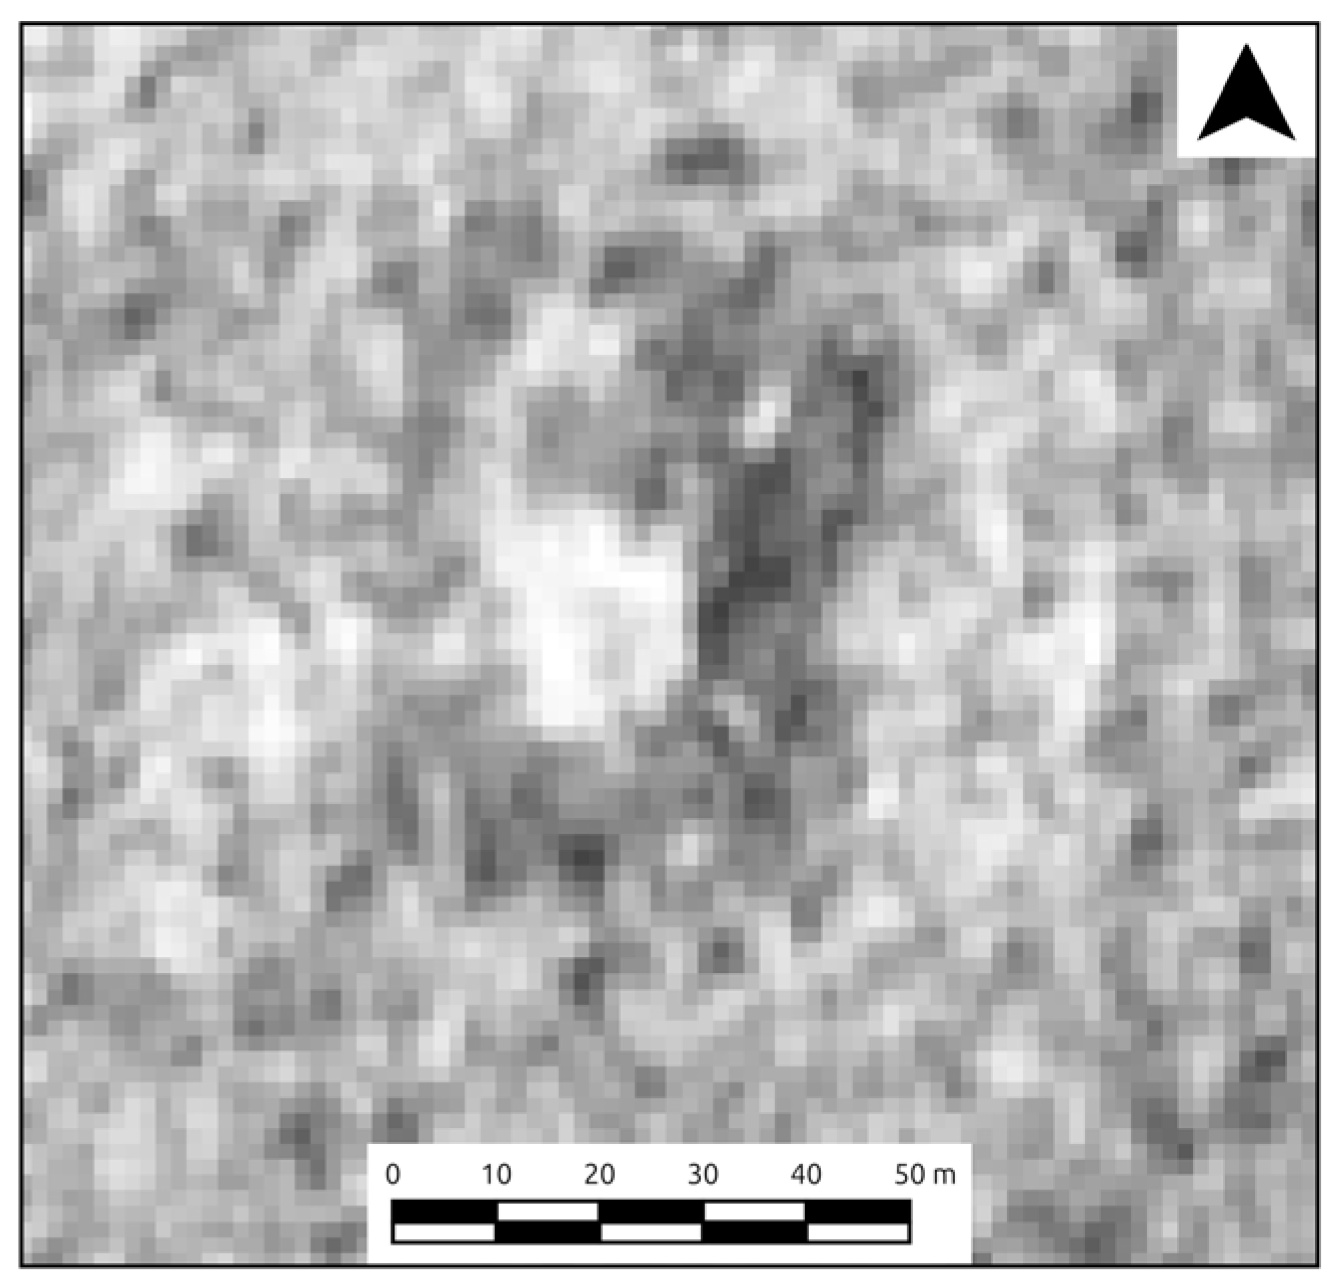
The SLRM is valuable for representing slight local elevation differences, eliminating larger-scale variations, and enhancing the visibility of shallow topographic features without depending on illumination angles [77]. This visualization effectively emphasizes minor slopes, making it an ideal tool for illuminating the berms bordering the aguadas and more accurately outlining their shape (Figure 5). The second visualization utilized, known as VAT, improves the identification of features in the DEM by amalgamating multiple visualizations into a single view. The sources employed for this combination include hillshade (HS) modeling, elevation gradient (SLP), positive topographic openness (OP), and Sky View Factor (SVF). These visualizations are combined as follows: SVF (blend type: multiplied, 25% opacity) with OP (blend type: overdose, 50% opacity) with SLP (blend type: lightness, 70% opacity) with HS.

2.2. Orthophotos Derived from Aerial Photographs

The photos are derived from aerial photographs captured by aircraft, from which displacements caused by camera or sensor tilt and lens aberrations have been removed, and they have been corrected and rectified by photogrammetric methods. Additionally, they have been orthogonally projected and georeferenced inside the national cartography of INEGI. This organization has utilized aerial photography techniques for around 48 years, employing scales of 1:20,000, 1:10,000, and 1:5000 [78].
The photographs are accessible on the INEGI website, and the aforementioned scales are available throughout Mexico. Orthophotos serve different purposes, such as mapping, land use, agriculture, cadastral, hydrology, vegetation evaluation, and land planning, among others [79,80,81]. Aerial photographs offer the advantage of being captured from a closer distance than satellite images, yielding enhanced spatial resolution compared to other remote sensing methods.
INEGI is presently assembling these orthophotos by integrating aerial photography and satellite imagery; however, the images from the decade preceding 2010 were sourced from aerial photographs captured by aircraft [78]. This analysis employed 1:20,000 scale photos, covering the whole Bajo El Laberinto region. The spatial resolution of these photos is 1.5 m per pixel, and they were captured in March 2003, as indicated by INEGI. Nonetheless, these photographs are monochrome and may be covered by clouds situated between the camera and the photographed area.
The orthophotos are acquired in raster format, with .bil or .tiff extensions, and upon download, they were included into QGIS (Figure 6). No further processing was conducted on these images, and the discernible aguadas in the set were identified and marked.

2.3. Satellite Images and Visualization Techniques

Satellite imagery is used across diverse fields, including agriculture, ecology, sustainable development, hydrology, meteorology, urban planning, and archaeology, among others [82,83]. Such imagery is sourced from active sensors that emit and receive energy, or passive sensors that only receive energy from the electromagnetic spectrum.
Electromagnetic energy travels in waves, creating what is known as the electromagnetic spectrum, which ranges from longer radio waves to very short gamma rays that pass through a series of intermediate amplitudes. Although the human eye can only perceive a small portion of the spectrum corresponding to visible light, other wavelengths can be captured by sensors and devices, imperceptible to our eyes [84]. Most satellites utilize sensors of this nature to gather diverse segments of the electromagnetic spectrum that are reflected from the surface of the Earth. The resultant images are composed of separate bands, each representing a precise range of electromagnetic wavelengths.
Of particular interest for this study is the near-infrared band (NIR), which constitutes the portion of radiation situated immediately beyond the visible spectrum. NIR is subject to absorption, transmission, and reflection by Earth’s surface, vegetation, and water in a specific manner that enables the detection of several characteristics not discernible to the human eye.
For instance, during photosynthesis, plants absorb blue and red light to produce chlorophyll. As a result, a healthy plant with higher chlorophyll content will reflect more near-infrared energy compared to a diseased plant with lower chlorophyll levels. Consequently, healthier vegetation will appear more vibrant in reds when visualizing this band (NIR) combined with red and green bands, while those with low chlorophyll levels or diseases will appear paler. Likewise, regions lacking vegetation will exhibit a white or near-white hue [84,85,86].
The behavior of water in the NIR portion of the spectrum is a crucial indicator for this study. The absorption of energy by water allows for exact and effortless delimitation, while water’s reflection of light helps ascertain its composition. For instance, in a visualization utilizing an NIR+R+G combination, dark blue indicates water clarity, whilst cyan hues represent turbidity. This is because suspended particles and turbidity reflect more light, preventing its penetration, a phenomenon not observed in clear water where all light is absorbed [84,85]. Satellite imagery has become a widely used tool for delineating and monitoring water bodies in various regions [87].

RGB Mosaic Images from Web Platforms

Web-based mosaics display true color images that are generated using combinations of red, green, and blue (RGB) bands. It should be noted that the images are already rendered into a mosaic and are ready for user navigation. Although several mosaics produced by various companies achieve impressive peak spatial resolutions, there exists a considerable variation within the mosaic, ranging from 60 cm to 30 m per pixel, contingent upon the pictures utilized for mosaic integration, resulting in variable utility.
It is not always possible to easily access the technical information of the base image, such as the resolution and date they were taken, or the origin of the image itself, since only the update date of the mosaic is typically shown on the screen and, in some cases, the source of the image, but without further details. Although it is possible to access the metadata of the visualization through the developer mode of Internet browsers such as Mozilla or Chrome, the information is found within the programming code of the web page and only accounts for the spatial resolution of the image and the date of creation.
The primary advantages of these internet mapping platforms include global coverage, minimal cloud interference, and varied zoom levels that can reach up to 19 or more levels of magnification. Another advantage of the images provided by Internet mapping platforms is their accessibility, as they can be viewed on any device with an Internet connection without the need for additional software and can be easily accessed through any Web browser. Although specialized applications for mobile devices or PCs are available, they are not necessary for most applications. Furthermore, the navigation between tiles exhibits exceptional intuitiveness, providing the ability to attach Supplementary Information layers, including vector layers, that can be overlaid.
Although multiple online mapping platforms are available, this study utilizes widely used options including BingMaps [69], ESRI [70], and Google Earth [71] (Figure 7). These platforms were integrated into QGIS (v.3.34) by means of Tile Map Service (TMS) or the Quick Maps Service plugin (2024) [88]. It is important to note that these web mosaics are regularly updated and may include new, higher-resolution satellite imagery in the future. Additionally, platforms like Google Earth and ESRI feature a history of mosaics, which can provide valuable insight into how an area has changed over time, with varying levels of spatial resolution.

2.4. Multispectral Imagery

As a fourth source of data, the study utilized multispectral images from two satellite constellations, Sentinel 2 and Planet. Sentinel 2, developed by the European Space Agency (ESA), provides images with 13 spectral bands and a resolution range of 10–60 m. It covers land areas since 2015 and updates every five days. Its primary advantage lies in its spectral resolution because it covers a significant segment of the electromagnetic spectrum. Consequently, the imagery generated by this constellation is highly beneficial for multiple studies.
Sentinel 2 images are open access and have a historical archive that goes from 2015 to the present, which can be easily consulted on the U.S. Geological Service website [89], where it is possible to select an area of interest and the date required to carry out a specific investigation.
The other set of multiband images used was the Planet constellation, which is compiled by a private company of the same name. This company has a wide variety of products, and the complimentary imagery used for this study includes only four bands, RGB (red, green and blue) and Near Infrared (NIR), with a spatial resolution of 3 m. Even though these images have fewer spectral bands than the previously mentioned ones and are not as useful for some studies, they are very useful for the identification of small features, given their high spatial resolution.
Another great advantage of Planet images is the temporal resolution provided by its large image repository, which has daily imagery data captured by the satellite network. This feature enhances the chance of finding cloud-free imagery from different times of the year. The main drawback, however, is that the imagery is provided by a private company and therefore has a cost (but a cost much less than lidar).
Nevertheless, Planet provides a limited number of courtesy images for students and non-profit researchers, as part of the Education and Research Program [72], which was utilized for this research. A further advantage of satellite imagery is that a permit is not required to acquire the data, an often-difficult part of the process associated with obtaining lidar data. The study employed image sets from the Sentinel 2 constellation on 3 May 2021, and from Planet on 12 April of the same year. The sets were chosen due to the lack of clouds and cloud shadows (Figure 8). Table 2 summarizes the images used and their technical characteristics.

2.5. Identification Procedure

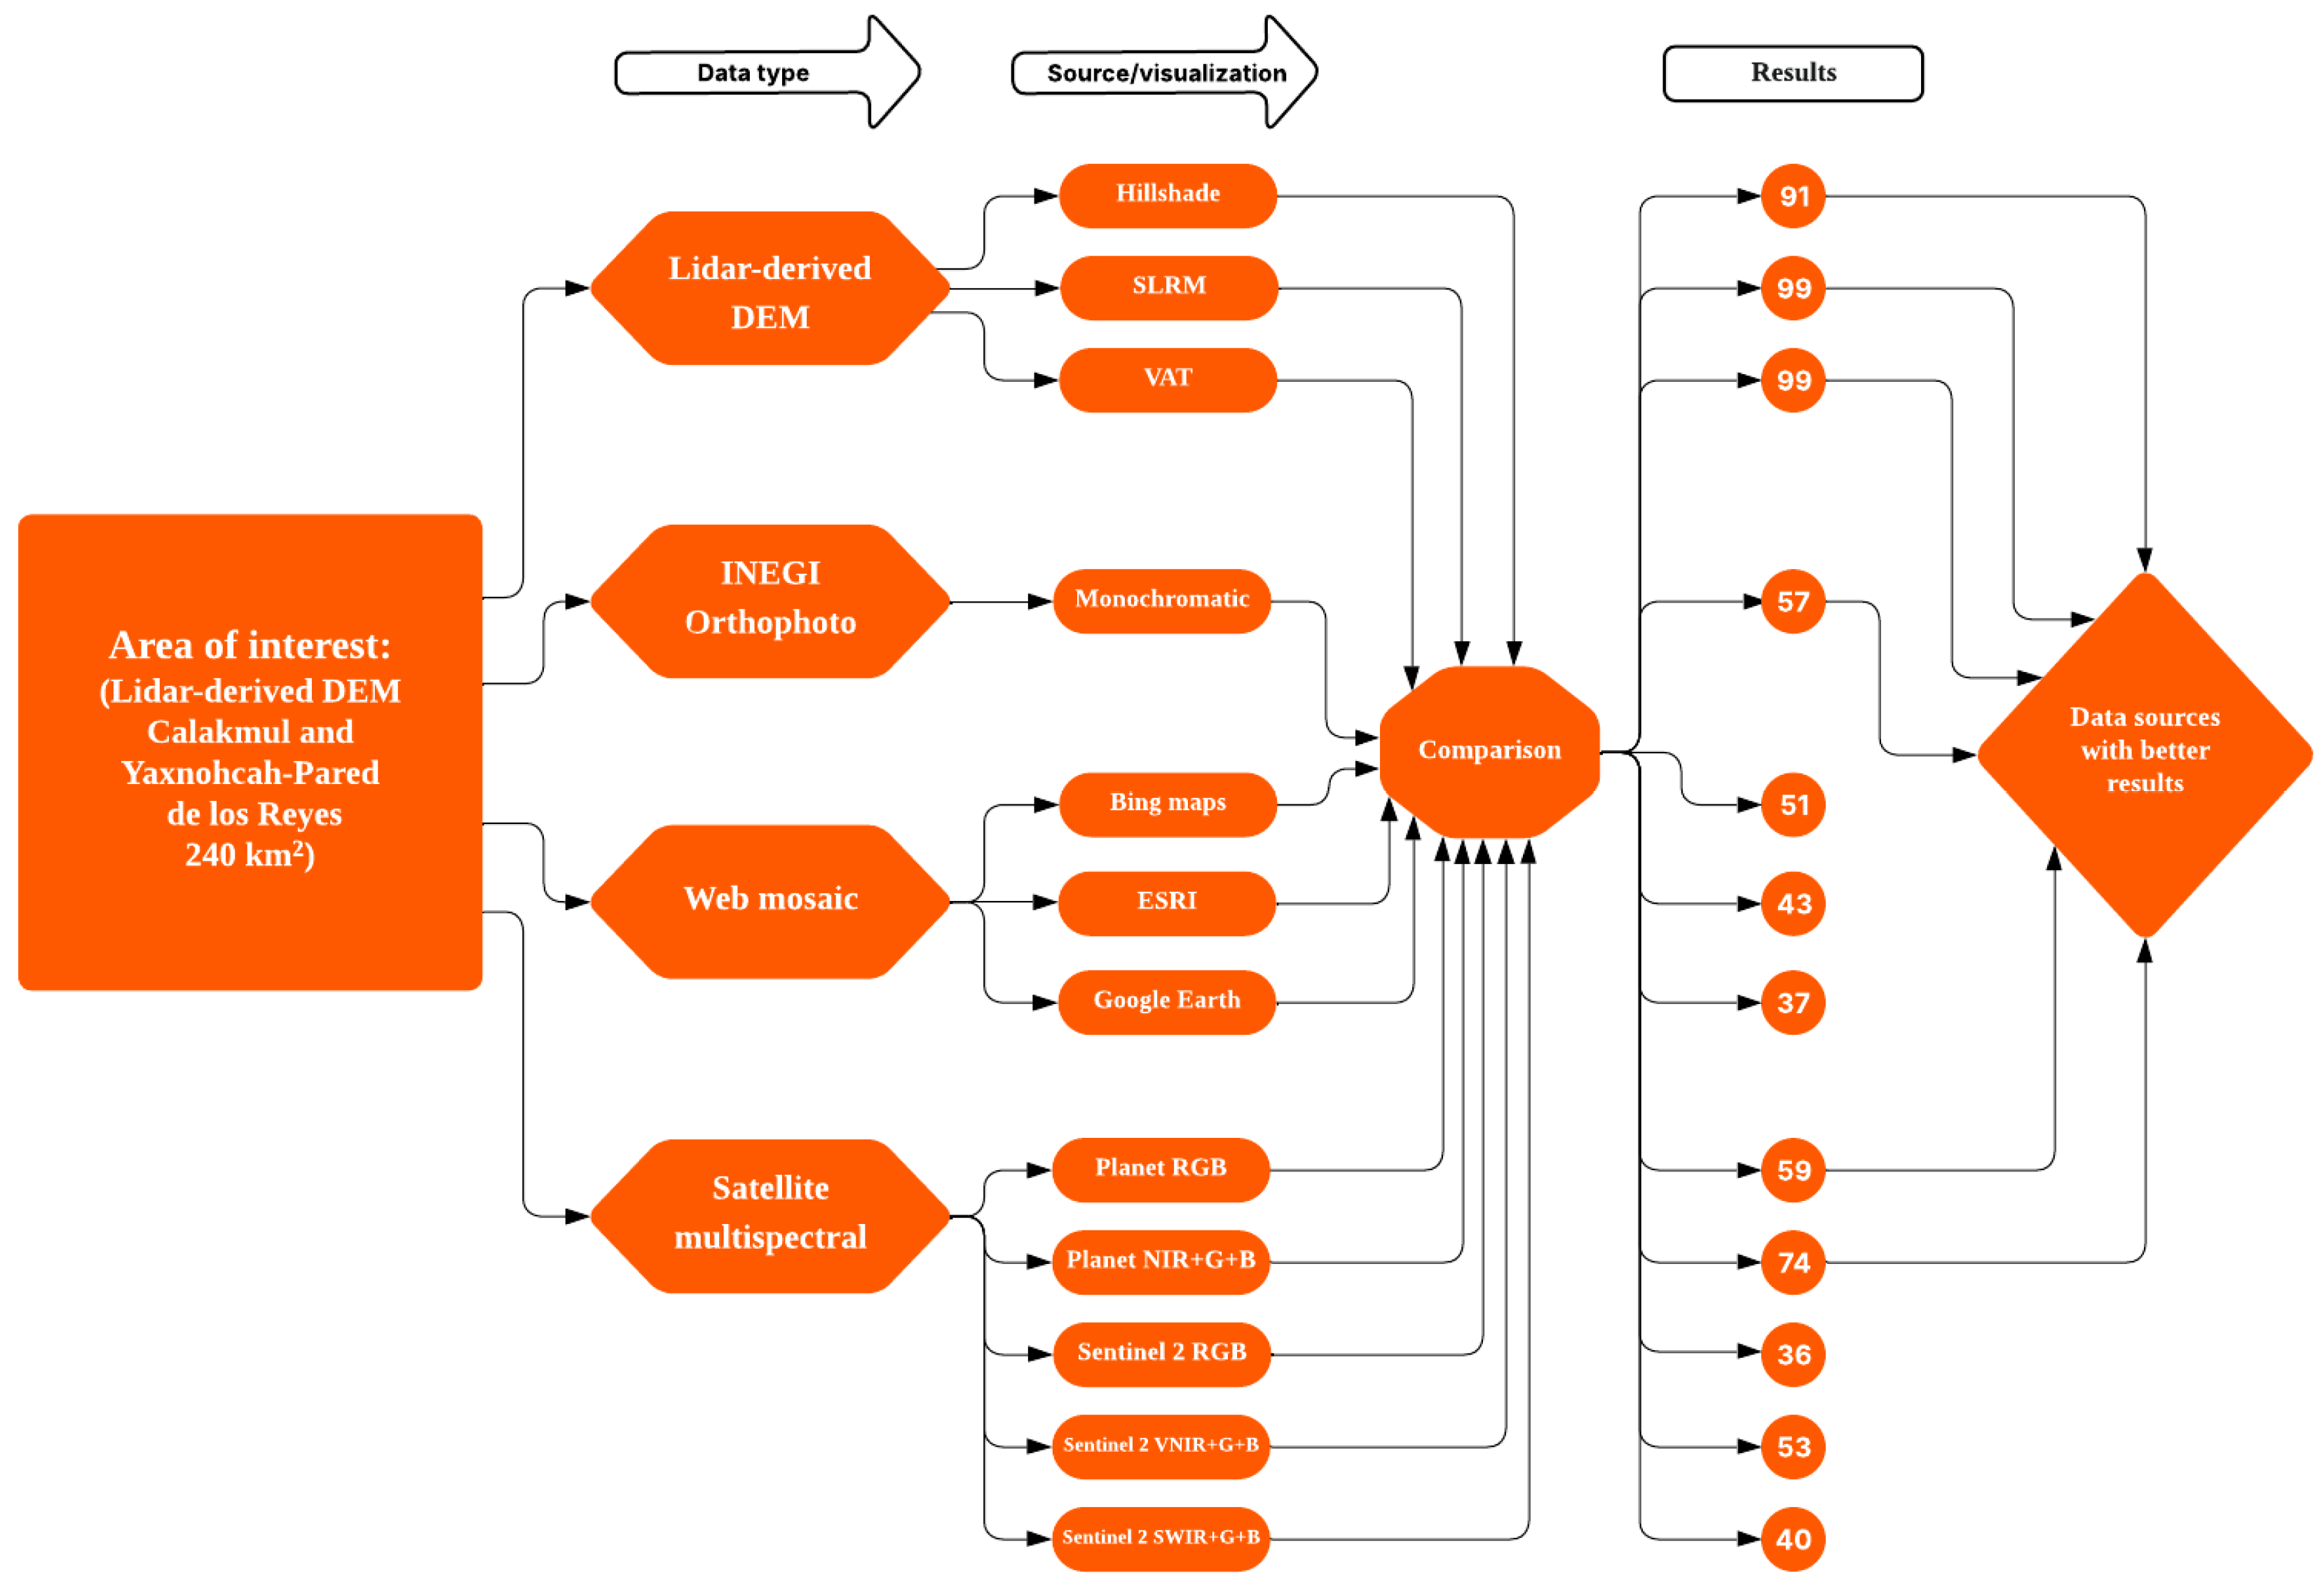
To locate all the aguadas and assess the effectiveness of each dataset on a case-by-case basis, twelve different visualizations were employed. Three views were obtained from lidar DEMs (Hillshade, SLRM, and Archaeological VAT), a fourth visualization corresponds to the orthophoto obtained by INEGI, followed by three from web mosaics on Bing Maps, ESRI and Google Earth. The authors acquired, merged, and processed the remaining five visualizations using satellite imagery from Sentinel 2 and Planet constellations.
The multispectral images from the Sentinel 2 satellites and the Planet constellation were downloaded from their respective platforms and displayed using QGIS (3.0) software. Band combinations were used to create three types of visualizations. The first type used RGB color combination in both sources, which is visible to human eyes. The second type used near-infrared plus green and blue bands (NIR+G+B). The Planet dataset included band 4 (NIR), band 2 (green) and band 3 (blue), while Sentinel 2 included B8 to the visible near infrared (VNIR), band 3 for green and band 2 for blue.
The last visualization was generated utilizing Sentinel 2 data, incorporating shortwave infrared (SWIR) from band 11, in conjunction with the green (B3) and blue (B2) bands. A vector layer was generated and labeled to emphasize each recognized element, as done with the prior visualizations.
The identification of the aguadas was carried out manually, combining and contrasting each of the visualizations created with the four types of sources (lidar DEMs, orthophotos, web mosaics, and multispectral satellite imagery). We opted to identify the aguadas manually in order to have greater certainty in the identification since each of the aguadas was compared and recorded using the twelve visualizations.
This process began with the delimitation of the area of interest, which, for this comparison, corresponded to that of the Yaxnohcah-Pared de los Reyes and Calakmul lidar data collection areas (see Figure 1). Subsequently, a GIS point layer was added, and each of the identified aguadas was marked, creating a specific layer for each visualization used to compare them and determine the number of aguadas visible in each view.
Each of the identified aguadas was given a code name based on the terminology used by the 1:10,000 scale grid of the INEGI [68], which is divided into quadrants of 40,679 km2 located throughout the Mexican territory. Each quadrant is assigned a unique key that refers to a 1:50,000 scale set of geospatial data produced by this government institution (e.g., e16a80). Each aguada located in each quadrant was assigned a sequential number in a west–east direction, e.g., “e16a80_1”.
The use of the INEGI grid has the advantage that each of the aguadas is identifiable in the national cartographic database, which makes it more accessible and compatible with other information generated by other agencies or research projects.
Finally, it is important to emphasize that vegetation cover is the key feature for identifying aguadas, as it facilitates unambiguous recognition in nearly all types of imagery. Nonetheless, when aguadas are partially or entirely obscured by vegetation, they can only be detected in lidar-derived digital elevation models or in the infrared spectrum of satellite images. Subsequent to the aforementioned, we conducted a comparative analysis to ascertain the most effective approach for identifying aguadas (Figure 9).

2.6. Visualization Comparison

To determine the optimal visualizations for each dataset, we provide typical examples of aguadas illustrating the principal differences in appearance. These include views of aguadas Big Tom, Fidelia, Bobal, 250 and 259. The key attributes of the five example aguadas are shown in Table 3.
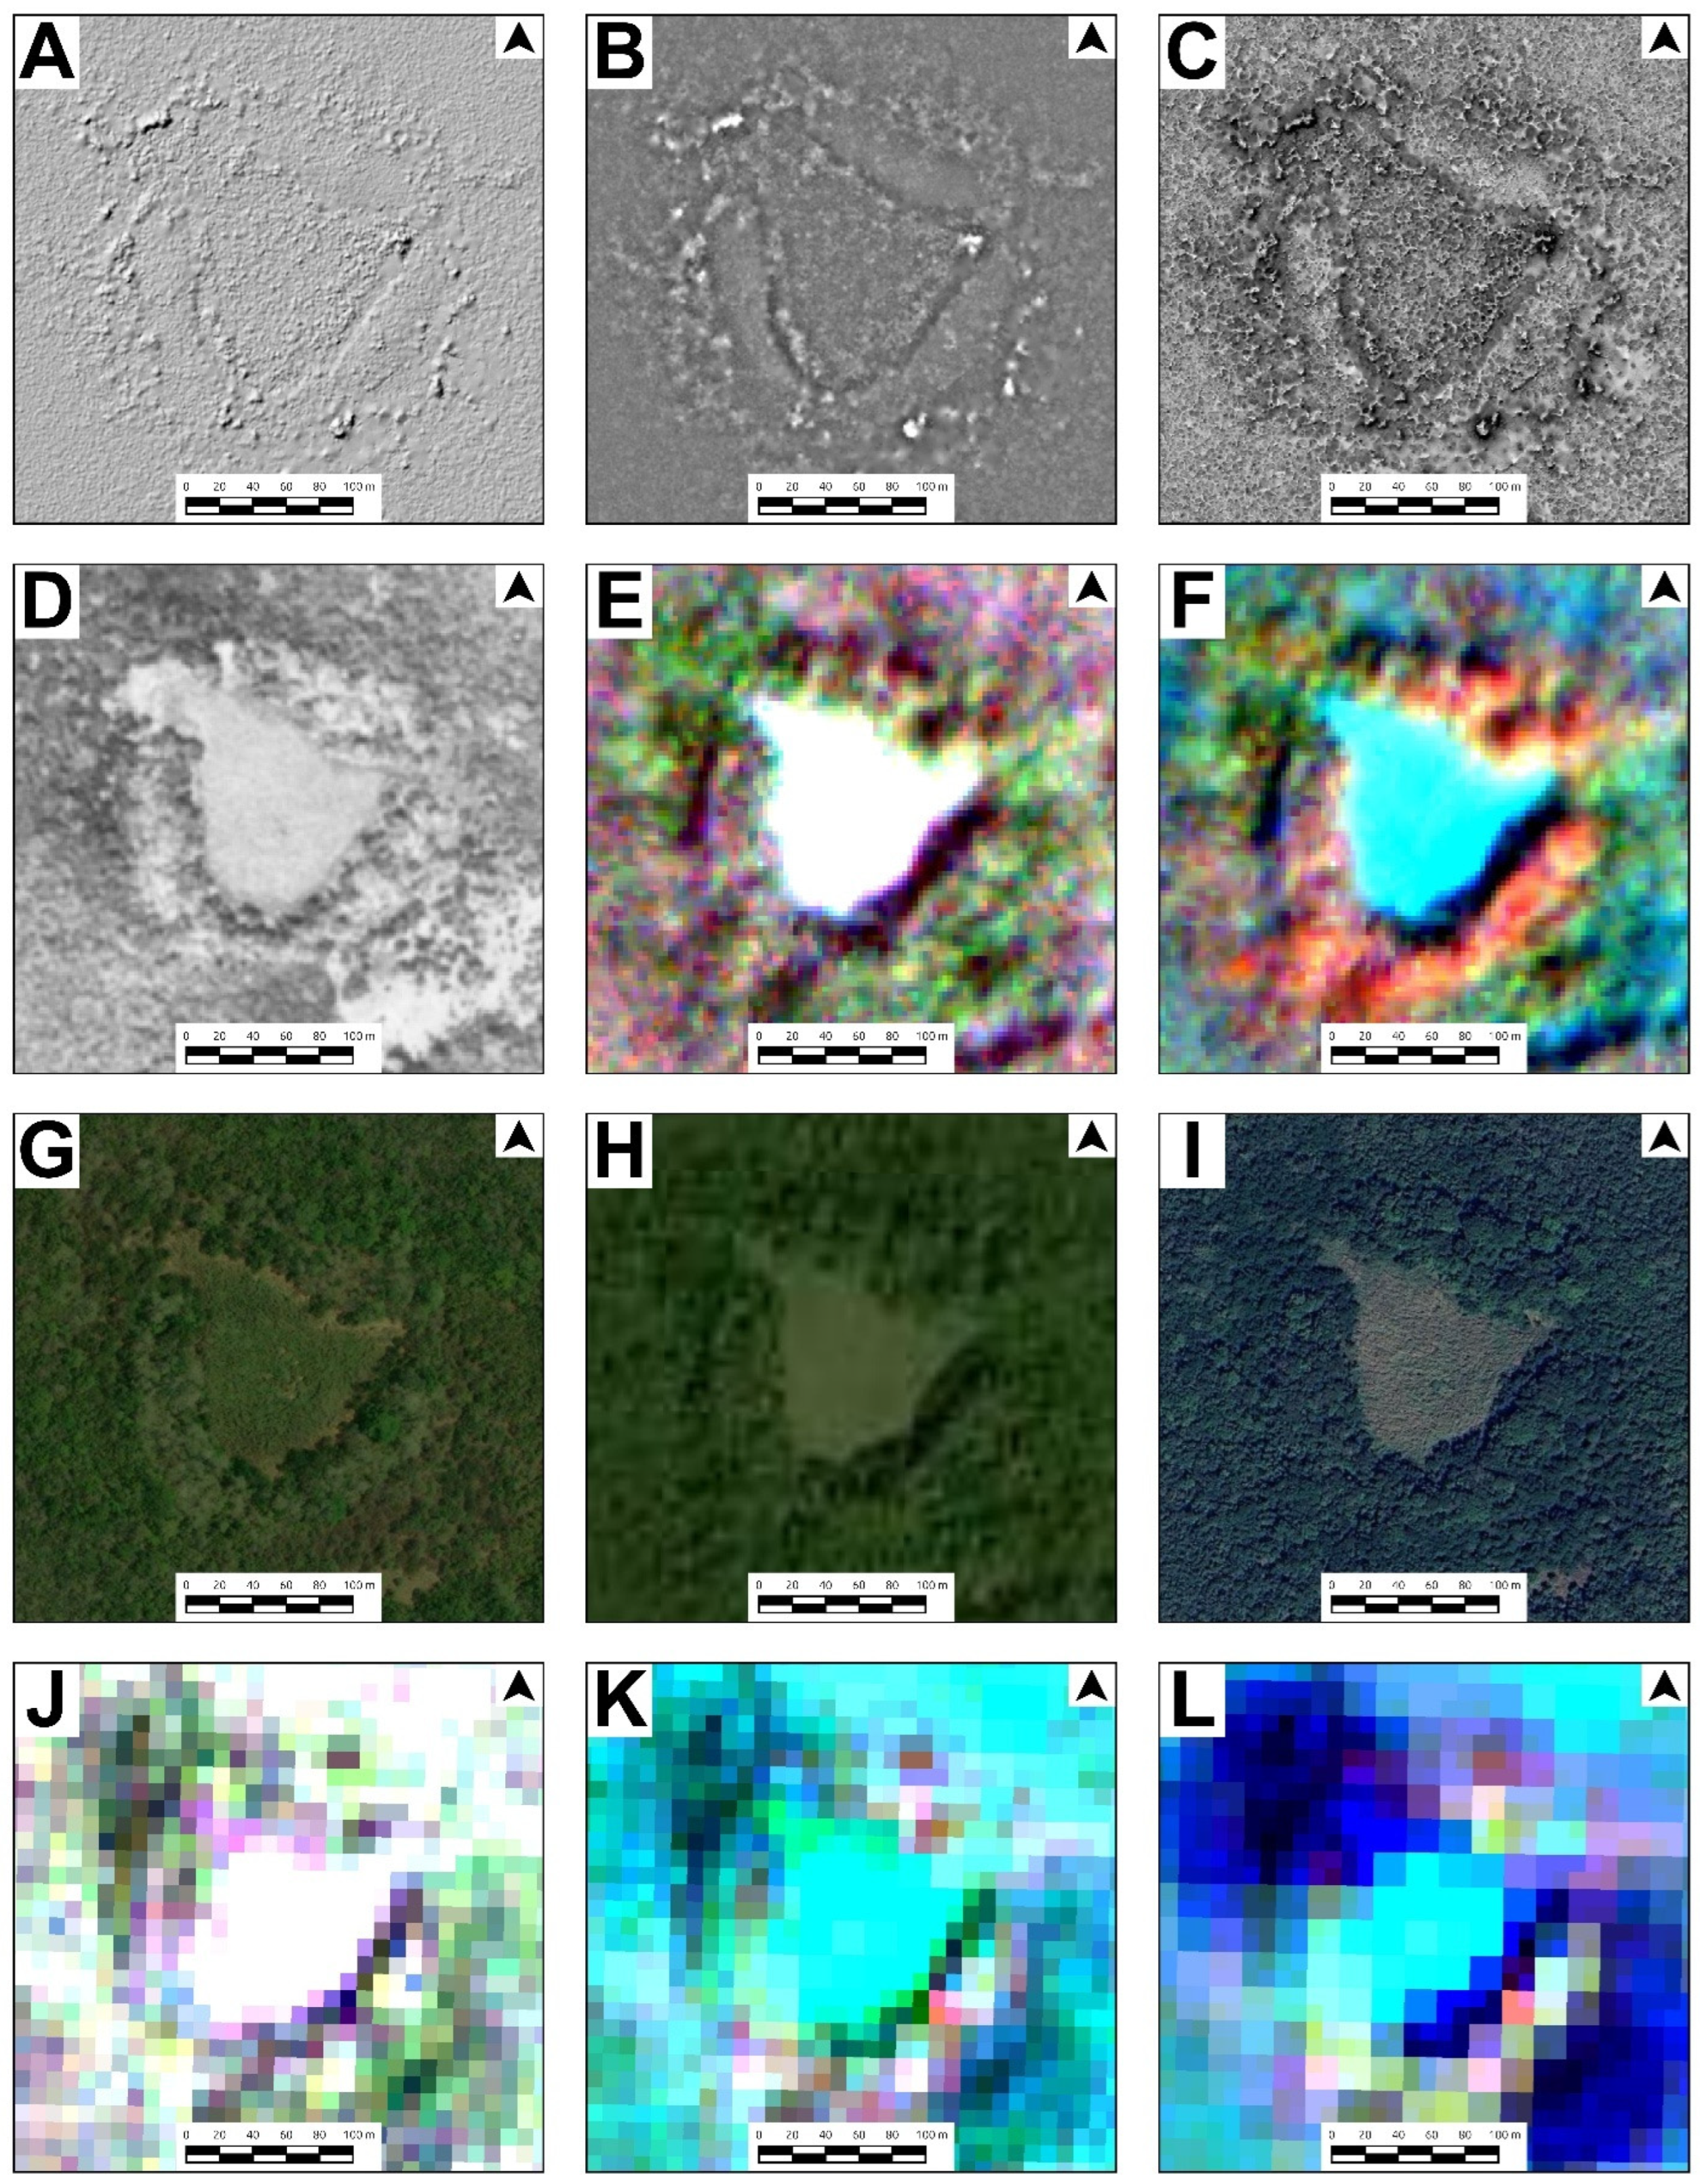
Aguada Big Tom is more than 100 m in size (Figure 10), mostly free of canopy, and retains water for most of the year. This hydrologic feature is easily visible in all visualizations; however, it is especially well defined in lidar visualizations, orthophoto, and the near-infrared band of satellite imagery.
Aguada Fidelia, as seen in Figure 11, can be identified through lidar DEM visualizations, orthophoto, and Planet imagery. However, it is difficult to discern Google Earth images, and only a little more discernible on Bing Maps and ESRI web mosaics. The Sentinel 2 views show pixels of different colors, but the aguada’s shape remains undefined. Aguada Fidelia is partially covered and contains water at the time the satellite images were taken, facilitating its detection through the reflectance of water or treeless ground.
In contrast, Aguada Bobal is nearly imperceptible in some Lidar DEM visualizations, like the SLRM, and cannot be distinguished on Sentinel 2 imagery because of its canopy cover and the limited spatial resolution (Figure 12). The orthophoto displays a clearly defined dark area, but Google Earth and Bing Maps merely display a subtle darkening that could be easily missed without prior knowledge of the aguada’s presence. The near-infrared (NIR) images from Planet, regardless of whether they are multiband or single-band false-color, produce comparably ambiguous visualizations. Thus, locating the aguada with the datasets at hand is extremely challenging, but not impossible, since its visibility in lidar and orthophoto images is limited, and its detection in satellite images is difficult due to the lower resolution.
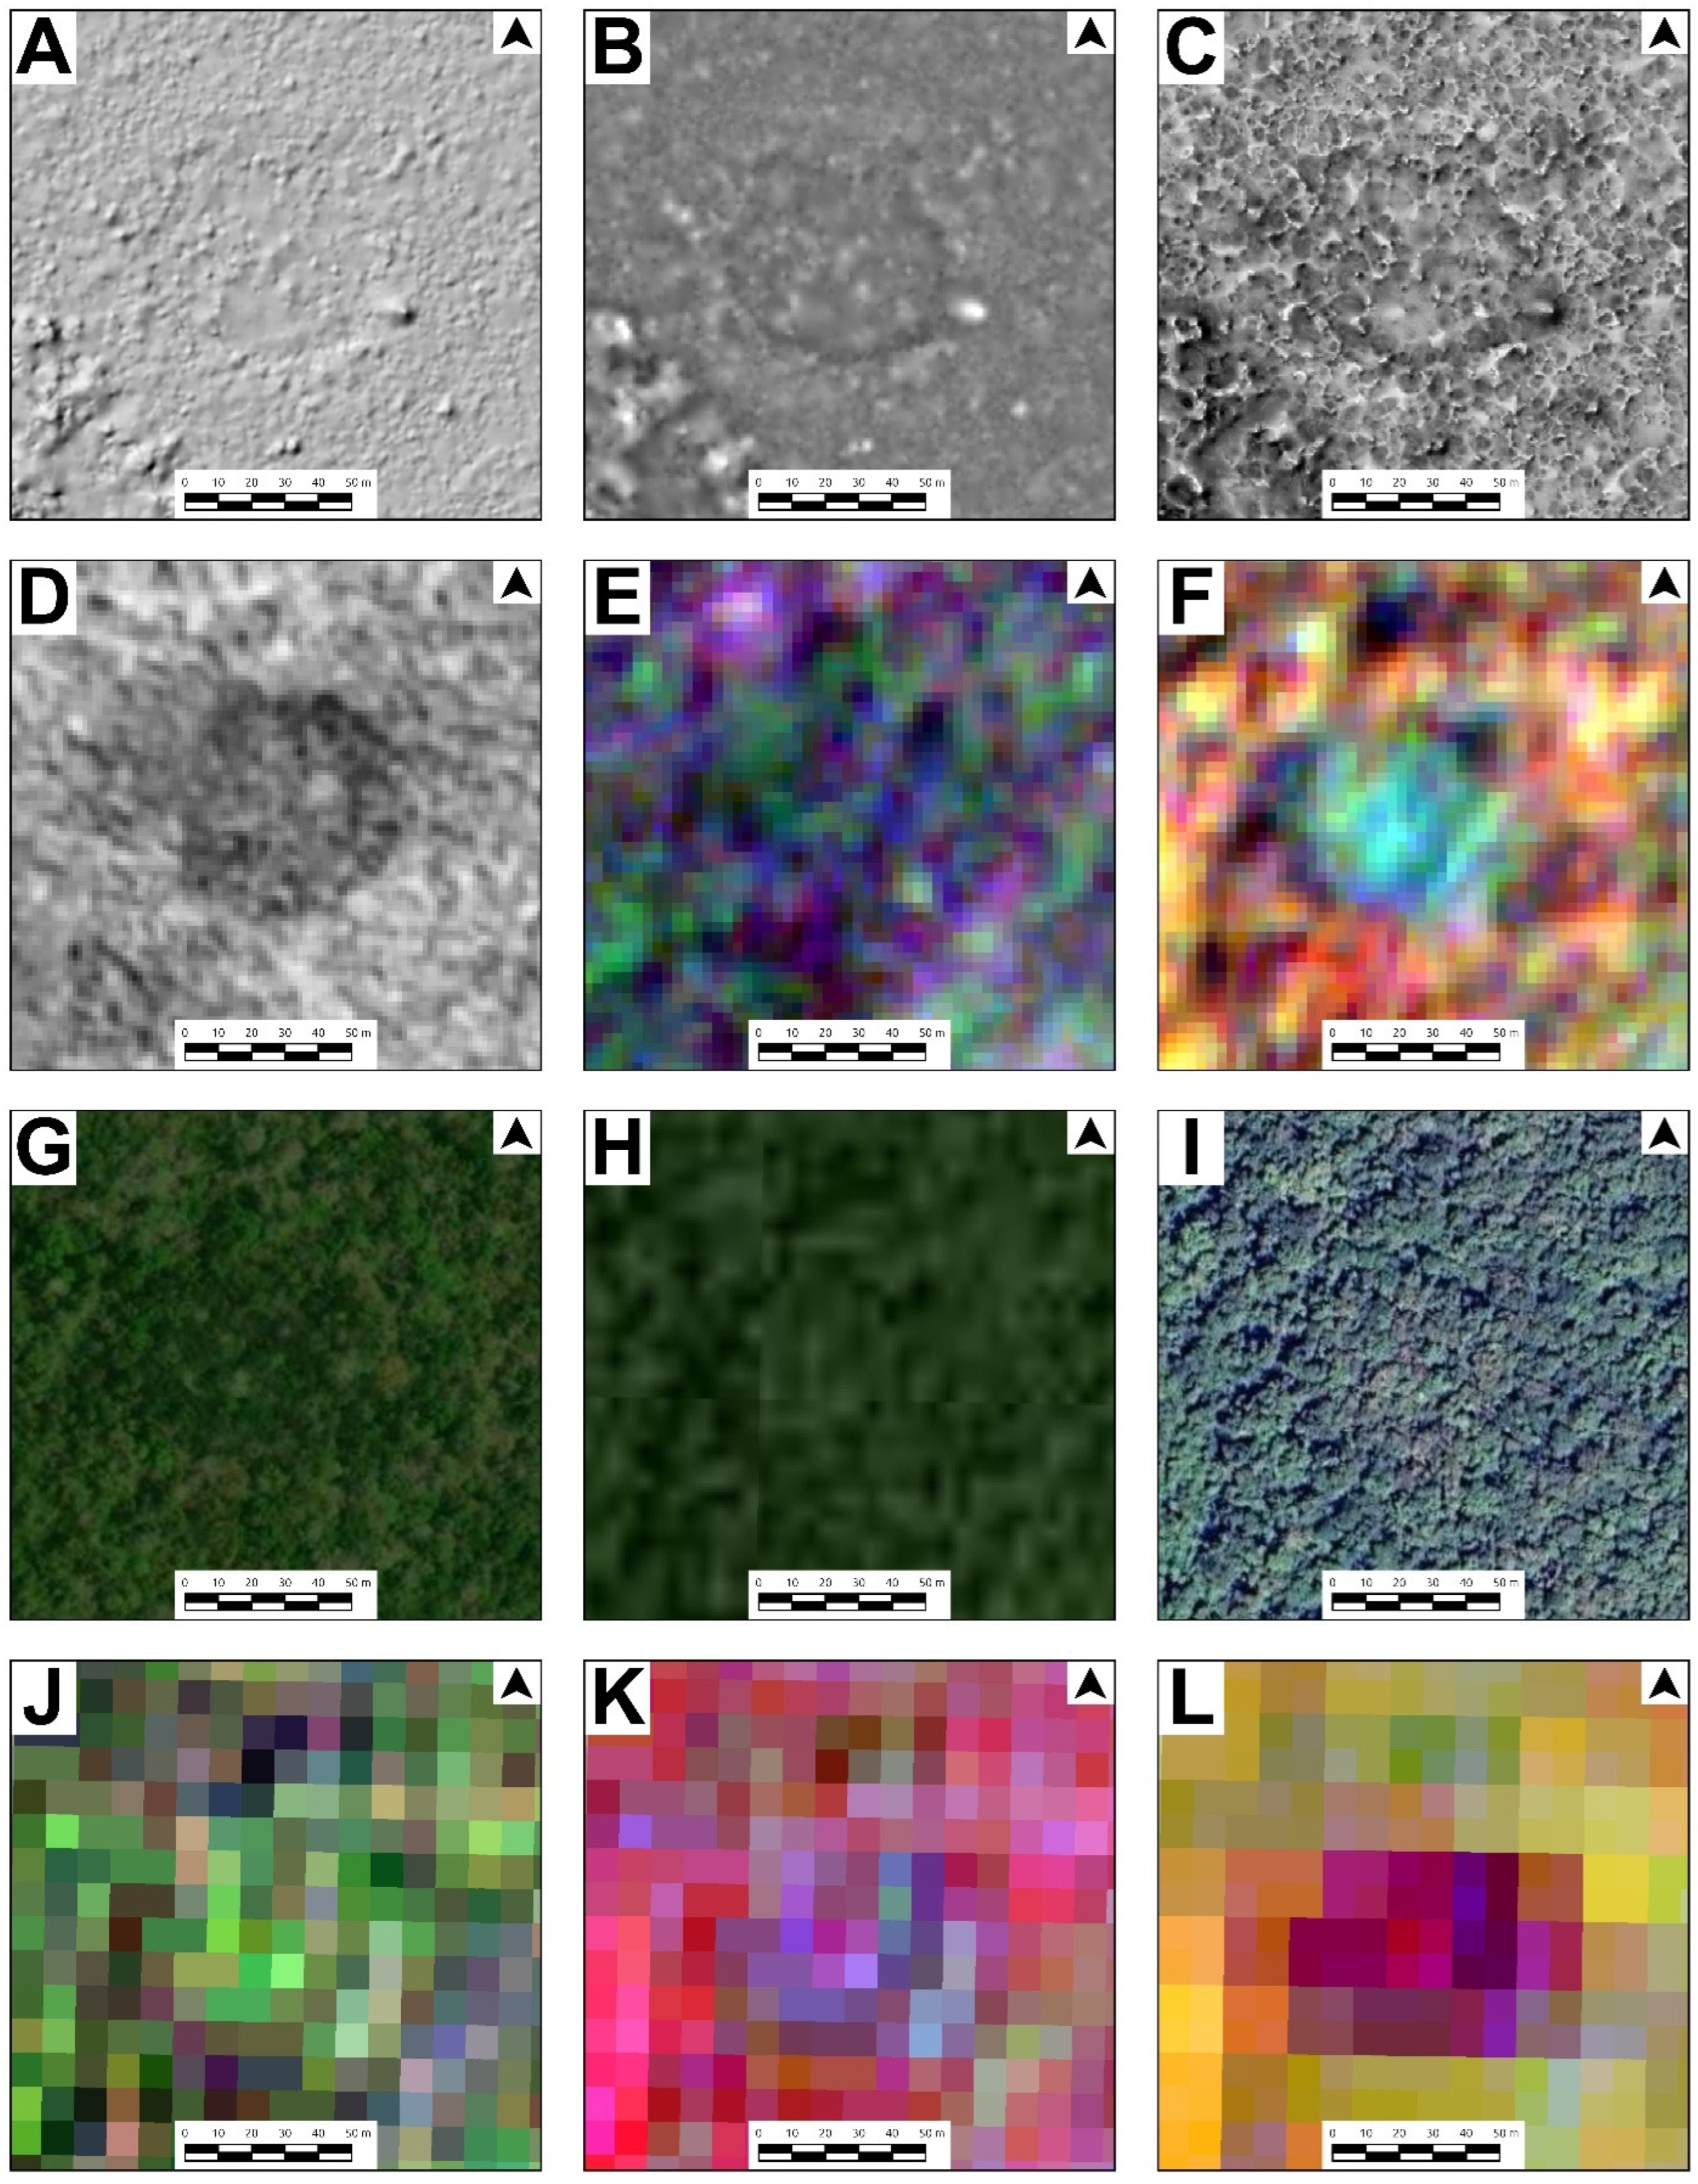
Most satellite photos and the orthophoto for Aguada 250 produced poor results. The feature in question was particularly challenging to locate without prior knowledge (Figure 13). Specifically, the Sentinel 2 images depicted only a handful of indistinct darker pixels, whereas Planet imagery visualizations show a faint, dark area that is nearly imperceptible to the naked eye but can be observed in RGB color and infrared visualizations.
In the Google Earth web mosaic, Aguada 250 is indistinguishable from its surroundings; however, the Bing Satellite image reveals that the area is devoid of distinguishing due to partial cloud cover. This invisibility in all sources is mainly because the aguada is covered by tree canopy, and although it appears to have retained water when the image was taken, it does not reflect visible light due to the obscuring vegetation. Although Aguada 250 does not show up very well in the DEM Hillshade view, it can be clearly defined in the archaeological combined VAT view and the Simple Local Relief Model (SLRM) visualization.
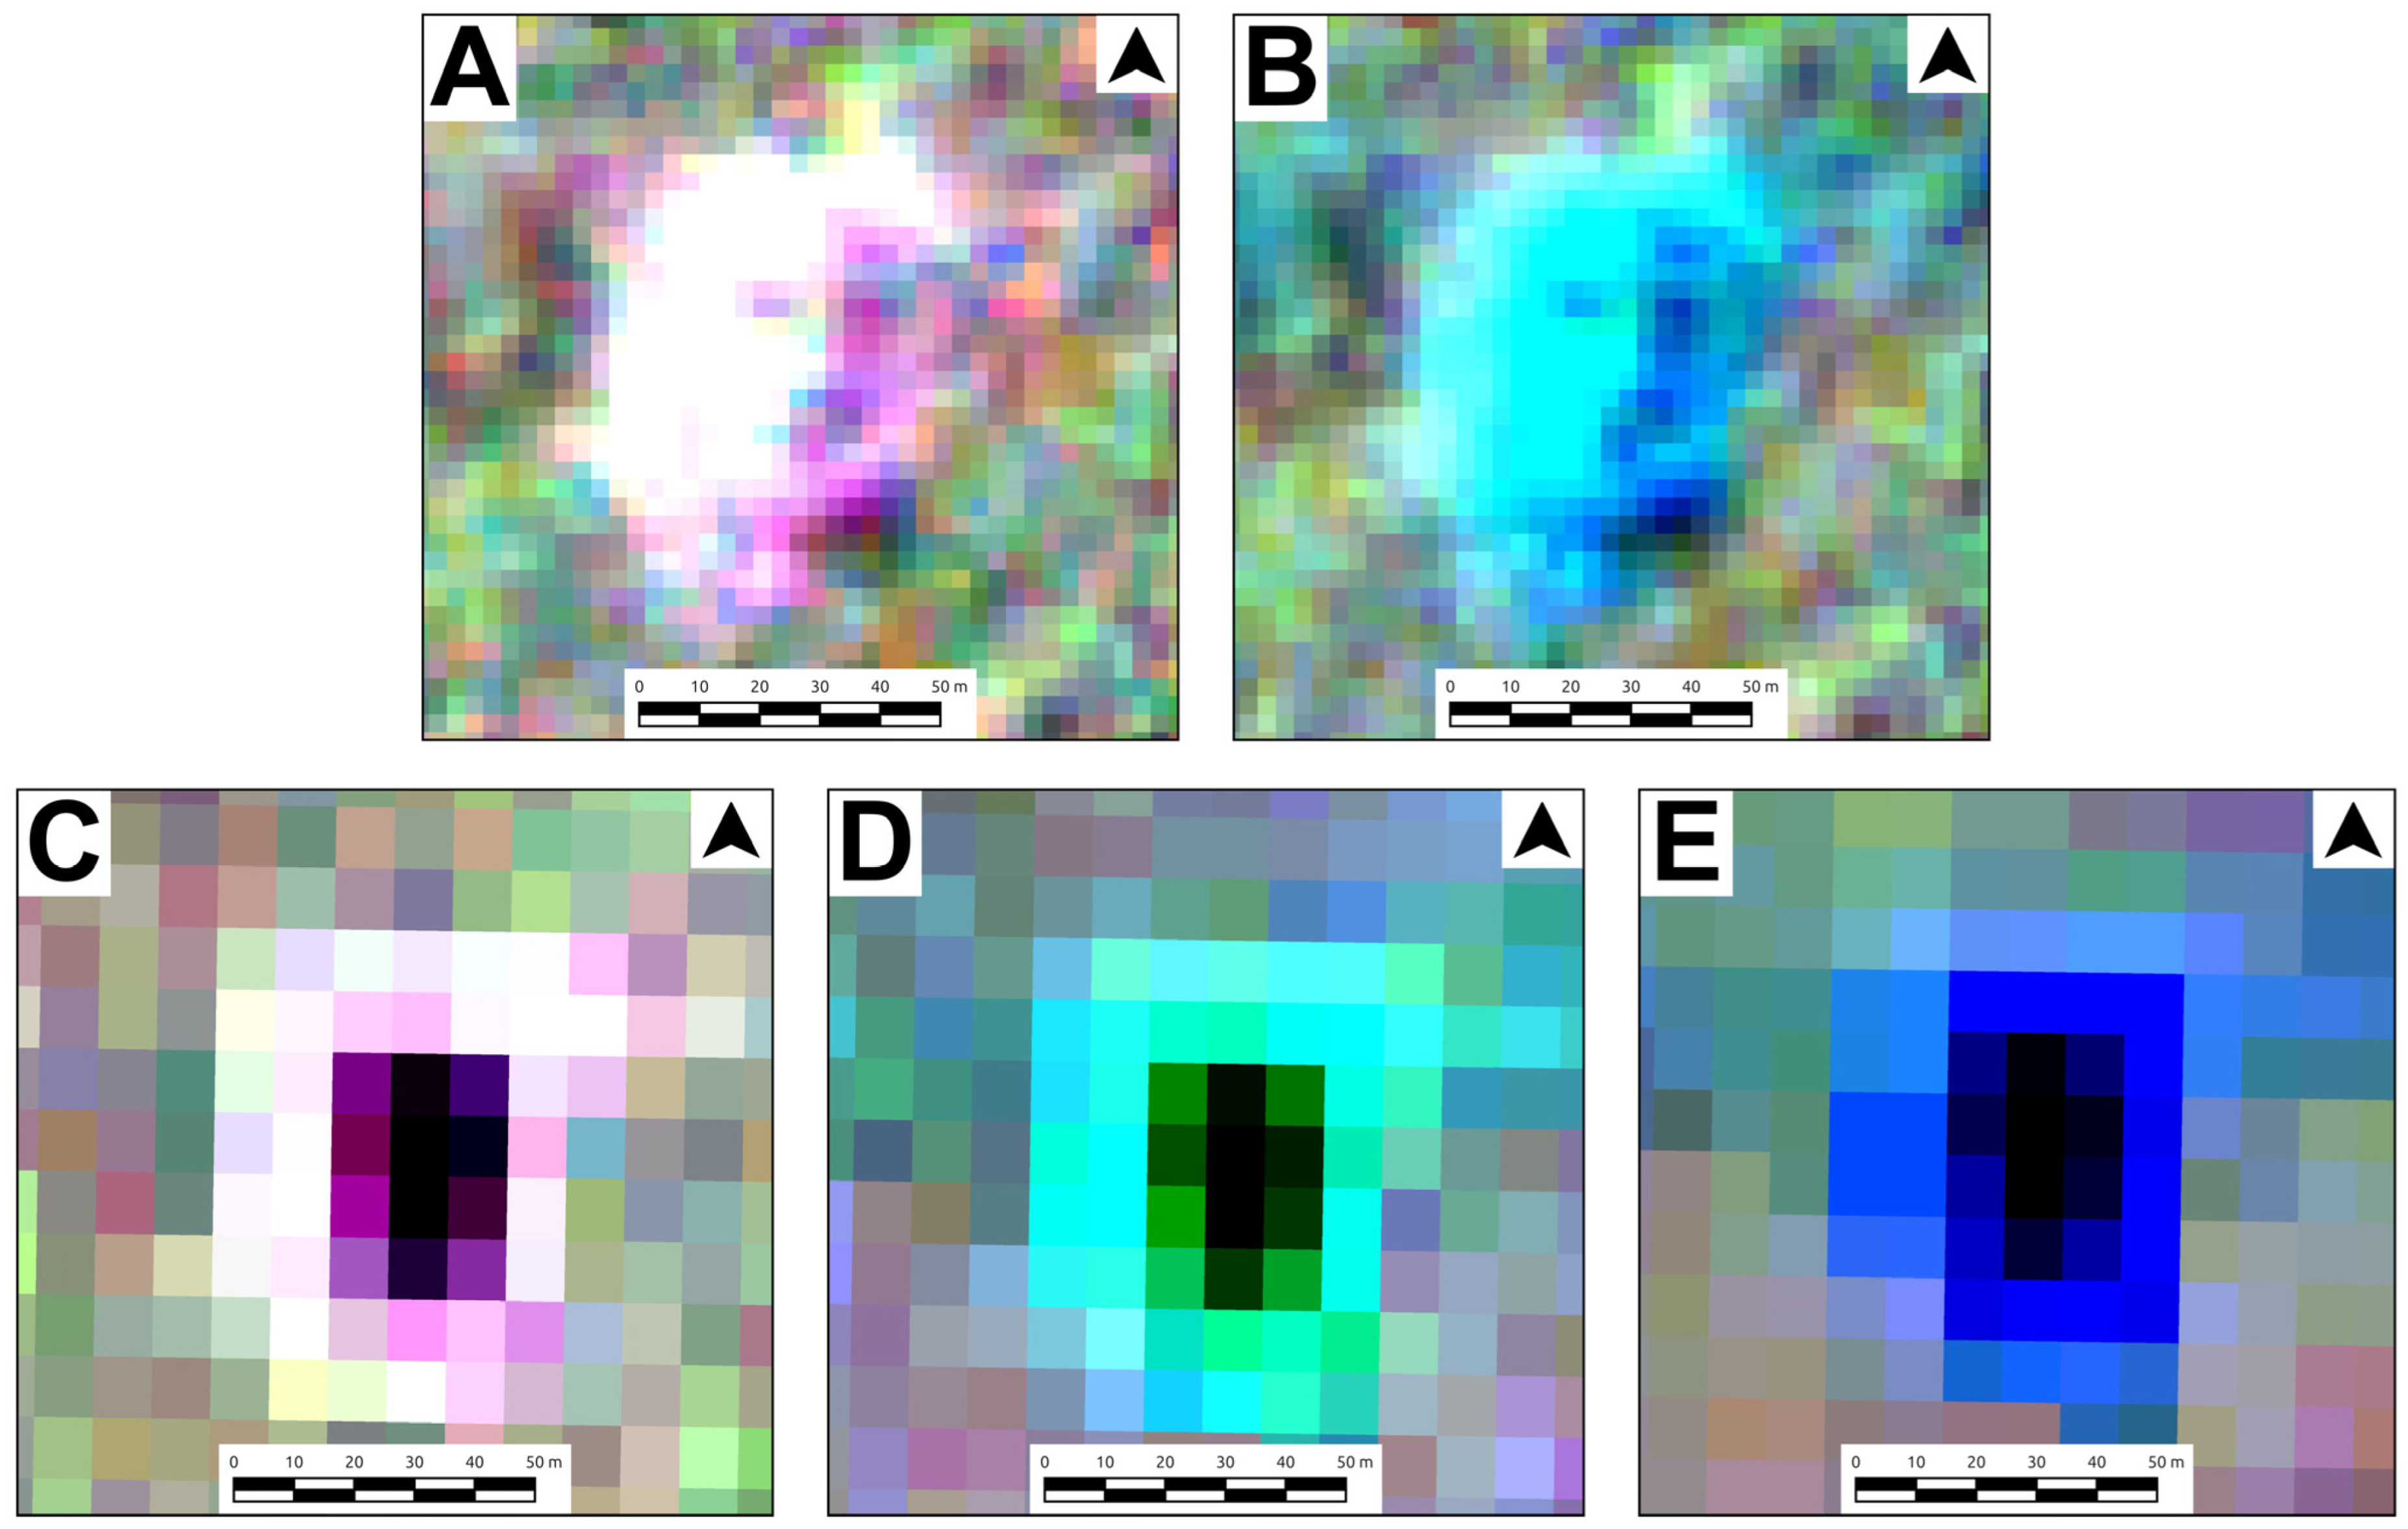
Aguada 259 is distinctly observable in the SLRM and Archaeological VAT visualizations, although it is more challenging to discern in the hillshade view (Figure 5). In the INEGI orthophoto, this water feature appears merely as a marginally darker region, lacking significant distinction. Although it is a small water body, it is easily identifiable in the mosaics of web platforms due to its status as an open-canopy water body, unobstructed by vegetation. This attribute makes it also discernible in multispectral image visualizations; however, spectral resolution is critical. In the Planet visualizations (Figure 8A,B), their form is distinctly observable, whereas in the Sentinel 2 visualizations, although it is detectable, the resolution presents only a collection of pixels lacking a discernible shape (Figure 8C–E). Table 4 delineates the characteristics of the selected aguadas categorized by source.

3. Results

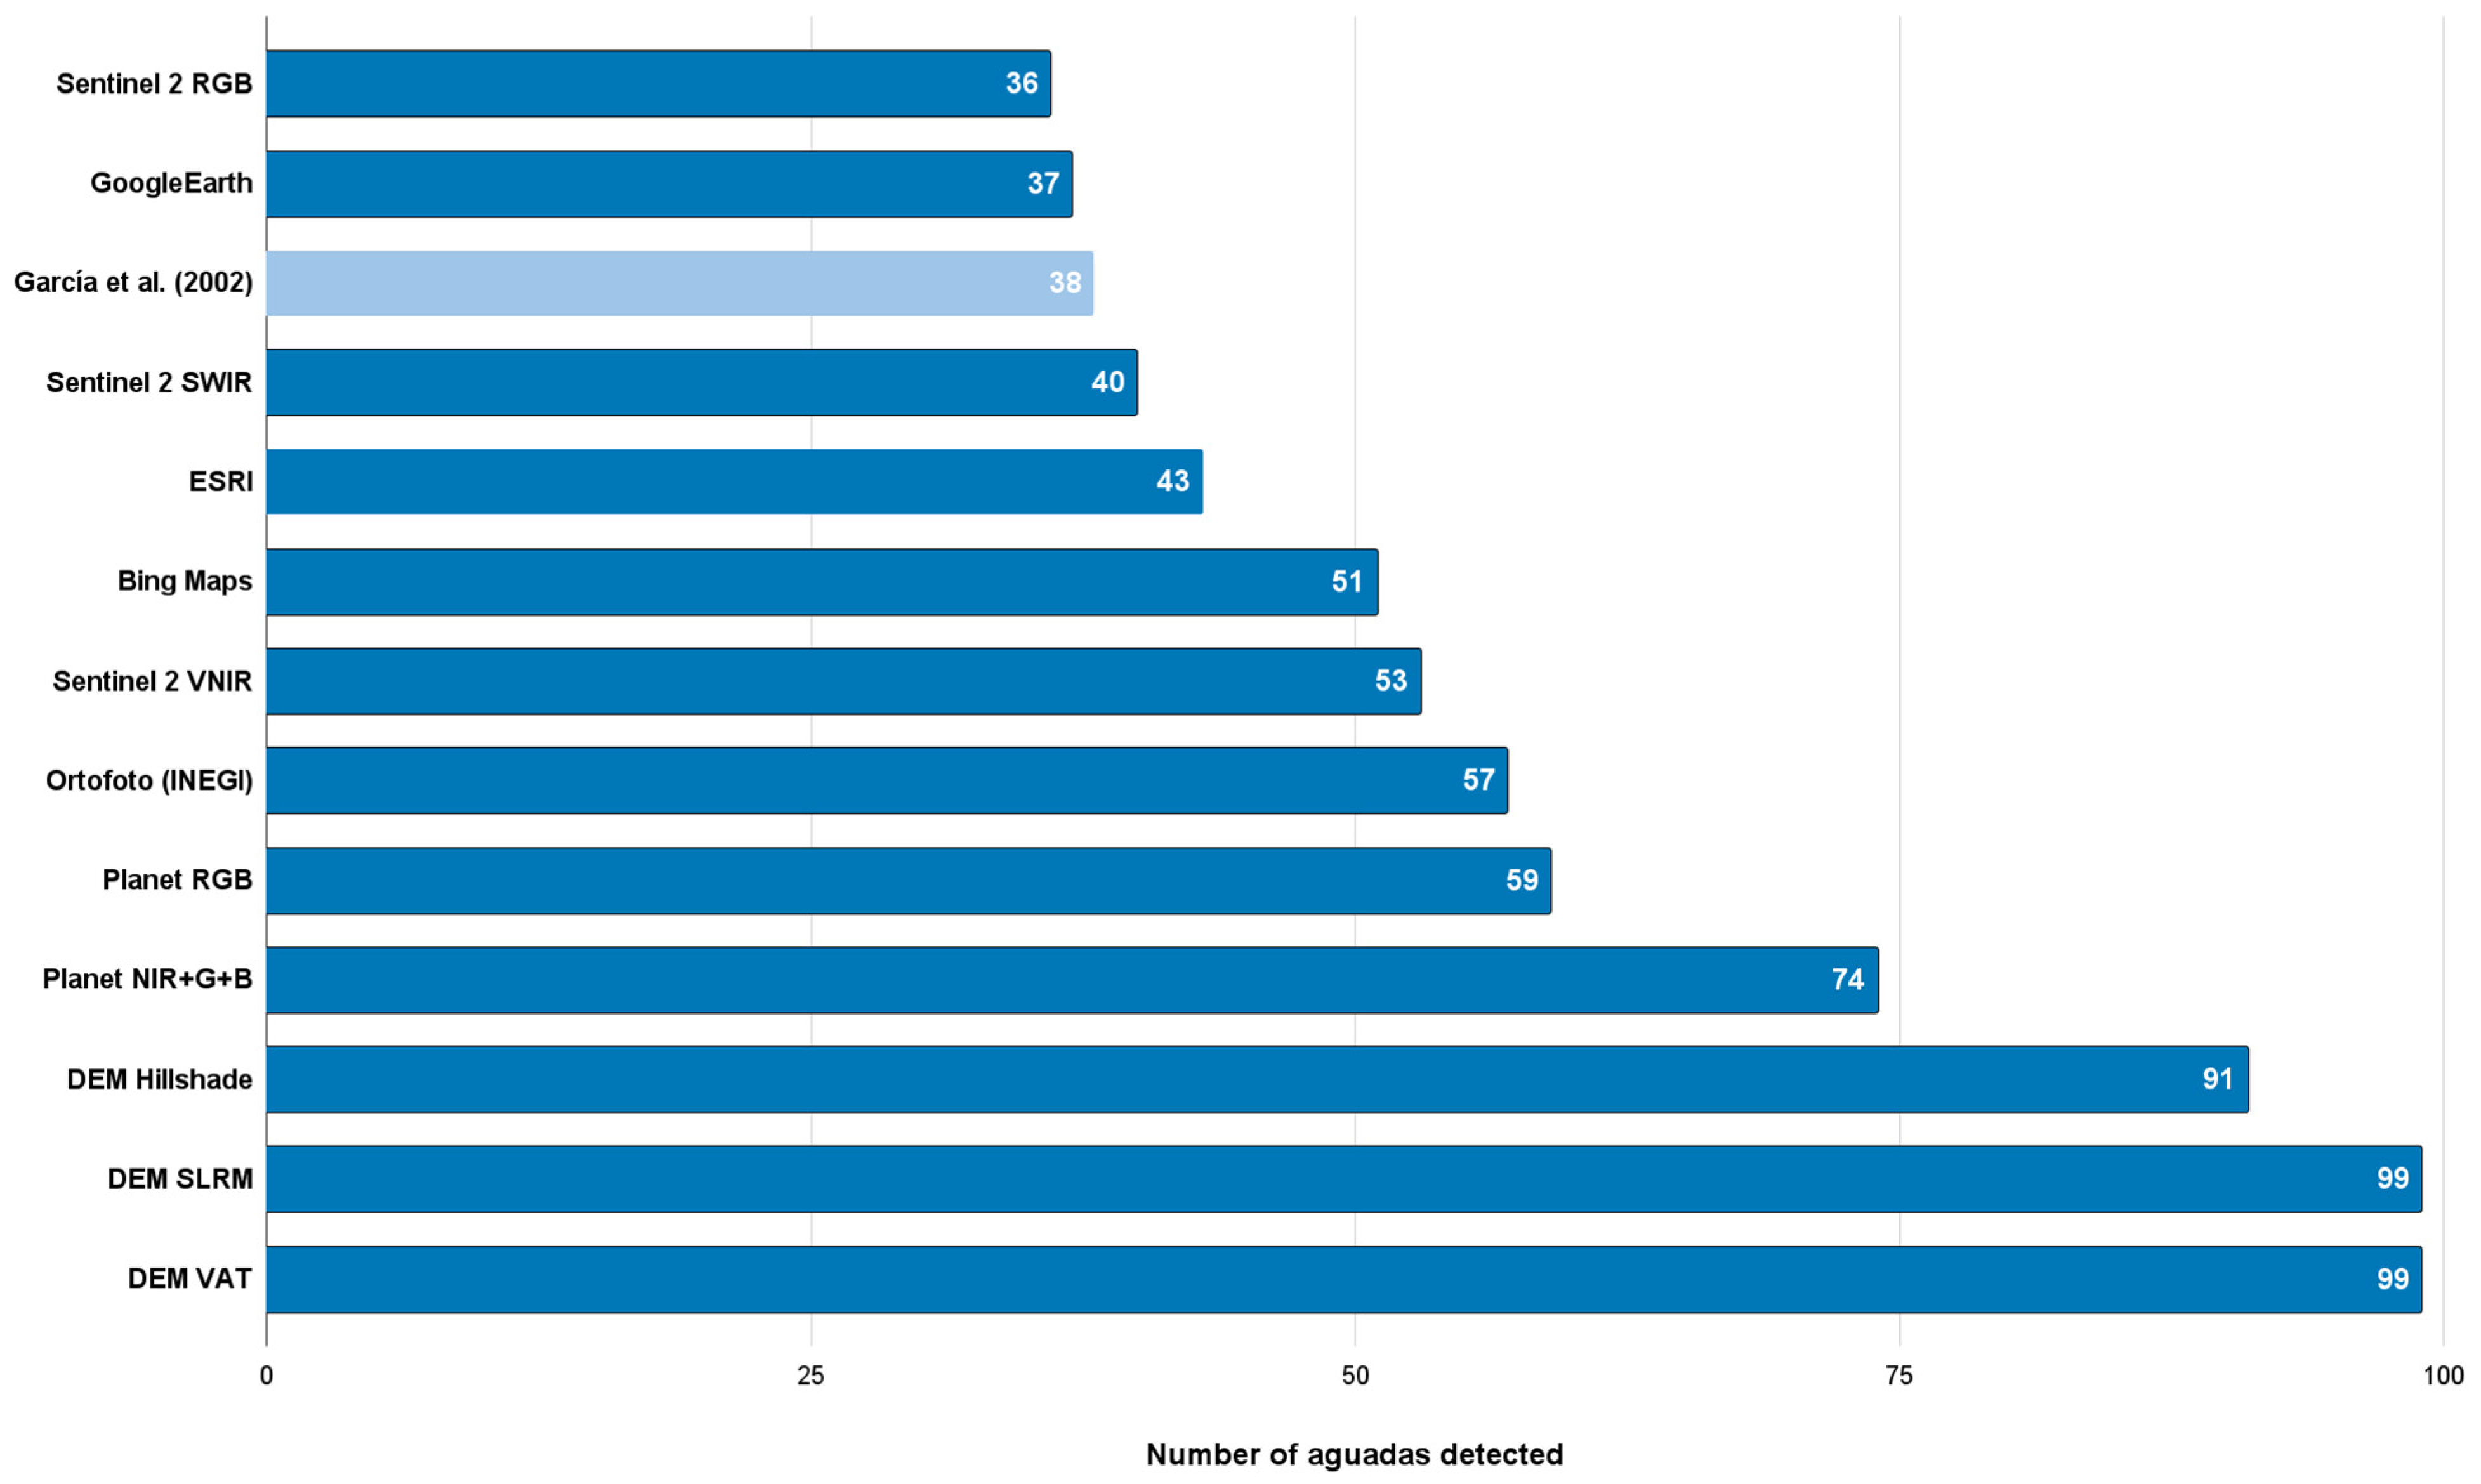
In our comparison, we assessed the identifiability of each of the aguadas through the lidar-derived DEM of the Yaxnohcah-Pared de los Reyes and Calakmul regions, tallying the total of features identified in each visualization. The SLRM visualization and the Archaeological VAT composition recorded the most aguadas, with a total of 99, followed by the hillshade visualization with 91 (Figure 14).
Out of the 99 aguadas, 38 were identified within the Yaxnohcah-Pared de los Reyes lidar-derived DEM area, whereas 61 aguadas were found in the Calakmul lidar-derived DEM, including those already recorded in the site’s center by earlier studies.
Although possessing a spatial resolution of 1.5 m, the orthophotos exhibited great clarity in extense water bodies; nevertheless, they proved less effective for smaller aguadas or those obscured by vegetation. This is primarily due to their ability to capture the surface as perceived by our eyes, with components such as vegetation or clouds obstructing surface features.
The results of the imagery retrieved from web platforms varied based on the spatial resolution of color mosaics and the area of interest. The Bing platform exhibited the most favorable results, whereas ESRI and Google Earth identification totals were inferior. The Sentinel 2 images were effective at detecting larger aguadas regardless of whether they were dry or contained water. However, they were not useful for smaller features or areas that were partially obstructed by vegetation. The near-infrared visualization yielded superior results, but the totals were more than forty five percent lower than those of the lidar DEM.
Sentinel 2 imagery produced results that are comparable to web mapping platforms, although VNIR+G+B visualization proved to be more effective. The collection of Sentinel 2 images is extensive with a useful spectral resolution for discerning large-scale landscape features. Nevertheless, they are unsuitable for identifying smaller bodies of water due to their low spatial resolution.
In contrast, Planet’s imagery is significantly helpful owing to their multispectral bands and higher spatial resolution, facilitating detailed inspection of morphological features. The near-infrared visualization has demonstrated superior efficacy by accentuating water bodies and areas devoid of vegetation, characteristics frequently observed in numerous aguadas. The Planet satellite imaging contains two primary characteristics: a near-infrared (NIR) band and a spatial resolution of 3 m. Although other satellite platforms, such as Digital Globe, possess comparable characteristics, they are expected to yield similar outcomes, given that they include bands capable of capturing the infrared segment of the electromagnetic spectrum.
The Planet, like other satellite sources, demonstrates an additional benefit of this data type; namely, several datasets are accessible and can be investigated at various intervals during the year or over several years. Aguadas may exhibit varying visibility contingent upon local water conditions, seasonal vegetation changes, and the passage of years. Consequently, while this has not been explored in this study, the utilization of multitemporal imagery is beneficial for identifying additional reservoirs.
Alongside the comparison conducted in this study, an additional comparison was undertaken with the survey by Garcia et al. (2002) [5], the sole known investigation that has cataloged aguadas throughout the CBR. Notwithstanding, they used high-resolution aerial imagery, and only 38 aguadas were discerned in the regions corresponding to the lidar-derived DEMs of Calakmul and Yaxnohcah-Pared de los Reyes, an amount comparable to that obtained by web mosaic platforms such as Sentinel 2 RGB or Google Earth.

3.1. Characteristics and Variability of Aguadas

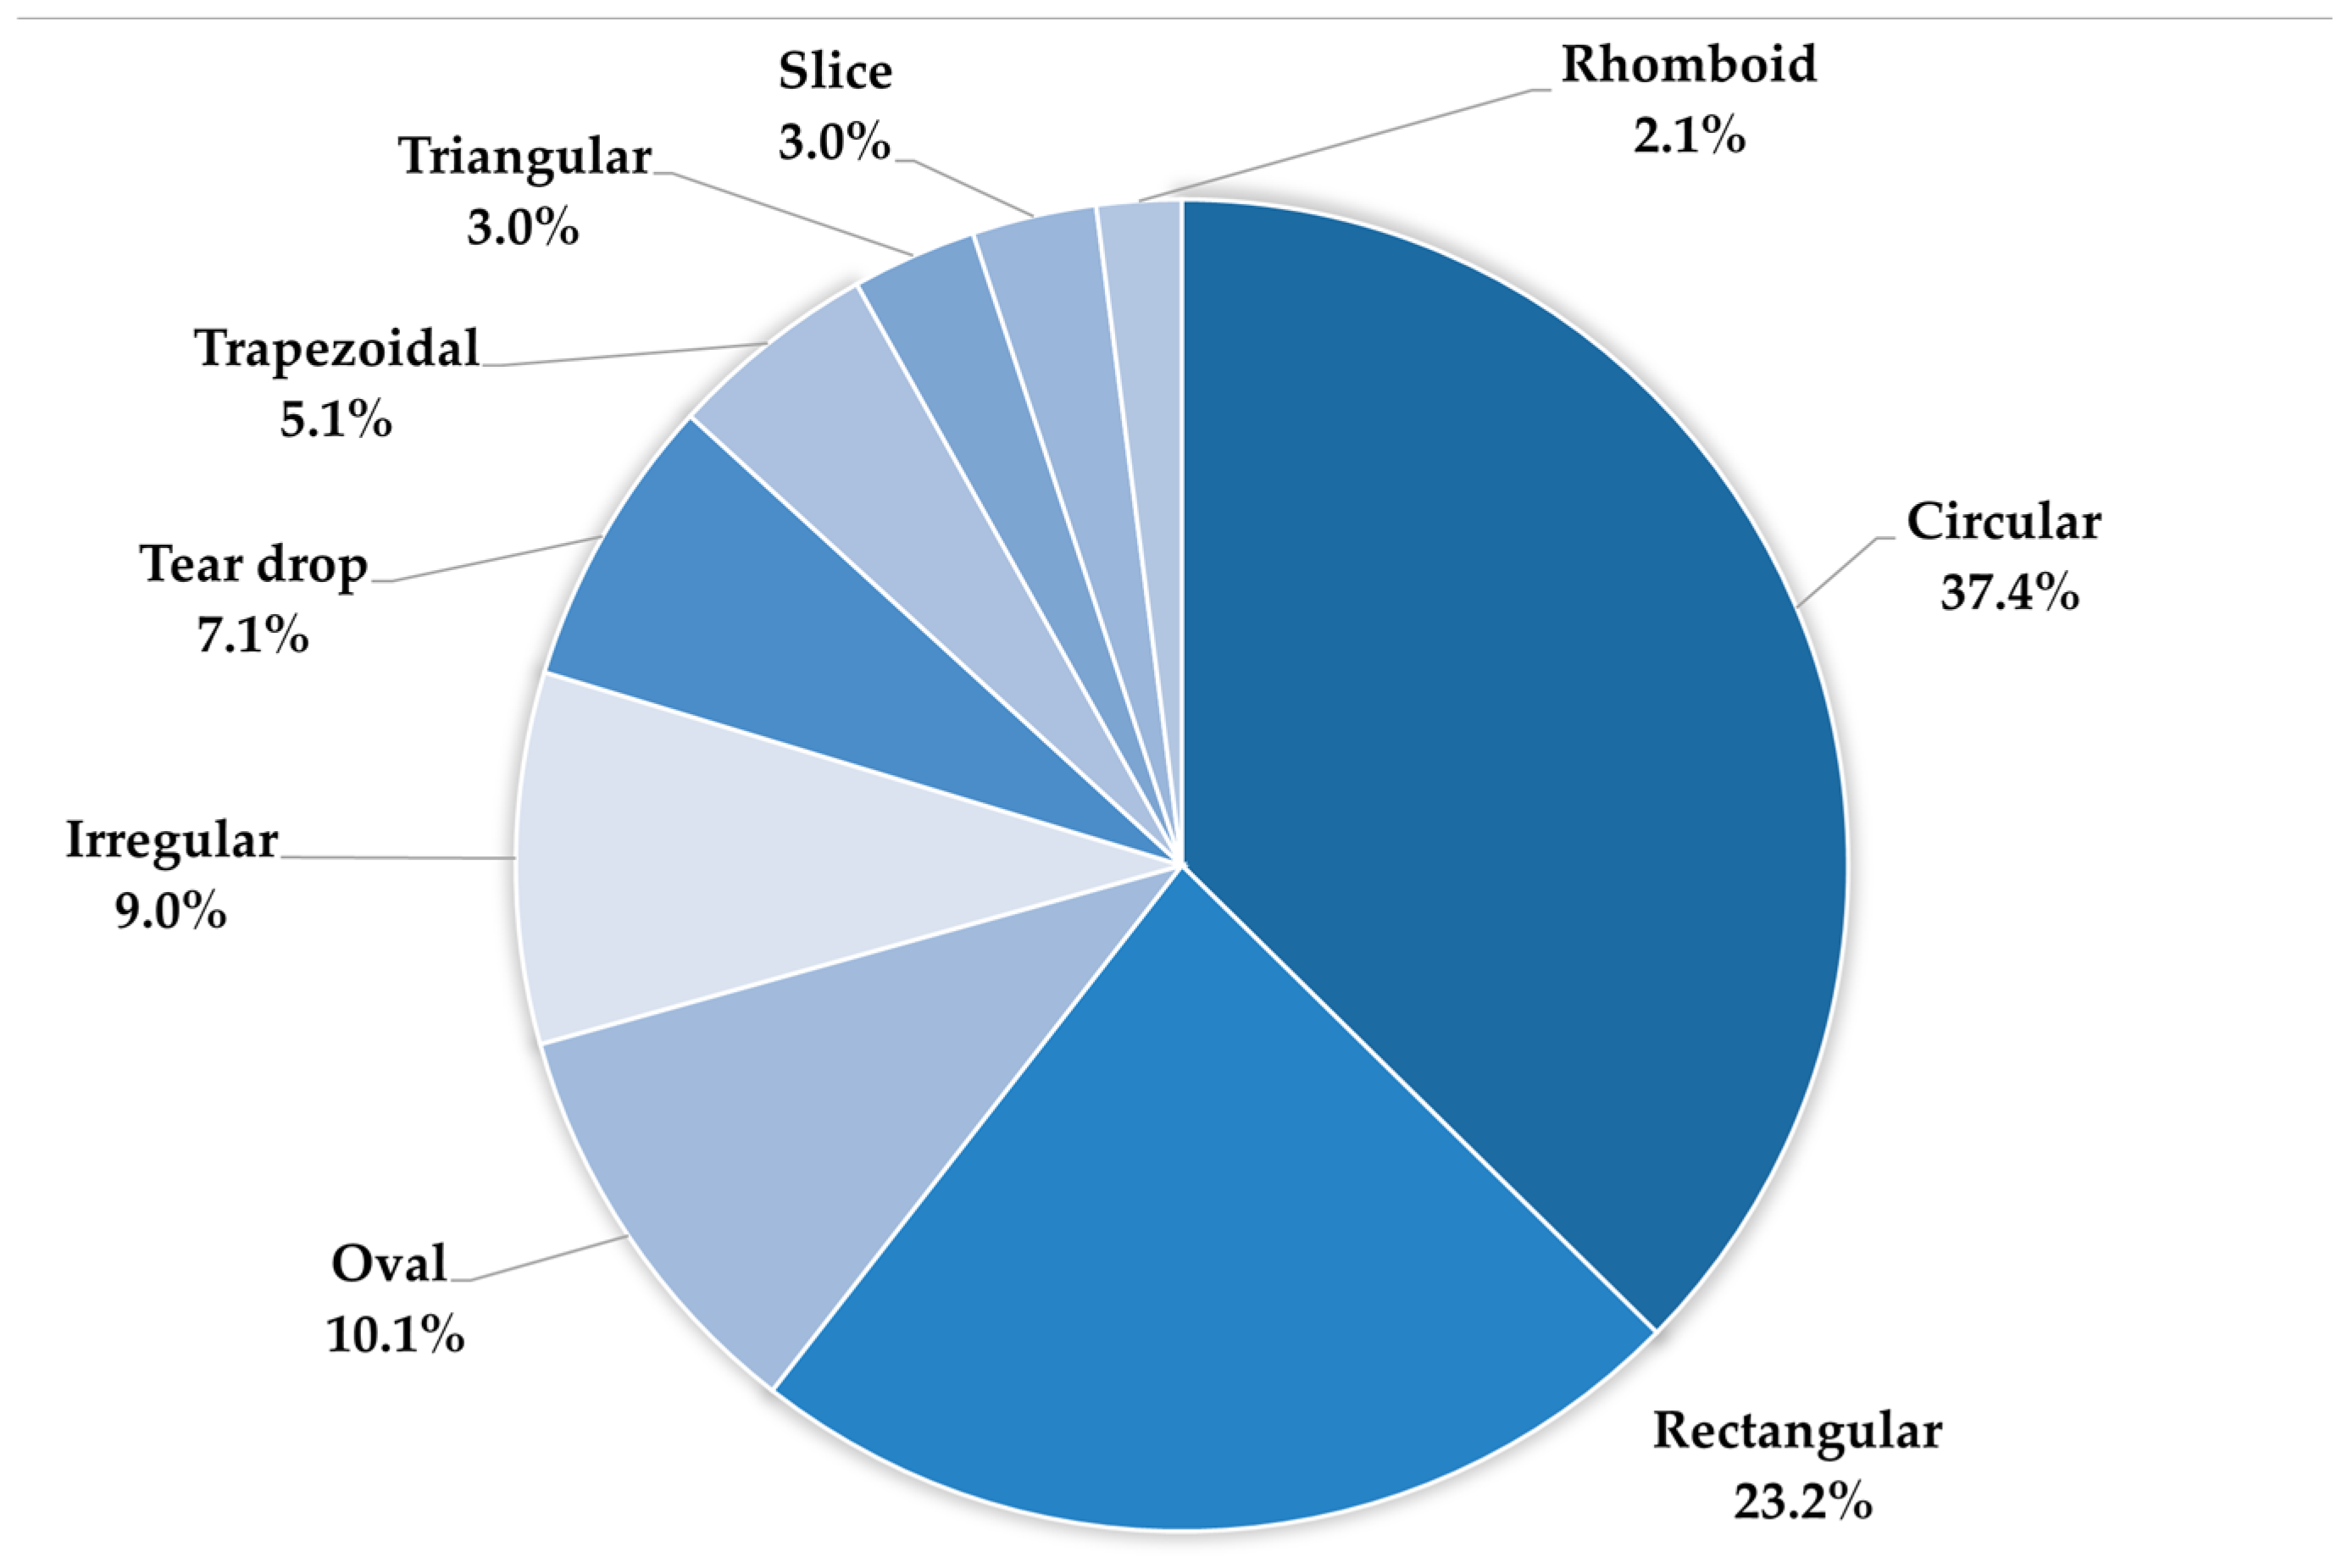
Shape, canopy, and topographic position were registered after identifying each aguada. Additional features, including possible origin (natural vs. artificial), were also recorded. Circular (37.4%) and rectangular (23.2%) shapes are the most common shapes in the survey area (Figure 15). Just over 9% of the aguadas are oval or irregular in shape, while the rest include a wide range of triangular, trapezoidal, tear-drop, slice, and rhomboid shapes.
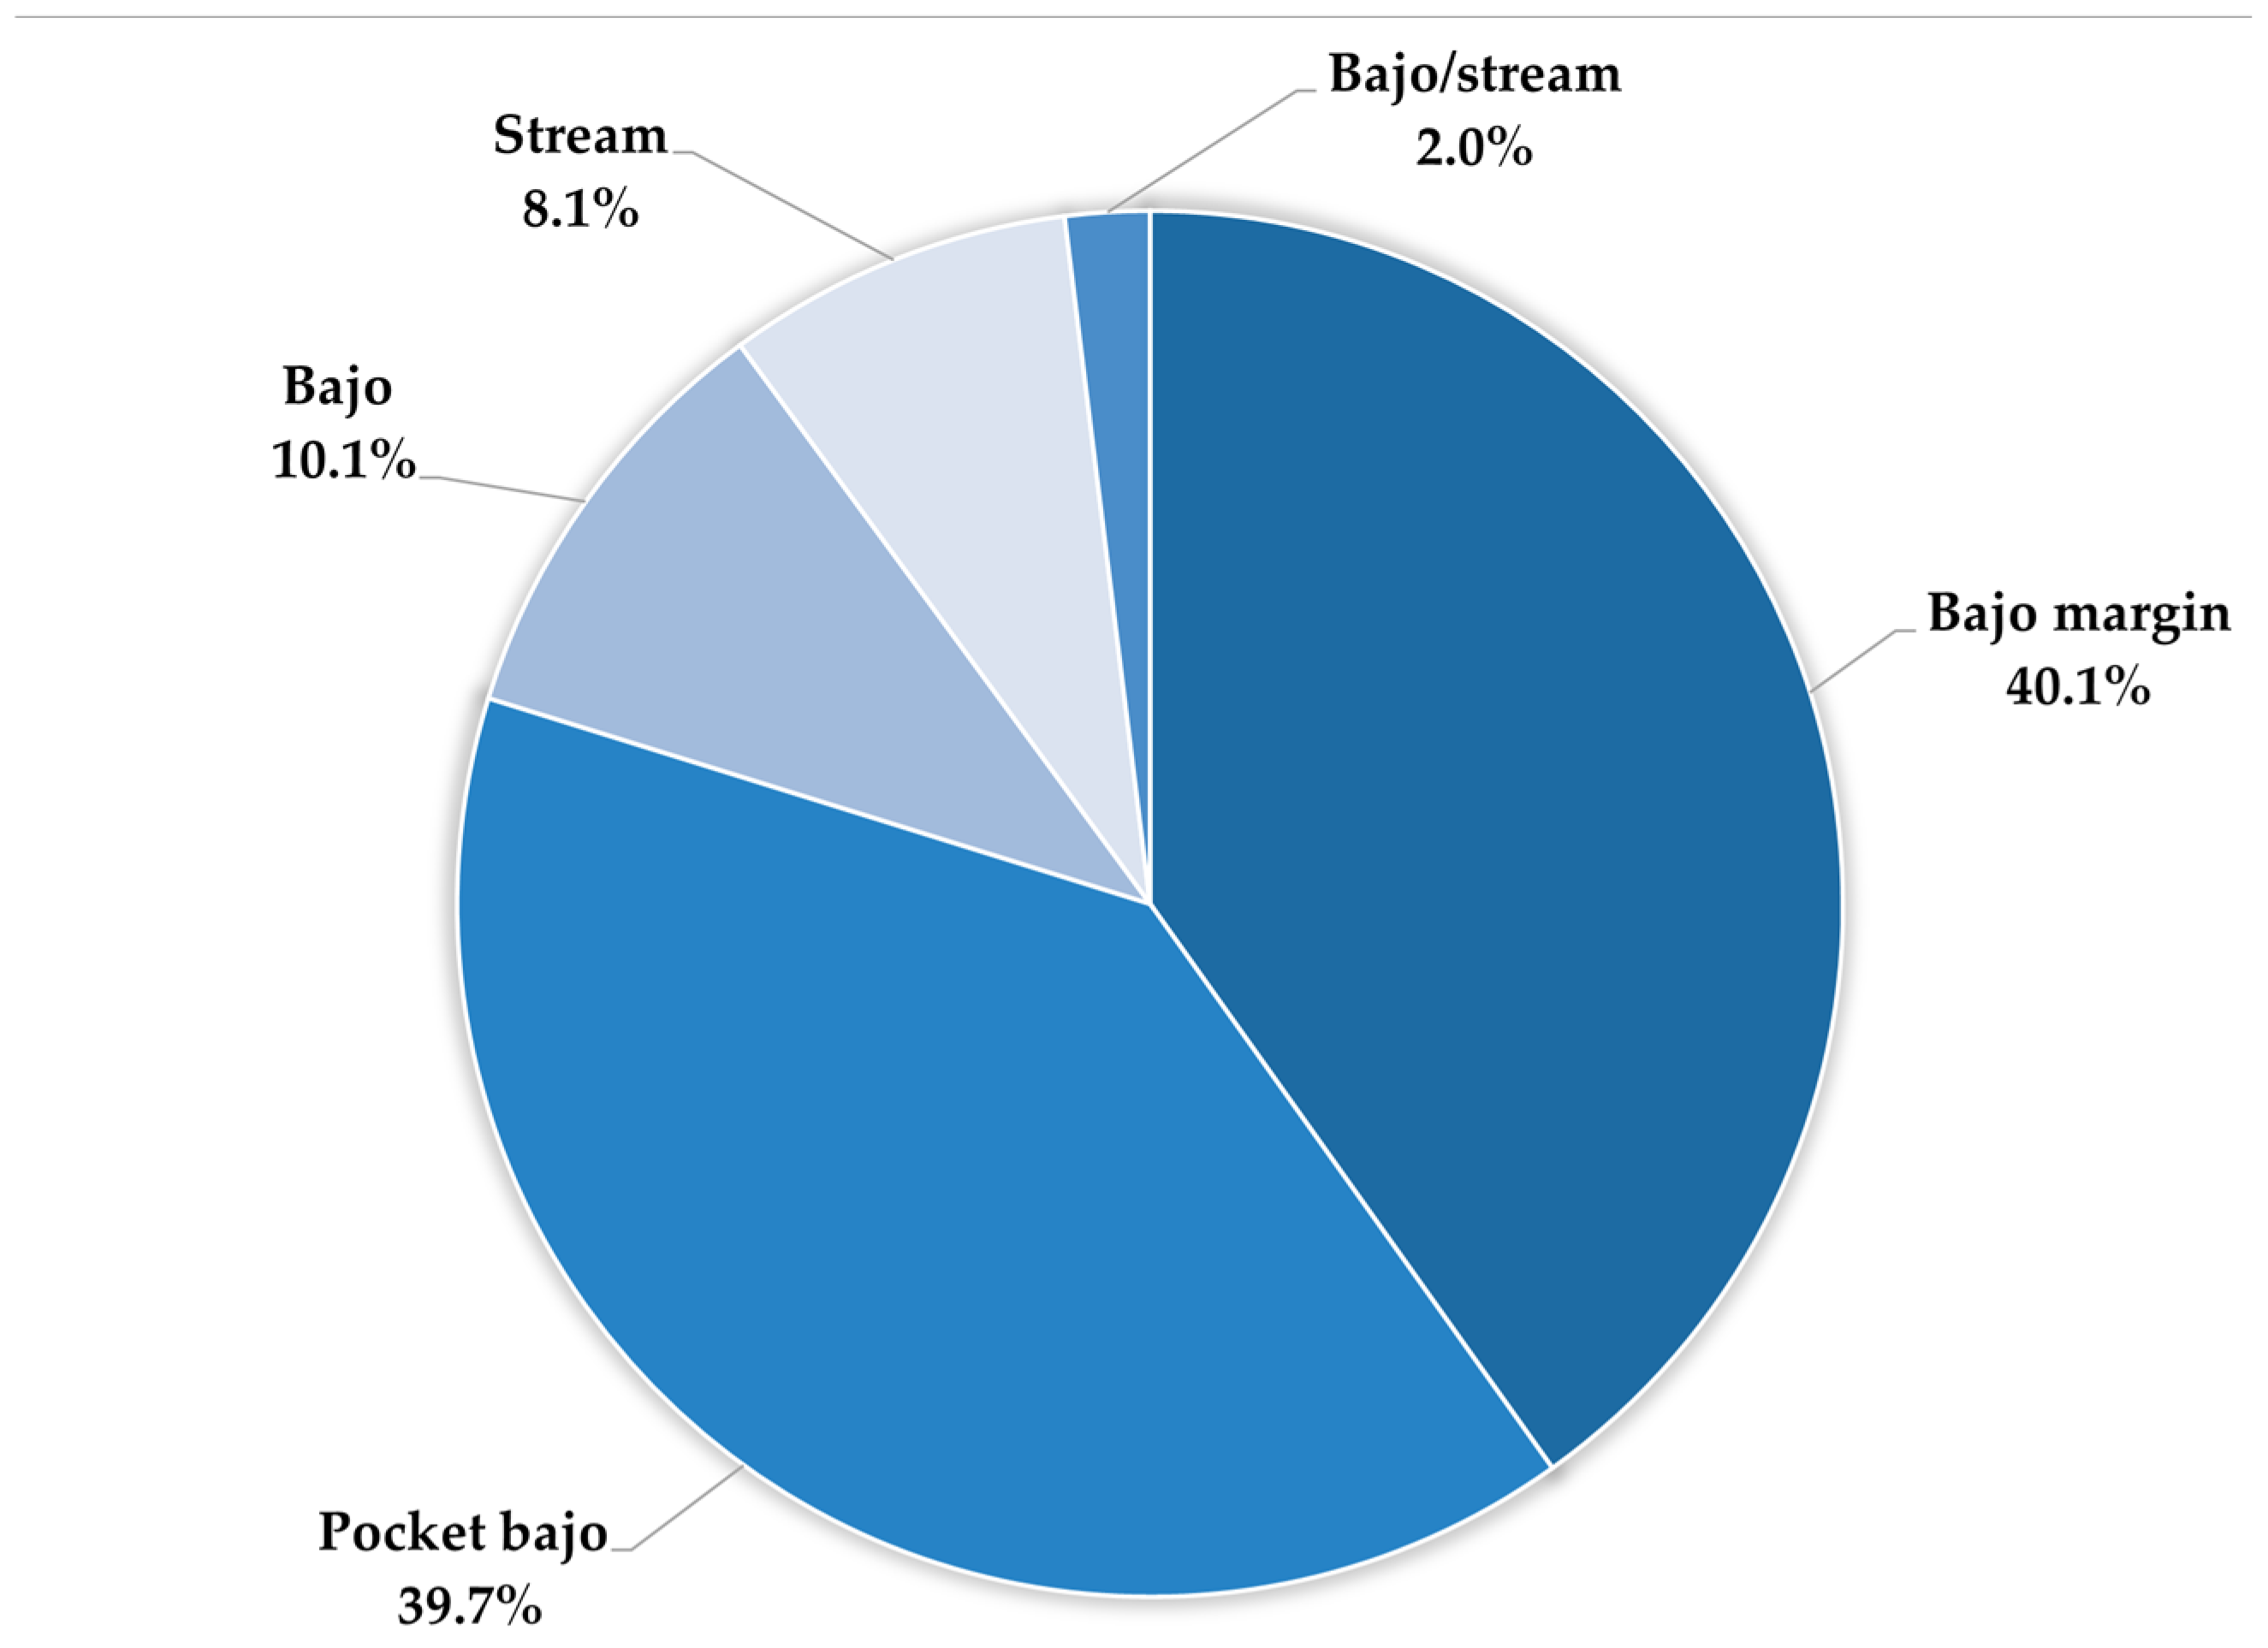
Each aguada’s topographic position was also noted as a characteristic, revealing the type of terrain in which it is situated. Although they can be found in a variety of contexts, such as within the bajos, pocket bajos, and along the path of seasonal streams, the aguadas are primarily located on the lowland edges. Approximately 39% of the 99 aguadas that have been identified are found in pocket bajos, 11% are found in large bajos (away from the margin), 8% are found in seasonal streams that flow from the upper areas to the wetlands, and around 41% are found on the edges of large bajos. An additional 2% is found within the channels of those seasonal streams that run tens or hundreds of meters within the large bajos (stream/bajos) (Figure 16).
The most important factor in the identification of an aguada is canopy cover, as some aguadas are open (no covering vegetation), while others are partially or completely covered. In the sample of the 99 identified aguadas, nearly 55.6% of them were entirely or partially covered, while the remainder were open (Figure 17).
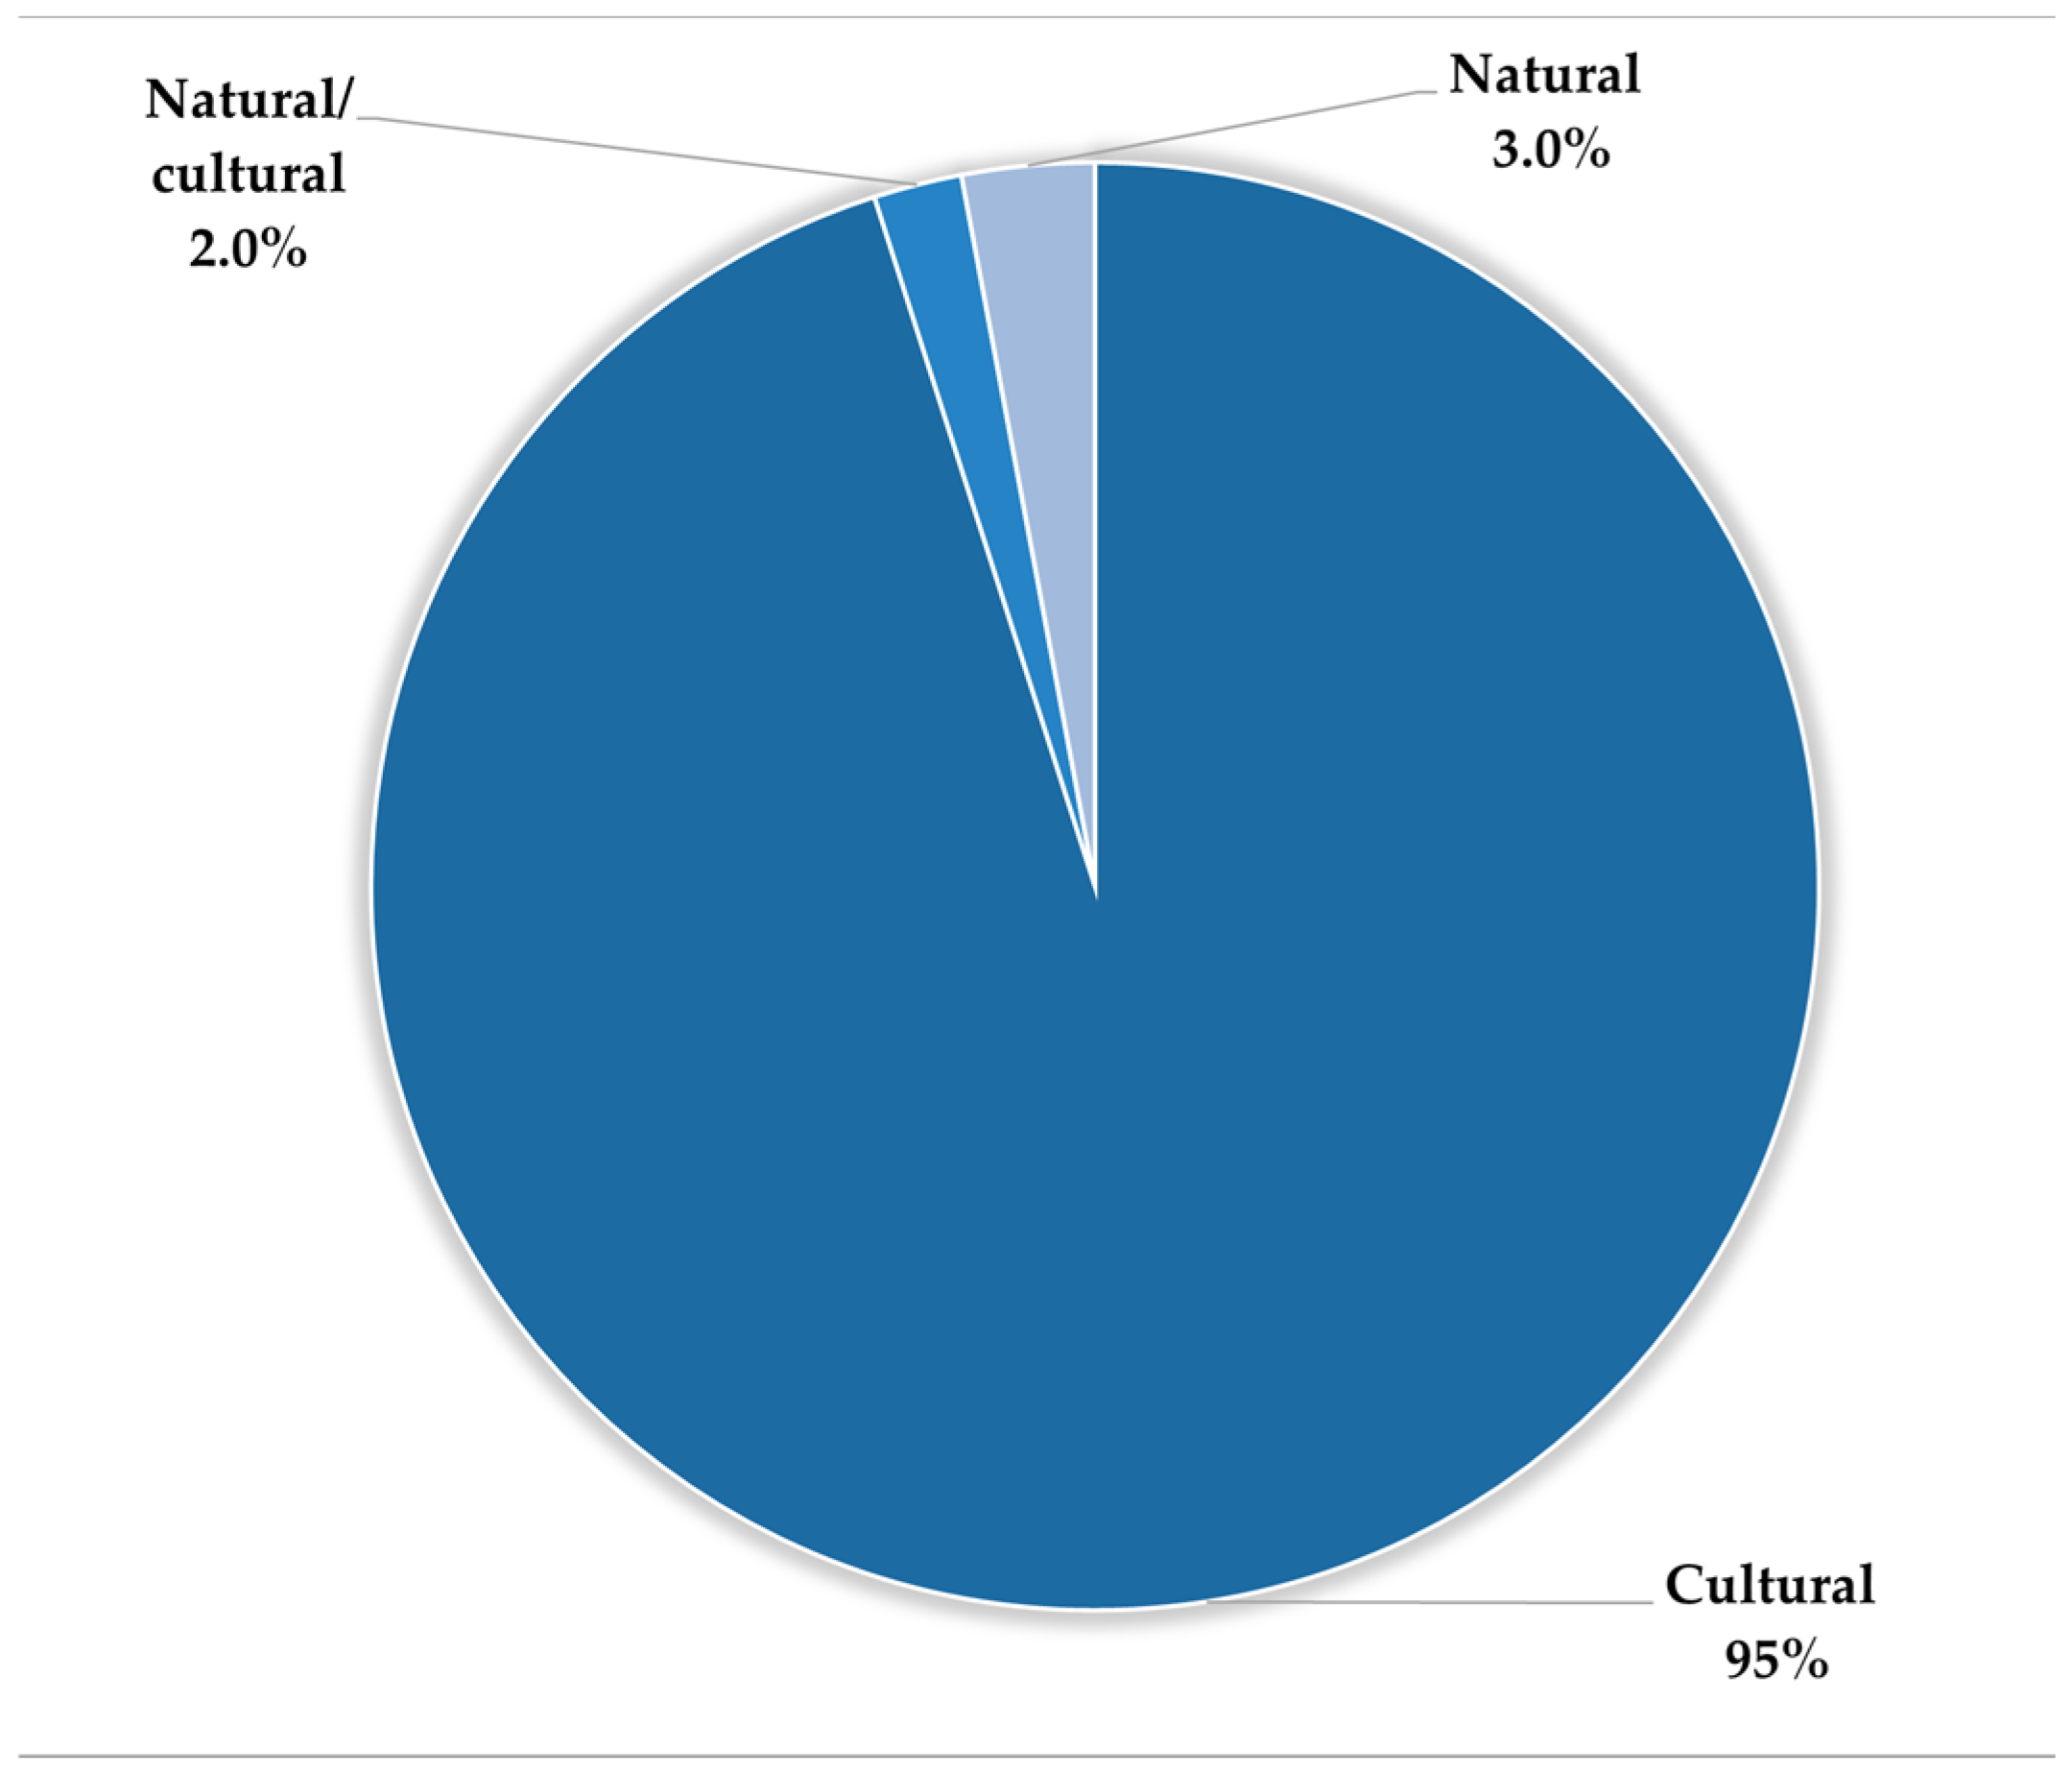
The last aspect of the aguadas recorded is their possible origin, that is, whether they were built or modified by the ancient Maya, or whether they are completely natural. Of the 99 identified aguadas, only three appear unmodified, natural formations and could be classified as civals, i.e., aguadas or marshy areas that form within the margins of bajos. Some of the remaining aguadas, although possibly having originated naturally, have their shape and context suggest significant cultural modifications (Figure 18).
From the above analysis, practical findings for the extension and enhancement of the identification process for aguadas, are outlined below:
  • Spatial resolution is crucial for identifying aguadas, as a higher resolution enhances the visibility of surface details, facilitating the detection of even the smallest examples;
  • Identification of aguadas depends primarily on the type of vegetation and whether it has canopy cover or not. Open canopy aguadas are the easiest to identify, and we assume that we have recorded all features with these characteristics;
  • Lidar-derived DEM SLRM and VAT visualizations are the most efficient, facilitating the identification of a total of 99 aguadas;
  • Out of the included satellite imagery sources, near-infrared (NIR) imagery from Planet has the highest success rate for aguada identification (74) due to the reflectivity of water;
  • The orthophotos from INEGI, despite their great spatial resolution of 1.5 m, yield worse results compared to multispectral images, as they offer just a monochromatic representation of the surface. Nonetheless, despite these constraints, about 60% of the aguadas were identified, surpassing the web mosaics;
  • Bing is the most efficient among the images retrieved from web platforms, followed by ESRI, while Google Earth is the least effective due to its low spatial resolution in the survey area;
  • In the multispectral satellite imagery, 36 additional aguadas were discovered, whilst the lidar-derived DEMs revealed 61 more aguadas compared to prior investigations by García et al. [5,63];

3.2. Field Verification

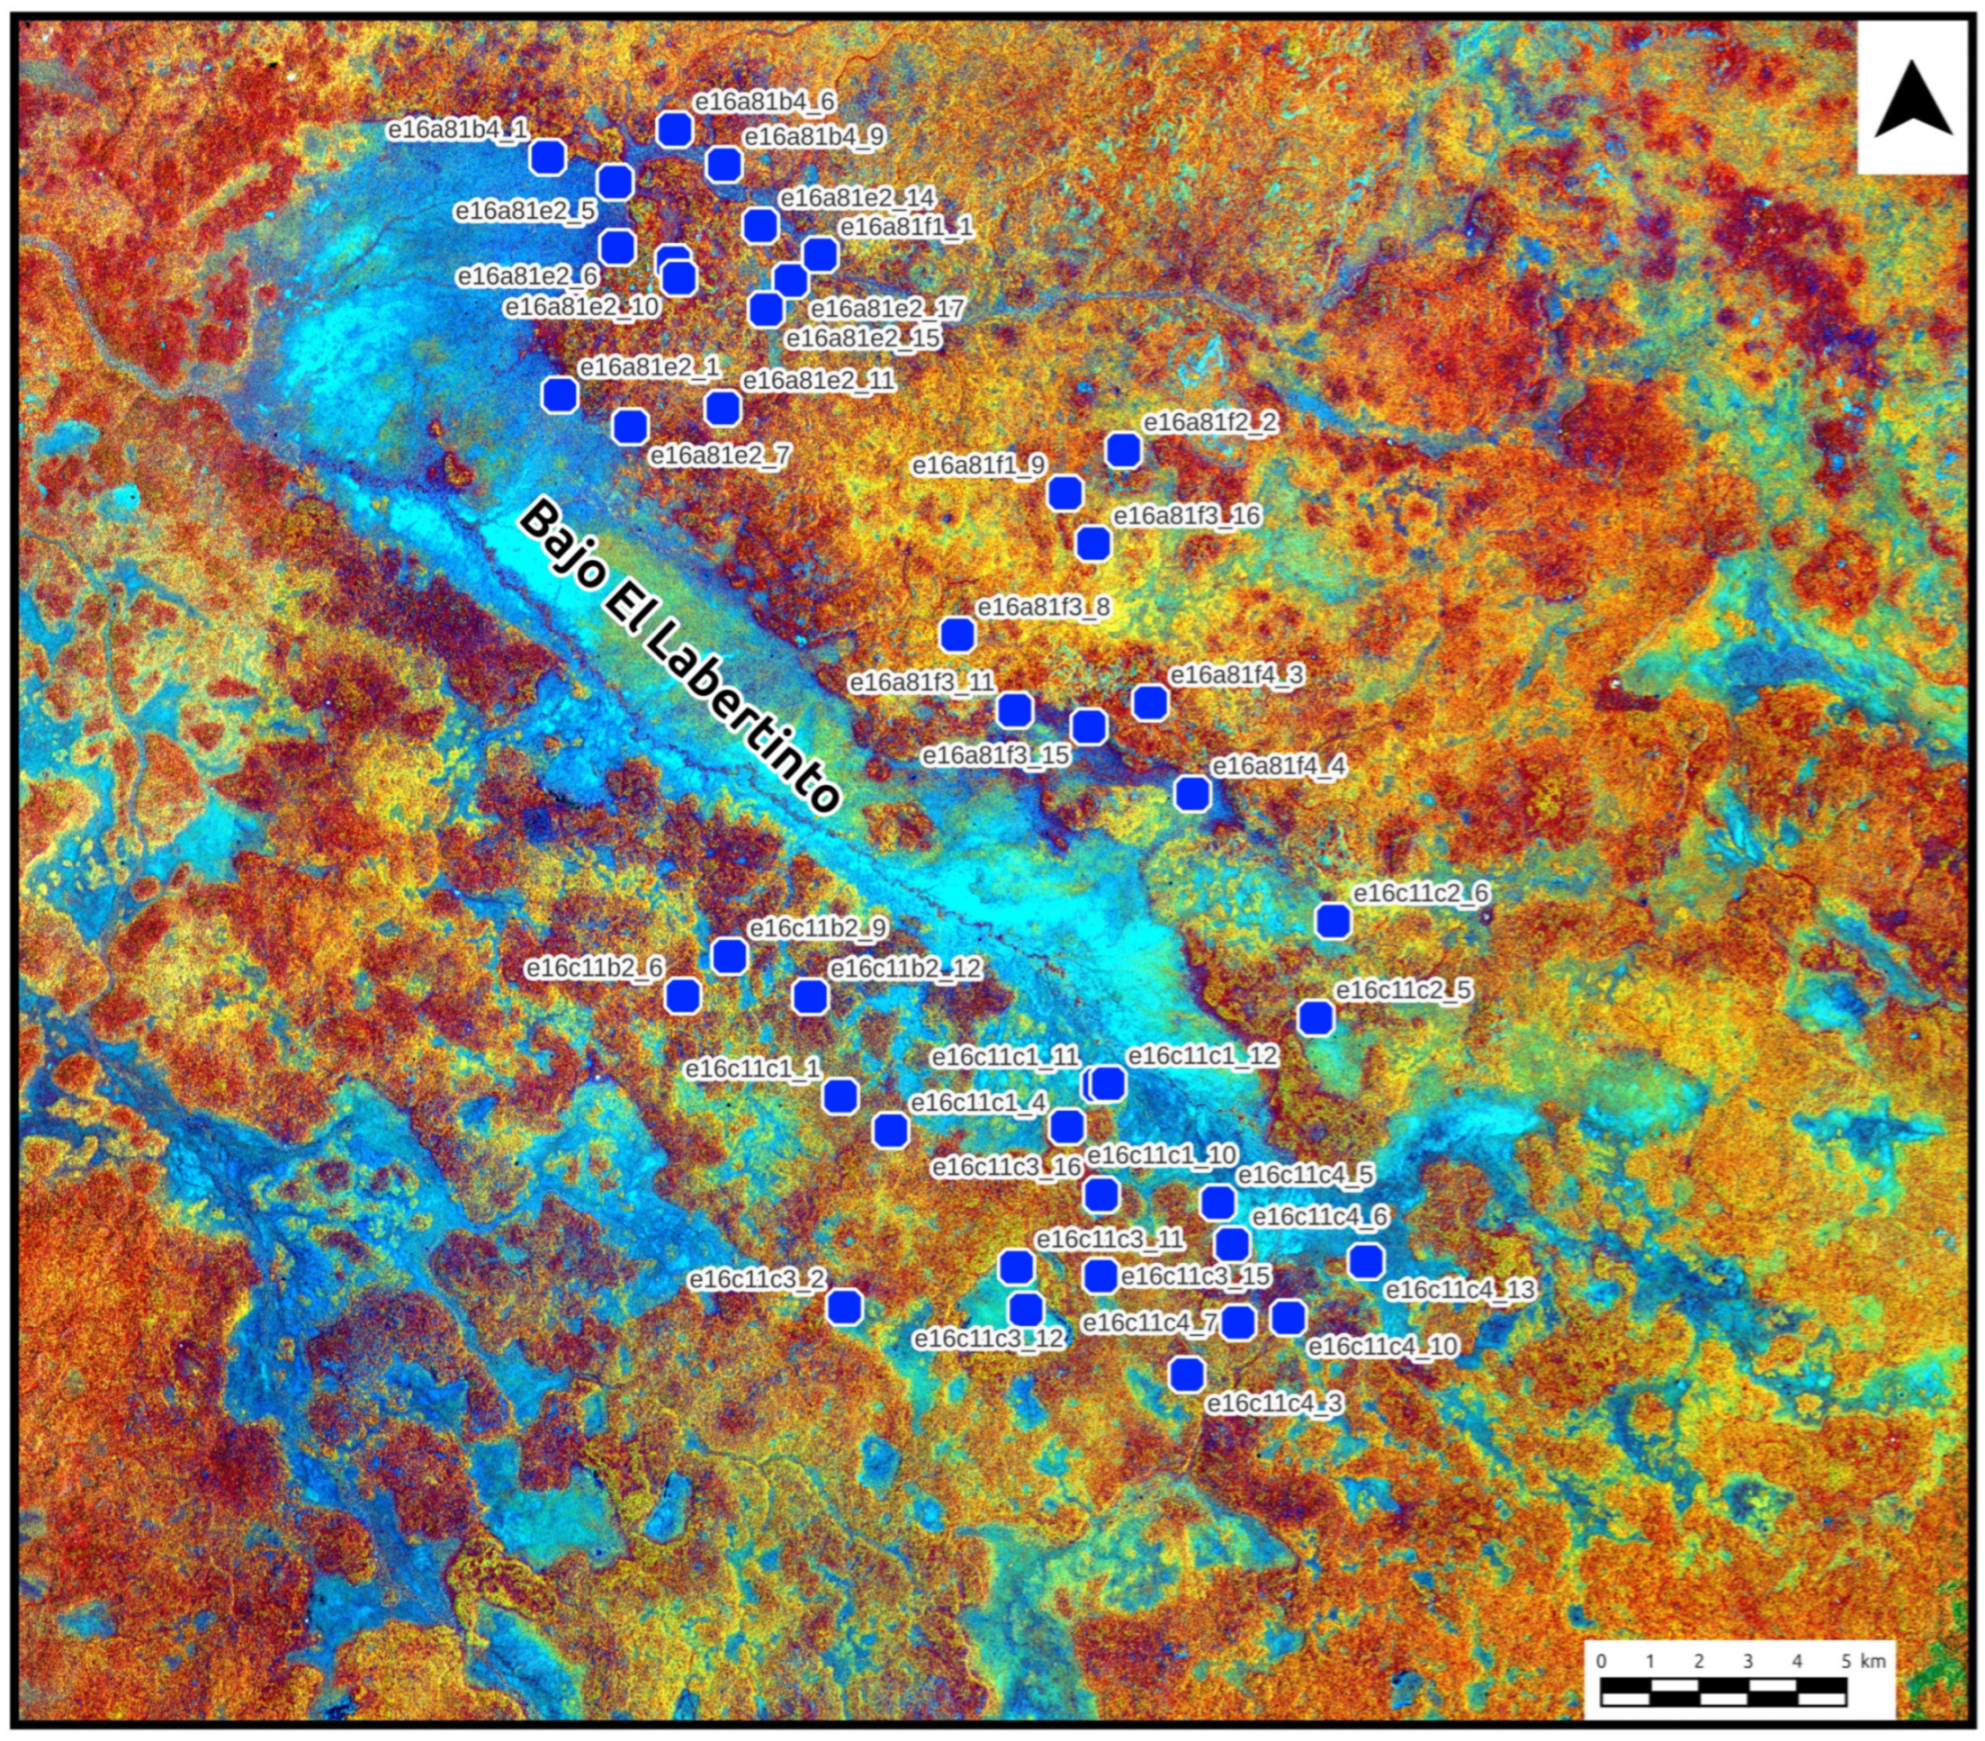
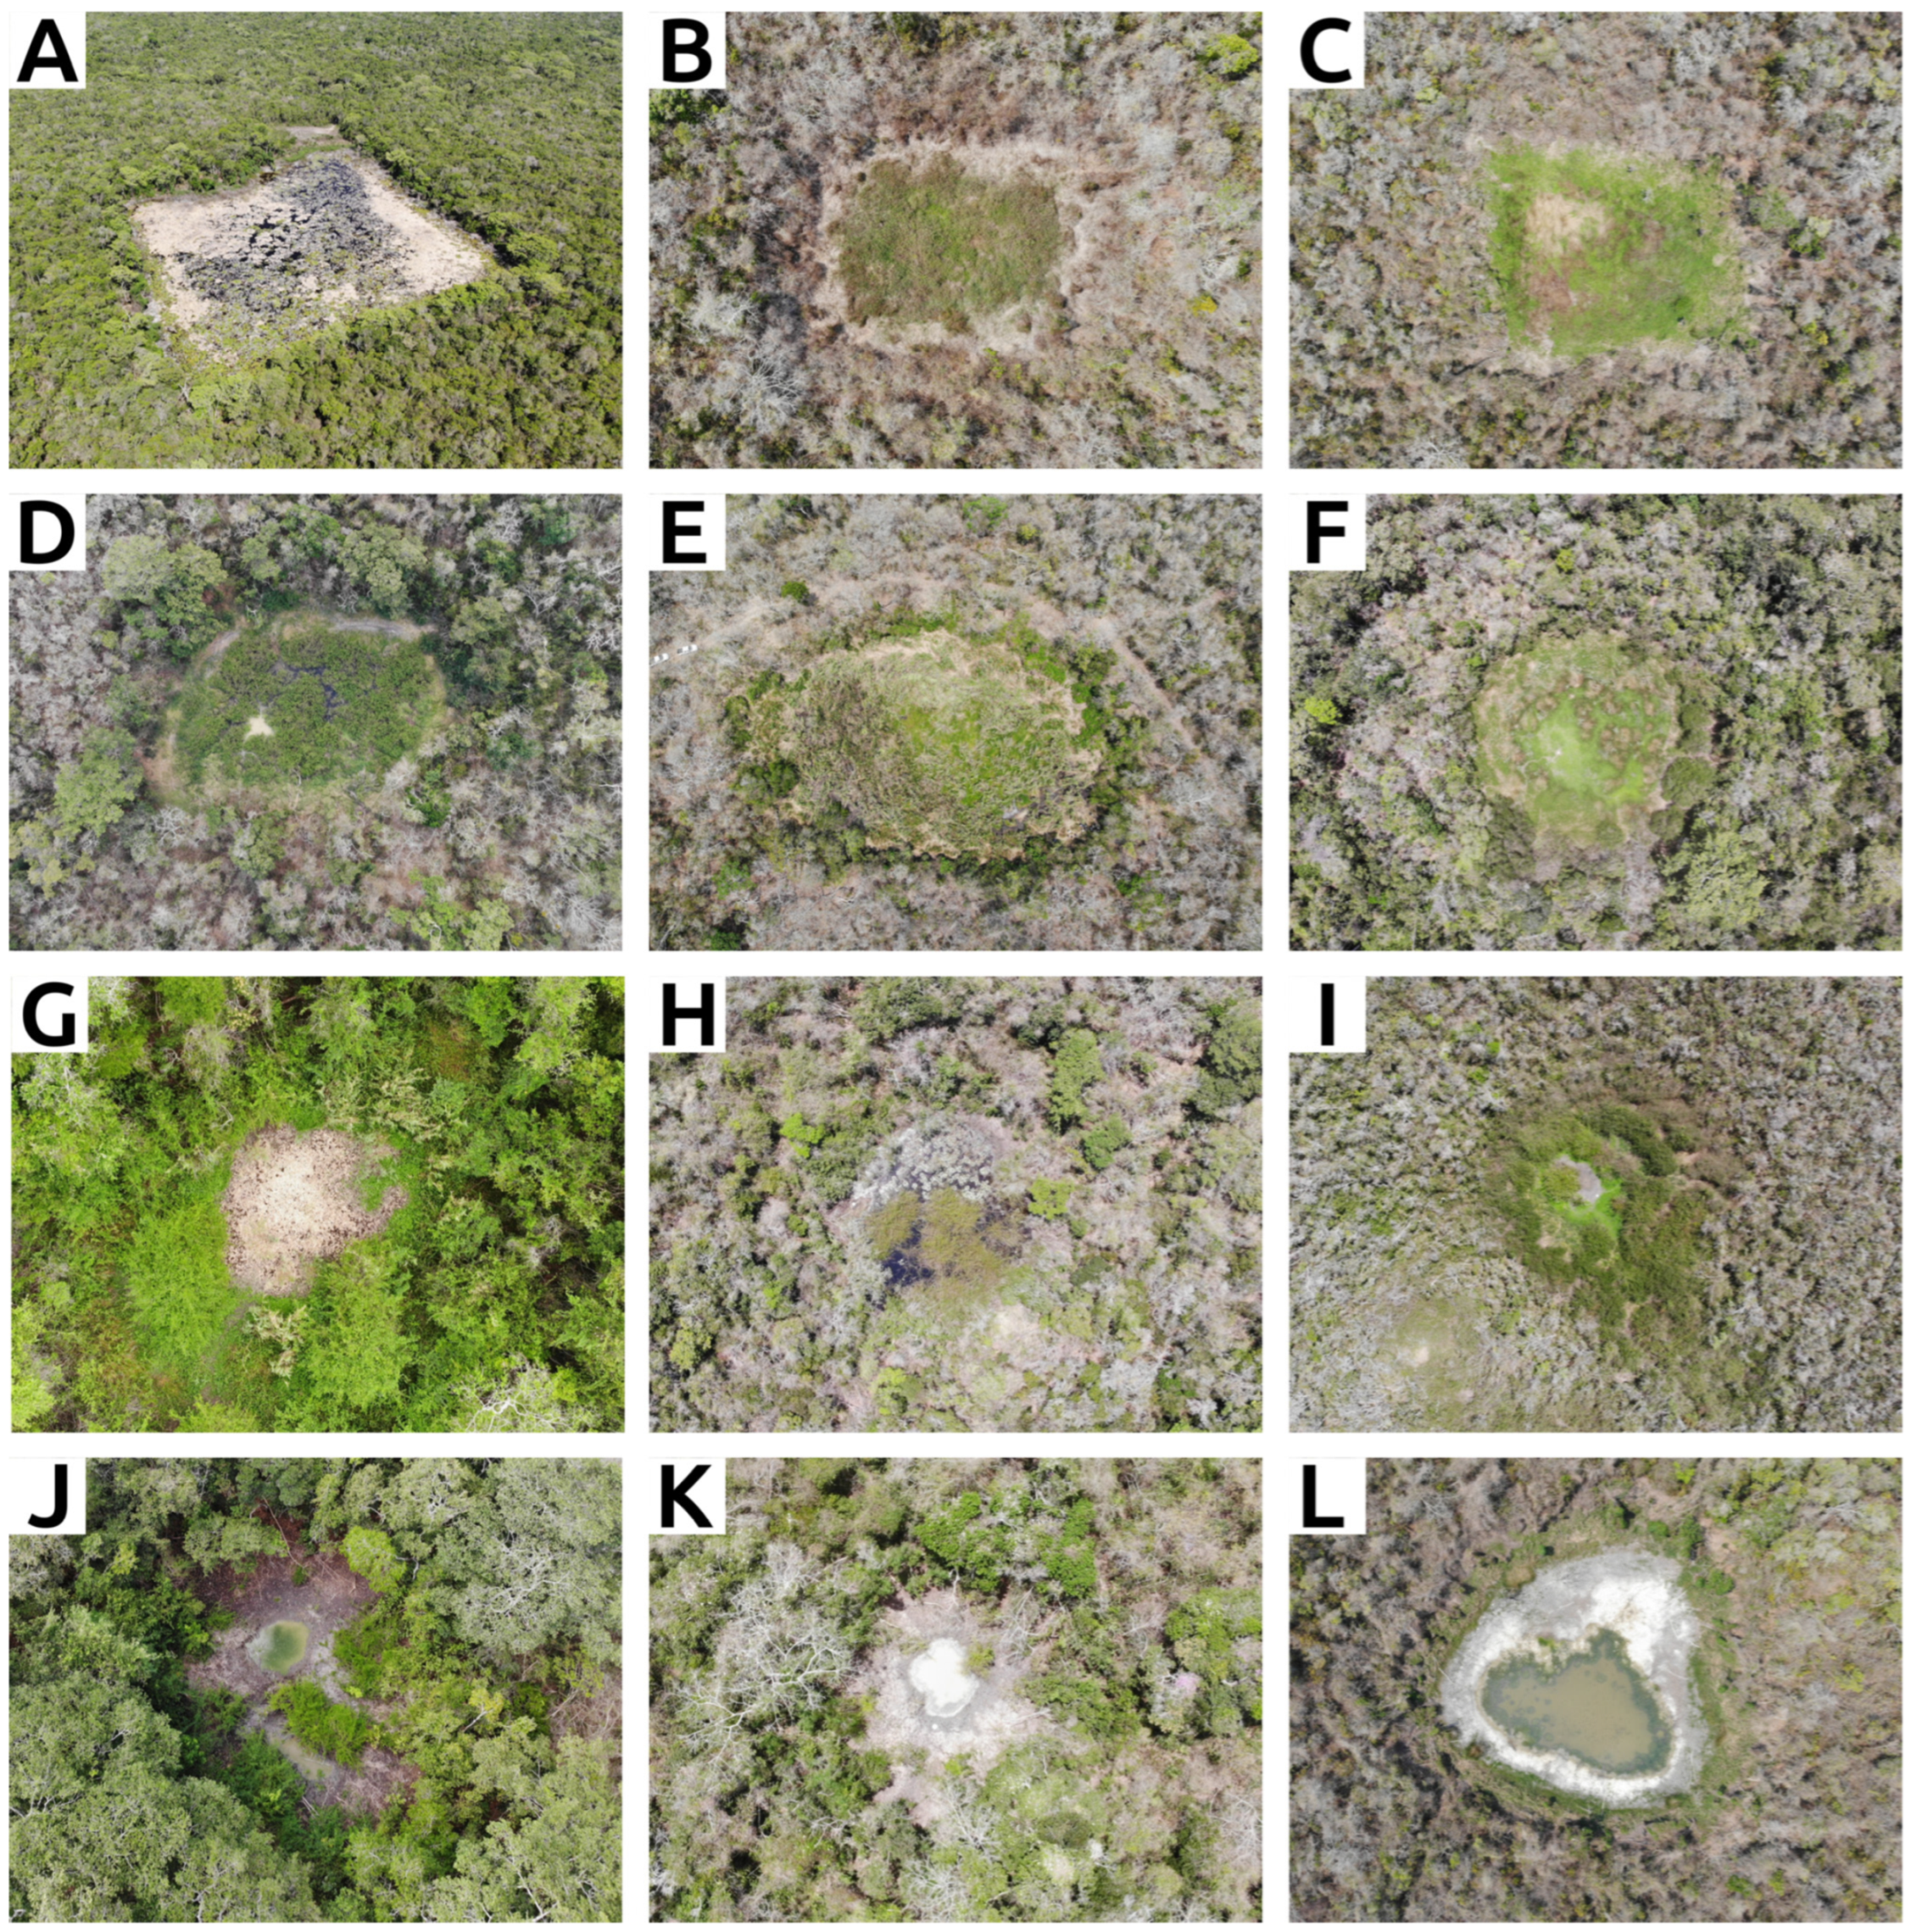
Although it is impossible to examine and verify each located aguada individually in the field, we have hitherto confirmed around 43 of these water bodies in the terrain (Figure 19). The verified aguadas are situated in multiple sites, including the Yaxnohcah-Pared de los Reyes lidar-derived DEM area, as well as others in the Calakmul region and areas identifiable exclusively through satellite imagery. The field verification included documentation using a drone, allowing us to assess the appearance of these aguadas from an aerial perspective (Figure 20).
Furthermore, observations were recorded regarding the vegetation and notable features of the examined aguadas, including the existence of berms, stones, channels, and adjacent structures. The majority of verification occurred during the dry season, resulting in most aguadas being desiccated. Verification during the rainy season is impossible due to extensive flooding, leaving various locations inaccessible.

3.3. Application of the Identification Process to the Entire Bajo El Laberinto Region

Following the comparison of the lidar-derived Digital Elevation Models (DEMs) of Calakmul and Yaxnohcah-Pared de los Reyes with satellite imagery, we expanded our investigation to an area where only satellite imagery is accessible, with the objective of identifying aguadas in the Bajo El Laberinto Region.
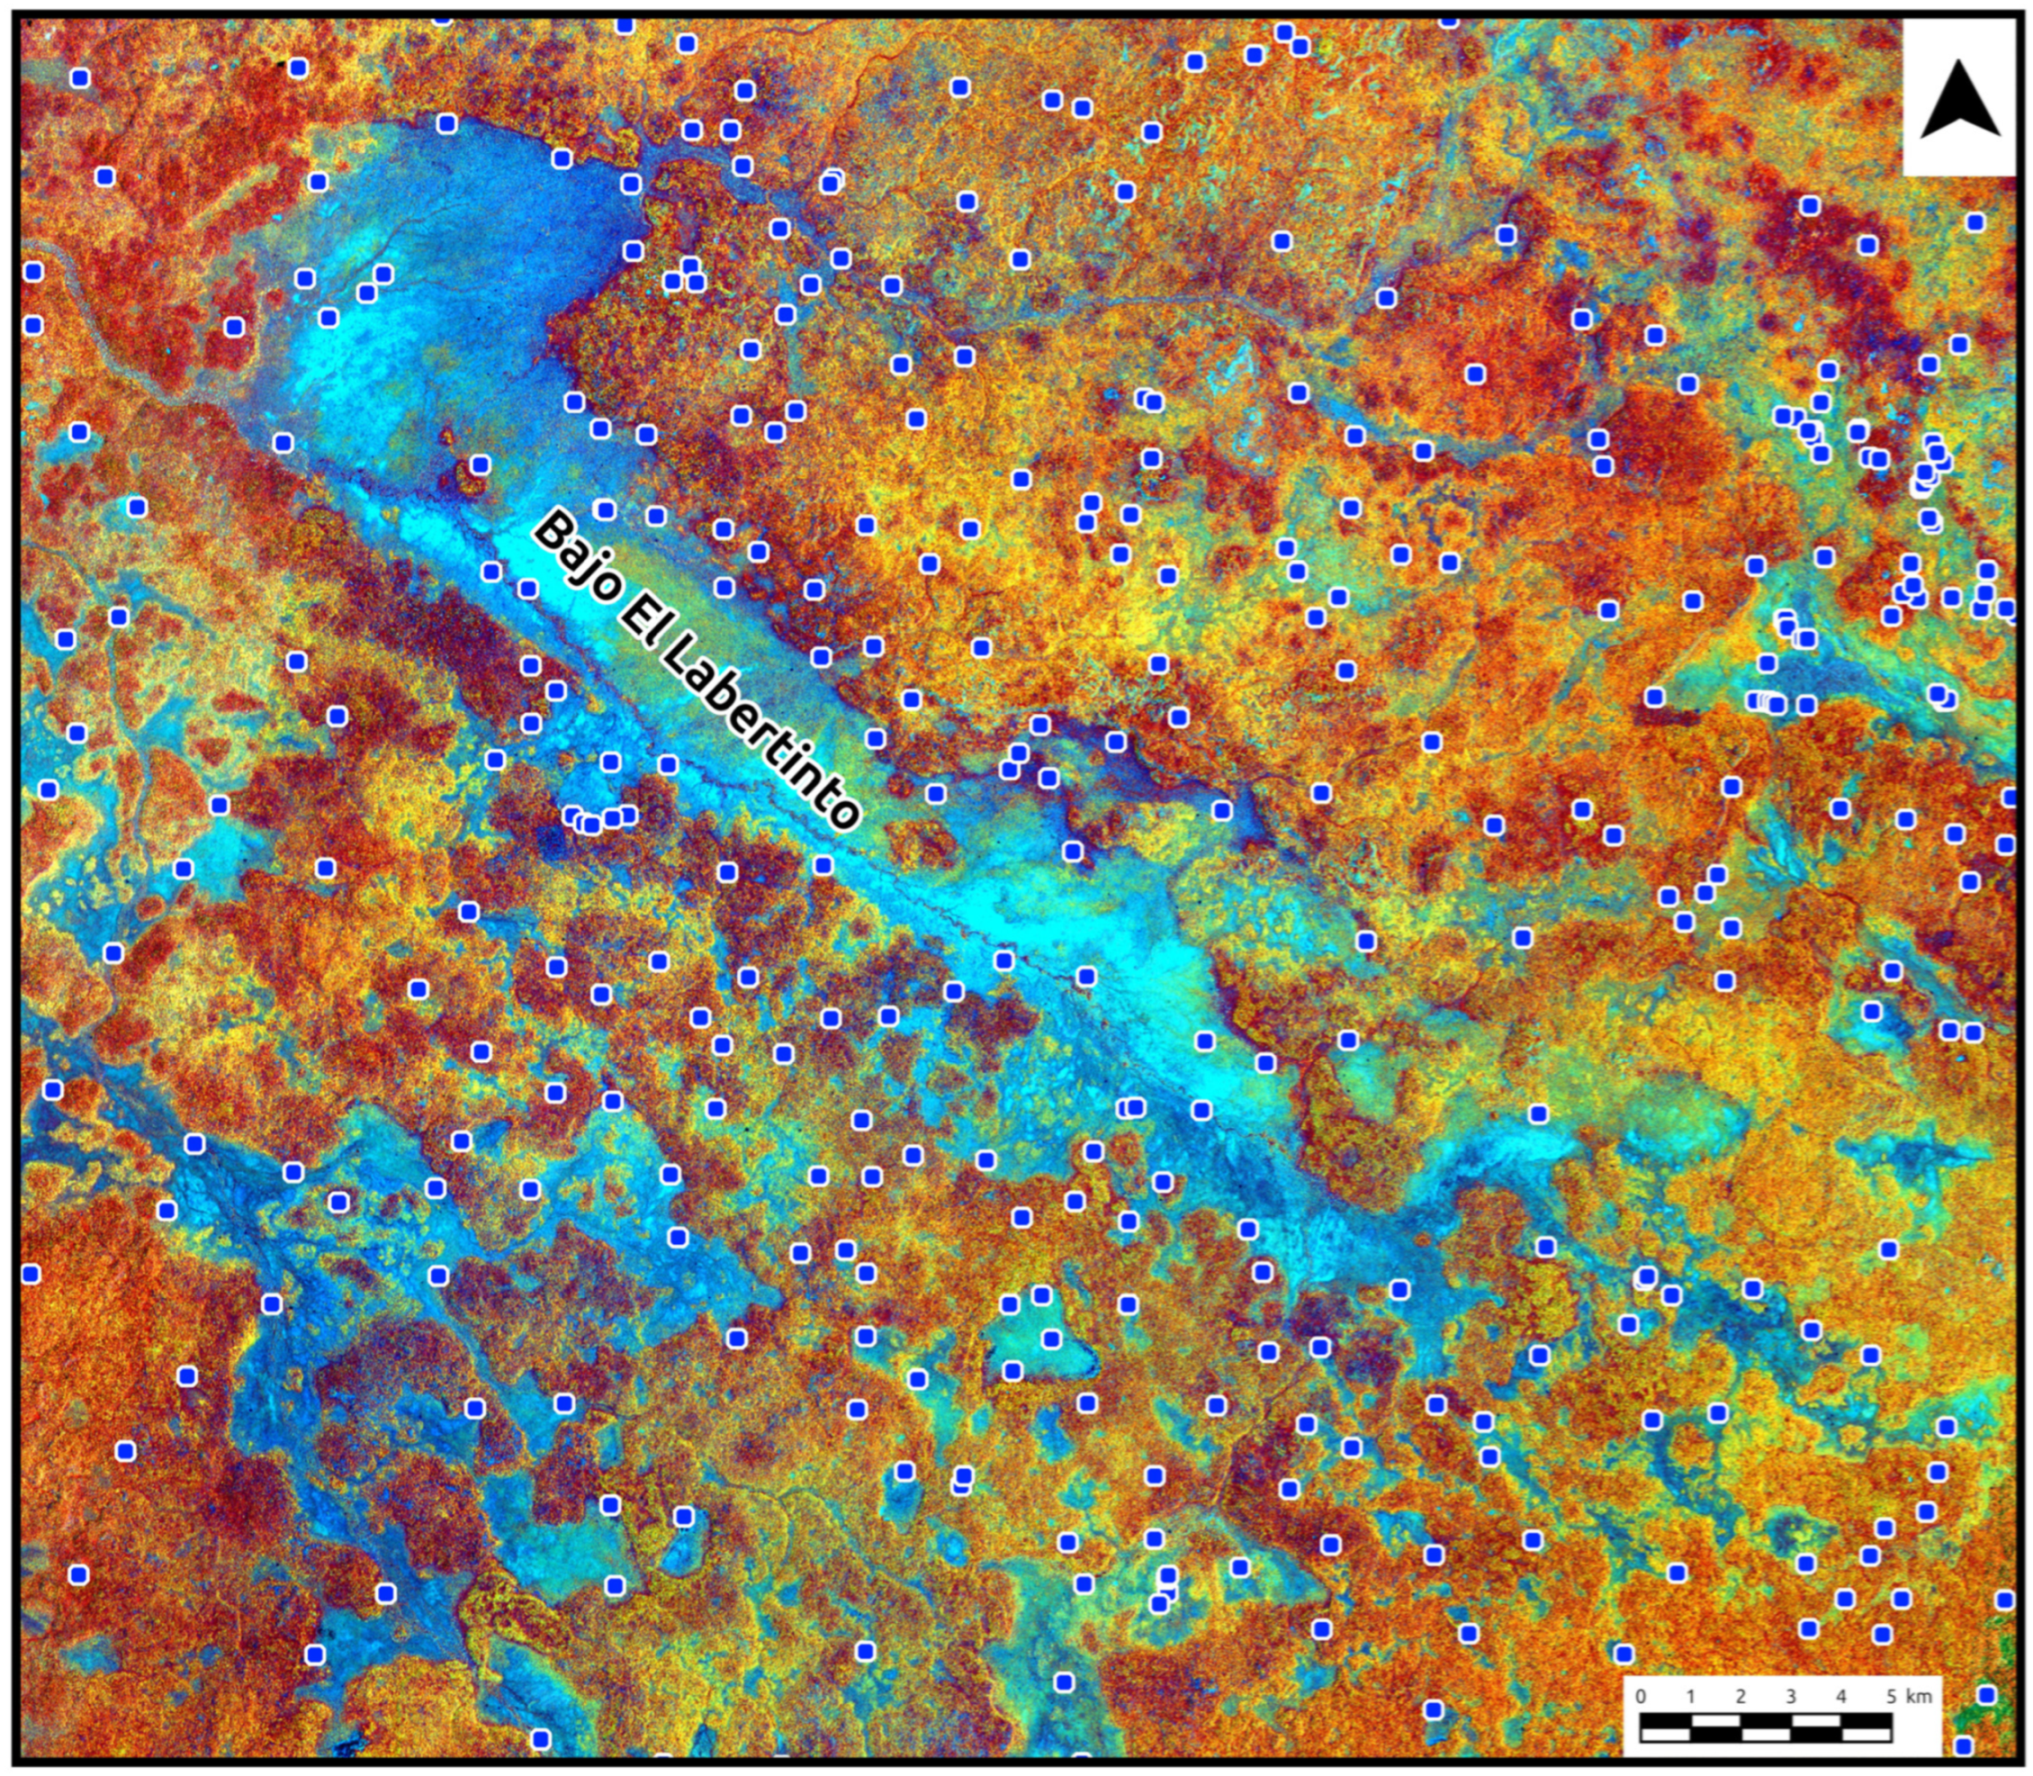
Following the outcomes of the prior comparative analysis, the identification of aguadas beyond the lidar coverage was expanded to encompass a total of 1400 square kilometers, equivalent to the entirety of the Bajo El Laberinto region and its vicinity. Visualizations from Planet NIR, Planet RGB, and INEGI’s orthophotos were employed for this purpose, according to their superior results after the lidar-derived DEM (Figure 21).
The aguadas were detected manually, with the stipulation that only those visible and identifiable in a minimum of two visualizations (Planet NIR, Planet RGB, or INEGI Orthophoto) were marked to prevent false positives. The result was the identification of 350 aguadas throughout the entire area of interest.
It is essential to acknowledge that we expect not all aguadas to be detected because of the limitations of satellite imagery. The aforementioned comparison indicates that in regions where only images from satellites are accessible, a minimum of 25% of the aguadas are likely undetected.
In consideration of these findings, the subsequent medium- to long-term goal of this research is to broaden the inventory of aguadas throughout the entire CBR region. This procedure will encompass additional aspects of these hydrological features, including, but not limited to, their morphology, context, position, density, and hydrological status, thus providing a comprehensive categorization of the aguadas in the entire region.

4. Discussion

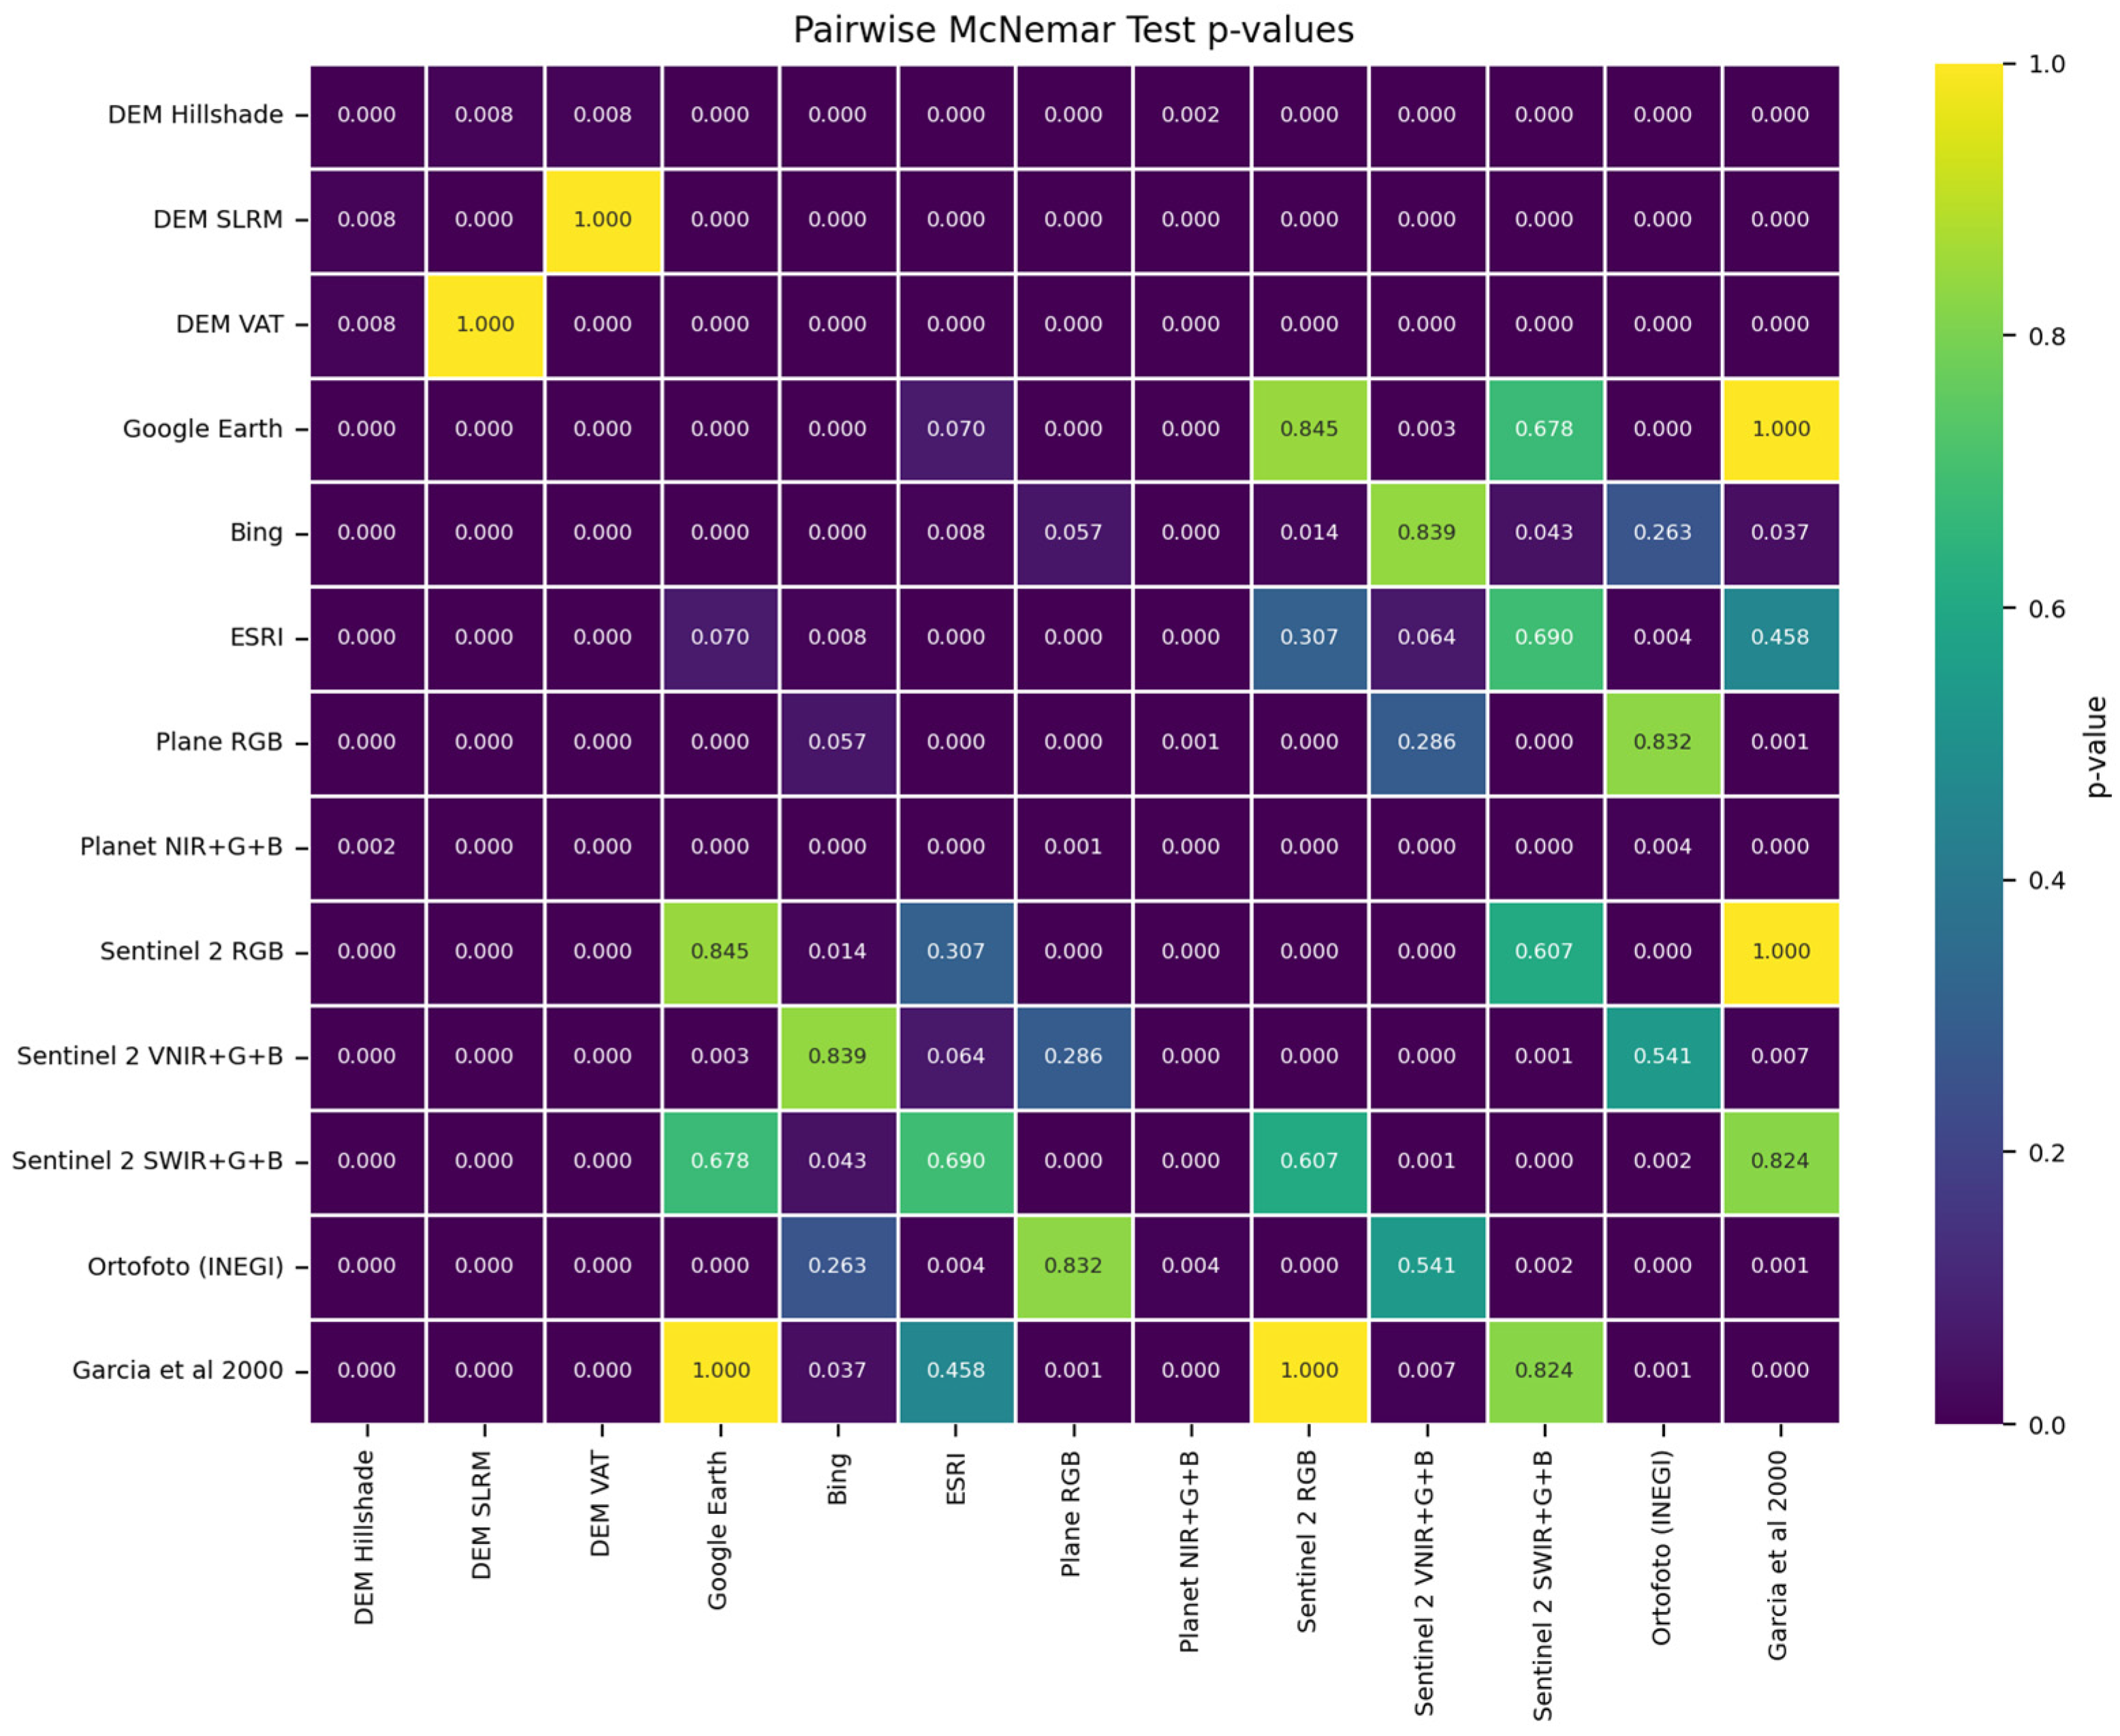
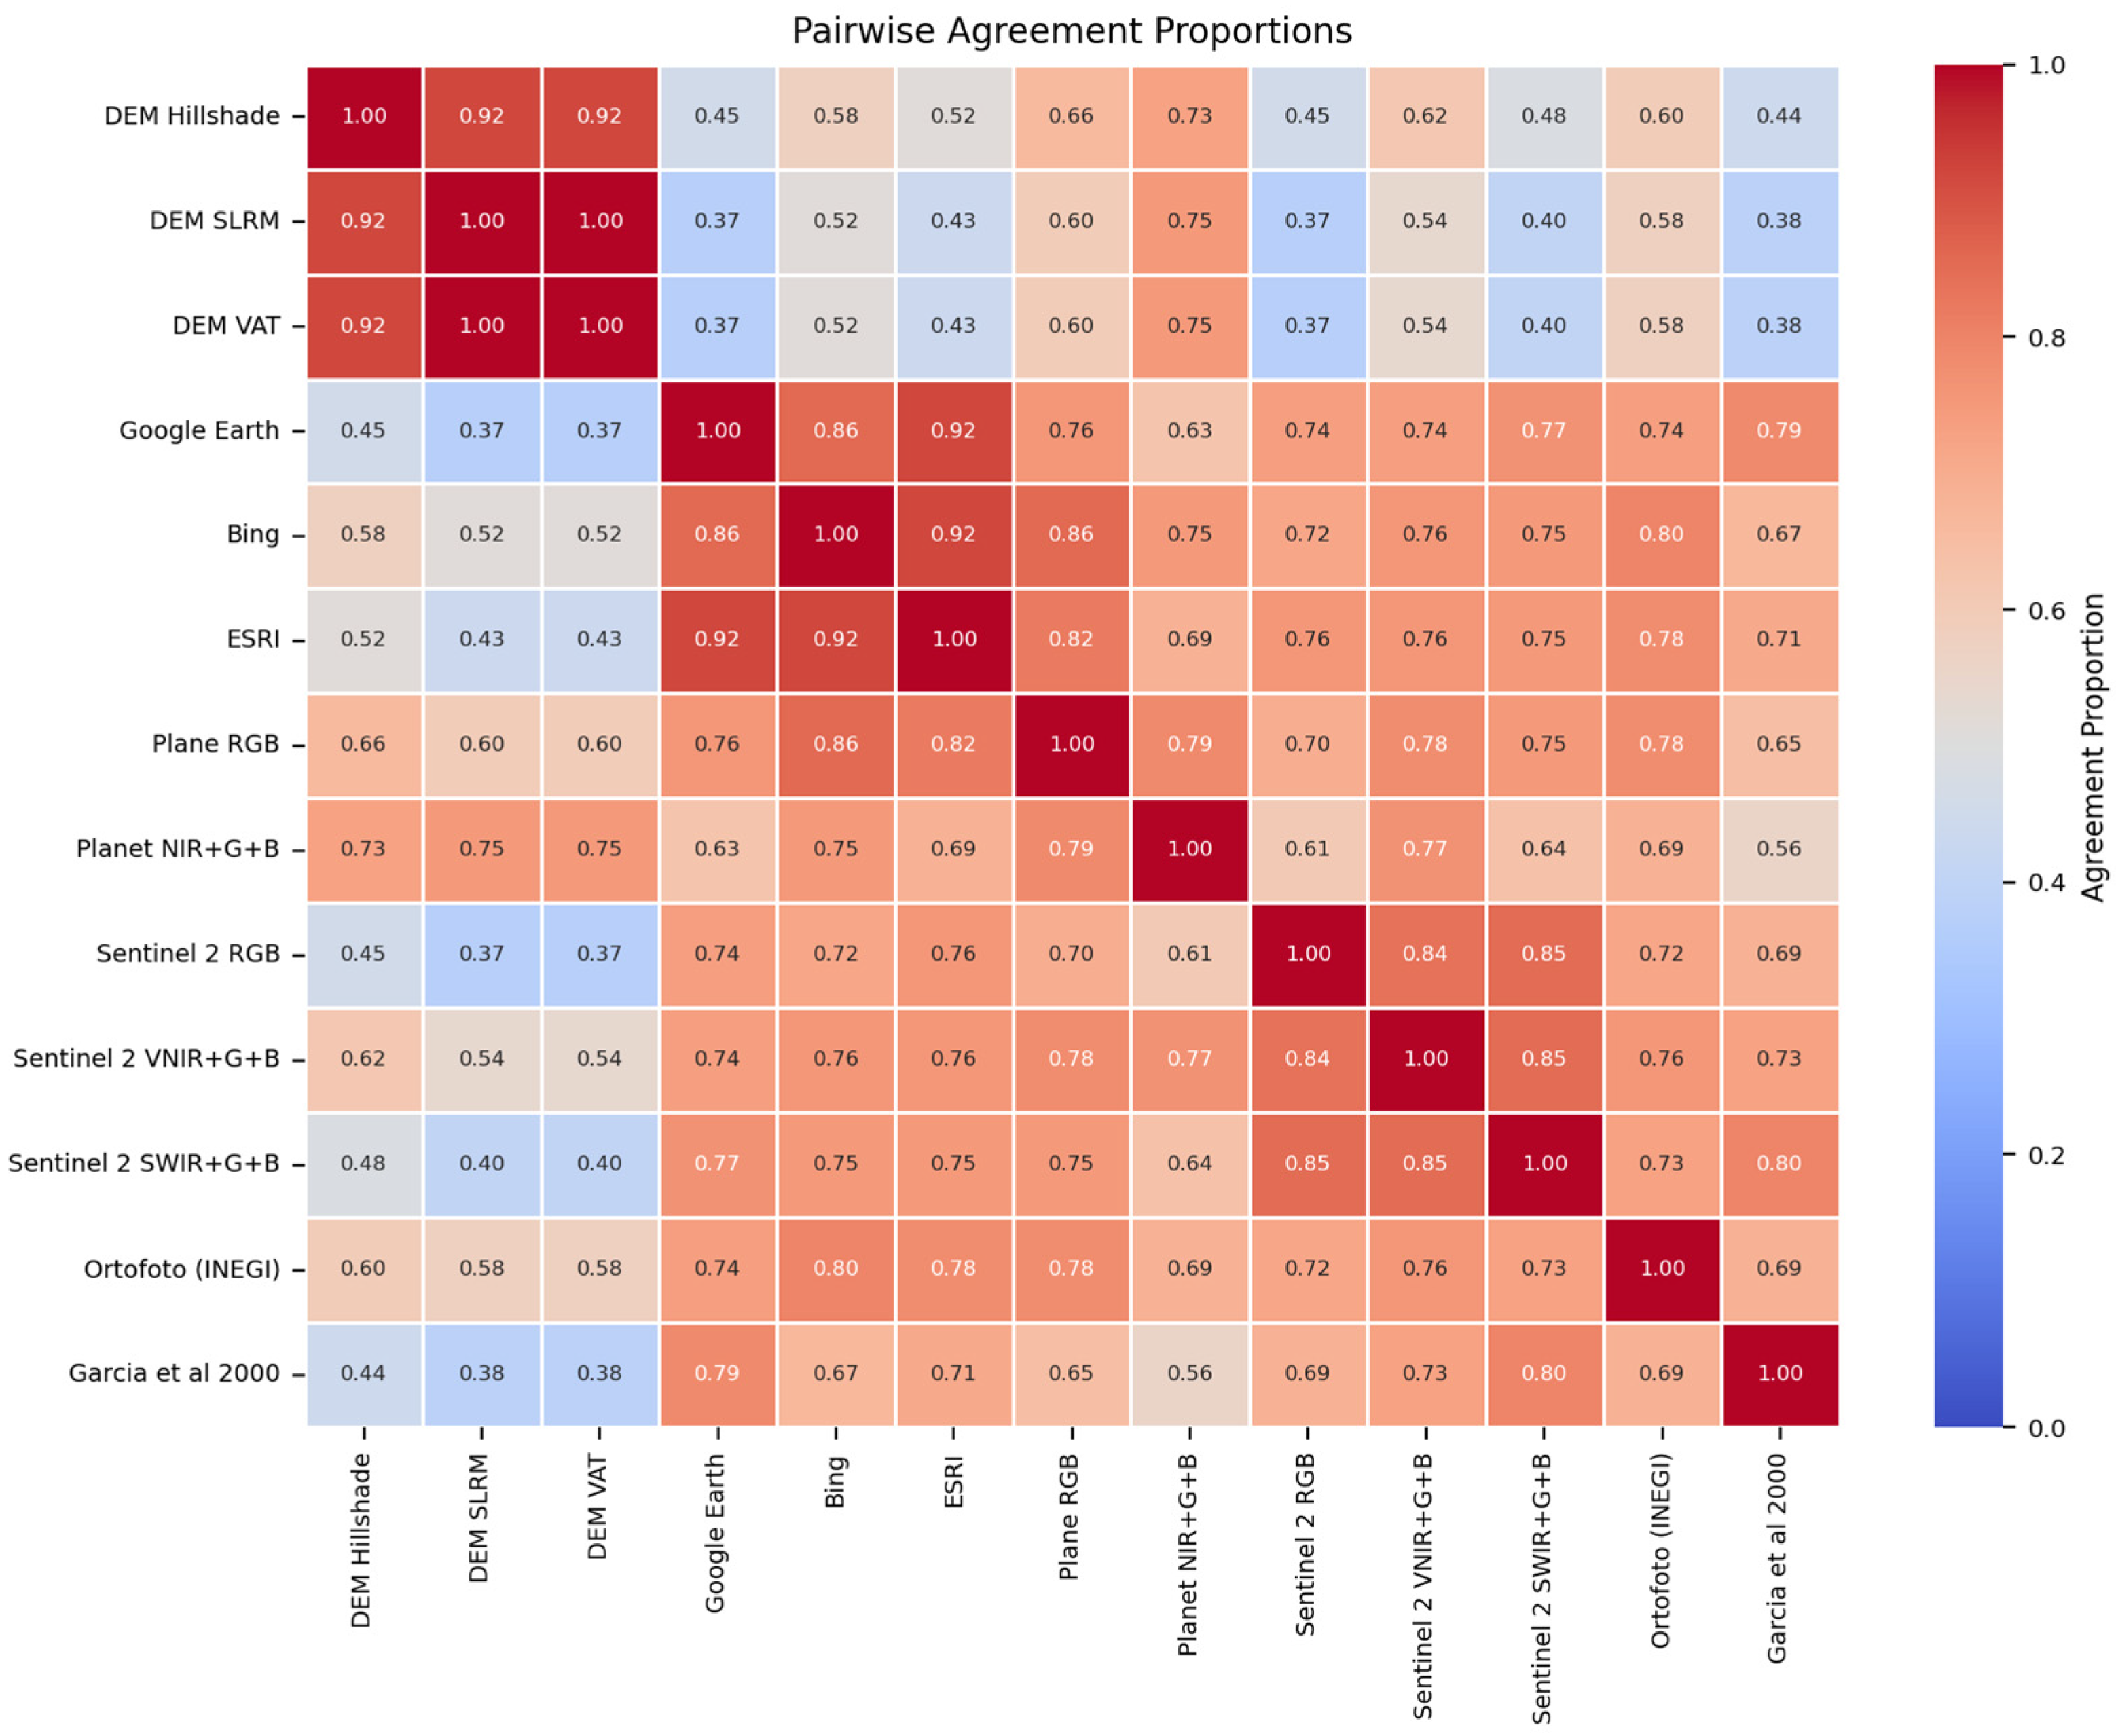
To evaluate the differences in results from various sources, McNemar’s test was employed. This test is useful for analyzing various sources as it compares paired binary outcomes (detected vs. not detected) for the same identified aguadas. This test confirmed that the results from the lidar-derived DEM visualizations were significantly more efficient compared to other sources. However, the Planet NIR+G+B view also achieved a notable level of identification and can thus be regarded as a complementary source to lidar-derived DEM visualizations.
The McNemar pair tests reveal a significant difference, with 78 cases demonstrating a p-value < 0.05 (Table S1), indicating a substantial disparity in the outcomes of the examined sources (Figure 22 and Figure 23), underscoring the importance of selecting the most appropriate sources for detection.
The effectiveness of different methods is also dependent on their intrinsic attributes. The DEM visualizations derived from lidar revealed 16 aguadas that were not detected by alternative methods, as they precisely depict the terrain’s topography, in contrast to aerial photographs (Garcia et al. 2000 [5]), orthophotos, web mosaics, and satellite images, which record surface reflectance and are compromised by vegetation cover or cloud interference that reduces their effectiveness.
Although lidar-derived DEMs are regarded as the “gold standard” due to their effectiveness, their utilization is not optimal due to high costs and restricted coverage, necessitating specialized, private, and costly flights. On the contrary, high-resolution satellite imagery constitutes the most viable sources owing to its vast coverage and relatively easy accessibility through satellite companies, although being less effective than DEMs derived from lidar.
This comparison demonstrates that, although less effective, high-resolution satellite imagery with the NIR band, when combined with various sources such as INEGI’s orthophotos and specific web mapping platforms, can serve as supplementary tools to enhance the detection of water bodies. This complementarity is crucial for minimizing the likelihood of false positives and false negatives.
While García et al.’s [5] seminal research represents the first identification of these water bodies at the CBR regional level, advancements in remote sensing technologies, including high-resolution satellite imagery and lidar-derived models, have proven to be more effective in detecting aguadas.

5. Conclusions

This study shows the usefulness of lidar DEM and satellite imagery for identifying hydrological features on a regional scale. Although laser scanners offer a significant advantage in terms of resolution and bare-ground modeling, their main limitation is their high cost and, therefore, their lack of coverage in a multitude of regions. Satellite imagery, especially in the near-infrared band, provides exceptional results for identifying aguadas. Despite the restrictions caused by the vegetation canopy, numerous sources of imagery create broader spatial and temporal coverage. This facilitates comparison between different images of a single aguada, resulting in more precise identification.
An additional benefit of satellite imagery is the ability to track aguadas over time, providing insights into how these features change over a given period. In contrast, lidar-derived models typically provide data from a single acquisition date. Therefore, in addition to identifying aguadas, satellite imagery is vital for long-term environmental monitoring and follow-up studies, for example, tracking water availability for wildlife.
In summary, lidar DEM-derived sources are the most effective at identifying aguadas due to their representation of topographic relief (lidar DEM also allows hydrological analysis such as flow modeling). However, this research indicates that satellite imagery with an NIR band and at least 3 m spatial resolution can locate up to 75% of aguadas nominally.
Therefore, we assert that diverse visual representations employed for the interpretation of geographic and hydrological aspects should be utilized in a complementary manner. By contrasting and comparing different visualizations, we may improve the quality of outcomes achieved by leveraging the distinct attributes of each visualization.
Numerous aspects of the aguadas necessitate clarification, including whether the ancient Maya constructed or modified them as part of their territorial adaptation and whether they were utilized concurrently or in disparate times. The aguadas are an essential element of the EIR landscape, significantly contributing to water availability for both the local population and wildlife during the dry season. The next step in acquiring a comprehensive understanding of the location and distribution of these items within the region is to establish a regional registry. This information can facilitate understanding of their importance in the Prehispanic period and will be beneficial in addressing current environmental challenges in the region.

Supplementary Materials

The following supporting information can be downloaded at: https://www.mdpi.com/article/10.3390/rs17193299/s1, Table S1: List of Identified Aguadas in the Region of the Bajo El Laberinto.

Author Contributions

Conceptualization, A.G.F.C.; methodology, A.G.F.C. and A.A.H.; software, A.G.F.C. and A.A.H.; validation, A.G.F.C. and A.A.H.; formal analysis, A.G.F.C.; investigation, A.G.F.C., N.P.D., A.A.H., C.C., F.K., K.R.-T. and D.H.-G.; resources, A.G.F.C., K.R.-T., N.P.D., F.K., A.A.H. and D.H.-G.; data curation, A.G.F.C.; writing—original draft preparation, A.G.F.C.; writing—review and editing, A.G.F.C., N.P.D., A.A.H., C.C., F.K., K.R.-T. and D.H.-G.; visualization, A.G.F.C.; supervision, A.A.H.; project administration, K.R.-T., F.K., A.A.H. and N.P.D.; funding acquisition, K.R.-T., F.K., A.A.H., N.P.D., D.H.-G. and A.G.F.C. All authors have read and agreed to the published version of the manuscript.

Funding

We would like to express our profound gratitude to the CONAHCYT-SECIHTI Postdoctoral Fellowship Program in Mexico, which made this research possible. The following entities provided financial support for the field seasons: the Social Sciences and Humanities Research Council of Canada, the National Science Foundation (NSF, U.S.), the Research and Technological Innovation Project Support Program (PAPIIT) of the Universidad Nacional Autónoma de Mexico (UNAM) (IA401623), the University of Calgary Research Funding Committee (URGC), Department of Anthropology and Archaeology and the Faculty of Arts of the University of Calgary, as well as the Centro de Estudios en Desarrollo Sustentable y Desarrollo de la Vida Silvestre (CEDESU) and the Facultad de Ciencias Sociales de la Universidad Autónoma de Campeche, and Department of Geography of the University of Cincinnati.

Data Availability Statement

Due to the sensitive nature of the research, as the area is a natural reserve that requires protection, the data that support this study are available from the corresponding author, AGFC, upon reasonable request. INEGI Orthophoto is available on its website [78], and CONABIO GIS data can be consulted and downloaded at its web database [63]. Planet data is courtesy of Planet.com [72], Sentinel 2 imagery is courtesy of the European Space Agency, and can be downloaded at USGS.com [89], web mapping platforms (Google, ESRI, Bing) can be accessed on their respective websites [62,63,64].

Acknowledgments

The Education and Research Program of Planet.com, which provided many of the images used in this study. The Archaeology Council of the National Institute of Anthropology and History (INAH); Adriana Velázquez Morlet, director of the INAH-Campeche Center; José Adalberto Zuñiga Morales, director of the Calakmul Biosphere Reserve; colleagues and members of the Yaxnohcah Archaeological Project and the PABEL Project; and the local workers of the communities of Conhuas, Constitución, Concepción, and Pablo García.

Conflicts of Interest

The authors declare no conflict of interest.

Abbreviations

The following abbreviations are used in this manuscript:
CBRCalakmul Biosphere Reserve
DEMDigital Elevation Model
EIRElevated Interior Region
PABELProyecto Arqueológico Bajo El Laberinto
PAYProyecto Arqueológico Yaxnohcah
GISGeographic Information System
RGBRed, Green, Blue
NIRNear Infrared
VNIRVisible Near Infrared
SWIRShort Wave Infrared
SLRMSimple Local relief Model
VATVisualization for Archaeological Topography
RVTRelief Visualization Toolbox
INEGIMexican Institute of Geography and Statistics.
CONABIONational Commission for the Knowledge and Use of Biodiversity of Mexico

References

  1. Dunning, N.P.; Beach, T.P.; Luzzadder-Beach, S. Kax and Kol: Collapse and Resilience in Lowland Maya Civilization. Proc. Natl. Acad. Sci. USA 2012, 109, 3652–3657. [Google Scholar] [CrossRef] [PubMed]
  2. Reyna-Hurtado, R.A.; Anleu, R.G.; Vetorazzi, M.G.; Pinzón, K.S.; Slater, K.; Nobrega, J.B.; Contreras, F.; Martin, G.M.S.; Panti, D.S.; Martínez, W.; et al. Aguadas de la Selva Maya: Santuarios de vida silvestre que unen esfuerzos de conservación internacional. Cienc. Nicolaita 2022, 84, 71–80. [Google Scholar] [CrossRef]
  3. Serrano-Mac-Gregor, I.; Weston-Flores, M. Las Aguadas de Calakmul y El Cambio Climático: ¿Qué Son Las Aguadas? Cienc. Y Mar 2021, XXV, 95–100. [Google Scholar]
  4. Slater, K. Calakmul Biodiversity Monitoring Report 2014–2019; Operation Wallacea: Old Bolingbroke, UK, 2021. [Google Scholar]
  5. García Gil, G.; Palacio Prieto, J.L.; Ortiz Pérez, M.A. Reconocimiento geomorfológico e hidrográfico de la Reserva de la Biosfera Calakmul, Mexico. Investig. Geográficas 2002, 48, 7–23. [Google Scholar]
  6. Dunning, N.P.; Beach, T.; Luzzadder-Beach, S. Environmental Variability among Bajos in the Southern Maya Lowlands and Its Implications for Ancient Maya Civilization and Archaeology; University of Arizona Press: Tucson, AZ, USA, 2006; pp. 81–99. [Google Scholar]
  7. Dunning, N.P.; Lentz, D.L.; Scarborough, V.L. Tikal Land, Water, and Forest: An Introduction. In Tikal: Paleoecology of an Ancient Maya City; Cambridge University Press: Cambridge, UK, 2015; pp. 1–15. [Google Scholar]
  8. Wahl, D.; Schreiner, T.; Byrne, R.; Hansen, R. A Paleoecological Record from a Late Classic Maya Reservoir in the North Petén. Lat. Am. Antiq. 2007, 18, 212–222. [Google Scholar] [CrossRef]
  9. Hubp, J.L. Elementos de Geomorfología Aplicada; Universidad Nacional Autónoma de Mexico: Mexico City, Mexico, 1988; ISBN 978-968-36-0560-3. [Google Scholar]
  10. Hubp, J.L. Diccionario Geomorfológico; Instituto de Geografía: Rio de Janeiro, Brazil, 2011; ISBN 978-607-02-2707-3. [Google Scholar]
  11. Nicod, J. A Little Contribution to the Karst Terminology: Special or Aberrant Cases of Poljes? Acta Carsologica 2003, 32, 29–39. [Google Scholar] [CrossRef]
  12. CONAGUA Regiones Hidrológicas. Available online: https://gisviewer.semarnat.gob.mx/aplicaciones/Atlas2015/agua_RH.html (accessed on 22 October 2023).
  13. Holdridge, L.R.; Grenke, W.C.; Hatheway, W.H.; Liang, T.; Tosi, J.A. Forest Environments in Tropical Life Zones: A Pilot Study; Pergamon Press: Oxford, UK, 1971. [Google Scholar]
  14. Pennington, T.D.; Sarukhán, J. Árboles Tropicales de Mexico. Manual Para Identificación de las Principales Especies; UNAM, Fondo de Cultura Económica: Mexico City, Mexico, 2005; ISBN 978-970-32-1643-7. [Google Scholar]
  15. Martínez, E.; Leal, C.G. La vegetación de Calakmul, Campeche, Mexico: Clasificación, descripción y distribución. Bol. Soc. Botánica Mexico 2002, 71, 7–32. [Google Scholar] [CrossRef]
  16. Vázquez-Alonso, M.; Lentz, D.L.; Dunning, N.P.; Carr, C.; Anaya Hernández, A.; Reese-Taylor, K. Lidar-Based Aboveground Biomass Estimations for the Maya Archaeological Site of Yaxnohcah, Campeche, Mexico. Remote Sens. 2022, 14, 3432. [Google Scholar] [CrossRef]
  17. Carrasco, V.R.; Colón, G.M. Proyecto Arqueológico Calakmul: Una revaloración de la conservación en la Arqueología. In XIX Simposio de Investigaciones Arqueológicas en Guatemala 2005 (Versión Digital); Laporte, J.P., Arroyo, B., Mejía, H., Eds.; Museo Nacional de Arqueología y Etnología: Guatemala, Guatemala, 2006; pp. 393–405. [Google Scholar]
  18. Domínguez, C.M.d.R.; Folan, W.J. Calakmul, Mexico: Aguadas, bajos, precipitación y asentamiento en el Petén Campechano. In IX Simposio de Investigaciones Arqueológicas en Guatemala, 1995; Laporte, J.P., Escobedo, H., Eds.; Museo Nacional de Arqueología y Etnología: Guatemala City, Guatemala, 1996; pp. 147–173. [Google Scholar]
  19. Fletcher, L.A.; Gann, J.A. Calakmul, Campeche: Patrón de Asentamiento y Demografía. Antropológicas 1992, 2, 20–25. [Google Scholar]
  20. Folan, W.J.; Fletcher, L.A.; May, H.J.; Florey, F.L. Las Ruinas de Calakmul, Campeche, Mexico: Un Lugar Central y Su Paisaje Cultural; Universidad Autónoma de Campeche, Centro de Investigaciones Históricas y Sociales, Secretaría de Educación Pública, FAMSI: Campeche, Mexico, 2001. [Google Scholar]
  21. Reese-Taylor, K.; Anaya, H.A. (Eds.) Proyecto Arqueológico Yaxnohcah, 2011: Informe de La Primera Temporada de Investigaciones; Reporte presentado al Consejo de Arqueología, Instituto Nacional de Antropología e Historia: Mexico City, Mexico, 2012. [Google Scholar]
  22. Flores Esquivel, A.; Sprajc, I. Reconocimiento Arqueológico En El Sur de Campeche: Nuevos Hallazgos y Contribuciones Para Una Visión Regional. Estud. Cult. Maya 2008, 32, 17–38. [Google Scholar] [CrossRef]
  23. Sprajc, I. (Ed.) Reconocimiento Arqueológico en el Sureste del Estado de Campeche, Mexico: 1996-2005: 1742; BAR: Oxford, UK, 2008; ISBN 978-1-4073-0184-6. [Google Scholar]
  24. Ruppert, K.; Denison, J.H. Archaeological Reconnaissance in Campeche, Quintana Roo, and Peten; Carnegie Institution of Washington: Washington, DC, USA, 1943. [Google Scholar]
  25. Anaya, H.A.; Gunter, S. Calakmul y El Reino de Kan Su Historia y Desarrollo a través de Las Inscripciones. In Los Investigadores de la Cultura Maya XVI; Universidad Autónoma de Campeche: Campeche, Mexico, 2008; pp. 217–231. [Google Scholar]
  26. Helmke, C.; Awe, J. Organización Territorial de Los Antiguos Mayas de Belice Central: Confluencia de Datos Arqueológicos y Epigráficos. Mayab 2008, 20, 65–91. [Google Scholar]
  27. Martin, S.; Grube, N. Chronicle of the Maya Kings and Queens: Deciphering the Dynasties of the Ancient Maya; Thames & Hudson: London, UK, 2008; ISBN 978-0-500-28726-2. [Google Scholar]
  28. Vázquez, L.V.A.; Kupprat, F.; Morales, A.C.; García, C.H.; Valencia, R.R. Los Cambios de Poder En El Juego Interdinástico: Los Gobernantes de Calakmul Del Siglo V al VIII d.C. In XXIX Simposio de Investigaciones Arqueológicas en Guatemala, 2015; Arroyo, B., Méndez, S.L., Ajú, Á.G., Eds.; Museo Nacional de Arqueología y Etnología: Guatemala City, Guatemala, 2016; pp. 101–111. [Google Scholar]
  29. Reese-Taylor, K.; Hernández, A.; Esquivel, A.; Monteleone, K.; Uriarte, A.; Carr, C.; Acuña, H.; Fernandez-Diaz, J.; Peuramaki-Brown, M.; Dunning, N. Boots on the Ground at Yaxnohcah Ground-Truthing Lidar in a Complex Tropical Landscape. Adv. Archaeol. Pract. 2016, 4, 314–338. [Google Scholar] [CrossRef]
  30. Reese-Taylor, K.; Anaya, H.A. (Eds.) Proyecto Arqueológico Yaxnohcah, 2013 Informe de La Segunda Temporada de Investigaciones; Reporte presentado al Consejo de Arqueología, Instituto Nacional de Antropología e Historia: Mexico City, Mexico, 2014. [Google Scholar]
  31. Reese-Taylor, K.; Anaya, H.A. (Eds.) Proyecto Arqueológico Yaxnohcah, Informe de Las 2014 y 2015 Temporadas de Investigaciones; Reporte presentado al Consejo de Arqueología, Instituto Nacional de Antropología e Historia: Mexico City, Mexico, 2016. [Google Scholar]
  32. Reese-Taylor, K.; Anaya, H.A. (Eds.) Proyecto Arqueológico Yaxnohcah, Informe de La 2016 Temporada de Investigaciones; Reporte presentado al Consejo de Arqueología, Instituto Nacional de Antropología e Historia: Mexico City, Mexico, 2017. [Google Scholar]
  33. Vázquez, L.V.A.; Reese-Taylor, K.; Anaya, H.A. (Eds.) Proyecto Arqueológico Yaxnohcah, Informe de Las Temporadas de Investigación 2017–18; Reporte presentado al Consejo de Arqueología, Instituto Nacional de Antropología e Historia: Mexico City, Mexico, 2019. [Google Scholar]
  34. Reese-Taylor, K.; Anaya, H.A.; Kupprat, F. (Eds.) Proyecto Arqueológico Yaxnohcah, Informe de La Temporada 2019; Reporte presentado al Consejo de Arqueología, Instituto Nacional de Antropología e Historia: Mexico City, Mexico, 2020. [Google Scholar]
  35. Kupprat, F.; Anaya, H.A.; Reese-Taylor, K. (Eds.) Proyecto Arqueológico Yaxnohcah-Bajo Laberinto, Informe de La Temporada 2022; Reporte presentado al Consejo de Arqueología, Instituto Nacional de Antropología e Historia: Mexico City, Mexico, 2022. [Google Scholar]
  36. Dunning, N.P.; Carr, C.; Kupprat, F.; Vázquez, M.; Clements, H. Investigación de Los Rasgos Hidráulicos En El Área de Pared de Los Reyes Durante El 2019. In Proyecto Arqueológico Yaxnohcah, Informe de la temporada 2019; Reese-Taylor, K., Anaya, H.A., Kupprat, F., Eds.; Instituto Nacional de Antropología e Historia: Mexico City, Mexico, 2020. [Google Scholar]
  37. Flores, C.A.G. Reconocimiento y Verificación de Aguadas En El Área de Yaxnohcah. In Proyecto Arqueológico Yaxnohcah-Bajo Laberinto, Informe de la temporada 2022; Kupprat, F., Anaya, H.A., Reese-Taylor, K., Eds.; Instituto Nacional de Antropología e Historia: Mexico City, Mexico, 2022; pp. 191–206. [Google Scholar]
  38. Brewer, J. A Landscape Archaeology Approach to Understanding Household Water Management Practices of the Ancient Lowland Maya. Ph.D. Dissertation, University of Cincinnati, Cincinnati, OH, USA, 2017. [Google Scholar]
  39. Brewer, J.L.; Carr, C.; Dunning, N.P.; Walker, D.S.; Anaya Hernández, A.; Peuramaki-Brown, M.; Reese-Taylor, K. Employing Airborne Lidar and Archaeological Testing to Determine the Role of Small Depressions in Water Management at the Ancient Maya Site of Yaxnohcah, Campeche, Mexico. J. Archaeol. Sci. Rep. 2017, 13, 291–302. [Google Scholar] [CrossRef]
  40. Dunning, N.P.; Brewer, J.; Carr, C.; Anaya Hernández, A.; Beach, T.; Chmilar, J.; Grazioso Sierra, L.; Griffin, R.; Lentz, D. Harvesting Ha: Ancient Water Collection and Storage in the Elevated Interior Region of the Maya Lowlands. In Sustainability and Water Management in the Maya World and Beyond; Valdez, F., Jr., Lucero, L.J., Larmon, J.T., Eds.; University Press of Colorado: Denver, CO, USA, 2022; pp. 13–52. [Google Scholar]
  41. Chmilar, J.A.; Dunning, N.P. Excavaciones En La Aguada Mucal: Operación 25. In Proyecto Arqueológico Yaxnohcah, Informe de las Temporadas de Investigación 2017–18; Vázquez, L.V.A., Reese-Taylor, K., Anaya, H.A., Eds.; Instituto Nacional de Antropología e Historia: Mexico City, Mexico, 2019. [Google Scholar]
  42. Folan, W.J.; Marcus, J.; Pincemin, S.; Carrasco, M.d.R.D.; Fletcher, L.; Lopez, A.M. Calakmul: New Data from an Ancient Maya Capital in Campeche, Mexico. Lat. Am. Antiq. 1995, 6, 310–334. [Google Scholar] [CrossRef]
  43. Folan, W.J.; Domínguez, C.M.d.R.; May, H.J. Aguadas. In Las ruinas de Calakmul, Campeche, Mexico: Un Lugar Central y su Paisaje Cultural; Folan, W.J., Fletcher, L.A., May, H.J., Florey, F.L., Eds.; Universidad Autónoma de Campeche, Centro de Investigaciones Históricas y Sociales: Campeche, Mexico, 2001; pp. 63–64. ISBN 978-968-6585-81-0. [Google Scholar]
  44. Stephens, J.L. En Busca de los Mayas. Viajes a Yucatán; Producción Editorial Dante: Mérida, Mexico, 1984; ISBN 978-968-7232-01-0. [Google Scholar]
  45. Akpinar-Ferrand, E. Aguadas: A Significant Aspect of the Southern Maya Lowlands. Ph.D. Dissertation, University of Cincinnati: Cincinnati, OH, USA, 2011. [Google Scholar]
  46. Akpinar Ferrand, E.; Dunning, N.; Lentz, D.; Jones, J.G. Use of Aguadas as Water Management Sources in Two Southern Maya Lowland Sites. Anc. Mesoam. 2012, 23, 85–101. [Google Scholar] [CrossRef]
  47. Beach, T.; Luzzadder-Beach, S.; Cook, D.; Dunning, N.; Kennett, D.J.; Krause, S.; Terry, R.; Trein, D.; Valdez, F. Ancient Maya Impacts on the Earth’s Surface: An Early Anthropocene Analog? Quat. Sci. Rev. 2015, 124, 1–30. [Google Scholar] [CrossRef]
  48. Dunning, N.P.; Anaya Hernández, A.; Beach, T.; Carr, C.; Griffin, R.; Jones, J.G.; Lentz, D.L.; Luzzadder-Beach, S.; Reese-Taylor, K.; Šprajc, I. Margin for Error: Anthropogenic Geomorphology of Bajo Edges in the Maya Lowlands. Geomorphology 2019, 331, 127–145. [Google Scholar] [CrossRef]
  49. Lucero, L.J.; Fedick, S.L.; Dunning, N.P.; Lentz, D.L.; Scarborough, V.L. Water and Landscape: Ancient Maya Settlement Decisions. Archaeol. Pap. Am. Anthropol. Assoc. 2014, 24, 30–42. [Google Scholar] [CrossRef]
  50. Seefeld, N. The Hydraulic System of Uxul—Origins, Functions, and Social Setting; Rheinische Friedrich-Wilhelms-Universität: Bonn, Germany, 2017. [Google Scholar]
  51. Scarborough, V.L.; Dunning, N.P.; Tankersley, K.B.; Carr, C.; Weaver, E.; Grazioso, L.; Lane, B.; Jones, J.G.; Buttles, P.; Valdez, F.; et al. Water and Sustainable Land Use at the Ancient Tropical City of Tikal, Guatemala. Proc. Natl. Acad. Sci. USA 2012, 109, 12408–12413. [Google Scholar] [CrossRef]
  52. Beach, T.; Luzzadder-Beach, S.; Flood, J.; Houston, S.; Garrison, T.G.; Román, E.; Bozarth, S.; Doyle, J. A Neighborly View: Water and Environmental History of the El Zotz Region. In Tikal: Paleoecology of an Ancient Maya City; Lentz, D.L., Dunning, N.P., Scarborough, V.L., Eds.; Cambridge University Press: Cambridge, UK, 2015; pp. 258–279. ISBN 978-1-107-02793-0. [Google Scholar]
  53. Herrera, J.H.; Toscano, H.L.T. Los Reservorios de Uxmal, Yucatán, Mexico. In Proceedings of the Actas del Décimo Congreso Nacional y Segundo Congreso Internacional Hispanoamericano de Historia de la Construcción, Donostia-San Sebastián, Spain, 3–7 October 2017; Instituto Juan de Herrera: San Lorenzo de El Escorial, Spain, 2017; pp. 751–758. [Google Scholar]
  54. Isendahl, C. The Weight of Water: A New Look at Pre-Hispanic Puuc Maya Water Reservoirs. Anc. Mesoam. 2011, 22, 185–197. [Google Scholar] [CrossRef]
  55. Dunning, N.; Weaver, E.; Smyth, M.; Ortegon, D. Xcoch: Home of Ancient Maya Rain Gods and Water Managers. In The Archaeology of Yucatan; Stanton, T., Ed.; Archaeopress: Oxford, UK, 2014; pp. 65–80. [Google Scholar]
  56. Smyth, M.P.; Dunning, N.P.; Weaver, E.M.; van Beynen, P.; Zapata, D.O. The Perfect Storm: Climate Change and Ancient Maya Response in the Puuc Hills Region of Yucatán. Antiquity 2017, 91, 490–509. [Google Scholar] [CrossRef]
  57. RAE Real Academia Española. Available online: https://www.rae.es/inicio (accessed on 11 April 2023).
  58. Dunning, N.P.; Griffin, R.E.; Jones, J.G.; Terry, R.E.; Larsen, Z.; Carr, C. Life on the Edge: Tikal in a Bajo Landscape. In Tikal: Paleoecology of an Ancient Maya City; Cambridge University Press: Cambridge, UK, 2015; pp. 95–123. [Google Scholar]
  59. Arredondo-Figueroa, J.L.; Flores-Nava, A. Características limnológicas de pequeños embalses epicontinentales, su uso y manejo en la acuicultura. HIDROBIOLÓGICA 1993, 2, 1–10. [Google Scholar]
  60. Cervantes, A.; Elias-Gutierrez, M.; Suárez-Morales, E. Limnological and Morphometrical Data of Eight Karstic Systems `cenotes’ of the Yucatan Peninsula, Mexico, during the Dry Season (February–May, 2001). Hydrobiologia 2002, 482, 167–177. [Google Scholar] [CrossRef]
  61. Beach, T.; Luzzadder-Beach, S.; Dunning, N.; Cook, D. Human and Natural Impacts on Fluvial and Karst Depressions of the Maya Lowlands. Geomorphology 2008, 101, 308–331. [Google Scholar] [CrossRef]
  62. Lohse, J.C. Intra-Site Settlement Signatures and Implications for Late Classic Maya Commoner Organization at Dos Hombres, Belize. In Ancient Maya Commoners; Lohse, J.C., Valdez, F., Eds.; University of Texas Press: New York, NY, USA, 2004; pp. 117–146. ISBN 978-0-292-79723-9. [Google Scholar]
  63. Comisión Nacional Para El Conocimiento y Uso de La Biodiversidad|Gobierno|Gob.Mx. Available online: https://www.gob.mx/conabio (accessed on 10 April 2024).
  64. Canuto, M.; Estrada-Belli, F.; Garrison, T.; Houston, S.; Acuña, M.; Kovac, M.; Marken, D.; Nondedeo, P.; Auld-Thomas, L.; Cyril, C.; et al. Ancient Lowland Maya Complexity as Revealed by Airborne Laser Scanning of Northern Guatemala. Science 2018, 361, eaau0137. [Google Scholar] [CrossRef]
  65. Chase, A.F.; Chase, D.Z.; Fisher, C.T.; Leisz, S.J.; Weishampel, J.F. Geospatial Revolution and Remote Sensing LiDAR in Mesoamerican Archaeology. Proc. Natl. Acad. Sci. USA 2012, 109, 12916–12921. [Google Scholar] [CrossRef]
  66. Šprajc, I.; Dunning, N.P.; Štajdohar, J.; Hernández Gómez, Q.; López, I.C.; Marsetič, A.; Ball, J.W.; Dzul Góngora, S.; Esparza Olguín, O.Q.; Flores Esquivel, A.; et al. Ancient Maya Water Management, Agriculture, and Society in the Area of Chactún, Campeche, Mexico. J. Anthropol. Archaeol. 2021, 61, 101261. [Google Scholar] [CrossRef]
  67. Thomas, B. Locating Aguadas in Northern Guatemala Using Remote Sensing; University of Cincinnati: Cincinnati, OH, USA, 2010. [Google Scholar]
  68. Instituto Nacional de Estadística y Geografía (INEGI). Available online: https://www.inegi.org.mx/ (accessed on 22 May 2024).
  69. Mapas de Bing. Available online: https://www.bing.com/maps (accessed on 21 April 2024).
  70. World, A.L.A. World Imagery Wayback. Available online: https://livingatlas.arcgis.com/wayback/ (accessed on 8 July 2024).
  71. Google Earth. Available online: https://earth.google.com/web/@20.16539502,-90.02215075,70.09011754a,15635.1056669d,35y,0h,0t,0r/data=CgRCAggBOgMKATBCAggBSg0I____________ARAA (accessed on 21 April 2024).
  72. Planet Education and Research Program|Planet|Planet. Available online: https://www.planet.com/industries/education-and-research/ (accessed on 3 March 2024).
  73. European Space Agency Las Misiones Sentinel. Available online: https://www.esa.int/Space_in_Member_States/Spain/Las_misiones_Sentinel (accessed on 2 March 2024).
  74. Kokalj, Ž.; Hesse, R. Airborne Laser Scanning Raster Data Visualization: A Guide to Good Practice; Založba ZRC: Brussels, Belgium, 2017; ISBN 978-961-254-984-8. [Google Scholar]
  75. Kokalj, Ž.; Somrak, M. Why Not a Single Image? Combining Visualizations to Facilitate Fieldwork and On-Screen Mapping. Remote Sens. 2019, 11, 747. [Google Scholar] [CrossRef]
  76. Zakšek, K.; Oštir, K.; Kokalj, Ž. Sky-View Factor as a Relief Visualization Technique. Remote Sens. 2011, 3, 398–415. [Google Scholar] [CrossRef]
  77. Hesse, R. LiDAR-Derived Local Relief Models—A New Tool for Archaeological Prospection. Archaeol. Prospect. 2010, 17, 67–72. [Google Scholar] [CrossRef]
  78. Ortoimágenes. Available online: https://www.inegi.org.mx/temas/imagenes/ortoimagenes/ (accessed on 8 July 2024).
  79. García Nieto, H.; Martínez León, G. Uso de ortofotos para actualizar el mapa de uso del suelo en Guanajuato, Mexico. Agric. Téc. En Mexico 2007, 33, 271–280. [Google Scholar]
  80. González-Iturbe, J.A.; Dzul, F.T.; Manrique, C.E. Diagnóstico Del Cambio y Recuperación de La Vegetación En Dos Zonas Críticas de La Eco-Región Los Petenes-Celestún-El Palmar. In Plan de Conservación de la Eco-Región Petenes-Calestún-Palmar; Acosta Lugo, E.D., Alonzo Parra, M., Andrade-Hernández, D., Castillo, J., Eds.; Universidad Autónoma de Campeche, Pronatura Península de Yucatán. A.C., San Francisco de Campeche: Campeche, Mexico, 2010; pp. 79–95. [Google Scholar]
  81. Díaz, J.J.D. El Uso de Modelos Digitales de Elevación y Ortoimágenes Para La Determinación de Los Cauces de Cuencas Hidrológicas de La Zona de Tixtla, Guerrero. Rev. Geográfica 2014, 155, 93–109. [Google Scholar]
  82. Navalgund, R.R.; Jayaraman, V.; Roy, P.S. Remote Sensing Applications: An Overview. Curr. Sci. 2007, 93, 1747–1766. [Google Scholar]
  83. Roy, P.S.; Behera, M.D.; Srivastav, S.K. Satellite Remote Sensing: Sensors, Applications and Techniques. Proc. Natl. Acad. Sci. India Sect. Phys. Sci. 2017, 87, 465–472. [Google Scholar] [CrossRef]
  84. Butcher, G. Tour of the Electromagnetic Spectrum; Government Printing Office: Washington, DC, USA, 2016; ISBN 978-0-9967780-2-2. [Google Scholar]
  85. Jensen, J.R. Remote Sensing of the Environment: An Earth Resource Perspective; Pearson Prentice Hall: Hoboken, NJ, USA, 2007; ISBN 978-0-13-188950-7. [Google Scholar]
  86. Lillesand, T. Remote Sensing and Image Interpretation, 7th ed.; Wiley: Hoboken, NJ, USA, 2015; ISBN 978-1-118-34328-9. [Google Scholar]
  87. Huang, C.; Chen, Y.; Zhang, S.; Wu, J. Detecting, Extracting, and Monitoring Surface Water from Space Using Optical Sensors: A Review. Rev. Geophys. 2018, 56, 333–360. [Google Scholar] [CrossRef]
  88. QuickMapServices—QGIS Python Plugins Repository. Available online: https://plugins.qgis.org/plugins/quick_map_services/ (accessed on 22 April 2024).
  89. USGS.Gov. Science for a Changing World. Available online: https://www.usgs.gov/ (accessed on 21 April 2024).
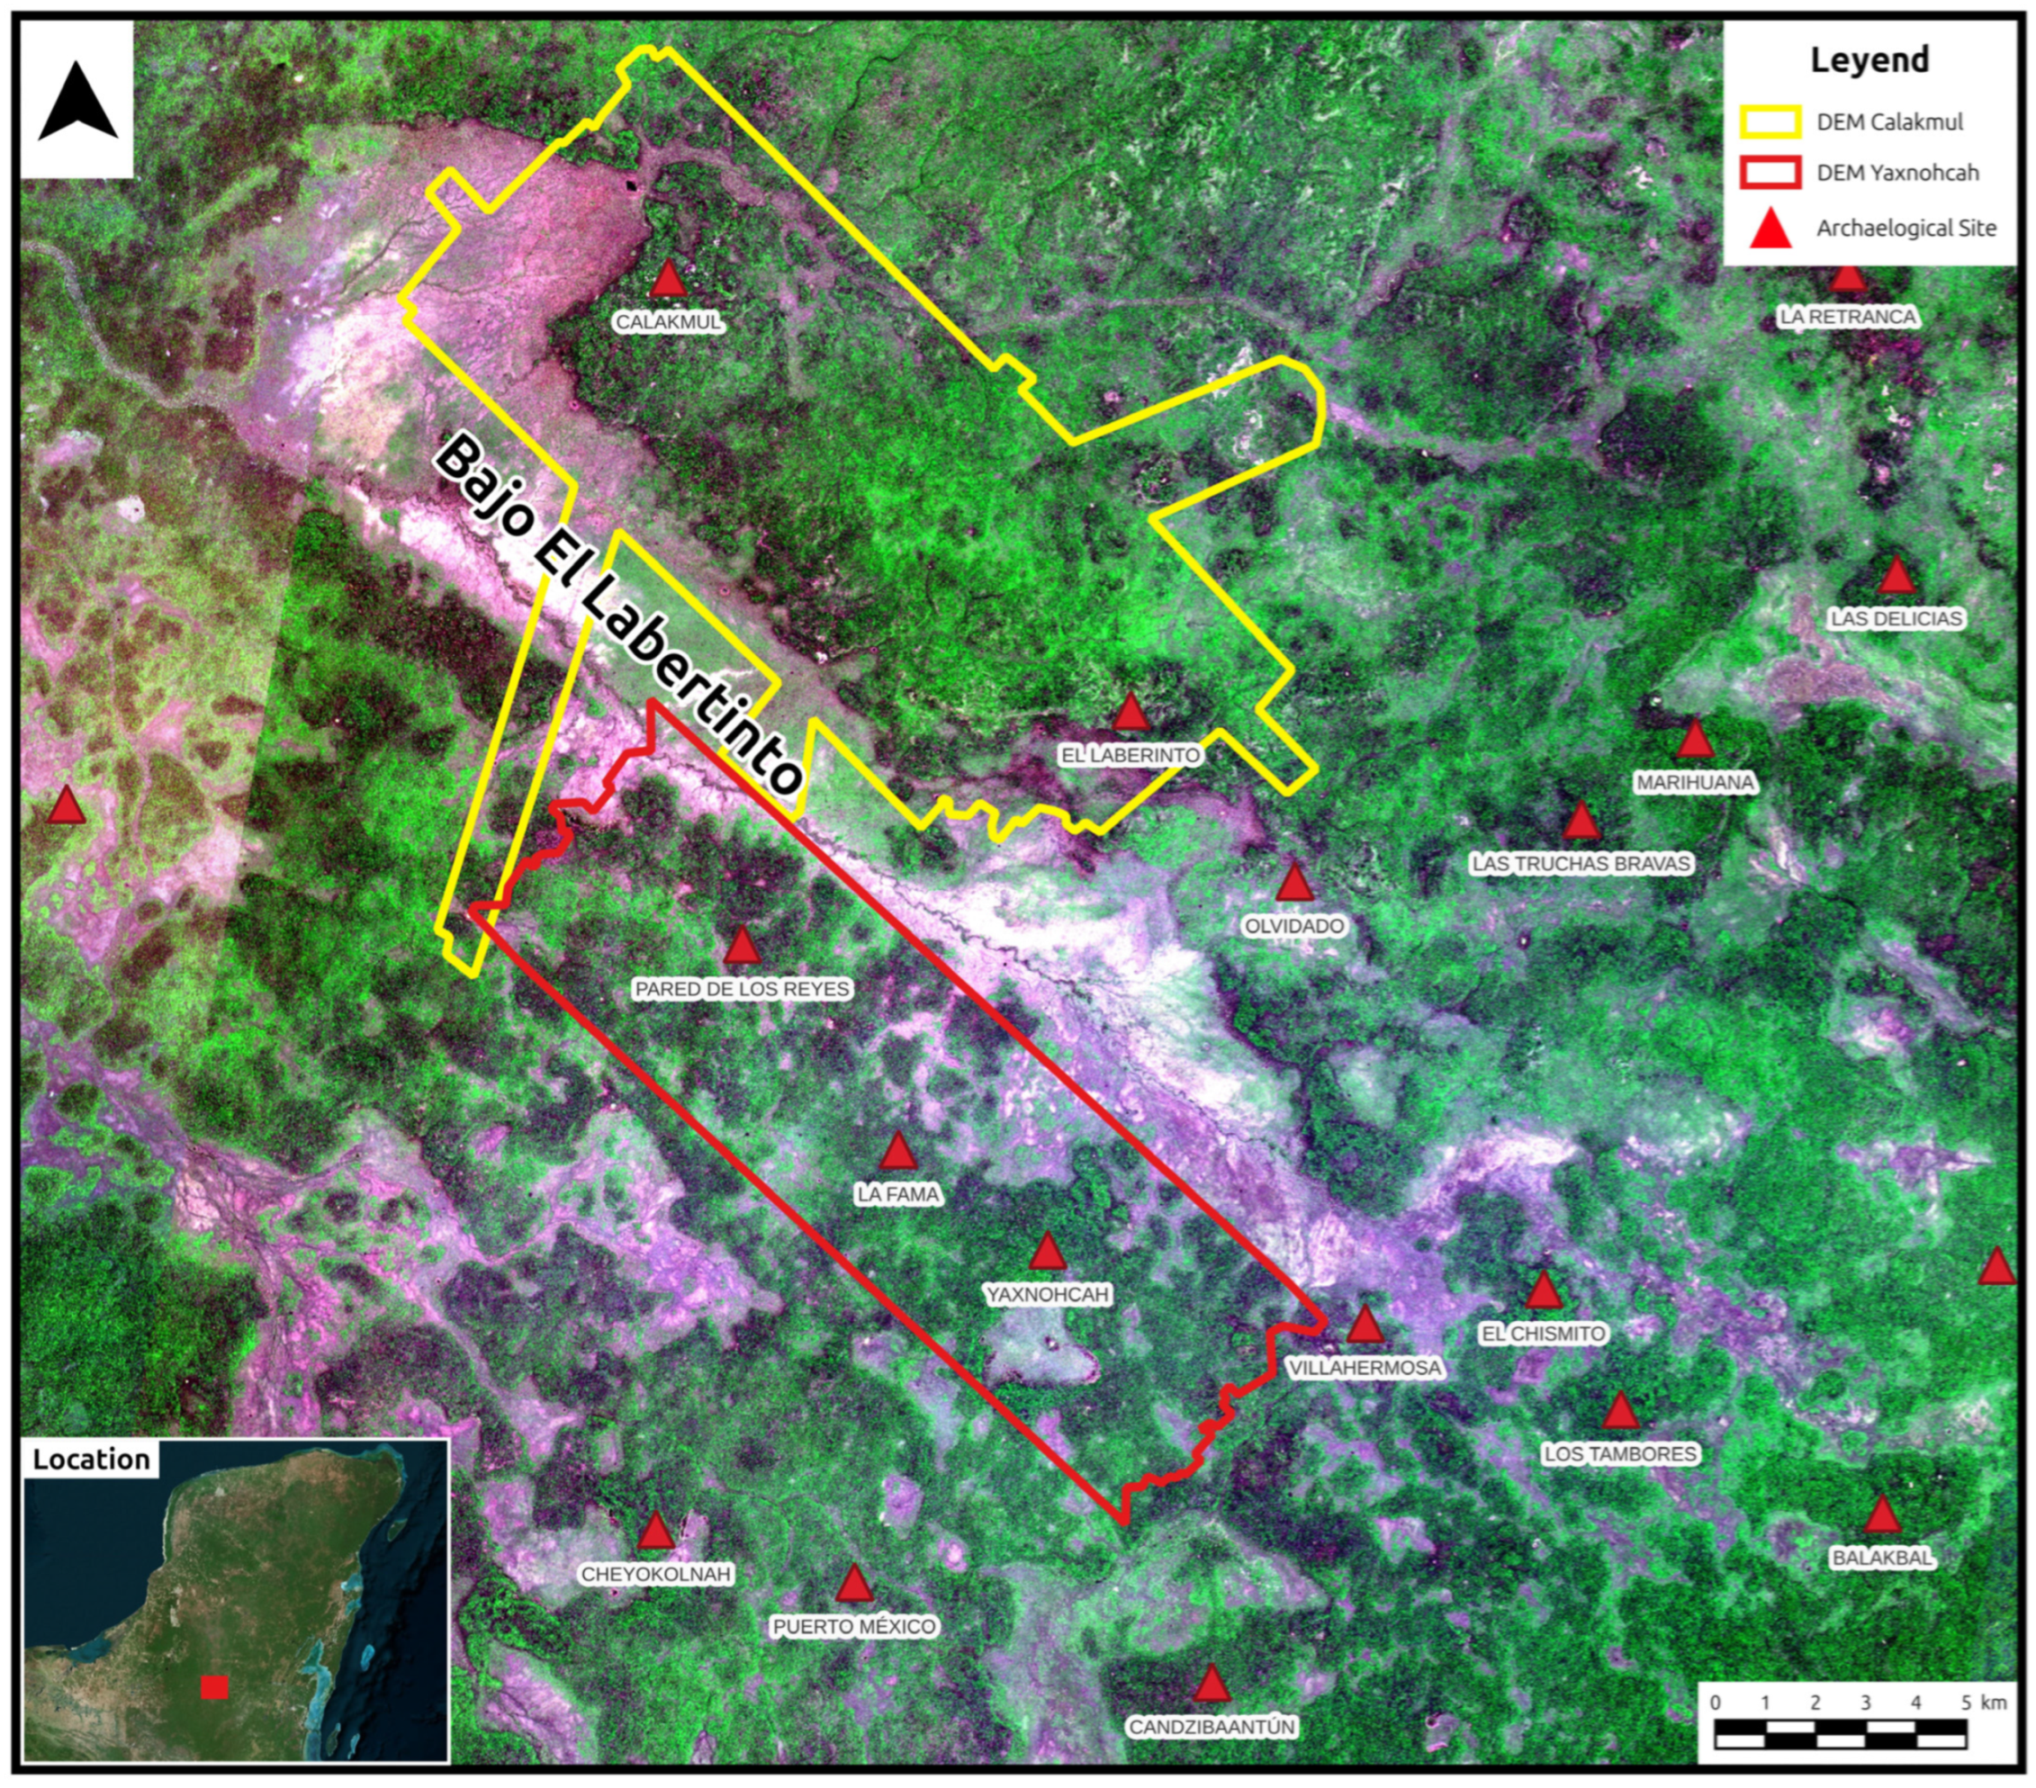
Figure 1. Bajo El Laberinto and study area of the Bajo El Laberinto Archaeological Project. The Calakmul and Yaxnohcah lidar survey areas outlined. Base map Planet Labs, RGB, 12 April 2021.
Remotesensing 17 03299 g001
Figure 2. (A) Aguada Mukal DEM view with photo showing an ancient Maya bukte’ (filtration well) revealed by excavation; (B) Aguada ChanGuis DEM view with photo showing laid stone floor buried under sediment as revealed by excavation. Base map lidar-derived DEM model, Visualization for Archaeological Topography. Photographs by Nicholas Dunning.
Remotesensing 17 03299 g002
Figure 3. Different views of aguadas. (A) Drone view of Aguada 5 of Calakmul, (B) ground view of Aguada Villahermosa, (C) drone view of Aguada Villahermosa. Photographs by Alberto Flores.
Remotesensing 17 03299 g003
Figure 4. Location of the five aguadas compared in this study. Base map Planet Labs, RGB composition, Date 12 April 2021.
Remotesensing 17 03299 g004
Figure 5. Three visualizations of Aguada 259 in the lidar-derived DEM of Yaxnohcah-Pared de los Reyes area. (A) Simple unidirectional hillshade, (B) Simple Local Relief Model (SLRM) and (C) Visualization for Archaeological Topography (VAT).
Remotesensing 17 03299 g005
Figure 6. Orthophoto visualization of Aguada 259, provided by INEGI.
Remotesensing 17 03299 g006
Figure 7. Three visualizations of Aguada 259, web platform visualizations. (A) Bing Maps, (B) ESRI and (C) Google Earth.
Remotesensing 17 03299 g007
Figure 8. Multispectral visualizations for Aguada 259: (A) Planet RGB combination, (B) Planet NIR+G+B combination, (C) Sentinel 2 RGB combination, (D) Sentinel 2 NIR+G+B combination, (E) Sentinel 2 SWIR+G+B combination (spatial resolution: Sentinel 2 15 m, Planet 3 m).
Remotesensing 17 03299 g008
Figure 9. Sources used and process of identifying aguadas in the lidar-derived DEM area of Calakmul and Yaxnohcah-Pared de los Reyes.
Remotesensing 17 03299 g009
Figure 10. Twelve visualizations of Aguada Big Tom. (A) Simple unidirectional hillshade, (B) Simple Local Relief Model (SLRM), (C) Visualization for Archaeological Topography (VAT), (D) Orthophoto (INEGI), (E) Planet RGB combination, (F) Planet NIR+G+B combination, (G) Bing maps, (H) ESRI, (I) Google Earth, (J) Sentinel 2 RGB combination, (K) Sentinel 2 VNIR+G+B combination, and (L) Sentinel 2 SWIR+G+B combination.
Remotesensing 17 03299 g010
Figure 11. Twelve visualizations of Aguada Fidelia. (A) Simple unidirectional hillshade, (B) Simple Local Relief Model (SLRM), (C) Visualization for Archaeological Topography (VAT), (D) Orthophoto (INEGI), (E) Planet RGB combination, (F) Planet NIR+G+B combination, (G) Bing maps, (H) ESRI, (I) Google Earth, (J) Sentinel 2 RGB combination, (K) Sentinel 2 VNIR+G+B combination, and (L) Sentinel 2 SWIR+G+B combination.
Remotesensing 17 03299 g011
Figure 12. Twelve visualizations of Aguada Bobal. (A) Simple unidirectional hillshade, (B) Simple Local Relief Model (SLRM), (C) Visualization for Archaeological Topography (VAT), (D) Orthophoto (INEGI), (E) Planet RGB combination, (F) Planet NIR+G+B combination, (G) Bing maps, (H) ESRI, (I) Google Earth, (J) Sentinel 2 RGB combination, (K) Sentinel 2 VNIR+G+B combination, and (L) Sentinel 2 SWIR+G+B combination.
Remotesensing 17 03299 g012
Figure 13. Twelve visualizations of Aguada 250. (A) Simple unidirectional hill-shade, (B) Simple Local Relief Model (SLRM), (C) Visualization for Archaeological Topography (VAT), (D) Orthophoto (INEGI), (E) Planet RGB combination, (F) Planet NIR+G+B combination, (G) Bing maps, (H) ESRI, (I) Google Earth, (J) Sentinel 2 RGB combination, (K) Sentinel 2 VNIR+G+B combination, and (L) Sentinel 2 SWIR+G+B combination.
Remotesensing 17 03299 g013
Figure 14. Total number of identified aguadas per source utilized in this study (dark blue). Previous study (Garcia et al. 2000) [5] in light blue.
Remotesensing 17 03299 g014
Figure 15. Aguadas identified by shape.
Remotesensing 17 03299 g015
Figure 16. Aguadas by topographic position.
Remotesensing 17 03299 g016
Figure 17. Aguadas by canopy cover.
Remotesensing 17 03299 g017
Figure 18. Aguadas by possible origin.
Remotesensing 17 03299 g018
Figure 19. Location of the 43 aguadas verified in the field in the Bajo el Laberinto region. Base map Planet Labs, NIR+G+B composition, date 12 April 2021.
Remotesensing 17 03299 g019
Figure 20. (A) e16a81e2_5 “Aguada 1 de Calakmul”, (B) e16a81F4_4, (C) e16a81f3_15, (D) e16c11c4_10 “Villahermosa”, (E) e16c11c3_2 “La Fama”, (F) e16c11c3_11 “Little Tom” (G) e16c11c1_10 “Mukal”, (H) e16c11c4_3, (I) e16c11c1_11, (J) e16a81b4_1 “Aguada 12 de Calakmul” (K) e16c11c4_6, (L) e16a81f3_11. Drone Photographs by Alberto G. Flores Colin, not on the same scale.
Remotesensing 17 03299 g020
Figure 21. The 350 aguadas identified in the Bajo el Laberinto region (base map Planet NIR-G-B), using a combination of lidar-derived DEM (SLRM and VAT), Planet NIR+G+B, Planet RGB and INEGI’s orthophotos. Base map Planet Labs, NIR+G+B composition, Date 12 April 2021.
Remotesensing 17 03299 g021
Figure 22. Results of McNemar test, p-values heatmap with significant differences (p < 0.05) [5].
Remotesensing 17 03299 g022
Figure 23. Results of McNemar test; pairwise agreement proportions [5].
Remotesensing 17 03299 g023
Table 1. Definitions of aguada.
Author (s)Concept
Dunning et al. [58]Ponds
Arredondo-Figueroa and Flores-Nava [59]Shallow ground depressions
Cervantes et al. [60]Sinkholes and shallow water reservoirs
Wahl et al. [8]Small ponds associated with topographic depressions
Akpinar [45]; Beach [61]Small dissolution sinkholes
Lohse [62]Depressions currently holding water
Seefeld [50]Ponds that retain water
Serrano and Weston [3]Temporary and/or permanent body of water of natural or Prehispanic cultural origin, which is formed from rainwater, with biophysical characteristics that allow impermeability of the karstic soils of the Selva Maya.
Table 2. Sources of remote sensing information used in the study.
SourceType of ImagerySensor TypeSpatial ResolutionBandsAccess
lidar (PABEL)Lidar-derived DEMActive50 cmPoint cloudCost (private)
INEGIOrthophotoPassive1.5 m-Free
Bing MapsRGB MosaicPassive4.5 m-Free
ESRIRGB MosaicPassive60 cm–15 m-Free
Google EarthRGB MosaicPassive60 cm–30 m-Free
Sentinel-2MultispectralPassive15 m13Free
PlanetMultispectralPassive3 m4Cost (courtesy)
Table 3. Base data for the five example aguadas used in the comparison(see Figure 5, Figure 6, Figure 7, Figure 8, Figure 9, Figure 10, Figure 11, Figure 12 and Figure 13).
NameFigureINEGI Name-BasedFormPositionCanopy
Aguada 2595–8e16c11c3_3OvalPocket bajoCover
Aguada 25013e16c11b2_11IrregularBajo marginOpen
Big Tom10e16c11c3_12TriangularIn bajoOpen
Bobal12e16c11c1_6CircularBajo marginCover
Fidelia11e16c11c3_16Tear-dropPocket bajoCover
Table 4. Results of the five example aguadas regarding each source (✓ = visible, X = not visible).
SourceA 250A 259Big TomBobalFidelia
DEM HillshadeX
DEM SLRM 20
DEM VAT
Orthophoto (INEGI)X
GoogleEarthXX
BingMapsXX
ESRIXX
Planet RGBX
Planet NIR+G+BX
Sentinel 2_RGBXX
Sentinel 2_NIR+G+BXX
Sentinel 2_SWIR+G+BXXX
Disclaimer/Publisher’s Note: The statements, opinions and data contained in all publications are solely those of the individual author(s) and contributor(s) and not of MDPI and/or the editor(s). MDPI and/or the editor(s) disclaim responsibility for any injury to people or property resulting from any ideas, methods, instructions or products referred to in the content.