Article

Improved Pixel Offset Tracking Method Based on Corner Point Variation in Large-Gradient Landslide Deformation Monitoring

1
Institute of International Rivers and Eco-Security, Yunnan University, Kunming 650500, China
2
School of Earth Sciences, Yunnan University, Kunming 650500, China
3
Yunnan International Joint Laboratory of China-Laos-Bangladesh-Myanmar Natural Resources Remote Sensing Monitoring, Kunming 650500, China
4
Research Center of Domestic High-Resolution Satellite Remote Sensing Geological Engineering, Universities in Yunnan Province, Kunming 650500, China
5
Yunnan Key Laboratory of Sanjiang Metallogeny and Resources Exploration and Utilization, Kunming 650051, China
*
Author to whom correspondence should be addressed.
Remote Sens. 2025, 17(19), 3292; https://doi.org/10.3390/rs17193292
Submission received: 4 August 2025 / Revised: 10 September 2025 / Accepted: 23 September 2025 / Published: 25 September 2025

Abstract

Highlights

What are the main findings?
  • A novel corner point change normalization cross-correlation pixel offset tracking method is proposed.
  • The method demonstrates improved landslide delineation and offset calculation using VV and VH polarization data.
What is the implication of the main finding?
  • The proposed method ensures high reliability in evaluating landslide displacement.
  • It provides an effective solution for monitoring large-gradient landslides and overcoming feature-matching challenges.

Abstract

Aiming at the problems of feature matching difficulty and limited extension application in the existing pixel offset tracking method for large-gradient landslides, this paper proposes an improved pixel offset tracking method based on corner point variation. Taking the Jinshajiang Baige landslide as the research object, the method’s effectiveness is verified using sentinel data. Through a series of experiments, the results show that (1) the use of VV (Vertical-Vertical) and VH (Vertical-Horizontal) polarisation information combined with the mean value calculation method can improve the accuracy and credibility of the circling of the landslide monitoring range, make up for the limitations of the single polarisation information, and capture the landslide range more comprehensively, which provides essential information for landslide monitoring. (2) The choice of scale factor has an essential influence on the results of corner detection, in which the best corner effect is obtained when the scale factor R is 2, which provides an essential reference basis for practical application. (3) By comparing traditional normalized and adaptive window cross-correlation methods with the proposed approach in calculating landslide offset distances, the proposed method shows superior matching accuracy and sliding direction estimation. (4) Analysis of pixels P1, P2, and P3 confirms the method’s high accuracy and reliability in landslide displacement assessment, demonstrating its advantage in tracking pixel offsets in large-gradient scenarios. Therefore, the proposed method offers an effective solution for large-gradient landslide monitoring, overcoming limitations of feature matching and limited applicability. It is expected to provide more reliable technical support for geological disaster management.

Graphical Abstract

1. Introduction

Landslides are a common and severe geological hazard, causing a large number of casualties and huge economic losses every year, and their suddenness and destructive power have made landslides a problem of great concern worldwide [1,2,3,4,5]. In particular, large-gradient landslides are particularly challenging due to their higher surface deformation rates and complex mechanisms [6].
Conventional optical remote sensing is often interfered with under severe weather conditions, such as heavy rain or snow, and natural disasters, such as landslides, often occur under these conditions. In contrast, Synthetic Aperture Radar (SAR) has all-weather, all-day observation capability and is not affected by weather [6,7,8,9,10,11]. In recent years, SAR technology has been widely used in the field of landslide monitoring [12,13] and has become one of the critical observation tools. Two methods for landslide surface deformation monitoring using SAR images are Differential Interferometric Synthetic Aperture Radar (D-InSAR), which is based on phase information, and Pixel Offset Tracking (POT), which is based on image intensity information. Differential interferometric SAR estimates deformation mainly through line-of-sight displacement. However, due to coherence loss, it cannot measure deformation that exceeds the maximum detectable gradient, and is therefore more suitable for slow and very slow landslide monitoring [14]. On the other hand, the offset tracking method can measure deformation along both azimuthal and distance directions and is less affected by coherence. Even with a complete loss of coherence in the interferogram, it can recover large-gradient deformations on the metre scale, making it more suitable for monitoring moderate to fast landslides (velocities more significant than a few centimetres/year). Although its measurement accuracy is relatively low, usually between 1/10~1/20 pixels [10,15], the SAR image pixel offset tracking method has been widely applied to monitor large-gradient landslide displacements in cases where D-InSAR fails [6,16,17].
The pixel offset tracking algorithm mainly matches SAR magnitude images with normalized cross-correlation (NCC) features [6,7,16] by searching for the position at the peak of the two-dimensional cross-correlation function generated to estimate the relative offset between the two images. Successfully estimating image offsets depends on identical features in two SAR images at the same scale. In recent years, researchers have proposed various improved offset tracking methods to improve the accuracy of offset measurements. Roughly, they are divided into three categories. The first one is to use additional information other than intensity to assist offset tracking [18], which utilizes additional information and helps to improve the precision and accuracy, but it also increases the computational complexity and the difficulty of data processing, especially when dealing with large-scale data. The second class eliminates in-window samples during the estimation process that have significantly different motion velocities from the centre pixel [7], which improves the accuracy of the landslide boundary results while requiring more iterations and computational resources, and is sensitive to the initial parameters. A third class estimates offsets for bright targets (e.g., buildings, exposed rock, and corner reflectors) [16,19] rather than uniformly distributed test points, often with results that are too sparse and limited by regional scattering properties. These improved methods aim to calculate the correlation between two regular or irregular image patches and find the maximum correlation to improve the precision and accuracy of offset measurements. However, there are still the following problems that need to be improved urgently:
(i) Difficulty in feature matching. For large-gradient landslides, the existing methods typically focus on the area that has slid together as a whole. At the same time, the image after landslides tends to expose uneven and new areas instead of the whole panning, which leads to the loss of adequate information originally contained, making feature matching more complex, and installing corner reflectors in the area of large-gradient landslides is not only costly but also dangerous.
(ii) The promotion and application are limited. The above three improved algorithms apply only to SAR data with higher spatial resolution, such as ALOS and GF-3 data, and the data cost is high. In contrast, Sentinel-1 data are free of charge, which can significantly reduce the cost of data acquisition, and there is a lack of landslide offset tracking methods applicable to Sentinel-1 data.
Based on the issues mentioned above, this study proposes an improved pixel offset tracking method based on corner point variation, aiming to overcome the limitations of existing approaches and enhance the accuracy and reliability of landslide displacement measurements. The method fully accounts for the heterogeneous characteristics of landslide areas, enhancing feature matching through the incorporation of corner point variations, while also leveraging freely available and widely accessible Sentinel-1 data, significantly reducing data acquisition costs and improving practicality and operability. By combining normalized cross-correlation with corner point feature extraction, CNCC achieves precise offset calculations in heterogeneous regions. Through these improvements and optimizations over existing methods, the proposed approach provides a more reliable and accurate solution for monitoring large-gradient landslides.

2. Materials and Methods

2.1. Jinsha River Baige Landslide

The upper reaches of the Jinsha River are one of the most active areas for geological hazards in China, with a complex geological environment that has been the site of numerous large earthquakes and large landslides [6]. Among them, the Jinsha River Baige landslide (31°4′55″N, 98°42′16″E) is located on the west bank of the upper Jinsha River at the junction of Jiangda County, Chamdo City, Tibet, China, and Baiyu County, Ganzi Tibetan Autonomous Prefecture, Sichuan Province, at an elevation of about 3600 m above sea level. Its regional location and geological profile are shown in Figure 1a,b. At about 4:00 a.m. on 11 October 2018, the region experienced an extra-large-scale high-level landslide with a total volume of about 23 million cubic metres of landslide that rapidly blocked the Jinsha River, forming a landslide weir of about 290 million cubic metres [9], which resulted in the flooding of several roads and disruption of traffic. At about 1700 h on 3 November 2018, a second high-level and high-speed slide of about 3.5 million cubic metres of rock from the landslide washed into the Jinsha River and caused the weir to fail again. It poses a serious threat to downstream villages and infrastructure. Although the catastrophic failure did not result in direct human casualties, the weir breach flooding triggered by the landslide inundated and destroyed thousands of houses and infrastructure located upstream and downstream. The landslide was the first known and documented large-scale slope failure on the upper Jinsha River in recent decades. Several scholars have suggested that the landslide resulted from long-term slope deformation, and precipitation has been hypothesised to be an essential factor in causing the landslide [9,20,21,22].

2.2. SAR Data and Auxiliary Data

In this paper, we focus on the offset calculation after the first landslide and use two SAR scenes acquired before and after the landslide from the C-band Sentinel-1A radar, launched by the European Space Agency in 2014. Since the Baige landslide is located on the west bank of the Jinsha River and mainly slides in the southeast direction, we selected datasets from the ascending orbit. Table 1 shows the parameter information of the SAR datasets. The images were acquired in IW mode with VV and VH polarizations, dated 3 October 2018 (before the landslide) and 15 October 2018 (after the landslide), respectively. In addition, eight SAR images from October 2017 to September 2018 were collected for the discussion of pre-disaster deformation monitoring of the landslide.
POD (Precise Orbit Ephemerides) was introduced for the subsequent removal of orbital error offsets, and ALOS 30-metre DEM data provided by the Japan Aerospace Exploration Agency (JAXA) was used for the removal of offsets caused by terrain factors. Coherence maps were obtained through alignment and interference processing for subsequent landslide mask extraction.

2.3. Methods

2.3.1. Traditional Normalized Cross-Correlation Tracking Methods

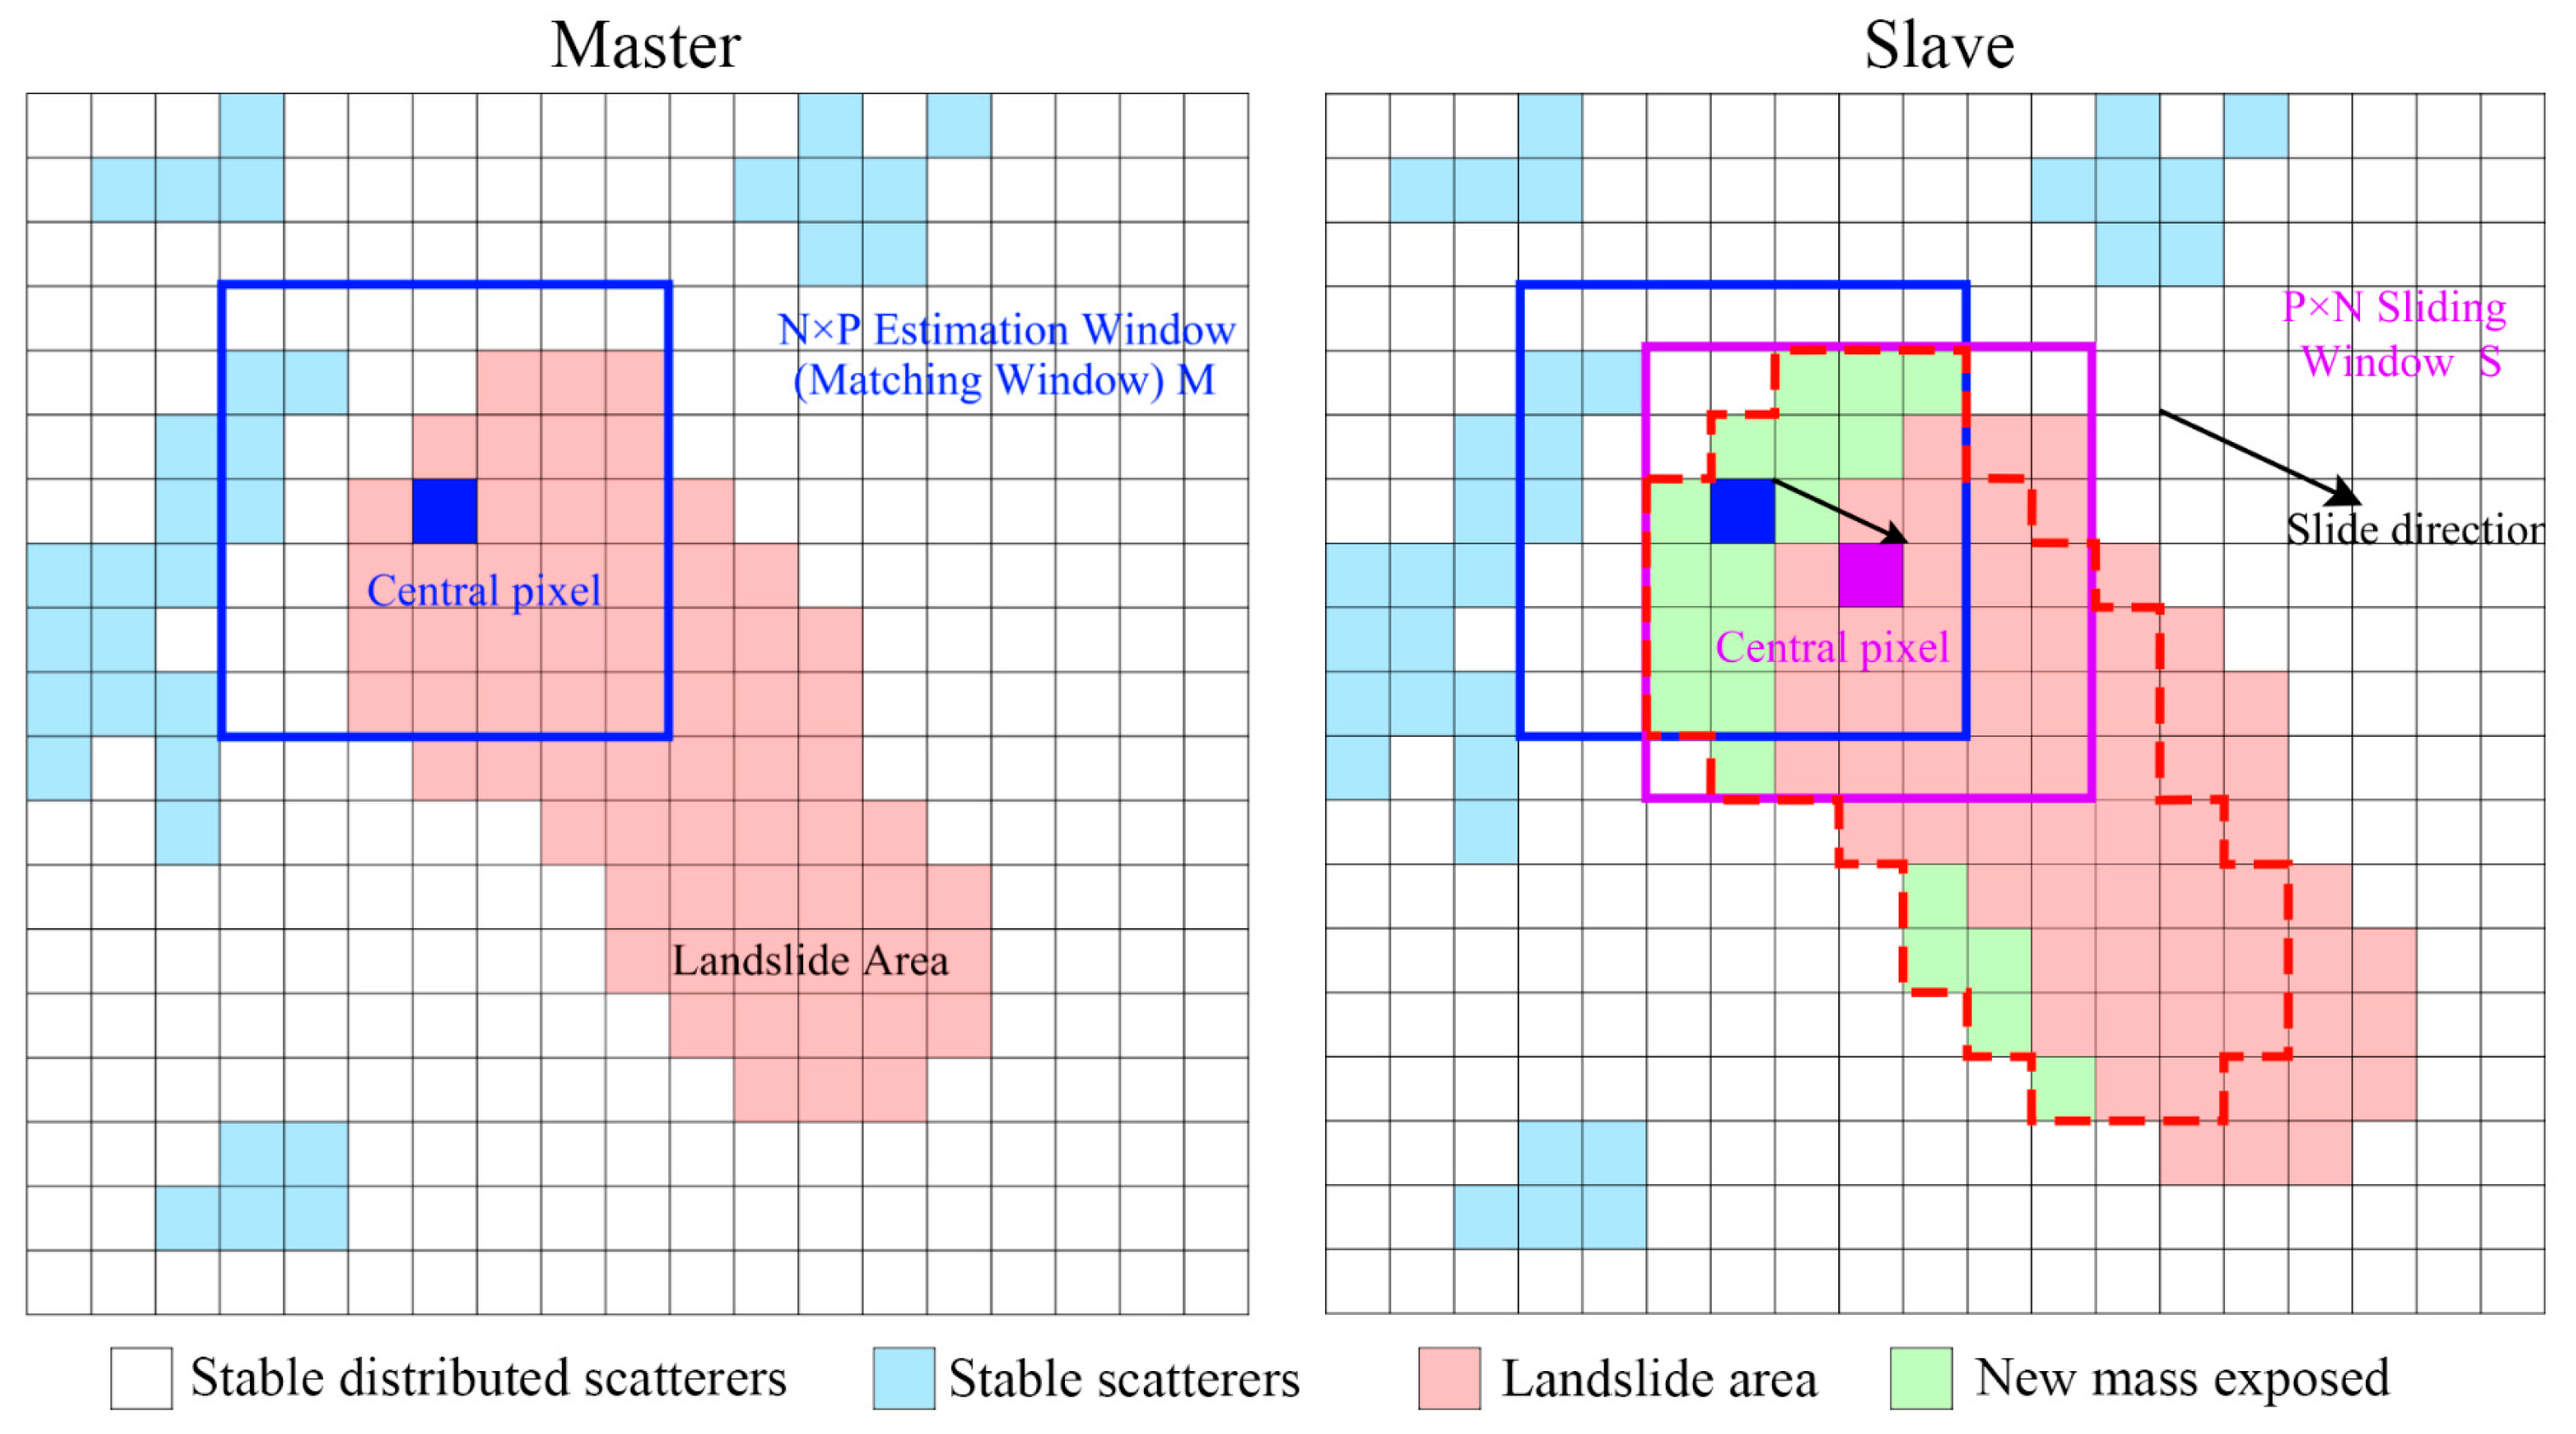
The core of the traditional normalized cross-correlation tracking method lies in the cross-correlation matching between the master image and the slave image, and the relative offset between the master image and the slave image is estimated by finding the position of the maximum number of inter-correlations, to get the deformation of the ground surface. Figure 2 shows the schematic diagram of the traditional normalized cross-correlation tracking method, with the stable distributed scatterer in white, the stable scatterer in blue, the landslide area in pink, and the newly exposed area after the landslide in green. The calculation needs to ensure that there are a certain number of pixel points (e.g., 64 × 64 window) in the matrix window to ensure the accuracy of the matching. The calculation of NCC is shown in Equation (1) [6]:
ρ = i = 1 N j = 1 P M i , j μ M S i , j μ S i = 1 N j = 1 P M i , j μ M 2 i = 1 N j = 1 P S i , j μ S 2
where ρ is the number of interrelationships and the size of the estimation window (matching window) is N × P, i 1 , 2 , , N and j 1 , 2 , , P are the pixel indices within the window. M i , j and S i , j are the intensity information at pixel i , j of the master image matching window and the slave image sliding window. μ is the average intensity value of the pixels within the window. μ M and μ S are the mean intensities of the master/slave image windows.
The total amount of offset obtained by the normalized cross-correlation tracking method can be obtained by Equation (2). It also includes the influence of other systematic errors, in the process of the actual operation of the satellite, the orbit state of the satellite in two flights will be deviated, at the same time, the radar information feedback to the ground will be affected by the interference of the ionosphere, the change in the ground ups and downs, and the influence of the noise of the SAR system.
δ t o t a l = δ o r b i t + δ t o p o graphic + δ i o n o s p h e r e + δ n o i s e + δ d e f o r m a t i o n
δ o r b i t is the offset caused by orbital factors generally removed by fitting; δ t o p o graphic is the offset caused by topographic factors, which external DEMs complement; and δ t o p o graphic is the offset caused by ionospheric disturbances. The study area is located at 31°N, and for the C-band, the ionosphere-induced offset is minimal and can be neglected [6,23]. δ n o i s e is the systematic noise-induced offset, which is negligible; δ d e f o r m a t i o n is the surface offset.

2.3.2. Adaptive Window Normalized Cross-Correlation Tracking Method

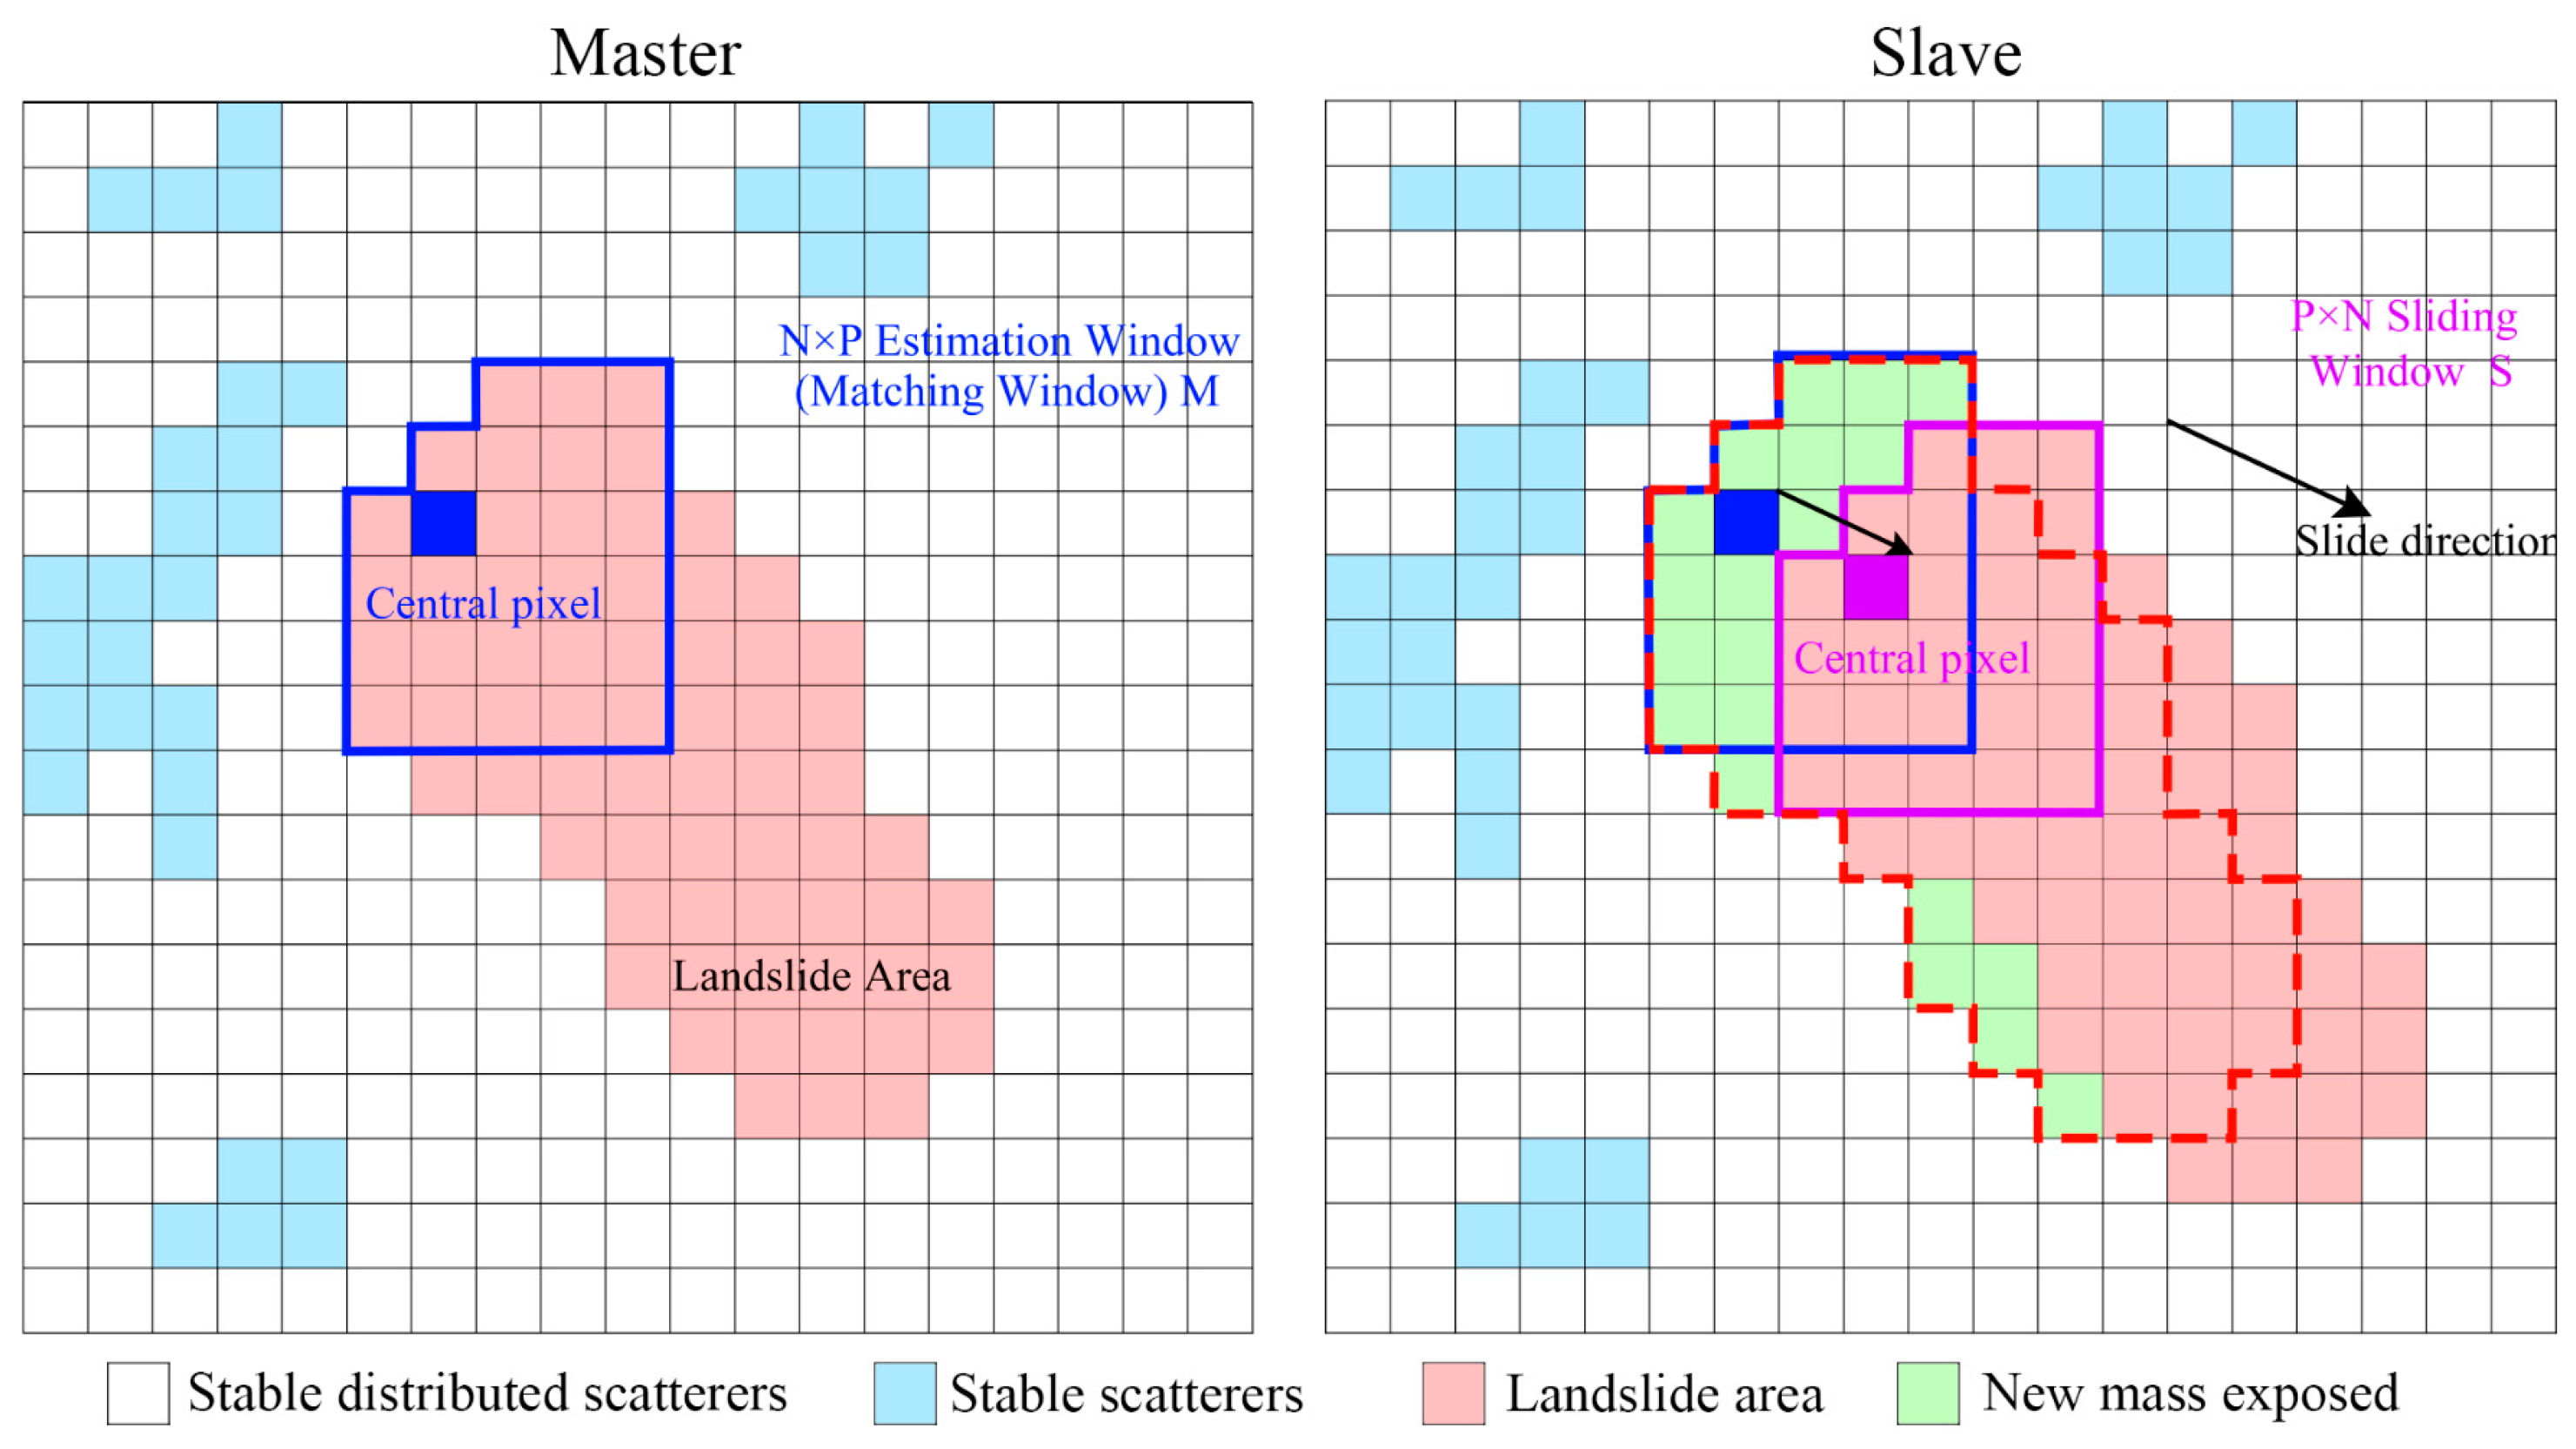
To address the issue that traditional normalized cross-correlation tracking algorithms compromise offset estimation accuracy when the measured image element is near the landslide edge, an adaptive window normalized cross-correlation tracking algorithm is proposed [14]. As the estimation window increases, the affected region becomes larger accordingly. In the calculation process, only the pixel points consistent with the motion direction of the central image element are selected to participate in the calculation to improve the reliability of the deformation estimation. The correlation coefficient can be obtained by calculating Equation (3). Figure 3 shows the principle diagram of the adaptive window normalized cross-correlation tracking method.
ρ = ( i , j ) W M i , j μ M S i , j μ S ( i , j ) W M i , j μ M 2 ( i , j ) W S i , j μ S 2
where W denotes the set of pixels in the adaptive window that are involved in the computation. M i , j and S i , j are the intensity information at pixel W in the master and slave image i , j window. μ is the average intensity value of the pixels within the W window.

2.3.3. Corner Point Change Normalized Cross-Correlation Tracking Method

The traditional normalized cross-correlation (Figure 2) and the adaptive window normalized cross-correlation tracking methods (Figure 3) are used with the default assumption that the region after a landslide is sliding together. This default assumption may lead to inaccuracy in matching because the post-slip image tends to expose inhomogeneous and new areas instead of panning as a whole, which results in the loss of valid information that was initially contained, making feature matching more difficult. Figure 4a shows that many new areas are exposed after landslides (green). Figure 4b shows the Jinshajiang Baige landslide. The SAR image changes before and after the landslide. Through Figure 4b, we can see that the green part represents the newly generated area after the landslide. In contrast, the yellow part is another area generated after the landslide, but it differs from the green part in that it is the new area formed by the stacking of the material before the landslide.
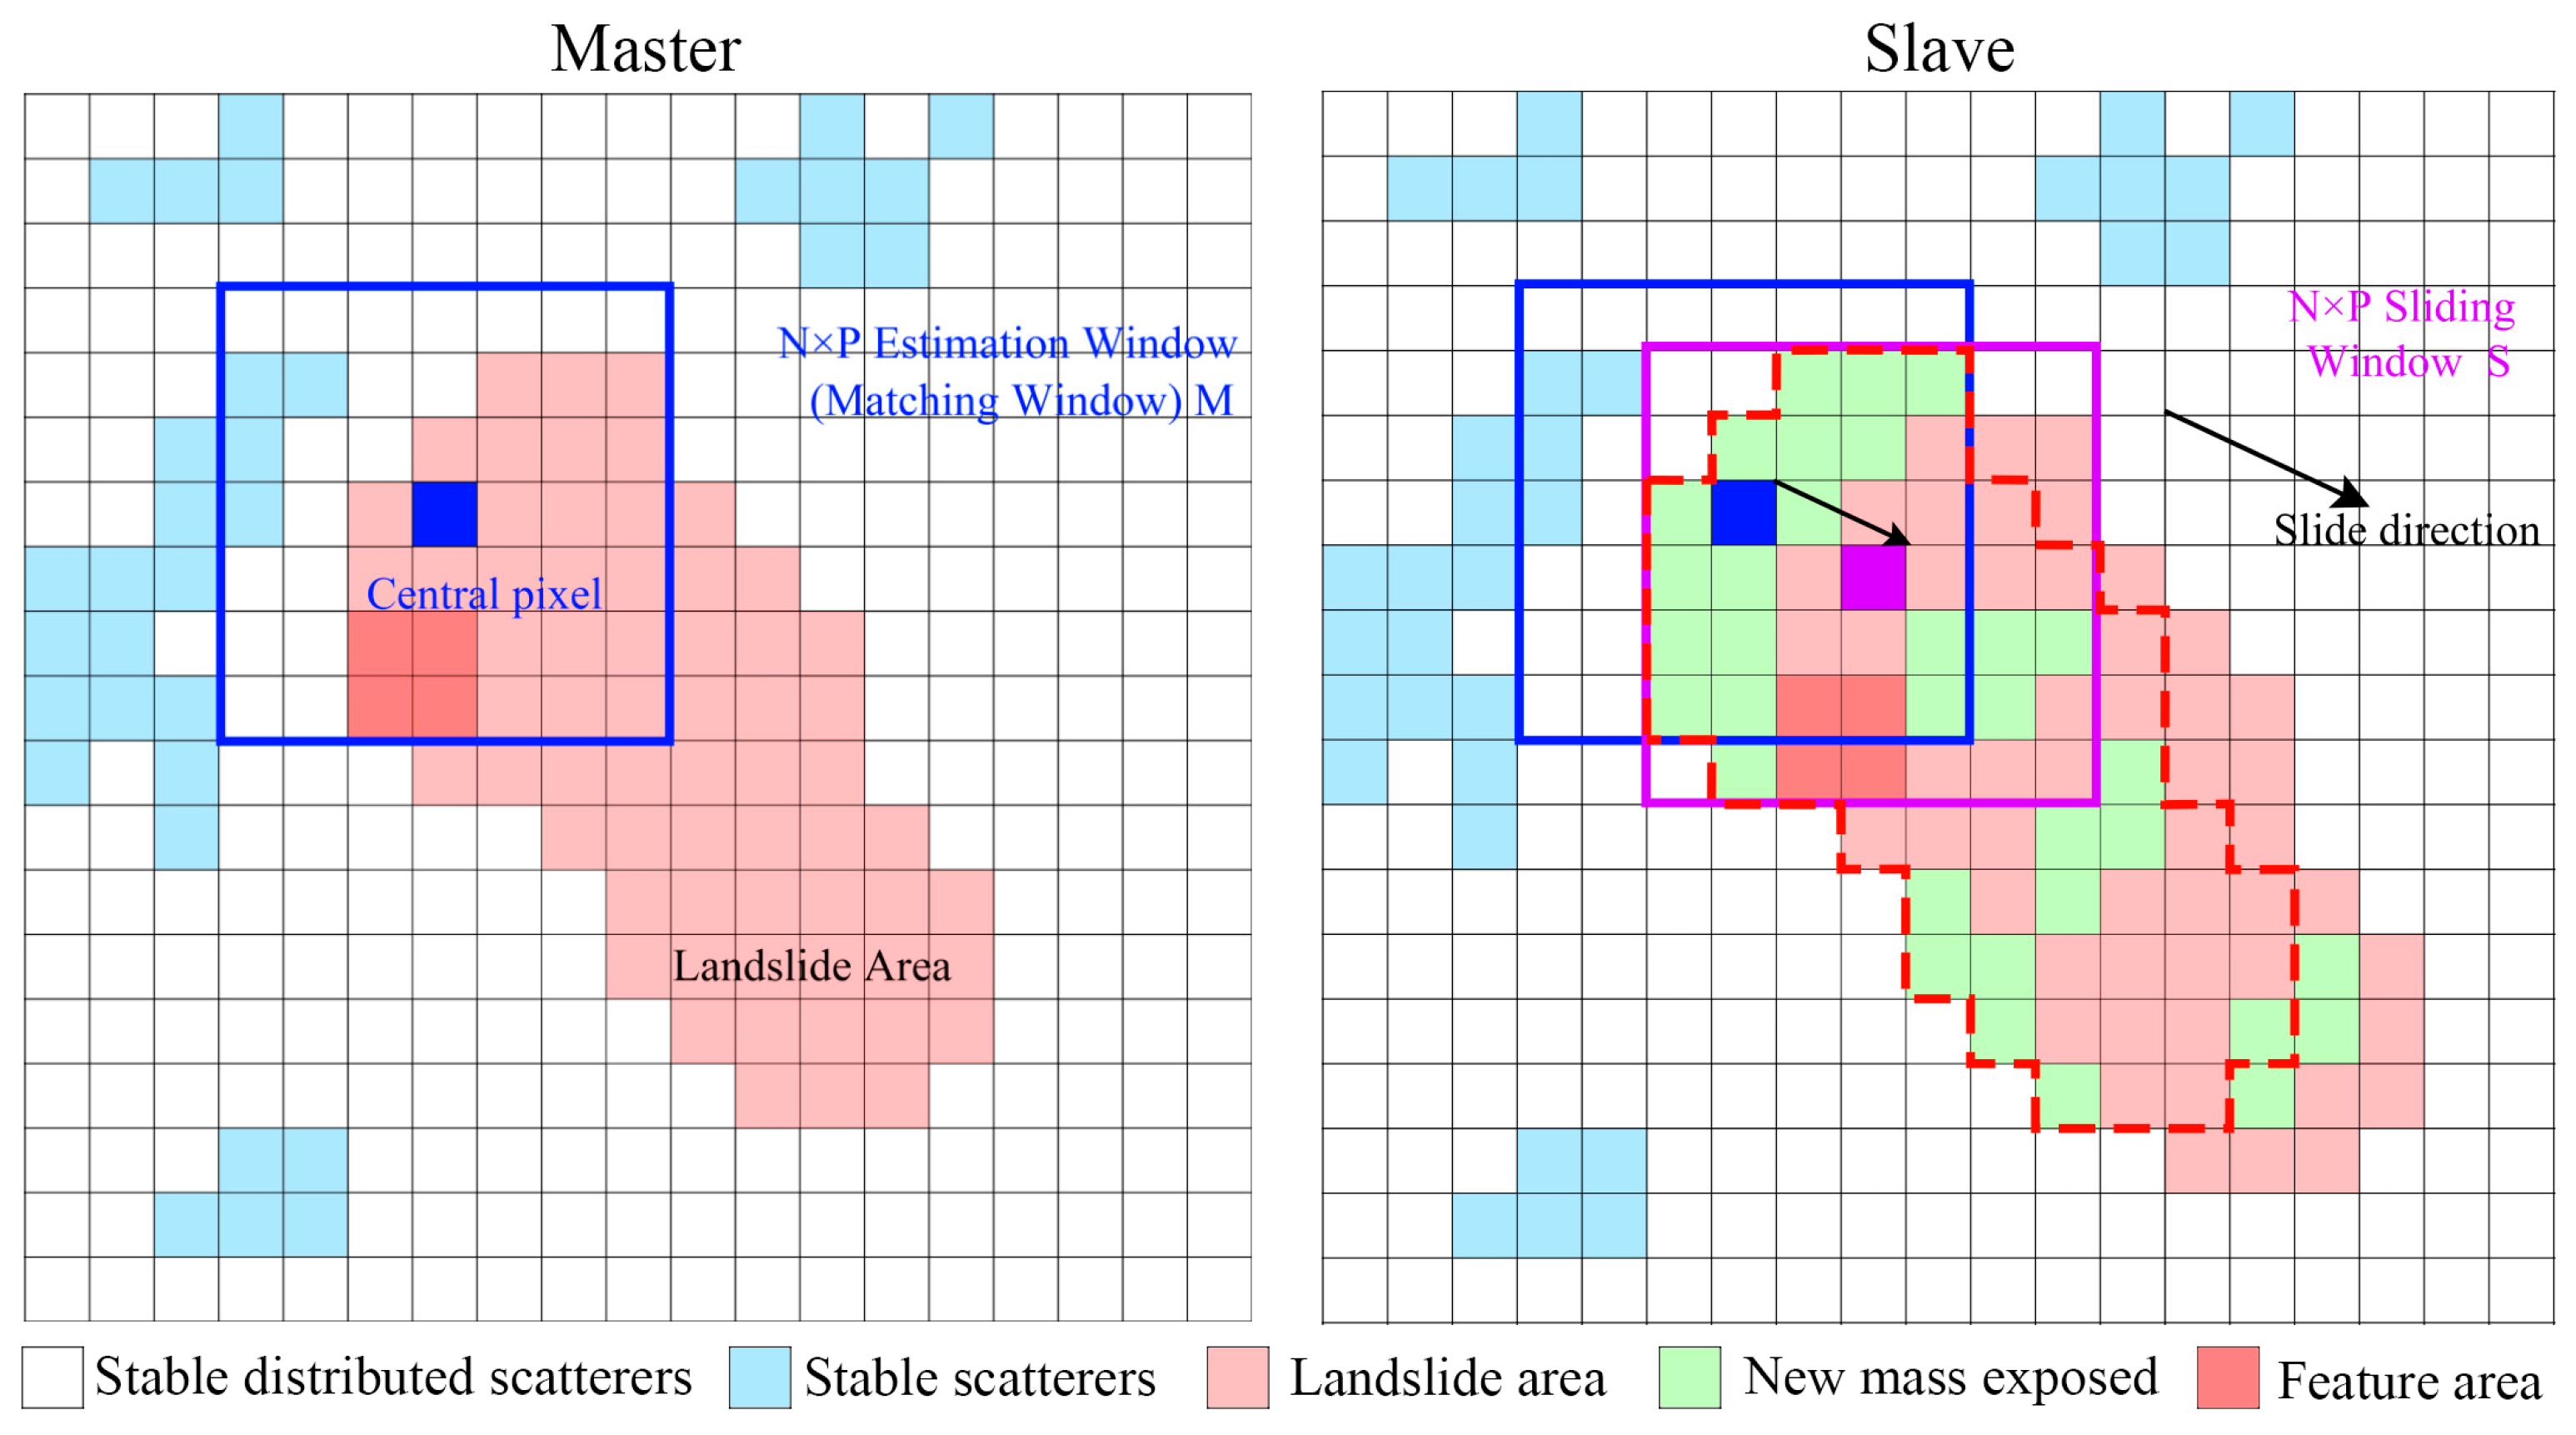
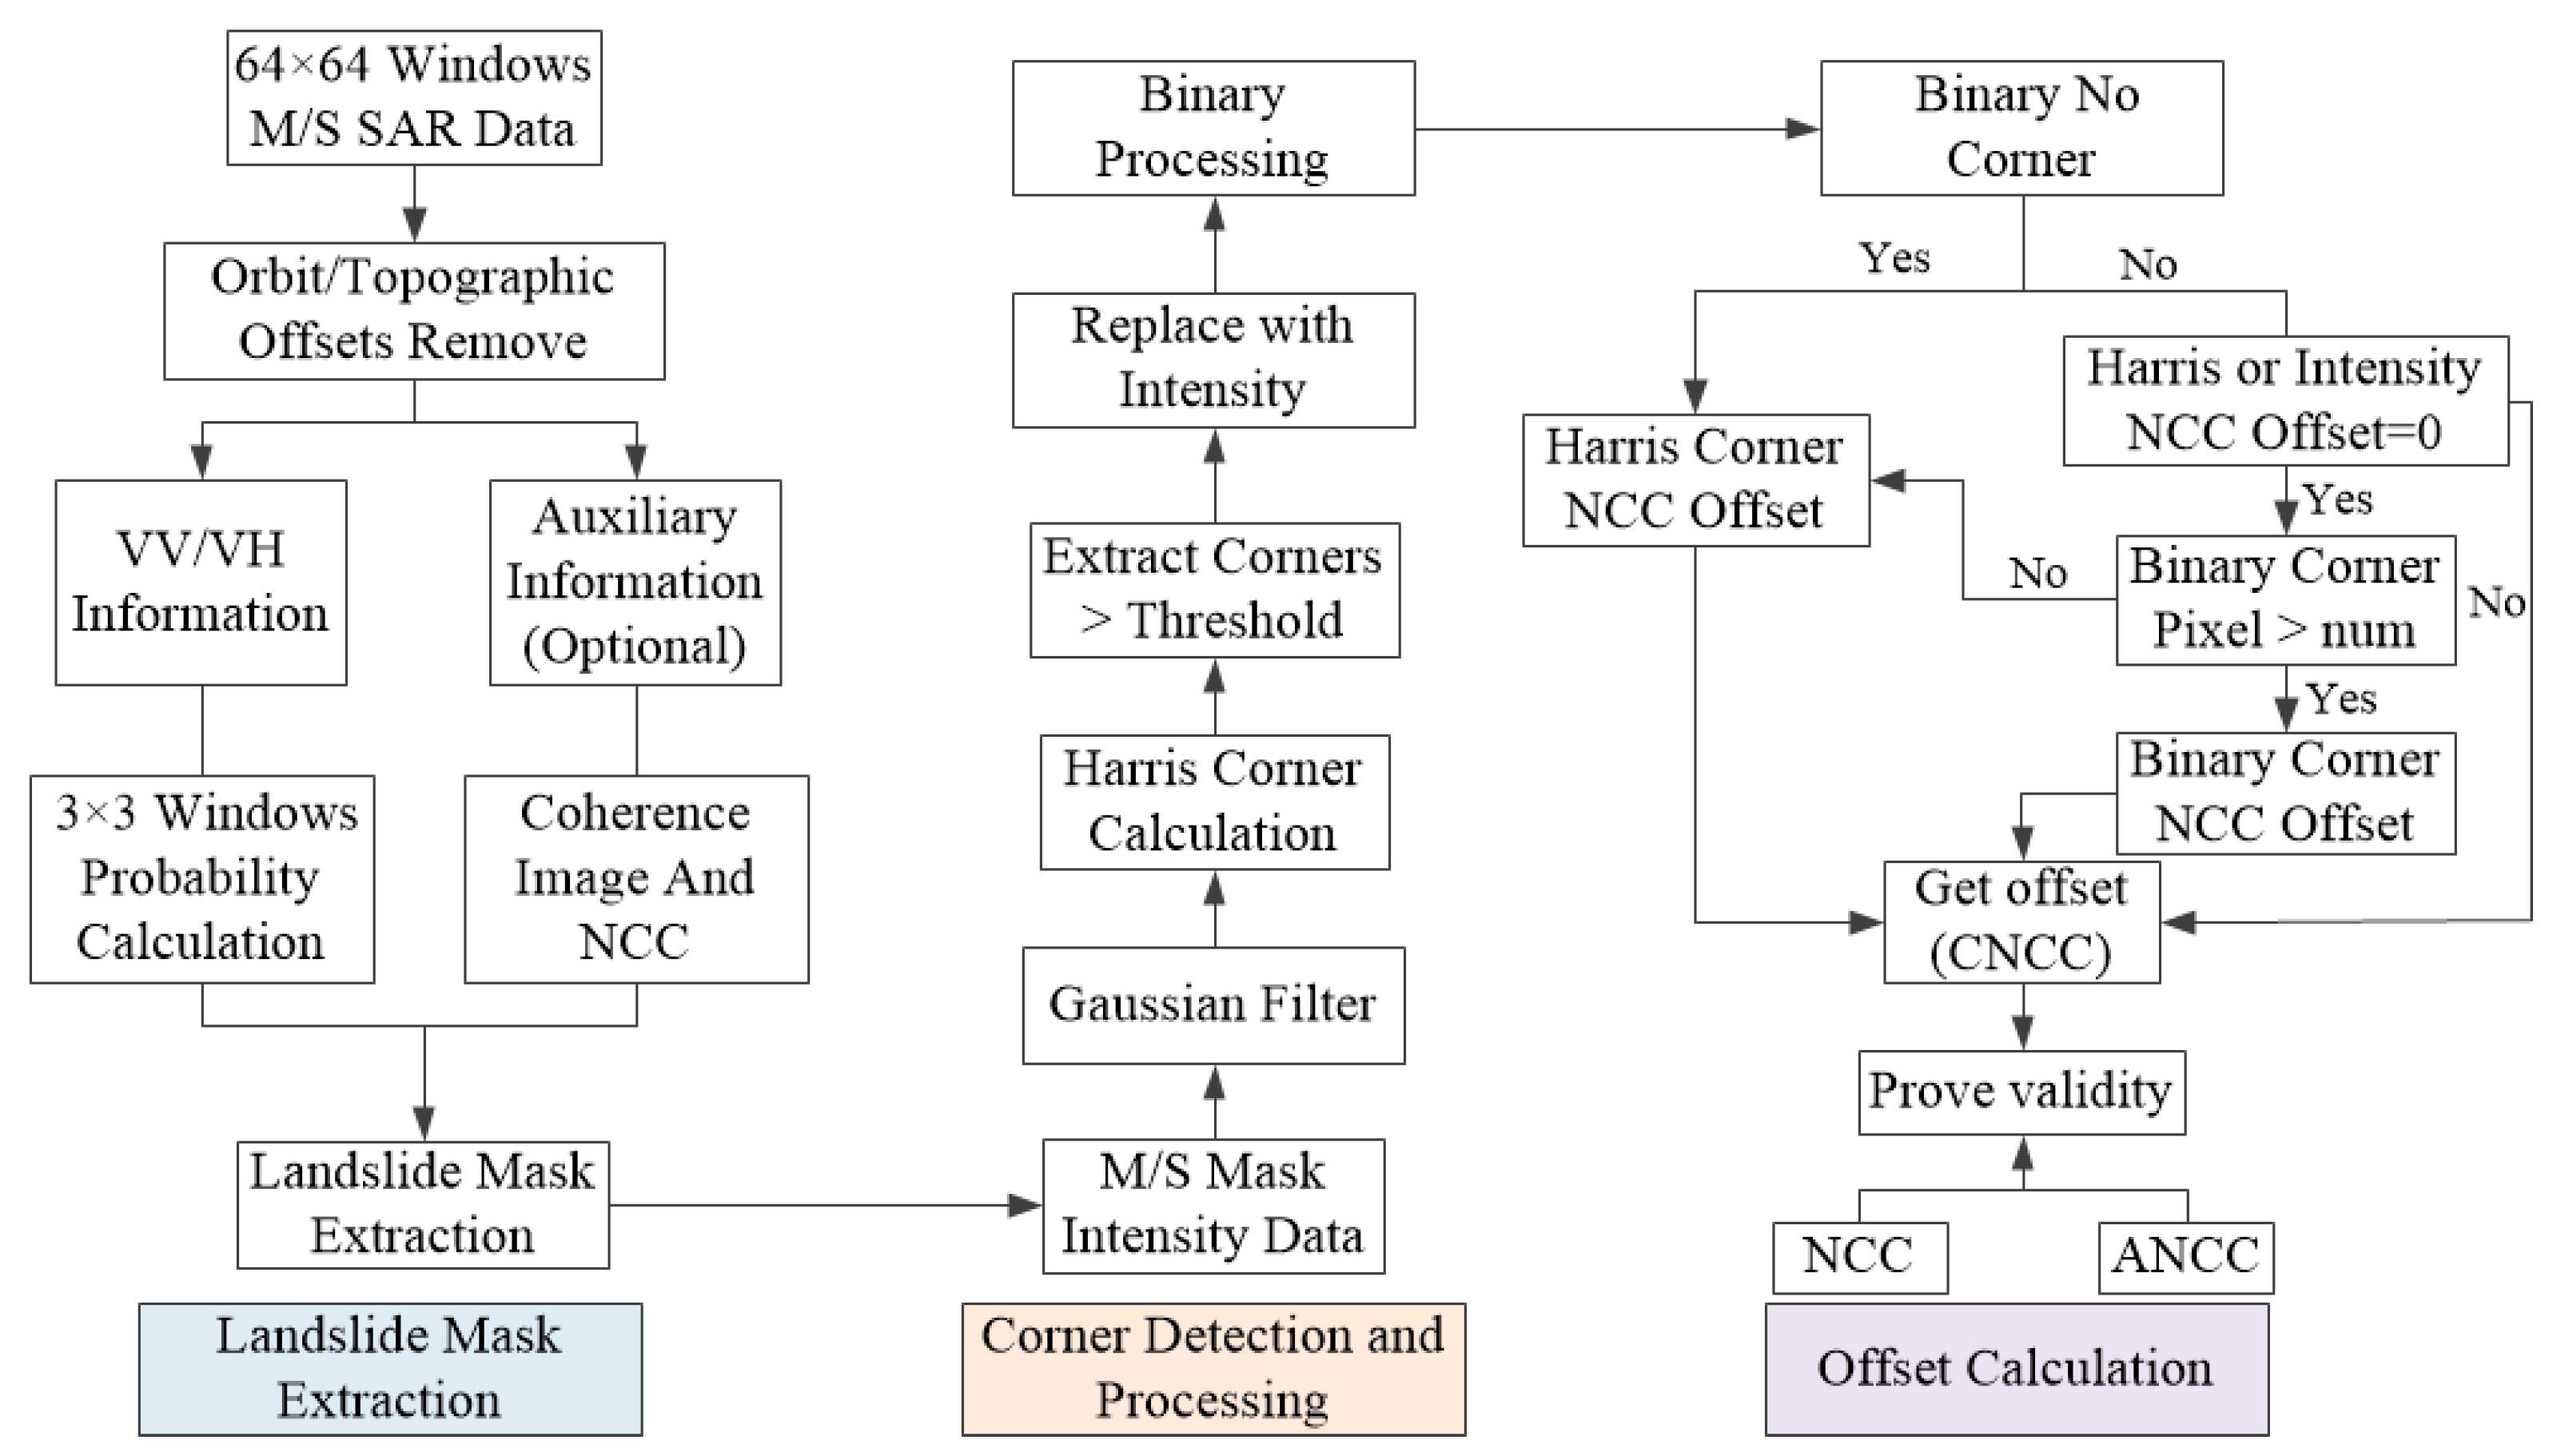
The corner point change normalized cross-correlation tracking method (CNCC) can solve this problem effectively, and its schematic diagram is shown in Figure 5 by finding the feature region after the landslide, then using the normalized cross-correlation to calculate the offset position of the feature region before the landslide, and finally getting its offset amount. To find the feature region, corner points are introduced in this paper to check and extract the feature region. The core of CNCC consists of the following parts: landslide mask extraction, corner point detection and extraction, offset calculation and comparison. Figure 6 illustrates the workflow of the proposed corner point variation–based normalized cross-correlation (CNCC) method. The main steps are summarized as follows. First, the landslide mask is extracted by analyzing pre- and post-landslide SAR intensity images, using VV and VH polarizations, supplemented by coherence or NCC results when necessary. Second, Harris corner points are detected in the masked areas to identify feature regions for tracking. Gaussian filtering is applied to reduce speckle noise and enhance the stability of corner detection. Third, the offsets of the detected feature regions are calculated using adaptive normalized cross-correlation, with oversampling applied to improve the measurement accuracy. Finally, the resulting displacement fields are obtained and compared with NCC and ANCC results to verify the accuracy and effectiveness of the proposed method.
  • Landslide mask extraction
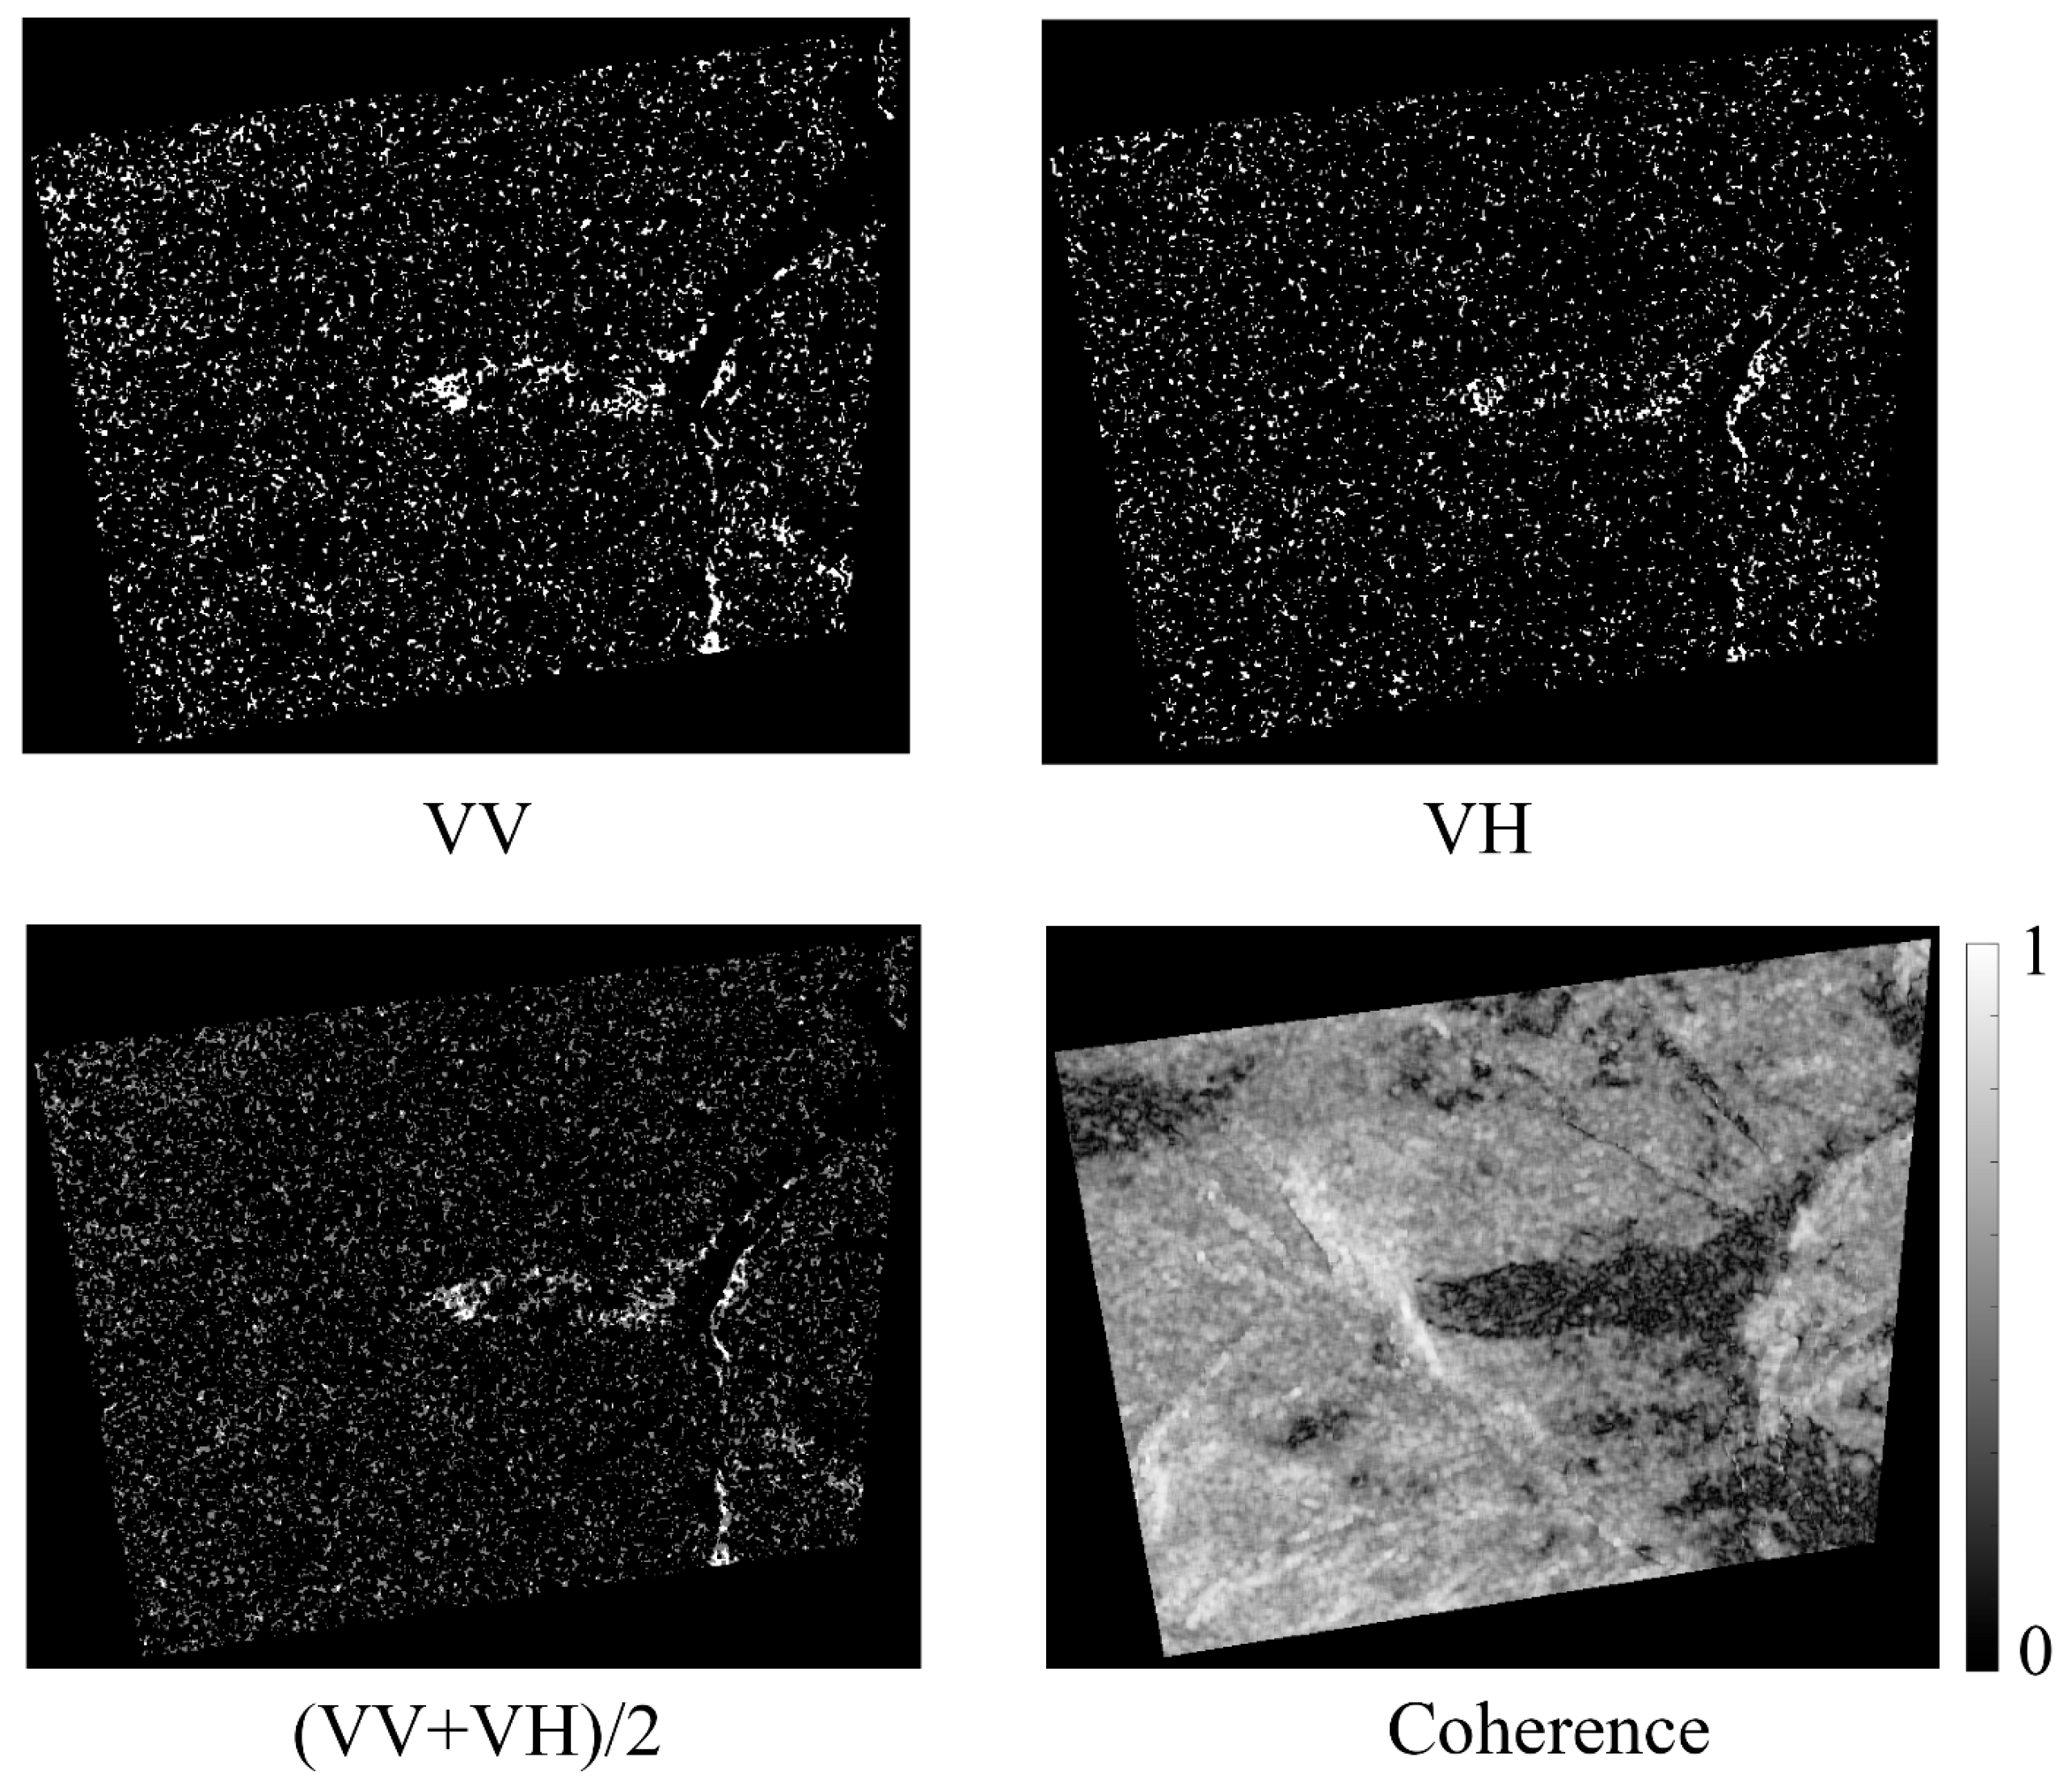
Determining the accurate landslide extent can effectively improve the accuracy and efficiency of the CNCC method. Comparing the intensity images before and after the landslide reveals that the intensity information of the object source is weakened after the landslide compared to before. Based on this, for the intensity images before and after the landslide, after removing the track offset and compensating using the external DEM topography, the landslide range is circled by using the information of its VV and VH polarisations for each pixel, as shown in Figure 7. The probability of the difference between before and after the landslide being damaging is computed by the matrix with a window size of 3 × 3, i.e., Calculate the difference ϕ between the corresponding areas of ϕ a f t e r after landslide and ϕ b e f o r e before landslide through Equation (4), and judge whether the probability of the difference being negative exceeds the set threshold, and if it exceeds, set the value to 1, and vice versa, set it to 0. Extract the part with the value of 1 under the polarization of VV and VH for averaging, and the landslide range can be circled based on the part with an average value greater than 0. Considering that polarisation information alone may not be influential in determining the extent in some areas, coherence or NCC offset results are introduced to assist in the determination.
ϕ = ϕ a f t e r ϕ b e f o r e
  • Corner detection and handling
Harris corner detection is a corner detection algorithm commonly used in computer vision to detect image corner features [24,25,26]. A corner point is considered to be encountered within a small local window if any slight change in this feature causes a significant change in greyscale by moving the small window in any direction. On the contrary, there is no corner point within the window. Harris corner detection serves as the core of CNCC computation, where the feature region is extracted to compute the offset.
Considering the presence of speckle noise in SAR intensity images, direct Harris corner detection on them is easily interfered with by noise, leading to unstable detection results or even false detection. In order to improve the accuracy and stability of Harris corner detection for SAR intensity images, we used Gaussian filtering can effectively smooth the image and remove high-frequency noise, making the corner point response more stable and reliable, and less susceptible to small noise changes. The principle is as follows [27,28]:
Assuming that φ b e f o r e and φ a f t e r are the SAR intensity images before and after the landslide with the size of H×K, corner detection is performed for each pixel using a 64×64 window size, respectively. Take the pre-landslide SAR intensity image φ b e f o r e as an example. Assuming a scale factor of R and twice R as the scale radius f , a square region with coordinate vectors j and k in the horizontal and vertical directions centred at the origin is created with a coordinate range f , , f . These two coordinate vectors j and k are combined to form the grid matrices X and Y , generating a grid matrix with a two-dimensional coordinate system centred at the origin. A two-dimensional Gaussian weight matrix W is calculated using Equation (5), and each element of this weight matrix is calculated based on the distance from the current coordinate position to the origin, with points at greater distances having smaller weights.
W = exp x arry + | y arry | R
where x arry denotes coordinates in the horizontal direction, y arry denotes coordinates in the vertical direction, ‖ denotes taking absolute values, and exp represents the natural exponential function.
To preserve detailed information across different directions in the SAR intensity image and capture its features more comprehensively, four directions are selected. The generated Gaussian weight matrix W is sliced into four different sub-matrices for subsequent filtering operations.
W 34 ­ n , p = W n , p             n = f + 2 , , 2 f + 1 ; p = 1 , , 2 f + 1 0                           other W 12 ­ ( n , p ) = W n , p             n = 1 , , f ; p = 1 , , 2 f + 1 0                           other W 14 ­ n , p = W n , p             n = 1 , , 2 f + 1 ; p = f + 2 , , 2 f + 1 0                           other W 23 ­ n , p = W n , p               n = 1 , , 2 f + 1 ; p = 1 , , f 0                           other
where W 34 is from bottom left to top right, W 12 is from top to bottom, W 14 is from top to bottom right and W 23 is from top left to bottom right.
The sliced Gaussian weight matrix is used to perform a filtering operation on the landslide front SAR intensity image φ b e f o r e . Four filtering results M 34 , M 12 , M 14 and M 23 are obtained. The gradient is calculated based on Equation (7).
G x = log ( M 14 M 23 ) G y = log ( M 34 M 12 )
where G x is the gradient in the horizontal direction and G y is the gradient in the vertical direction.
Based on the gradient results, a portion of the Harris corner point response function is calculated according to Equation (8). These response values are calculated to detect regions with significant corner point features in the SAR intensity image. The location of the corner points in the SAR intensity image can be determined by subsequent processing of these response values, such as thresholding and suppression of non-extremely significant values. Moreover, the response function is smoothed using a Gaussian filter.
C s h 11 = R 2 G x ­ 2 C s h 12 = R 2 G x G y C s h 22 = R 2 G y ­ 2
where C s h 11 denotes the weighted sum of the squares of the horizontally oriented gradients in the Harris corner point response matrix. C s h 12 denotes the weighted sum of the product of the horizontally oriented gradients and the vertically oriented gradients in the Harris corner point response matrix. C s h 22 denotes the weighted sum of the squares of the vertically oriented gradients in the Harris corner point response matrix.
The pre-slide Harris corner point response function was calculated from the smoothed response function [29].
H a r r i s before = C s h 11 C s h 22 C s h 12 ­ 2 d C s h 11 + C s h 22 2
One parameter d (typically set to 0.04) is the response function’s sensitivity coefficient and controls the response function’s sensitivity. It directly affects the number and quality of detected corner points. Increasing the value of d will increase the sensitivity of the response function and detect more corners, but it may also bring more noise and invalid corners. Conversely, decreasing the value of d decreases the sensitivity of the response function and reduces the number of detected corner points, but may miss some actual corner points.
Repeating Equations (5)–(9) above yields the post-slip Harris corner point response function H a r r i s after .
The Harris Corner Point Response Function value is a metric that indicates the likelihood of a corner point. Positive values indicate that the location is highly likely to be a corner, and values close to zero indicate the pixel is in a flat region. Negative values indicate that the pixel is likely to be on an edge. Values closer to zero indicate that the position is less likely to be a corner. The feature regions with H a r r i s after greater than the threshold (generally set to 0.95) and with the most elements are extracted for subsequent feature region selection. The essence of the CNCC offset calculation is to find the relative offset of the feature region before and after the landslide. In order to facilitate the subsequent offset calculation, oversampling is required. Since SAR data is scattered, the data needs to be oversampled to calculate the offset more accurately. This is because SAR data has a scattering effect, and oversampling helps to reduce aliasing due to increased bandwidth, thereby improving the accuracy of the calculation. The oversampling factor is set to at least 2.
  • Corner detection and handling offset calculation and comparison
The landslide occurs in the southeast direction, and its sliding mainly manifests as a shift in the direction of distance. First, we need to judge the landslide feature region to determine whether it satisfies two conditions: the element is not empty, and there are at less 9 elements. Suppose the feature area meets these two conditions. We will calculate the normalized cross-correlation number between the feature area and the oversampled SAR image before the landslide to get the offset. On the contrary, if the feature area does not satisfy these two conditions, we will calculate the normalized cross-correlation number between the oversampled pre- and post-landslide SAR images to get the offset finally. Typically, the proportion of image elements with fewer than 9 elements in the feature region is low, so this situation will not significantly affect the final CNCC calculation result, making it highly consistent with the NCC result. Finally, the computed results of CNCC offsets are compared with those of NCC and ANCC to verify the accuracy and effectiveness of the method in this paper.

3. Results

3.1. Landslide Mask Extraction Results

In Figure 8, the landslide extent extracted using polarization information is demonstrated because the probability of a negative difference in SAR data before and after the landslide is 0.85. VV and VH polarisation information can extract the landslide extent that cannot be captured under a single polarisation information. Combining information from multiple polarisation channels can improve the accuracy and reliability of identification in landslide monitoring. Further analysis reveals that different surface characteristics of features may affect single polarisation information, resulting in certain landslide areas not being fully detected. Using data from multiple polarisation channels can make up for this deficiency, thus more comprehensively capturing the extent of landslides. In addition, a more stable and reliable result can be obtained by finding the mean value of the extracted landslide extent. This is because calculating the mean value can reduce the influence of local errors, thus maximizing the extraction of the landslide extent and improving the accuracy and credibility of the subsequent monitoring. Therefore, the combined use of information from multiple polarisation channels and the mean value calculation method proposed in this paper can accurately and somewhat extract the landslide extent in landslide monitoring.

3.2. Corner Detection and Extraction Results

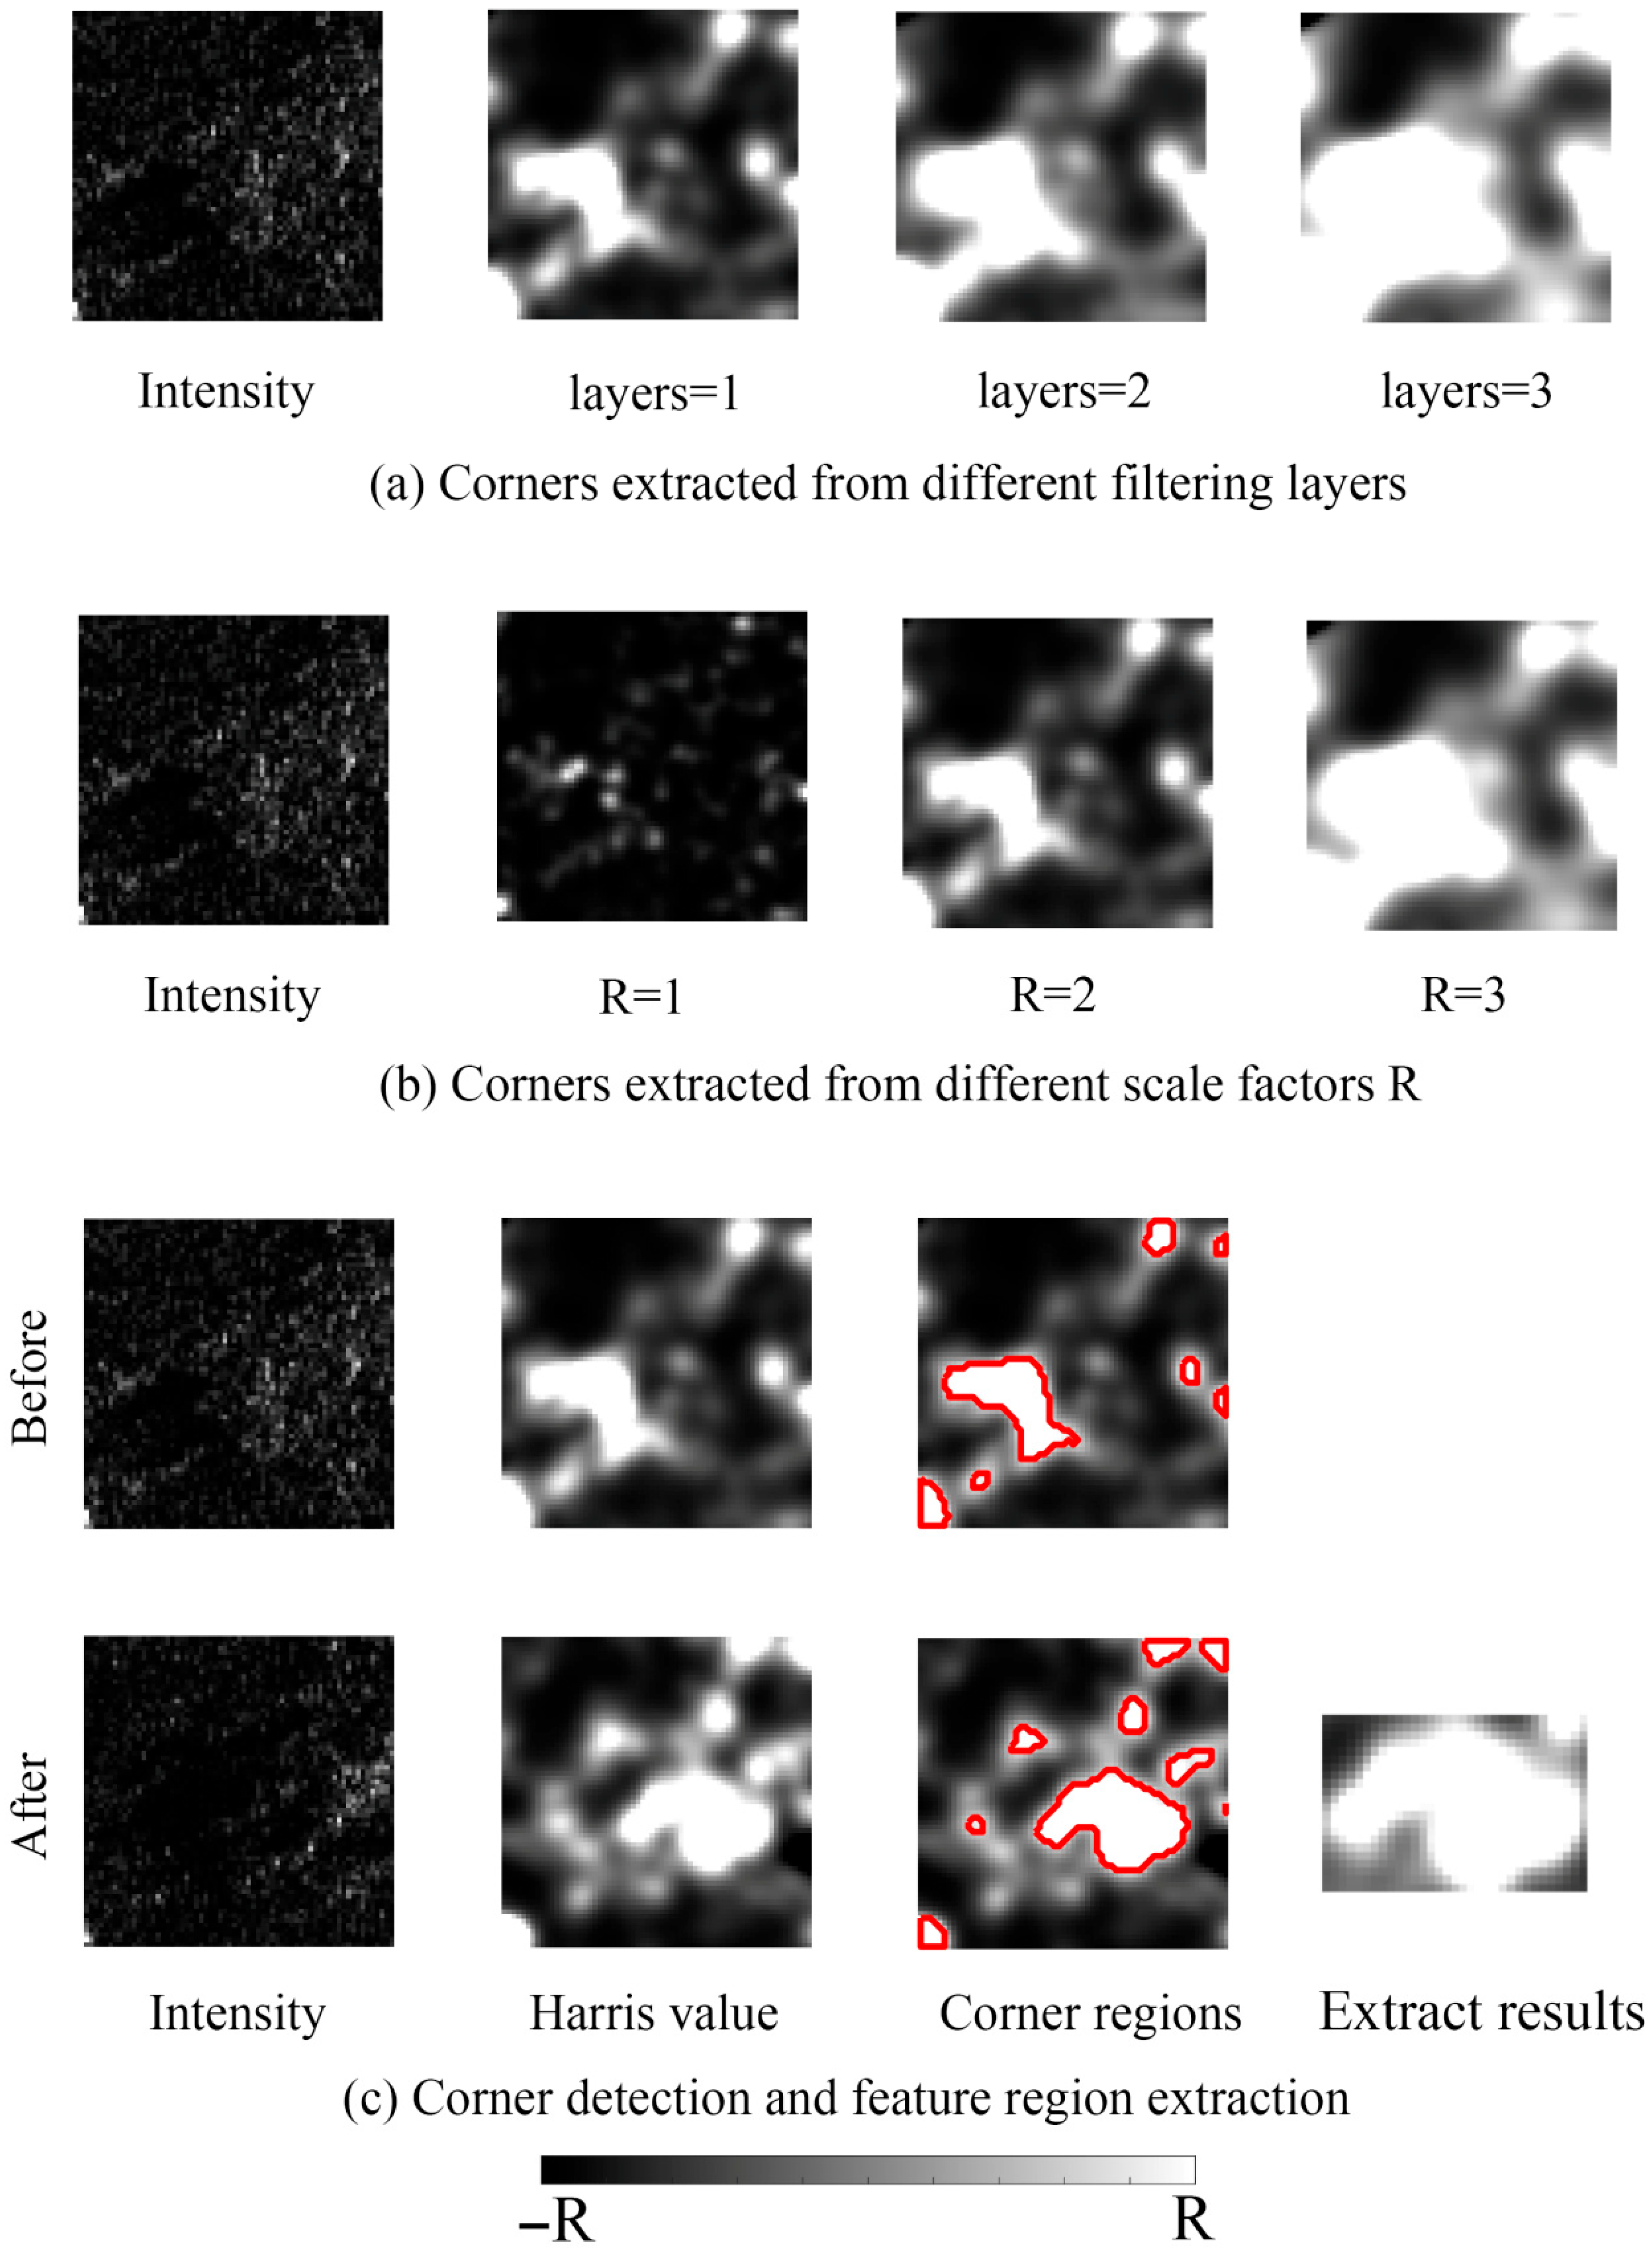
This part of the analysis focuses on the SAR intensity image located at pixel (273,310). Observe the images of the corner points computed with different Gaussian filter layers before the landslide, as demonstrated in Figure 9a. Comparing the intensity infographics reveals a black region at the lower left of the intensity map, whose intensity is significantly different from that of the surrounding region. Therefore, the extracted corner points should correspond to this intensity variation. With the increase in the number of filtering layers, the range of the corner points is gradually expanded. Although the locations of the corner points coincide, the boundaries are inconsistent. The number of filtering layers of 1 was considered the best choice. Figure 9b demonstrates the corner point images calculated based on different scale factors. It is found that the best corner points are obtained when the scale factor R is 2. In contrast, when R is 1, the corner points are undetectable, and when R is 3, the range of corner points is expanded, resulting in inconsistent boundaries. This indicates that the choice of scale factor has an essential impact on the corner point detection results, while R = 2 can better capture the landslide features. Figure 9c shows the plot of Harris response function values before and after the landslide, and the threshold has been set to 0.95 extracted corner points. With this step, the feature area after the landslide has been successfully extracted.

3.3. Offset Calculation Results

Different results have been obtained in calculating the landslide distance to offset using conventional normalized cross-correlation and adaptive window normalized cross-correlation, as well as the method proposed in this paper, as shown in Figure 10. All three methods can estimate the landslide offset to some extent. Since the whole landslide is sliding from west to east, the distance-direction offset obtained should ideally be negative. However, a noteworthy phenomenon occurs in the normalized cross-correlation and adaptive window normalized cross-correlation. In the upper region of the landslide, a large chunk of positive values of distance-directed offsets appears. This indicates that the landslide in this region is moving in the opposite direction from the overall sliding direction. The root of this problem lies in the presence of an interior that includes both sliding and stabilizing regions in the matching window before and after the landslide. Therefore, when using normalized cross-correlation and adaptive window normalized cross-correlation calculations, the mutual correlation of the two windows can lead to inaccurate matching.
In contrast, the method proposed in this paper can calculate the sliding direction correctly. This is because, within the sliding window, the region with distinctive features after the landslide is first extracted using corner points. Then, normalized cross-correlation is performed with the matching window before the landslide. This method improves the accuracy of the matching calculation to a certain extent and makes the estimation of the sliding direction more reliable.
In order to evaluate the accuracy and reliability of this paper’s method even further, three pixels in Figure 10d were selected: P1 (278,281), P2 (270,370), and P3 (229,428). In Figure 11, the red area represents the feature area extracted using the methods in this paper. At the same time, the blue box indicates the position of the pre-landslide location of the post-landslide feature area. For the P1 pixel, the offsets extracted by the three algorithms are the same, which indicates their consistency. However, for the P2 pixel, the normalized cross-correlation result and the adaptive window normalized cross-correlation result match the left region of the post-slip SAR intensity image to the right side of the pre-slip, which is caused by inaccurate matching.
In contrast, the method in this paper can effectively determine the position of the feature region in front of the landslide, and its matching result aligns with the overall displacement direction of the landslide, which shows the superiority of the method in this paper. For the P3 pixel, located in the boundary region of the landslide, there are two motion states: stable and unstable regions. The normalized cross-correlation calculation yields essentially no offset. In contrast, the adaptive window normalized cross-correlation and this paper’s method yield an offset that is not zero, which may indicate that the pixel is in an unstable region. Comparing the results of adaptive window normalized cross-correlation, this paper’s method uses the feature region to calculate the normalized cross-correlation, which can effectively capture the pixel offset changes. In summary, the method in this paper shows high accuracy and reliability in assessing landslide displacement.

4. Discussion

4.1. Advantages of This Paper’s Method over Existing Methods

The advantages of this paper’s method over existing methods are apparent. Traditional pixel offset tracking methods treat the post-landslide offset as an overall translational process, ignoring the inhomogeneity of terrain changes and the possible emergence of new regions. In contrast, this paper employs an improved pixel offset tracking method (CNCC) based on corner point changes to detect such inhomogeneities and new regions from the post-landslide image. By calculating the Harris corner-point response function of the post-landslide SAR image, the CNCC method can accurately identify the most characteristic regions in the image rather than simply processing the whole image. This method considers the changes in the characteristic regions. It, therefore, can capture the changes in the image more accurately, avoiding the overall panning error that may occur in the traditional method. Secondly, the method in this paper verifies the validity of each parameter setting of the Harris corner-point response function through a series of experiments to determine the optimal parameter combination that can accurately find the feature area after a landslide. This systematic experimental design and parameter tuning ensure the robustness and accuracy of the CNCC method in practical applications. In addition, to enhance processing efficiency and accuracy, this paper’s method introduces polarisation information to determine the extent of the landslide. By using the polarisation information, the boundary of the landslide area can be determined more precisely, which further improves the accuracy and applicability of the CNCC method. In summary, the method in this paper has apparent advantages over existing pixel offset tracking methods: it can capture image changes more accurately, avoid overall translation errors, and further improve the robustness and processing efficiency of the method through experimental validation and the introduction of polarization information.

4.2. Validation of the Accuracy of the Offset Results Obtained by Different Methods

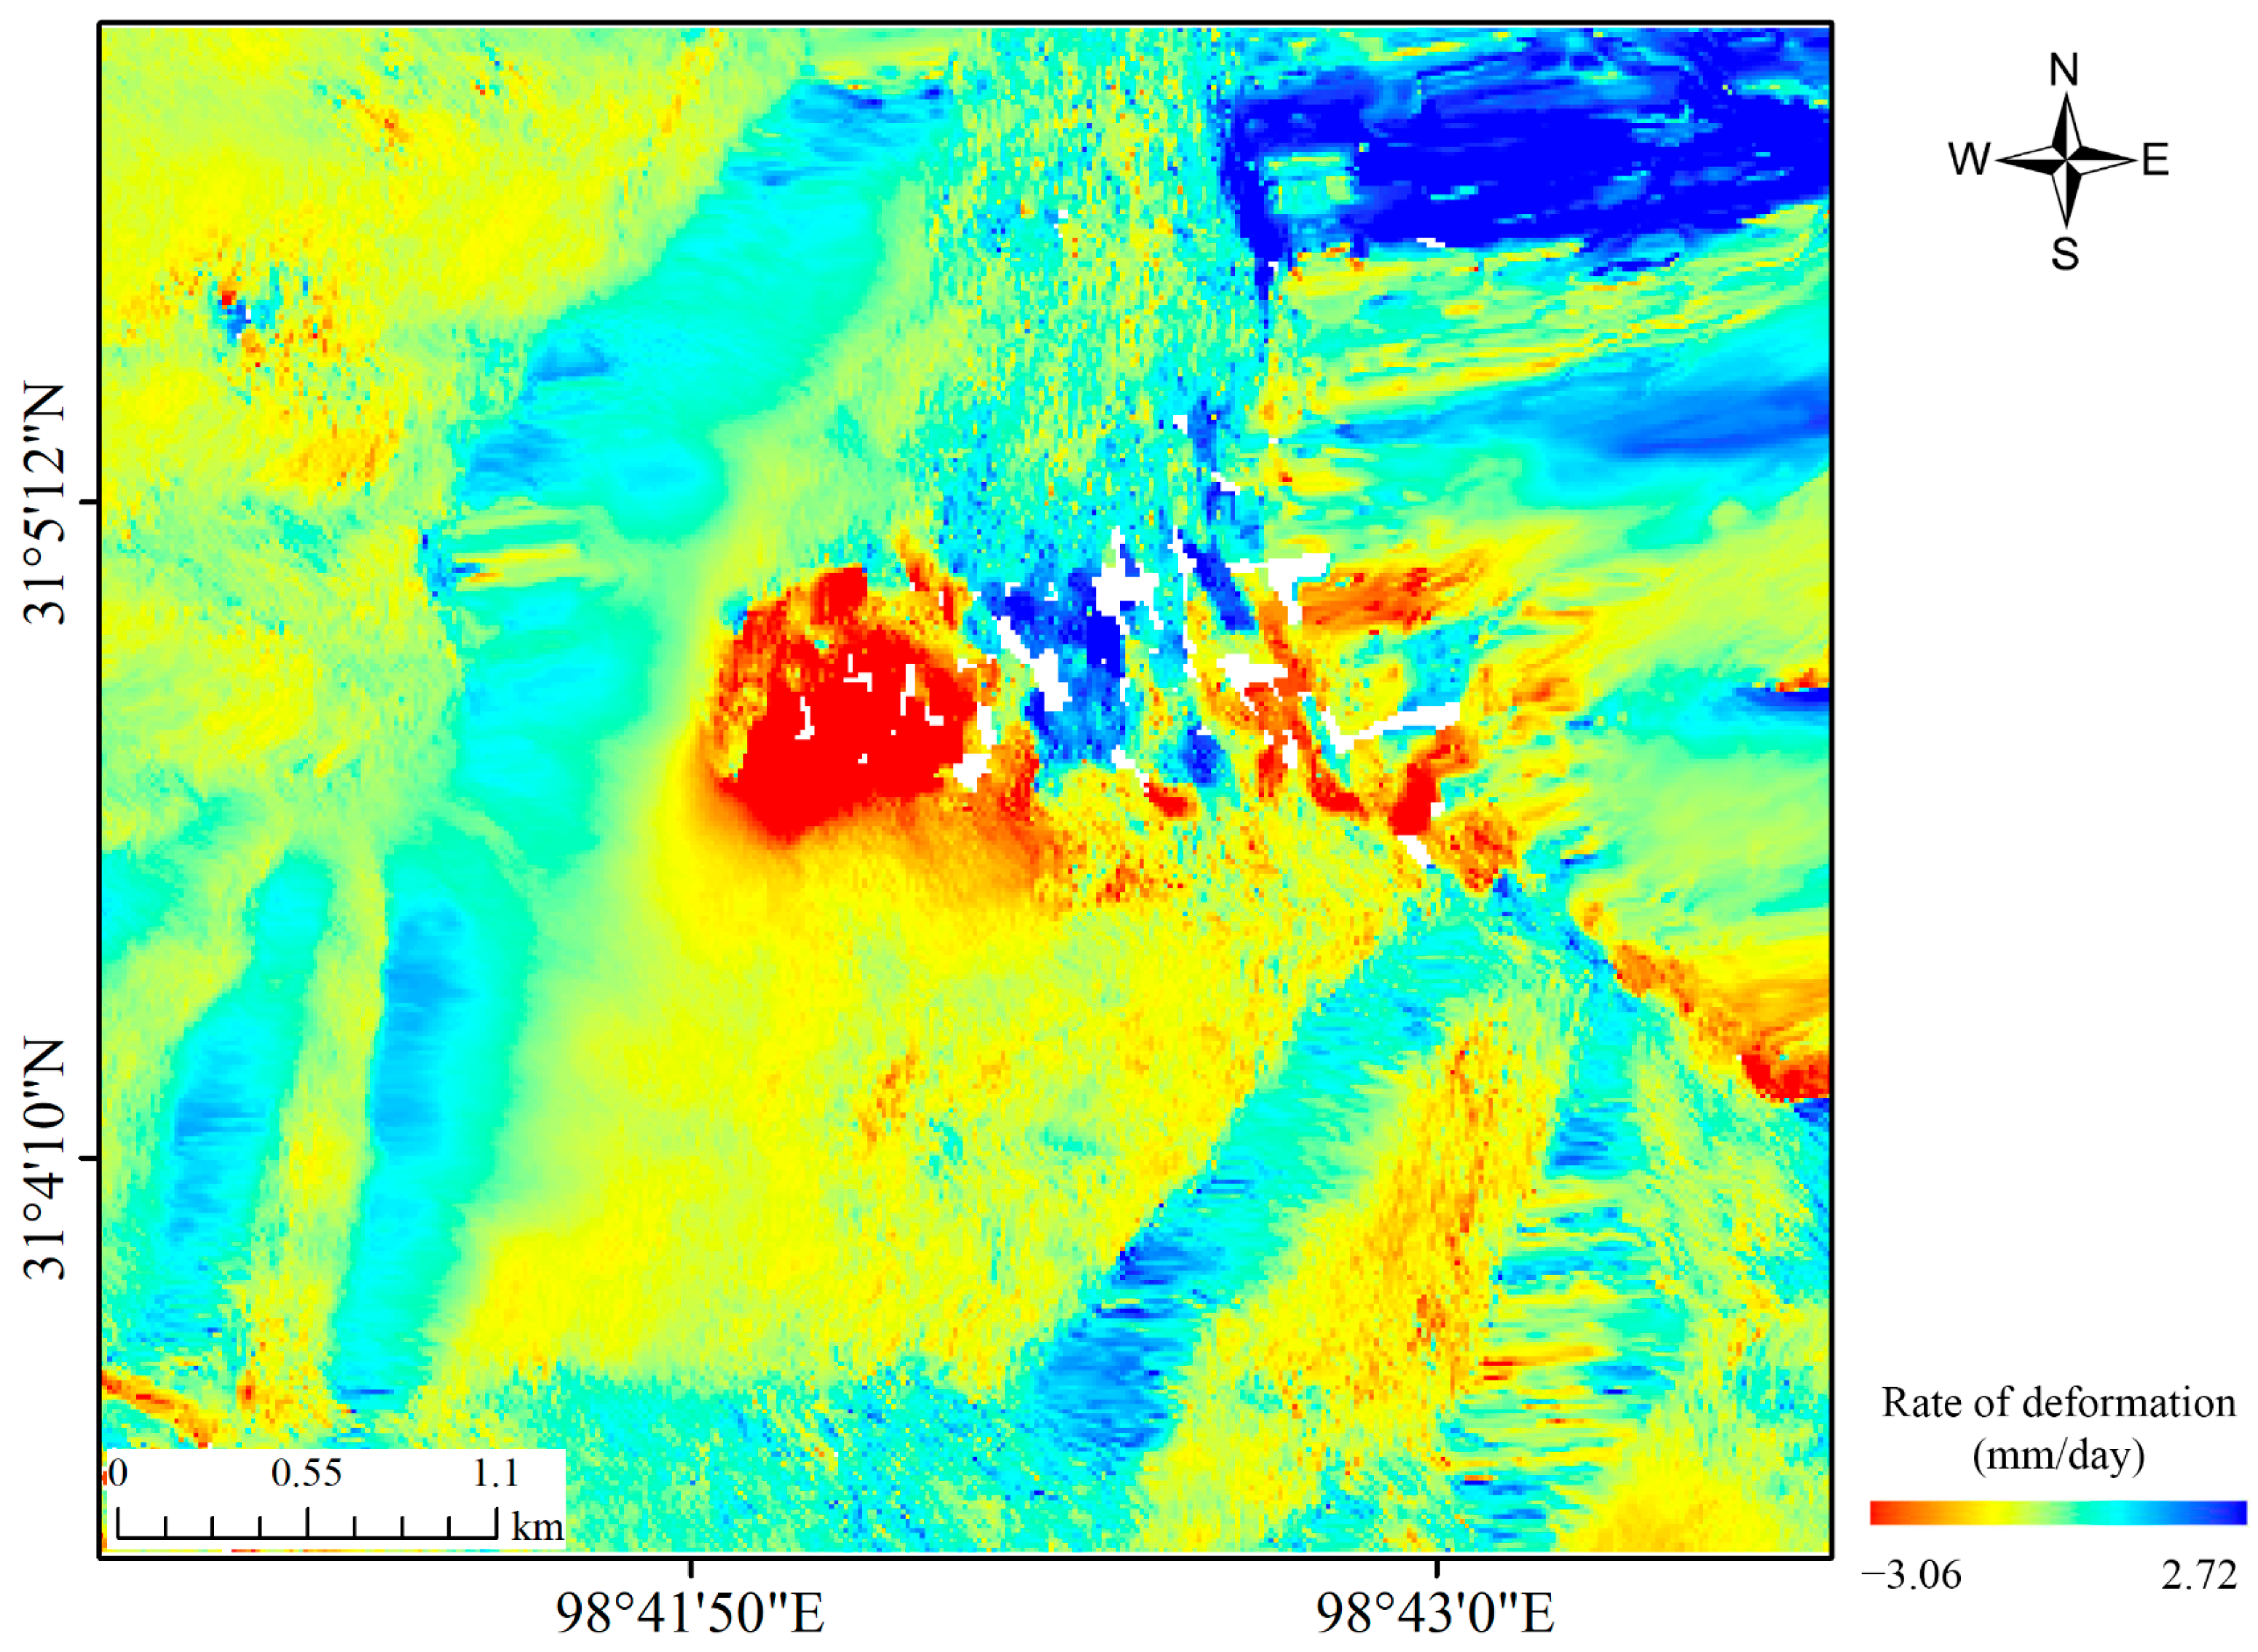
D-InSAR technology has substantial superiority in the monitoring of sudden landslides, earthquakes, and other short time scales, providing high spatial and temporal resolution monitoring of surface deformation, which can capture the changes in deformation signals on small scales and short time scales. Although D-InSAR cannot directly measure deformation in the severely deformed core of large-gradient landslides, its results in surrounding coherent regions can still achieve millimetre-level precision. These results can provide valuable references for assessing the accuracy and validity of offset tracking results derived from different methods, particularly in cases where second-class leveling data are unavailable. Figure 12 demonstrates the LOS deformation rates obtained from the Jinshajiang Baige landslide on 3 October 2018 (before the landslide) and 15 October 2018 (after the landslide), and it can be seen that the maximum deformation rate from west to east (away from the satellite line-of-sight direction) during this landslide time interval is 3.06 mm/day, while the maximum deformation rate from east to west (close to the satellite line-of-sight direction) is 2.72 mm/day. It is proven that D-InSAR can effectively monitor the deformation rate of sudden large-gradient landslides.
However, it should be noted that D-InSAR measures line-of-sight (LOS) deformation, whereas POT provides two-dimensional deformation in both azimuth and range directions. This inherent geometric discrepancy makes it inappropriate to compare the absolute displacement values of the two methods directly. Therefore, the validation in this study primarily focuses on the spatial consistency of deformation patterns, rather than requiring exact numerical agreement between D-InSAR and POT results.
As can be seen from Figure 12, in the upper and middle parts of the landslide, the deformation rate offset from west to east is the largest. When compared with the offset results obtained by the three methods in Figure 10, the CNCC method proposed in this paper demonstrates higher consistency with the spatial distribution patterns observed in the D-InSAR results while effectively avoiding the issue of excessive smoothing. This indicates that the CNCC method can capture the key deformation characteristics of large-gradient landslides more accurately than conventional approaches.

4.3. Pre-Disaster Deformation Monitoring and Evolution Process of Landslides

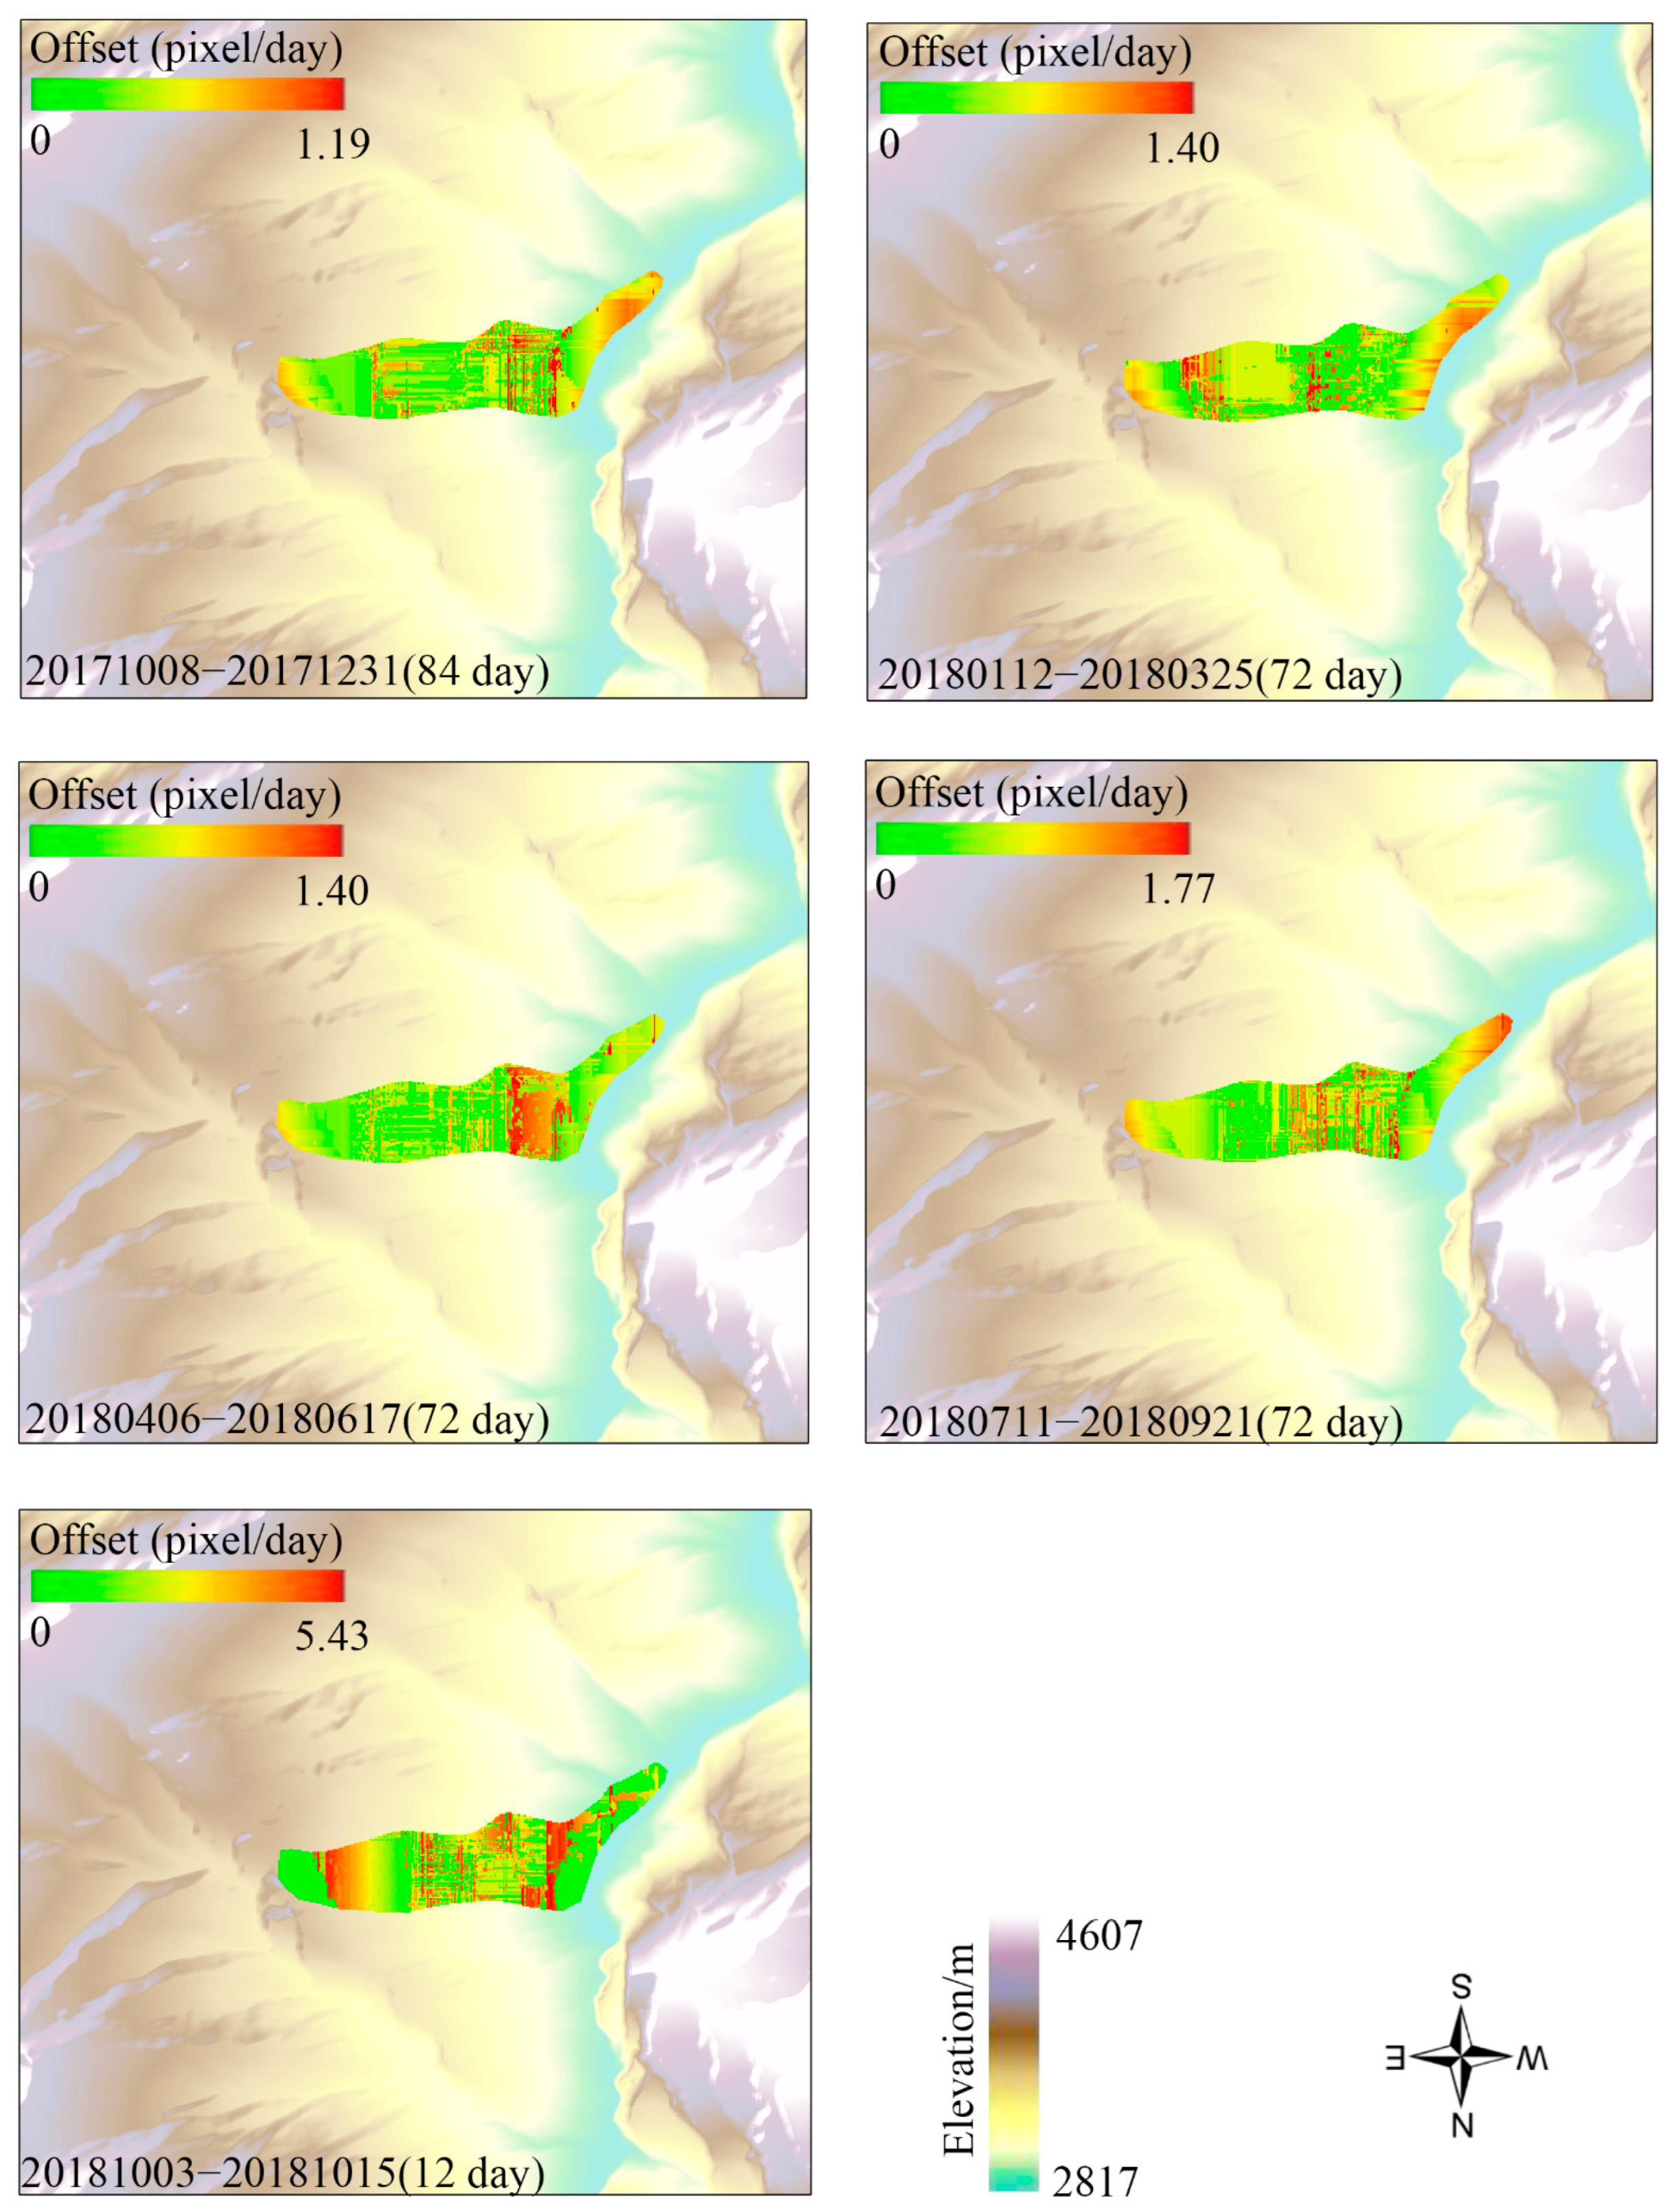
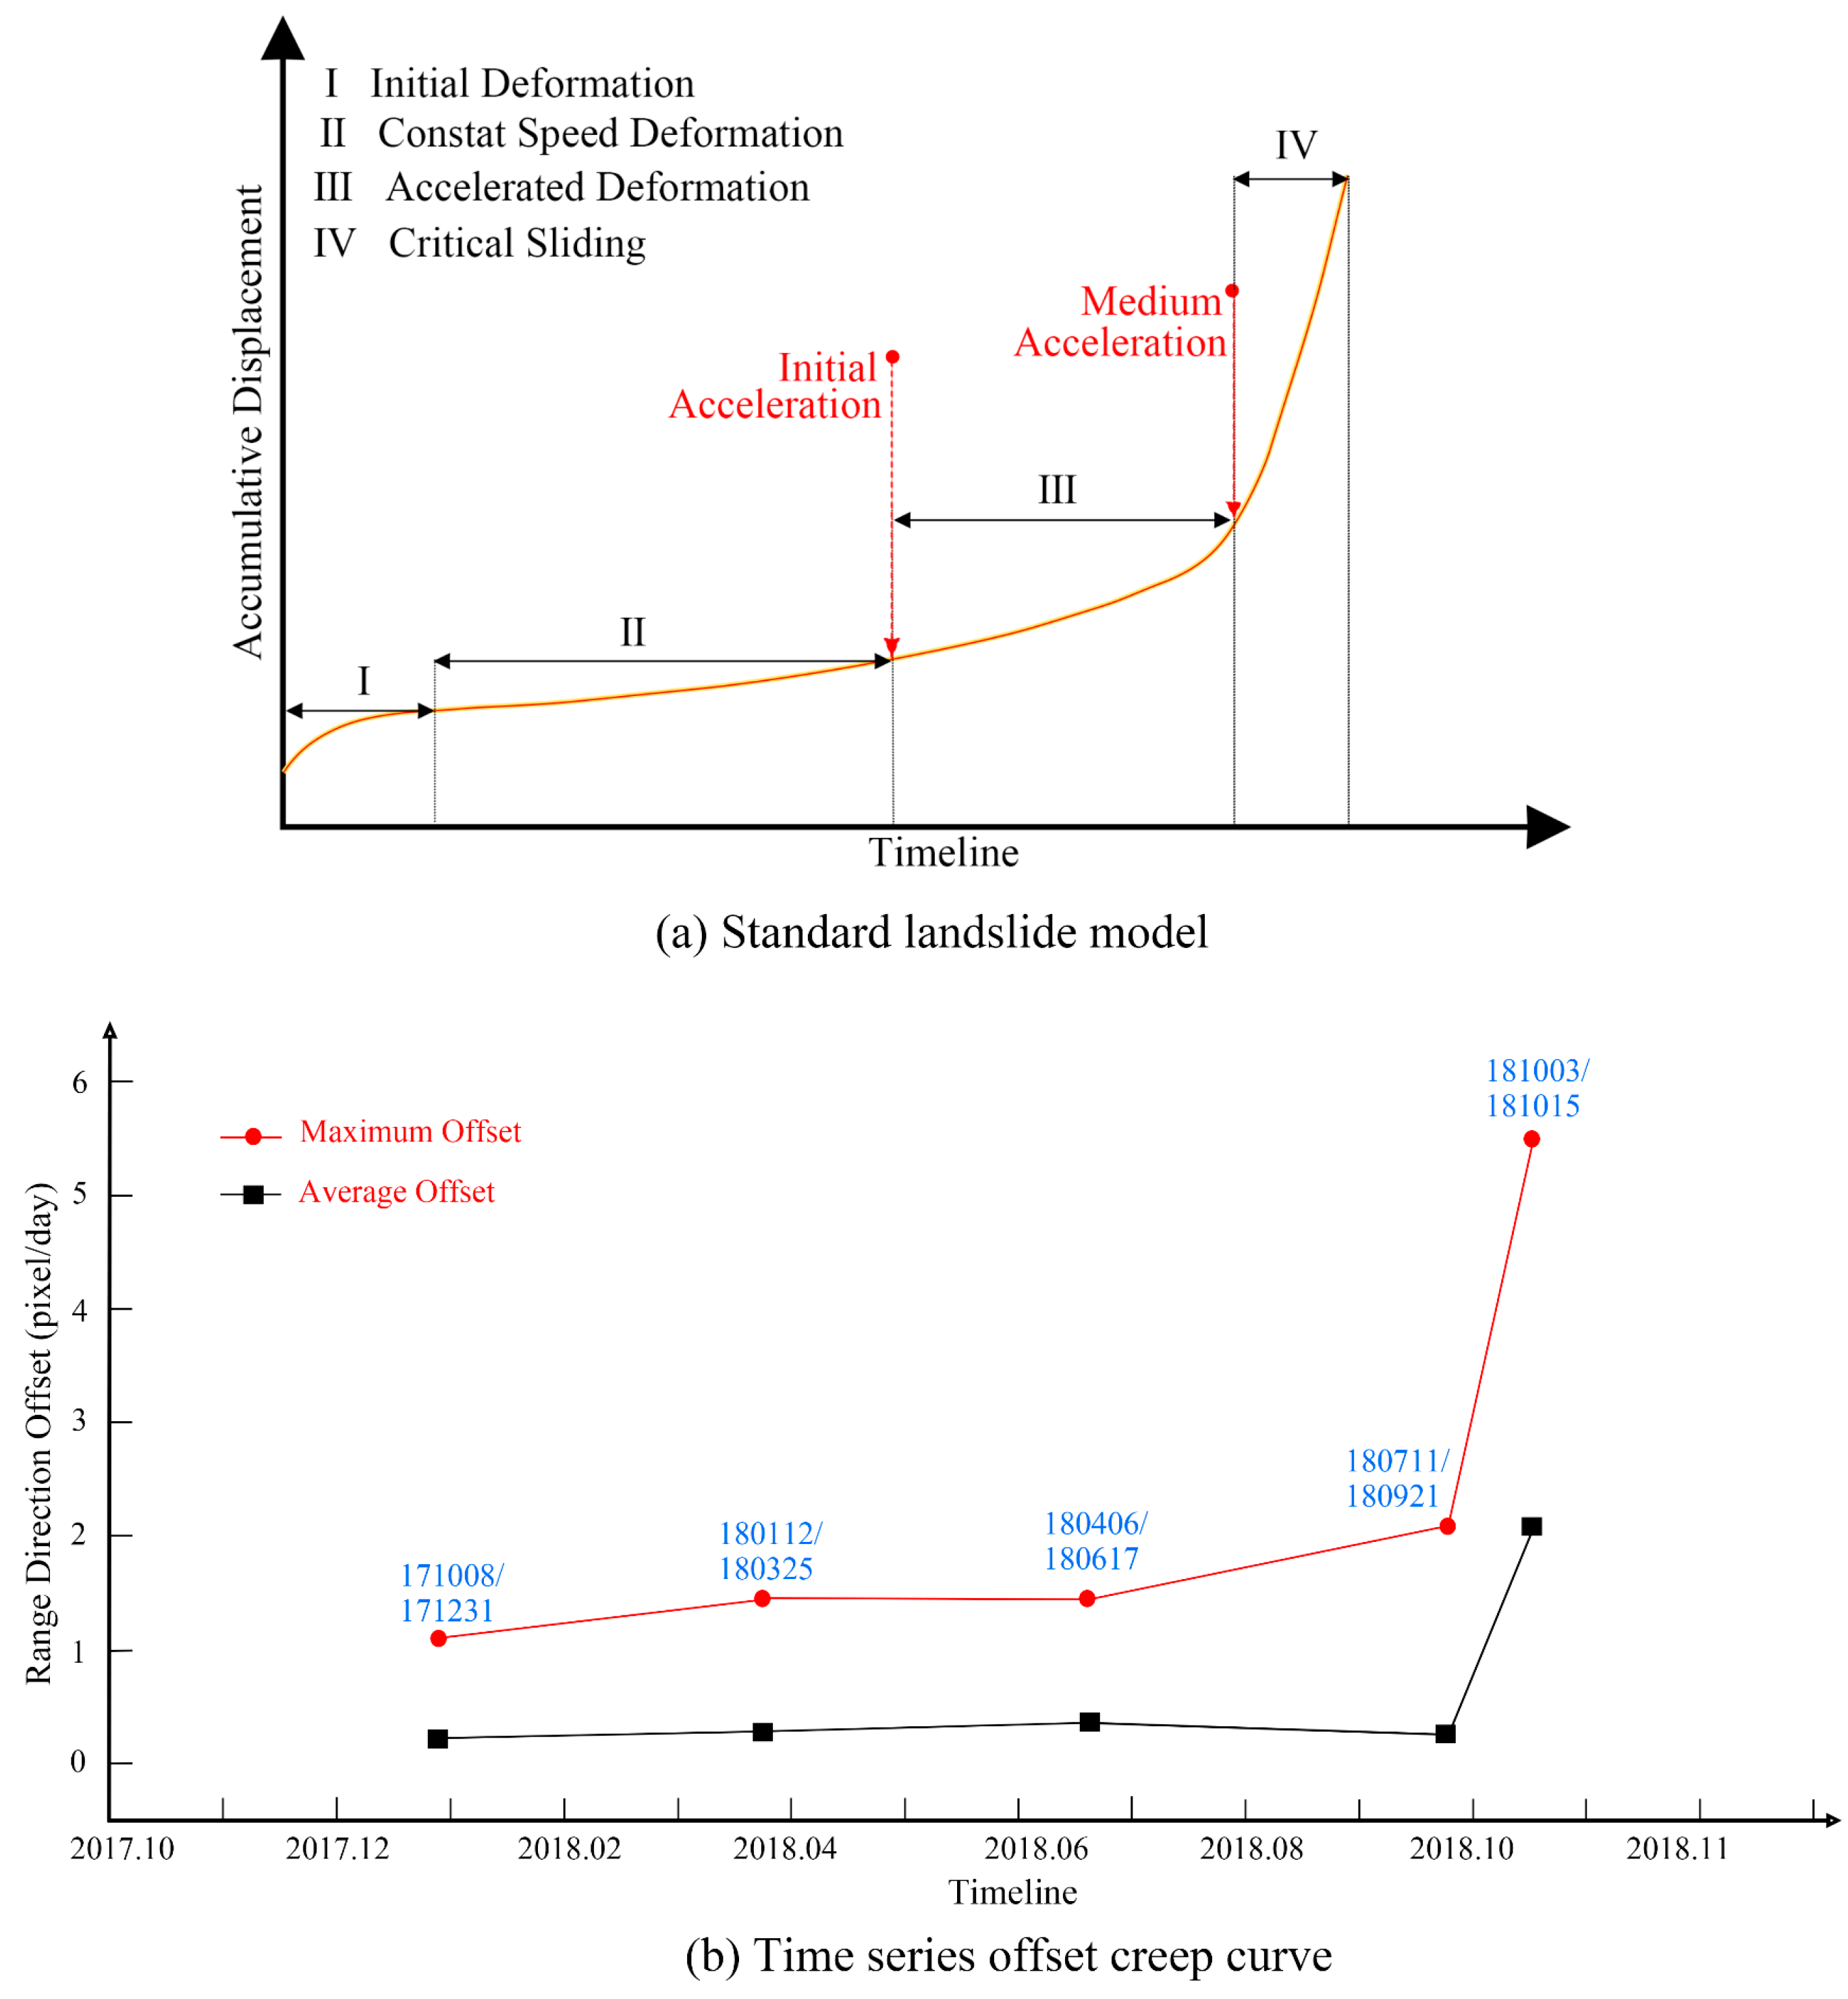
The time series displacement can effectively determine the current stage of the slope and provide a basis for landslide prediction and risk assessment. The above verifies that CNCC can be used as an accurate and effective offset calculation method. For this purpose, the images from October 2017 to October 2018 were extracted with their offsets, and all the positive or negative offsets in the distance direction were converted to positive values for the convenience of statistics. Figure 13 shows the offsets acquired under different time phases, and the results show significant variations in the offsets acquired under different time phases. Specifically, the maximum offset is 1.19 pixels per day from 8 October 2017 to 31 December 2017. The maximum offset is 1.40 pixels per day from 12 January 2018 to 25 March 2018. The maximum offset is 1.40 pixels per day from 6 April 2018 to 17 June 2018. For the period 11 July 2018 to 21 September 2018, the maximum offset is 1.77 pixels per day.
Moreover, from 3 October 2018 to 15 October 2018, the maximum offset reached 5.43 pixels daily. These data reflect significant variations in the slope displacement rate over time, which may be related to changes within the slope and the influence of external factors. Of particular note is the 15 October 2018 landslide event. By comparing the displacement data before and after this event, a significant increase in the displacement rate prior to the landslide can be observed. This finding further validates the feasibility and effectiveness of time series displacement analysis in landslide prediction. The sudden increase in displacement rate may be a precursor signal of an impending landslide, which provides an essential basis for early warning.
The relationship between the displacement rate and the timeline can be interpreted by the standard landslide model, as shown in Figure 14a, which is usually divided into four phases: initial deformation, isokinetic deformation, accelerated deformation, and critical sliding. The creep curve is a graphical representation of this relationship, where the maximum and mean curves present the landslide deformation, respectively, as shown in Figure 14b. For the maximum value curve, we can observe that the slope underwent a prolonged process of almost isotropic creep between 31 December 2017 and 17 June 2018, followed by an accelerated deformation between July and September, while critical sliding and eventual landslide was reached in October. In contrast, the mean curve matches the maximum curve for most of the period. However, during the July to September period, the mean curve is shifted less than during the isokinetic phase, which may be because the accelerated deformation of the landslide body during the July to September period resulted in some of the displacements being used to accelerate the deformation during the process, rather than the displacements occurring uniformly throughout the entire period. This may indicate a change in the internal structure or geological conditions of the landslide body during this time, resulting in an irregular increase in the displacement rate. Possible causes include changes in the water table, the release of local geological stresses, and the influence of other external factors that may lead to an uneven distribution of deformation within the landslide body. Therefore, the mean curve reflects the overall average trend, unlike the maximum local displacement values shown by the maximum curve.
The pre-landslide deformation monitoring and evolution process obtained using the proposed method are generally consistent with the results reported in reference [6]. The measured offsets at different time stages exhibit significant changes over time, in agreement with the trends presented in [6]. Both studies indicate that the maximum displacement occurs in the upper part of the slope. Moreover, the standard landslide model derived from our method closely resembles that in [6], showing an extended period of nearly uniform creep followed by accelerated deformation, eventually reaching a critical state leading to slope failure. This comparison demonstrates that the proposed method can reliably capture the temporal evolution and spatial characteristics of landslide deformation, consistent with previous satellite-based monitoring results.

4.4. Offset Validity and Noise Control

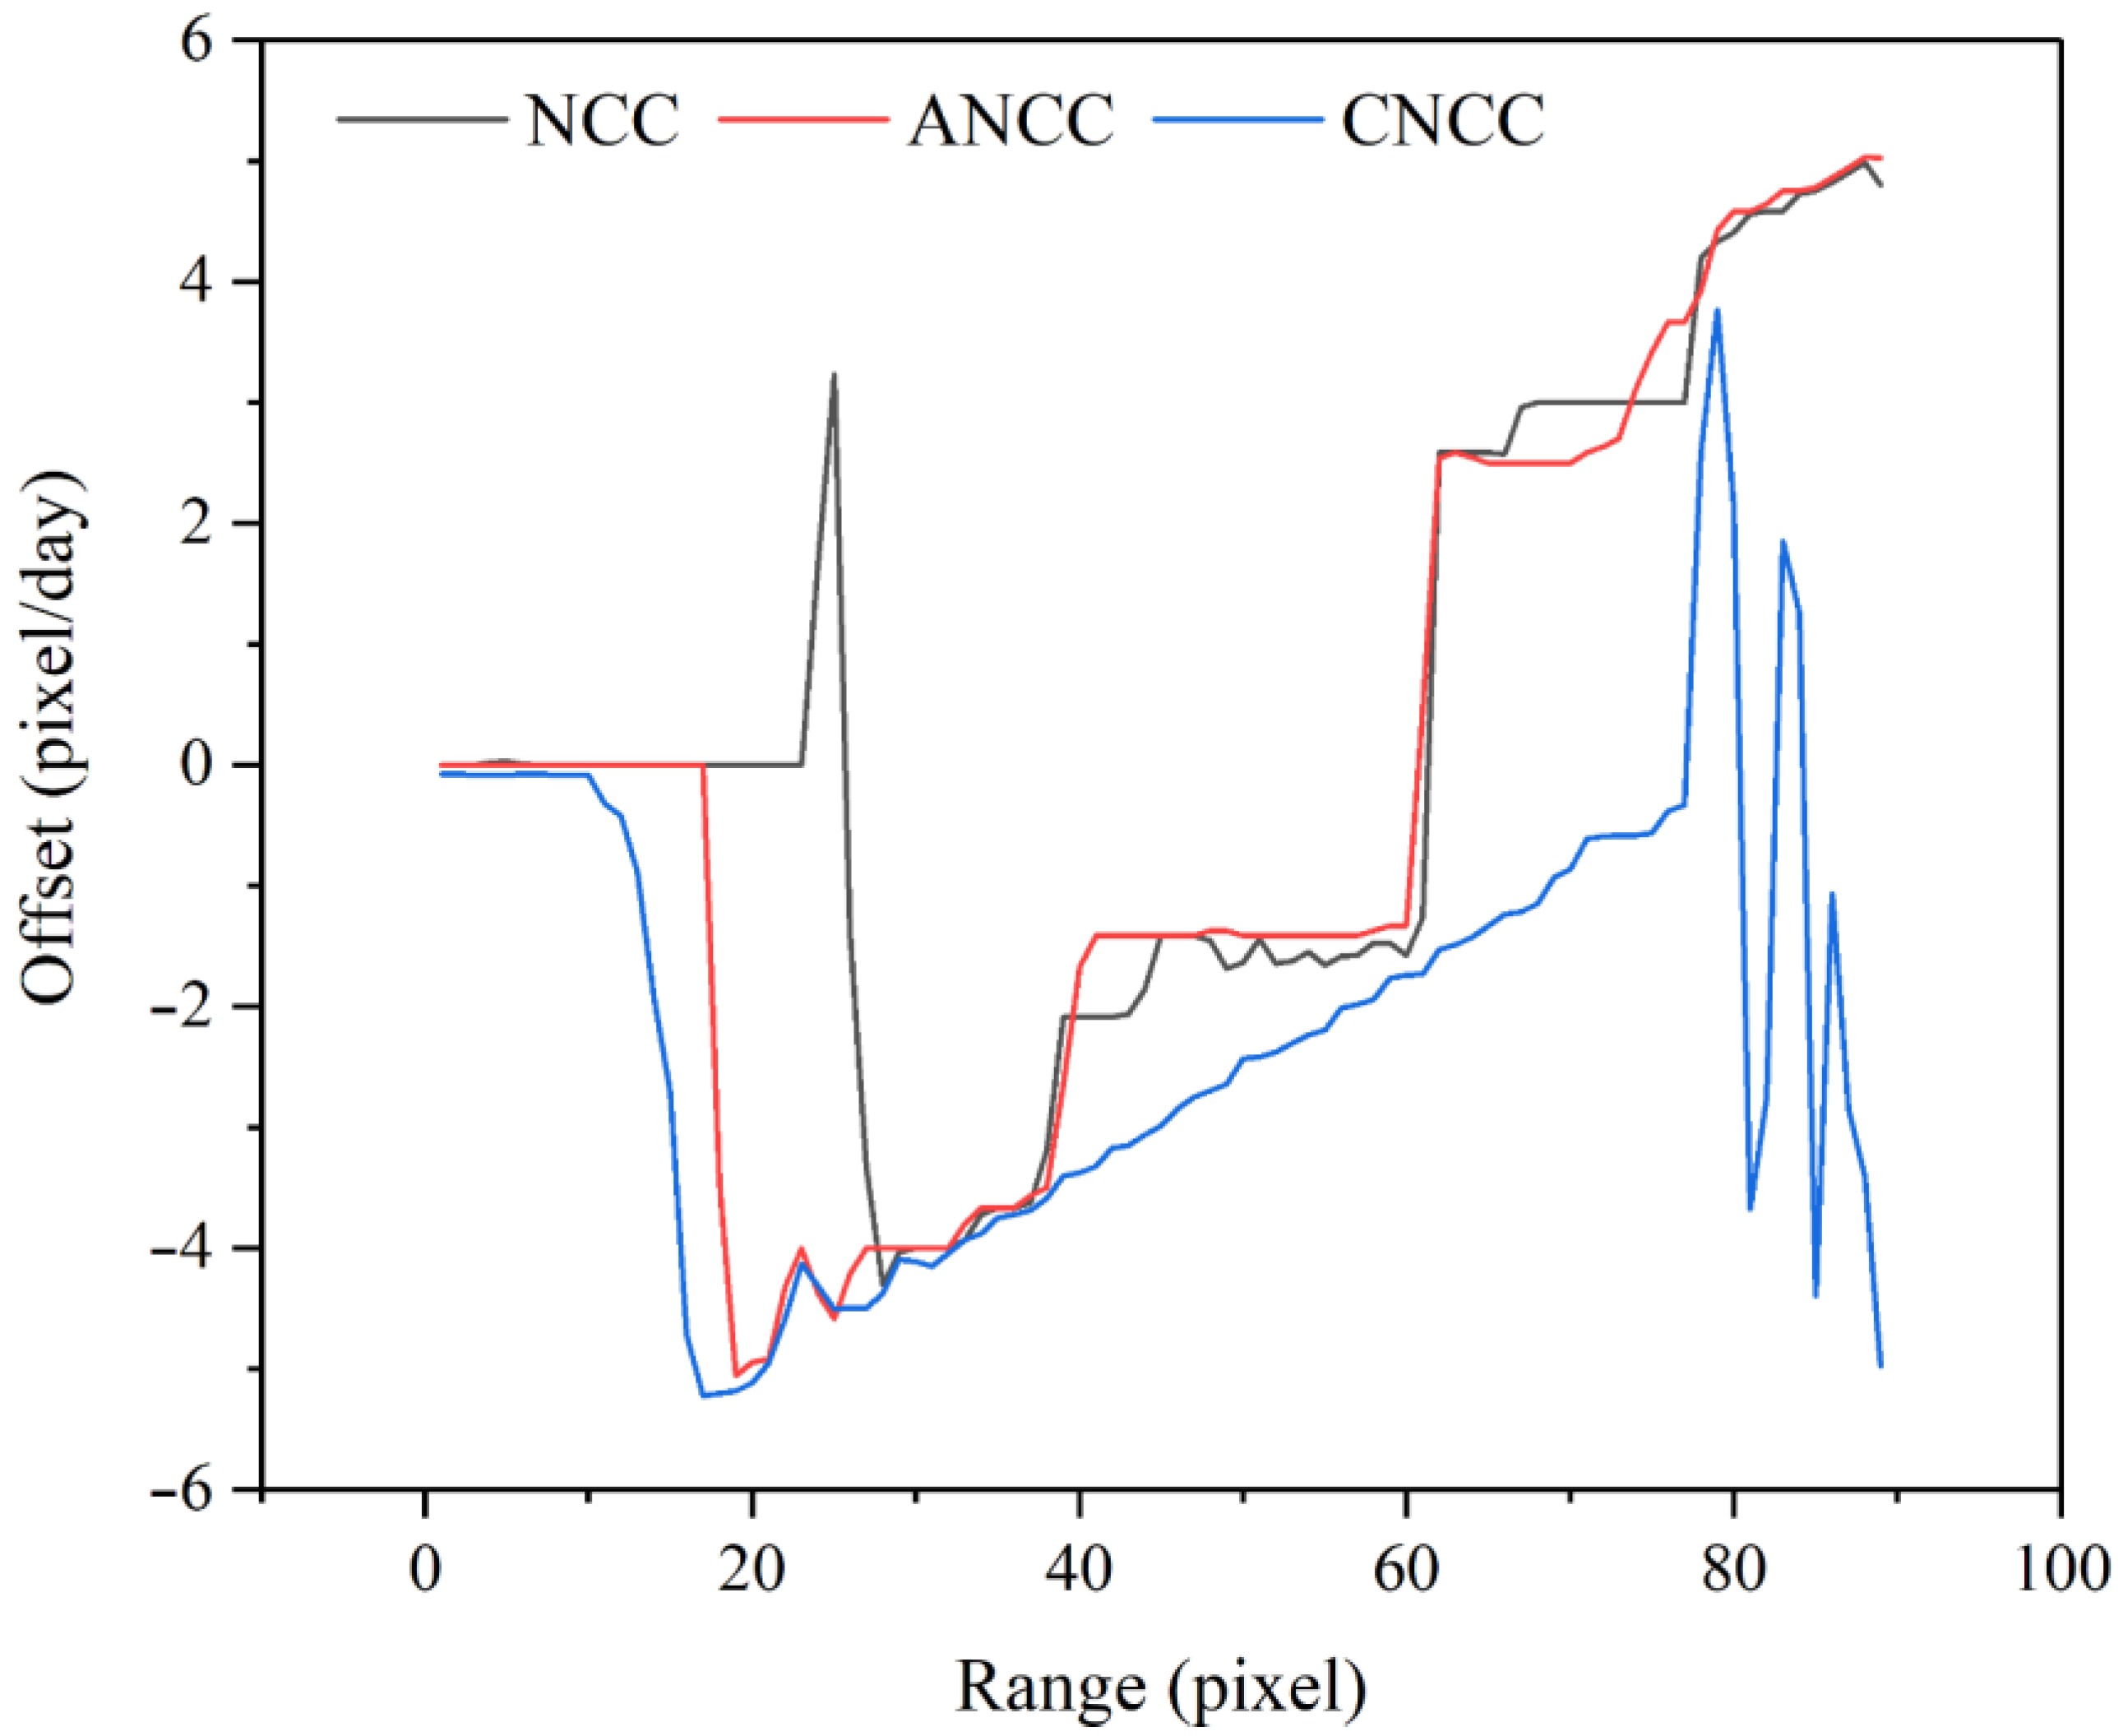
The profiles of the distance-direction offset results obtained under different methods are plotted with the connecting line from P1 to P2. As shown in Figure 15, the offsets obtained by the CNN and ANCC methods show a clear upward trend after the distance-direction pixel is 60. There is an apparent inconsistency between the offset calculation and the actual phenomenon after the distance-direction pixel is 76. For the Baige landslide, the whole is offset from west to east. The feature area or image after the landslide cannot be on the right side before the landslide. This inconsistency suggests that using the CNN and ANCC methods may produce obvious errors under certain circumstances, which can be avoided using the CNCC method proposed in this paper.
In order to ensure the accuracy of the offset results obtained by the CNCC method, the associated errors need to be effectively controlled. Firstly, the noise of SAR data acquired through ESA quickly leads to feature-matching errors, thus increasing the possibility of unreasonable matching. For this reason, when dealing with these data, we have performed multiview processing and filtering on the SAR data to control the errors from the data source. These preprocessing steps reduce the influence of noise and improve the accuracy of the data matching. Secondly, setting oversampling is also one of the necessary measures. Oversampling can further reduce the influence of noise on the offset results. By increasing the sampling rate, we can capture more detailed information, improving the matching accuracy and stability. Oversampling can significantly improve the algorithm’s robustness when dealing with highly noisy data, making the offset calculation results more reliable. In addition, the CNCC method adopts a more fine-grained matching strategy when calculating the offset. This strategy takes multiple influencing factors into account, which not only improves the accuracy of the calculation but also reduces the errors caused by noise and other disturbing factors. By optimising the above methods, the CNCC method shows higher stability and accuracy when dealing with complex terrain changes such as the Baige landslide.
In summary, CNN and ANCC methods may sometimes have obvious offset errors. In contrast, the CNCC method proposed in this paper effectively controls the errors. It ensures the accuracy of the offset results through multi-view and filtering processing, oversampling, and an acceptable matching strategy. The comparison results in Figure 15 demonstrate this, proving the superiority of the CNCC method in pixel offset tracking.

4.5. Effect of Different Matrix Windows on the Calculation of Offsets for the Method in This Paper

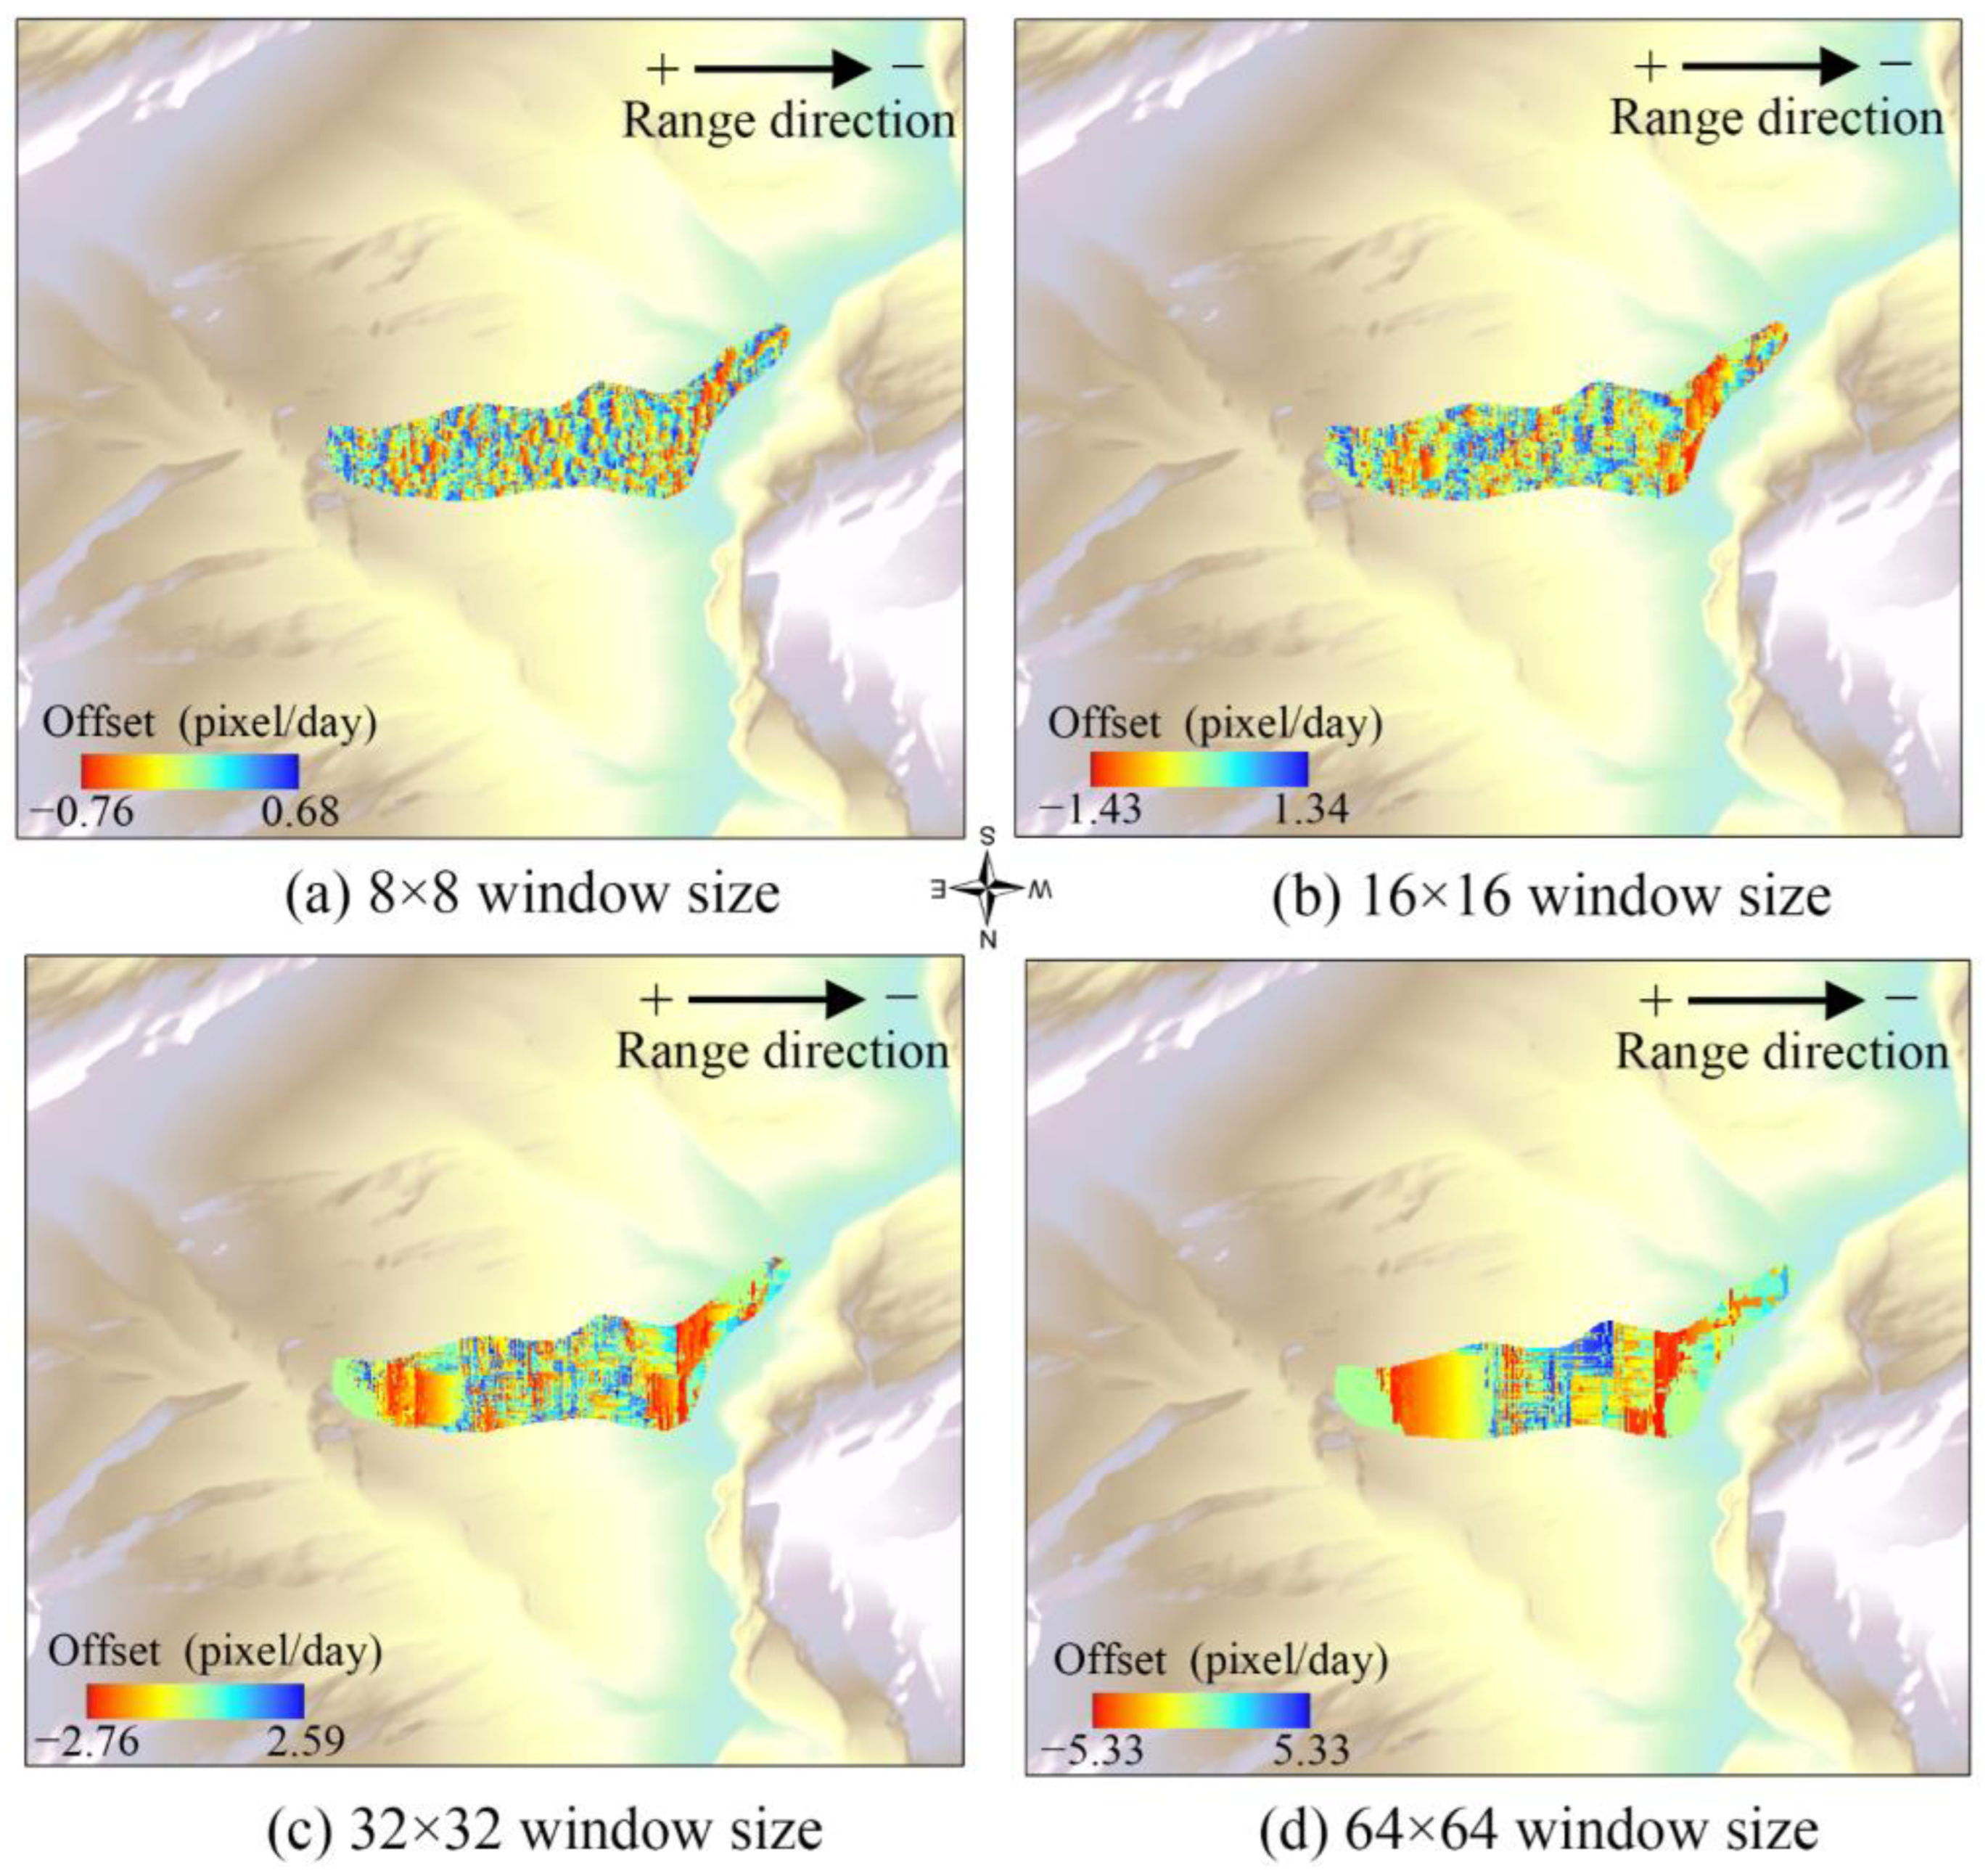
For all three methods NCC, ANCC or CNCC: In order to ensure that there is a small number of pixel points in the matrix window, all of them choose the 64 × 64 size window for the calculation to ensure the accuracy of the matching, but it is not clear how the effect of different windows on the results of the CNCC offset calculation, for this reason, we choose the 8 × 8, 16 × 16, 32 × 32, and this paper’s 64 × 64 window for the offset calculation. The calculation results are shown in Figure 16. The offset measurement accuracy increases as the window size increases. This paper explores the effect of different matrix window sizes on offset calculation. Although the choice of window size does not significantly affect the results when matching using methods such as NCC, ANCC and CNCC, in order to ensure that a sufficient number of pixel points are contained within the matrix window to improve the matching accuracy, we chose a window of 64 × 64 size for the calculation. This size is considered to be effective in balancing computational complexity and accuracy. However, for CNCC, the specific effects of different window sizes on the offset calculation results have not been clarified.
For this reason, we conducted further research and selected four different window sizes, 8 × 8, 16 × 16, 32 × 32 and 64 × 64, for offset calculation. Through experiments, we obtained the offset calculation results under different window sizes, as shown in Figure 16. When using an 8×8 window for calculation, despite the smaller window size, it is easy to be affected by local noise due to the small number of pixel points included, resulting in lower accuracy of offset calculation. At this point, the ability to capture image details is weak, and the stability of the matching results is relatively poor. As the window size increases to 16 × 16, the accuracy of the calculation results improves. This is because a more significant window can contain more pixel points, thus reducing the effect of noise to some extent. However, the window remains small, and the improvement in matching accuracy is limited. Additionally, the detail-capturing ability and stability are still unsatisfactory. The accuracy of the offset measurement is further improved when calculations are performed using a 32 × 32 window. This window size can better balance the computational complexity and accuracy while containing enough pixel points. The ability to capture image details is significantly enhanced, and the stability of the matching results is improved. The 64 × 64 window used in this paper performs best in the experiments. A larger window not only contains more pixel points, which can more effectively counteract the effect of noise, but also improves the overall accuracy of the offset calculation. At this point, the matching results have higher stability and accuracy and can more accurately reflect the actual offset of the image. By comparing and analysing the offset calculation results of different window sizes, we have come up with the following rules: small window size (8 × 8) contains fewer pixel points, is easily affected by noise, has lower calculation accuracy, has weak ability to capture image details, and has poor stability of matching results. Medium window size (16 × 16): This setting contains more pixel points, reducing noise impact and improving computational accuracy. However, the improvement is limited, and the detail-capturing ability and stability remain unsatisfactory. Larger window size (32 × 32): This contains enough pixel points, offers a better balance between computational complexity and accuracy, enhances image detail capturing ability, and improves the stability of matching results. Maximum window size (64 × 64): This contains the most pixel points, the least noise impact, the highest computational accuracy, the best stability of matching results, and accurately reflects the actual image offset visible. As the window size increases, the offset measurement accuracy gradually improves, and the stability of the matching results is also enhanced. However, this enhancement is at the cost of reducing the resolution. In practical applications, choosing a suitable window size is crucial to ensure that highly accurate offset calculation results are obtained within a reasonable range of computational complexity. The experimental results show that the 64 × 64 window provides the best overall matching accuracy in this method and is well-suited for offset calculations in relatively homogeneous landslide zones, such as the central area of the Baige landslide. However, in more complex and fractured regions, such as the trailing-edge crack belt, smaller windows (e.g., 32 × 32) may be necessary to preserve finer deformation details and avoid mismatches (see Figure 16c). This suggests that dynamically adjusting the window size based on terrain complexity can further improve the robustness and accuracy of the offset calculation.

4.6. Limitations of the Proposed Method

Although the proposed corner point variation–based improved pixel offset tracking method (CNCC) demonstrates promising results for the Baige landslide, several limitations remain that should be acknowledged. This study focuses on a single landslide case, meaning the robustness and general applicability of the method across diverse geological environments have not been empirically verified. While the theoretical principles of corner point detection and pixel offset tracking are universal, differences in surface characteristics, vegetation cover, and imaging conditions may affect the performance of the method in other regions. Therefore, the broader applicability of CNCC should be further explored in future research through applications to multiple landslide cases with varying geological and environmental settings.
Another important limitation is the lack of independent ground truth data, such as GPS or levelling measurements, which restricts rigorous quantitative validation of the derived displacement fields. To partially address this challenge, we adopted an indirect validation strategy by comparing CNCC results with those obtained from two widely used pixel offset tracking methods (NCC and ANCC) and with Differential InSAR (D-InSAR) measurements. These comparative analyses consistently demonstrated that CNCC produced more continuous and reliable displacement estimates, particularly in low-coherence regions and areas with complex terrain. However, such indirect evaluations cannot fully replace external field-based validation. To further improve the credibility of the results, we attempted to contact several researchers working in the field of pixel offset tracking to request simulated datasets for independent verification, but unfortunately, no replies were received. This highlights the difficulty of obtaining suitable reference data for large-scale landslides in remote and hazardous areas.
In addition, the evaluation of CNCC performance in this study relies primarily on qualitative comparisons and internal consistency assessments. While the pixel-level displacement patterns of selected points (e.g., P1, P2, P3) provide valuable insights, the lack of comprehensive statistical analyses such as RMSE calculations, effective matching ratios, or significance tests limits the extent to which the precision of the method can be quantitatively assessed. This limitation stems directly from the absence of high-quality reference data. It could be addressed in future studies by integrating UAV-based surveys, field campaigns, or other high-resolution datasets.
These limitations underline the need for continued research to refine the CNCC method and expand its applications. Future work will focus on applying the method to diverse landslide events and incorporating independent datasets to conduct comprehensive quantitative evaluations. Such efforts will enhance the reliability and generalizability of CNCC, making it a more robust tool for large-gradient landslide monitoring and hazard assessment.

5. Conclusions

Aiming at the limitations of the existing pixel offset tracking method for large-gradient landslides in terms of feature matching difficulty and limited promotion and application, this paper proposes an improved pixel offset tracking method based on the Corner point change, takes the sentinel data as the data source, and selects the Jinsha River Baige landslide as a typical study area to verify the effectiveness of this paper’s method, drawing the following conclusions through a series of experiments:
(1) Using VV and VH polarisation information combined with the mean value calculation method can improve the accuracy and credibility of landslide monitoring, make up for the limitations of single polarisation information, and capture the landslide extent more comprehensively. Combining information from multiple polarisation channels is significant for landslide monitoring.
(2) The choice of scale factor has an essential impact on the corner detection results. In the study of this paper, when the scale factor R is 2, the best corner point results are obtained. However, R values of 1 or 3 may lead to inaccurate corner point detection or boundary mismatch, which needs to be carefully considered in practical applications.
(3) The traditional normalized cross-correlation and adaptive window normalized cross-correlation methods and the method proposed in this paper show different results in calculating the landslide distance to offset. The method in this paper has better matching accuracy and sliding direction estimation capability compared with the traditional method, which has significant application value in landslide monitoring.
(4) By analyzing the three pixels, P1, P2 and P3, it is verified that this paper’s method exhibits high accuracy and reliability in assessing landslide displacement. This indicates that the method in this paper has certain advantages for the large-gradient landslide pixel offset tracking problem and can overcome the limitations of the feature matching difficulty and the restricted popularization and application, providing an effective solution for landslide monitoring.
In summary, the proposed CNCC method provides a cost-effective solution for monitoring large-gradient landslides using free and widely accessible Sentinel-1 data. By integrating corner point variation with normalized cross-correlation, this approach improves feature matching in heterogeneous landslide regions and enhances the accuracy of displacement estimation. In future work, the method will be further developed toward automated processing workflows to improve efficiency and scalability. At the same time, its generalizability will be assessed across different geological environments and landslide types. These efforts will support the practical application of CNCC in large-scale landslide early warning and disaster management systems.

Author Contributions

Conceptualization, D.Z. and Z.Z.; methodology, D.Z.; software, Z.Z.; validation, D.Z., Z.Z. and F.Z.; formal analysis, D.Z.; investigation, D.Z.; resources, D.Z.; data curation, Z.Z.; writing—original draft preparation, D.Z.; writing—review and editing, D.Z., Z.Z. and F.Z.; visualization, D.Z., Z.Z. and F.Z.; supervision, F.Z.; project administration, D.Z.; funding acquisition, D.Z. and Z.Z. All authors have read and agreed to the published version of the manuscript.

Funding

This research was funded by “National Natural Science Foundation of China, grant number 42161067”, “Yunnan Provincial Department of Education Science Research Fund Project, grant number 2023Y0196” and “Postgraduate Research and Innovation Foundation of Yunnan University, grant number KC-23236484”.

Data Availability Statement

The “Sentinel-1” data used in this study can be obtained at https://search.asf.alaska.edu/ (accessed on 4 August 2025). The “ALOS 30m” digital elevation model (DEM) can be accessed at https://www.eorc.jaxa.jp/ALOS/en/aw3d30/data/index.htm (accessed on 4 August 2025). The GACOS atmospheric correction data can be found at http://www.gacos.net/ (accessed on 4 August 2025). The Precise Orbit Ephemerides can be obtained at https://s1qc.asf.alaska.edu/aux_poeorb/ (accessed on 4 August 2025).

Acknowledgments

The authors are deeply thankful to the anonymous reviewers for their invaluable feedback on the manuscript. We thank the European Space Agency (ESA) for generously providing access to the Sentinel 1 data. We also extend their gratitude to the journal’s Chief Editor and Deputy Editor for their support and guidance throughout the publication process.

Conflicts of Interest

The authors declare no conflicts of interest.

References

  1. Kc, R.; Sharma, K.; Dahal, B.K.; Aryal, M.; Subedi, M. Study of the spatial distribution and the temporal trend of landslide disasters that occurred in the Nepal Himalayas from 2011 to 2020. Environ. Earth Sci. 2023, 83, 42. [Google Scholar] [CrossRef]
  2. Petley, D. Global patterns of loss of life from landslides. Geology 2012, 40, 927–930. [Google Scholar] [CrossRef]
  3. Wang, W.; Motagh, M.; Xia, Z.; Plank, S.; Li, Z.; Orynbaikyzy, A.; Zhou, C.; Roessner, S. A framework for automated landslide dating utilizing SAR-Derived Parameters Time-Series, An Enhanced Transformer Model, and Dynamic Thresholding. Int. J. Appl. Earth Obs. Geoinform. 2024, 129, 103795. [Google Scholar] [CrossRef]
  4. Xu, Y.; Schulz, W.H.; Lu, Z.; Kim, J.; Baxstrom, K. Geologic controls of slow-moving landslides near the US West Coast. Landslides 2021, 18, 3353–3365. [Google Scholar] [CrossRef]
  5. Zhou, D.; Zhao, Z.; Xi, W.; Zhao, X.; Chao, J. New method for landslide susceptibility evaluation in alpine valley regions that considers the suitability of InSAR monitoring and introduces deformation rate grading. Geo-Spat. Inf. Sci. 2025, 28, 565–588. [Google Scholar] [CrossRef]
  6. Jia, H.; Wang, Y.; Ge, D.; Deng, Y.; Wang, R. Improved offset tracking for predisaster deformation monitoring of the 2018 Jinsha River landslide (Tibet, China). Remote Sens. Environ. 2020, 247, 111899. [Google Scholar] [CrossRef]
  7. Cai, J.; Zhang, L.; Dong, J.; Wang, C.; Liao, M. Polarimetric SAR pixel offset tracking for large-gradient landslide displacement mapping. Int. J. Appl. Earth Obs. Geoinform. 2022, 112, 102867. [Google Scholar] [CrossRef]
  8. Dai, K.; Feng, Y.; Zhuo, G.; Tie, Y.; Deng, J.; Balz, T.; Li, Z. Applicability Analysis of Potential Landslide Identification by InSAR in Alpine-Canyon Terrain—Case Study on Yalong River. IEEE J. Sel. Top. Appl. Earth Observ. Remote Sens. 2022, 15, 2110–2118. [Google Scholar] [CrossRef]
  9. Li, M.; Zhang, L.; Ding, C.; Li, W.; Luo, H.; Liao, M.; Xu, Q. Retrieval of historical surface displacements of the Baige landslide from time-series SAR observations for retrospective analysis of the collapse event. Remote Sens. Environ. 2020, 240, 111695. [Google Scholar] [CrossRef]
  10. Wang, L.; Deng, K.; Zheng, M. Research on ground deformation monitoring method in mining areas using the probability integral model fusion D-InSAR, sub-band InSAR and offset-tracking. Int. J. Appl. Earth Obs. Geoinform. 2020, 85, 101981. [Google Scholar] [CrossRef]
  11. Xia, Z.; Motagh, M.; Li, T.; Peng, M.; Roessner, S. A methodology to characterize 4D post-failure slope instability dynamics using remote sensing measurements: A case study of the Aniangzhai landslide in Sichuan, Southwest China. ISPRS-J. Photogramm. Remote Sens. 2023, 196, 402–414. [Google Scholar] [CrossRef]
  12. Wang, Y.; Dong, J.; Zhang, L.; Deng, S.; Zhang, G.; Liao, M.; Gong, J. Automatic detection and update of landslide inventory before and after impoundments at the Lianghekou reservoir using Sentinel-1 InSAR. Int. J. Appl. Earth Obs. Geoinform. 2023, 118, 103224. [Google Scholar] [CrossRef]
  13. Zhao, C.; Lu, Z.; Zhang, Q.; de la Fuente, J. Large-area landslide detection and monitoring with ALOS/PALSAR imagery data over Northern California and Southern Oregon, USA. Remote Sens. Environ. 2012, 124, 348–359. [Google Scholar] [CrossRef]
  14. Cai, J.; Wang, C.; Mao, X.; Wang, Q. An Adaptive Offset Tracking Method with SAR Images for Landslide Displacement Monitoring. Remote Sens. 2017, 9, 830. [Google Scholar] [CrossRef]
  15. Strozzi, T.; Luckman, A.; Murray, T.; Wegmuller, U.; Werner, C.L. Glacier motion estimation using SAR offset-tracking procedures. IEEE Trans. Geosci. Remote Sens. 2020, 40, 2384–2391. [Google Scholar] [CrossRef]
  16. Du, S.; Mallorqui, J.J.; Zhao, F. Patch-Like Reduction (PLR): A SAR Offset Tracking amplitude filter for deformation monitoring. Int. J. Appl. Earth Obs. Geoinform. 2022, 113, 102976. [Google Scholar] [CrossRef]
  17. Niu, J.; Yang, Z.; Zhang, L.; Lu, J.; Xiang, Y.; Tian, Z.; Guo, S. Reducing patch-like Errors in SAR offset tracking displacements using logarithmic transformation and a weighted NCC algorithm. Remote Sens. Lett. 2023, 14, 357–368. [Google Scholar] [CrossRef]
  18. Wang, C.; Mao, X.; Wang, Q. Landslide Displacement Monitoring by a Fully Polarimetric SAR Offset Tracking Method. Remote Sens. 2016, 8, 624. [Google Scholar] [CrossRef]
  19. Singleton, A.; Li, Z.; Hoey, T.; Muller, J.-P. Evaluating sub-pixel offset techniques as an alternative to D-InSAR for monitoring episodic landslide movements in vegetated terrain. Remote Sens. Environ. 2014, 147, 133–144. [Google Scholar] [CrossRef]
  20. Fan, X.; Xu, Q.; Alonso-Rodriguez, A.; Subramanian, S.S.; Li, W.; Zheng, G.; Dong, X.; Huang, R. Successive landsliding and damming of the Jinsha River in eastern Tibet, China: Prime investigation, early warning, and emergency response. Landslides 2019, 16, 1003–1020. [Google Scholar] [CrossRef]
  21. Ouyang, C.; An, H.; Zhou, S.; Wang, Z.; Su, P.; Wang, D.; Cheng, D.; She, J. Insights from the failure and dynamic characteristics of two sequential landslides at Baige village along the Jinsha River, China. Landslides 2019, 16, 1397–1414. [Google Scholar] [CrossRef]
  22. Yang, W.; Wang, Y.; Sun, S.; Wang, Y.; Ma, C. Using Sentinel-2 time series to detect slope movement before the Jinsha River landslide. Landslides 2019, 16, 1313–1324. [Google Scholar] [CrossRef]
  23. Zitová, B.; Flusser, J. Image registration methods: A survey. Image Vis. Comput. 2003, 21, 977–1000. [Google Scholar] [CrossRef]
  24. Li, J.; Allinson, N.M. A comprehensive review of current local features for computer vision. Neurocomputing. 2008, 71, 1771–1787. [Google Scholar] [CrossRef]
  25. Sánchez, J.; Monzón, N.; Salgado, A. An Analysis and Implementation of the Harris Corner Detector. Image Process. Line 2018, 8, 305–328. [Google Scholar]
  26. Zeng, Z.; Jiang, Z.; Chen, Q.; He, P. An Improved Corner Detection Algorithm Based on Harris. Adv. Eng. Forum 2012, 6–7, 717–721. [Google Scholar] [CrossRef]
  27. Dellinger, F.; Delon, J.; Gousseau, Y.; Michel, J.; Tupin, F. SAR-SIFT: A SIFT-Like Algorithm for SAR Images. IEEE Trans. Geosci. Remote Sens. 2015, 53, 453–466. [Google Scholar] [CrossRef]
  28. Ma, W.; Wen, Z.; Wu, Y.; Jiao, L.; Gong, M.; Zheng, Y.; Liu, L. Remote Sensing Image Registration With Modified SIFT and Enhanced Feature Matching. IEEE Geosci. Remote Sens. Lett. 2017, 14, 3–7. [Google Scholar] [CrossRef]
  29. Harris, C.; Stephens, M. A Combined Corner and Edge Detector. In Proceedings of the 4th Alvey Vision Conference, Manchester, UK, 31 August–2 September 1988; pp. 147–151. [Google Scholar]
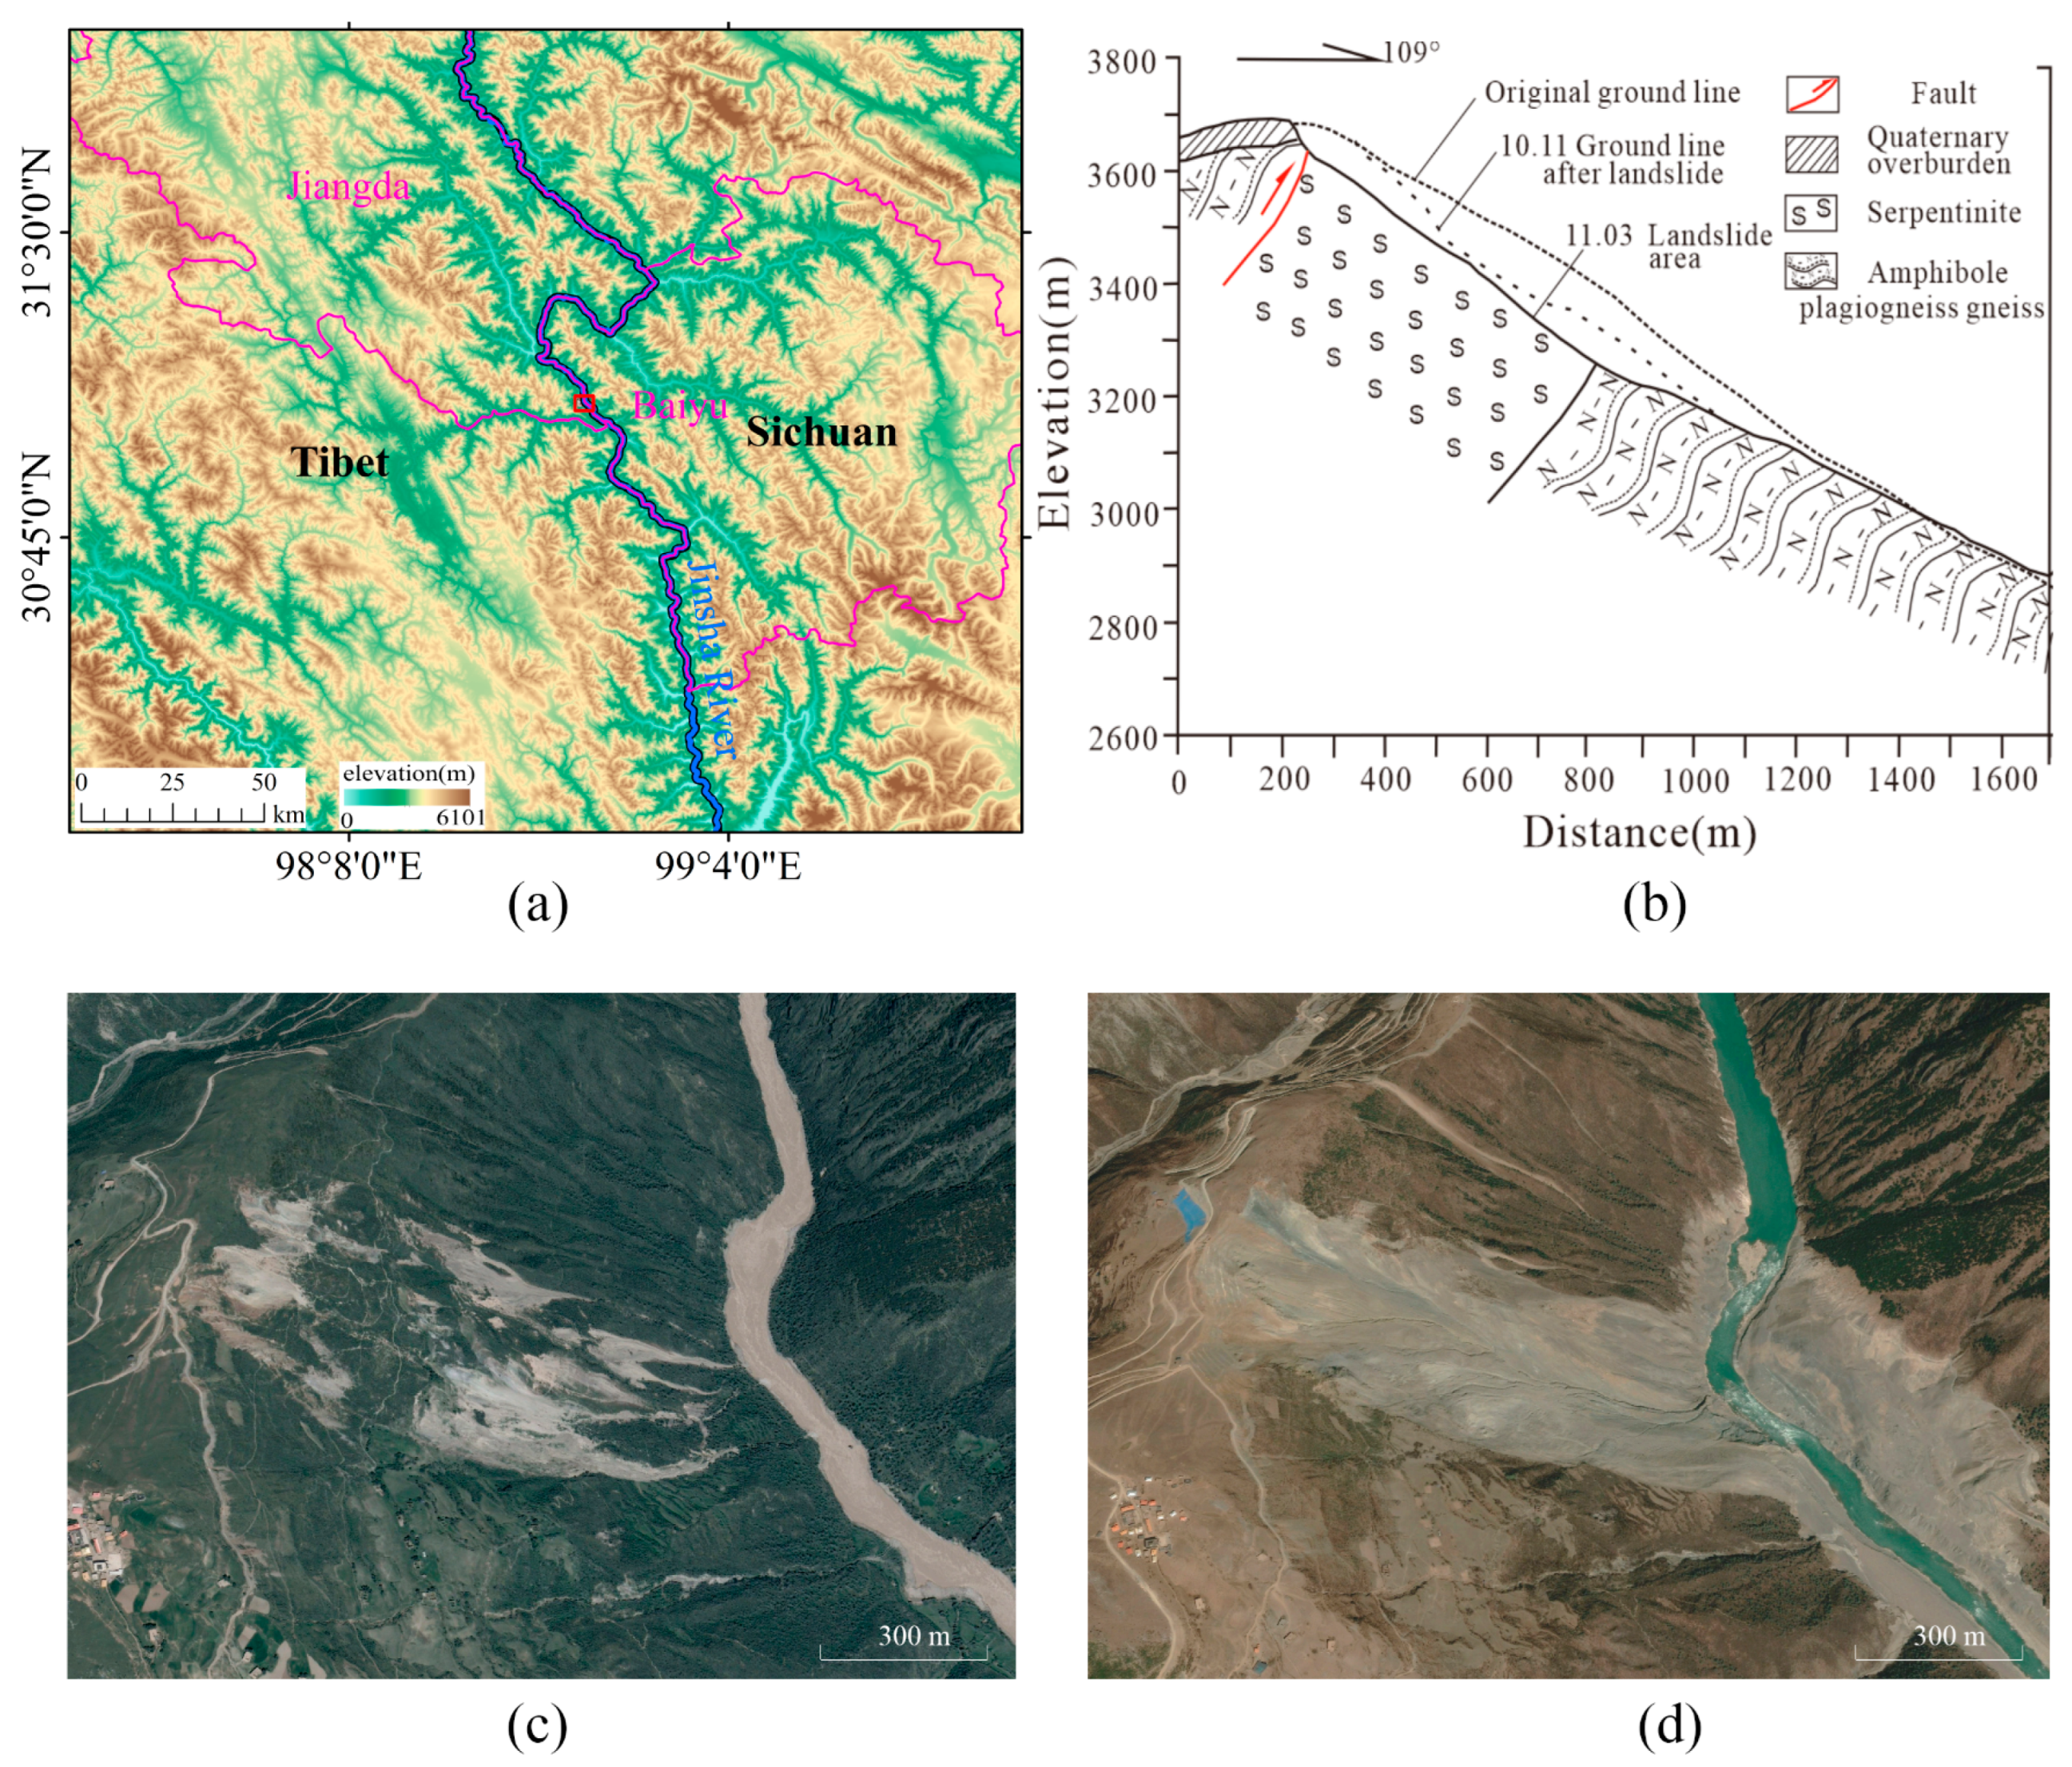
Figure 1. Overview of the study area. (a) shows the location of the study area, with the red box showing the Baig landslide area and the corresponding data overlaid on the SRTM (Shuttle Radar Topography Mission) 30 m DEM (Digital Elevation Model). (b) shows the geological profile (adapted from literature [9]). (c) Moreover, (d) are optical image maps before and after the landslide.
Remotesensing 17 03292 g001
Figure 2. Schematic diagram of traditional normalized cross-correlation tracking method.
Remotesensing 17 03292 g002
Figure 3. Schematic diagram of adaptive normalized cross-correlation tracking method.
Remotesensing 17 03292 g003
Figure 4. Schematic diagram of pixel change after actual landslide. (a) Illustration of newly exposed areas after the landslide, where the green areas represent ground surfaces newly exposed due to the landslide; (b) Pre- and post-event SAR image change map of the Baige landslide along the Jinsha River, where the green areas indicate newly exposed regions after the landslide, and the yellow areas represent new regions formed by the accumulation of pre-slide materials.
Remotesensing 17 03292 g004
Figure 5. Schematic diagram of corner change normalized cross-correlation tracking method.
Remotesensing 17 03292 g005
Figure 6. CNCC technology roadmap. Where M/S is an abbreviation for Master/Slave.
Remotesensing 17 03292 g006
Figure 7. Calculation diagram of a single pixel.
Remotesensing 17 03292 g007
Figure 8. Polarisation information and coherence to extract landslide extent maps.
Remotesensing 17 03292 g008
Figure 9. Single pixel corner detection and feature region extraction. The red frame indicates the range of corner points extracted under the set threshold.
Remotesensing 17 03292 g009
Figure 10. A plot of offset results was obtained using different methods.
Remotesensing 17 03292 g010
Figure 11. Plot of matching results under different methods for three pixels. (Red areas are substituted for feature areas, and blue boxes indicate the location of the pre-slip area after the landslide).
Remotesensing 17 03292 g011
Figure 12. D-InSAR deformation rate results.
Remotesensing 17 03292 g012
Figure 13. The plot of the time series offset results.
Remotesensing 17 03292 g013
Figure 14. Time Offset Pattern Chart.
Remotesensing 17 03292 g014
Figure 15. Offset map of P1 to P2 line profile.
Remotesensing 17 03292 g015
Figure 16. Offset results obtained for different window sizes.
Remotesensing 17 03292 g016
Table 1. Parameter information of the SAR datasets.
ParameterValue
Radar BandC-band
OrbitAscending
Imaging ModeIW
Polarization ModeVV, VH
Incidence Angle (°)36.62
Range Pixel6.99
Azimuth Pixel13.99
Pre-landslide Image Date3 October 2018
Post-landslide Image Date15 October 2018
Additional Images for Pre-disaster Monitoring8 scenes from October 2017 to September 2018
Disclaimer/Publisher’s Note: The statements, opinions and data contained in all publications are solely those of the individual author(s) and contributor(s) and not of MDPI and/or the editor(s). MDPI and/or the editor(s) disclaim responsibility for any injury to people or property resulting from any ideas, methods, instructions or products referred to in the content.