Article

Semantic Segmentation Method of Residential Areas in Remote Sensing Images Based on Cross-Attention Mechanism

1
College of Information Science and Engineering, Northeastern University, Shenyang 110819, China
2
School of Information Science and Engineering, Shenyang University of Technology, Shenyang 110870, China
3
College of Interdisciplinary Sciences, Liaoning University of Technology, Jinzhou 121001, China
4
SIASUN Robot & Automation Co., Ltd., Shenyang 110168, China
5
Faculty of Robot Science, Engineering Northeastern University, Shenyang 110169, China
*
Author to whom correspondence should be addressed.
These authors contributed equally to this work.
Remote Sens. 2025, 17(18), 3253; https://doi.org/10.3390/rs17183253
Submission received: 8 August 2025 / Revised: 13 September 2025 / Accepted: 19 September 2025 / Published: 20 September 2025

Abstract

Highlights

What are the main findings?
  • A novel CrossAtt-UNet architecture is proposed, integrating a cross-attention module to capture cross-level dependencies and enhance feature interactions in remote sensing semantic segmentation.
  • Experimental results on the Urban Residential Semantic Segmentation Dataset (URSSD) demonstrate superior accuracy (95.47%), mIoU (89.80%), F1-score (94.63%) and robustness compared with mainstream segmentation networks.
What is the implication of the main finding?
  • The proposed method significantly improves structural coherence, boundary recognition, and generalization ability, enabling reliable extraction of complex urban features in high-resolution remote sensing images.
  • CrossAtt-UNet shows strong adaptability across tasks, as validated by its performance in concrete damage detection, highlighting its potential for urban planning, disaster monitoring, and infrastructure assessment.

Abstract

Aiming at common problems such as high classification error rate, environmental noise interference, regional discontinuity, and structural absence in the semantic segmentation of residential areas, this paper proposes a CrossAtt-UNet architecture based on the Cross Attention mechanism. This network is based on the Att-UNet framework and innovatively proposes a Cross Attention module. Cross-level information features are extracted by establishing cross-associations on the feature map’s horizontal and vertical coordinate axes. It ensures the efficient utilization of computing resources and significantly improves the accuracy of semantic segmentation and the adjacency relationship of the target region. After many experimental verifications, this network architecture performs outstandingly on the semantic segmentation dataset of living areas, with an accuracy of 95.47%, an mAP (mean average precision) of 94.57%, an mIoU (mean intersection over union) of 89.80%, an F1-score of 94.63%, a train_loss (training loss) of 0.0878, and a val_loss (validation loss) of 0.1459. Its segmentation performance, area integrity, and edge recognition accuracy are higher than those of mainstream networks. The concrete damage detection experiment further indicates that this network has good generalization ability, demonstrating stable performance and robustness.

1. Introduction

With the advancement of remote sensing science and satellite observation technology, the urbanization process has developed rapidly, and the distribution types of the pattern of residential areas have become increasingly complex and diversified [1,2]. Based on this background, the high-precision identification and semantic segmentation tasks of urban residential areas play a core role in improving the quality of urban planning and management efficiency [3]. Thanks to the precise retention of spatial details and the efficient capture of semantic features, UNet can obtain high-precision spatial pattern features and systematic classification of ground objects. It can effectively support the definition of urban functional areas, building identification, monitoring of land use changes, and analysis of the urban growth process, and it has become an irreplaceable tool for intelligent city management. Significant breakthroughs have recently been made in the semantic segmentation of remote-sensing images. Zhu, Z., et al. develop a network structure using an axial Transformer and a U-shaped hierarchical codec for feature extraction of remote sensing images. Introducing the axial attention mechanism significantly enhances this network’s global feature capture ability and can significantly reduce the interference caused by irrelevant features [4]. Jonnala, N., et al. propose an efficient semantic segmentation scheme integrating the deep interaction mechanism and the attention module to improve the segmentation speed of water areas in aerial images. This study adopted UNet as the basic network to implement spatial feature calibration and cross-scale multi-dimensional feature integration, achieving a significant breakthrough in the positioning accuracy of water edges [5]. Wang, X., et al. propose an Adaptive Feature Fusion UNet structure to enhance the semantic segmentation ability of remote sensing data. This model consists of a dense jump connection mechanism, an adaptive feature fusion layer, a channel attention convolution component, and a spatial attention structure, which complete the elastic fusion of cross-layer features and the fine modeling of channel space interaction [6]. For the change detection of heterogeneous remote sensing images, Lv, Z., et al. propose a streamlined and efficient deep learning scheme using typical UNet models. This method utilizes the dual-phase image block stitching technology to achieve shared modeling of the feature space. Adding multi-scale convolution components to the UNet backbone makes it compatible with various scales and geometric structures of surface targets. The focus loss and dice loss are further integrated into a combined loss function, thereby correcting the imbalance of the sample distribution [7]. Although high-resolution remote sensing images can display rich spatial textures and diverse ground object details in image segmentation and have considerable development potential, they face many complex challenges. In image semantic segmentation, urban regional targets have significant multi-classiness and highly complex spatial relationships and are generally accompanied by noise, shadows, and occlusion phenomena [8]. It has seriously weakened the practical effect of conventional image analysis methods and shallow networks under challenging scenarios. The ground targets for urban residences often exhibit multi-dimensional spatial forms and mixed feature attributes. It is difficult to fully present their geometric forms and spatial distribution characteristics using a single image feature, leading to insufficient semantic coverage and incomplete structural restoration in existing schemes. Such phenomena become more obvious when dealing with the recognition problems of building targets with multiple scales, unclear boundaries, and high occlusion.
To solve the above problems, this paper labels the remote sensing image Dataset (Urban Residential Semantic Segmentation Dataset, URSSD) used for semantic segmenting residential areas. This paper proposes a CrossAtt-UNet architecture. This network employs the Cross Attention module. With the help of this module, multi-level feature interaction between pixels and their row and column neighborhoods is supported, enhancing the coverage of spatial information and compressing the computational load. Simultaneously, the quality of feature extraction and the cross-pixel dependency relationship are improved. The comprehensive accuracy rate of semantic segmentation and the continuity of the target region have been improved. This paper realizes the efficient and precise extraction of urban spatial information, significantly improving the efficient and precise parsing performance of semantic elements of urban life scenes in remote sensing images and providing technical support and practical guidance for intelligent decision-making in fields such as urban spatial planning, disaster monitoring, and emergency management.
The main contributions of this paper can be summarized as follows:
The ISPRS Vaihingen dataset is re-annotated as URSSD.
The CrossAtt-UNet architecture based on Att-UNet is proposed. This network remembers the Cross Attention module to enhance spatial information coverage and compresses the computational load.
The CrossAtt-UNet is evaluated on the semantic segmentation dataset of living areas, with an accuracy of 95.47%, an mAP of 94.57%, an mIoU of 89.80%, an F1-score of 94.63%, a train_loss of 0.0878, and a val_loss of 0.1459.
The paper demonstrates that the proposed model can also be used in concrete damage detection, demonstrating good generalization ability and robustness.
This paper is organized as follows. Section 2 expounds on the problems to be studied in the current semantic segmentation of living areas and labels the dataset of semantic segmentation of living areas. Section 3 proposes a semantic segmentation of remote sensing living areas based on CrossAtt-UNet and elaborates on the loss function and evaluation index. Section 4 analyzes the test results of mainstream semantic segmentation network methods for semantic segmenting living areas and conducts generalization experiments on CrossAtt-UNet.

2. Materials and Methods

2.1. Extraction of Living Area Information

2.1.1. Image Segmentation Method for Residential Areas

The core objective of semantic segmentation of residential areas lies in accurately identifying and outlining the external boundaries of various ground features in urban residential areas from high-resolution remote sensing images with complex structures and variable backgrounds, providing crucial basic data support for subsequent spatial information analysis, urban functional zoning, and ecological environment monitoring, etc. [9,10,11,12,13]. In the current research and application practice, as shown in Figure 1, the image segmentation task can be divided into instance and semantic segmentation methods. Semantic segmentation focuses on assigning category labels to each pixel, while instance segmentation marks the category of pixels and distinguishes different individuals under the same category. The resolution of the FCNF feature map gradually decreases, resulting in the loss of detailed information and a lack of integration of context and details [14]. Small object features may be lost after extreme downsampling in the U-Net [15]. Compared with the U-Net model, SegNet has lower segmentation accuracy in complex scenes, especially performing poorly in the processing of object boundaries.
Instance segmentation not only requires semantic classification of pixels but also the distinction between different instances of the same category. The Mask R-CNN has high computational complexity and limited performance in segmenting small targets [16]. YOLACT has poor occlusion handling between instances and is sensitive to small targets [17]. The PANet model is highly complex and prone to overfitting. At the operational level of image structure analysis in living and residential areas, this task also requires precise segmentation of the spatial range where it is located. The model must have efficient feature extraction, context construction, and edge awareness capabilities [18].

2.1.2. Semantic Segmentation Dataset of Residential Areas

In order to achieve precise positioning and automatic identification of urban residential areas, as shown in Figure 2, this paper re-annotates the ISPRS Vaihingen dataset as URSSD. It helps the network converge more stably in scenarios involving regression or normalized outputs, thereby enhancing the numerical stability of computation. Although different datasets may contain varying numbers of categories, mapping their labels to the interval [0, 1] facilitates a more consistent and unified processing approach.
Processing the pixel data of the labeled images using the normalization technique can significantly improve the following capabilities: (1). Enhancing the semantic segmentation ability of the network. (2). Improving the accuracy and robustness of the semantic segmentation algorithm when facing practical tasks. (3). Optimizing the numerical stability in the training stage. (4). The input feature distribution is relatively concentrated, achieving faster model convergence. (5). Promoting the initialization and regularization implementation of weight parameters.
Label the image pixel normalization description. Let the image be I , an image with a height of H , a width of W , and a number of channels of C . The original pixel values are I ( c , x , y ) [ 0 , 255 ] . For RGB images, C = 3 , and for grayscale images, C = 1 . Normalize the image to [ 0 , 1 ] using the following linear normalization formula:
I n o r m ( x , y , c ) = ( I ( x , y , c ) I m i n ) / ( I m a x I m i n )
In the formula, I m i n = 0 represents the minimum value of the recirculation ratio, and I m a x = 255 represents the maximum value of the recirculation ratio.
Normalization processing aims to adjust the range of all data to between [ 0,1 ] , thereby balancing the importance of each feature. The normalization formula is simplified as:
I n o r m ( x , y , c ) = I ( x , y , c ) / 255
This dataset implements refined labeling of representative ground targets in the city and involves multiple components of typical living scenarios. This dataset is designed for remote sensing image interpretation, providing normalized training data and quantifiable evaluation benchmarks. It adopts a six-classification system, categorizing ground objects based on the attributes reflected by pixels. It also encodes each category with specific colors to simplify the label operation and visual output during the training stage. The labeled categories and the corresponding number of labels are shown in Table 1.
This dataset is aimed at the pixel-level semantic classification task of typical ground objects in urban residential areas, aiming to provide sample resources with high annotation quality, clear semantic structure, and reasonable data organization for the training, verification, and evaluation of deep learning models. URSSD entirely considers the representativeness of ground object categories, the diversity of spatial distribution, and the reliability of label accuracy, ensuring its good adaptability and scalability in various urban application scenarios. It can effectively extract and identify key spatial information such as the distribution of building forms, road traffic density, and ecological greening structure in urban residential areas, thereby providing strong data support and technical references for tasks such as urban scene understanding, disaster assessment, and dynamic monitoring of land use.
This dataset implements refined labeling of representative ground targets in the city and involves multiple components of typical living scenarios. This dataset is designed for remote sensing image interpretation, providing normalized training data and quantifiable evaluation benchmarks. It adopts a six-classification system, categorizing ground.
1. Total sample size: URSSD contains 5053 high-resolution remote sensing images, each of which has been annotated at the pixel level for semantic segmentation.
2. The dataset is partitioned into training, validation, and test sets at a ratio of 7:2:1, with efforts made to ensure balanced coverage of different scenes and to avoid concentrating a particular type of scene within a single subset.
3. Image resolution range: The size of images is 2500 × 2000, with some images cropped and normalized to ensure consistency between training and validation.
4. Data acquisition source: The imagery is obtained from remote sensing platforms, covering representative urban residential scenes.
5. Annotation method and consistency verification: Researchers with remote sensing image interpretation expertise conduct the labeling process using a self-developed annotation tool. Annotation quality and accuracy are further ensured through consistency checks.

2.2. Semantic Segmentation of Remote Sensing Residential Areas Based on CrossAtt-UNet

2.2.1. Cross Attention

The existing methods have main technical limitations in remote sensing image segmentation, involving difficulties such as poor classification accuracy, complex background noise, discontinuous target connections, lack of structural integrity, and inaccurate edge detection. The deficiency of boundary determination and topological awareness constitutes the main obstacle hindering the improvement of segmentation accuracy. This paper innovatively introduces the Cross Attention module structure, enhancing the ability to extract features and provide context solutions for row and column relationships in the full text. This module adopts a dense skip connection architecture, establishing cross-associations of the feature map’s horizontal and vertical coordinate axes and comprehensively exploring the dependency relationships between the channels of the feature map. The structural framework of this model is detailed in Figure 3. DWConv 1 × 3 and DWConv 3 × 1, respectively, perform depth-separable convolution operations on the horizontal and vertical dimensions, which is helpful for the model to recognize directional features such as row and column textures and edges in the image and calculate the attention weight between the two vectors. DWDConv 1 × 5 and DWDConv 5 × 1, respectively, perform dilation convolution operations in the horizontal and vertical directions, significantly expanding the receptive field without increasing parameters, capturing distant feature relationships, and further enhancing the directional perception ability of structure, edge, and texture.
The core idea of the Cross Attention module: Divide the input features into three identical features. For the three input feature maps f R C × H L × W L , g R C × H L × W L , and h R C × H L × W L , the attention weights across channels are obtained through the attention calculation between channels to enhance semantic interaction. Among them, C represents the number of channels; H L is the height of the image; W L is the image’s width; B is the sample size. F represents the number of compressed channels, usually set as F = C / r , where r is the compression ratio (8 or 16).
The calculation steps of cross-attention are as follows:
1. Interpolate operation: The input three feature maps, f , g , and h are sampled up or down to change spatial resolution. It is a parameter-free geometric transformation operation:
X = I n t e r p o l a t e ( f ) R C × H × W Y = I n t e r p o l a t e ( g ) R C × H × W Z = I n t e r p o l a t e ( h ) R C × H × W
2. Feature extraction along the horizontal and vertical coordinate axes: DWDConv 1 × 5 and DWDConv 5 × 1, respectively, perform dilation convolution operations in the horizontal and vertical directions, significantly expanding the receptive field without increasing parameters, capturing distant feature relationships and further enhancing the directional perception ability of structure, edges, and textures.
X = D W D C o n v   1 × 5 ( X ) R C × H × W Y = D W D C o n v   5 × 1 ( Y ) R C × H × W
The role of DWDConv ( 1 × 5 ) and DWDConv ( 5 × 1 ) builds upon DWConv by introducing a dilation rate, which skips specific pixels during convolution to enlarge the receptive field. These operators provide broader directional receptive fields along the horizontal and vertical axes, making them particularly suitable for capturing long linear structures such as roads, block boundaries, and rivers, while compensating for the limitation of standard DWConv, which primarily focuses on short-range features. Their advantages can be summarized as follows:
Expanded receptive field without increasing parameters: compared with enlarging the kernel size directly.
Enhanced balance between global and local context: targets often vary in scale in remote sensing imagery, and DWDConv can simultaneously attend to fine-grained details and broader contextual information.
Preservation of spatial details: unlike pooling, dilated convolution does not perform downsampling, thereby retaining more spatial information.
3. Edge feature extraction: DWConv 1 × 3 and DWConv 3 × 1, respectively, perform depth-separable convolution operations on the horizontal and vertical dimensions, which is helpful for the model to recognize directional features such as row and column textures and edges in the image.
Z = D W C o n v   1 × 3 ( Z ) R C × H × W V = D W C o n v   3 × 1 ( Z ) R C × H × W
The role of DWConv ( 1 × 3 ) and DWConv ( 3 × 1 ) is to extract fine-grained edge and texture features along the horizontal and vertical directions, thereby strengthening the modeling of linear structures such as building boundaries and roads. Their advantages are as follows:
Reduced computational cost and parameter count: the complexity of a standard k × k convolution is O k 2 · C 2 , whereas DWConv requires only O k 2 · C , greatly reducing computation.
High sensitivity to spatial features: since each channel is convolved independently, DWConv is more responsive to local spatial patterns such as edges and corners.
Compatibility with pointwise convolution: DWConv first extracts spatial features, which are then fused across channels using a 1 × 1 convolution.
4. Calculation of Q, K and V: Using fully connected layers or Conv 1 × 1 convolution, channel compression, and nonlinear transformation are first performed on X and Y :
Q = W f X R F × H × W K = W g Y R F × H × W V = W h Z R F × H × W
Among them, ∗ represents the convolution operation; W f , W g , and W h R F × C are the weight matrices of queries, keys, and values, and are trainable weight matrices.
5. Similarity (attention) calculation: Calculate the attention weights between two embedding vectors, which can be extended to an inter-channel weight matrix (for multi-channel interaction):
A = S o f t m a x Q · K T R F × F
Among them, A i j represents the attention intensity of the i-th channel in X to the j-th channel in Y. The Softmax function ensures that the obtained attention weights are positive and normalized.
6. Weighted fusion: Use the attention matrix to weighted fuse the input feature V channel to obtain a new feature representation:
W = A · V R C × H × W
Among them, · represents matrix multiplication. This step ensures that only the important areas are retained and passed into the decoder to suppress the background and noise.
7. Transposed Convolution: Transposed convolution is an operation used to improve the spatial resolution of feature maps. It expands the dimensions of W and F to the same latitude, facilitating fusion.
W = T r a n s p o s e d   C o n v o l u t i o n ( W )
8. Fusion with the original features (optional): It can be fused with the original F through residual or weighted methods:
Z = γ W + F
Among them, γ is a learnable scaling parameter.

2.2.2. CrossAtt-UNet Architecture

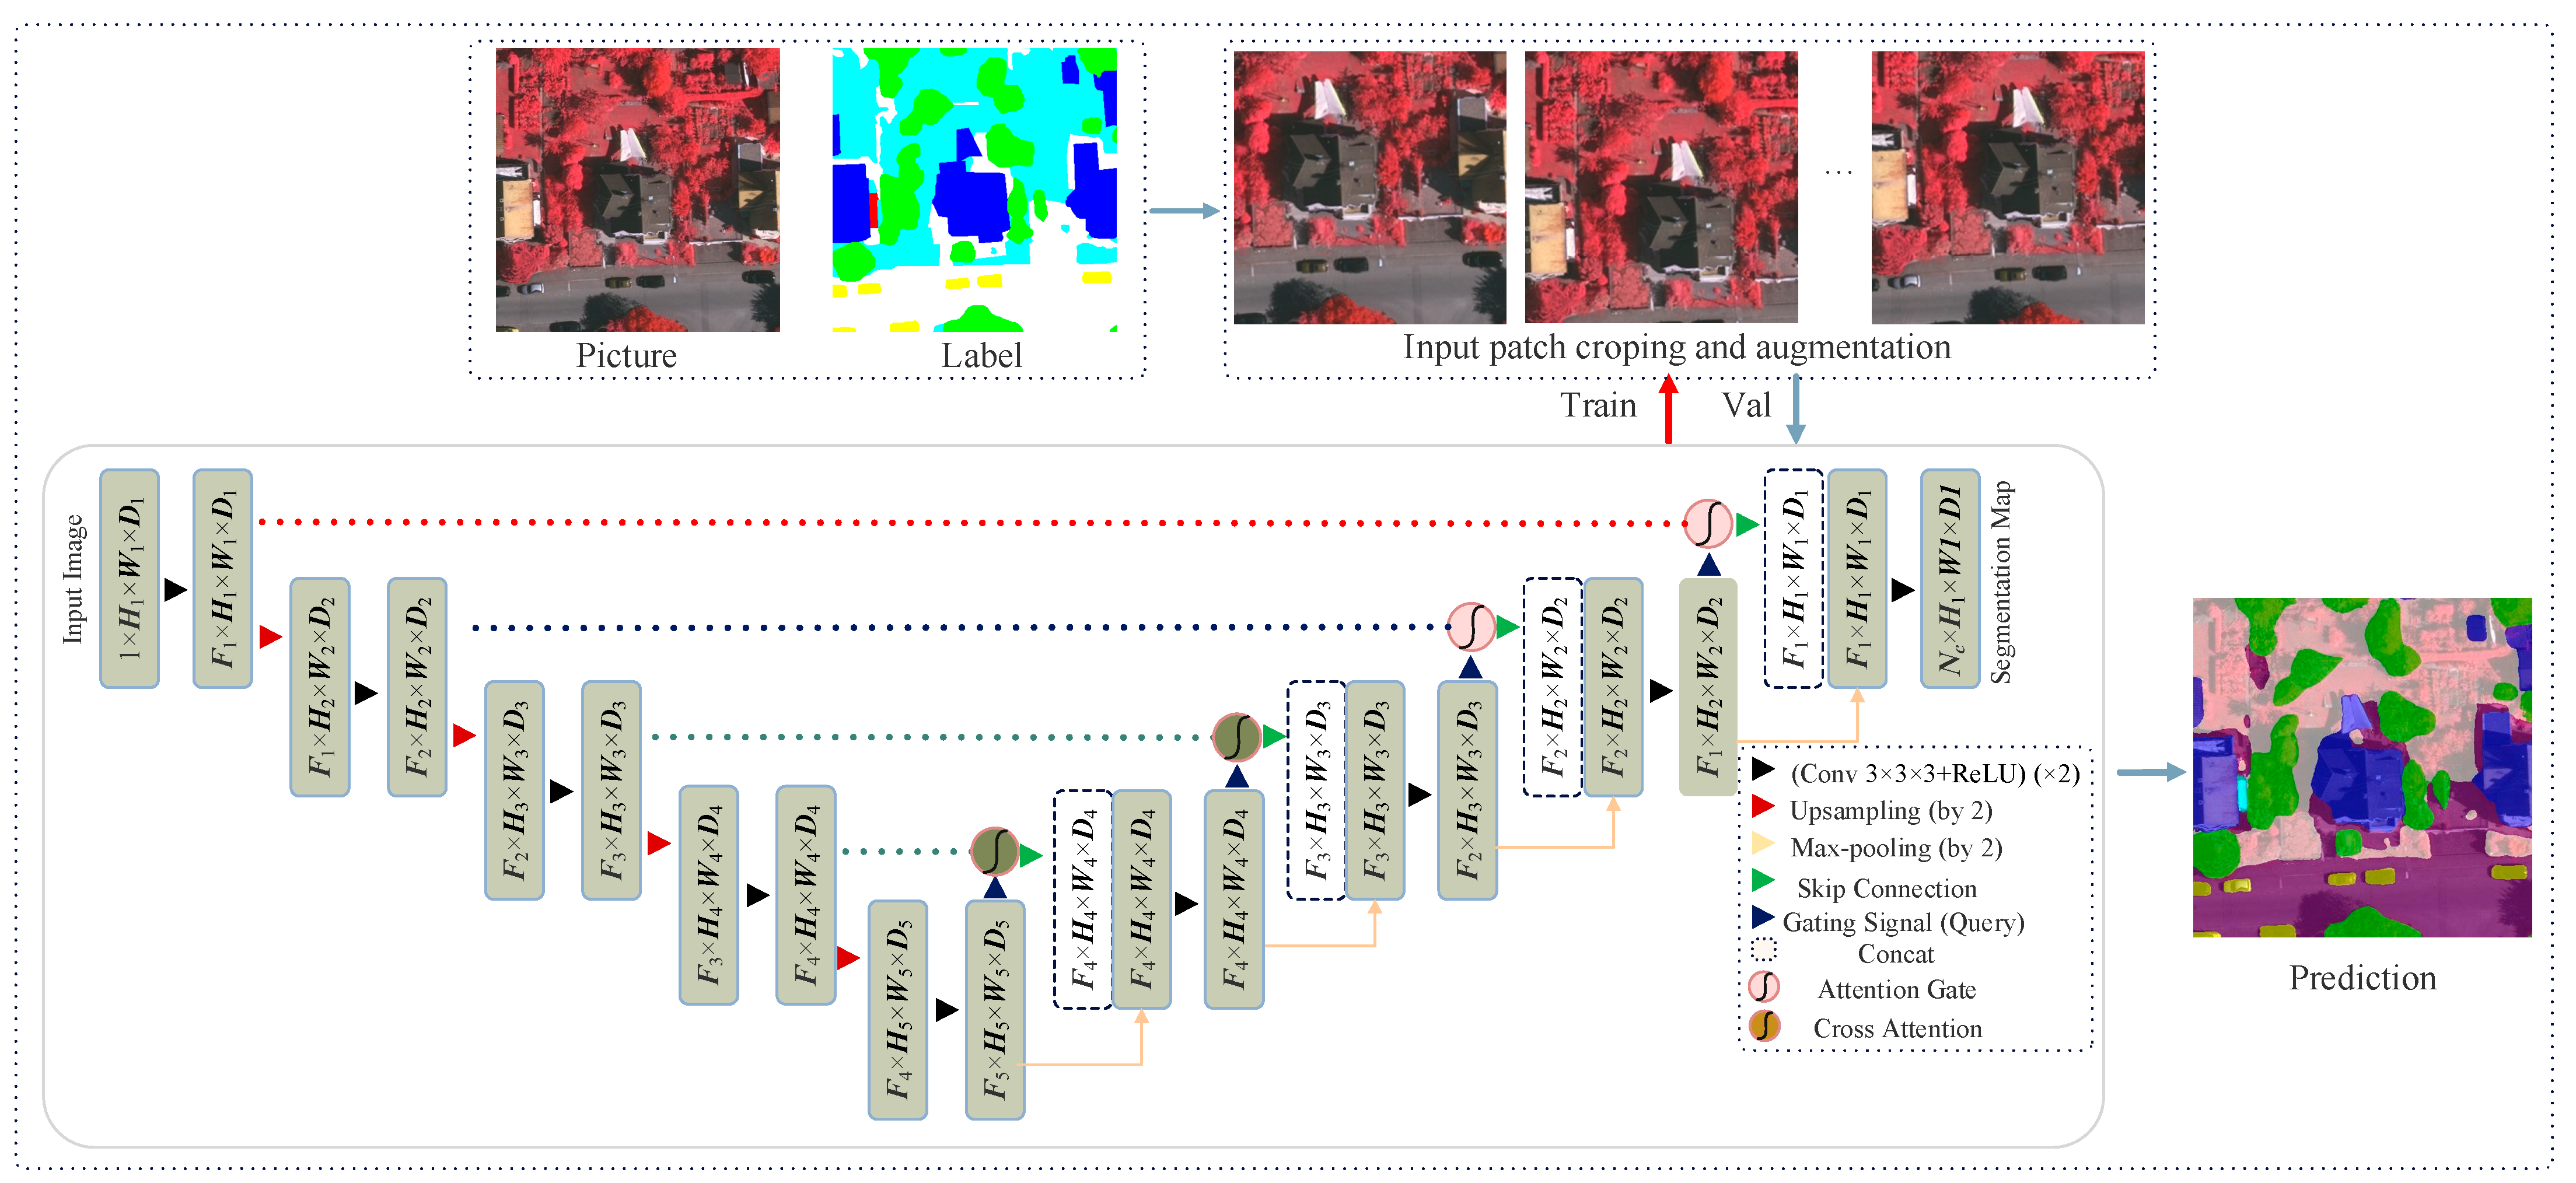
The CrossAtt-UNet architecture is similar to Att-UNet. The difference is that UNet only performs concatenation operations at the same level as the decoder and Encoder. Here, an Attention Gate and Cross Attention combined with a dense skip connection structure are added to the weight part of the encoder encoding at the same level. Its overall framework is shown in Figure 4. The CrossAtt-UNet model proposed in this paper is composed of introducing the Cross Attention module into the Att-UNet model architecture. CrossAtt-UNet is mainly composed of the following parts:
1. Encoder: Extracts multi-scale semantic features of images (such as ResNet, VGG, etc., can also be used as backbones). The model’s Encoder consists of 4 convolutional layers and four max-pooling layers. Each convolutional layer performs two 3 × 3 convolution operations to extract the key information in the data. Each max-pooling layer halves the spatial resolution of the feature map, thereby reducing the computational complexity.
2. Decoder: The low-resolution and high-semantic features extracted by the Encoder are gradually upsampled to restore the original image size. Fine pixel-level segmentation is achieved with the shallow features in the encoding stage [19,20,21,22,23,24]. The decoder part is similar to the Encoder, containing four convolutional layers connected by transposed convolutional layers. These transposed convolutional layers magnify the feature maps extracted by the Encoder through reverse convolution operations, restoring their dimensions to the original size.
3. Attention Gate: Embedded in the skip connection of Cross Attention, it performs saliency filtering on the transmitted features. Attention Gate can guide the network to focus more on the key areas, especially in the case of blurred boundaries or severe background interference, which is helpful to improve the segmentation accuracy. This mechanism also has the characteristics of being lightweight and easy to integrate. It enhances the feature expression ability and the robustness of the network without significantly increasing the computational overhead, thereby improving the overall model performance.
4. CrossAtt-UNet: Embedded in the dense skip connections of CrossAtt-UNet, Criss-Cross Attention achieves approximately global context modeling by constructing cross-associations in the horizontal and vertical directions of the feature map. Thus, it effectively compensates for the limitations of the traditional self-attention mechanism, such as high computational complexity and low efficiency in global feature extraction.
5. Skip Connection: The same-layer feature connects the encoder and decoder.

2.2.3. Loss Function and Evaluation Indicators

In the image semantic segmentation task based on the CrossAtt-UNet architecture, the reasonable selection of the loss function and performance evaluation indicators is significant in improving the model performance and optimizing the training process. This paper selects and implements representative loss functions and evaluation indicators to ensure the accuracy and generalization ability of the segmentation results. Their design and application strategies will be systematically expounded in the following text.
Loss function:
1. train_loss (training loss): train_loss represents the loss of the model on the training set and serves as the optimization objective used to guide weight updates during the training process. The cross-entropy loss is one of the most commonly used loss functions and is particularly suitable for classification tasks [25]. Calculate the difference between each pixel’s predicted category and the actual label. Its formula is as follows:
L C E = c = 1 C y c l o g p c
Among them, C is the number of categories, y c is the probability of the actual label, and p c is the predicted probability. Cross-entropy loss is often used in multi-classification tasks, especially in image segmentation tasks where pixel-level labels are known.
2. val_loss (validation loss): val_loss is the loss value of the model on the validation set. It is similar to train_loss, using the same loss function but evaluating the model’s fitting ability for unseen data.
If both val_loss and train_loss decrease simultaneously, it indicates that the model performs consistently on the training and validation sets and has a good fit. If val_loss increases while train_loss decreases, it indicates that the model begins to overfit and its generalization ability declines. If val_loss continues to be higher than train_loss, it may indicate a significant distribution difference between the validation and training sets or insufficient training data.
Evaluation indicators:
Definition of mIoU (mean intersection over union): mIoU is one of the most commonly used evaluation metrics in semantic segmentation, representing the degree of weight between the predicted result and the actual label [26,27]. It measures the intersection and union ratio (iou) between the predicted area and the actual area of each category and then takes the average for all categories. For a specific category i, iou is defined as:
i o u i = T P i / ( T P i + F P i + F N i )
Among them, T P i is the true example of Class i ; F P i is a false positive example of Class i ; F N i is a false negative example of Class i .
The mIoU is the average value of iou for all categories:
m i o u = 1 C i = 1 C i o u i
Among them, C represents the total number of categories.
Precision, Recall, F1 score, and mAP:
  Precision   = T P / ( T P + F P )   × 100 % Recall   = T P / ( T P + F N ) × 100 %
F 1   score = 2 × Precision × Recall     Precision + Recall  
m A P = i = 1 n     0 1   P i ( R ) d R N
TP refers to the number of actual positive samples correctly predicted by the model, FP refers to the number of actual negative samples incorrectly predicted as positive, and FN indicates the number of actual positive samples incorrectly predicted as negative by the model. N represents the total number of sample categories.
The loss function and evaluation index of CrossAtt-UNet play a crucial role in the image segmentation task. Choosing the appropriate loss function and evaluation index can improve the segmentation accuracy and effectively enhance the robustness and adaptability of the model. The loss function and evaluation indicators should be reasonably selected for different task requirements based on the data set’s characteristics and the task’s specific requirements.

2.2.4. Comparative Innovation Analysis

TMFNet alleviates the problems of shadow occlusion and target scale variation through multimodal fusion of spectral information and DSM height features. In contrast, our proposed CrossAtt-UNet focuses on feature optimization for single-modal remote sensing imagery [28]. By introducing cross-association modeling along horizontal and vertical coordinate axes, combined with depthwise separable and dilated convolutions, CrossAtt-UNet effectively enhances the representation of texture similarity discrimination, small-scale targets, and blurred boundaries. This constitutes a complementary innovation direction to TMFNet’s multimodal complementarity.
The Ada-MBA module in FTransUNet computes self-attention and cross-attention in parallel to mutually enhance intra- and inter-modal information, emphasizing semantic regions [29]. In contrast, the Cross Attention module proposed in this paper emphasizes cross-modeling along row and column directions and the capture of inter-channel dependencies. Its goal is to improve multi-scale spatial interactions and boundary detail recognition in single-modal images. Compared with Ada-MBA’s mutual enhancement mechanism, our approach is more suitable for large-scale, high-resolution remote sensing image segmentation tasks that require real-time or near-real-time performance.
Although medical and natural scene image segmentation share similarities, the application scenarios differ considerably. Specifically, medical images generally focus on organ or lesion structures, where target shapes are relatively regular and background interference is minimal. In contrast, objects in residential remote sensing images (e.g., buildings, roads, vegetation, vehicles) are characterized by complex distributions, large-scale variations, blurred boundaries, and susceptibility to noise, shadows, and occlusion. Therefore, although Cross Attention has achieved promising results in medical image segmentation, its direct transfer cannot effectively address the multi-scale and complex background challenges inherent in remote sensing imagery. The innovation of this study lies in adapting the Cross Attention module to the complexity of remote sensing scenes.
Furthermore, regarding module design optimization, Cross Attention in medical image segmentation is often employed to enhance conditional information across modalities or capture local and non-local dependencies (e.g., Diffusion Transformer U-Net, TransAttUnet) [30,31]. In contrast, the proposed CrossAtt module integrates cross-association modeling along horizontal and vertical coordinate axes, incorporating depthwise separable and dilated convolutions to enlarge the receptive field. This design enhances the ability to capture multi-scale spatial features and boundary details while maintaining computational efficiency, particularly crucial for segmenting complex residential remote sensing scenes.
Finally, concerning performance improvement mechanisms, advances in medical image segmentation primarily focus on enhancing generalization across different imaging modalities. By contrast, the proposed method emphasizes resolving challenges in cross-scale feature interactions and small-object recognition in remote sensing imagery.

3. Results and Analysis

To systematically evaluate the practical effect of the CrossAtt-UNet model proposed in this paper in the semantic segmentation of urban residential areas, URSSD is adopted as the primary experimental dataset, thoroughly presenting the experimental process and important parameter settings. Through a combination of quantitative and qualitative experimental methods, this paper systematically compares the performance differences of this model with the current mainstream semantic segmentation methods. The segmentation accuracy rate, smooth region transition, and boundary clarity verify the performance optimization. Furthermore, generalization experiments are conducted to verify the transferability of the network model. All experiments are conducted on the same hardware platform to ensure a fair comparison. The specific experimental configuration is shown in Table 2 for details.
The main parameters of the comparison network are as follows: the relevant parameters of DeepLabV3+ are set so that the feature map size is 1/8 of the input, and the dilation rates are [1,6,12,18]. BayesianUNet adopts the same configuration as the standard UNet, except for incorporating dropout. The network employs 3 × 3 convolution kernels, a dropout rate of 0.2 in the intermediate encoder–decoder layers, and a depth of four downsampling and upsampling stages. The primary parameter configuration of FR-UNet is mainly consistent with the standard U-Net. It employs 3 × 3 convolution kernels with a four-layer downsampling and four-layer upsampling structure, where the number of feature channels starts at 64 and doubles at each layer up to 512. The parameters of Siam-NestedUNet are consistent with those of FR-UNet. The main parameter configuration of SmaAt-UNet consists of 3 × 3 convolution kernels with a four-layer downsampling and four-layer upsampling structure, where the number of feature channels starts from 16 or 32 and doubles at each layer up to 256.

3.1. Experiment on Semantic Segmentation of Residential Areas

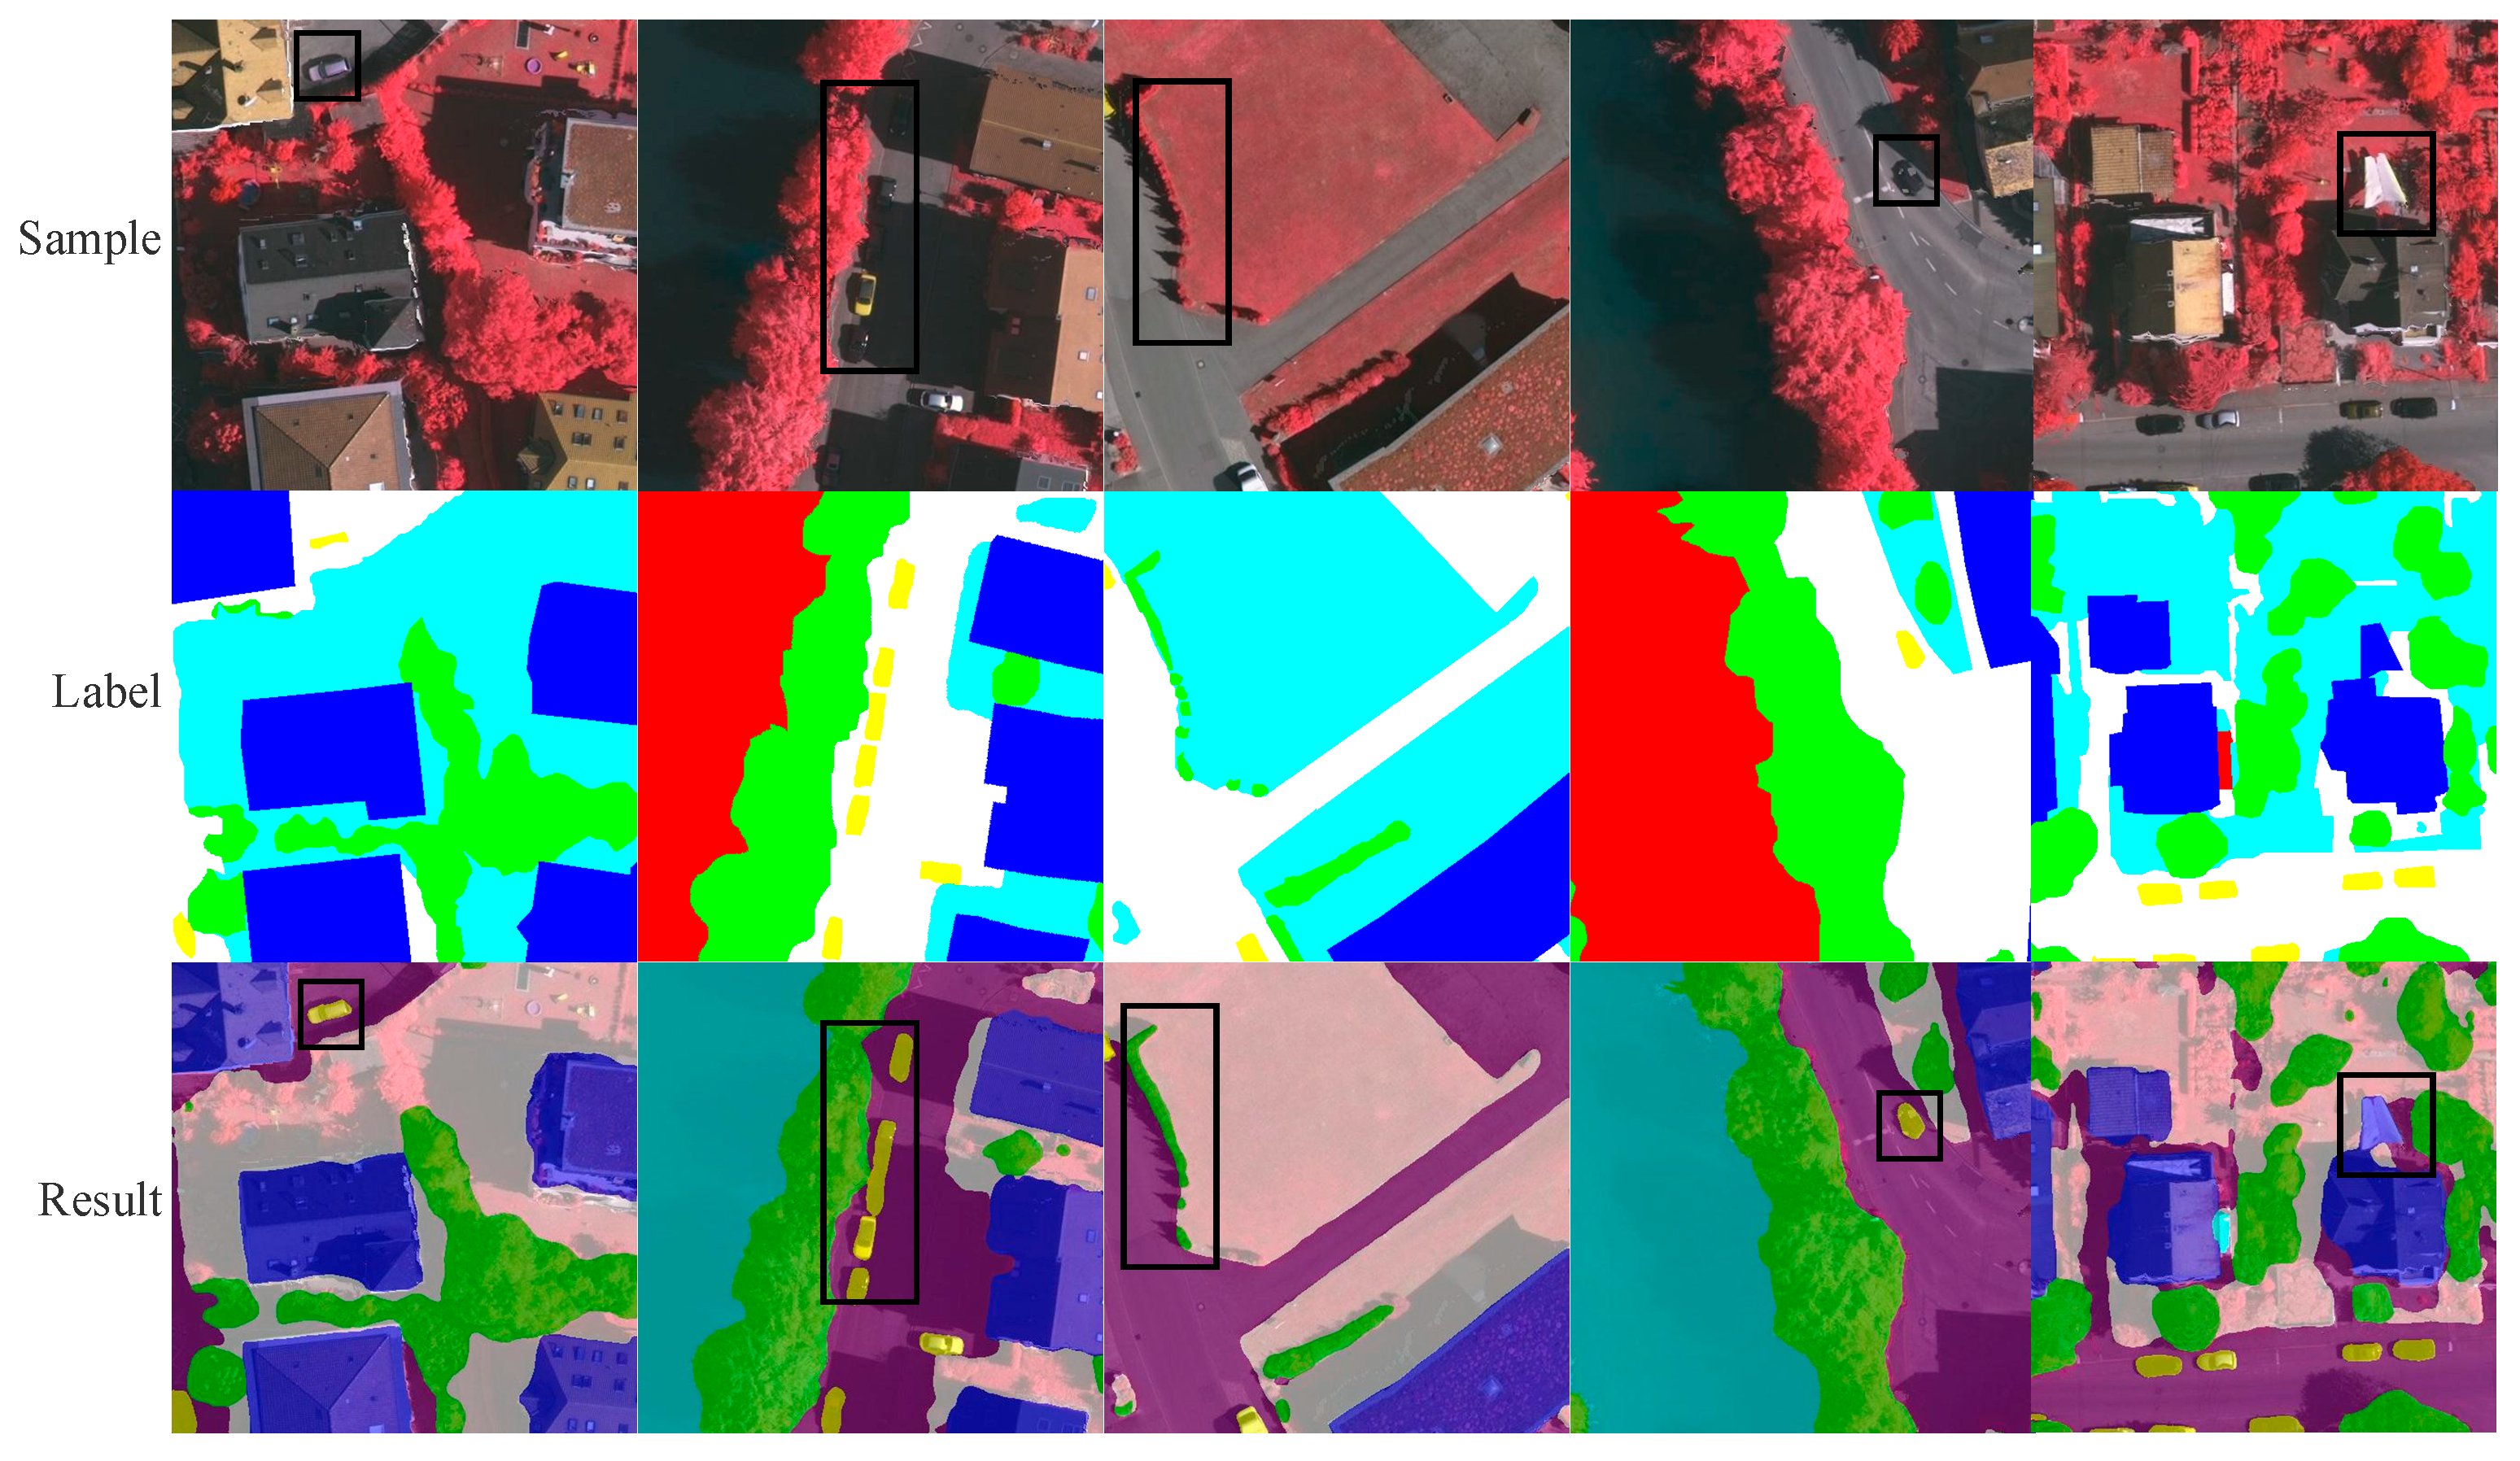
As shown in Figure 5, through the analysis of the prediction results of the CrossAtt-UNet model in the semantic segmentation task of residential areas, it can be seen that this model shows high accuracy and robustness in identifying and distinguishing the background, road surface, buildings, vegetation, trees, and vehicles in typical residential areas. Each group of images successively presents the original remote sensing images of the same scene, manually labeled images, and the semantic segmentation results generated by the model. From this, the consistency between the model segmentation effect and the real labeling can be intuitively compared. It is particularly worth noting that within the area marked by the black box in the figure, the application of cross-attention significantly improves the integrity of the ground object boundaries and the coherence of the classification areas, demonstrating the significant effect of this module in enhancing the expression of semantic features. This mechanism can fully learn the morphological characteristics of various ground objects in the living area and effectively improve the problems of segmentation fracture and misjudgment of traditional models in complex scenes. Its application potential and development prospects in remote sensing image analysis scenarios have been verified.

3.2. Comparison of Different Network Performances

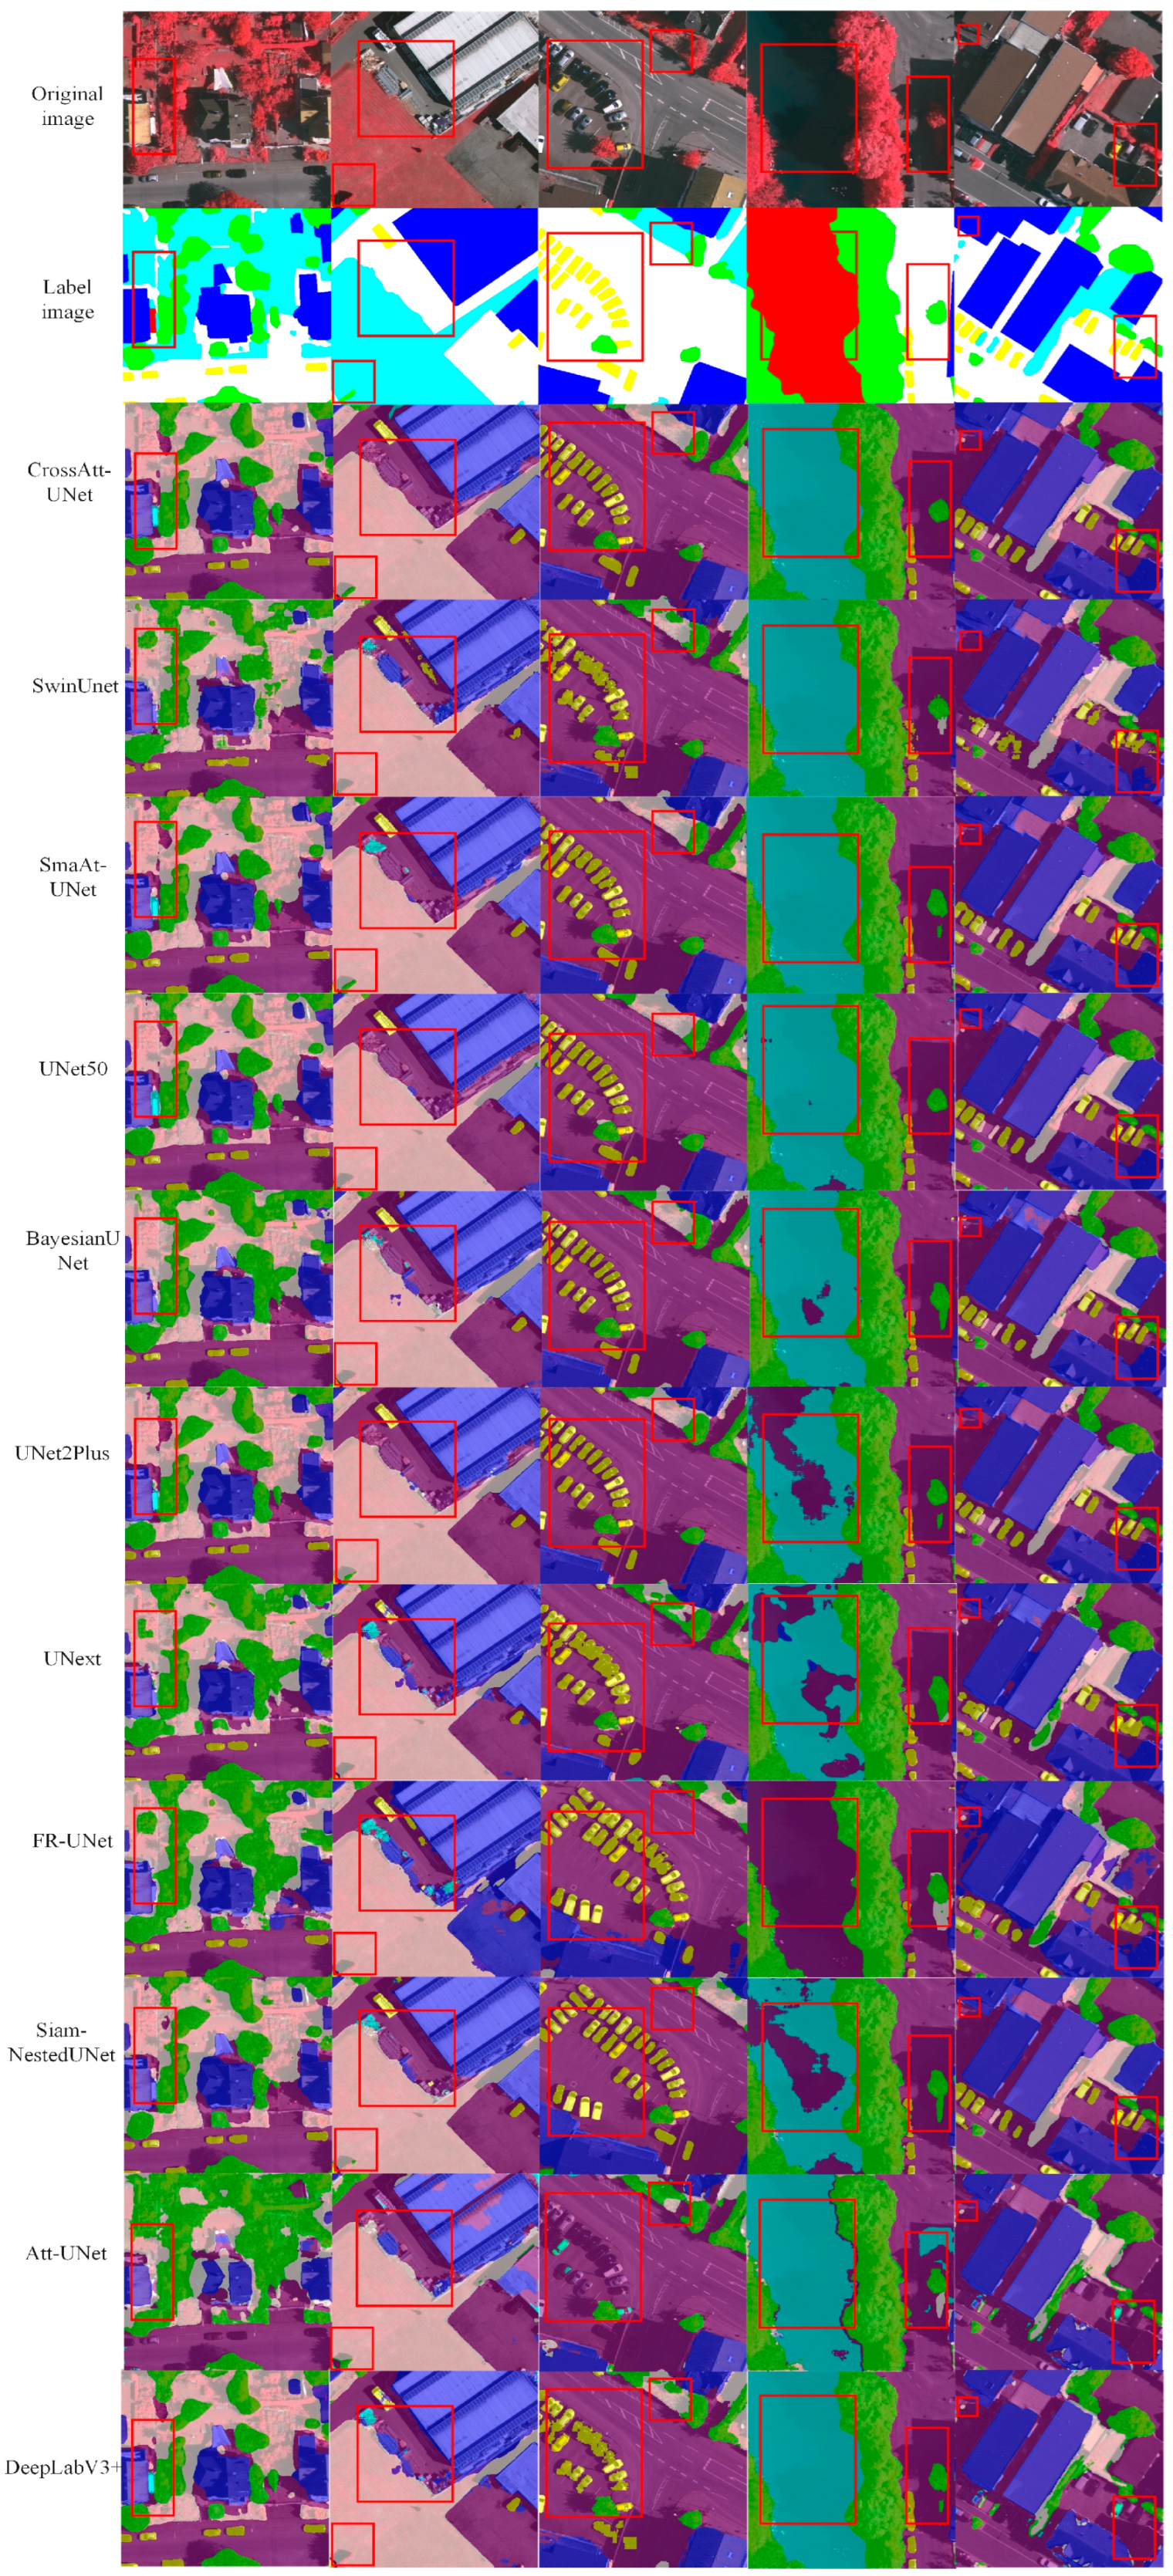
Figure 6 presents a comparative analysis of the segmentation performance of various semantic segmentation models applied to residential areas in high-resolution remote sensing imagery. The models compared include representative deep learning architectures such as BayesianUNet, UNet50 based on ResNet50, SwinUNet, UNext, FR-UNet, Siam-NestedUNet, DeepLabV3+, SmaAt-UNet, and UNet2Plus. Each set of images illustrates the semantic segmentation visualization results generated by different models for the same remote sensing scene. This facilitates an intuitive comparison of CrossAtt-UNet performance in recognizing living area classes.
In the first column, the red bounding box indicates that CrossAtt-UNet, UNet50, DeepLabV3+, and SmaAt-UNet accurately identified the corresponding area. In contrast, BayesianUNet, UNext, Att-UNet, FR-UNet, Siam-NestedUNet, UNet2Plus, and SwinUNet exhibited misclassified small target categories. CrossAtt-UNet and SmaAt-UNet demonstrated this region’s most complete and spatially coherent segmentation. Att-UNet, SmaAt-UNet, and UNet2Plus correctly identified the tree-covered area in the second column. At the same time, SwinUNet, DeepLabV3+, BayesianUNet, UNext, FR-UNet, Siam-NestedUNet, UNet50, and UNet2Plus2 failed to segment the trees, leading to significant misclassification. CrossAtt-UNet and Att-UNet achieved this part’s most accurate and spatially continuous segmentation. In the third column, CrossAtt-UNet, BayesianUNet, UNext, FR-UNet, Siam-NestedUNet, UNet2Plus, DeepLabV3+, UNet50, and SmaAt-UNet correctly segmented the area without misclassifying it as trees. Among them, Att-UNet and SmaAt-UNet yielded the poorest performance. In the fourth column, Att-UNet, UNet50, and UNet2Plus2 demonstrated the weakest segmentation performance. In contrast, CrossAtt-UNet and SmaAt-UNet achieved this region’s most accurate and coherent segmentation. In the fifth column, the red bounding box shows that Att-UNet, SwinUNet, UNext, FR-UNetBayesianUNet, UNet50, DeepLabV3+, and UNet2Plus2 exhibited minor misclassifications in the targeted area, with SwinUNet performing the worst. Experimental results demonstrate that CrossAtt-UNet performs superiorly in the semantic segmentation of residential areas.
When training deep learning models, smooth train_loss and smooth val_loss are the results after smoothing the train_loss and val_loss. It is mainly used to observe the trend during the training process more clearly and avoid being masked by fluctuations. During the training process, especially in mini-batch gradient descent, the train_loss and val_loss often exhibit violent waves at different steps/epochs due to the diversity of samples. The original curve may be jagged, making it difficult to tell whether the model is converging or overfitting. After smoothing, the overall trend of loss changes (such as decline, stabilization, and increase) becomes clearer.
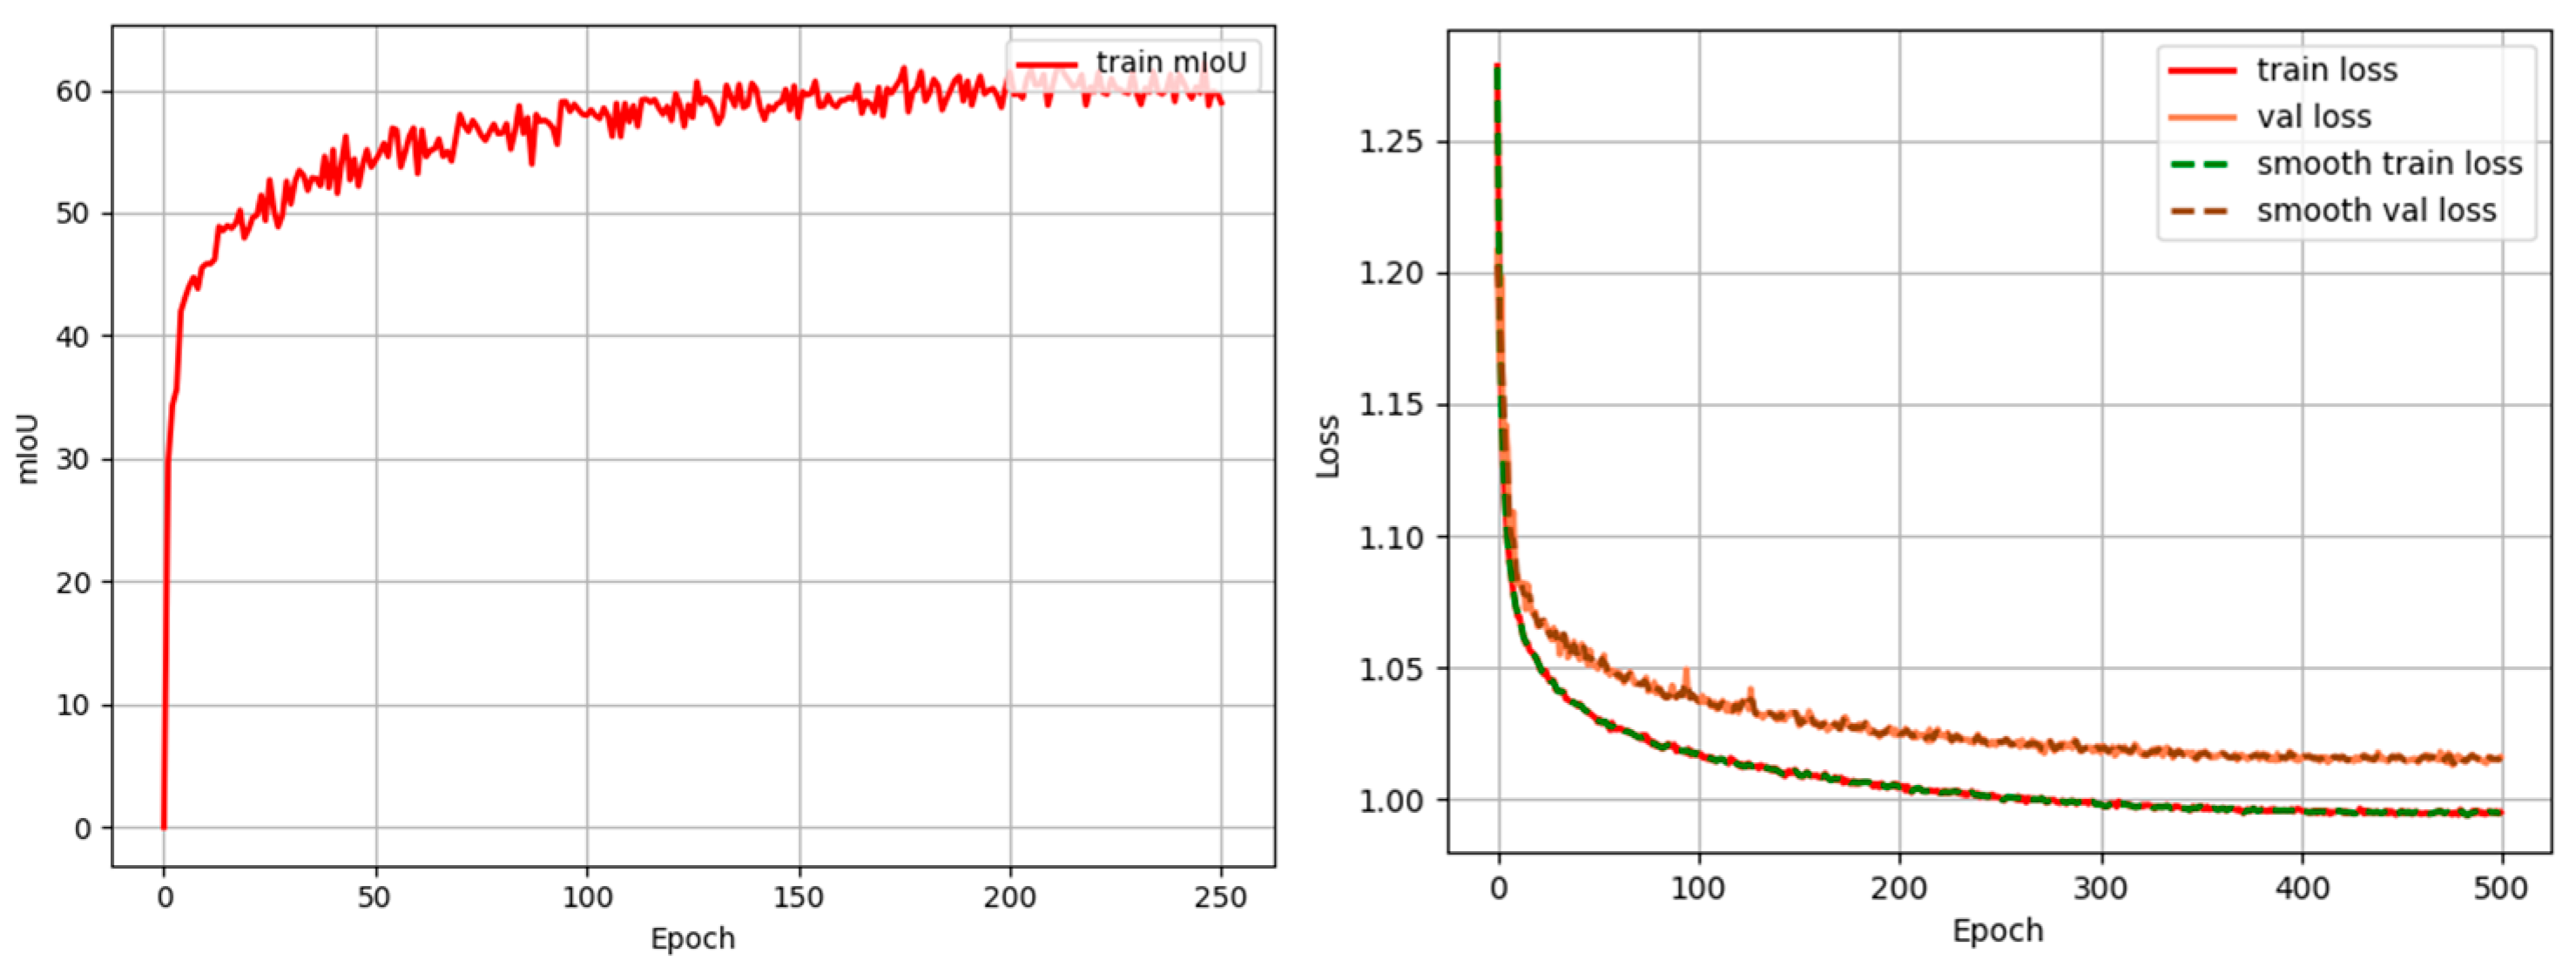
Figure 7 shows the result parameters of the performance evaluation indicators for the Att-UNet network prediction: mIoU is 58.95%, train_loss is 0.9951, and val_loss is 1.0160. Thus, the superiority of the CrossAtt-UNet network is verified.
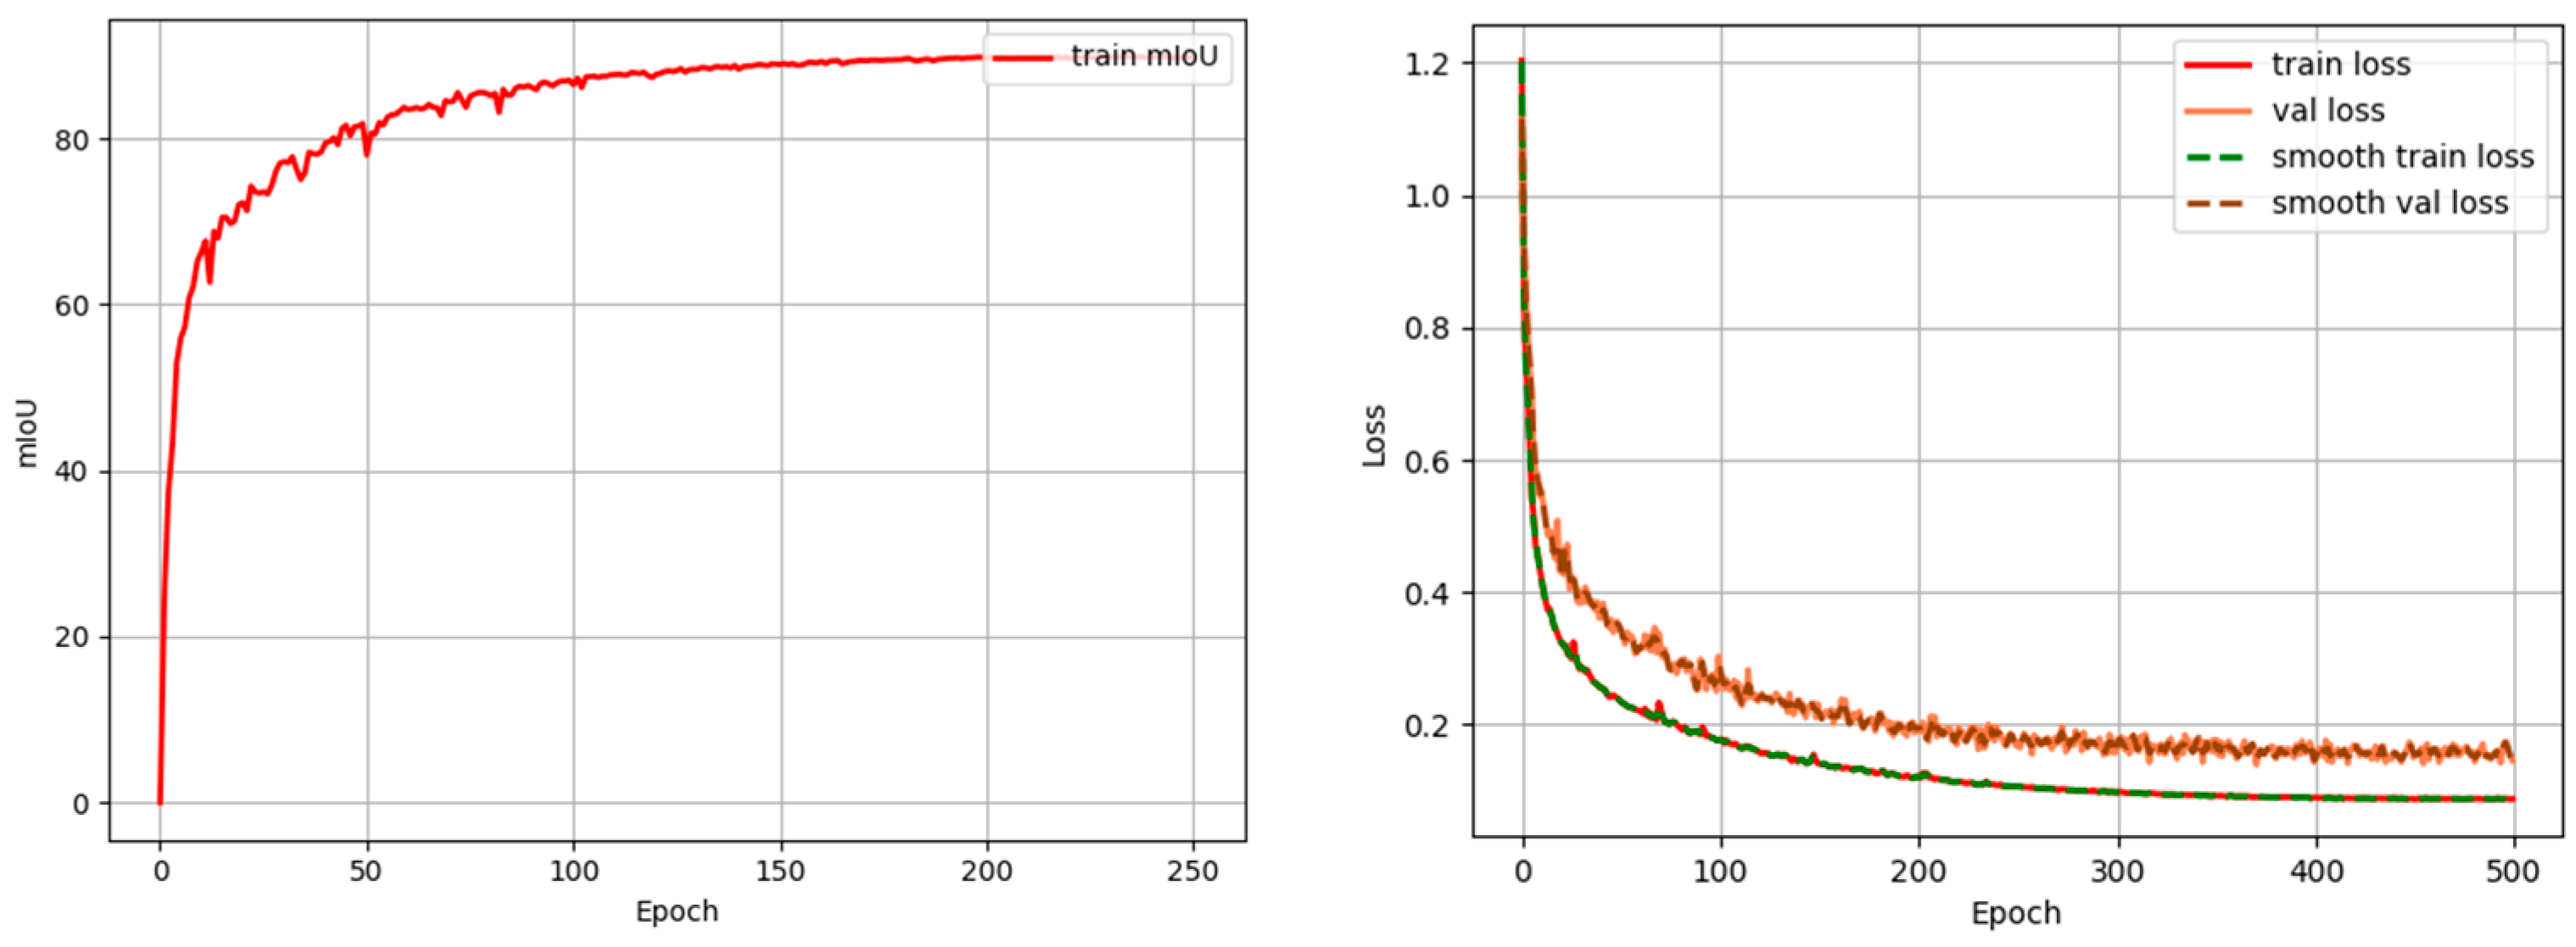
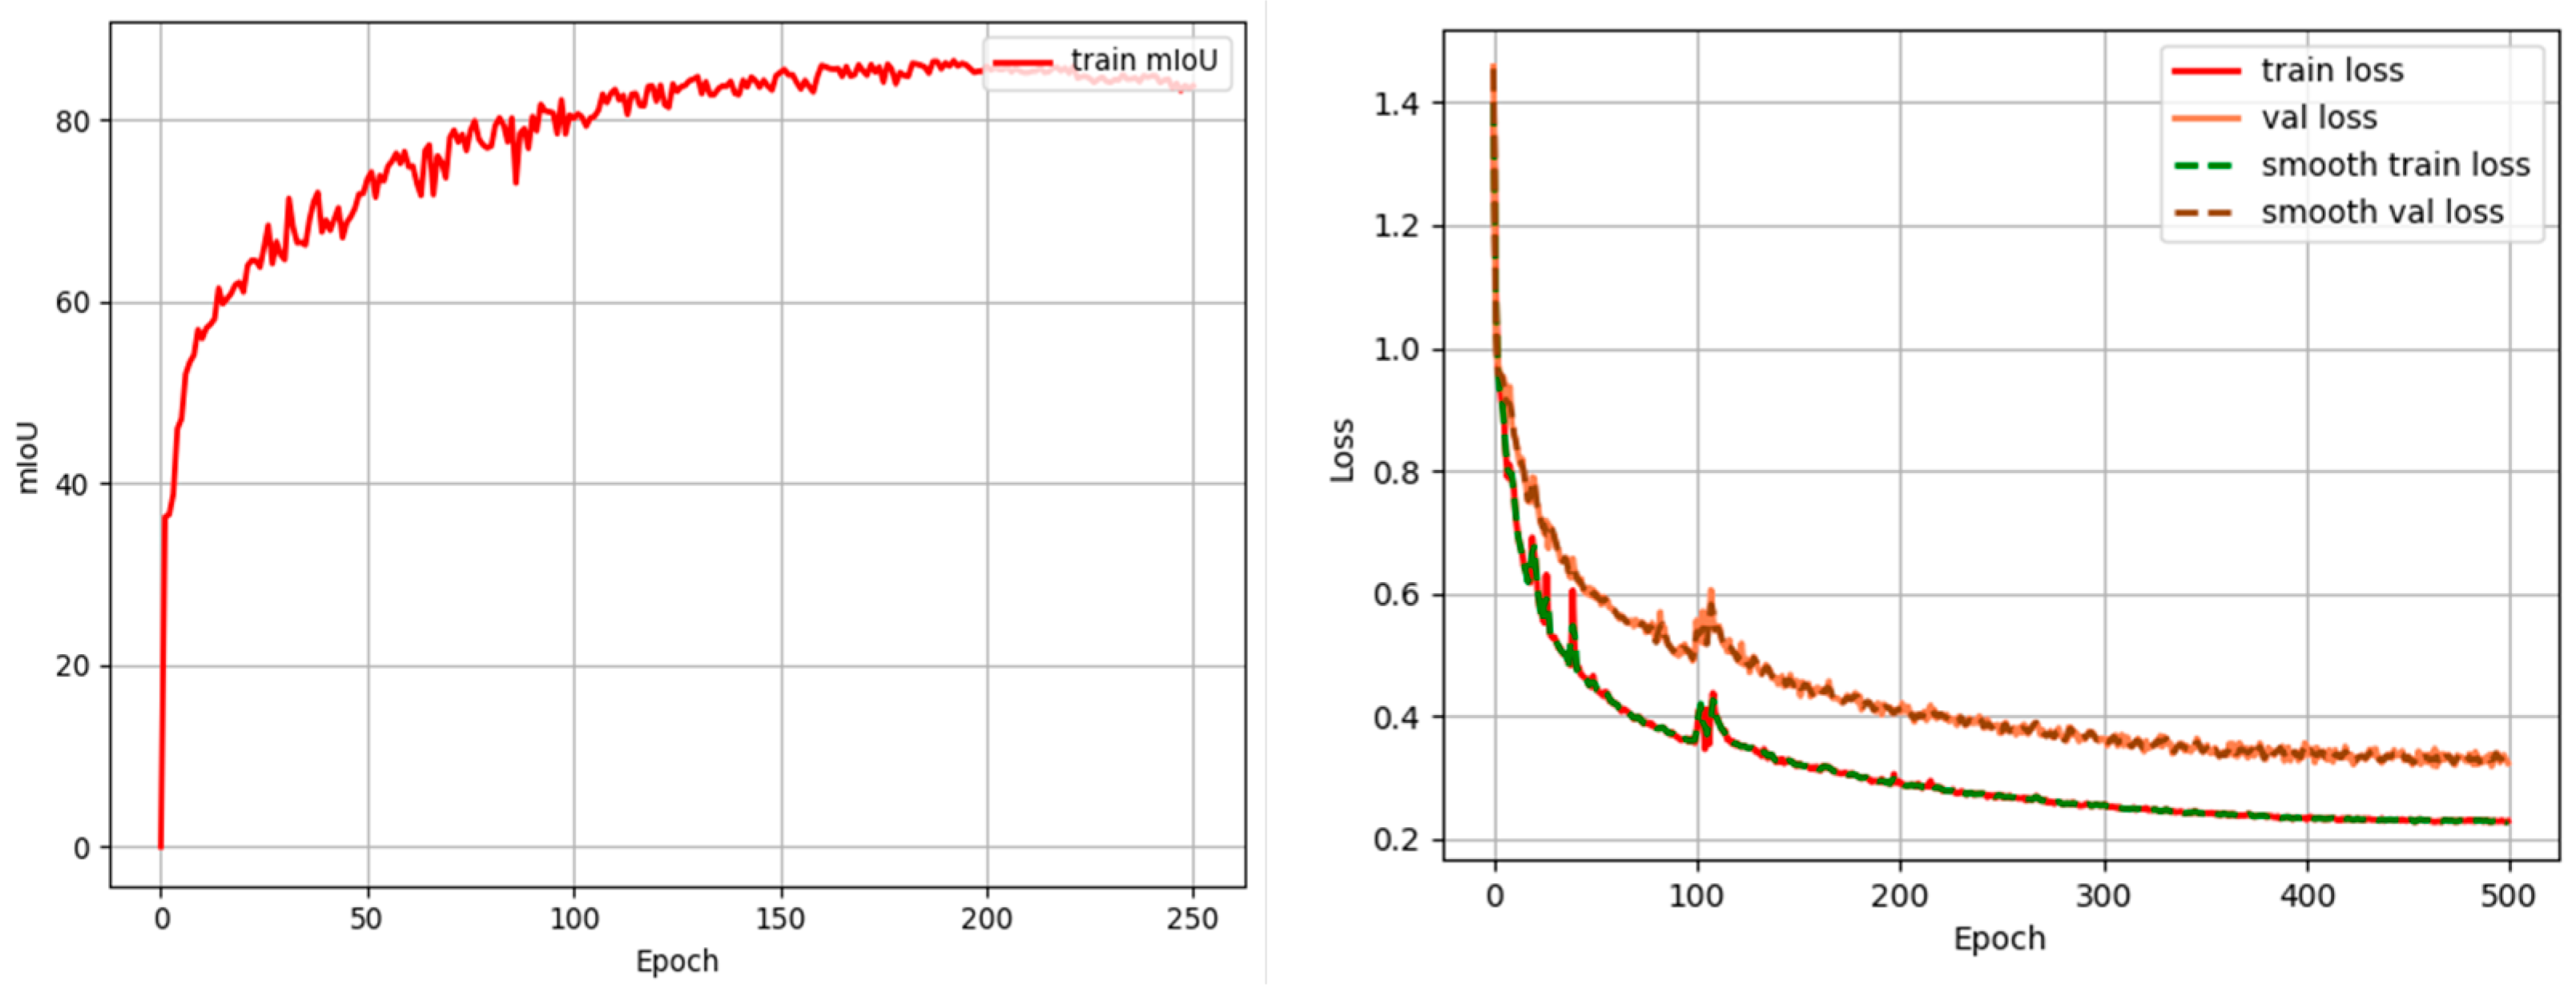
As shown in Figure 8, the result parameters of the performance evaluation indicators for the CrossAtt-UNet network prediction are mIoU is 89.80%, train_loss is 0.0878, and val_loss is 0.1459. Compared with Att-UNet, CrossAtt-UNet increased mAP by 0.62%, mIoU by 30.85%, and reduced train_loss by 0.9073 and val_loss by 0.8701. After convergence, CrossAtt-UNet is smoother than Att-UNet.
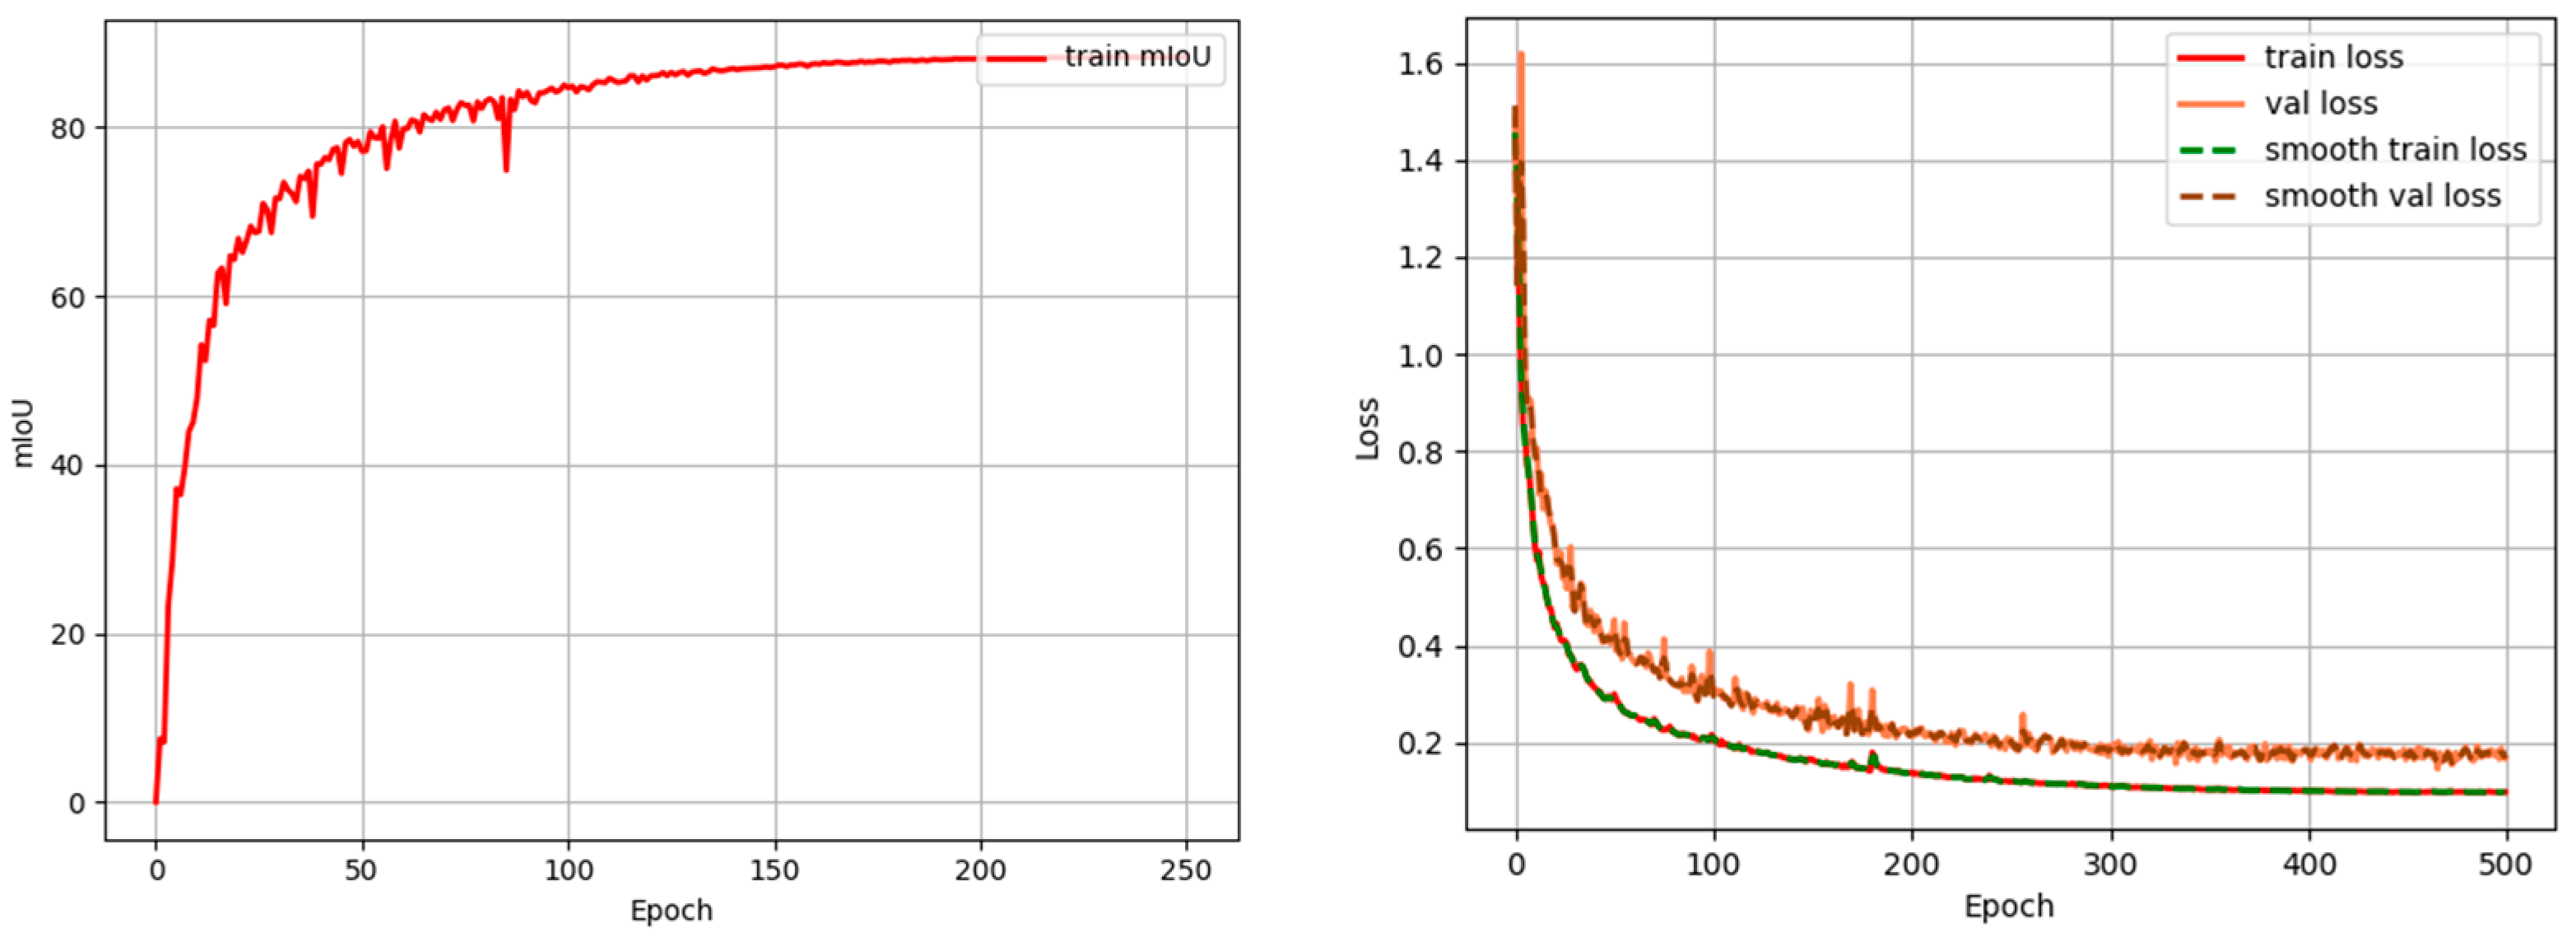
As shown in Figure 9, the result parameters of the performance evaluation indicators for the UNet50 network prediction are as follows: mIoU is 88.32%, train_loss is 0.0976, and val_loss is 0.1675. The UNet50 network performs well in the object segmentation task, but there is room for improvement in detail processing and computational efficiency. However, it may still underperform when dealing with very tiny local features.
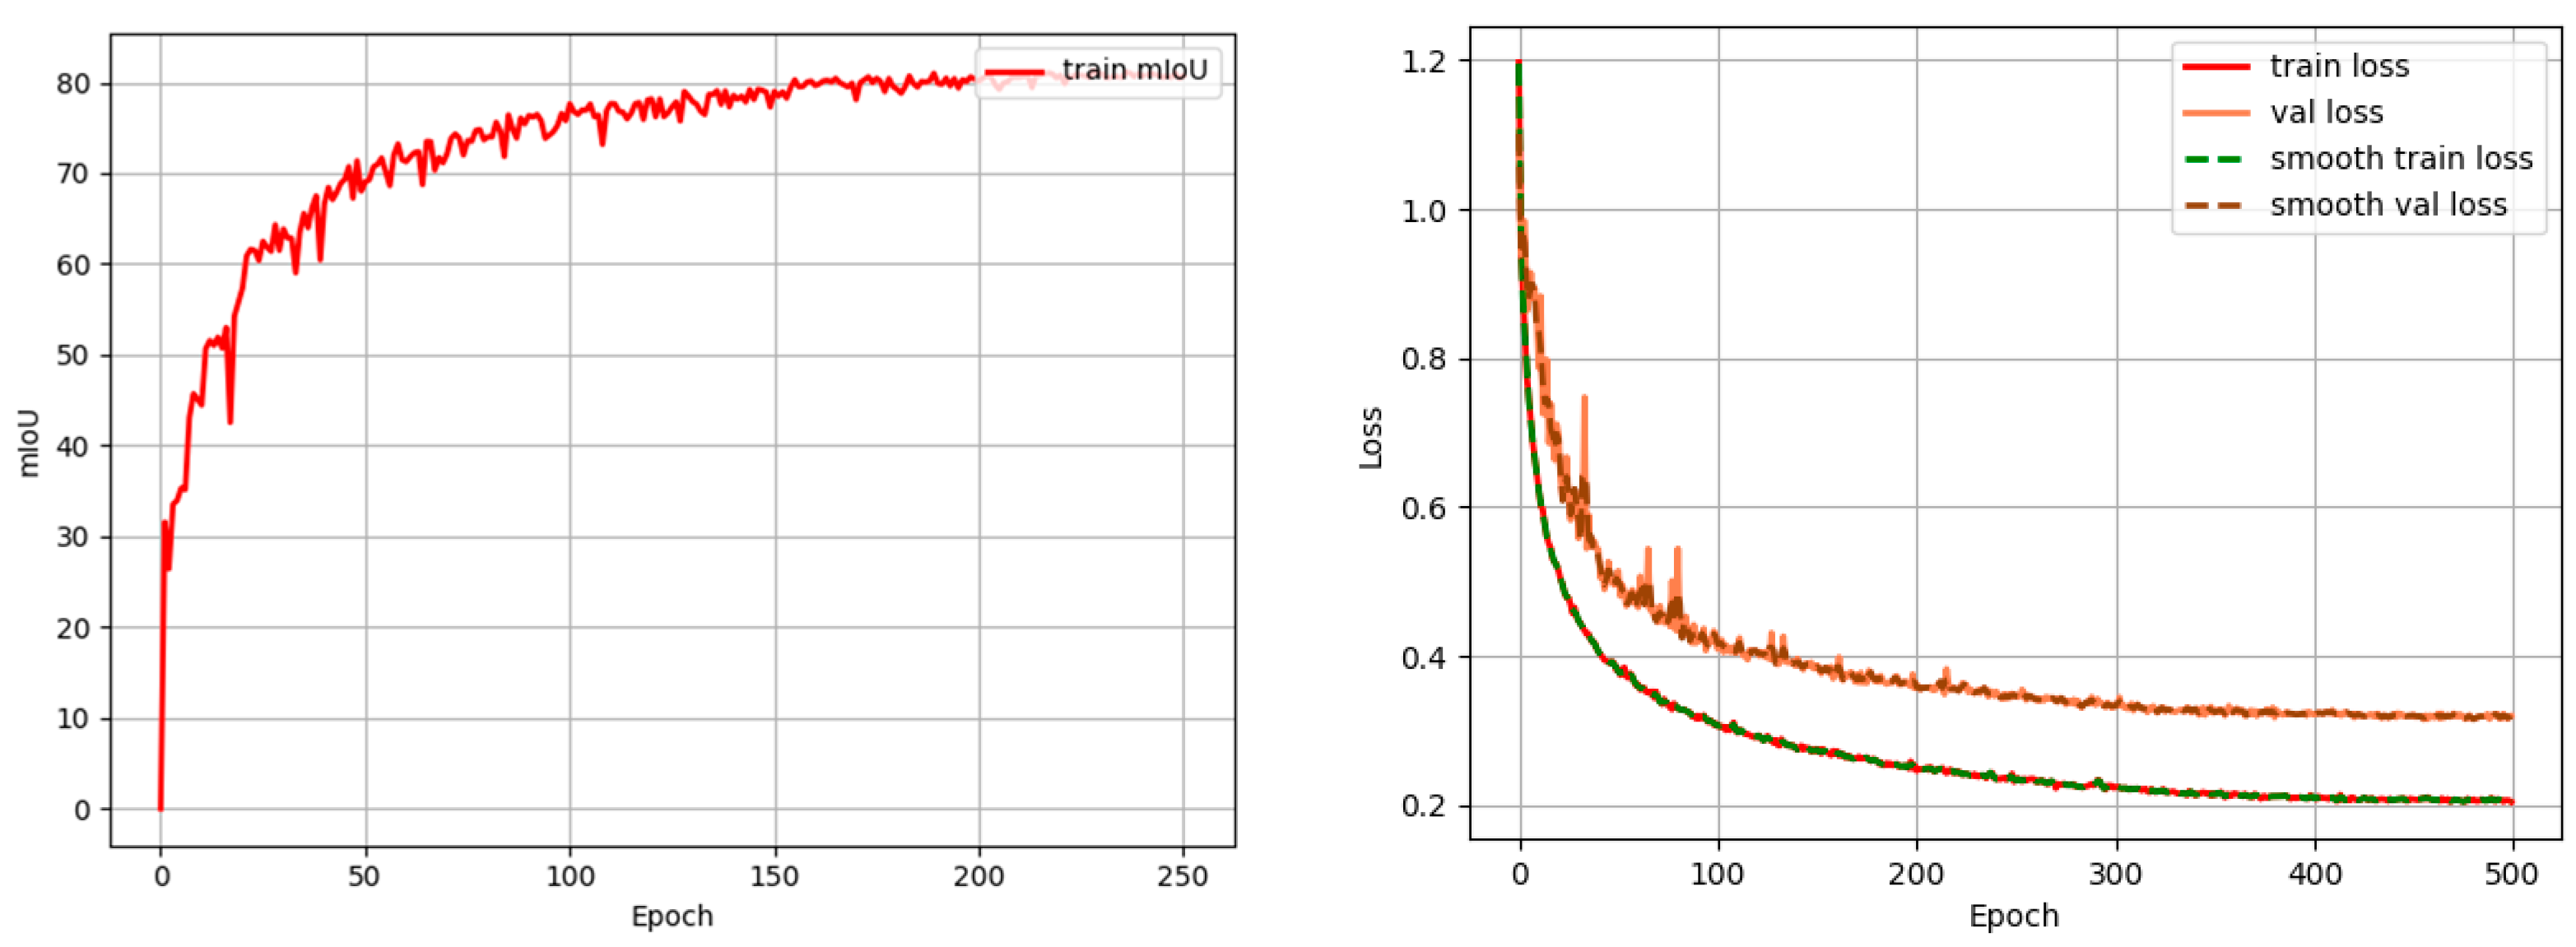
As shown in Figure 10, the result parameters of the performance evaluation indicators for the BayesianUNet network prediction are as follows: mIoU is 80.71%, train_loss is 0.2043, and val_loss is 0.3197. The BayesianUNet network has incorrect labels in some detailed parts. These incorrect labels mainly manifest in recognizing small objects or areas with complex edges, but there are still deficiencies in handling details.
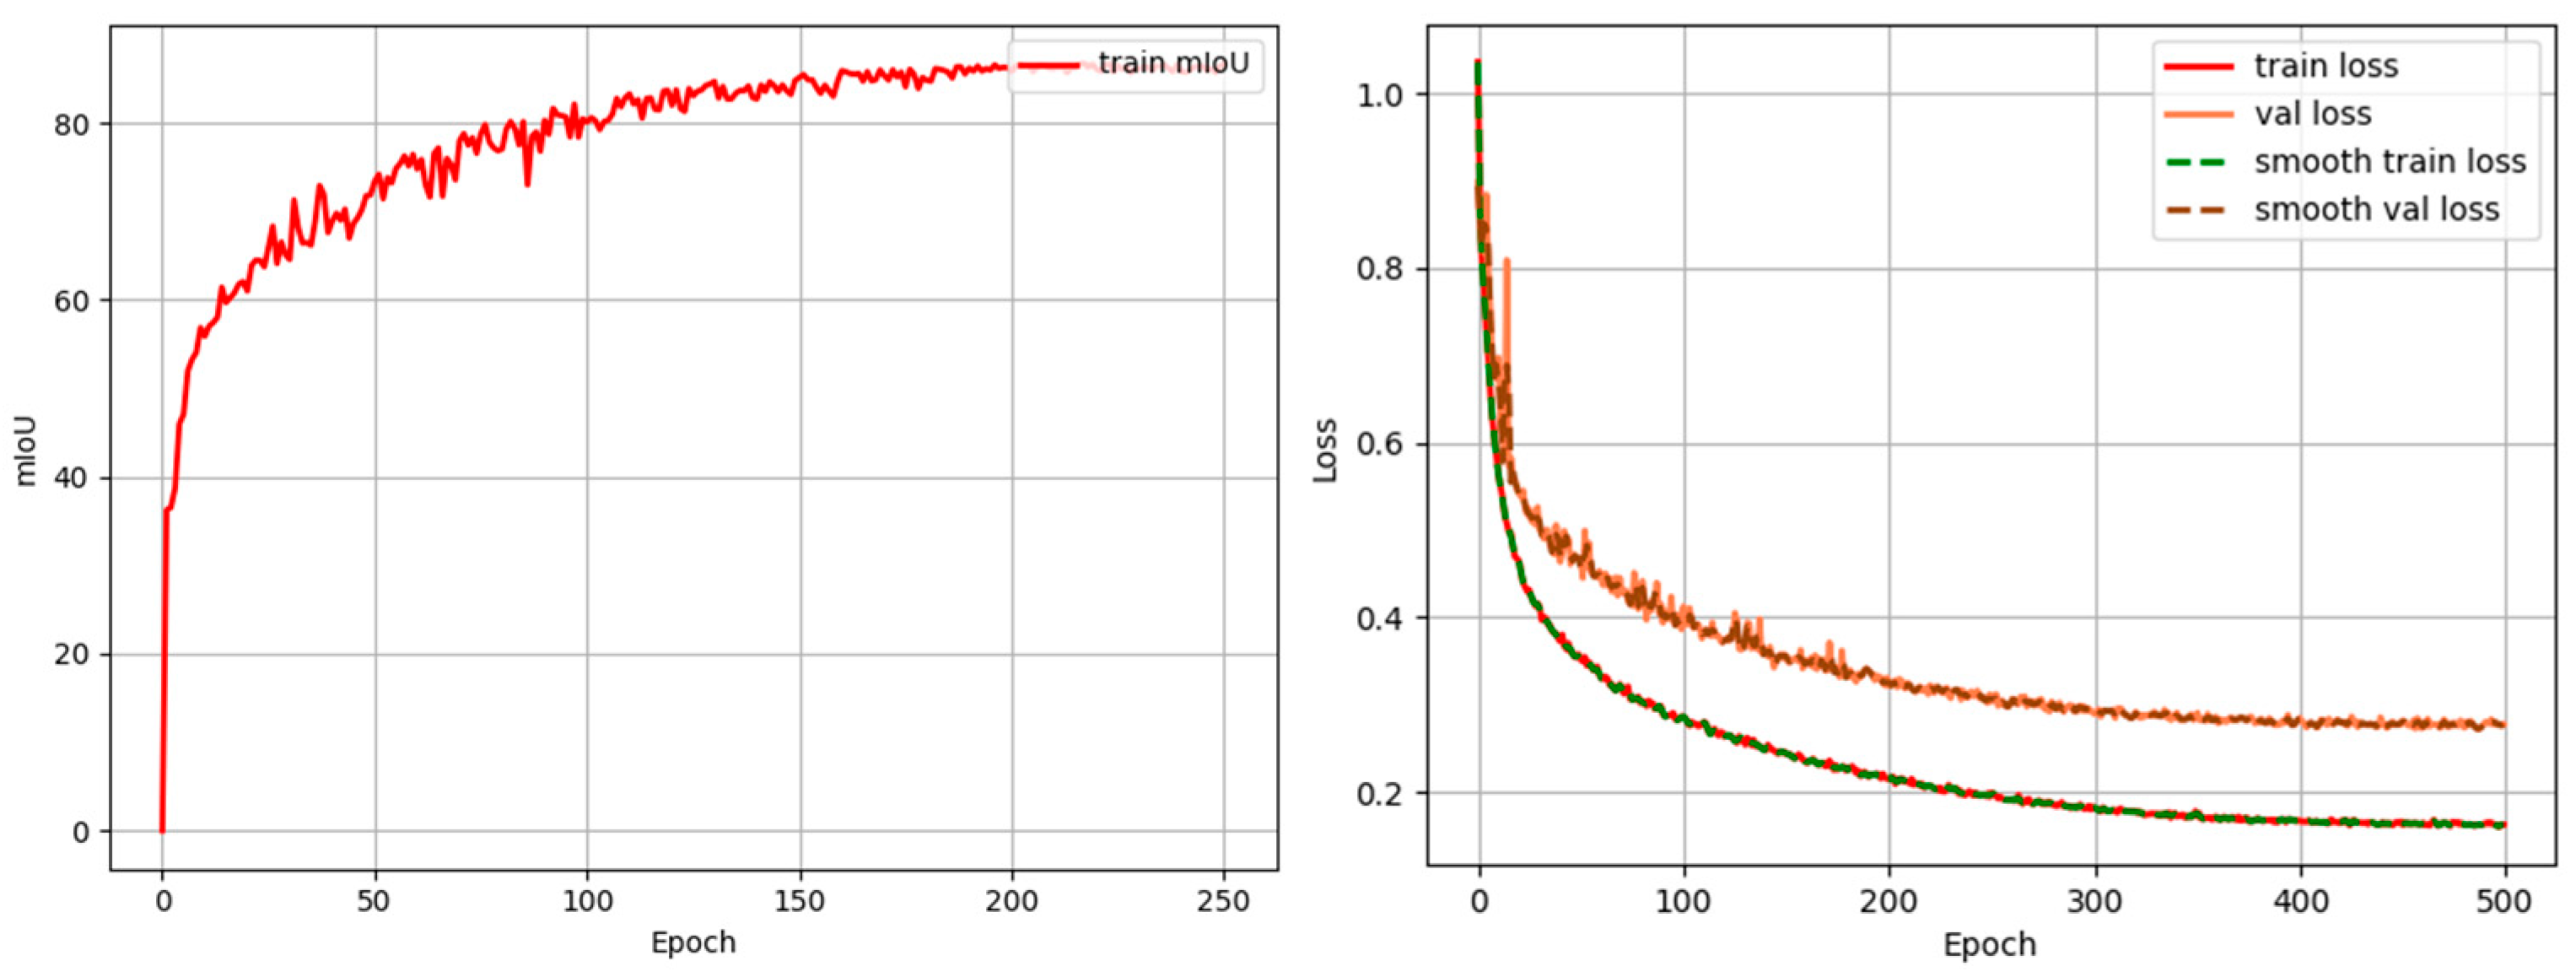
As shown in Figure 11, the result parameters of the performance evaluation indicators predicted by the UNet2Plus network are as follows: mIoU is 86.67%, train_loss is 0.1630, and val_loss is 0.2775. When the UNet2Plus network processes tiny targets in high-resolution images, it may still experience missed or false detections. Secondly, the problems of complex edge areas and blurred object boundaries can also lead to the difficulty of accurately segmenting the model.
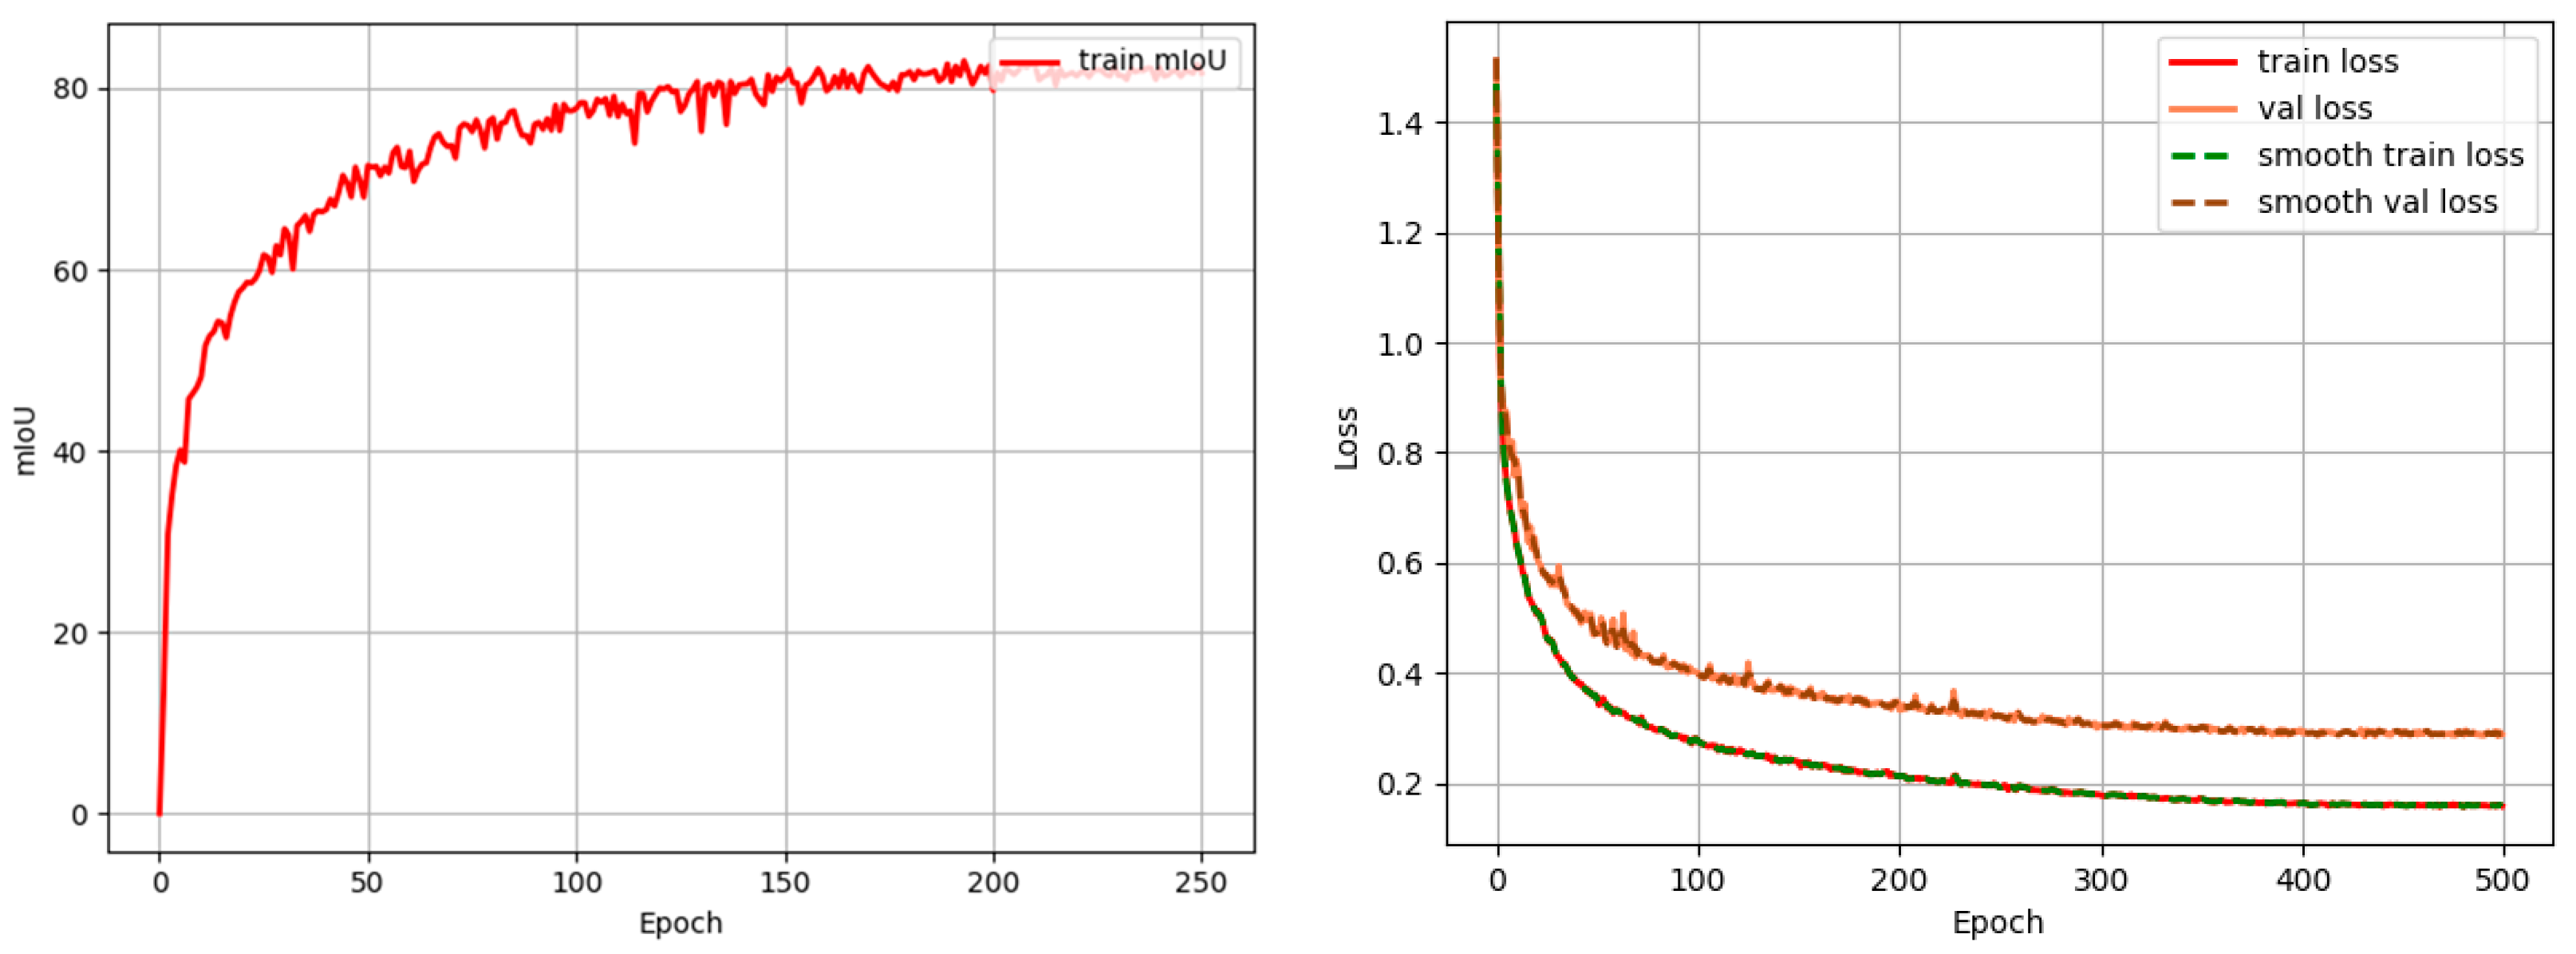
As shown in Figure 12, the result parameters of the performance evaluation indicators for the Siam-NestedUNet network prediction are mIoU is 81.67%, train_loss is 0.1578, and val_loss is 0.2882.
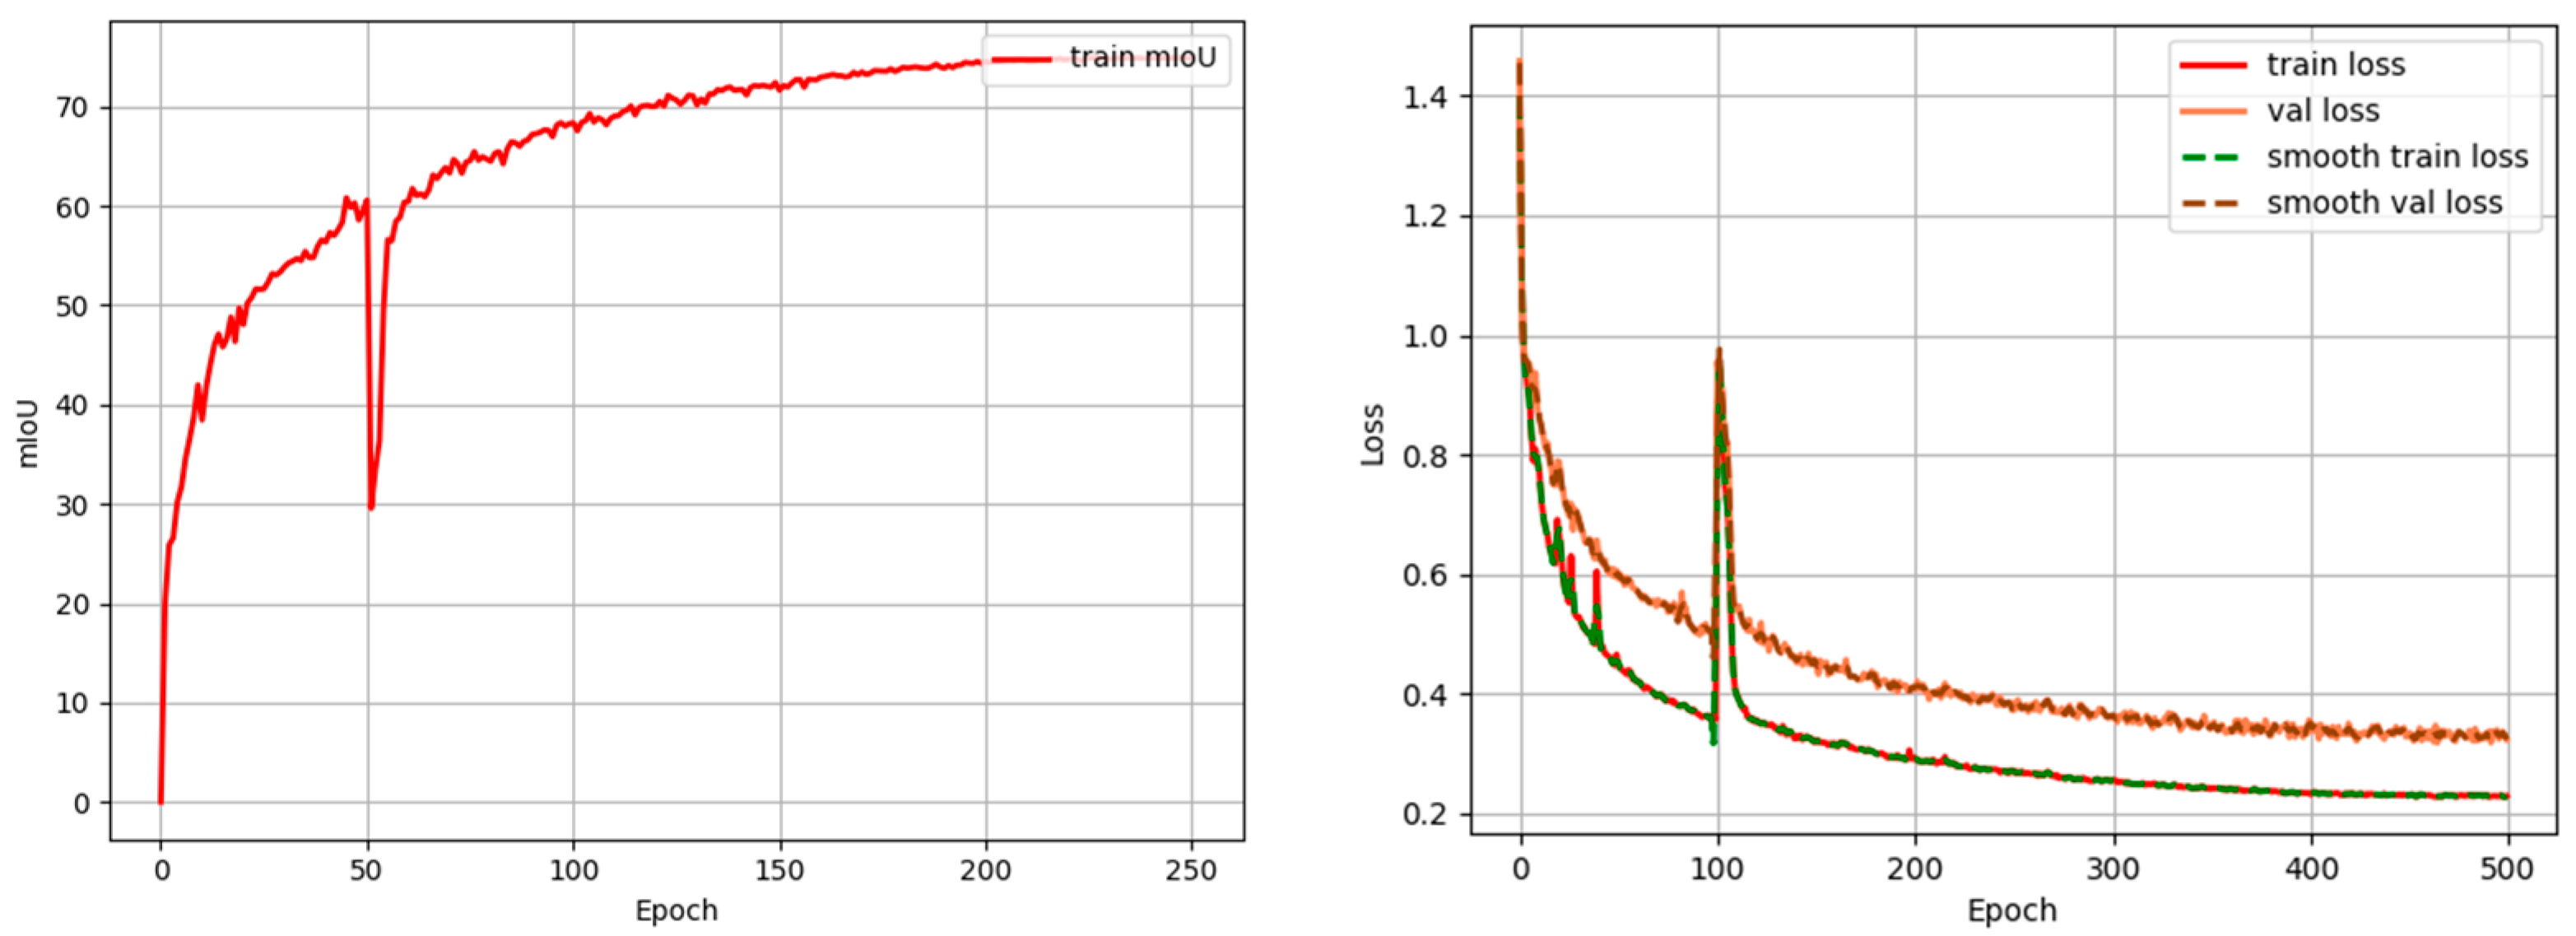
As shown in Figure 13, the result parameters of the performance evaluation indicators for the SwinUnet network prediction are as follows: mIoU is 74.89%, train_loss is 0.2282, and val_loss is 0.3227. The SwinUnet network performs the worst in the object segmentation task.
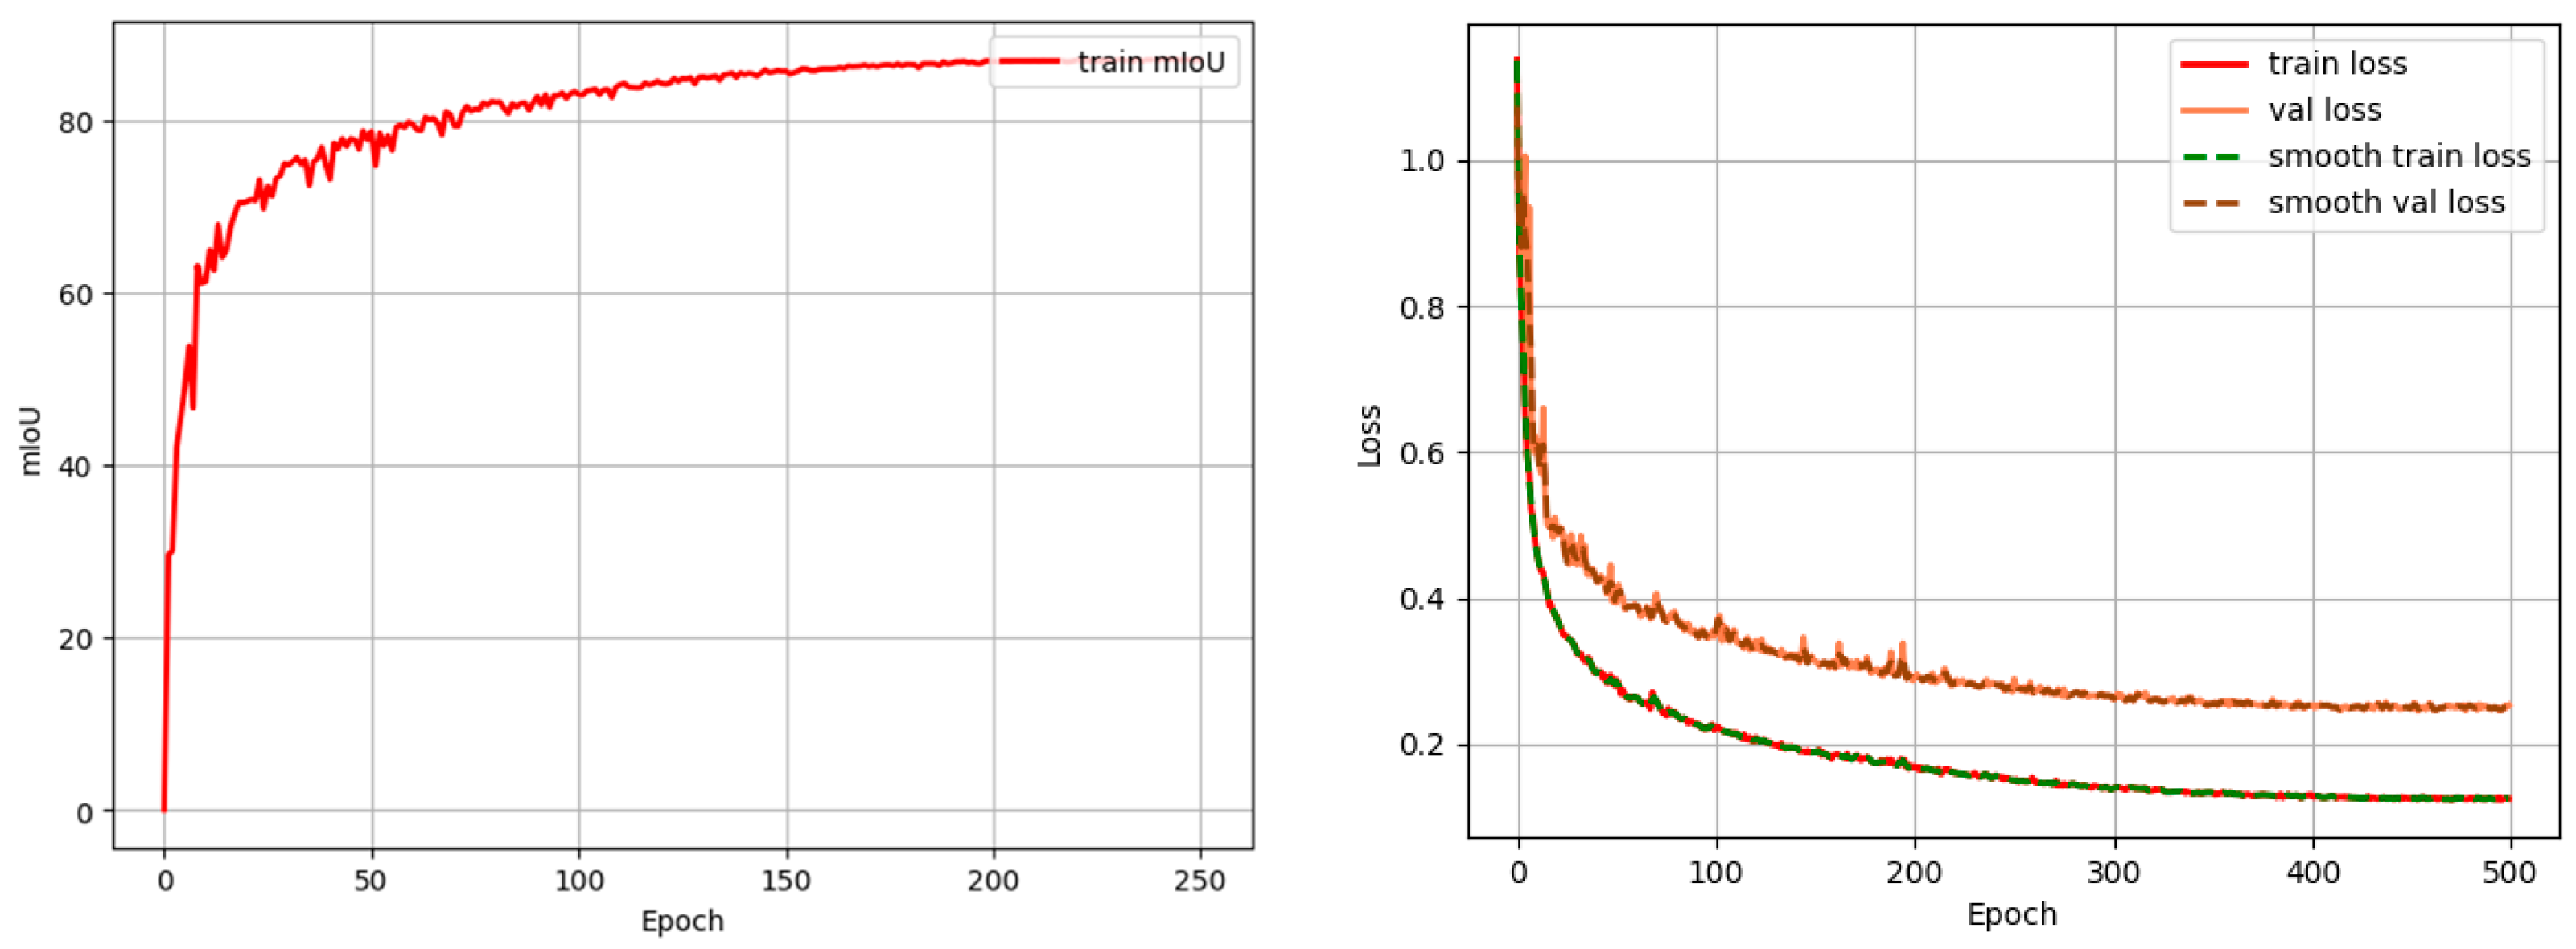
As shown in Figure 14, the result parameters of the performance evaluation indicators for the SmaAt-UNet network prediction are as follows: mIoU is 86.91%, train_loss is 0.1253, and val_loss is 0.2533. Although SmaAt-UNet performs well in object segmentation, the model highly depends on high-quality labeled data.
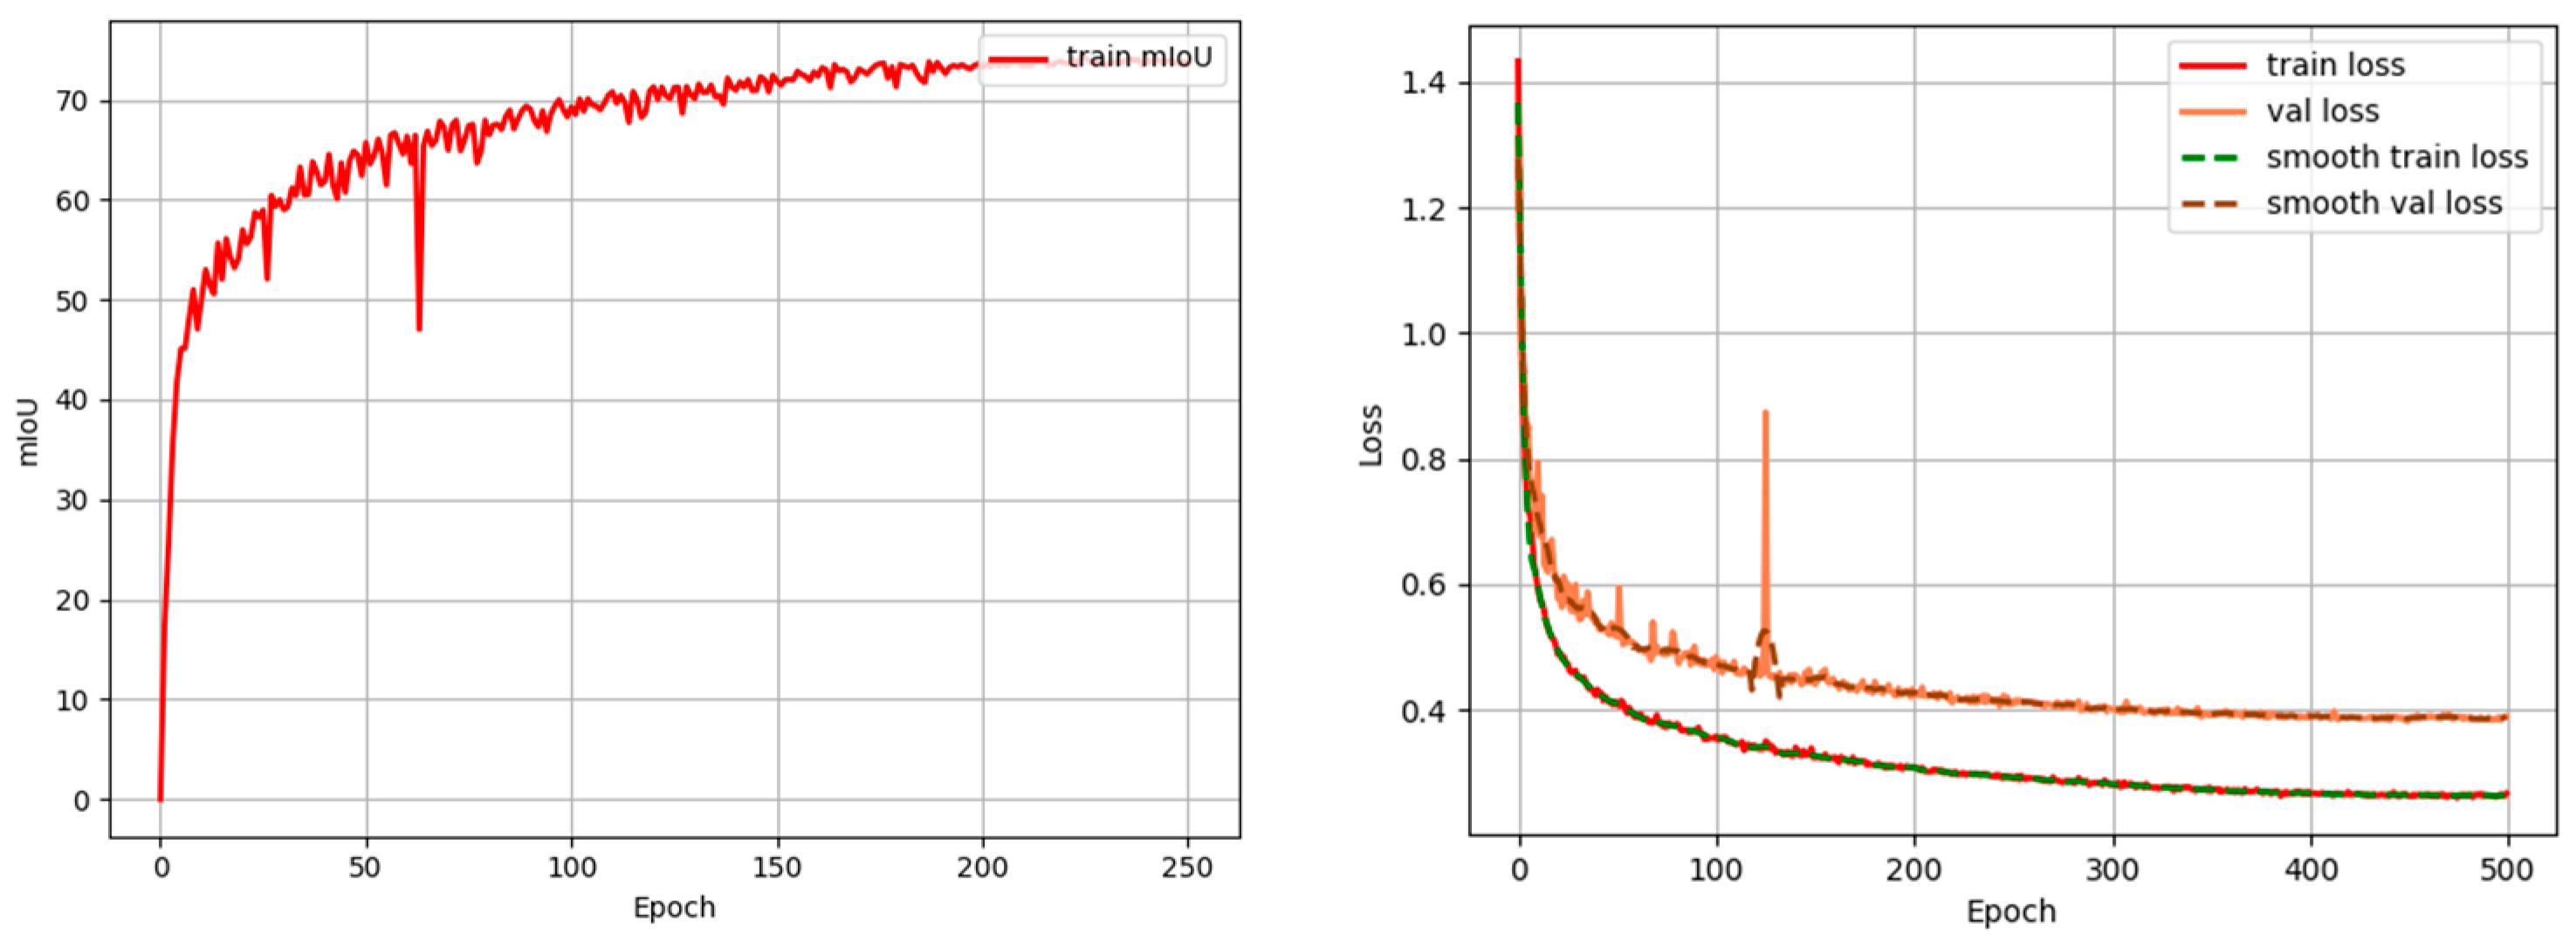
As shown in Figure 15, the result parameters of the performance evaluation indicators for the UNext network prediction are as follows: mIoU is 73.55%, train_loss is 0.2672, and val_loss is 0.3897. The UNext network performs the worst in the object segmentation task.
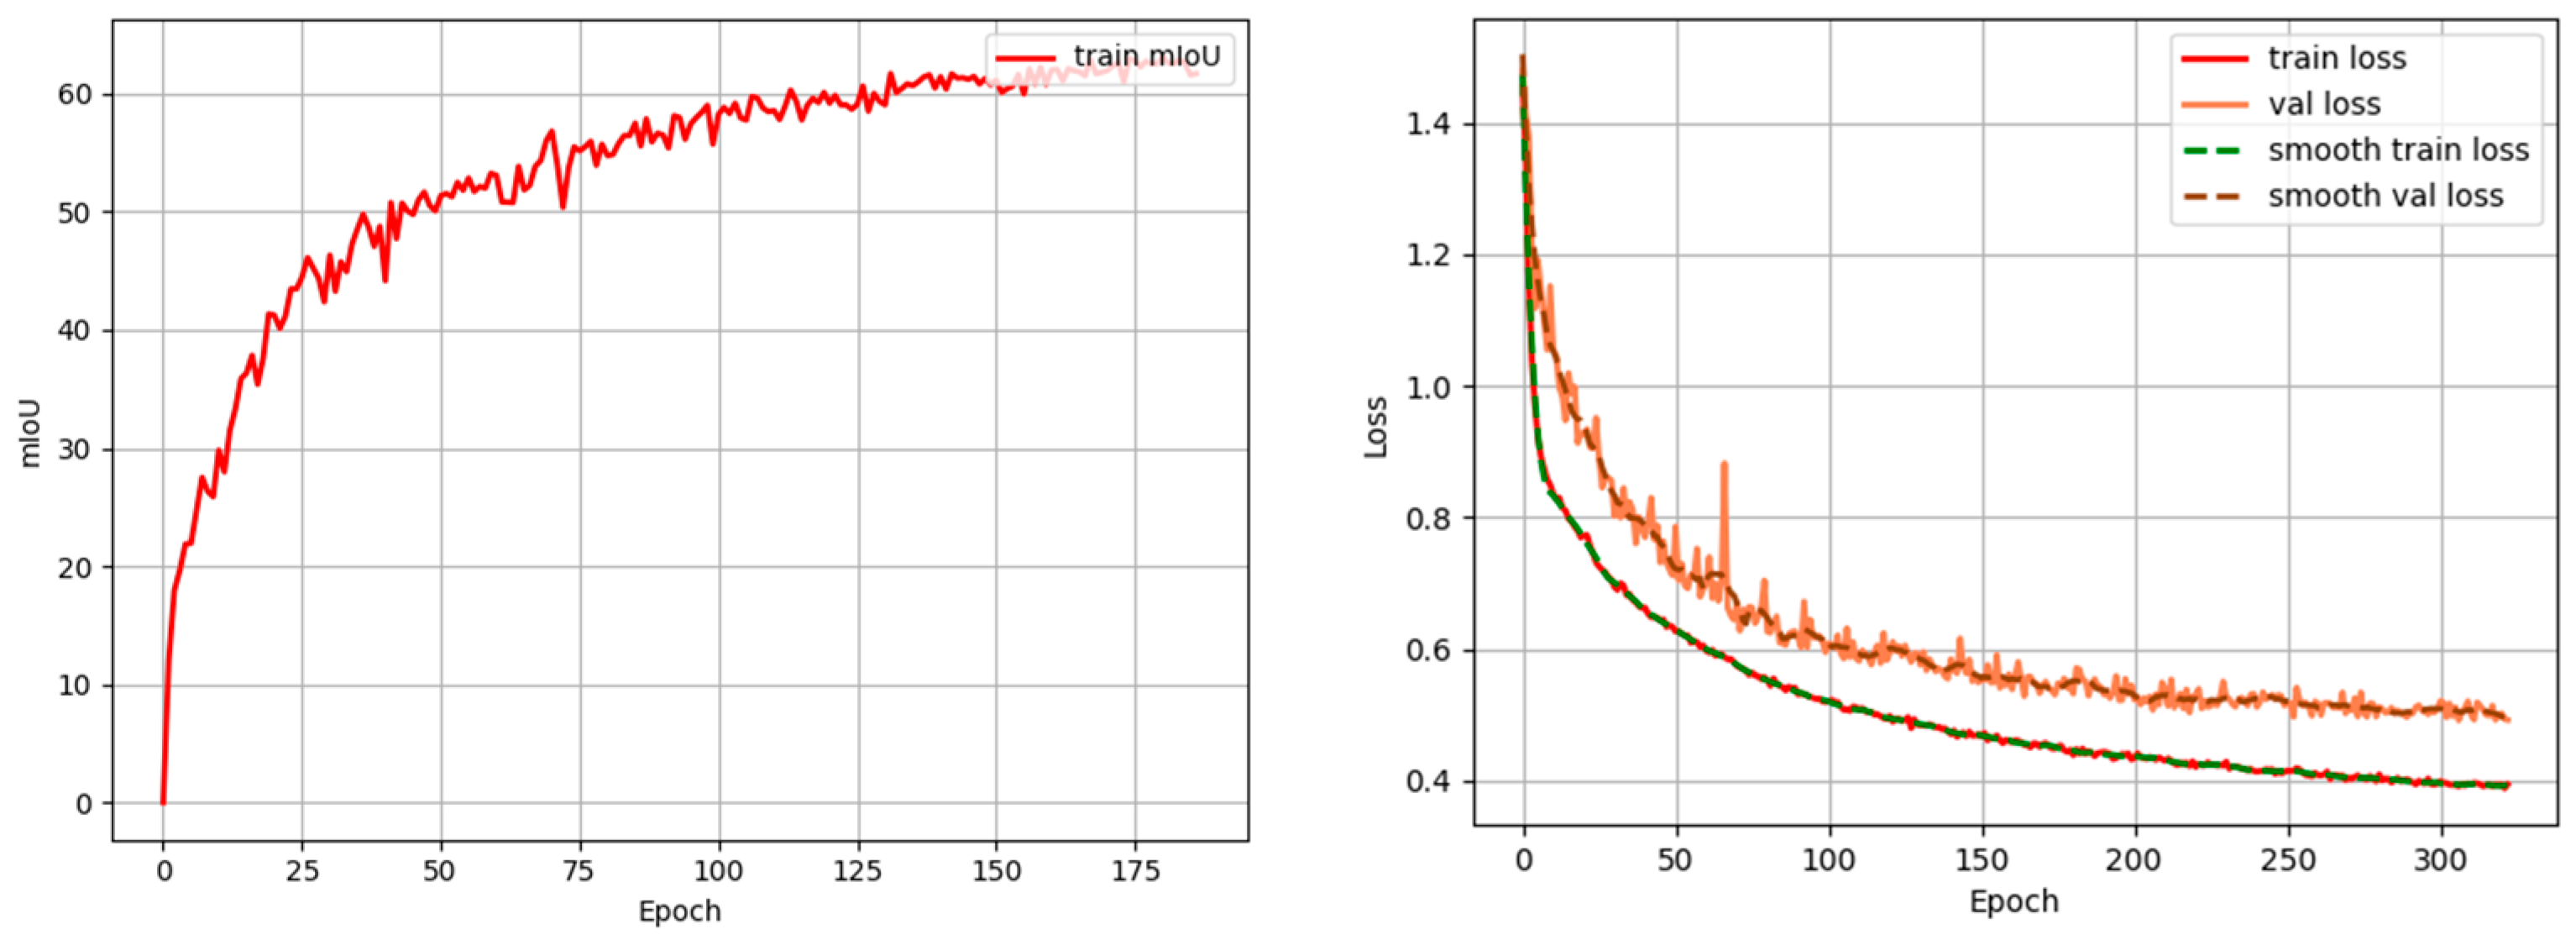
As shown in Figure 16, the result parameters of the performance evaluation indicators for the FR-UNet network prediction are as follows: mIoU is 62.04%, train_loss is 0.3942, and val_loss is 0.4921. The FR-UNet network performs the worst in the object segmentation task.
As shown in Figure 17, the result parameters of the performance evaluation indicators for the DeepLabV3+ network prediction are mIoU is 83.45%, train_loss is 0.2295, and val_loss is 0.3148. Thus, the superiority of the CrossAtt-UNet network is verified.
As shown in the experimental data in Table 3, from the analysis of the experimental data, it can be seen that in the comparison of the parameters of F1-score, mIoU, mAP, accuracy, train_loss, and val_loss of the CrossAtt-UNet segmentation architecture proposed in this study, the experimental data indicators are all higher than those of the mainstream segmentation network models. The fps meets the requirements of real-time performance. This network has high precision and strong generalization ability in the semantic segmentation of complex urban scenes. The model stably realizes the accurate discrimination and segmentation of boundaries between different categories, thereby highlighting the outstanding performance of this network architecture in multi-level semantic understanding and category discrimination.
In summary, the contribution of this study lies not only in applying Cross Attention to residential remote sensing image segmentation but also in tailoring the module to the specific characteristics of this domain. Experimental results demonstrate its advantages in accuracy, boundary recognition, and generalization performance. Specifically, the proposed CrossAtt-UNet achieved an accuracy of 95.47%, an mAP of 94.57%, an mIoU of 89.80%, an F1-score of 94.63%, a train_loss of 0.0878, and a val_loss of 0.1459 on the URSSD dataset, significantly outperforming mainstream models. The UNext model adopts a lightweight architecture with relatively fewer parameters and lower computational complexity, leading to faster inference and a significantly higher FPS than other attention-based networks. In contrast, CrossAtt-UNet incorporates a Cross Attention module that substantially enhances multi-scale feature interaction and boundary recognition. However, this improvement comes at the cost of additional computational overhead, resulting in a slightly lower FPS.
Nevertheless, CrossAtt-UNet achieves markedly higher mAP, F1-score, accuracy, and mIoU than UNext. Because accuracy and robustness are often prioritized over extreme inference speed in remote sensing residential area semantic segmentation tasks, CrossAtt-UNet remains highly valuable and practically applicable despite its modest FPS reduction. Moreover, cross-dataset experiments on concrete crack detection further confirmed its robustness, indicating that the proposed method improves accuracy and exhibits strong generalization ability.

3.3. Ablation Experiment

As shown in Table 4, the ablation experiments further validate the effectiveness of the proposed CrossAtt-UNet architecture. When both the Attention Gate and the Cross Attention module are removed, the performance drops dramatically, with the mIoU decreasing to 58.95% and both train_loss and val_loss exceeding 0.99. Incorporating the Attention Gate alone improves the mIoU to 79.83%, indicating its crucial role in refining salient features and enhancing boundary discrimination. However, the complete CrossAtt-UNet model, which integrates both modules, achieves the highest performance with an accuracy of 95.47%, mAP of 94.57%, and mIoU of 89.80%, while simultaneously reducing the loss values to 0.0878 (train_loss) and 0.1459 (val_loss). These results demonstrate that the joint introduction of the Attention Gate and Cross Attention mechanism substantially strengthens feature representation, promotes spatial continuity, and ensures more robust semantic segmentation in complex urban scenes. The ablation study, therefore, highlights the indispensability of both components and underscores the superior performance and robustness of the CrossAtt-UNet framework. The complete CrossAtt-UNet exhibits significantly superior performance in mIoU and the estimated F1-score compared with its ablated variants. Removing the Attention Gate leads to a marked decline in performance, with the F1-score decreasing from approximately 94.6% to 88.8%. When both the Attention Gate and Cross Attention are removed, the performance further deteriorates substantially, with the F1-score dropping to around 74.1%. These results indicate that the Attention Gate and Cross Attention modules play a critical role in enhancing the model’s overall performance.

3.4. Network Generalization Experiment

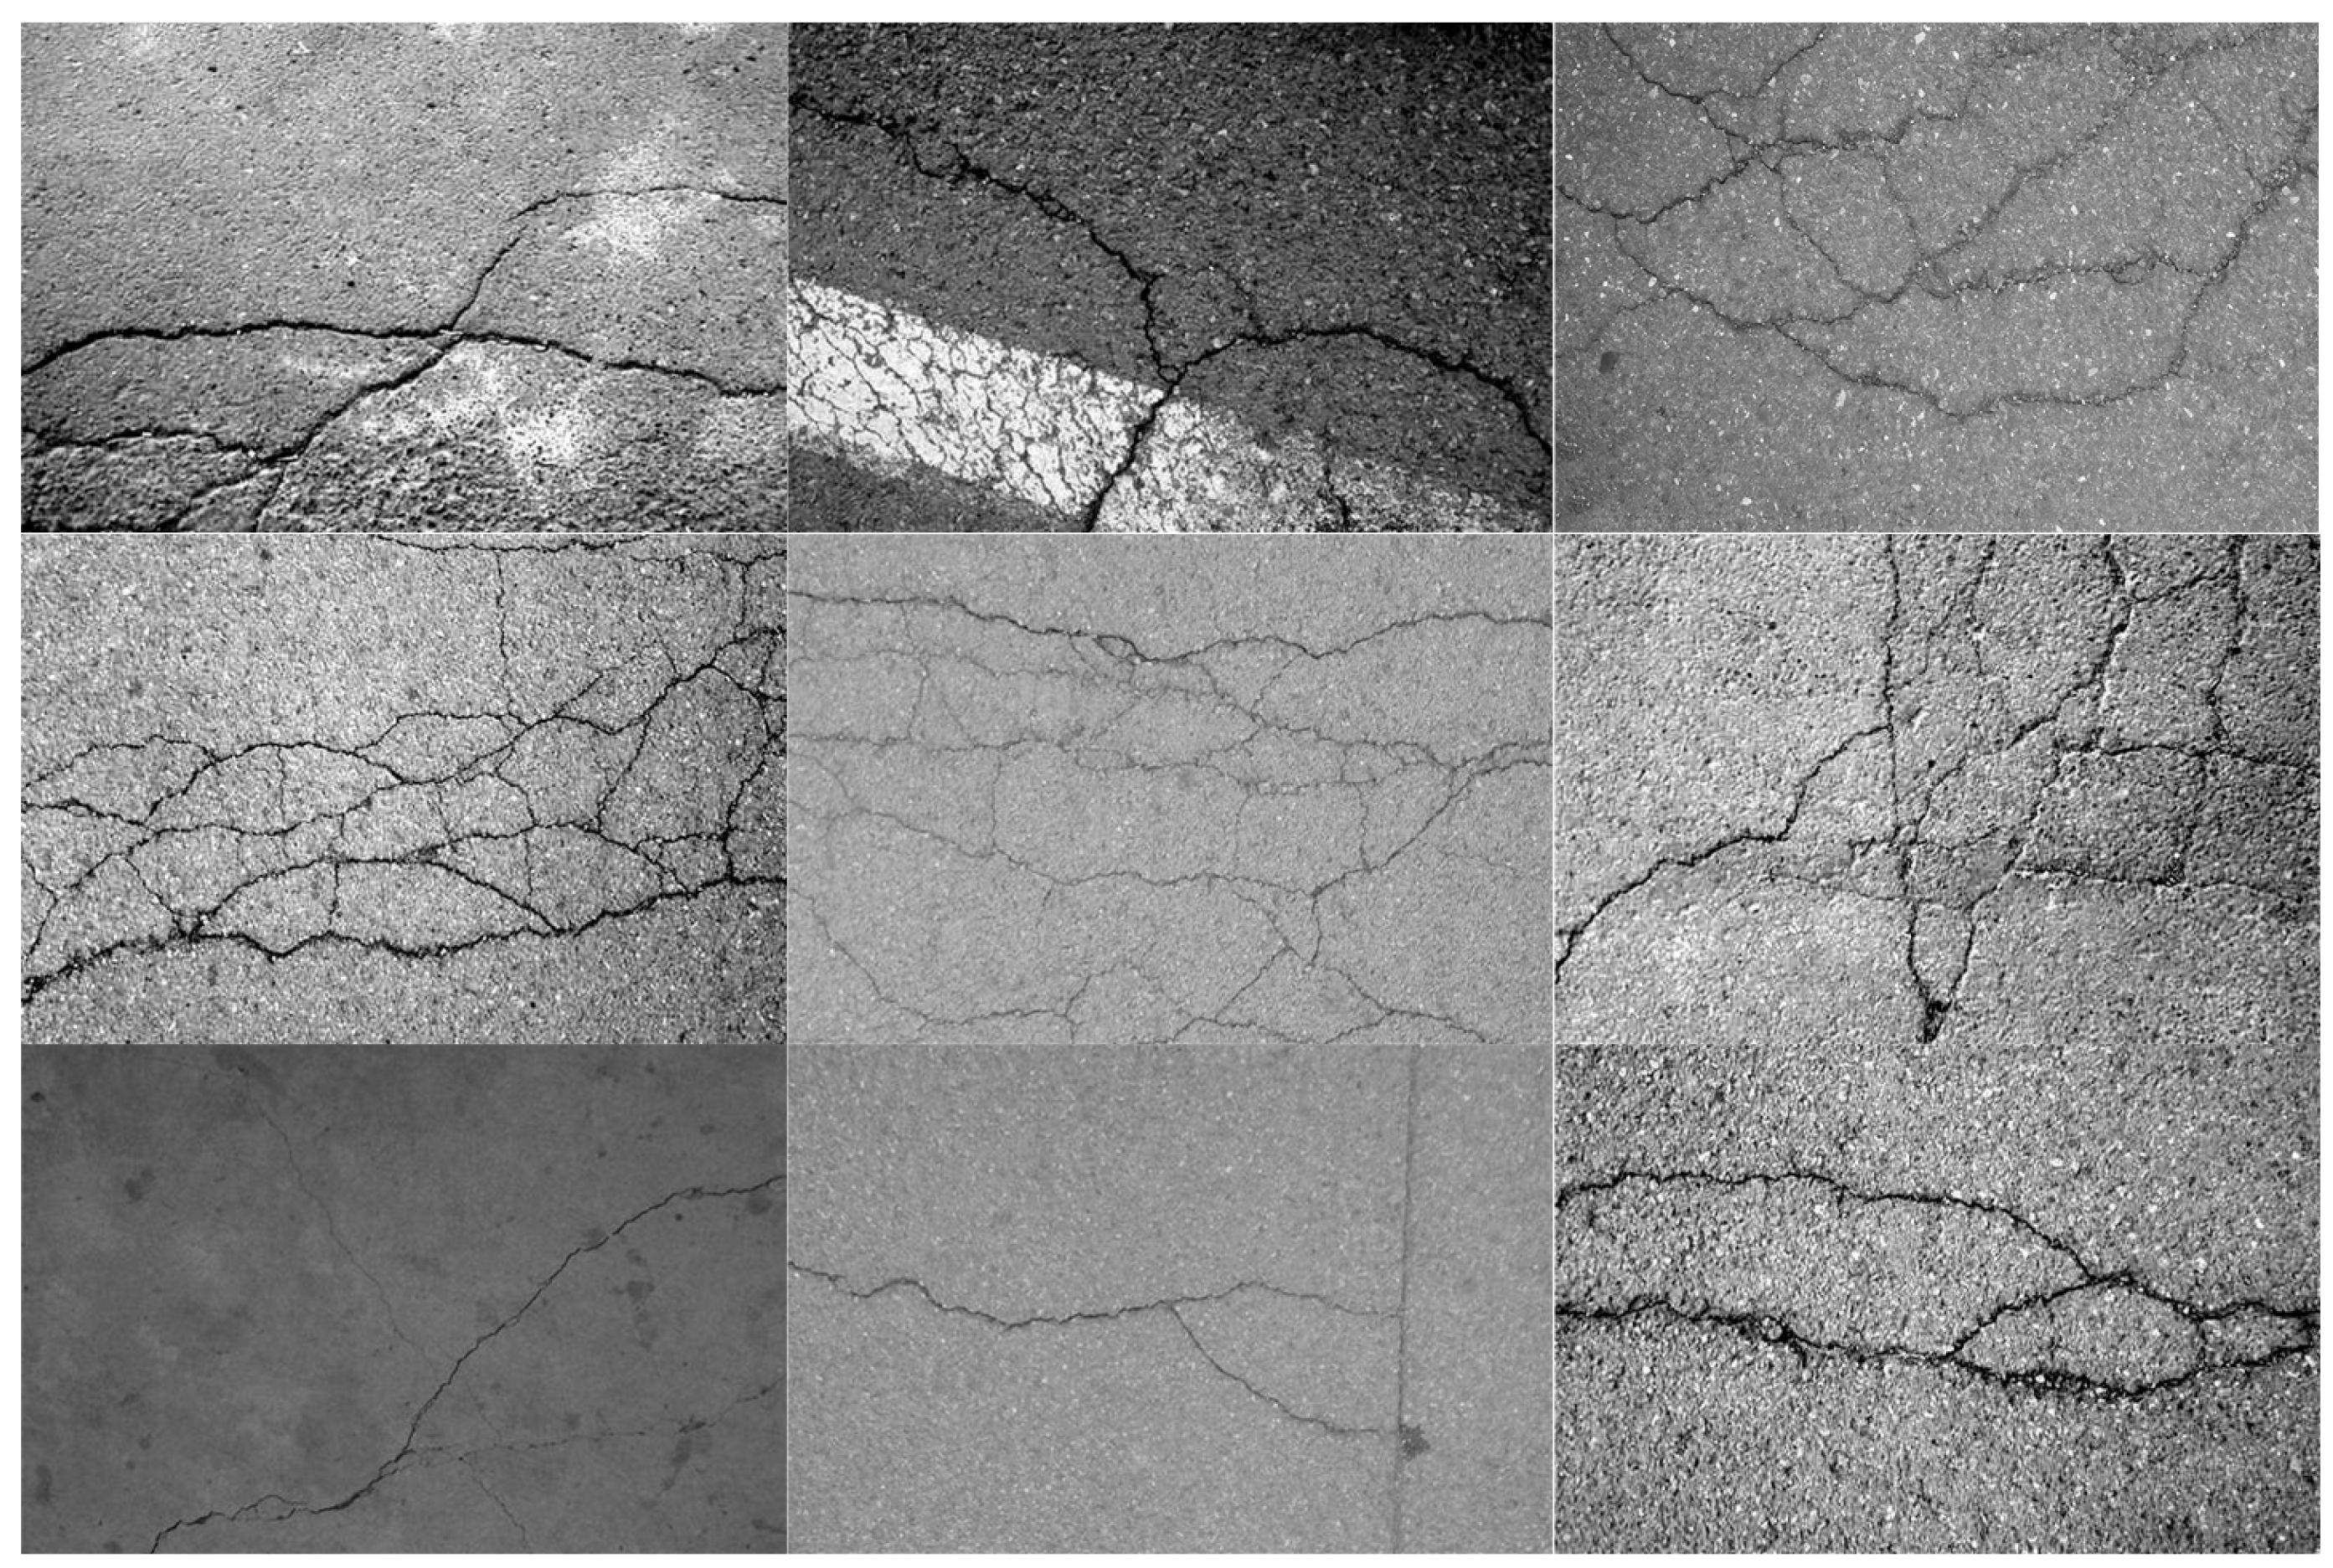
The superiority of CrossAtt-UNet in tasks has been verified in URSSD. To demonstrate the superior segmentation performance of the proposed CrossAtt-UNet algorithm and to verify its applicability to other datasets, this study evaluates the model’s generalization capability and stability characteristics in the public dataset for concrete damage detection [38,39]. This dataset is designed to support high-precision damage location and classification tasks. It is an important basis for the health monitoring of concrete infrastructure such as bridges, tunnels, and building walls. The 2147-labeled dataset for concrete damage detection is a collection that combines images of concrete structures with their corresponding pixel-level damage labels, used for training, validating, and testing semantic segmentation or instance segmentation models. As shown in Figure 18, it is the original image for concrete damage detection.
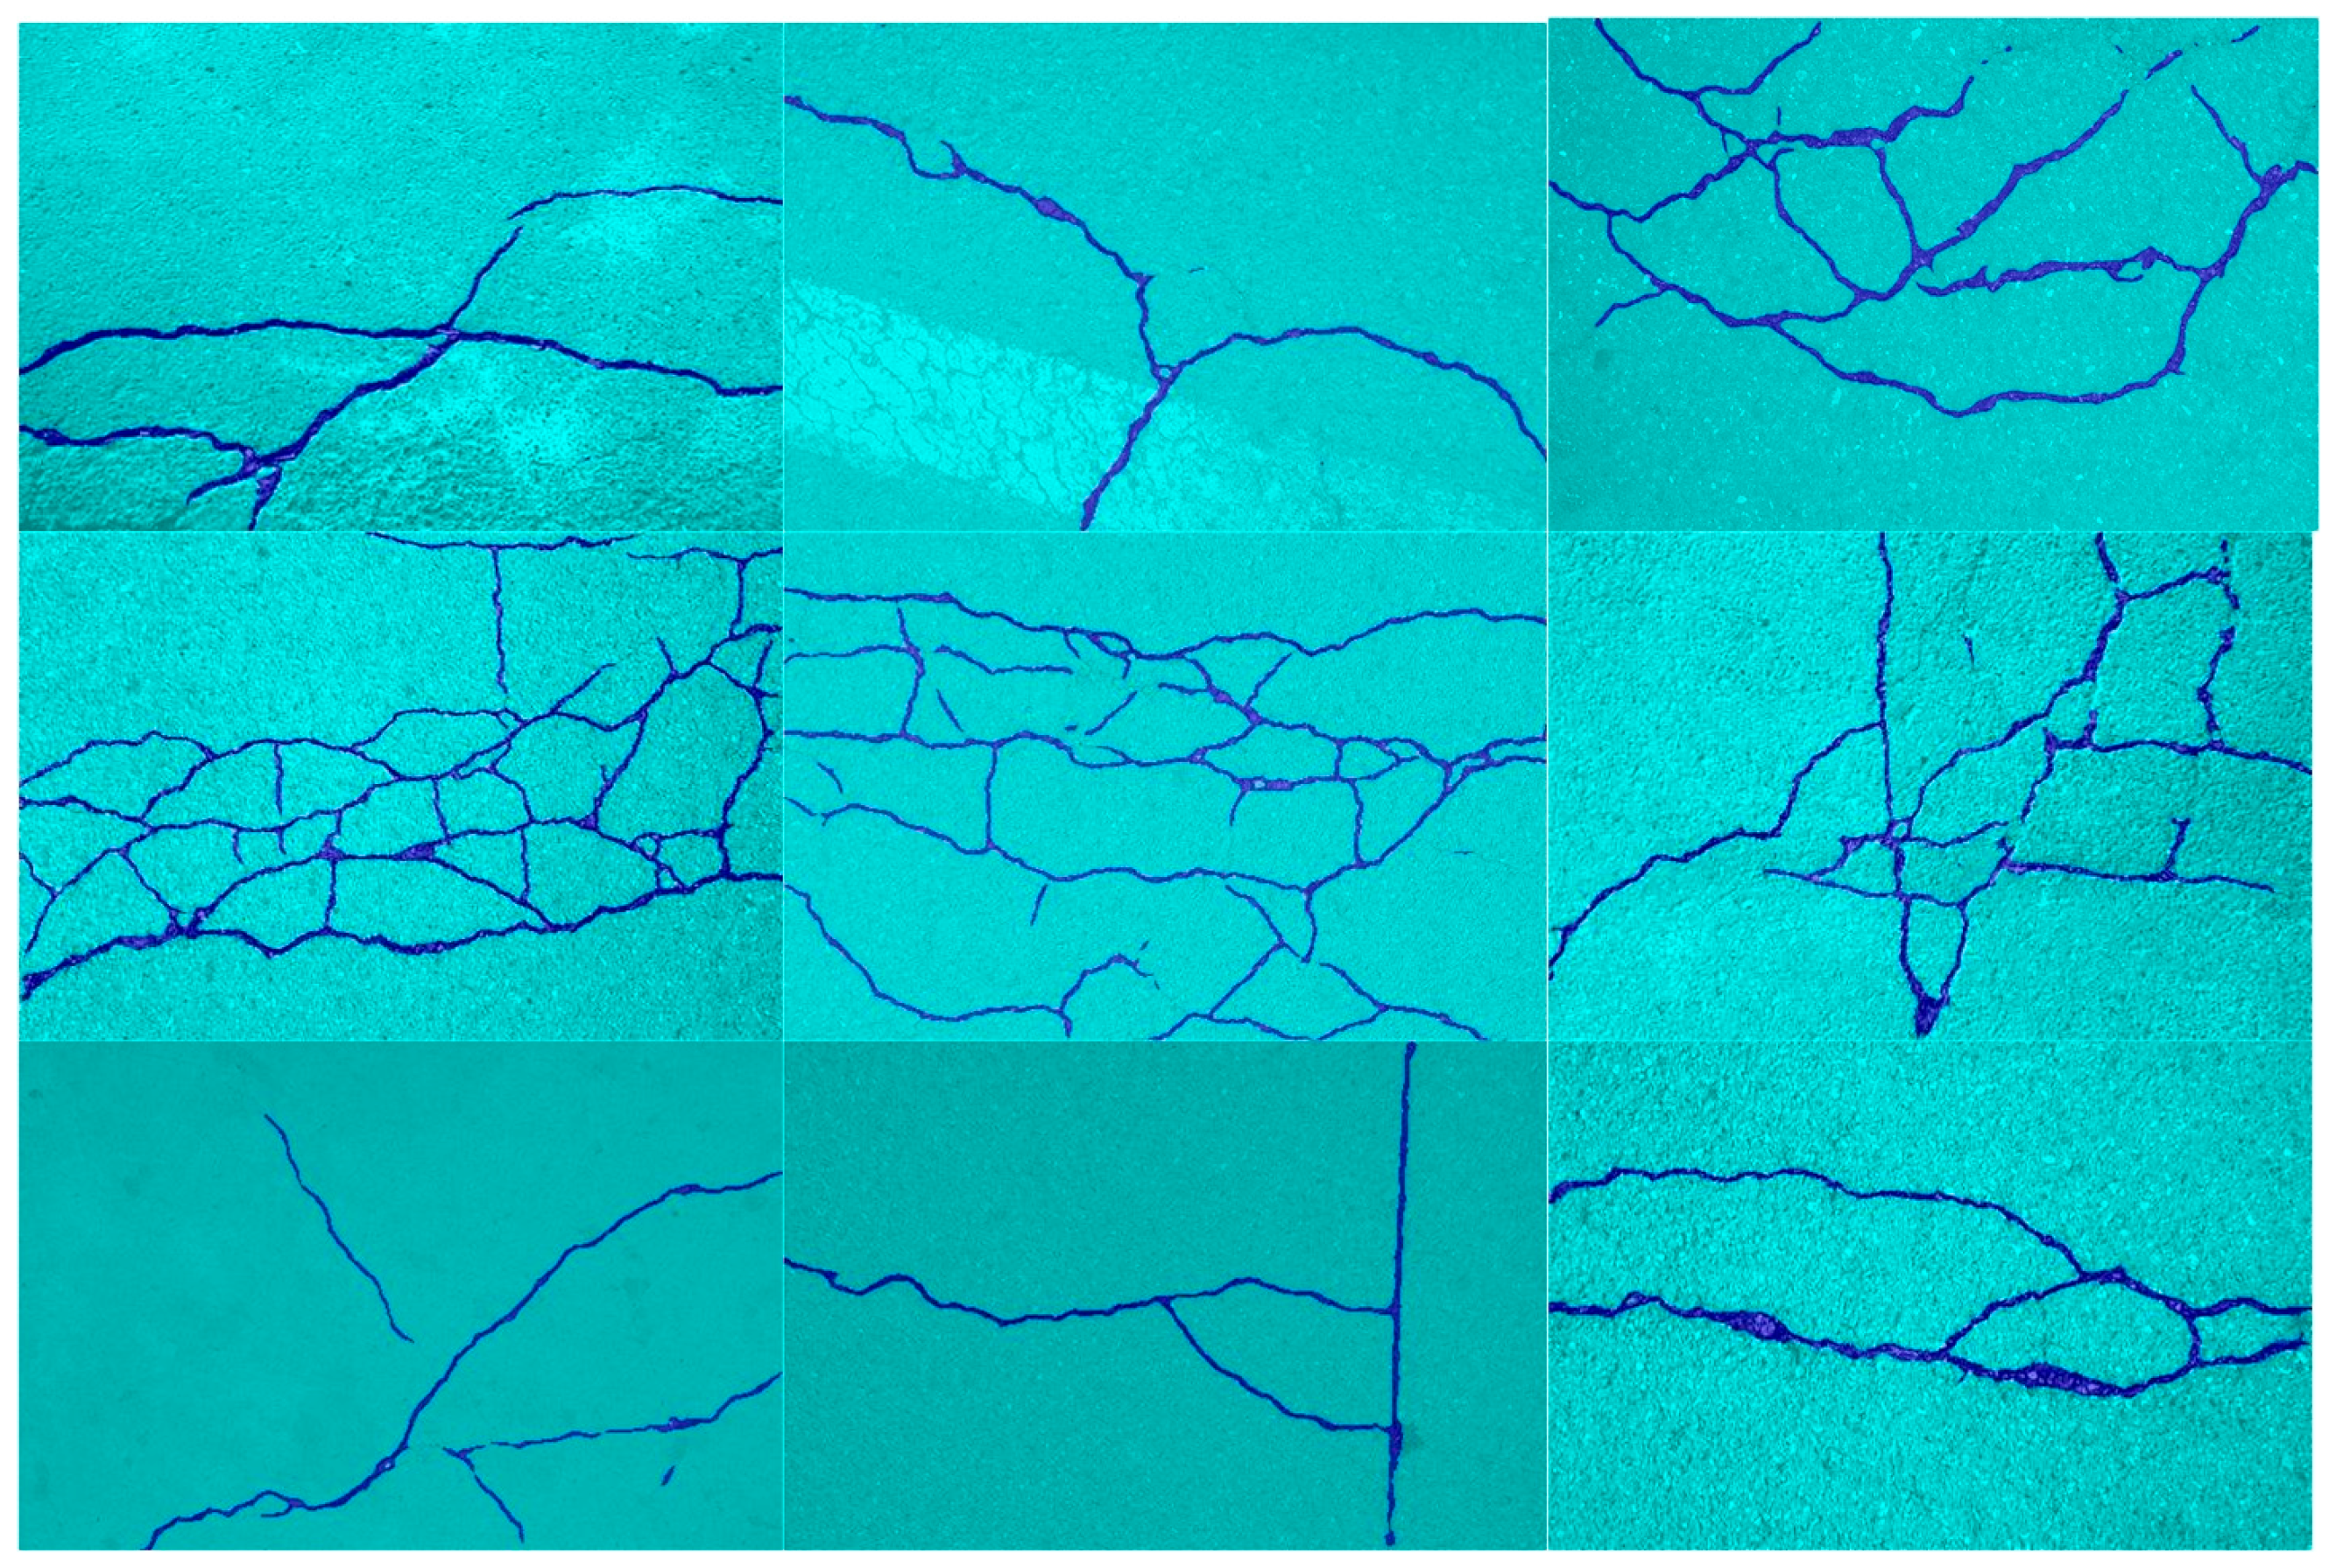
Figure 19 presents the detection results of concrete surface cracks by CrossAtt-UNet. Corresponding one-to-one with the original image in Figure 18, the blue highlighted areas in the figure represent the crack positions detected by the model. From the image results, this model can effectively capture the characteristics of various forms of cracks. (1). Irregular reticular cracks, complex crack structures, and dense intersections. The model can still accurately delineate their orientation and connectivity. (2). Slender linear cracks. This model can detect delicate but continuous crack structures, demonstrating excellent detail perception ability. (3). Cracks in the low-contrast background. Although the gray-scale difference between the cracks and the background is insignificant, the model still shows strong robustness.
As shown in the experimental data in Table 5, the CrossAtt-UNet image segmentation task demonstrates a significant performance improvement. Its detection accuracy and robustness are superior to the comparison methods, verifying the practical value of this algorithm. CrossAtt-UNet significantly enhances cross-level interactions between global and local features by incorporating the Cross Attention module, thereby improving its representational capacity. However, this added complexity also makes gradient propagation more intricate, which may lead to local oscillations or a slower convergence rate, resulting in a slightly higher validation loss (val_loss) compared to FR-UNet. Nevertheless, CrossAtt-UNet achieves substantially better F1-score, mAP, accuracy, and mIoU than FR-UNet, demonstrating stronger robustness and practical value in complex segmentation scenarios. CrossAtt-UNet can achieve relatively accurate crack extraction under different crack scales, morphologies, and texture backgrounds, reflecting good generalization performance and stability.

4. Discussion

The CrossAtt-UNet network architecture proposed in this paper addresses the core problems, such as low classification accuracy, unclear edges, and weak structural coherence in the semantic segmentation task of urban residential areas in remote sensing images. It proposes an innovative cross-attention mechanism and verifies its superiority in multiple dimensions. By introducing the Cross Attention module, based on maintaining the efficient coding-decoding ability of the Att-UNet architecture, the modeling ability of the model for cross-channel and cross-dimensional semantic features has been significantly enhanced, the receptive field has been effectively expanded, and the level of spatial context understanding has been improved.
Firstly, from the perspective of quantitative indicators, CrossAtt-UNet achieved an mIoU of 89.80%, an accuracy of 95.47%, an F1-score of 94.63%, an mAP of 94.57%, an fps of 15.72 on URSSD, a training loss of 0.0878, and a validation loss of 0.1459. It is significantly superior to other traditional UNet. This indicates that the CrossAtt module effectively enhances the feature interaction ability and semantic expression accuracy of the model without significantly increasing the complexity of the network.
Secondly, from the perspective of the qualitative analysis results, CrossAtt-UNet performs well in the continuity of the target boundary, the restoration of fine-grained structures, and the recognition of small targets. In the comparative experiment shown in Figure 6, multiple red-box-marked areas indicate that the model can accurately extract typical targets in living areas such as buildings, trees, and vehicles, and effectively avoid the misclassification problem caused by small target sizes or blurred edges. Especially when compared with models such as UNet, DeepLabV3+, UNet50, SwinUnet, SmaAt-UNet, Att-UNet, and UNet2Plus, its advantages in boundary recognition accuracy and regional coherence are particularly prominent, further verifying the effectiveness of the Cross Attention mechanism in the modeling of complex spatial structures.
In addition, this paper also carried out cross-dataset generalization experiments and selected the concrete damage detection task as the test scenario. In the context of such domain transitions, CrossAtt-UNet still maintains high segmentation accuracy and robustness. It outperforms other mainstream models in comprehensive indicators, indicating that this model is also adaptable in various complex visual tasks other than urban remote sensing images and shows broad practical application potential.
To sum up, urban planning and infrastructure monitoring are important applications of remote sensing image technology. The CrossAtt-UNet proposed in this paper not only achieves excellent performance in the semantic segmentation task of living areas in remote sensing images but also provides a new idea for effectively solving the difficulties in identifying complex target structures and extracting boundary information in remote sensing semantic segmentation. This method shows reasonable practicability and general ability in actual remote sensing scenarios. Using the images obtained by drone aerial photography as a valuable source for monitoring urban changes can help plan future development and provide reliable technical support for subsequent smart city construction, urban functional zoning, land use monitoring, and intelligent city management. Furthermore, robust, efficient, and scalable semantic segmentation algorithms can be developed that can be deployed and used with less training effort. Combined with embedded hardware, powerful computing resources, and lightweight networks, it is the future of artificial intelligence applications.

5. Conclusions

This paper proposes a new network model, CrossAtt-UNet, for automatic segmentation and accurate recognition of urban residential areas in high-resolution remote sensing images. This paper takes Att-UNet as the core framework and integrates the Cross Attention module, which can cover a larger perception area and save computing resources. It significantly improves the ability to capture cross-level feature dependencies, enhances the feature collaborative complementarity ability, and improves the overall performance of semantic segmentation and the topological connection of the target area. The experimental results thoroughly verify the excellent performance of the proposed CrossAtt-UNet model on URSSD, achieving a better balance between semantic segmentation accuracy and spatial structure integrity of the network. The performance evaluation of the network obtained that the accuracy is 95.47%, the F1-score is 94.63%, the mAP is 94.57%, the mIoU is 89.80%, the train_loss is 0.0878, and the val_loss is 0.1459, demonstrating its effectiveness in maintaining structural coherence and boundary recognition accuracy and showing strong generalization ability and practical application value.
Although this paper has made breakthroughs in enhancing the semantic segmentation performance of remote sensing images in urban areas, it can still be optimized in the following ways: The image preprocessing link can be optimized to enhance the quality and information expression of the original data. It is necessary to systematically study the efficient fusion and extraction approaches of multi-scale features, thereby enhancing the semantic understanding ability and processing efficiency of the model and saving operational costs. It is possible to introduce multi-source remote sensing datasets to develop multimodal networks to enhance the model’s generalization and fault tolerance when dealing with diverse terrains. The paper proposes incorporating imbalance-handling strategies such as Weighted Cross-Entropy and Dice Loss to improve segmentation performance for minority classes. We also plan to conduct comparative experiments to validate the effectiveness of these methods.

Author Contributions

Conceptualization, Y.M. and B.Z.; methodology, C.W.; software, R.S. and B.Z.; validation, Y.M. and B.Z.; formal analysis, C.W.; investigation, R.S.; resources, C.W.; writing—original draft preparation, R.S.; writing—review and editing, B.Z. and Y.M.; funding acquisition, R.S. and C.W. All authors have read and agreed to the published version of the manuscript.

Funding

This research is funded by the Ministry of Industry and Information Technology Project under grant (TC220H05X-04). Development and application of autonomous working robots in large scenes(02210073421003). Research and development of automatic inspection flight control technology for satellite denial environment UAV(02210073424000).

Data Availability Statement

Data are contained within the article.

Conflicts of Interest

Authors Bin Zhao, Yang Mi and Ruohuai Sun was employed by the company SIASUN Robot & Automation Co., Ltd. The remaining authors declare that the research was conducted in the absence of any commercial or financial relationships that could be construed as a potential coflict of interest.

References

  1. He, X.; Zhou, Y.; Zhao, J.; Zhang, D.; Yao, R.; Xue, Y. Swin Transformer Embedding UNet for Remote Sensing Image Semantic Segmentation. IEEE Trans. Geosci. Remote Sens. 2022, 60, 4408715. [Google Scholar] [CrossRef]
  2. Fan, L.; Zhou, Y.; Liu, H.; Li, Y.; Cao, D. Combining Swin Transformer with UNet for Remote Sensing Image Semantic Segmentation. IEEE Trans. Geosci. Remote Sens. 2023, 61, 5530111. [Google Scholar] [CrossRef]
  3. Zhao, X.; Wu, Z.; Chen, Y.; Zhou, W.; Wei, M. Fine-Grained High-Resolution Remote Sensing Image Change Detection by SAM-UNet Change Detection Model. Remote Sens. 2024, 16, 3620. [Google Scholar] [CrossRef]
  4. Zhu, Z.; Zhang, S.; Qiu, L.; Wang, H.; Luo, G. Axis-Based Transformer UNet for RGB Remote Sensing Image Denoising. IEEE Signal Process. Lett. 2024, 31, 2515–2519. [Google Scholar] [CrossRef]
  5. Jonnala, N.; Bheemana, R.; Prakash, K.; Bansal, S.; Jain, A.; Pandey, V. DSIA U-Net: Deep shallow interaction with attention mechanism UNet for remote sensing satellite images. Sci. Rep. 2025, 15, 549. [Google Scholar] [CrossRef] [PubMed]
  6. Wang, X.; Hu, Z.; Shi, S.; Hou, M.; Xu, L.; Zhang, X. A deep learning method for optimizing semantic segmentation accuracy of remote sensing images based on improved UNet. Sci. Rep. 2023, 13, 7600. [Google Scholar] [CrossRef]
  7. Lv, Z.; Huang, H.; Gao, L.; Benediktsson, J.; Zhao, M.; Shi, C. Simple Multiscale UNet for Change Detection with Heterogeneous Remote Sensing Images. IEEE Geosci. Remote Sens. Lett. 2022, 19, 2504905. [Google Scholar] [CrossRef]
  8. Wang, X.; Fan, Z.; Jiang, Z.; Yan, Y.; Yang, H. EDFF-Unet: An Improved Unet-Based Method for Cloud and Cloud Shadow Segmentation in Remote Sensing Images. Remote Sens. 2025, 17, 1432. [Google Scholar] [CrossRef]
  9. Lu, Y.; Li, H.; Zhang, C.; Zhang, S. Object-Based Semi-Supervised Spatial Attention Residual UNet for Urban High-Resolution Remote Sensing Image Classification. Remote Sens. 2024, 16, 1444. [Google Scholar] [CrossRef]
  10. Li, X.; Yang, X.; Li, X.; Lu, S.; Ye, Y.; Ban, Y. GCDB-UNet: A novel robust cloud detection approach for remote sensing images. Knowl.-Based Syst. 2022, 238, 107890. [Google Scholar] [CrossRef]
  11. Zhang, Y.; Lu, H.; Ma, G.; Zhao, H.; Xie, D.; Geng, S.; Tian, W.; Sian, K. MU-Net: Embedding MixFormer into Unet to Extract Water Bodies from Remote Sensing Images. Remote Sens. 2023, 15, 3559. [Google Scholar] [CrossRef]
  12. Ye, F.; Zhang, R.; Xu, X.; Wu, K.; Zheng, P.; Li, D. Water Body Segmentation of SAR Images Based on SAR Image Reconstruction and an Improved UNet. IEEE Geosci. Remote Sens. Lett. 2024, 21, 4010005. [Google Scholar] [CrossRef]
  13. Peng, D.; Zhang, Y.; Guan, H. End-to-End Change Detection for High Resolution Satellite Images Using Improved UNet. Remote Sens. 2019, 11, 1382. [Google Scholar] [CrossRef]
  14. Chen, G.; Tan, X.; Guo, B.; Zhu, K.; Liao, P.; Wang, T.; Wang, Q.; Zhang, X. SDFCNv2: An Improved FCN Framework for Remote Sensing Images Semantic Segmentation. Remote Sens. 2021, 13, 4902. [Google Scholar] [CrossRef]
  15. Rajamani, K.T.; Rani, P.; Siebert, H.; ElagiriRamalingam, R.; Heinrich, M.P. Attention-augmented U-Net (AA-U-Net) for semantic segmentation. Signal Image Video Process. 2023, 17, 981–989. [Google Scholar] [CrossRef]
  16. Amo-Boateng, M.; Sey, N.E.N.; Amproche, A.A.; Domfeh, M.K. Instance segmentation scheme for roofs in rural areas based on Mask R-CNN Instance segmentation scheme for roofs in rural areas based on Mask R-CNN. Egypt. J. Remote Sens. Space Sci. 2022, 25, 569–577. [Google Scholar]
  17. Zeng, J.; Ouyang, H.; Liu, M.; Leng, L.; Fu, X. Multi-scale YOLACT for instance segmentation Multi-scale YOLACT for instance segmentation. J. King Saud Univ.-Comput. Inf. Sci. 2022, 34, 9419–9427. [Google Scholar] [CrossRef]
  18. Sun, Y.; Zhao, Y.; Han, X.; Gao, W.; Hu, Y.; Zhang, Y. A feature enhancement network combining UNet and vision transformer for building change detection in high-resolution remote sensing images. Neural Comput. Appl. 2025, 37, 1429–1456. [Google Scholar] [CrossRef]
  19. Tang, Y.; Cao, Z.; Guo, N.; Jiang, M. A Siamese Swin-Unet for image change detection. Sci. Rep. 2024, 14, 4577. [Google Scholar] [CrossRef]
  20. Wang, X.; Wang, X.; Zhao, K.; Zhao, X.; Song, C. FSL-Unet: Full-Scale Linked Unet with Spatial-Spectral Joint Perceptual Attention for Hyperspectral and Multispectral Image Fusion. IEEE Trans. Geosci. Remote Sens. 2022, 60, 5539114. [Google Scholar] [CrossRef]
  21. Yang, M.; Yuan, Y.; Liu, G. SDUNet: Road extraction via spatial enhanced and densely connected UNet. Pattern Recognit. 2022, 126, 108549. [Google Scholar] [CrossRef]
  22. Liang, F.; Wang, Z.; Ma, W.; Liu, B.; En, Q.; Wang, D.; Duan, L. HDFA-Net: A high-dimensional decoupled frequency attention network for steel surface defect detection. Measurement 2025, 242, 116255. [Google Scholar] [CrossRef]
  23. Thai, D.; Fei, X.; Le, M.; Züfle, A.; Wessels, K. Riesz-Quincunx-UNet Variational Autoencoder for Unsupervised Satellite Image Denoising. IEEE Trans. Geosci. Remote Sens. 2023, 61, 5404519. [Google Scholar] [CrossRef]
  24. Xie, H.; Pan, Y.; Luan, J.; Yang, X.; Xi, Y. Open-pit Mining Area Segmentation of Remote Sensing Images Based on DUSegNet. J. Indian Soc. Remote Sens. 2021, 49, 1257–1270. [Google Scholar] [CrossRef]
  25. Yang, Y.; Zheng, S.; Wang, X.; Ao, W.; Liu, Z. AMMUNet: Multiscale Attention Map Merging for Remote Sensing Image Segmentation. IEEE Geosci. Remote Sens. Lett. 2025, 22, 6000705. [Google Scholar] [CrossRef]
  26. Jing, Y.; Zhang, T.; Liu, Z.; Hou, Y.; Sun, C. Swin-ResUNet+: An edge enhancement module for road extraction from remote sensing images. Comput. Vis. Image Underst. 2023, 237, 103807. [Google Scholar] [CrossRef]
  27. Sun, Y.; Bi, F.; Gao, Y.; Chen, L.; Feng, S. A Multi-Attention UNet for Semantic Segmentation in Remote Sensing Images. Symmetry 2022, 14, 906. [Google Scholar] [CrossRef]
  28. Liu, Y.; Gao, K.; Wang, H.; Yang, Z.; Wang, P.; Ji, S.; Huang, Y.; Zhu, Z.; Zhao, X. A Transformer-based multi-modal fusion network for semantic segmentation of high-resolution remote sensing imagery. Int. J. Appl. Earth Obs. Geoinf. 2024, 133, 104083. [Google Scholar] [CrossRef]
  29. Ma, X.; Zhang, X.; Pun, M.O.; Liu, M. A multilevel multimodal fusion transformer for remote sensing semantic segmentation. IEEE Trans. Geosci. Remote Sens. 2024, 62, 5403215. [Google Scholar] [CrossRef]
  30. Chowdary, G.J.; Yin, Z. Diffusion transformer u-net for medical image segmentation. In Proceedings of the International Conference on Medical Image Computing and Computer-Assisted Intervention, Vancouver, BC, Canada, 8–12 October 2023; pp. 622–631. [Google Scholar]
  31. Chen, B.; Liu, Y.; Zhang, Z.; Lu, G.; Kong, A.W.K. Transattunet: Multi-level attention-guided u-net with transformer for medical image segmentation. IEEE Trans. Emerg. Top. Comput. Intell. 2023, 8, 55–68. [Google Scholar] [CrossRef]
  32. Saidu, I.C.; Csató, L. Active learning with bayesian UNet for efficient semantic image segmentation. J. Imaging 2021, 7, 37. [Google Scholar] [CrossRef]
  33. Valanarasu, J.M.J.; Patel, V.M. Unext: Mlp-based rapid medical image segmentation network. In Proceedings of the International Conference on Medical Image Computing and Computer-Assisted Intervention, Singapore, 18–22 September 2022; Springer Nature: Cham, Switzerland, 2022; pp. 23–33. [Google Scholar]
  34. Tian, Y.; Fu, L.; Fang, W.; Li, T. FR-UNet: A Feature Restoration-Based UNet for Seismic Data Consecutively Missing Trace Interpolation. IEEE Trans. Geosci. Remote Sens. 2025, 63, 5904310. [Google Scholar] [CrossRef]
  35. Fang, S.; Li, K.; Shao, J.; Li, Z. SNUNet-CD: A densely connected Siamese network for change detection of VHR images. IEEE Geosci. Remote Sens. Lett. 2021, 19, 8007805. [Google Scholar] [CrossRef]
  36. Chang, Z.; Li, H.; Chen, D.; Liu, Y.; Zou, C.; Chen, J.; Han, W.; Liu, S.; Zhang, N. Crop type identification using high-resolution remote sensing images based on an improved DeepLabV3+ network. Remote Sens. 2023, 15, 5088. [Google Scholar] [CrossRef]
  37. Trebing, K.; Staǹczyk, T.; Mehrkanoon, S. SmaAt-UNet: Precipitation nowcasting using a small attention-UNet architecture. Pattern Recognit. Lett. 2021, 145, 178–186. [Google Scholar] [CrossRef]
  38. Xue, W.; Ai, J.; Zhu, Y.; Chen, J.; Zhuang, S. AIS-FCANet: Long-term AIS Data assisted Frequency-Spatial Contextual Awareness Network for Salient Ship Detection in SAR Imagery. IEEE Trans. Aerosp. Electron. Syst. 2025, 1–6. [Google Scholar] [CrossRef]
  39. Ai, J.; Xue, W.; Zhu, Y.; Zhuang, S.; Xu, C.; Yan, H.; Chen, L.; Wang, Z. AIS-PVT: Long-Time AIS Data Assisted Pyramid Vision Transformer for Sea-Land Segmentation in Dual-Polarization SAR Imagery. IEEE Trans. Geosci. Remote Sens. 2024, 62, 5220712. [Google Scholar] [CrossRef]
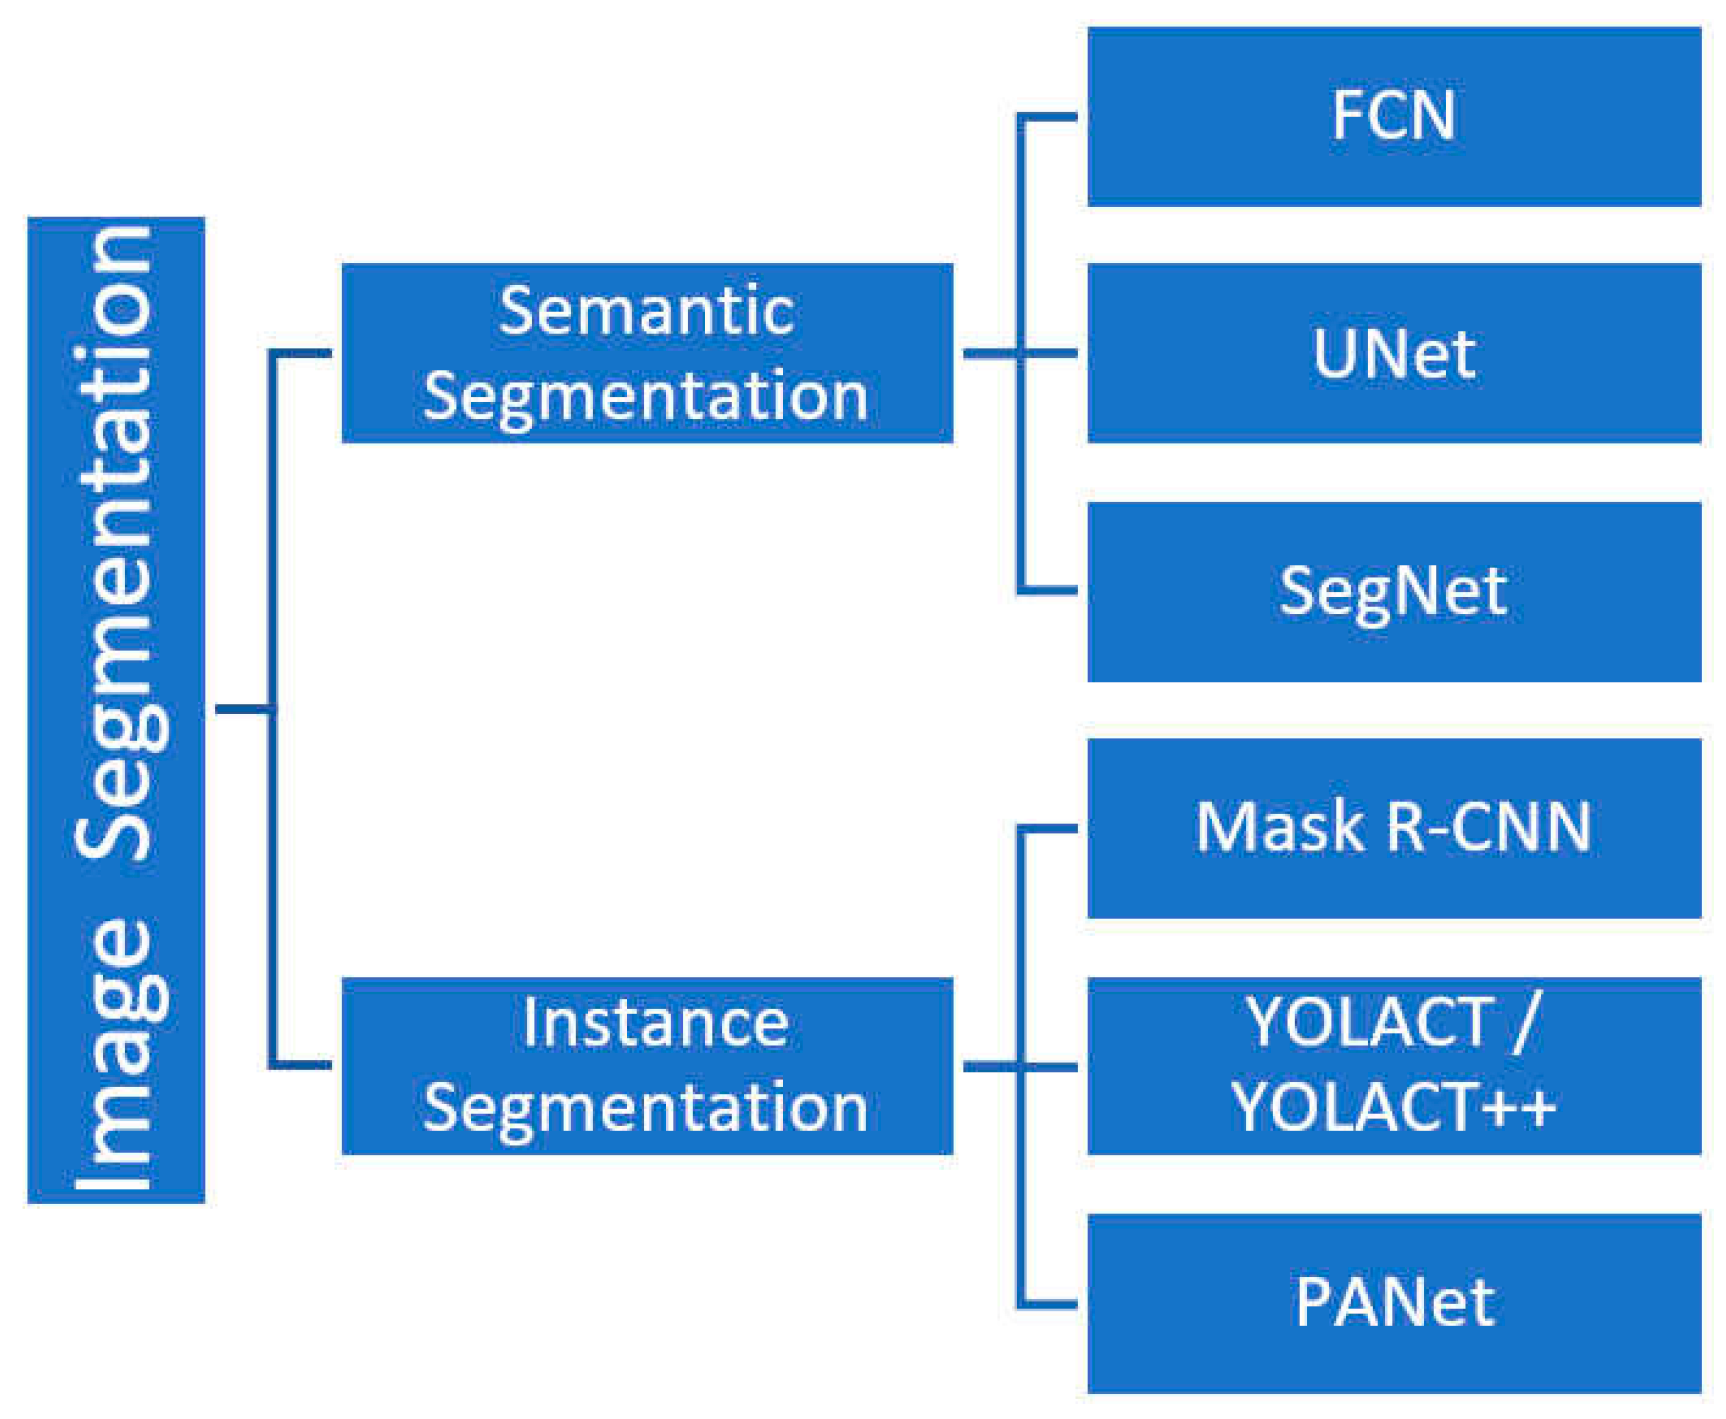
Figure 1. The image segmentation task.
Remotesensing 17 03253 g001
Figure 2. The semantic segmentation dataset of residential areas.
Remotesensing 17 03253 g002
Figure 3. Schematic of the Cross Attention.
Remotesensing 17 03253 g003
Figure 4. Block Diagram of CrossAtt-UNet Semantic Segmentation.
Remotesensing 17 03253 g004
Figure 5. Semantic Segmentation Experiment of Remote Sensing Datasets in Residential Areas.
Remotesensing 17 03253 g005
Figure 6. Comparative Experiment on Semantic Segmentation of Remote Sensing Data.
Remotesensing 17 03253 g006
Figure 7. The mIoU and loss curves of Att-UNet.
Remotesensing 17 03253 g007
Figure 8. The mIoU and loss curves of CrossAtt-UNet.
Remotesensing 17 03253 g008
Figure 9. The mIoU and loss curves of UNet50.
Remotesensing 17 03253 g009
Figure 10. The mIoU and loss curves of BayesianUNet.
Remotesensing 17 03253 g010
Figure 11. The mIoU and loss curves of UNet2Plus.
Remotesensing 17 03253 g011
Figure 12. The mIoU and loss curves of Siam-NestedUNet.
Remotesensing 17 03253 g012
Figure 13. The mIoU and loss curves of SwinUnet.
Remotesensing 17 03253 g013
Figure 14. The mIoU and loss curves of SmaAt-UNet.
Remotesensing 17 03253 g014
Figure 15. The mIoU and loss curves of UNext.
Remotesensing 17 03253 g015
Figure 16. The mIoU and loss curves of FR-Unet.
Remotesensing 17 03253 g016
Figure 17. The mIoU and loss curves of DeepLabV3+.
Remotesensing 17 03253 g017
Figure 18. Original images of concrete damage detection.
Remotesensing 17 03253 g018
Figure 19. The detection effect of CrossAtt-UNet on concrete damage.
Remotesensing 17 03253 g019
Table 1. Semantic segmentation dataset of Residential Areas.
Label CategoryLabel Number
background1328
surfaces575
building965
vegetation834
tree765
car586
Table 2. Operating environment and hyperparameters.
NameVersionNameValue
OSUbuntu MATE 16.04epochs500
CPUIntel(R) Xeon(R) CPU E5-2620 v4 @ 2.10 GHzbatch16
RAM128 GBμ0.9
GPUGeForce RTX 3090*2workers8
Driver455.23.05dropout0
CUDA11.1scale0.5
python3.7.13SGD1 × 10−2
torch1.10.1+cu11LR0.2
torchvision0.11.2++cu111optimizerAdam
Table 3. The performance comparison of the different algorithms.
AlgorithmsAccuracymAPmIoUF1-Scoretrain_lossval_lossfps
UNet5094.78%93.98%88.32%93.80%0.09760.167522.47
BayesianUNet [32]90.73%89.34%80.71%89.33%0.20430.319720.12
Unet2Plus94.26%91.94%86.67%92.86%0.16300.27755.71
UNext [33]88.15%83.12%73.55%84.76%0.26720.389733.67
FR-UNet [34]83.41%73.02%62.04%76.57%0.39420.492115.35
CrossAtt-UNet95.47%94.57%89.80%94.63%0.08780.145915.72
Att-UNet85.16%73.95%58.95%74.17%0.99511.016016.12
Siam-NestedUNet [35]92.8%87.64%81.67%89.91%0.15780.288217.74
SwinUnet88.62%85.24%74.89%85.64%0.22820.322714.52
DeepLabV3+ [36]94.54%91.79%83.45%90.98%0.22950.314827.45
SmaAt-UNet [37]94.08%93.36%86.91%93.00%0.12530.253319.89
Table 4. Ablation Experiments of CrossAtt-UNet Components.
AlgorithmsAccuracymAPmIoUF1-Scoretrain_lossval_lossfps
CrossAtt-UNet95.47%94.57%89.80%94.64%0.08780.145915.72
CrossAtt-UNet without Attention Gate91.94%80.53%79.83%88.83%0.21360.455415.93
CrossAtt-UNet without Attention Gate and Cross Attention85.16%73.95%58.95%74.15%0.99511.016016.12
Table 5. The performance comparison of the different algorithms.
AlgorithmsAccuracymAPmIoUF1-Scoretrain_lossval_lossfps
UNet5098.04%74.48%74.71%85.50%0.15420.160422.65
BayesianUNet98.09%79.47%73.90%84.96%0.16550.160721.72
Unet2Plus97.74%68.57%63.93%77.97%0.14200.26405.82
UNext98.06%76.82%72.54%84.05%0.174580.169939.56
FR-UNet98.21%77.6%73.92%84.97%0.12860.144516.48
CrossAtt-UNet98.22%79.14%75.20%85.83%0.14100.165114.66
Att-UNet88.05%68.35%52.48%68.84%0.98571.155412.32
Siam-NestedUNet91.34%77.45%73.54%84.72%0.14500.254118.12
SwinUnet97.84%75.5%70.49%82.67%0.21550.205015.63
DeepLabV3+97.54%72.5171.45%83.39%0.20550.241432.34
SmaAt-UNet98.09%79.47%73.9%84.96%0.19390.171220.47
Disclaimer/Publisher’s Note: The statements, opinions and data contained in all publications are solely those of the individual author(s) and contributor(s) and not of MDPI and/or the editor(s). MDPI and/or the editor(s) disclaim responsibility for any injury to people or property resulting from any ideas, methods, instructions or products referred to in the content.