Article

Study on Prediction of Potato Above-Ground Biomass and Yield Based on UAV Visible Light Image

1
College of Optical, Mechanical and Electrical Engineering, Zhejiang A&F University, Hangzhou 311300, China
2
School of Regional Innovation and Social Design Engineering, Kitami Institute of Technology, 165 Koen-cho, Kitami-shi 090-8507, Hokkaido, Japan
3
Key Laboratory for Innovative Utilization of Characteristic Food Crop Resources in Central Zhejiang, Jinhua 321000, China
*
Author to whom correspondence should be addressed.
Remote Sens. 2025, 17(18), 3246; https://doi.org/10.3390/rs17183246
Submission received: 29 July 2025 / Revised: 17 September 2025 / Accepted: 18 September 2025 / Published: 19 September 2025
(This article belongs to the Section Remote Sensing in Agriculture and Vegetation)

Abstract

Highlights

What are the main findings?
  • Developed a novel, potato-optimized vegetation index (GRCVI) that significantly enhances the accuracy of fractional vegetation cover (FVC) extraction from UAV visible-light imagery under varying field conditions.
  • Proposed an improved single-period SfM method that effectively overcomes soil elevation variability, enabling high-precision plant height estimation without the need for multi-temporal data.
What is the implication of the main finding?
  • Establishes a low-cost and efficient UAV-based framework for non-destructively monitoring key potato phenotypic traits (FVC and plant height), above-ground biomass, and ultimately predicting tuber yield.
  • Demonstrates the successful integration of remote sensing features with machine learning (FNN), providing a scalable solution for precision agriculture and high-throughput phenotyping in potato cultivation systems.

Abstract

Potato above-ground biomass (AGB) and tuber yield estimation remain challenging due to the subjectivity of farmer-based assessments, the high data requirements of spectral analysis methods, and the sensitivity of traditional Structure from Motion (SfM) techniques to soil elevation variability. To address these challenges, this study proposes a novel UAV-based visible-light remote sensing framework to estimate the AGB and predict the tuber yield of potato crops. First, a new vegetation index, the Green-Red Combination Vegetation Index (GRCVI), was developed to improve the separability between vegetation and non-vegetation pixels. Second, an improved single-period SfM method was designed to mitigate errors in canopy height estimation caused by terrain variations. Fractional vegetation coverage (FVC) and plant height (PH) derived from UAV imagery were then integrated into a feedforward neural network (FNN) to predict AGB. Finally, potato tuber yield was predicted using polynomial regression based on AGB. Results showed that GRCVI combined with the numerical intersection method and SVM classification achieved FVC extraction accuracy exceeding 95%. The improved SfM method yielded canopy height estimates with R2 values ranging from 0.8470 to 0.8554 and RMSE values below 2.3 cm. The AGB estimation model achieved an R2 of 0.8341 and an RMSE of 19.9 g, while the yield prediction model obtained an R2 of 0.7919 and an RMSE of 47.0 g. This study demonstrates the potential of UAV-based visible-light imagery for cost-effective, non-destructive, and scalable monitoring of potato growth and yield, providing methodological support for precision agriculture and high-throughput phenotyping.

1. Introduction

Potato is the fourth-largest food crop in the world, following wheat, rice, and maize, and it plays a vital role in ensuring global food security [1]. As the world’s largest potato producer, China holds the leading position in terms of both cultivation area and overall output. Nevertheless, China’s average yield per unit area continues to lag considerably behind the worldwide average [2]. One of the main reasons for this issue is the lack of timely, accurate, and dynamic yield monitoring and prediction methods, which limits the scientific and precise management of potato cultivation.
Above-ground biomass (AGB) is a critical morphological parameter for evaluating crop growth status, guiding field management, and forecasting yield [3,4]. Furthermore, AGB serves as a fundamental input for calculating the nitrogen nutrition index, which has been widely adopted to diagnose crop nitrogen supply levels and to inform precision nitrogen application strategies [5]. In potato cultivation, AGB is strongly correlated with tuber growth and development [3]. And field experiments have also demonstrated a close linear relationship between AGB and final tuber yield [6,7]. Therefore, accurate and timely monitoring of potato AGB, along with a clear understanding of its dynamic relationship with tuber biomass accumulation, is essential for optimizing agronomic practices, enhancing yield potential, and safeguarding food security.
Currently, the prediction of potato above-ground biomass and yield primarily relies on two approaches: estimations based on farmers experience and canopy spectral analysis. Farmer-based estimations are highly dependent on their expertise and subjective judgment, often resulting in considerable errors, poor standardization, and an inability to meet the demands of real-time monitoring with high spatial and temporal resolution [8,9]. Although canopy spectral analysis offers relatively high objectivity and accuracy in theory, its practical application is limited by the need for large-scale, high-quality training datasets. Additionally, issues such as variations in lighting conditions, observation angles, and cultivar-specific spectral shifts—as well as the complex nonlinear relationships between high-dimensional spectral features and biological traits—compromise the robustness and generalizability of the models across different regions [10,11]. Therefore, there is an urgent need for a more accurate, efficient, and widely applicable method for predicting both above-ground biomass and yield in potato crops.
In recent years, remote sensing technologies have been widely applied to estimate potato biomass and yield, offering non-destructive and scalable alternatives to traditional field-based measurements [6,12,13]. Studies using hyperspectral imagery have demonstrated the potential to capture subtle variations in canopy structure and biochemical properties, enabling accurate prediction of above-ground biomass [14,15]. Multispectral and RGB-based UAV imaging approaches have also been developed to estimate vegetation indices, fractional vegetation cover, and canopy height, which are strongly correlated with potato growth and yield [16]. Thermal and LiDAR-based methods have further expanded monitoring capabilities by providing insights into crop water status and three-dimensional canopy structure. Despite these advances, most existing studies face limitations such as high equipment costs, large data requirements, or reduced robustness when applied across different cultivars and growing environments [17,18]. Moreover, while UAV-based methods have shown promise in major cereal crops, their application to tuber crops such as potato remains relatively limited [19,20]. Current research lacks a comprehensive, low-cost, and easily generalizable framework that integrates phenotypic traits derived from UAV imagery to achieve accurate, real-time yield prediction. This gap underscores the need for novel methods that leverage visible-light UAV data in combination with advanced modeling approaches to improve the accuracy and accessibility of potato biomass and yield estimation.
In response to the aforementioned research gaps and practical demands, this study aims to acquire high-resolution visible light imagery of potato crops using UAV-based remote sensing technology. A vegetation index tailored to the phenotypic characteristics of potato plants will be developed, enabling the extraction and integration of key traits such as plant height and FVC. These phenotypic parameters will then be used to construct predictive models for estimating AGB and underground tuber yield. The primary goals of this research are outlined as follows:
(1)
Develop a rapid estimation method for potato FVC using UAV-based remote sensing technology.
(2)
Optimize the traditional Structure from Motion (SfM) approach to establish an accurate model for estimating potato plant height.
(3)
Construct predictive models for potato AGB and tuber yield based on integrated phenotypic information.

2. Materials and Methods

2.1. Study Area and Field Experiment Design

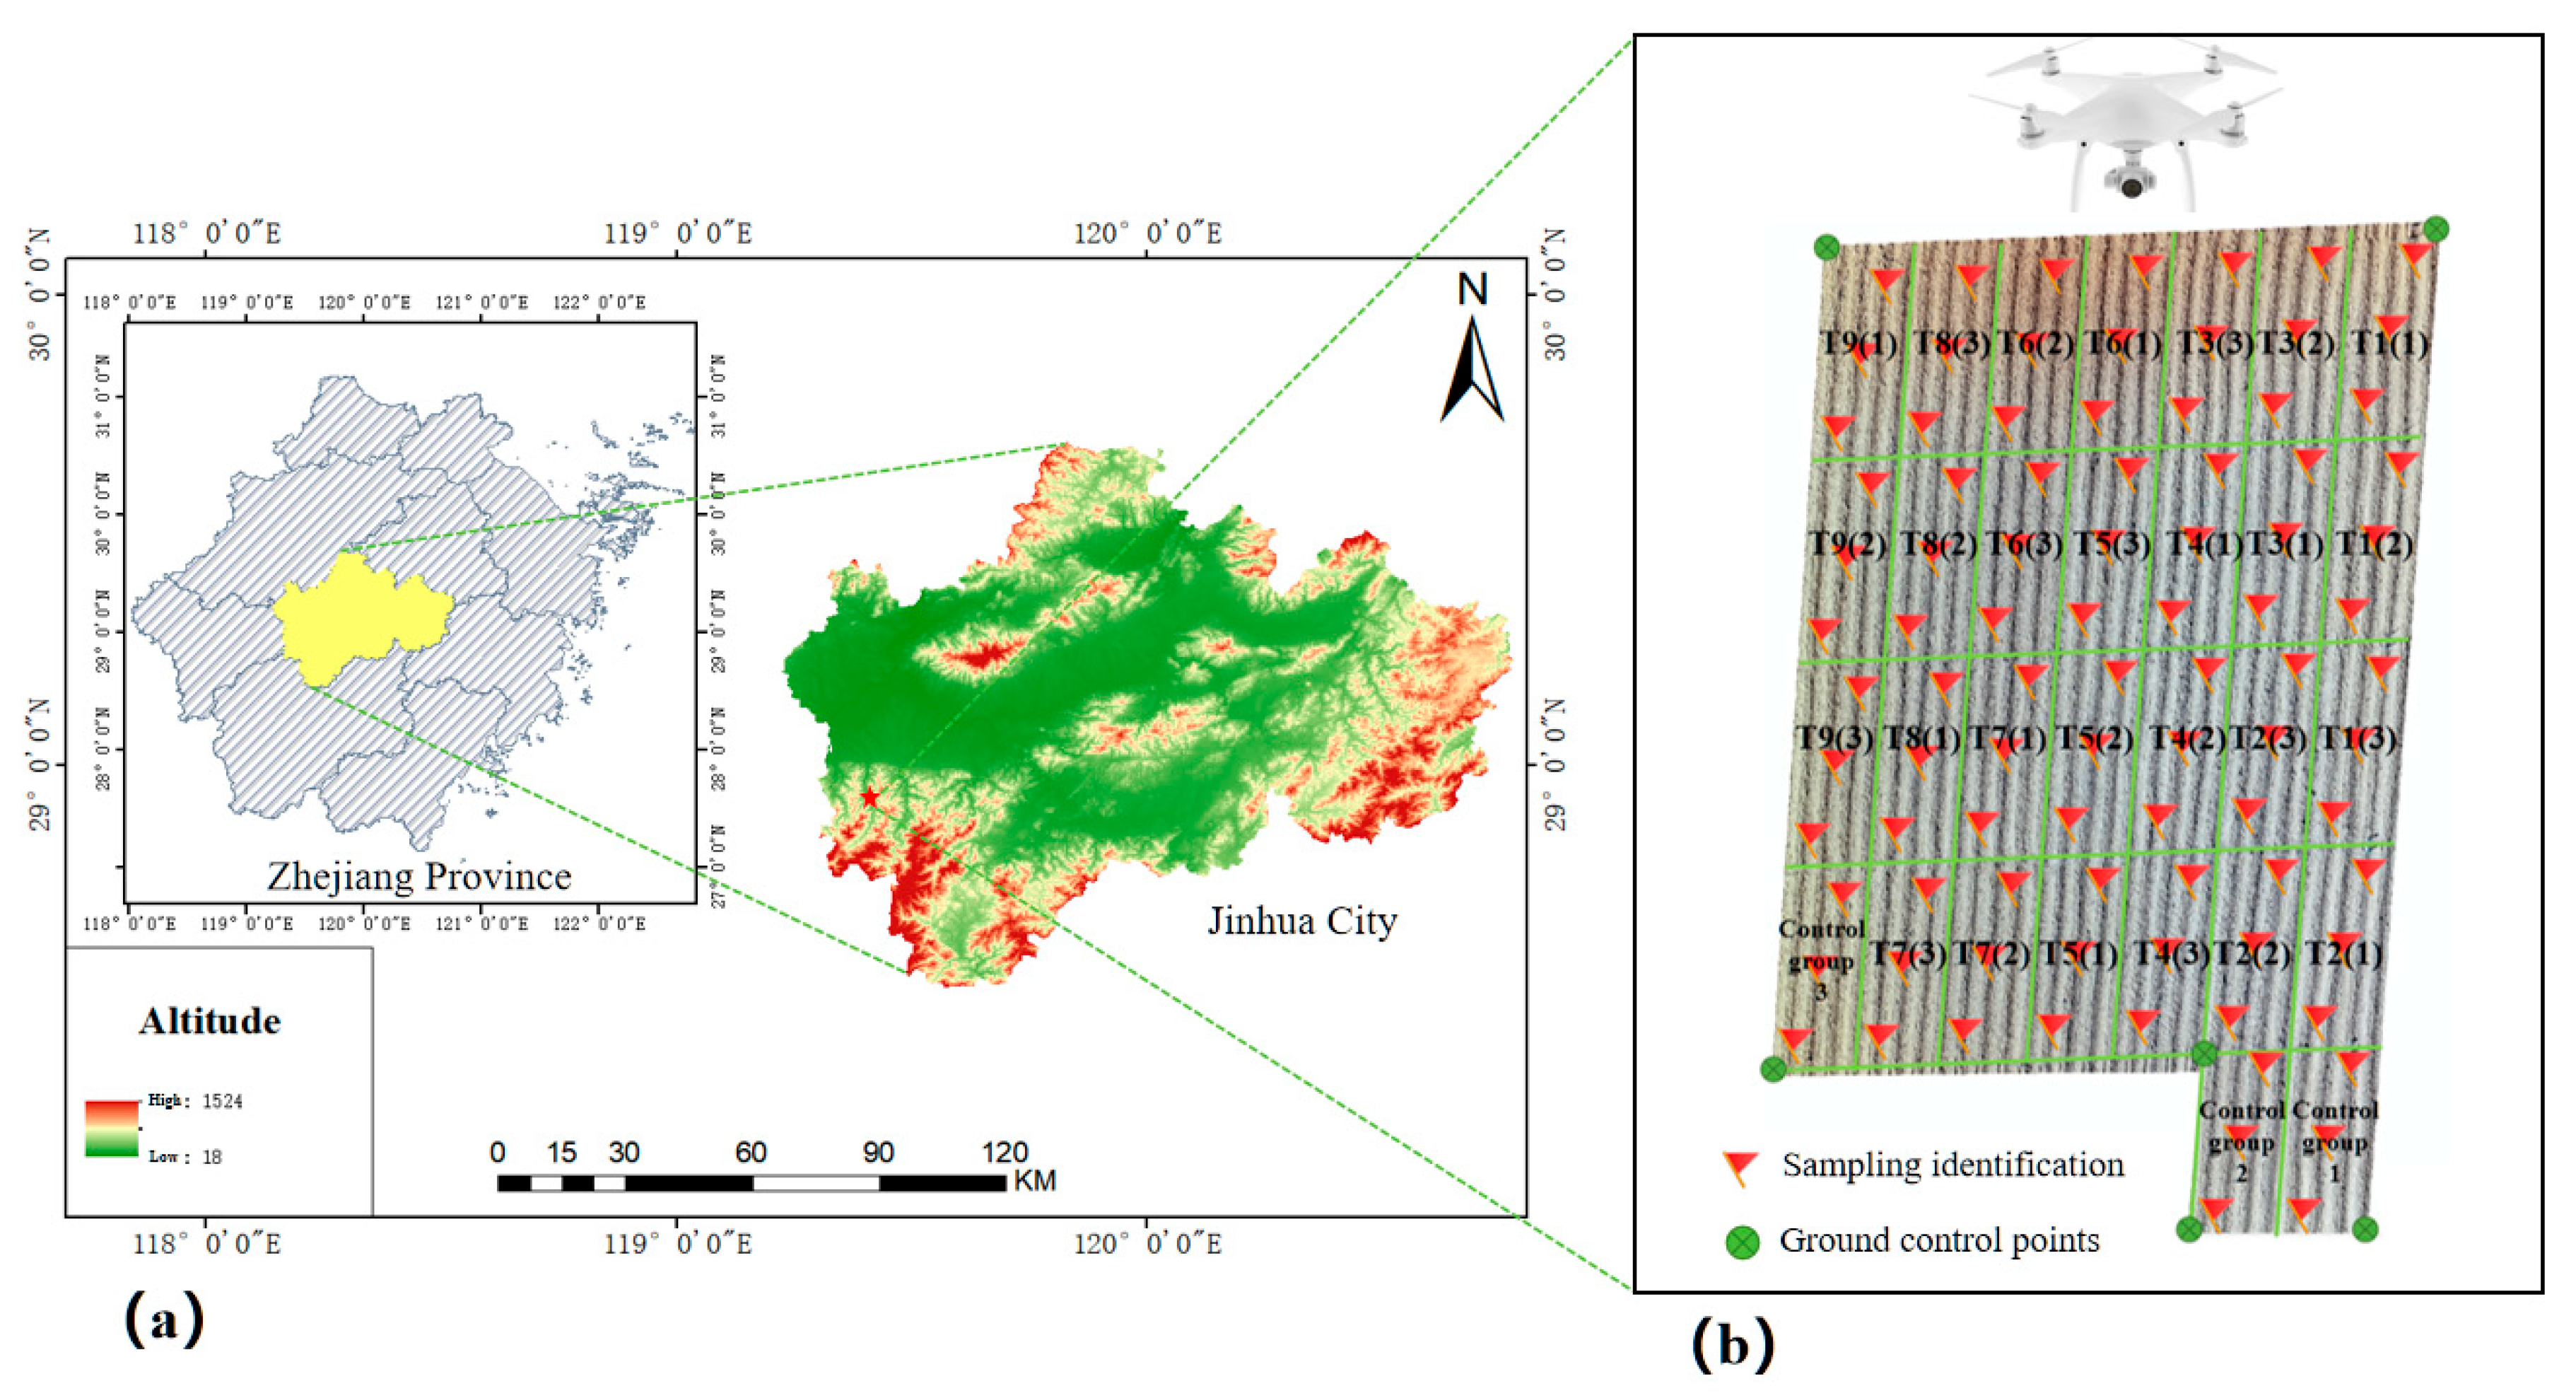
The field experiment was conducted in Langya Town, Wucheng District, Jinhua City, Zhejiang Province, China (119°28′38.29″E, 29°00′34.16″N). The site is located in a subtropical monsoon climate zone, with an average annual precipitation of approximately 1380 mm, mean sunshine duration of 2060 h, and a long frost-free period, providing favorable conditions for both spring and autumn potato cultivation. The soil at the experimental site is classified as sandy loam with a pH of 6.8, moderate fertility, and good drainage capacity. The previous crop was rice, and a paddy–upland rotation system was adopted, which helps maintain soil structure, supports stable potato yields, and reduces the incidence of soil-borne pests and diseases.
Potato planting for the field experiment was initiated on 13 September 2024, using the cultivar “Hua Song Xiang Zao.” The sowing process was conducted manually. Seed tubers were spaced 0.25 m apart within rows, with ridges spaced 0.85 m apart, and planting depth set at 0.10 m. To minimize edge effects, three additional rows were planted around the boundary of the experimental site as buffer zones. The layout comprised 27 plots, each measuring 8 m by 4 m, resulting in a total experimental area of 960 m2, as illustrated in Figure 1b.
To regulate the nutrient availability across different growth stages, various fertilization treatments were applied. Nitrogen (N) was administered at three concentration levels: N1: 105 kg/hm2, N2: 225 kg/hm2, and N3: 345 kg/hm2. Similarly, potassium (K) was also applied at three levels: K1: 105 kg/hm2, K2: 225 kg/hm2, and K3: 345 kg/hm2. Each fertilizer treatment combination was replicated three times.
To effectively eliminate the influence of potato plants outside the experimental plots on information acquisition, six ground control points (GCPs) were established based on the plot layout as shown in Figure 1b. These GCPs served as geographic reference markers for the experimental area and were also used in UAV image mosaicking, thereby ensuring the geometric calibration of the orthomosaics and DSMs. Each GCP consisted of a black-and-white PVC panel measuring 0.50 m × 0.50 m, which could be clearly identified by the UAV at a flight altitude of 30 m.

2.2. Acquisition and Processing of UAV-Based Visible Light Imagery

The UAV employed in this study was the DJI Phantom 4 PRO (Shenzhen DJI Sciences and Technologies Ltd., Shenzhen, China). The main technical parameters of the UAV and the onboard camera are listed in Table 1. Visible light images of the potato crop were acquired at three key growth stages: Tuber formation stage (5 November 2024), Tuber expansion stage (23 November 2024), and Maturity stage (9 December 2024). The flight missions were planned using Altizure4.7.0 software, which facilitated the mapping of the target field and the design of automated flight paths. The UAV operated autonomously along the predefined routes, with a flight altitude set to 25 m and a flight speed of 3 m/s. Both forward and side overlap rates were maintained at 90%. To ensure optimal image quality and minimize the impact of plant shadows caused by sunlight the image acquisition was consistently scheduled around solar noon (approximately 12:00 p.m.). All UAV flight parameters were kept consistent across missions.
Following image acquisition, the collected field images were mosaicked to generate a complete orthomosaic of the experimental area for subsequent remote sensing analysis. Pix4Dmapper was employed to perform image stitching and orthorectification. The image processing workflow involved the transformation of image coordinates into real-world geospatial coordinates. Keypoint detection was conducted using the Scale-Invariant Feature Transform (SIFT) algorithm to identify and match features across overlapping images. Structure from Motion (SfM) algorithms were then applied to reconstruct the three-dimensional point cloud, and bundle adjustment techniques were used to refine camera parameters and optimize point cloud geometry. After orthomosaic generation, the stitched imagery was subjected to spatial cropping to precisely delineate the boundaries of the experimental plots and to define regions of interest (ROI). This step was implemented using ENVI 5.3 software. The identification of the ROI was critical for accurate extraction of plant phenotypic features and for reliable assessment of crop growth status. The cropped orthomosaic images corresponding to the three main growth stages were present in Figure 2.

2.3. Acquisition of Potato Growth Parameters

2.3.1. Acquisition of Plant Height Data

Plant height serves as a direct and effective indicator of potato growth status and plays a crucial role in evaluating tuber development as well as guiding sampling strategies. In this study, plant height was measured manually using a steel tape measure with a minimum scale of 1 mm. During each measurement event, fifteen representative plants were randomly selected in each plot. The tape was placed vertically from the top of the ridge surface near the base of the main stem, with the highest point of the plant canopy used as the reference for data recording. All measurements were taken from eye level to ensure accuracy. For each selected plant, three repeated measurements were performed, and the average value was calculated to represent the final plant height.

2.3.2. Acquisition of Above-Ground Biomass Data

The measurement of potato above-ground biomass (AGB) primarily involved determining the fresh weight of the aerial parts, including stems and leaves. As this process requires destructive sampling and the physical separation of tubers from shoot tissues, large-scale sampling could adversely affect the continuity and integrity of subsequent experiments, particularly the acquisition of UAV-based remote sensing data. To minimize such disruptions, a limited yet repeated sampling strategy was adopted. Representative plants were carefully selected from each experimental plot during three key phenological stages: Tuber formation stage (21 October 2024), Tuber expansion stage (15 November 2024), and Maturity stage (3 December 2024 and 9 December 2024). In total, 30 experimental plots were sampled, including 27 plots with different fertilizer treatments and 3 control plots. At each sampling event, five representative plants were collected from each plot, ensuring that the sampled individuals exhibited growth conditions close to the plot average. After excavation, the above-ground components (stems and leaves) were separated from the plant. Given that soil particles often adhered to the lower stem sections, the plant material was thoroughly rinsed with clean water, gently wiped, and briefly air-dried. The cleaned biomass was then weighed using an electronic balance with a precision of 0.01 g. The resulting measurement was recorded as the AGB for the sampled plant. The fresh-weight procedure was adopted to ensure consistency with tuber yield measurements, which were also obtained after cleaning and weighing, and to enable rapid, high-throughput field sampling required for UAV-based phenotyping while minimizing disruption to subsequent flights and image acquisition. Although oven-dry biomass is a common practice to control moisture variability, we selected fresh weight with a standardized workflow of cleaning, brief air-drying, and immediate weighing to guarantee internal consistency and field feasibility.

2.3.3. Acquisition of Tuber Weight Data

After separating the above-ground stems and leaves from the tubers, the weight of the potato tubers was measured. Since the tubers are located in the soil and often covered with dirt, they were cleaned, dried, and weighed using an electronic balance.

2.4. Estimation Method for Potato Fractional Vegetation Cover (FVC)

2.4.1. Selection of Remote Sensing Feature Indicators and Development of a Novel Vegetation Index

The extraction of potato plant growth information is influenced by various factors, including illumination conditions, soil background, and cultivar differences. To identify a vegetation index (VI) suitable for potato phenotypic information retrieval, this study selected nine commonly used vegetation indices (VIs) in the field of crop remote sensing monitoring: GRVI, EXG, RGBVI, MGRVI, NGRVI, NGBDI, TBVI, RGCI, and BGCI [21,22,23,24]. These VIs were evaluated for their effectiveness in extracting FVC. The calculation formulas for each VI were provided in Table 2.
Common visible light VIs are typically constructed through mathematical operations involving the red, green, and blue spectral bands [25]. However, UAV-acquired imagery is often subject to environmental influences, leading to variations in RGB pixel values for the same target type. Without proper analysis of crop images under varying conditions, the application of conventional VIs may introduce significant experimental errors, thereby compromising the accuracy of data extraction. In this study, orthomosaic visible light images of potato fields from three key growth stages: Tuber formation stage, Tuber expansion stage, and Maturity stage were processed to develop a novel VI capable of effectively extracting plant relate information.
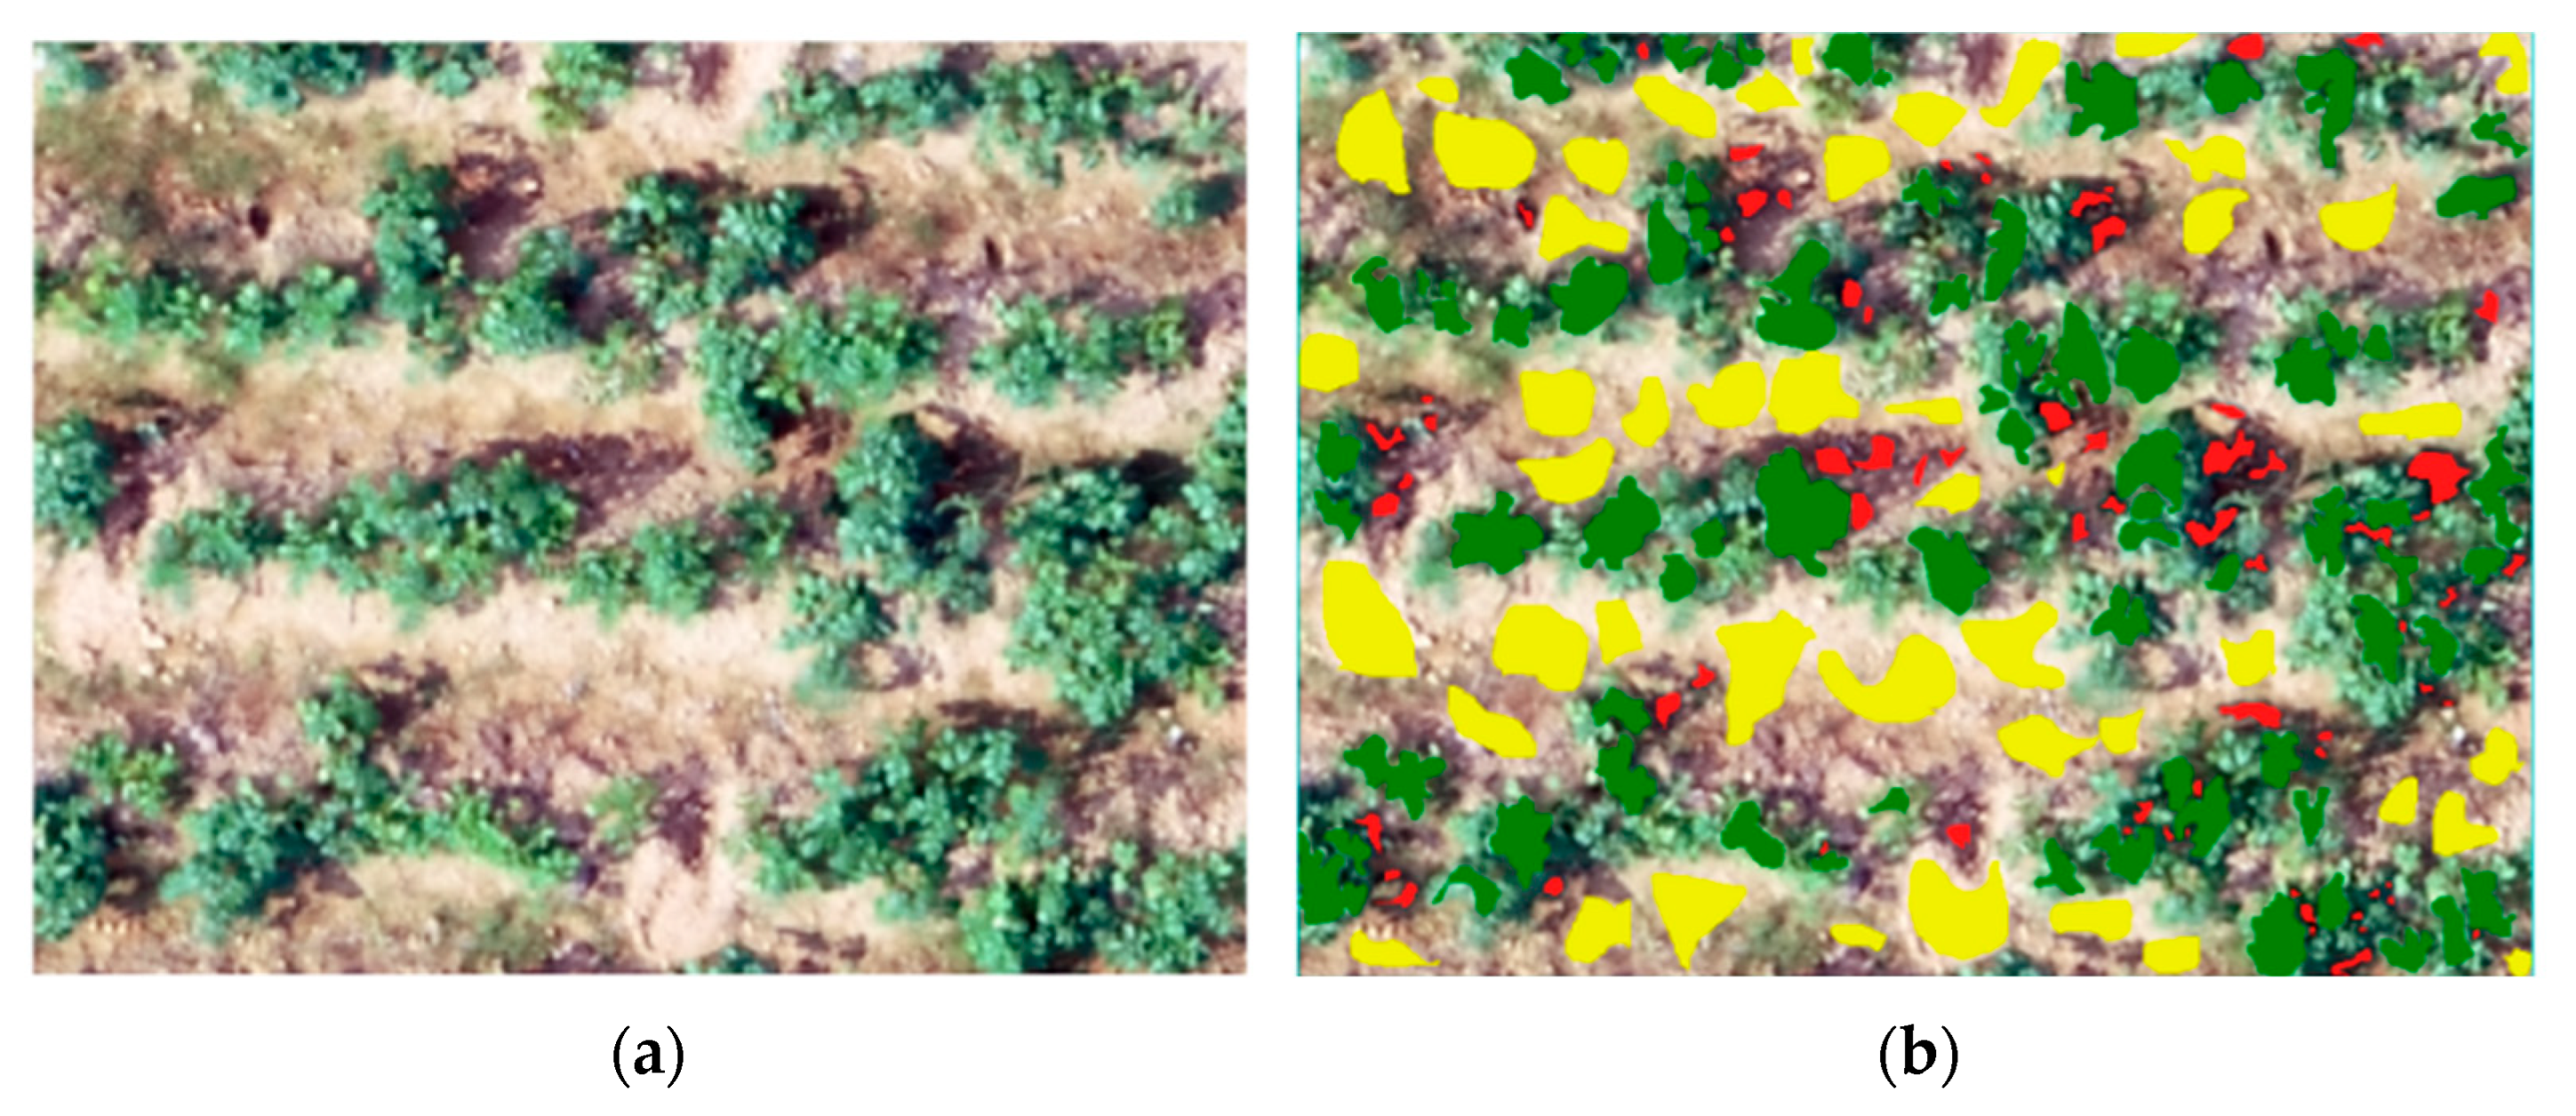
Using ENVI 5.3, 70 regions of interest (ROIs) were selected for each land cover type (potato plants, soil, and shadows) to capture variability in RGB values under different conditions while ensuring balanced class representation, as shown in Figure 3. The red, green, and blue spectral bands were extracted and classified for three land cover categories within the ROIs: potato plants, soil, and plant shadows.
To more clearly illustrate the red, green, and blue band values of different land cover types, the band values extracted from the ROIs were used to generate the scatter plots shown in Figure 4.
As shown in Figure 4a, there is a clear separation between potato plants and soil in the red-green band combination, and the distinction between plant canopy and shadow is also well defined. The scatter points representing potato plants are primarily located above those of soil and shadow. Therefore, the green-red band combination demonstrates strong capability in distinguishing potato plants from other land cover types.
Using Figure 4a as the source image, 30 scatter points representing potato plants were selected along the boundary lines separating the three land cover types: potato plants, soil, and plant shadows for curve fitting. The fitting results were shown in Figure 5. Error analysis indicated a good fit of the boundary points, with the R2 of 0.9813.
Based on the fitted numerical expression derived from the green-red band combination, a new VI was constructed to process the UAV remote sensing imagery obtained from the field experiment in this study. The resulting VI, termed the Green-Red Combination Vegetation Index (GRCVI), was defined as shown in Equation (1).
GRCVI = 2 G 1.1267 R 23.694 B
The GRCVI was derived from the regression fitting of ROI boundary points in the green–red band combination (Figure 5). Although conceptually related to the Excess Green Index (EXG), GRCVI represents a tailored variant optimized for potato canopy extraction: the blue band was excluded to reduce spectral noise, and the weighting of the green band was enhanced to maximize separability from soil and shadow.
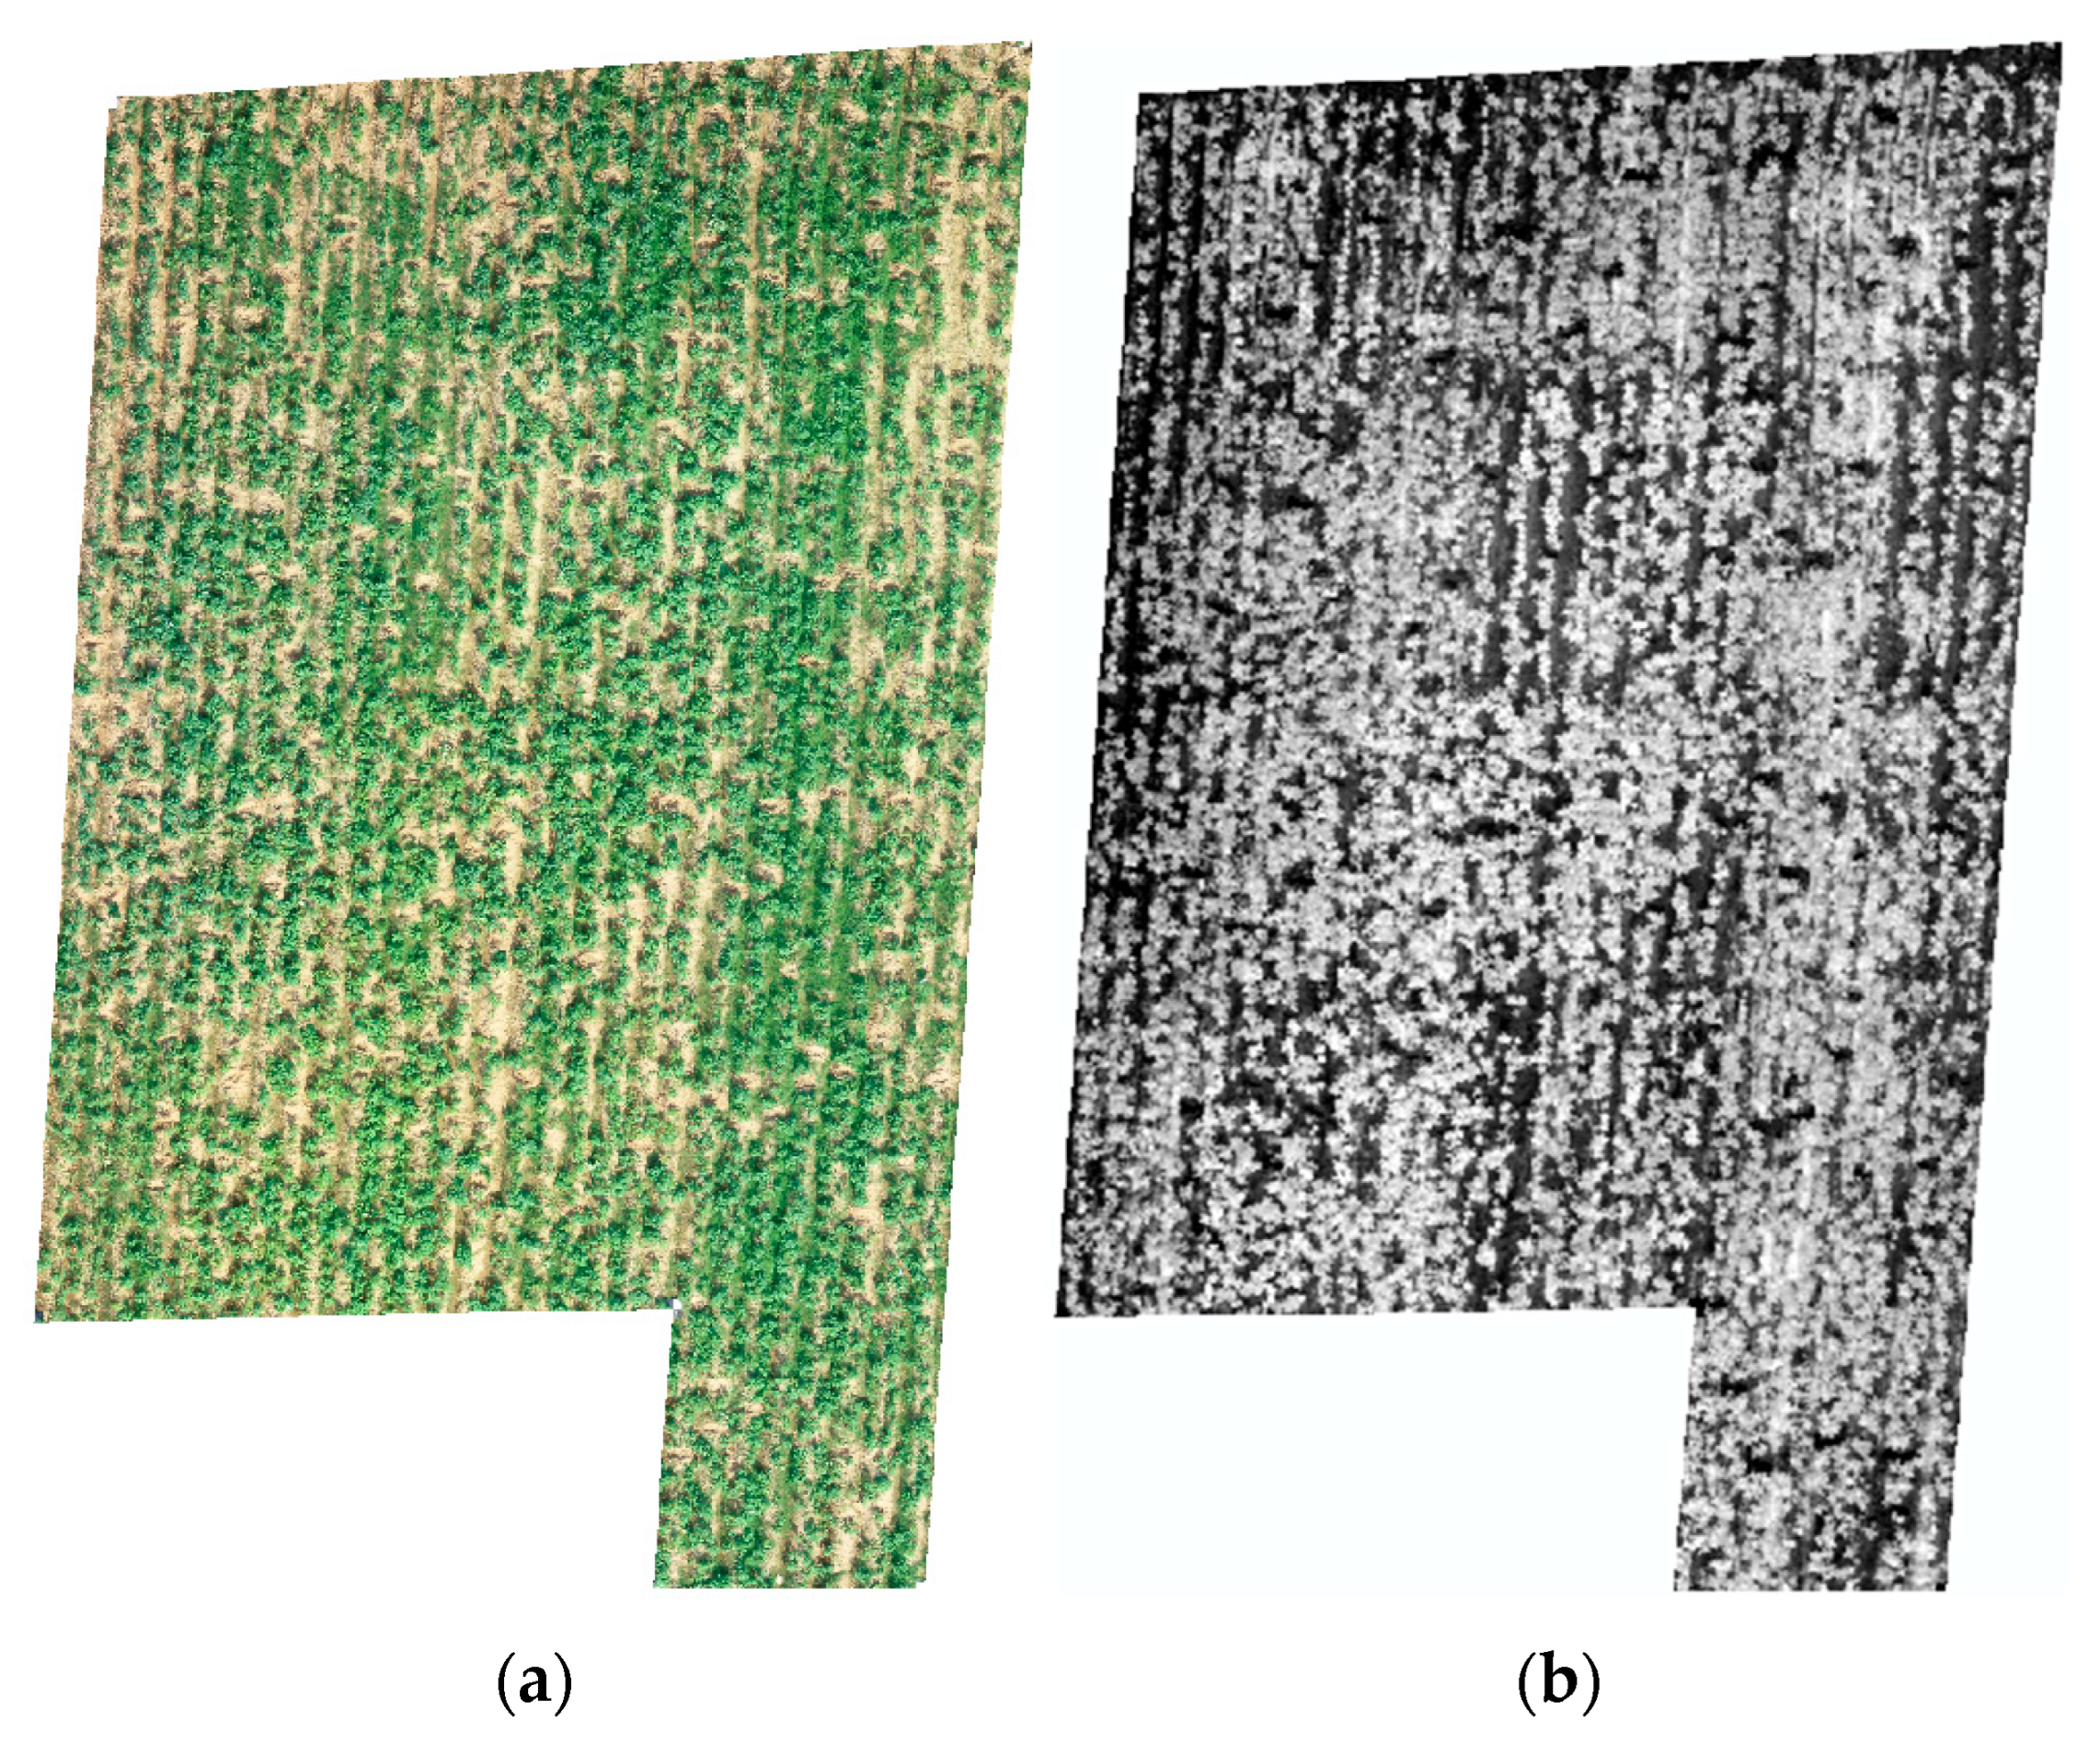
The newly developed VI(GRCVI) was applied to the UAV remote sensing image of the potato field. The processing results were presented in Figure 6.

2.4.2. Supervised Classification Method

With the rapid advancements in remote sensing and machine learning technologies, supervised classification results are being progressively utilized as benchmark data for assessing the performance of image processing and classification in remote sensing applications [26]. In this research, potato plant FVC values derived from the Support Vector Machine (SVM) algorithm at three different growth phases were used as baseline data for assessing the accuracy of FVC extraction. The performances of the numerical intersection method, histogram bimodal method, and Otsu thresholding method were subsequently evaluated, enabling identification of the optimal thresholding approach for vegetation coverage estimation.
SVM, a supervised learning method derived from statistical learning theory, is mainly applied in classification and regression analyses. Typical kernel functions employed in SVM are the linear kernel, polynomial kernel, and radial basis function (RBF) kernel [24]. SVM adheres to the principle of structural risk minimization, which effectively balances model complexity and generalization ability. This makes it particularly well-suited for scenarios involving small sample sizes and high-dimensional data.
Although SVM offers high precision in extracting potato FVC, its application on a larger scale requires substantial training and validation data. Furthermore, it involves significant computational resources, including high memory consumption and processing time. The performance of the classification heavily relies on accurate sample selection, effective parameter tuning, and adequate computational capacity. Considering these factors, this study uses the output from SVM-based supervised classification as a reference dataset for validating the effectiveness of different FVC extraction methods. To assess the accuracy, a confusion matrix is employed, measuring overall accuracy, Kappa coefficient, and both producer’s and user’s accuracy for each class—providing a thorough evaluation of classification performance [27]. Additionally, the confusion matrix is commonly utilized as fundamental data for further statistical analyses and is broadly accepted as a standard approach for assessing classification accuracy in remote sensing studies [28].

2.4.3. Numerical Intersection Method

The numerical intersection method is a threshold determination approach based on statistical distribution characteristics. It begins by extracting the grayscale values of both the target and background regions and calculating their respective probability density functions. By analyzing the intersection characteristics of the probability density curves for the two classes, the intersection point is identified. The grayscale value corresponding to this point is then used as the classification threshold to effectively distinguish between target and background regions in the image.
By taking into account the probability distributions of grayscale values for both the target and background, the numerical intersection method accurately reflects the statistical characteristics of different classes in real-world imagery. As a result, it exhibits high classification accuracy and stability, particularly when there is a pronounced grayscale contrast between target and background regions. This method has been widely applied in the extraction of vegetation information from remote sensing images.

2.4.4. Histogram Bimodal Method

The histogram bimodal method is a thresholding technique based on grayscale feature information [29]. In grayscale images, different classes exhibit distinct grayscale value ranges, and the grayscale values for each class generally follow a normal distribution within their respective ranges. This approach identifies the classification threshold by examining the bimodal pattern within the histogram and selecting the minimum point between the two peaks, which represent the background and the target object, respectively. The histogram bimodal method is widely applied for separating targets from background areas and performs well in scenarios with stable illumination and high contrast between target and background, offering strong accuracy and robustness.
In this study, the grayscale images processed using VIs were used to generate grayscale value histograms for the entire image. If there is a clear grayscale difference between vegetated and non-vegetated areas, the histogram exhibits a distinct bimodal distribution. The minimum point between the two histogram peaks is identified, and its associated grayscale value is chosen as the classification threshold for estimating fractional vegetation cover (FVC).

2.4.5. Otsu Thresholding Method

The Otsu thresholding method, proposed by Nobuyuki Otsu, is an image segmentation technique that performs global thresholding in an unsupervised manner. It automatically determines the optimal threshold for effectively separating the target object from the background [30]. The method is based on maximizing the between class variance as the optimization criterion and searches the grayscale histogram for the threshold that minimizes the within-class variance, thereby achieving an optimal segmentation result.
In this study, the Otsu thresholding method was applied to grayscale images processed with VIs to perform automated segmentation between plant and non-plant background areas. The method identifies an optimal grayscale threshold that achieves the best possible separation between vegetation and background.

2.5. Potato Plant Height Extraction Method Based on Improved Structure from Motion (SfM)

2.5.1. Traditional SfM Method

Estimating plant height using UAV based methods is one of the mainstream approaches for rapid and non-destructive acquisition of crop phenotypic information [31]. The quantification of plant height is typically based on Structure from Motion (SfM) technology [32]. This method derives plant height information by analyzing multi-temporal remote sensing images to generate a digital surface model (DSM), and calculating the difference between the DSM and a reference digital terrain model (DTM). Traditional SfM approaches generally require remote sensing data from at least two different time periods to compute plant height. However, in actual field management, agricultural activities often alter the terrain, leading to mismatches between the DTM reference surface and DSM data, which in turn causes cumulative errors in height inversion. In addition, traditional SfM methods tend to produce large estimation errors for plant height at early growth stages, making them inadequate for accurate early stage plant height retrieval.

2.5.2. Improved SfM Method

In this study, the SfM algorithm was improved to estimate potato plant height using DSM data acquired within the same growth stage. Based on the plant and non-plant regions identified through SVM-based supervised classification during the estimation of fractional vegetation cover, the DSM data corresponding to soil and plant areas were separated for each experimental plot. For the separated DSM data, the average soil DSM value was calculated within a defined window of 20 × 20 pixels in the bare soil region, which served as the soil elevation reference, while the maximum plant DSM value within the canopy region was considered as the elevation of the potato canopy. The difference between the canopy DSM value and the soil DSM value was then calculated to obtain the potato plant height, as expressed in Equation (2).
H p l a n t = D S M P max D S M S m e a n
In the equation, Hplant represents plant height, DSMPmax denotes the maximum DSM value of the plant region, and DSMSmean represents the mean DSM value of the soil region.
To evaluate the error between the estimated and actual values of potato plant height, this study employed the coefficient of determination (R2) and the root mean square error (RMSE) as evaluation metrics. The formulas for these two indicators were shown in Formulas (3) and (4).
R 2 = 1 i = 1 n x i y i 2 i = 1 n x i x ˙ ¯ 2
R M S E = i = 1 n x i y i 2 n

2.6. Method for Potato Above-Ground Biomass (AGB) and Yield Prediction

2.6.1. Selection of Yield-Related Factors

In this study, plant height (PH), FVC, AGB, and tuber weight obtained from field experiments were used to analyze the correlations among yield-related factors under actual cultivation conditions. The goal was to identify the primary factor influencing yield prediction.

2.6.2. Construction of Potato AGB and Yield Prediction Models

The AGB prediction model was developed using three machine learning methods: Random Forest (RF), Feedforward Neural Network (FNN), and Support Vector Regression (SVR) [33,34,35]. These techniques were utilized to build predictive models for estimating AGB. By evaluating and comparing the predictive performance of the three approaches, the optimal model was identified. In this research, sampling was performed twice during the tuber maturity stage, and the second sample set served as validation data to assess the developed models’ effectiveness. The accuracy of each model was measured using the coefficient of determination (R2) and root mean square error (RMSE).
Given the strong correlation between AGB and tuber yield in potato plants, this study performed both linear and polynomial fitting using the AGB and yield data collected at two different growth stages. The resulting fitting equations were then applied to predict tuber yield based on AGB. The second sampling data from the maturity stage were used as the test set to validate the prediction accuracy. In addition to temporal partition validation using the second sampling data, leave-one-out cross-validation (LOOCV) was also employed to further evaluate model reliability. In this approach, each sample was used once as the validation set while the remaining samples were used for training, and the process was repeated until all samples were tested. Model accuracy was consistently assessed using the coefficient of determination (R2) and the root mean square error (RMSE).

3. Results

3.1. Results of Supervised Classification Method

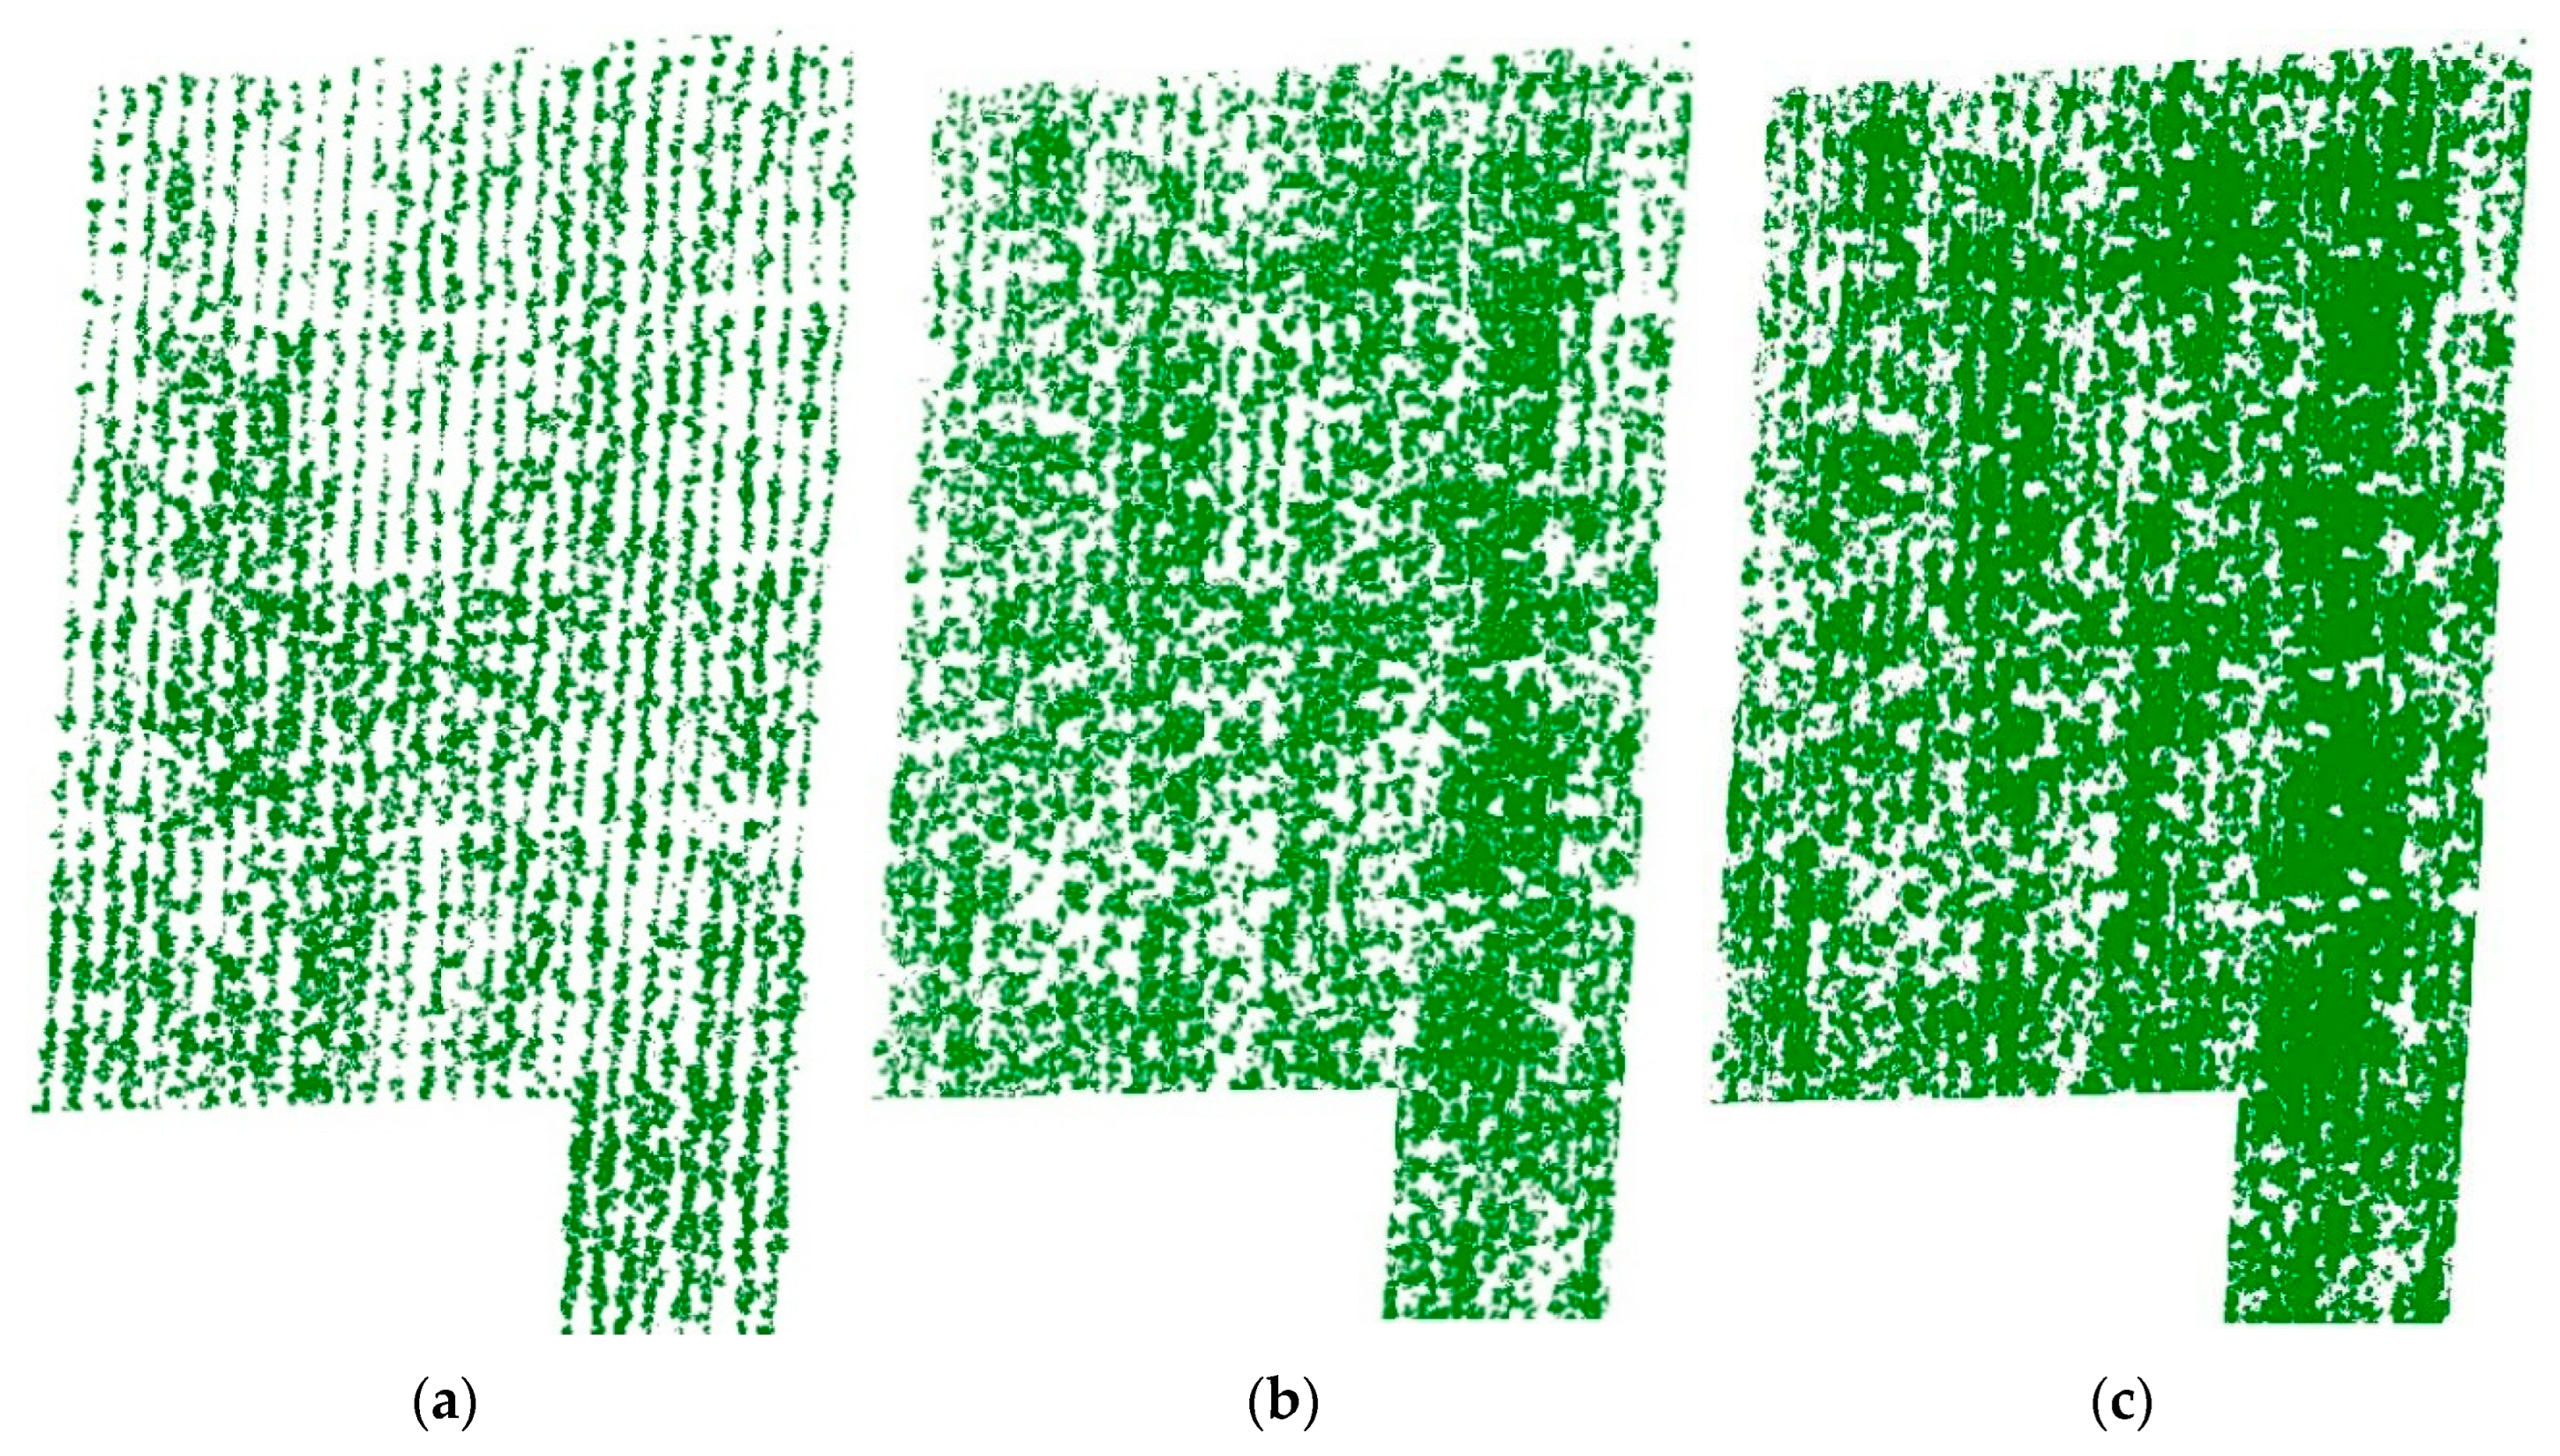
For the SVM based supervised classification, the radial basis function (RBF) kernel was employed because of its high computational efficiency and suitability for handling complex datasets, while also reducing the risk of overfitting and thereby ensuring model robustness. To validate classification accuracy, 50 independent ROIs were newly defined within the study area to represent potato and non-potato classes. These validation ROIs were separated from those used for index construction to ensure independence between training and testing samples. A confusion matrix was then generated to evaluate classification performance, and both the overall accuracy and Kappa coefficient were calculated. The supervised classification outputs are presented in Figure 7, and Figure 8 illustrates the confusion matrix validation results for the three potato growth stages using the SVM classifier.
The supervised classification method based on SVM achieved an overall accuracy of 99.6274% and a Kappa coefficient of 0.9925. Figure 7 and Figure 8 illustrate that the SVM classifier performed exceptionally well in accurately distinguishing potato plants throughout all three growth stages.

3.2. Results of FVC Extraction Using Three Methods

A statistical analysis was conducted on the digital number (DN) values of the nine selected VIs, along with the newly developed GRCVI. The DN values are dimensionless digital reflectance values output from the UAV camera sensor. For each treatment plot, the average DN of all corresponding pixels was calculated and used for subsequent vegetation index computation. Classification thresholds for potato plants at Tuber formation stage, Tuber expansion stage, and Maturity stage were determined using the numerical intersection method, histogram bimodal method, and Otsu thresholding method, as shown in Table 3, Table 4 and Table 5. To better illustrate the threshold extraction process using different VIs, this study presents the threshold results obtained by the numerical intersection method for three VIs: GRCVI, RGCI, and EXG across the three growth stages. The corresponding histogram curves for these stages were shown in Figure 9.
As shown in Table 3, the classification thresholds for all ten VIs across the three growth stages were determined using the numerical intersection method. Further analysis of the intersection curves revealed that the histogram distributions of plant and non-plant regions for five vegetation indices (GRVI, RGBVI, MGRVI, NGRVI, and NGBDI) exhibited considerable overlap. For clarity, Figure 10 presented only the histogram of NGRVI as a representative example. Due to this high degree of overlap, the classification thresholds obtained for these five VIs, even when combined with the SVM method, were unable to effectively extract potato FVC. Therefore, this study proceeded to perform FVC extraction using the remaining five VIs.
The determined thresholds were further applied to extract overall FVC information for the experimental potato field across the three growth stages. FVC was calculated using Formula (5) [36]. The FVC extraction results for the five VIs across the three potato growth stages, based on different thresholding methods, were presented in Table 6.
F V C = N p l a n t N p l a n t + N b a c k g r o u n d × 100 %
In the equation, Nplant represents the total number of vegetation pixels, Nbackground represents the total number of non-vegetation pixels.
The vegetation and non-vegetation pixel counts obtained from the SVM classification were used as the ground truth values for FVC (23.41%, 45.98%, and 58.40% for the three growth stages). The accuracy of FVC estimates produced by the three methods was compared using these reference values, and the results were shown in Figure 11.
According to the statistical results in Figure 11, the GRCVI vegetation index constructed in this study demonstrated strong performance in FVC estimation across all three potato growth stages. Although the Otsu thresholding method achieved slightly higher accuracy than the numerical intersection method during the Tuber formation stage and Tuber expansion stage, its performance declined significantly at the maturity stage. In contrast, the numerical intersection method combined with the GRCVI consistently provided accurate FVC estimations throughout the entire growth cycle and maintained reliable performance even under the complex field conditions present at maturity stage. To further validate the accuracy of FVC results derived from the five selected VIs using the numerical intersection method, confusion matrix analysis was conducted for the three growth stages. The corresponding overall accuracies and Kappa coefficients were presented in Table 7.
According to the results presented in Table 7, the GRCVI proposed in this research exhibited robust discrimination capability for potato plants throughout all three growth phases. It delivered the highest overall accuracy and Kappa coefficient at both the tuber expansion and maturity stages. Specifically, the classification accuracy reached 99.78% (Kappa coefficient = 0.9957) during the tuber expansion stage and 99.56% (Kappa coefficient = 0.9884) during the maturity stage. Additionally, at the tuber formation stage, combining the GRCVI with the numerical intersection method produced the second-highest accuracy, achieving an overall classification accuracy of 98.99% and a Kappa coefficient of 0.9951.
To ensure the stability and accuracy of FVC estimation, this study adopted the GRCVI in combination with the numerical intersection method based on SVM-supervised classification as the final approach for estimating potato FVC during the Tuber formation, Tuber expansion, and Maturity stages. The extracted FVC results were shown in Figure 12.

3.3. Results of Plant Height Extraction Using the Improved SfM Method

In ENVI 5.3, the vegetation regions extracted from the FVC results were used as ROIs to create masks for segmenting the DSM images, allowing for the statistical analysis of potato plant height. The average heights extracted using the improved SfM method at the three growth stages were 19.65 cm, 37.23 cm, and 44.17 cm, respectively.
To further validate the performance of the improved SfM method, the estimated plant heights were compared with field-measured values. The estimation accuracy was assessed using the coefficient of determination (R2) and the root mean square error (RMSE). The validation results were presented in Figure 13.
As illustrated in Figure 13, the improved SfM approach demonstrated strong accuracy in estimating potato plant height during the tuber formation stage, yielding an R2 of 0.8470 and an RMSE of 1.8628 cm. In the tuber expansion stage, the estimation accuracy reached R2 of 0.8252 and the RMSE of 1.8567 cm. At the maturity stage, the method achieved R2 of 0.8554 and the RMSE of 2.2665 cm. These results indicate that the improved SfM method not only provides high overall estimation accuracy but also yields plant height estimates with low variability.
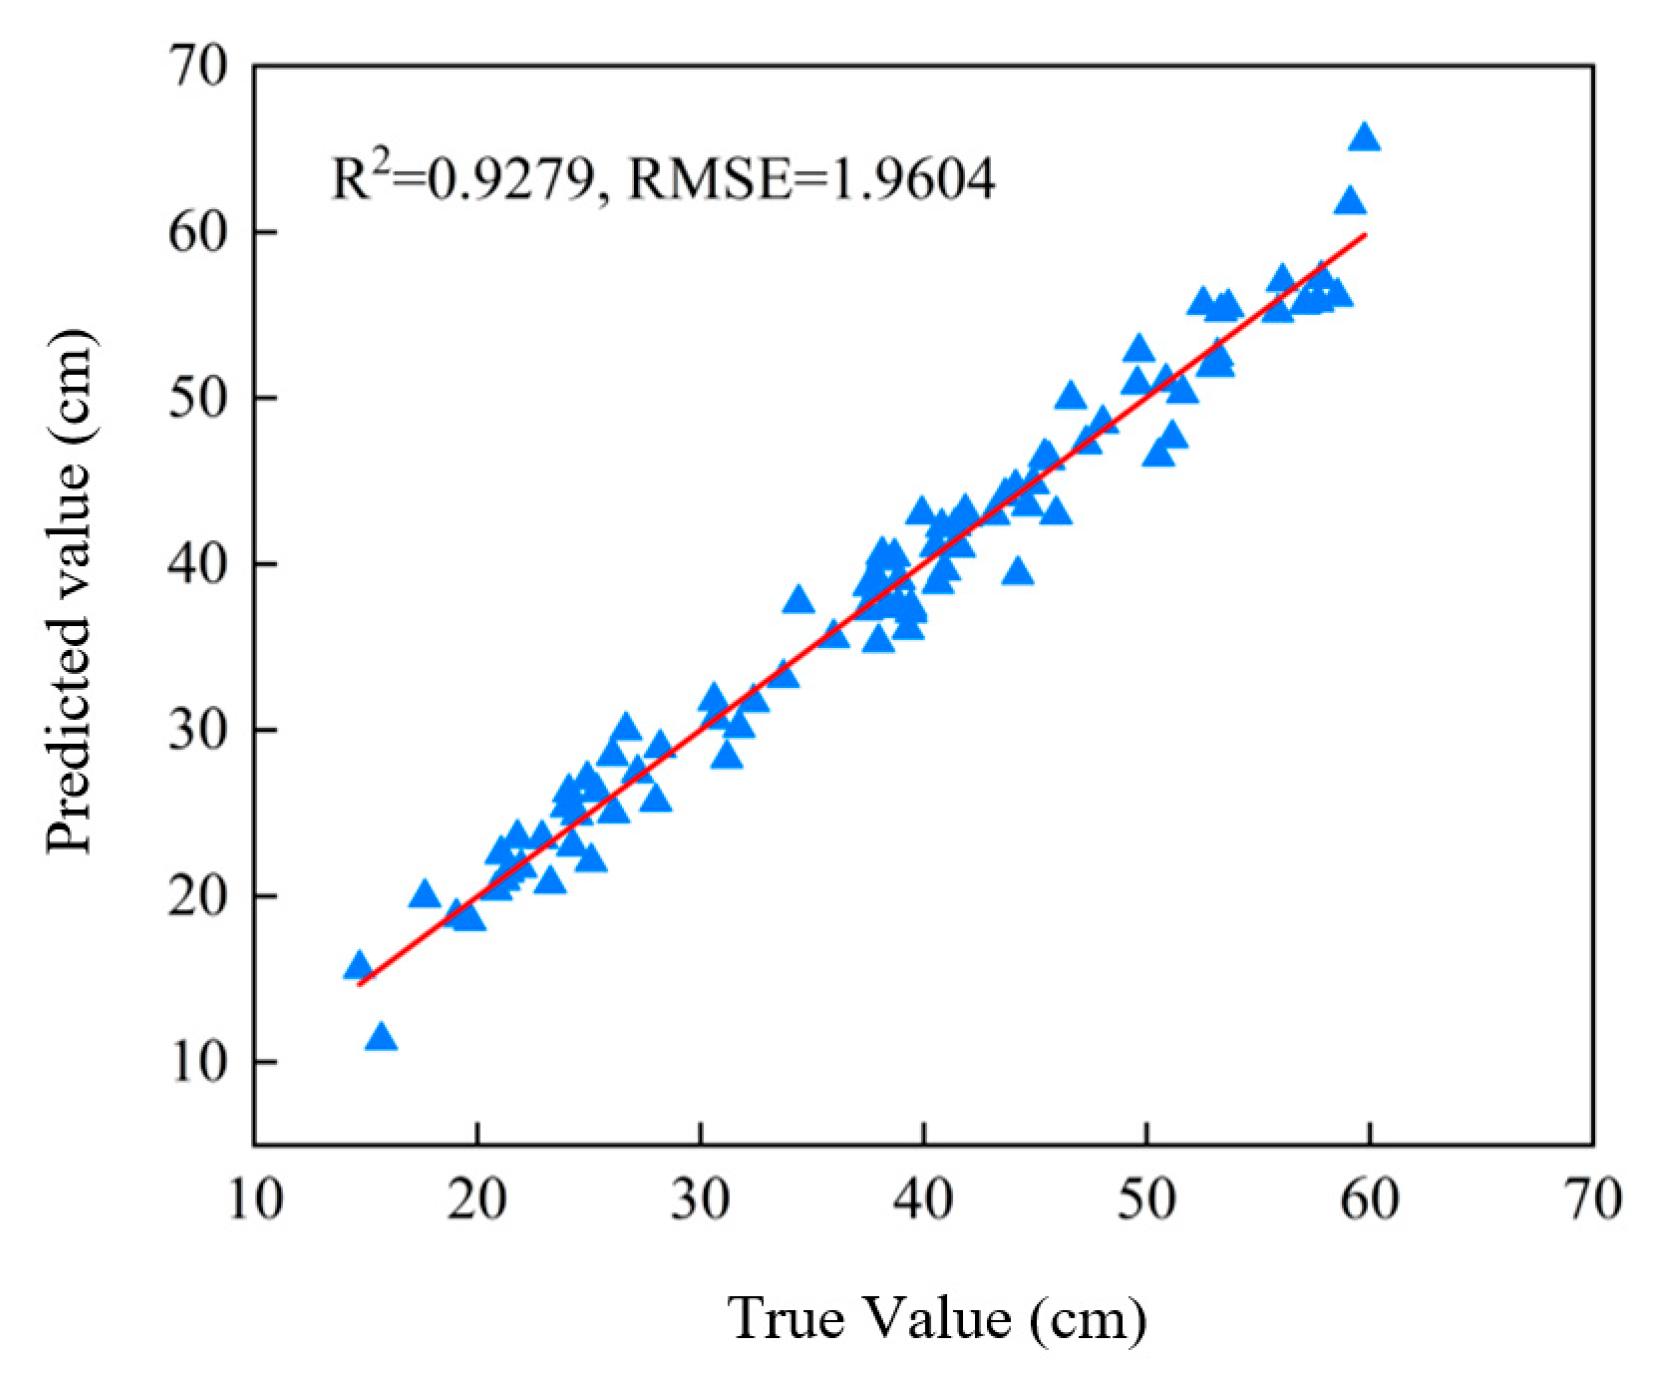
As shown in Figure 14, analysis of the improved SfM method across the full growth period demonstrated excellent performance in potato plant height inversion, with the R2 value of 0.9279 and the RMSE of 1.9604 cm. The accuracy validation results indicate that the improved SfM method also provides reliable estimation performance for monitoring the temporal dynamics of potato plant height throughout the entire growth cycle.
The improved SfM method developed in this study demonstrated strong environmental adaptability and stability, indicating its effectiveness and reliability in the dynamic monitoring of potato plant height.

3.4. Results of Selection Yield-Related Factors

With the analysis results presented in Figure 15.
As illustrated in Figure 15a for the tuber expansion stage, the strongest correlation was observed between AGB and potato tuber yield, with a correlation coefficient of 0.8236. Moreover, plant height demonstrated the highest association with AGB at this stage, showing a correlation coefficient of 0.7176. Based on the analysis of yield-related factors throughout different potato growth phases, AGB was selected in this study as the key predictor for potato yield estimation. Consequently, an AGB prediction model was developed using plant height and FVC as input variables.

3.5. Results of Potato AGB and Yield Prediction

In this study, a plant height–AGB prediction model was constructed using the Random Forest (RF) method based on the analysis of plant height and AGB.A dataset comprising 150 samples collected during the tuber expansion and maturity stages were utilized, with 105 samples randomly assigned for training and the remaining 45 used for model validation. To achieve optimal prediction performance, the number of decision trees in the RF model was set to 200 during training. The prediction results of the model were presented in Figure 16.
As shown in Figure 16, it is feasible to estimate AGB from plant height using the RF method based on the available data. However, the prediction performance of the biomass model constructed by RF varied significantly across different potato growth stages. Compared to models developed for individual growth stages, the model trained across the full growth period did not achieve satisfactory prediction accuracy. Although the inclusion of more sample data can help compensate for accuracy issues caused by plant lodging during the maturity stage, the high degree of variability in the prediction results limits the model’s applicability in practical scenarios.
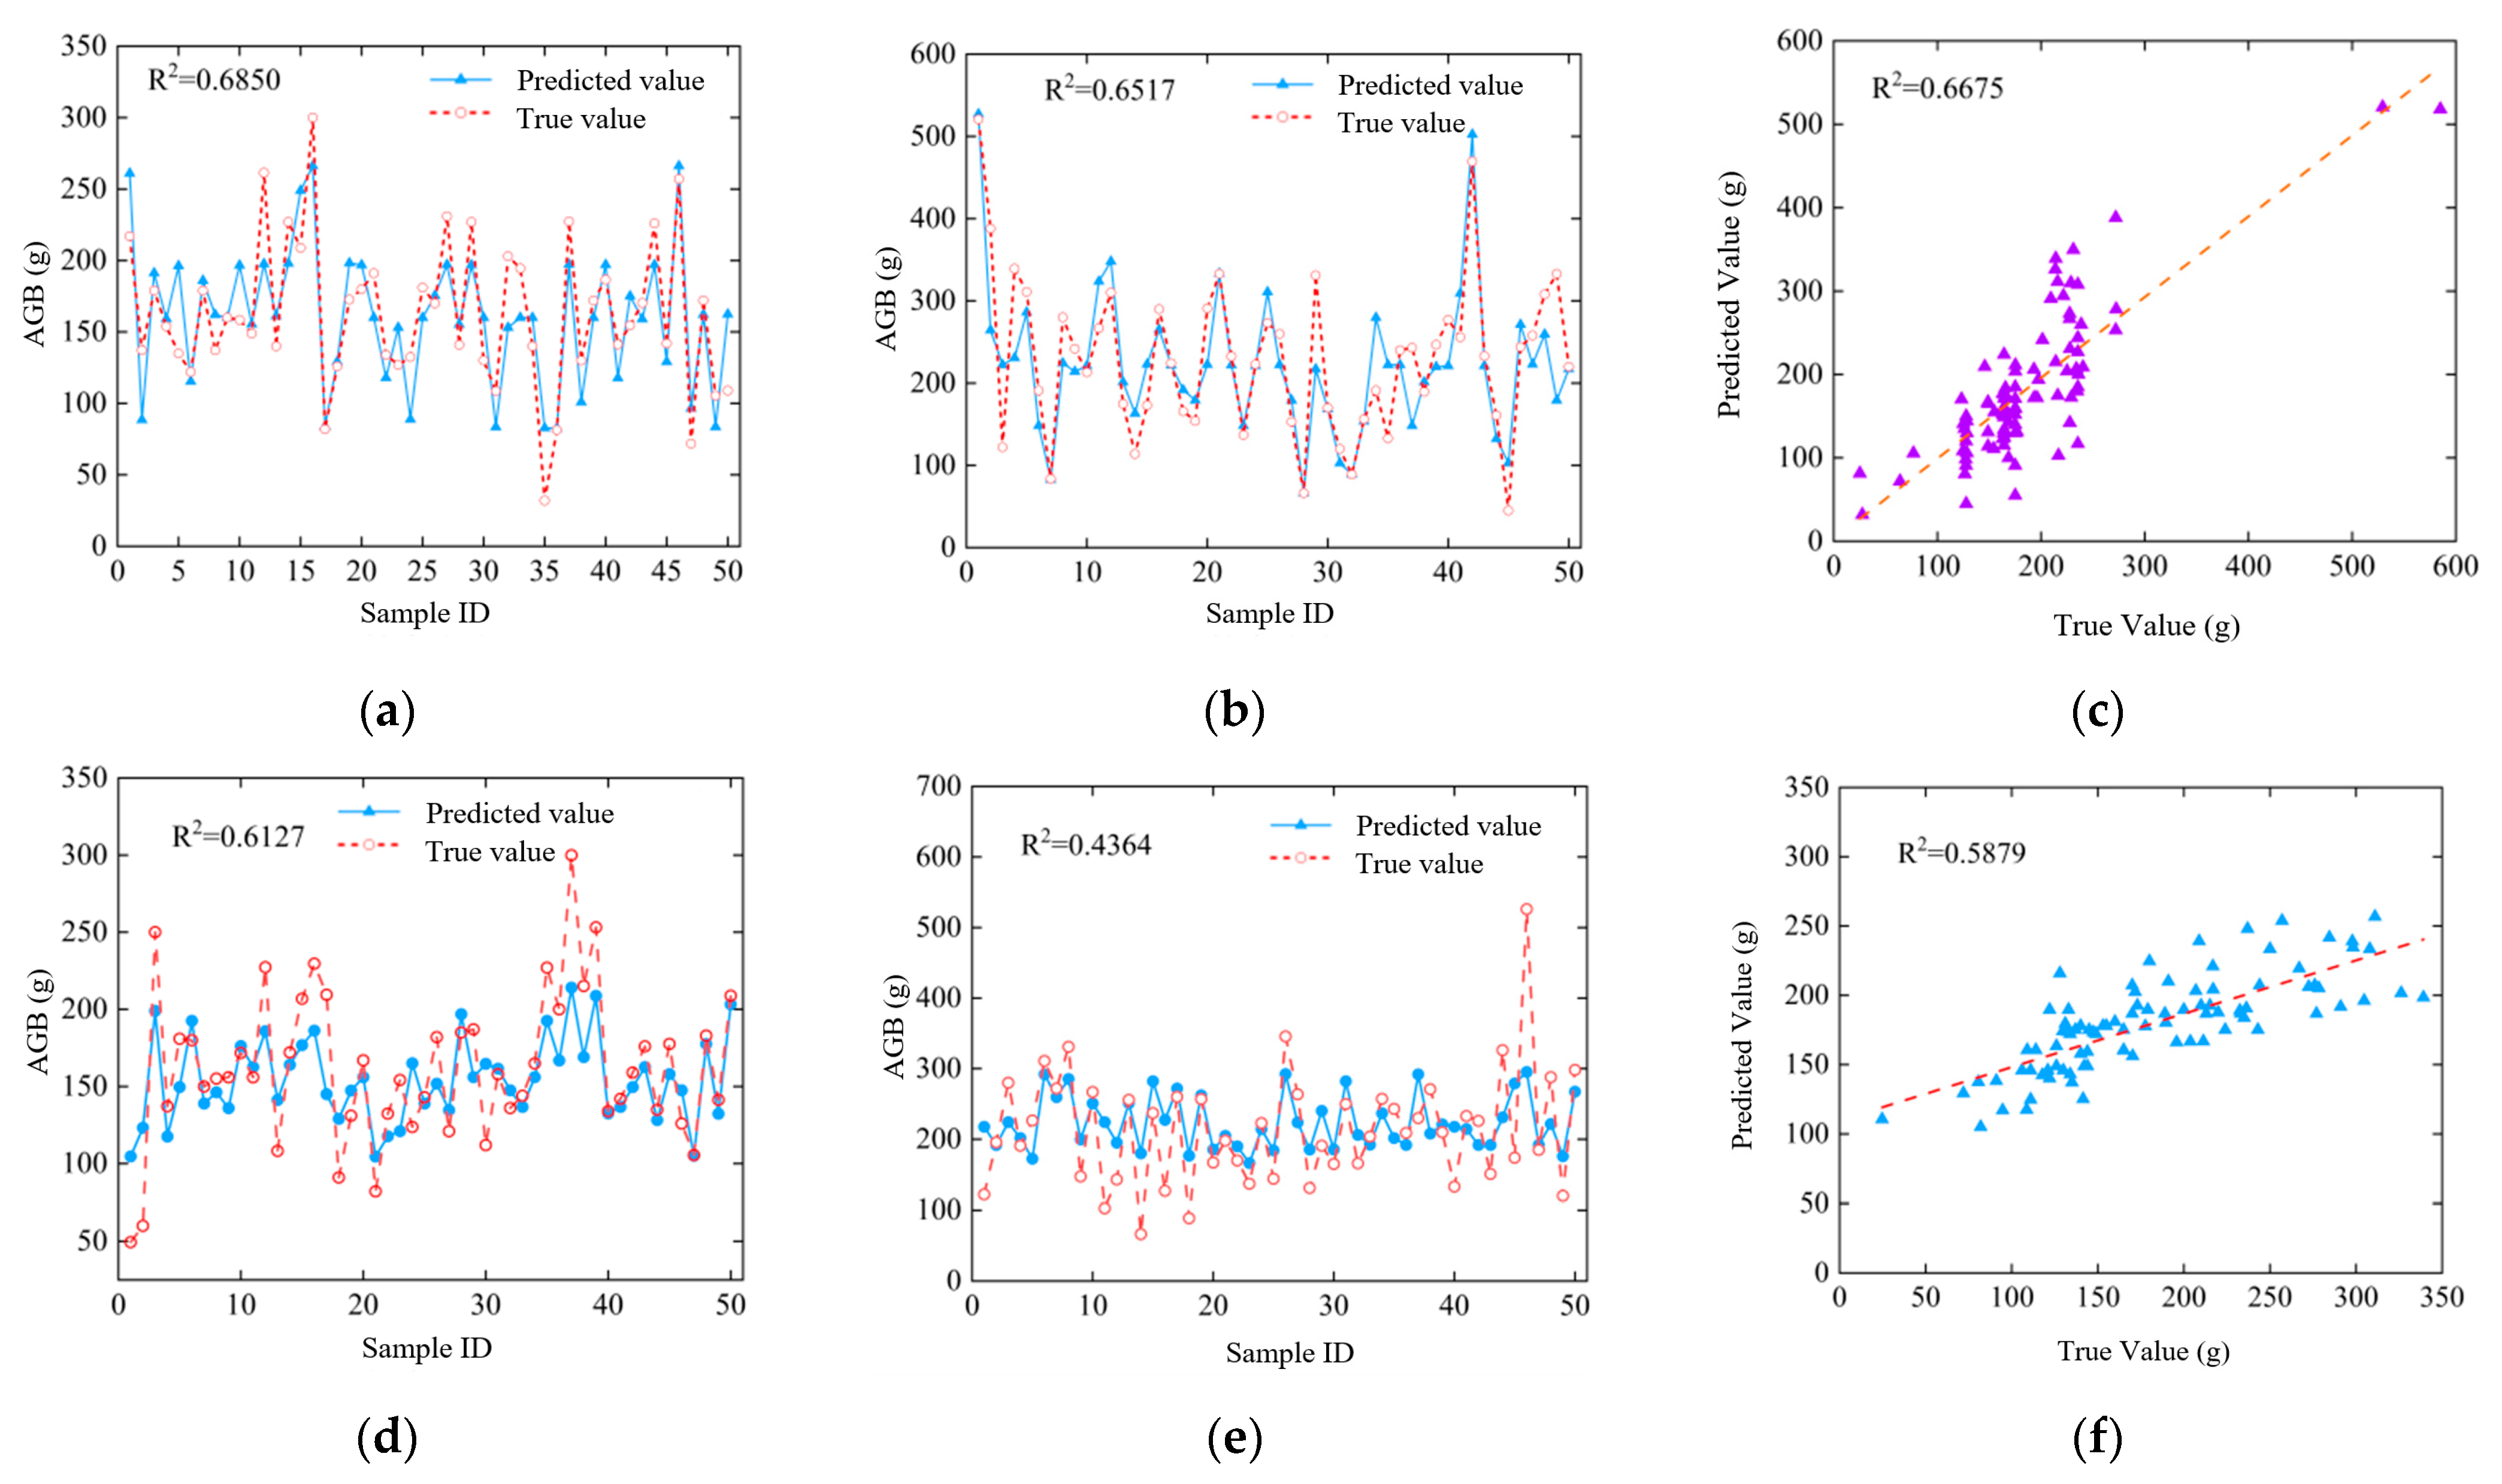
Given that the RF method did not yield satisfactory results in AGB prediction, this study further developed potato AGB prediction models using two additional machine learning approaches: Feedforward Neural Network (FNN)and Support Vector Regression (SVR). Plant height data were used as the input to predict AGB. The training and validation sets used for these two models were consistent with those applied in the RF model. After multiple trials, the optimal FNN model was configured with 25 hidden layers. The prediction results for both models were shown in Figure 17.
As shown in Figure 17, both machine learning methods performed best in AGB prediction during the tuber expansion stage. The FNN model achieved an R2 of 0.6850, while the SVR model reached 0.6127, both outperforming the RF method, with FNN showing particularly superior performance. At the maturity stage, the prediction accuracy of the FNN model slightly declined to an R2 of 0.6675, still maintaining a good level of performance. In contrast, the accuracy of the SVR model dropped significantly, with an R2 of only 0.4364. Overall, among the three models, the FNN model demonstrated stable performance during both the expansion and maturity stages, indicating strong robustness. In comparison, the RF and SVR models exhibited greater variability in prediction accuracy, particularly during the maturity stage.
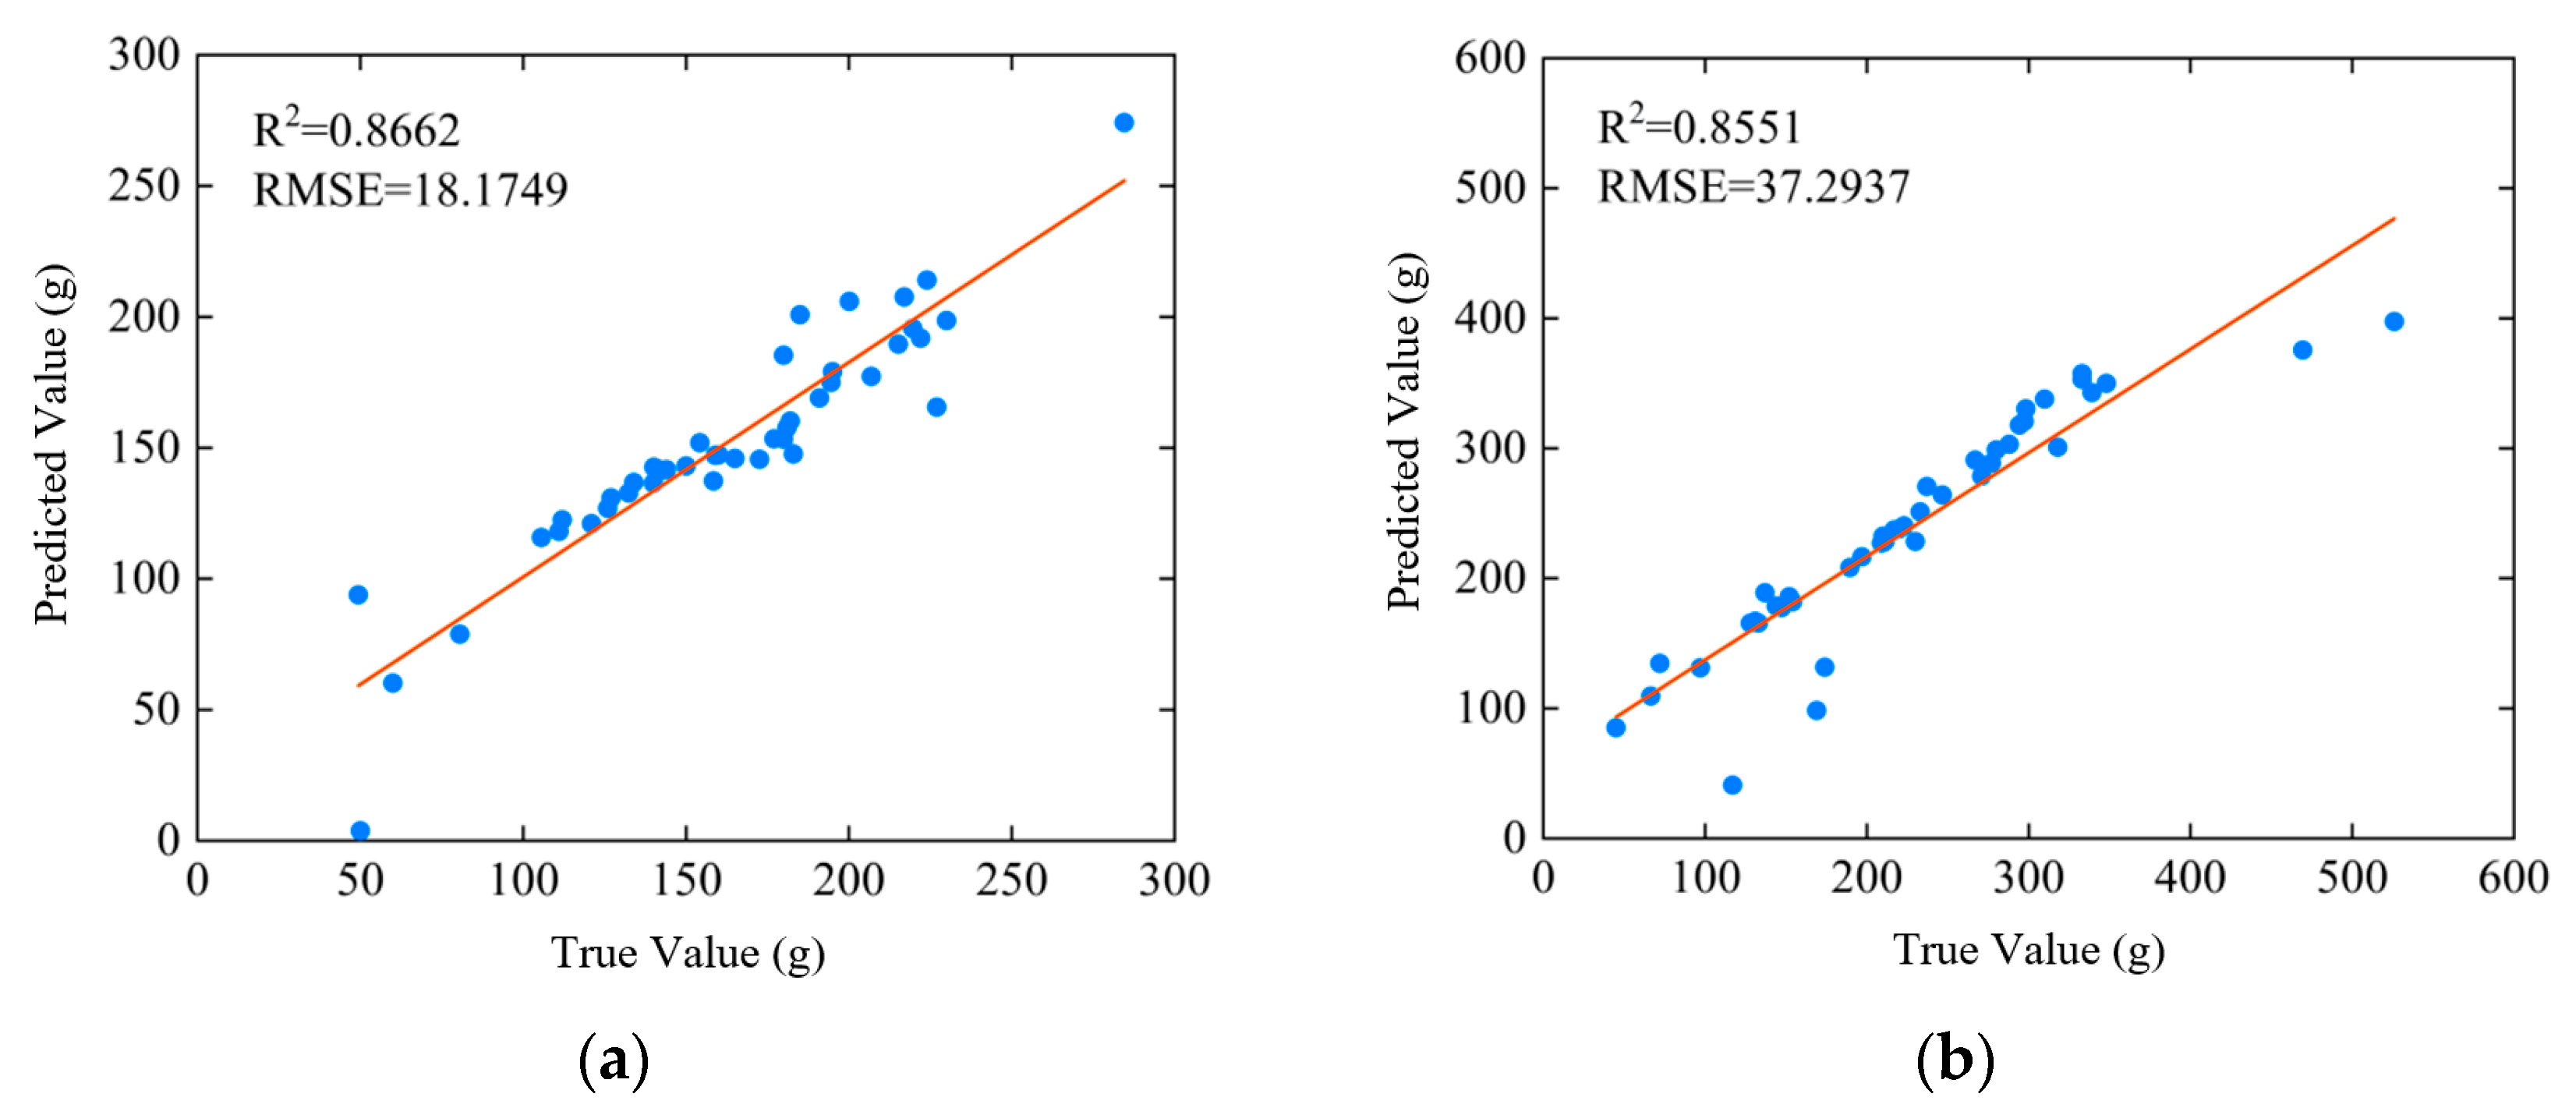
In this study, the FNN method, which demonstrated superior performance, was further optimized by incorporating both plant height and FVC data to enhance the prediction of AGB in potatoes. The optimized FNN model uses plant height and FVC as input variables and AGB as the output. The network structure includes an input layer, two hidden layers, and an output layer, where each hidden layer contains 15 neurons. The trained FNN model is mathematically expressed in Equation (6).
y = W 3 f 2 ( W 2 f 1 ( W 1 x + b 1 ) + b 2 ) + b 3
In the equation, W1 represents the weight matrix from the input layer to the first hidden layer, W2 represents the weight matrix from the first hidden layer to the second hidden layer, W3 represents the weight matrix from the second hidden layer to the output layer, b1 is the bias vector of the first hidden layer, b2 is the bias vector of the second hidden layer, b3 is the bias term of the output layer.
As shown in Figure 18, the FNN-based AGB prediction model, incorporating both plant height and FVC information, achieved an R2 of 0.8662 during the tuber expansion stage an improvement of 0.1812 compared to the unoptimized model. The RMSE of the model was 18.1749 g. At the maturity stage, the optimized model also maintained strong predictive performance, with an R2 of 0.8551. These results indicate that the optimized AGB prediction model offers improved stability and reliability during these growth stages.
The second sampling data collected during the maturity stage were used as validation data to evaluate the performance of the optimized potato AGB prediction model. The validation results were presented in Figure 19.
As depicted in Figure 19a, the AGB prediction model proposed in this study exhibited high predictive accuracy, achieving a coefficient of determination (R2) of 0.8341 and a root mean square error (RMSE) of 19.8595 g. The integration of plant height and FVC into the model significantly enhanced its performance, indicating that the AGB prediction model is both accurate and reliable. It is well-suited for estimating potato AGB across the entire growth cycle.
In addition, measured plant height combined with FVC obtained from the SVM method was used to estimate AGB, and the results showed a slightly higher accuracy (R2 = 0.9012, RMSE = 17.3126 g), as shown in Figure 19b. Nevertheless, the UAV-derived PH and FVC model still achieved reliable prediction performance, which demonstrates that the proposed approach can meet the requirements of AGB estimation without the need for labor-intensive ground measurements.
Leave-one-out cross-validation (LOOCV) was further applied to evaluate the performance of the AGB prediction model (Figure 19c). The results showed a slight decrease in R2 and a slight increase in RMSE compared with temporal validation (R2 = 0.8147, RMSE = 21.4632 g), but the overall prediction accuracy remained stable, demonstrating that the model achieved reliable performance across different sampling subsets.
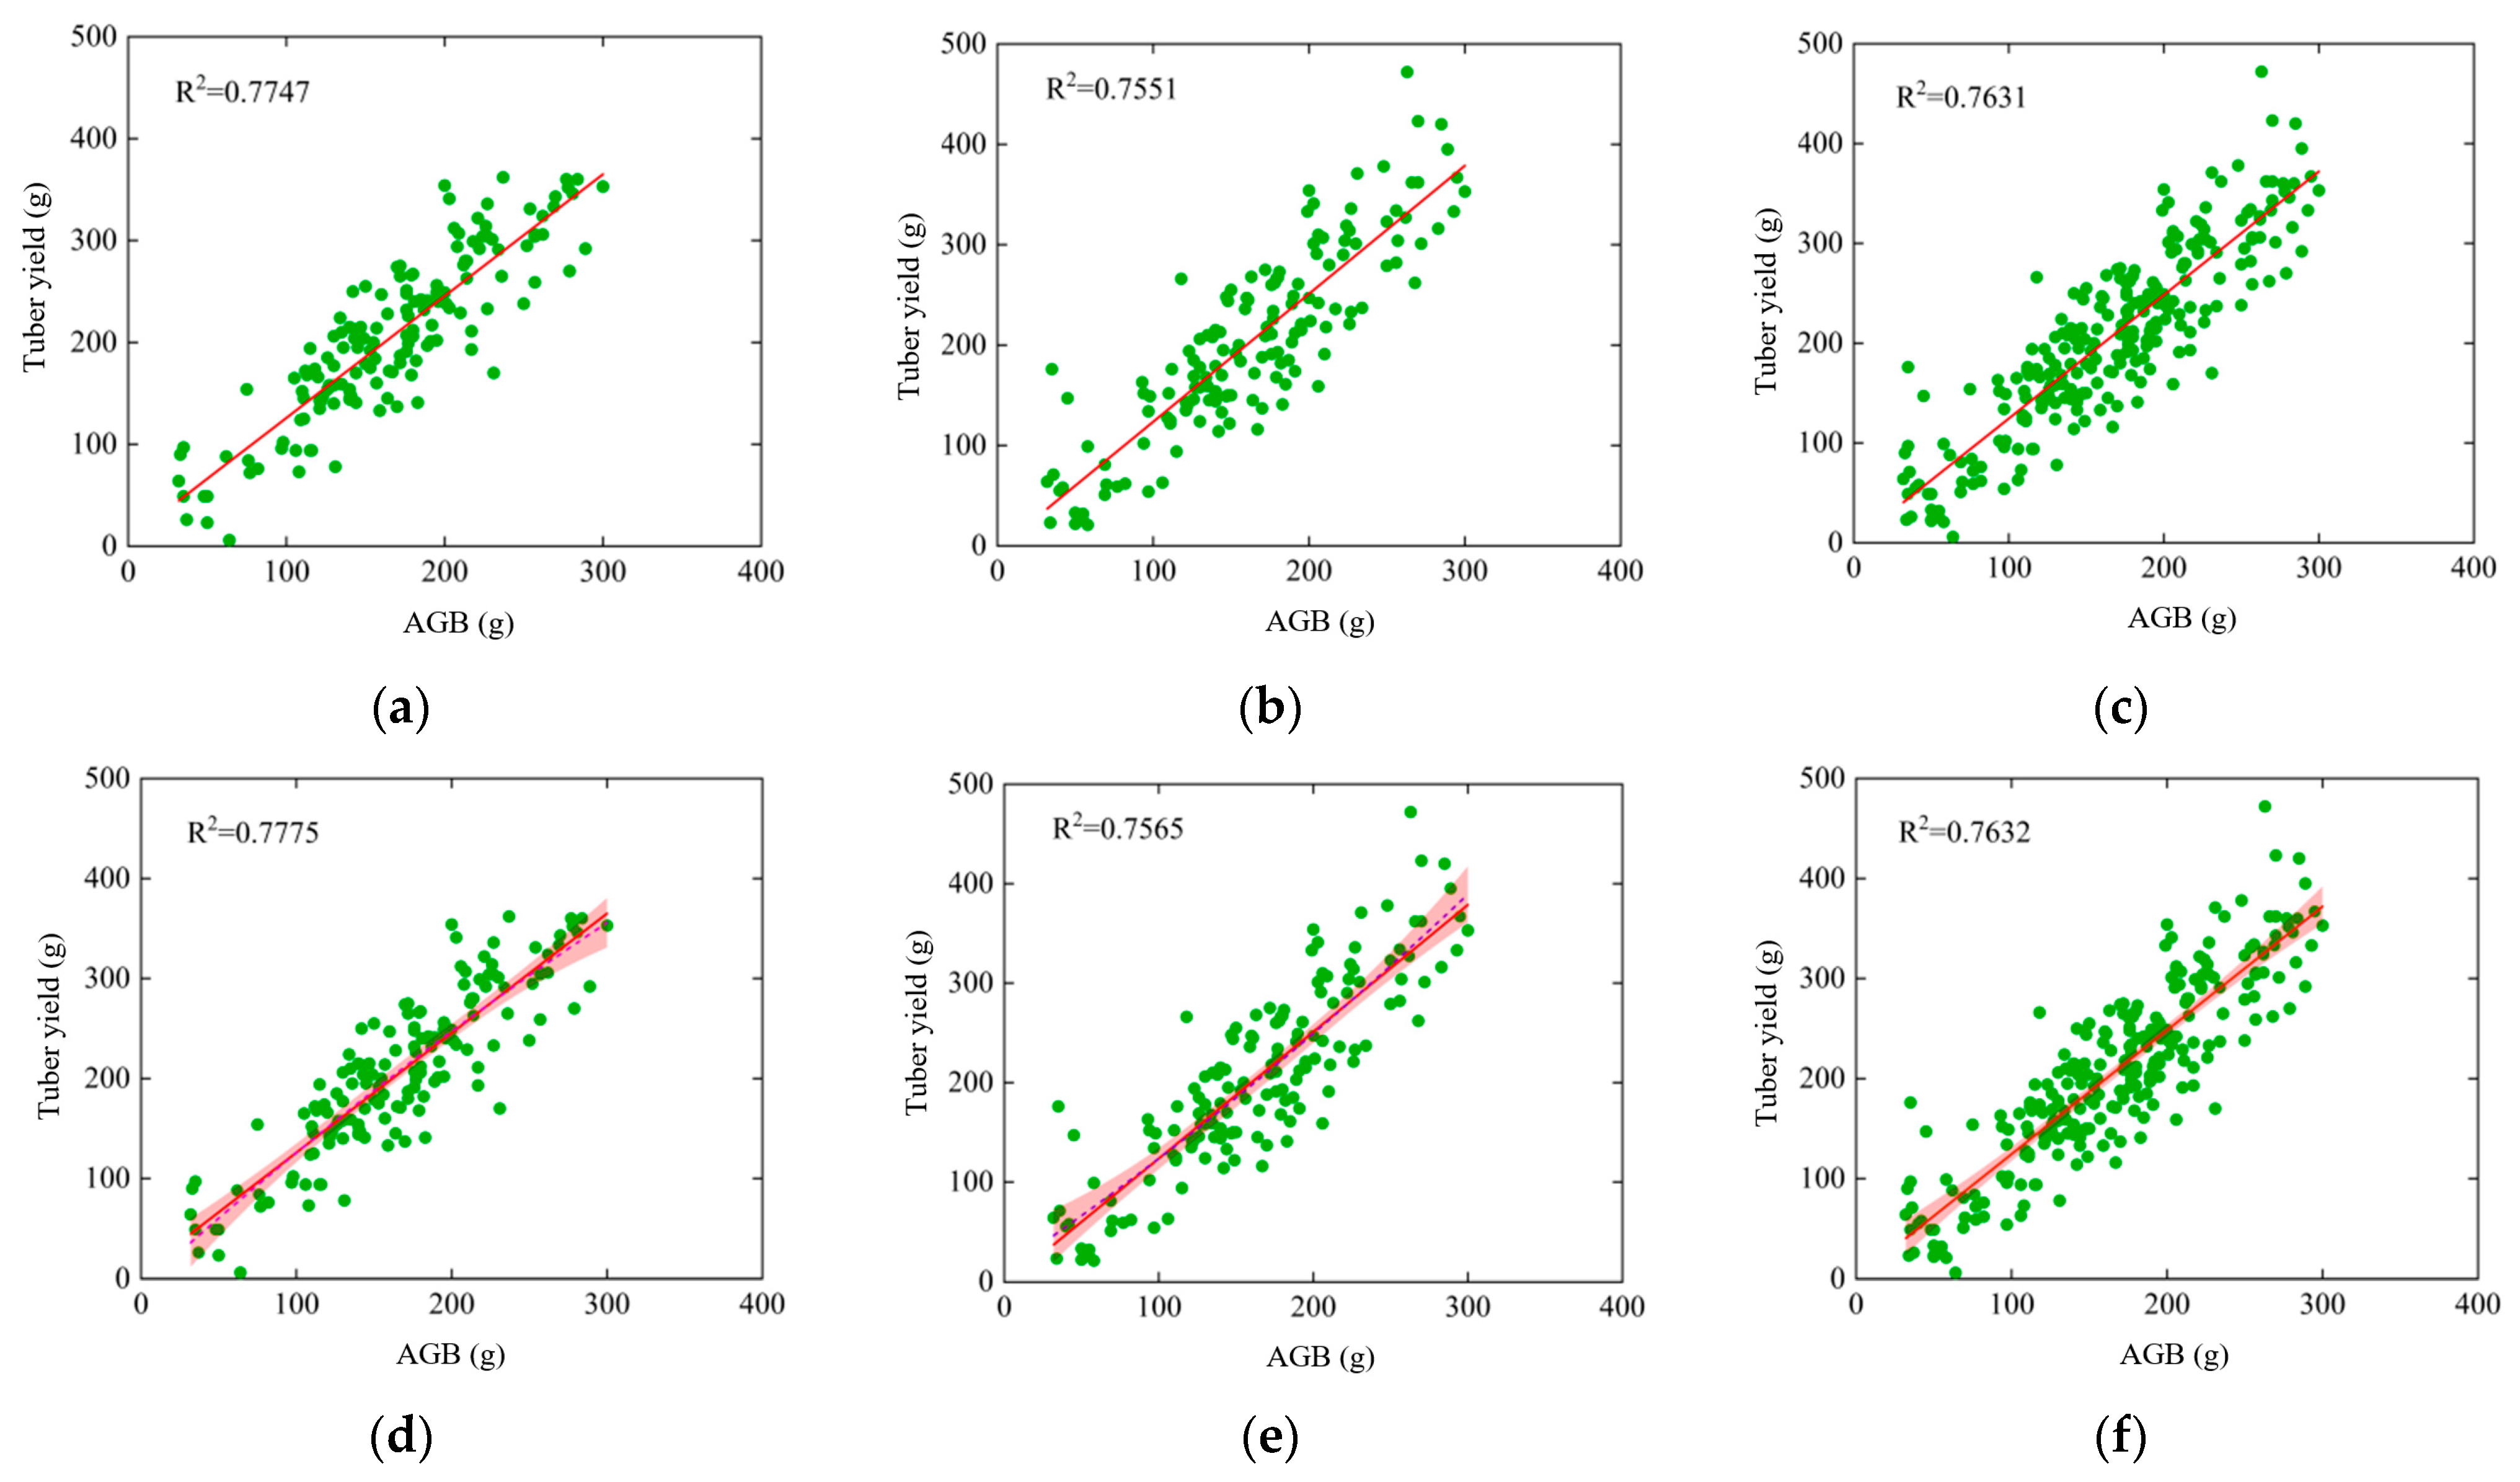
The study further conducted linear and polynomial fitting using the AGB and tuber yield data collected at two growth stages. The fitting results were presented in Figure 20.
Analysis of Figure 20 indicates that the results of both linear and polynomial fitting are similar, with polynomial fitting showing slightly better performance across the tuber expansion stage, maturity stage, and the full growth period. At the maturity stage, the R2 values for linear and polynomial fitting were 0.7551 and 0.7565, respectively, both lower than those at the expansion stage, which aligns with the results of the correlation analysis. To ensure the accuracy and generalizability of the prediction, this study adopted polynomial fitting using data from the full growth period. The resulting fitted curve was then used for final tuber yield prediction. The polynomial fitting equation is presented in Equation (7).
y = 0.0006 x 2 + 1.3767 x + 16.7921
In this study, the second sampling data from the maturity stage were used as the test set. Using the fitted polynomial equation, potato tuber yield was predicted based on AGB. A comparison between the predicted and actual yield values was shown in Figure 21.
As shown in Figure 21a, the model demonstrated good prediction accuracy, with the R2 of 0.7919 and the RMSE of 47.0436 g. Through the above experiments, this study investigated the response relationship between AGB and tuber yield in potatoes, establishing a reliable correlation between AGB and yield. The results confirm the feasibility of using AGB for effective yield prediction.
Furthermore, measured AGB was directly used to predict tuber yield, and the results showed a slightly higher accuracy (R2 = 0.8465, RMSE = 35.7286 g), as shown in Figure 21b. However, the UAV-derived AGB model also provided reliable prediction performance, indicating that the proposed non-destructive UAV-based approach can achieve accurate yield estimation without the need for destructive ground sampling.
For yield prediction, LOOCV analysis was also performed (Figure 21c). Consistent with the results for AGB, the yield model showed minor reductions in R2 and slightly higher RMSE(R2 = 0.7689, RMSE = 51.1564 g), yet maintained robust predictive capability. This indicates that the yield prediction framework can generalize well across different sample groups.
4. Discussion

This study introduced a UAV-based visible-light framework for estimating potato above-ground biomass (AGB) and predicting tuber yield. The framework demonstrated the potential for scalable, non-destructive monitoring of potato crops, but there are still challenges and areas for improvement.

4.1. UAV-Based Remote Sensing for Potato Crop Monitoring

The Green-Red Combination Vegetation Index (GRCVI), developed in this study, demonstrated significant effectiveness in extracting fractional vegetation cover (FVC). The index outperformed traditional indices, such as the Excess Green Index (EXG), especially during the Tuber formation and Tuber expansion stages. This is consistent with findings from previous studies that highlighted the advantages of crop-specific indices in improving canopy detection. The GRCVI showed strong discrimination capability between potato plants and other land cover types, reducing the impact of soil and shadow interference. However, FVC extraction accuracy decreased in the Maturity stage, likely due to canopy closure and weed interference. Similar challenges have been observed in studies involving wheat and maize, where spectral similarity between senescent leaves and soil reduced classification accuracy. This suggests that further optimization of the GRCVI, perhaps through combining multispectral or hyperspectral data, could improve its robustness during later growth stages, where canopy senescence becomes more prominent [37,38].

4.2. Plant Height Estimation Using Improved Structure from Motion (SfM)

The improved Structure from Motion (SfM) method applied in this study was effective in estimating potato plant height (PH) across all growth stages. Unlike traditional multi-temporal SfM approaches that require multiple data acquisitions and may accumulate errors due to terrain variations [39], our single-period strategy significantly reduced these errors and ensured more stable plant height estimation. This method showed a high degree of accuracy during the Tuber formation, Expansion, and Maturity stages, making it a reliable tool for dynamic field conditions. While the improved SfM method performed well, it could be further optimized by integrating additional remote sensing data such as LiDAR, which could improve the accuracy of plant height estimation in areas with complex terrain or varying plant densities.

4.3. Biomass and Yield Prediction Models

The modeling of above-ground biomass (AGB) and tuber yield prediction was one of the most important aspects of this study. The Feedforward Neural Network (FNN) model outperformed other models like Random Forest (RF) and Support Vector Regression (SVR) in predicting AGB, particularly at the Tuber expansion stage. The ability of FNNs to capture complex non-linear relationships between plant height, fractional vegetation cover (FVC), and biomass led to superior prediction accuracy. However, the FNN model’s performance declined during the Maturity stage, which can be attributed to the complexities associated with plant senescence, lodging, and canopy structure changes. This issue was also noted in other studies on crop biomass prediction, where similar challenges arose due to the variability introduced by plant aging and environmental stress. To address these challenges, future research could focus on developing hybrid models that combine multiple canopy traits and environmental data to improve the robustness of biomass prediction during late-stage growth. Additionally, integrating environmental variables such as soil moisture, temperature, and weather conditions may provide a more holistic understanding of the factors affecting biomass accumulation, as seen in studies on rice and maize [40].

4.4. Yield Prediction and Further Improvement

Yield prediction using AGB as an intermediate variable has been shown to be effective, with polynomial regression models providing satisfactory accuracy in predicting potato tuber yield. The results were consistent with other crop studies, where AGB was used as a key predictor for yield, given its close relationship with plant development and tuber formation. However, while the AGB-based yield prediction model performed well, the accuracy decreased during the Maturity stage, which could be attributed to the complex and non-linear relationship between AGB and yield at this stage. This is supported by similar findings in other crops where the relationship between biomass and yield becomes more difficult to model as the crop nears maturity. Future work should explore the possibility of direct integration of multiple canopy parameters, such as PH, FVC, and vegetation indices, into the yield prediction models. By combining complementary traits, the model may reduce errors and increase robustness, as demonstrated in studies on crops like soybean, wheat, and maize [41,42]. Moreover, integrating advanced deep learning techniques, such as convolutional neural networks (CNNs), could further improve the model’s performance, especially for yield prediction under varying environmental conditions.

4.5. Practical Implications for Precision Agriculture

The UAV-based framework developed in this study demonstrates considerable potential for non-destructive, high-throughput monitoring of potato crops, which is crucial for precision agriculture, especially in regions where potato yields are below global averages. By providing real-time insights into crop growth and health, this framework could facilitate more efficient and timely field management decisions. However, for broader adoption and improved prediction accuracy, future research should focus on extending the framework’s applicability to a wider range of growth conditions and environments. Testing the framework across different potato cultivars, as well as in varying climatic and soil conditions, would help assess its robustness and generalizability. Furthermore, the integration of multispectral or hyperspectral UAV imagery and advanced machine learning techniques could enhance the accuracy of both biomass and yield predictions, particularly during late growth stages when the plant’s physiological processes become more complex.

5. Conclusions

This study established a UAV-based visible-light remote sensing framework for estimating potato above-ground biomass (AGB) and predicting tuber yield. The framework integrated a newly developed Green-Red Combination Vegetation Index (GRCVI), an improved Structure from Motion (SfM) approach, and a Feedforward Neural Network (FNN) model. The GRCVI showed strong capability in distinguishing potato plants from soil and shadow, and the improved SfM method provided accurate plant height (PH) estimation across growth stages. Combined with fractional vegetation cover (FVC), these traits were effectively incorporated into the FNN to achieve robust AGB prediction, which in turn supported reliable yield estimation.
Beyond the accuracy achieved, this framework emphasizes the agronomic relevance of using AGB as an intermediate predictor. By linking PH and FVC to tuber yield through AGB, the approach ensures both predictive performance and biological interpretability. This indirect integration strategy reflects the functional relationship between canopy traits and yield formation, offering a practical solution for non-destructive monitoring of potato crops.
Overall, the proposed framework contributes to UAV-based crop phenotyping by demonstrating that low-cost visible-light imagery, when combined with tailored vegetation indices and machine learning, can provide timely and scalable yield prediction. Future work should extend validation across different cultivars and regions, integrate additional data such as multispectral imagery and environmental variables, and explore direct multi-parameter fusion strategies to further enhance prediction robustness and generalizability.

Author Contributions

Methodology, Y.C.; Software, Y.C.; Writing—original draft, Y.C.; Visualization, Y.C.; Writing—review and editing, Y.H., M.L., X.T. and L.Y.; Funding acquisition, Y.H.; Supervision, Y.H. and L.C.; formal analysis, M.L.; Investigation, X.S., A.H. and L.C.; Validation, X.S., A.H. and X.T. All authors have read and agreed to the published version of the manuscript.

Funding

This work was financially supported by National Natural Science Foundation of China (32171894).

Data Availability Statement

The original contributions presented in this study are included in the article.

Acknowledgments

We are grateful to Wenkai Luo, Chenhao Yu for data collection.

Conflicts of Interest

The authors declare no conflicts of interest.

References

  1. Lu, Y.; Kear, P.; Lu, X.; Gatto, M. The status and challenges of sustainable intensification of rice-potato systems in southern China. Am. J. Potato Res. 2021, 98, 361–373. [Google Scholar] [CrossRef]
  2. Zhang, H.; Fen, X.; Yu, W.; Hu, H.-h.; Dai, X.-F. Progress of potato staple food research and industry development in China. J. Integr. Agric. 2017, 16, 2924–2932. [Google Scholar] [CrossRef]
  3. Li, B.; Xu, X.; Zhang, L.; Han, J.; Bian, C.; Li, G.; Liu, J.; Jin, L. Above-ground biomass estimation and yield prediction in potato by using UAV-based RGB and hyperspectral imaging. ISPRS J. Photogramm. Remote Sens. 2020, 162, 161–172. [Google Scholar] [CrossRef]
  4. Liu, Y.; Fan, Y.; Yue, J.; Jin, X.; Ma, Y.; Chen, R.; Bian, M.; Yang, G.; Feng, H. A model suitable for estimating above-ground biomass of potatoes at different regional levels. Comput. Electron. Agric. 2024, 222, 109081. [Google Scholar] [CrossRef]
  5. Gnyp, M.L. Evaluating and Developing Methods for Non-Destructive Monitoring of Biomass and Nitrogen in Wheat and Rice Using Hyperspectral Remote Sensing. Ph.D. Thesis, Universität zu Köln, Köln, Germany, 2014. [Google Scholar]
  6. Mukiibi, A.; Machakaire, A.; Franke, A.; Steyn, J. A systematic review of vegetation indices for potato growth monitoring and tuber yield prediction from remote sensing. Potato Res. 2025, 68, 409–448. [Google Scholar] [CrossRef]
  7. Fan, Y.; Liu, Y.; Yue, J.; Jin, X.; Chen, R.; Bian, M.; Ma, Y.; Yang, G.; Feng, H. Estimation of potato yield using a semi-mechanistic model developed by proximal remote sensing and environmental variables. Comput. Electron. Agric. 2024, 223, 109117. [Google Scholar] [CrossRef]
  8. Khanal, S.; Fulton, J.; Shearer, S. An overview of current and potential applications of thermal remote sensing in precision agriculture. Comput. Electron. Agric. 2017, 139, 22–32. [Google Scholar] [CrossRef]
  9. Yang, Q.; Su, Y.; Hu, T.; Jin, S.; Liu, X.; Niu, C.; Liu, Z.; Kelly, M.; Wei, J.; Guo, Q. Allometry-based estimation of forest aboveground biomass combining LiDAR canopy height attributes and optical spectral indexes. For. Ecosyst. 2022, 9, 100059. [Google Scholar] [CrossRef]
  10. Servia, H.; Pareeth, S.; Michailovsky, C.I.; de Fraiture, C.; Karimi, P. Operational framework to predict field level crop biomass using remote sensing and data driven models. Int. J. Appl. Earth Obs. Geoinf. 2022, 108, 102725. [Google Scholar] [CrossRef]
  11. Verrelst, J.; Malenovský, Z.; Van der Tol, C.; Camps-Valls, G.; Gastellu-Etchegorry, J.-P.; Lewis, P.; North, P.; Moreno, J. Quantifying vegetation biophysical variables from imaging spectroscopy data: A review on retrieval methods. Surv. Geophys. 2019, 40, 589–629. [Google Scholar] [CrossRef]
  12. Tsouros, D.C.; Bibi, S.; Sarigiannidis, P.G. A review on UAV-based applications for precision agriculture. Information 2019, 10, 349. [Google Scholar] [CrossRef]
  13. Maes, W.H.; Steppe, K. Perspectives for remote sensing with unmanned aerial vehicles in precision agriculture. Trends Plant Sci. 2019, 24, 152–164. [Google Scholar] [CrossRef]
  14. Liu, Y.; Feng, H.; Yue, J.; Jin, X.; Fan, Y.; Chen, R.; Bian, M.; Ma, Y.; Song, X.; Yang, G. Improved potato AGB estimates based on UAV RGB and hyperspectral images. Comput. Electron. Agric. 2023, 214, 108260. [Google Scholar] [CrossRef]
  15. Liu, Y.; Fan, Y.; Feng, H.; Chen, R.; Bian, M.; Ma, Y.; Yue, J.; Yang, G. Estimating potato above-ground biomass based on vegetation indices and texture features constructed from sensitive bands of UAV hyperspectral imagery. Comput. Electron. Agric. 2024, 220, 108918. [Google Scholar] [CrossRef]
  16. Xie, J.; Zhou, Z.; Zhang, H.; Zhang, L.; Li, M. Combining canopy coverage and plant height from UAV-based RGB images to estimate spraying volume on potato. Sustainability 2022, 14, 6473. [Google Scholar] [CrossRef]
  17. Wen, T.; Li, J.-H.; Wang, Q.; Gao, Y.-Y.; Hao, G.-F.; Song, B.-A. Thermal imaging: The digital eye facilitates high-throughput phenotyping traits of plant growth and stress responses. Sci. Total Environ. 2023, 899, 165626. [Google Scholar] [CrossRef]
  18. Mulugeta Aneley, G.; Haas, M.; Köhl, K. LIDAR-based phenotyping for drought response and drought tolerance in potato. Potato Res. 2023, 66, 1225–1256. [Google Scholar] [CrossRef]
  19. Joshi, A.; Pradhan, B.; Gite, S.; Chakraborty, S. Remote-sensing data and deep-learning techniques in crop mapping and yield prediction: A systematic review. Remote Sens. 2023, 15, 2014. [Google Scholar] [CrossRef]
  20. Panday, U.S.; Pratihast, A.K.; Aryal, J.; Kayastha, R.B. A review on drone-based data solutions for cereal crops. Drones 2020, 4, 41. [Google Scholar] [CrossRef]
  21. Shi, X.; Yang, H.; Chen, Y.; Liu, R.; Guo, T.; Yang, L.; Hu, Y. Research on Estimating Potato Fraction Vegetation Coverage (FVC) Based on the Vegetation Index Intersection Method. Agronomy 2024, 14, 1620. [Google Scholar] [CrossRef]
  22. Zhang, X.; Zhang, F.; Qi, Y.; Deng, L.; Wang, X.; Yang, S. New research methods for vegetation information extraction based on visible light remote sensing images from an unmanned aerial vehicle (UAV). Int. J. Appl. Earth Obs. Geoinf. 2019, 78, 215–226. [Google Scholar] [CrossRef]
  23. Chen, Y.; Guo, T.; Shi, X.; Yang, H.; Zhang, K.; Yang, L.; Hu, Y. Development of a nitrogen requirement map generation method for potato based on UAV visible light image. Comput. Electron. Agric. 2025, 233, 110181. [Google Scholar] [CrossRef]
  24. Ballester, C.; Brinkhoff, J.; Quayle, W.C.; Hornbuckle, J. Monitoring the effects of water stress in cotton using the green red vegetation index and red edge ratio. Remote Sens. 2019, 11, 873. [Google Scholar] [CrossRef]
  25. Meyer, G.E.; Neto, J.C. Verification of color vegetation indices for automated crop imaging applications. Comput. Electron. Agric. 2008, 63, 282–293. [Google Scholar] [CrossRef]
  26. Foody, G.M. Ground truth in classification accuracy assessment: Myth and reality. Geomatics 2024, 4, 81–90. [Google Scholar] [CrossRef]
  27. Congalton, R.G. A review of assessing the accuracy of classifications of remotely sensed data. Remote Sens. Environ. 1991, 37, 35–46. [Google Scholar] [CrossRef]
  28. Congalton, R.G.; Green, K. Assessing the Accuracy of Remotely Sensed Data: Principles and Practices; CRC press: Boca Raton, FL, USA, 2019. [Google Scholar]
  29. Sezgin, M.; Sankur, B.l. Survey over image thresholding techniques and quantitative performance evaluation. J. Electron. Imaging 2004, 13, 146–168. [Google Scholar]
  30. Goh, T.Y.; Basah, S.N.; Yazid, H.; Safar, M.J.A.; Saad, F.S.A. Performance analysis of image thresholding: Otsu technique. Measurement 2018, 114, 298–307. [Google Scholar] [CrossRef]
  31. Fujiwara, R.; Kikawada, T.; Sato, H.; Akiyama, Y. Comparison of remote sensing methods for plant heights in agricultural fields using unmanned aerial vehicle-based structure from motion. Front. Plant Sci. 2022, 13, 886804. [Google Scholar] [CrossRef] [PubMed]
  32. Chu, T.; Starek, M.J.; Brewer, M.J.; Murray, S.C.; Pruter, L.S. Characterizing canopy height with UAS structure-from-motion photogrammetry—Results analysis of a maize field trial with respect to multiple factors. Remote Sens. Lett. 2018, 9, 753–762. [Google Scholar] [CrossRef]
  33. Pal, M. Random forest classifier for remote sensing classification. Int. J. Remote Sens. 2005, 26, 217–222. [Google Scholar] [CrossRef]
  34. Kavitha, S.; Varuna, S.; Ramya, R. A comparative analysis on linear regression and support vector regression. In Proceedings of the 2016 Online International Conference on Green Engineering and Technologies (IC-GET), Coimbatore, India, 19 November 2016; pp. 1–5. [Google Scholar]
  35. Huang, A.; Yu, C.; Feng, J.; Tong, X.; Yorozu, A.; Ohya, A.; Hu, Y. A motion planning method for winter jujube harvesting robotic arm based on optimized Informed-RRT * algorithm. Smart Agric. Technol. 2025, 10, 100732. [Google Scholar] [CrossRef]
  36. Hu, J.; Feng, H.; Wang, Q.; Shen, J.; Wang, J.; Liu, Y.; Feng, H.; Yang, H.; Guo, W.; Qiao, H. Pretrained deep learning networks and multispectral imagery enhance maize lcc, fvc, and maturity estimation. Remote Sens. 2024, 16, 784. [Google Scholar] [CrossRef]
  37. Steduto, P.; Hsiao, T.C.; Raes, D.; Fereres, E. AquaCrop—The FAO crop model to simulate yield response to water: I. Concepts and underlying principles. Agron. J. 2009, 101, 426–437. [Google Scholar] [CrossRef]
  38. Yang, H.; Zhao, J.; Lan, Y.; Lu, L.; Li, Z. Fraction vegetation cover extraction of winter wheat based on spectral information and texture features obtained by UAV. Int. J. Precis. Agric. Aviat. 2019, 2, 54–61. [Google Scholar]
  39. Cui, H.; Shen, S.; Gao, X.; Hu, Z. CSFM: Community-based structure from motion. In Proceedings of the 2017 IEEE International Conference on Image Processing (ICIP), Beijing, China, 17–20 September 2017; pp. 4517–4521. [Google Scholar]
  40. Wang, X.; Xu, G.; Feng, Y.; Peng, J.; Gao, Y.; Li, J.; Han, Z.; Luo, Q.; Ren, H.; You, X. Estimation model of rice aboveground dry biomass based on the machine learning and hyperspectral characteristic parameters of the canopy. Agronomy 2023, 13, 1940. [Google Scholar] [CrossRef]
  41. Tan, S.; Pei, J.; Zou, Y.; Fang, H.; Wang, T.; Huang, J. Improving rice yield prediction with multi-modal UAV data: Hyperspectral, thermal, and LiDAR integration. Geo-Spat. Inf. Sci. 2025, 1–20. [Google Scholar] [CrossRef]
  42. Fei, S.; Hassan, M.A.; Xiao, Y.; Su, X.; Chen, Z.; Cheng, Q.; Duan, F.; Chen, R.; Ma, Y. UAV-based multi-sensor data fusion and machine learning algorithm for yield prediction in wheat. Precis. Agric. 2023, 24, 187–212. [Google Scholar]
Figure 1. Experimental Field Location and Global Aerial View. (a) Experimental Field Location. (b) Global Aerial View.
Remotesensing 17 03246 g001
Figure 2. Visible light image stitching and clipping results in three periods. (a) Tuber formation stage. (b) Tuber expansion stage. (c) Maturity stage.
Remotesensing 17 03246 g002
Figure 3. Selection of regions of interest (ROI) for Different Land Cover Types. (a) Original Image. (b) ROI Selection Diagram.
Remotesensing 17 03246 g003
Figure 4. Scatter Plots of Different Visible Band Combinations for Various Land Cover Types. (a) Green–Red Band Combination. (b) Blue–Green Band Combination. (c) Red–Blue Band Combination.
Remotesensing 17 03246 g004
Figure 5. Fitting Results for Vegetation Index Construction.
Remotesensing 17 03246 g005
Figure 6. Original Image and Processed Result Using GRCVI Vegetation Index. (a) Original Image of Potato Field. (b) GRCVI Grayscale Image.
Remotesensing 17 03246 g006
Figure 7. SVM Supervised Classification Results for Potato at Three Growth Stages. (a) Tuber formation stage. (b) Tuber expansion stage. (c) Maturity stage.
Remotesensing 17 03246 g007
Figure 8. Confusion Matrix Validation Results of SVM Classification for Potato at Three Growth Stages. (a) Tuber formation stage. (b) Tuber expansion stage. (c) Maturity stage.
Remotesensing 17 03246 g008
Figure 9. Histogram Curves of Three VIs during three growth stages. (a) GRCVI-Tuber formation stage. (b) RGCI-Tuber formation stage. (c) EXG-Tuber formation stage. (d) GRCVI-Tuber expansion stage. (e) RGCI-Tuber expansion stage. (f) EXG-Tuber expansion stage. (g) GRCVI-Maturity stage. (h) RGCI-Maturity stage. (i) EXG-Maturity stage.
Remotesensing 17 03246 g009
Figure 10. Histogram Curve of the NGRVI Vegetation Index.
Remotesensing 17 03246 g010
Figure 11. Comparison of Fractional vegetation coverage (FVC) Estimation Accuracy Using Three Thresholding Methods across Three Growth Stages. (a) Tuber formation stage. (b) Tuber expansion stage. (c) Maturity stage.
Remotesensing 17 03246 g011
Figure 12. Fractional vegetation coverage (FVC) Extraction Results at Three Growth Stages Using SVM Supervised Classification Combined with GRCVI and Numerical Intersection Method. (a) Tuber formation stage. (b) Tuber expansion stage. (c) Maturity stage.
Remotesensing 17 03246 g012
Figure 13. Accuracy of Plant Height Estimation at Different Growth Stages Using the Improved Structure from Motion (SfM) Method. (a) Tuber formation stage. (b) Tuber expansion stage. (c)Maturity stage.
Remotesensing 17 03246 g013
Figure 14. Accuracy of Plant Height Estimation Over the Entire Growth Period Using the Improved SfM Method.
Remotesensing 17 03246 g014
Figure 15. Heatmap of Correlation Analysis Across Different Growth Stages. (a) Tuber expansion stage. (b) Maturity stage.
Remotesensing 17 03246 g015
Figure 16. Above-ground biomass (AGB) Prediction Performance at Different Growth Stages Using the Random Forest (RF) Method. (a) Tuber expansion stage. (b) Maturity stage. (c) Over the Entire Growth Period.
Remotesensing 17 03246 g016
Figure 17. Above-ground biomass (AGB) Prediction Results at Different Growth Stages Using Feedforward Neural Network (FNN) and Support Vector Regression (SVR) Methods. (a) FNN -Tuber Expansion stage. (b) FNN-Maturity stage. (c) FNN-Entire Growth Period. (d) SVR-Tuber Expansion stage. (e) SVR-Maturity stage. (f) SVR-Entire Growth Period.
Remotesensing 17 03246 g017
Figure 18. Above-ground biomass (AGB) Prediction Performance of the Optimized Feedforward Neural Network (FNN) Model at Different Growth Stages. (a) Tuber expansion stage. (b) Maturity stage.
Remotesensing 17 03246 g018
Figure 19. Performance Validation of the Above-ground biomass (AGB) Prediction Model. (a) AGB estimated using UAV-derived plant height and FVC. (b) AGB estimated using ground-truth data. (c) AGB prediction model validated using LOOCV.
Remotesensing 17 03246 g019
Figure 20. Linear Fitting (LF) and Polynomial Fitting (PF) Results of Above-ground biomass (AGB) and Tuber Yield at Different Growth Stages. (a) LF-Tuber expansion stage. (b) LF-Maturity stage. (c) LF-Entire Growth Period. (d) PF-Tuber expansion stage. (e) PF-Maturity stage. (f) PF-Entire Growth Period.
Remotesensing 17 03246 g020
Figure 21. Performance Validation Results of the Yield Prediction Model. (a) Yield predicted from UAV-derived AGB. (b) Yield predicted from measured AGB. (c) Yield prediction model validated using LOOCV.
Remotesensing 17 03246 g021
Table 1. Main Parameter of the DJI Phantom 4 PRO UAV and onboard camera.
Parameter of the UVAValueParameter of the Onboard Camera Value
Takeoff weight (g)1388Lens aperturef/2.8–f/11
Max horizontal speed (km/h)72Effective pixels20 MP
Max continuous flight time (min)30ISO rangeAuto: 100–3200; Manual: 100–12,800
Gimbal pitch angle (°)−90~+30Shutter speed (s)1/2000–1/8000
Positioning accuracy (RMS)Vertical: 1.5 cm + 1 ppm; Horizontal: 1 cm + 1 ppmMax photo resolution5472 × 3648 pixels
Table 2. Visible light vegetation indices.
Vegetation IndicesEquation
GRVI(G − R)/(G + R)
EXG2G − R − B
RGBVI(G2 − R*B)/(G2 + R*B)
MGRVI(G2 − R2)/(G2 + R2)
NGRVI(G2 + R2)/(G2 − R2)
NGBDI(G − B)/(G + B)
TBVIG-1.2531B-34.446
RGCI2G-1.1555R-25.007-B
BGCI2G-1.0299B-19.308-R
* R, G, and B represent the red, green, and blue spectral bands, respectively.
Table 3. Classification Threshold Determination Results Based on the Numerical Intersection Method.
Vegetation IndicesTuber Formation StageTuber Expansion StageMaturity Stage
EXG75.333371.050064.3333
GRVI1.02640.45331.7561
RGBVI28.863622.625045.1411
MGRVI5.71845.759115.8771
NGRVI5.87576.395615.9457
NGBDI0.89802.960321.7666
TBVI−4.6480−2.8884−15.1320
RGCI48.175647.766834.4870
BGCI36.548431.027513.5222
GRCVI33.428034.330524.7578
Table 4. Classification Threshold Determination Results Based on the Histogram Bimodal Method.
Vegetation IndicesTuber Formation StageTuber Expansion StageMaturity Stage
EXG63.000065.000062.0000
TBVI−4.2378−19.0148−19.3001
RGCI40.947741.316134.8726
BGCI21.531618.255915.8320
GRCVI20.258420.530212.3480
Table 5. Classification Threshold Determination Results Based on the Otsu Thresholding Method.
Vegetation IndicesTuber Formation StageTuber Expansion StageMaturity Stage
EXG55.152956.047156.8510
TBVI−7.1414−3.2686−12.7219
RGCI32.255934.204137.9243
BGCI14.261719.018126.9715
GRCVI15.766720.530225.6579
Table 6. FVC Extraction Results at Three Growth Stages Based on Three Methods.
Vegetation IndicesGrowth StageFVC-Numerical Intersection Method (%)FVC-Histogram Bimodal Method (%)FVC-Otsu Thresholding Method (%)
EXGTuber formation23.9928.2124.31
Tuber expansion48.4553.3047.25
Maturity60.9562.2552.36
TBVITuber formation27.6527.4722.21
Tuber expansion50.4765.1140.15
Maturity73.3868.5671.56
RGCITuber formation25.2327.8524.85
Tuber expansion48.6454.2048.19
Maturity65.0465.0351.06
BGCITuber formation57.4527.2523.95
Tuber expansion49.0458.7548.75
Maturity67.6366.2649.36
GRCVITuber formation24.3328.5923.59
Tuber expansion46.8156.7046.64
Maturity60.8167.8451.04
Table 7. Accuracy Validation of FVC Based on the Numerical Intersection Method Using Confusion Matrix.
Vegetation IndicesPotato Growth StagePotato PlantNon-Plant BackgroundOverall Accuracy (%)Kappa Coefficient
Producer Accuracy (%)User Accuracy (%)Producer Accuracy (%)User Accuracy (%)
EXGTuber formation100.0087.8382.65100.0092.300.8412
Tuber expansion97.1697.0596.8496.9697.010.9400
Maturity stage100.0098.9094.20100.0098.540.9605
TBVITuber formation99.7699.9499.9599.8199.870.9973
Tuber expansion90.9689.3787.20100.0089.080.7829
Maturity96.6492.8477.7888.5991.900.7757
RGCITuber formation100.0087.5582.20100.0092.100.8370
Tuber expansion98.8783.0378.9298.5389.100.7811
Maturity100.0098.2394.6399.9998.650.9634
BGCITuber formation64.5357.8541.1348.0854.140.5740
Tuber expansion99.4989.7187.8299.3993.850.9385
Maturity99.9997.9393.7299.9798.410.9569
GRCVITuber formation100.0099.1898.81100.0098.990.9951
Tuber expansion99.9799.6199.5999.9699.780.9957
Maturity99.8799.5599.8699.6099.560.9884
Disclaimer/Publisher’s Note: The statements, opinions and data contained in all publications are solely those of the individual author(s) and contributor(s) and not of MDPI and/or the editor(s). MDPI and/or the editor(s) disclaim responsibility for any injury to people or property resulting from any ideas, methods, instructions or products referred to in the content.