Article

Assessment of Long-Term Photovoltaic (PV) Power Potential in China Based on High-Quality Solar Radiation and Optimal Tilt Angles of PV Panels

1
State Key Laboratory of Remote Sensing Science, Faculty of Geographical Science, Beijing Normal University, Beijing 100875, China
2
Beijing Engineering Research Center for Global Land Remote Sensing Products, Faculty of Geographical Science, Beijing Normal University, Beijing 100875, China
*
Author to whom correspondence should be addressed.
Remote Sens. 2025, 17(18), 3235; https://doi.org/10.3390/rs17183235
Submission received: 10 July 2025 / Revised: 9 September 2025 / Accepted: 17 September 2025 / Published: 18 September 2025

Abstract

Highlights

What are the main findings?
  • High-quality diffuse solar radiation dataset is reconstructed to reassess 40 years of PV power potential over China.
What is the implication of the main finding?
  • The optimal PV panel tilt angle for maximizing power generation is identified using long-term weather data.
  • Optimizing the tilt angle is projected to increase China’s PV energy yield by 14.9 TWh/year based on 2023 PV installations.
  • A novel tilt angle optimization model based on diffuse fraction is proposed.

Abstract

Solar photovoltaic (PV) plays a crucial role in China’s pursuit of carbon neutrality. Assessing the PV power potential over China is essential for future energy planning and policy making. Surface solar radiation and panel tilt angle are critical factors influencing PV power generation. However, existing solar radiation datasets cannot fully meet assessment needs due to insufficient temporal coverage and limited accuracy, and the impact of panel tilt angles on PV potential is largely overlooked. This study developed a PV power estimation framework to assess the long-term (1980–2019) PV power potential at 609 stations across China, based on reconstructed high-quality solar radiation and optimized tilt angles. The validation of PV power estimates using ground measured outputs from four operational PV power stations indicated a correlation coefficient of 0.67 and a root mean square error of 0.07 for estimated daily capacity factor (CF). The assessment results revealed that the multi-year mean CF of China is 0.149 ± 0.031, with higher potentials in northern provinces and lower in southern provinces. The mean annual CF shows a declining trend of −7 × 10⁻⁴ per decade during 1980–2019, with significant decreases primarily in heavily polluted regions. In addition, we propose an optimal tilt angle estimation model based on diffuse fraction, achieving higher accuracy than previously released models. The estimated optimal tilt angle results in an increase in PV energy yield by 14.9 TWh/year for China compared with latitude-based schemes, based on China’s cumulative PV capacity by 2023 (609 GW). Our findings provide valuable insights for the effective implementation of solar PV projects in China.

1. Introduction

The extensive reliance on non-renewable energy sources has led to climate change issues, such as global warming, and raised concerns about potential energy crises over the past few decades [1]. It is imperative to explore green, clean, and efficient renewable energy sources worldwide [2]. Among renewable technologies, photovoltaic (PV) technology has emerged as a critical component of the global energy supply [3]. As the world’s largest carbon emitter, China has set ambitious targets for reducing carbon emissions, aiming to achieve carbon peak by 2030 and carbon neutrality by 2060. To achieve these goals, solar PV technology has been extensively applied under government support, leading to a thriving PV industry in China. By the end of 2023, China had the largest cumulative PV capacity globally, reaching 609 GW [4], with projections suggesting further expansion to 1000 GW by 2040 and up to 1500 GW by 2060 [5,6]. Hence, precise assessments of PV power potential are of significant importance for designing future environmental policies.
PV power potential is affected by multiple factors, including meteorological and environmental conditions (e.g., aerosols [7,8,9], clouds [10,11], and routine meteorological variables [12]), technical aspects (e.g., PV panel tilt angle [13,14], PV cell temperature [15,16], and shadowing [17,18]), and land-use constraints [19,20,21]. Among these, solar radiation is the most fundamental determinant of PV power generation [22]. Obtaining and processing precise solar radiation data are thus essential for successful solar PV projects. Surface solar radiation is typically categorized into surface total solar radiation (Rs) and surface diffuse solar radiation (Rdif), both of which are key parameters for measuring, simulating, and monitoring PV power outputs. Ground measurements are regarded as the most effective and direct way to gather solar radiation data [23]. However, there is still a serious shortage of solar radiation measurements [24], especially for Rdif, due to the complexity and high costs involved in its monitoring [25,26]. As a result, it is critical to develop estimating methods to determine Rdif. The tilt angle of PV panels is another critical factor influencing PV power generation, as it governs the amount of solar radiation received by the panels. A suboptimal tilt angle reduces system efficiency, thereby decreasing power generation [27]. Several studies have explored the optimal tilt angle of PV panels and developed some latitude-based estimation models [28,29]. However, the optimal tilt angle is also significantly influenced by local solar radiation patterns. Relying solely on latitude cannot yield an accurate estimation of the optimal tilt angle, particularly in a region with diverse climatic conditions like China. Hence, the lack of high-quality Rdif data and accurate optimal tilt angle estimates remains a major challenge for precise PV potential assessments.
PV power potential is commonly evaluated through two methods: the energy rating method and the power rating method. The energy rating method focuses on the energy output of a PV system over a specific time period, with energy generation estimated by multiplying total solar radiation by the performance ratio (PR). The simple form and flexible data requirements of the energy rating method have led to its widespread adoption, particularly in large-scale studies [30,31,32]. However, the assumption of a constant PR in this method overlooks the impact of varying ambient conditions on PV performance, thereby introducing uncertainties and limiting its applicability [33]. In contrast, the power rating method accounts for the impacts of instantaneous ambient conditions on PV module efficiency and generates time-varying PV power outputs, enabling a more realistic simulation of energy production fluctuations. The increasing availability of high spatiotemporal resolution remote sensing products [34,35] and reanalysis datasets [36,37] has further provided a solid data foundation for this approach. Surface solar radiation, air temperature, and wind speed data from these products have been widely used for PV power potential assessments worldwide [38,39,40,41,42]. However, several datasets have been reported to show regional inaccuracies in solar radiation estimates. For instance, the ECMWF ReAnalysis v5 (ERA5) product has been found to overestimate the hourly total solar radiation in China by 30.87 W/m2 while underestimating the diffuse radiation by approximately 43.08 W/m2 [43]. Such biases in solar radiation components constrain the broader use of these products in localized PV potential assessments.
In terms of PV power potential in China, several studies have conducted evaluations from different perspectives. For instance, Qiu et al. [44] assessed PV generation potential comprehensively considering theoretical PV potential and land suitability and found that there is a spatial dislocation between the PV capacity potential and the electricity demand in China. Sweerts et al. [45] evaluated China’s solar PV generation potential from 1960 to 2015 using surface radiation data from 119 radiation stations and also estimated the associated losses in PV generation potential. Song et al. [46] calculated PV power potential across China from 1961 to 2016, based on the daily solar radiation data reconstructed by an improved machine learning model. The assessment results revealed a decrease of 1.69 kWh·m−2 per decade of China’s PV potential from 1961 to 2016. Tang et al. [47] evaluated the solar PV potential over China using high-accuracy solar radiation data from dense ground stations and investigated the annual technical potential across different administrative region scales. However, current assessments still face several limitations concerning PV model inputs and system configuration. For example, although diffuse radiation is closely linked to the irradiance received by PV panels and ultimately affects power generation, most studies have paid little attention to obtaining long-term, high-quality diffuse radiation datasets. Moreover, existing studies either assume PV panels are mounted horizontally or determine the tilt angle solely based on latitude, while research assessing PV potential using optimized tilt angles remains scarce.
Motivated by these challenges, this study developed a PV power estimation framework to evaluate the long-term (1980–2019) PV power potential at 609 stations across China, based on reconstructed Rdif and optimized tilt angles. We first constructed a random forest model coupled with atmospheric parameters to generate a high-quality station-based Rdif dataset. Then, using long-term meteorological data, we determined the optimal tilt angles of PV panels that maximize the total PV energy yield over 40 years. Ultimately, PV electricity generation was simulated using a power rating model. We also proposed a novel optimal tilt angle estimation model based on the diffuse fraction (DF) and compared it with four typical latitude-dependent models. The insights derived from this study provide targeted policy implications for improving solar energy utilized efficiency and promoting sustainable development in China.

2. Data and Methodology

2.1. Data and Preprocessing

2.1.1. Ground-Based Datasets

Three station datasets were collected in this study to provide the necessary solar radiation data for calculating PV power outputs. The first dataset consists of daily meteorological measurements, including air temperature, atmospheric pressure, relative humidity, temperature range, precipitation, wind speed, and sunshine duration, at 839 stations from 1980 to 2019. These data were obtained from the Chinese Meteorological Administration. Among these 839 stations, only 70 have solar radiation measurements since 1980. The second dataset contained daily Rdiff measurements for these 70 stations from 1980 to 2016. These two datasets were utilized to reconstruct the Rdif time series at 839 stations. Examination of the reconstructed Rdiff showed that only 609 of the 839 stations had relatively complete records (with at least 20 days of data each month throughout the year). Therefore, these 609 stations were used for the subsequent optimal tilt angle estimation and PV potential assessment. The third dataset included daily Rs data covering the same 609 stations from 1980 to 2019, which was reconstructed by Hou et al. [48] based on ground measurements. The reconstructed Rs were validated, showing an overall correlation coefficient (R) of 0.97, a root mean square error (RMSE) of 23.12 W/m2, and a mean bias error (MBE) of 0.04 W/m2, indicating outstanding accuracy. The spatial distribution of the selected 609 stations, the 70 solar radiation stations, and the six geographic regions of China is illustrated in Figure 1. Additional details regarding the provinces and elevation in China are provided in Figure S1.

2.1.2. Reanalysis Datasets

Two reanalysis products were used to assist in estimating Rdif and provide necessary ambient parameters for PV power outputs. The first reanalysis product, MERRA-2 [36], is an enhanced version of MERRA and represents NASA’s latest achievement from its Global Modeling and Assimilation Office. MERRA2 provides data on multiple variables at hourly intervals on a 0.5° × 0.625° grid from 1980 to the present. This study collected aerosol data (aerosol optical thickness, AOT), cloud data (cloud fraction, CLF; cloud optical thickness, COT) and air temperature data from MERRA2. The hourly AOT, CLF, and COT data were averaged to a daily scale and then used to estimate the daily Rdif. The air temperature was assumed to be equal to the ambient temperature and used in calculating PV power outputs. The second reanalysis product used is ERA5 [37]. As the fifth generation of atmospheric reanalysis datasets, ERA5 represents one of the most advanced reanalysis products currently available. It utilizes an advanced four-dimensional variational assimilation system to provide a comprehensive range of global reanalysis datasets, including surface and atmospheric variables with various spatial and temporal resolutions. The hourly 10 m u-component (zonal, east–west) and 10 m v-component (meridional, north–south) of wind were collected from ERA5 and utilized to calculate surface wind speed.

2.2. Methodology

2.2.1. Estimation of Rdif

Daily Rdif values for 839 stations across China from 1980 to 2019 were reconstructed using a RF model. The RF model [49] is well-known for its robustness in analyzing complex interactions and handling high-dimensional data. It has been extensively applied to geoscience and remote sensing challenges, particularly for estimating Rdif [50,51,52]. The construction of the RF model involved three key steps: feature selection, training dataset division, and hyperparameter optimization. Routine meteorological variables that have been demonstrated to strongly correlate with Rdif—such as average temperature, sunshine duration, and daily temperature range [53,54]—were selected as predictors, while measured Rdif values served as the dependent variable. Eighty percent (56 stations) of the 70 stations were randomly assigned to the training set for developing the Rdif estimation model, while the remaining 20% (14 stations) constituted the test set for evaluating model performance. The hyperparameters of the RF model were optimized through a grid search method, with the corresponding thresholds and variation ranges detailed in Table S1. Additionally, five-fold cross-validation was applied to reduce the risk of model overfitting. To validate the stability of the RF model, two advanced machine learning models—Extremely Randomized Trees and Gradient Boosting Regression Trees—were also applied for comparison. The results demonstrated that the RF model achieved best performance in general (Figure S2), affirming its effectiveness in estimating Rdif. The reconstructed Rdif values were further validated against the corresponding ground measured Rdif values in both training and test sets. Metrics used to evaluate model performance include R, RMSE, and MBE, which are widely recognized as some of the most commonly used statistical indicators, defined as:
R = i = 1 n X o , i X o , i ¯ X e , i X e , i ¯ i = 1 n X o , i X o , i ¯ 2 i = 1 n X o , i X o , i ¯ 2
R M S E = 1 n i = 1 n X o , i X e , i 2
M B E = 1 n i = 1 n X e , i X o , i
where n represents the number of data records, Xo,i denotes the actual measured values, and Xe,i represents the estimates.

2.2.2. Optimization of PV Panel Tilt Angle

This study employed a straightforward data-driven approach to determine the optimal tilt angles of PV panels. The method iteratively adjusts the tilt angle in predefined step size to identify the angle that maximizes total PV energy yield over a specified time period. This approach ensures that the optimal tilt angle for the location of interest is determined while accounting for local geography and long-term climatic conditions. A target function was formulated to implement this method, as described below:
θ opt = arg max θ Y n = 1 N P θ , I n , T n , W n
where θ opt represents the optimized tilt angle. Y denotes the range over which the tilt angle is iteratively adjusted, with a step size of 1°. Since the optimal tilt angle is generally close to the local latitude, Y can be defined as φ 15 ° , φ + 15 ° . I n , T n and W n correspond to the solar radiation, ambient temperature, and wind speed at time step n , respectively. The method described in Section 2.2.3 was applied to calculate hourly PV output, which was subsequently integrated to determine the total PV generation for each tilt angle increment. We employed this function to estimate the optimal tilt angles for PV panels at 609 locations across China, using the reconstructed solar radiation data and auxiliary ambient parameters (ambient temperature and wind speed) from 1980 to 2019. Although finer tilt angle step size could theoretically improve the precision of the estimates, our findings indicate that a step size of 1° is sufficient to yield reliable optimal tilt angle estimates. Furthermore, incorporating longer time series of weather data can improve the robustness of optimal tilt angle estimations, thereby maximizing PV energy yield over the long term [55].

2.2.3. Estimation of PV CF

In this study, a framework was developed to estimate hourly PV power outputs. This framework consisted of two components: pretreatment of the reconstructed Rs and Rdif data and estimation of PV power outputs. The solar radiation received by a PV panel is strongly influenced by the angle of incidence, which varies throughout the day. PV power output, determined by the amount of solar irradiance received by the panel, also fluctuates throughout the day. Estimating PV power outputs using average data can introduce uncertainties due to the non-linear response of energy conversion efficiency of PV module to irradiance and temperature [22]. In contrast, synthetic hourly solar radiation derived from daily data enables more accurate assessments [56]. Therefore, it is necessary to resample the reconstructed daily Rs and Rdif data to an hourly scale using a sinusoidal diurnal cycle model, as shown in Equation (5) [56]:
r h = max { 0 , sin π h s e t h r i s e h h r i s e π r 2 h s e t h r i s e }
where h represents the h -th hour of the day, r h represents the hourly solar radiation at hour h , h s e t represents the sunset hour, h r i s e represents the sunrise hour, and r is the total solar radiation of the day.
The PV power outputs in this study were calculated using the PVLIB-Python model. PVLIB-Python, an open-source toolbox developed by Sandia National Laboratories, provides comprehensive simulations for PV system electricity generation and flexible performance modeling under various configurations [57]. Based on the selected PV module and inverter models, the toolbox can calculate PV power outputs for any user-defined times and locations. This model requires at least two solar radiation components as input—Rs and Rdif in this framework—and provides alternating current (A.C.) output power as the final result. Converting surface solar radiation to the solar radiation incident on the PV panel is a critical step for calculating PV power generation. The detailed conversion process, using reconstructed solar radiation, is provided in Equations (6)–(9) [58]:
P O A g l o b a l = P O A d i r e c t + P O A d i f f u s e
P O A d i r e c t = R s R d i f sin z × cos ε
P O A d i f f u s e = R d i f × 1 + cos ( θ ) 2 + A × R s × 1 cos ( θ ) 2
ε = arccos cos ( z ) × cos ( θ ) + sin ( z ) × sin ( θ ) + cos ( a p a s )
In these equations, total in-plane irradiance ( P O A g l o b a l ), in-plane beam irradiance ( P O A d i r e c t ) and in-plane diffuse irradiance ( P O A d i f f u s e ) represent the total, direct and diffuse solar radiation incident on the PV panel, respectively. z represents the solar zenith angle. ε is the angle of incidence. θ is the PV panel tilt angle. a p and a s represent the azimuth angles of the PV panel and the sun, respectively. a p is set to 180° as China is located in the northern hemisphere. A is the ground albedo, which typically ranges from 0.1 to 0.4 for land surfaces. A default value of 0.25 was used in this study.
Configuring the PVLIB-Python model involves defining PV panel installation parameters and selecting the PV module, inverter, and temperature models. This study adopted a fixed-tilt installation as the tracking mode for PV panels. A Canadian Solar CS5P 220 M module, with a maximum output power of 220 W and an efficiency of 12.94%, was selected for the PV module. An ABB MICRO-0.25-I-OUTD-US 208Vac inverter, with a designed efficiency of 96%, was chosen to simulate the inverter model. Consequently, the overall peak efficiency of the PV system, accounting for both the module and inverter efficiencies, was calculated as 12.94% × 0.96 ≈ 12.42%. The Sandia Array Performance Model was employed to estimate PV cell temperatures based on ambient temperature. These selected models have been widely adopted in previous research and are considered reliable [47,59].
To facilitate the comparison of PV power potential across different regions, we adopted CF as a quantifying metric. CF is defined as the ratio of actual power output to the design rated power output. This definition largely eliminates the influence of the intrinsic characteristics of PV modules, making the CF value primarily dependent on local meteorological conditions (such as surface solar radiation and temperature) rather than the choice of a particular PV panel [47]. In this study, the raw hourly PV power outputs at individual stations were normalized by dividing by 220 to obtain CF values. These hourly CF values were then aggregated to represent monthly, seasonal, and annual CF by calculating the respective means. This approach ensures consistency in quantifying PV power potential across all stations, allowing for meaningful comparisons and robust assessments of regional and temporal variations.

3. Results and Analysis

3.1. Validation of the Estimated Rdi

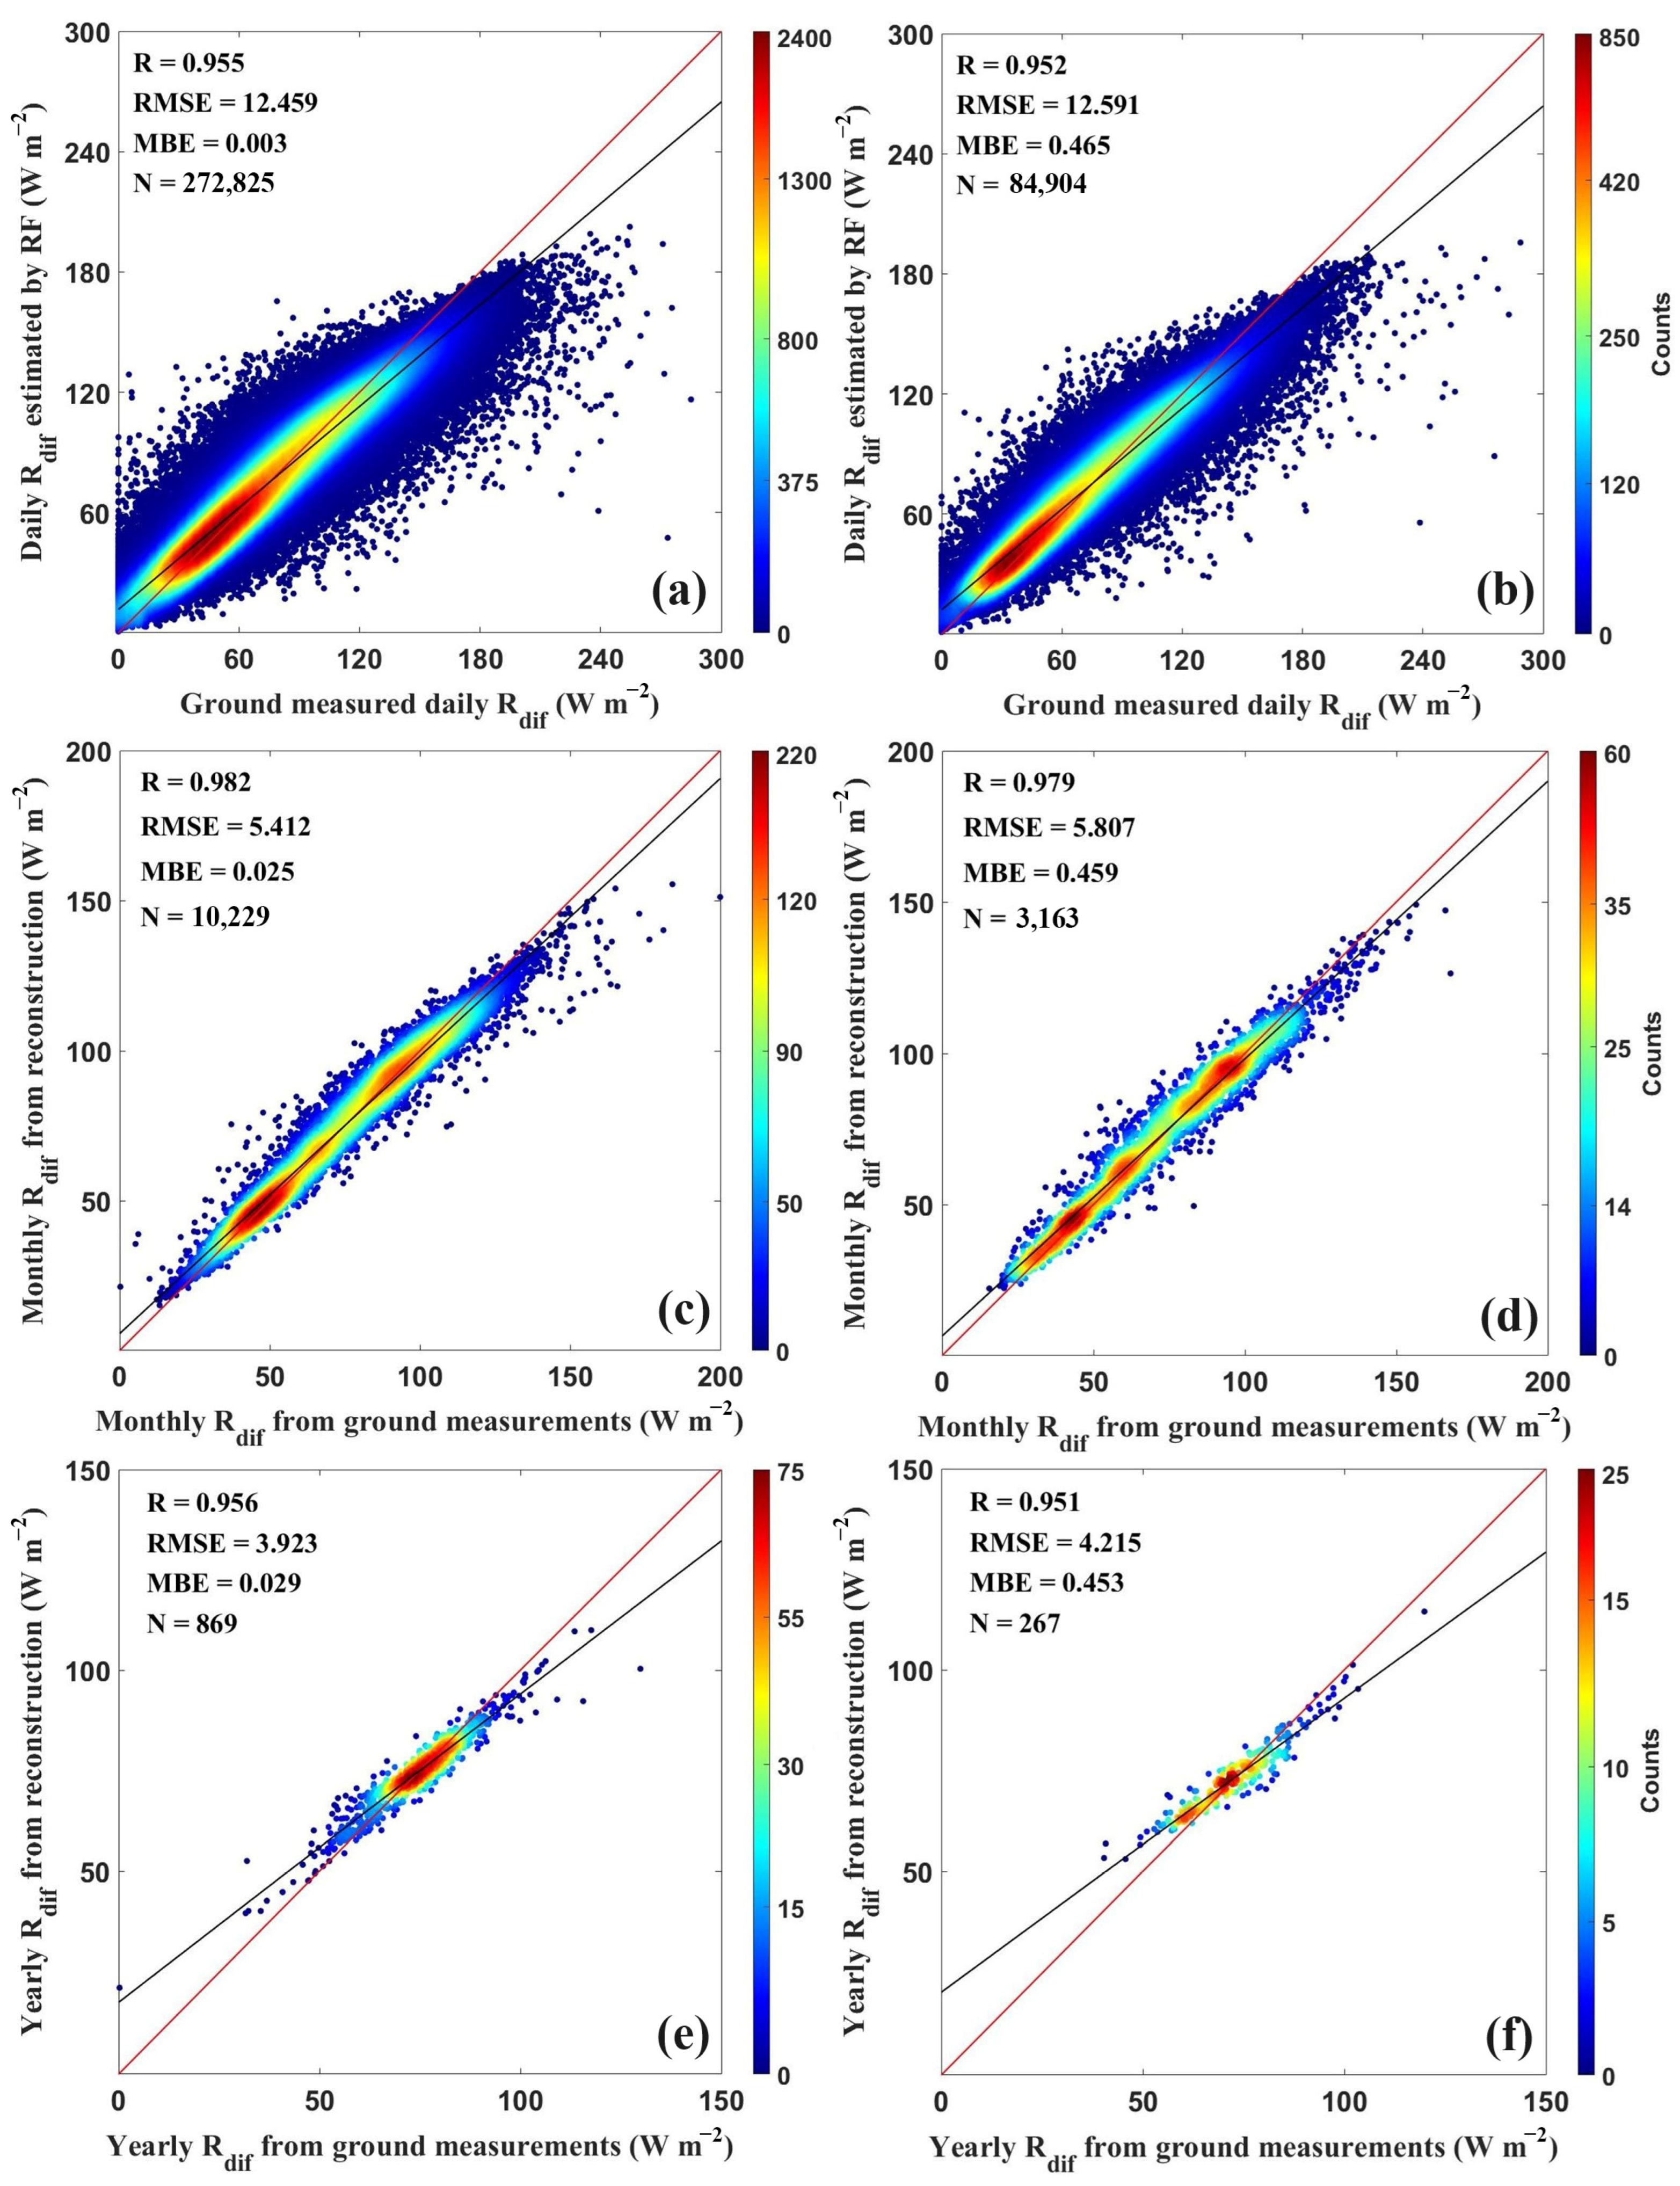
This study estimated daily Rdif values at 839 ground stations from 1980 to 2019 using the proposed RF model. To demonstrate the model’s applicability across multiple temporal scales, the estimated Rdif values were validated against ground measurements from the training and test sets at daily, monthly, and annual scales, as shown in Figure 2. The model demonstrates higher accuracy on the training set across all temporal scales, with R, RMSE, and MBE values ranging from 0.955 to 0.982, 3.923 to 12.459 W/m2, and 0.003 to 0.029 W/m2, respectively. The accuracy of the test set is slightly lower than that of the training set but is still satisfactory, with R, RMSE, and MBE values ranging from 0.951 to 0.979, 4.215 to 12.591 W/m2, and 0.453 to 0.465 W/m2, respectively. The validation results demonstrate the strong spatiotemporal extensibility of the Rdif estimation model. The accuracy of estimates is comparable to related studies [60,61,62,63,64]. Notably, the estimations at monthly and annual scales outperform those at the daily scale. For instance, daily Rdif estimates exhibit overestimation at low values and underestimation at high values (Figure 2a,b), while such discrepancies are much smaller at the monthly and annual scales (Figure 2c–f). This phenomenon is likely due to the offsetting effects of daily Rdif overestimations and underestimations when averaged to derive monthly and annual values.
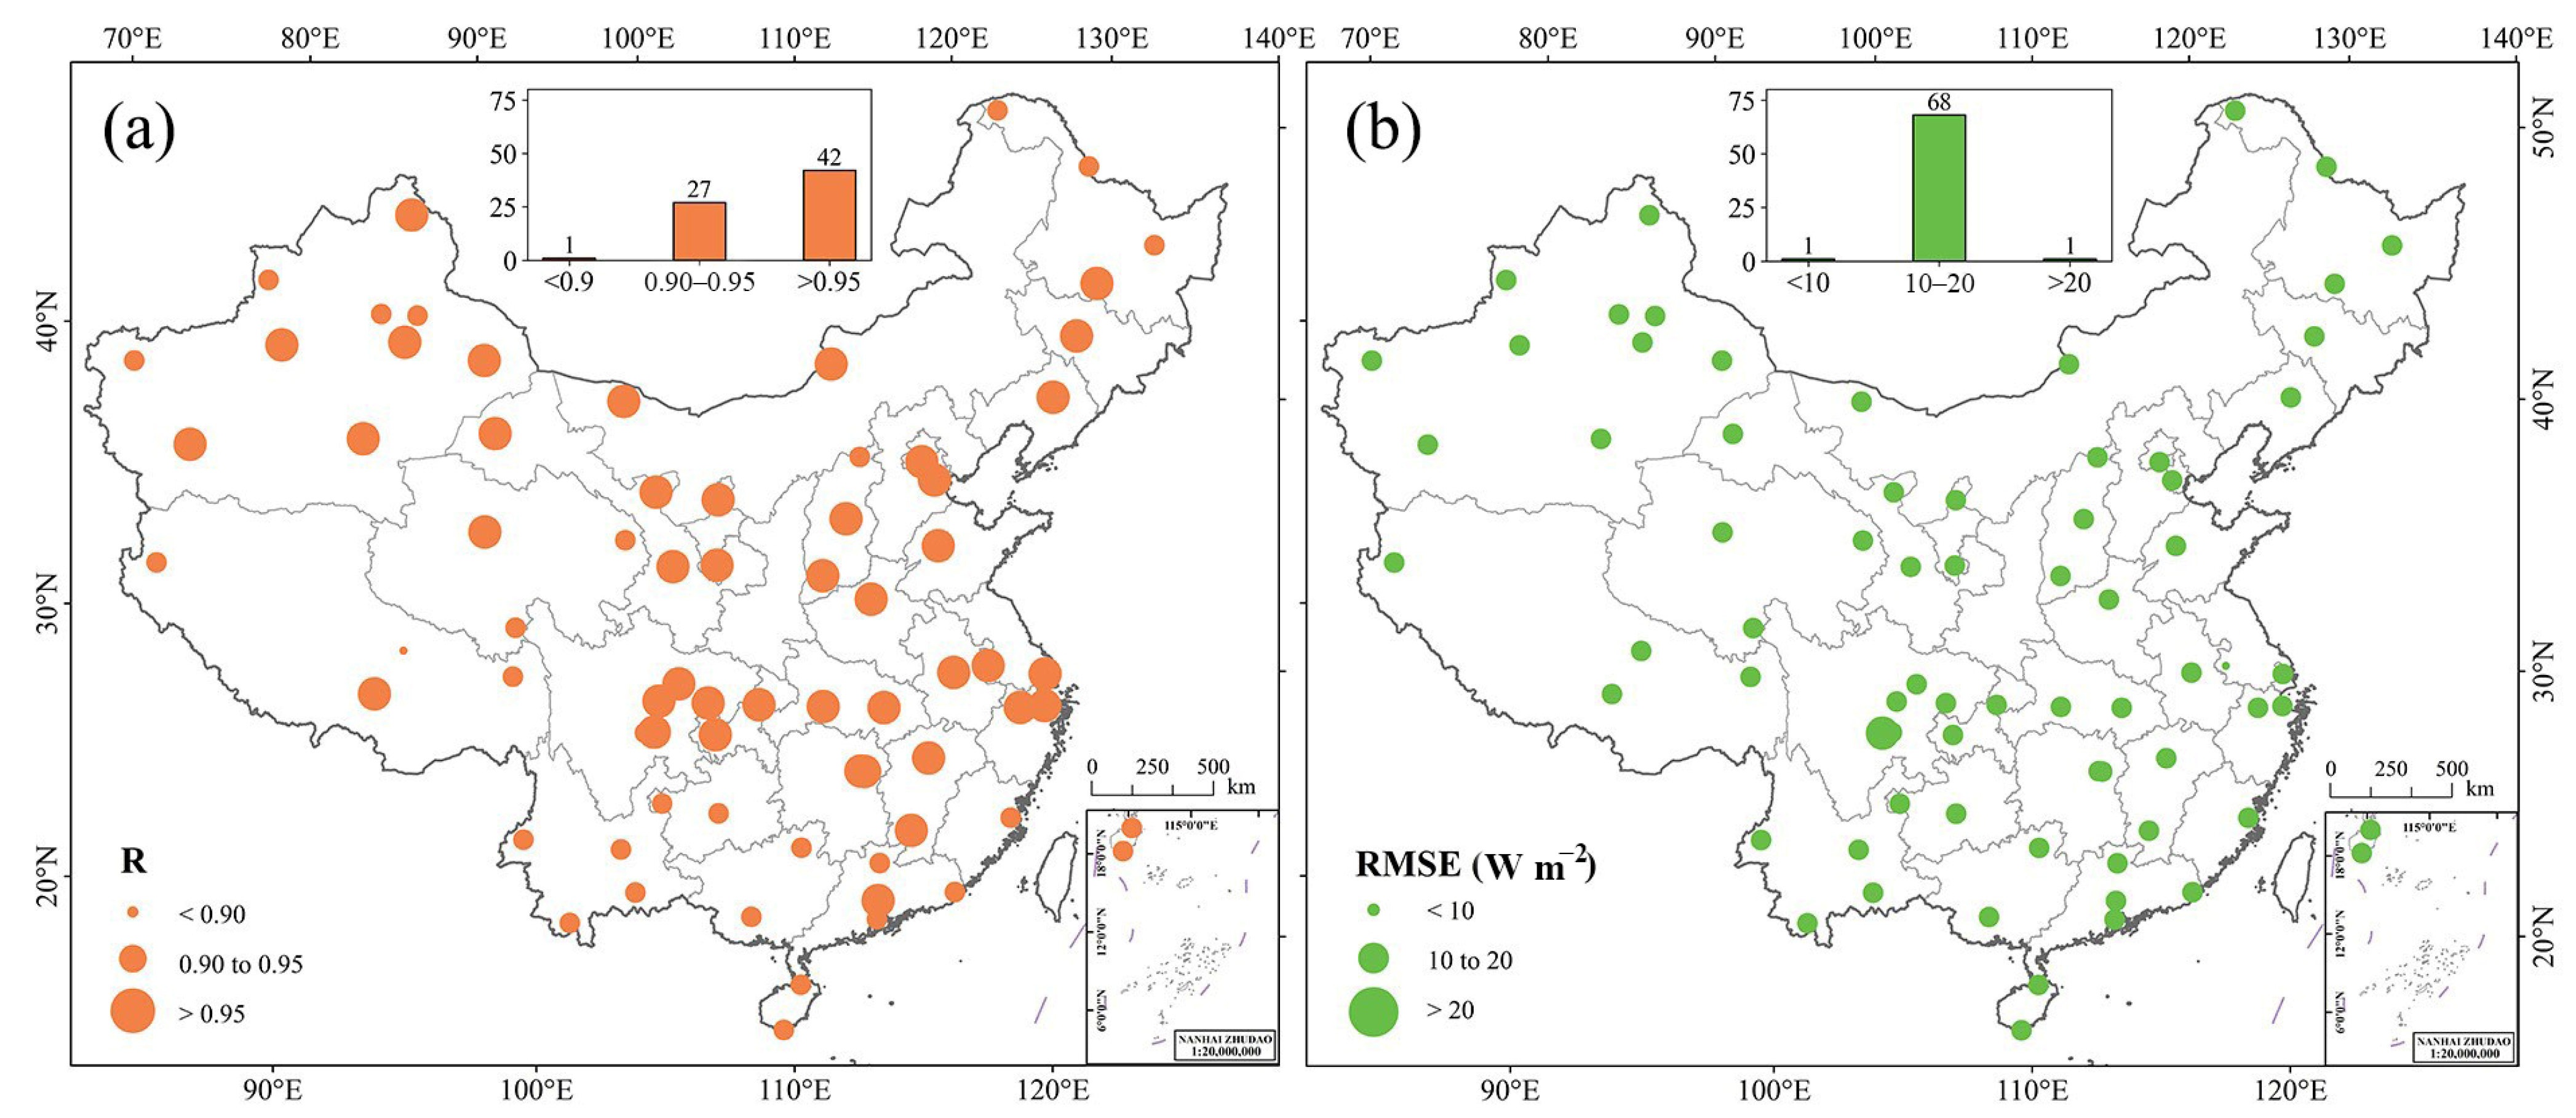
Validation was also performed separately at 70 ground stations to evaluate the spatial performance of the model. The R and RMSE values for individual stations are presented in Figure 3. Overall, our estimates correlate well with ground measurements at most stations, with R values ranging from 0.89 to 0.97. R values higher than 0.90 were found at 69 stations, out of which 42 exhibited R values over 0.95. The RMSE among stations vary from 9.70 to 22.20 W/m2, with 69 stations having values lower than 20 W/m2. The results demonstrate that the developed RF model, which incorporates atmospheric parameters, is capable of accurately estimating Rdif across regions with varying climatic characteristics.

3.2. Validation of the Estimated PV CF

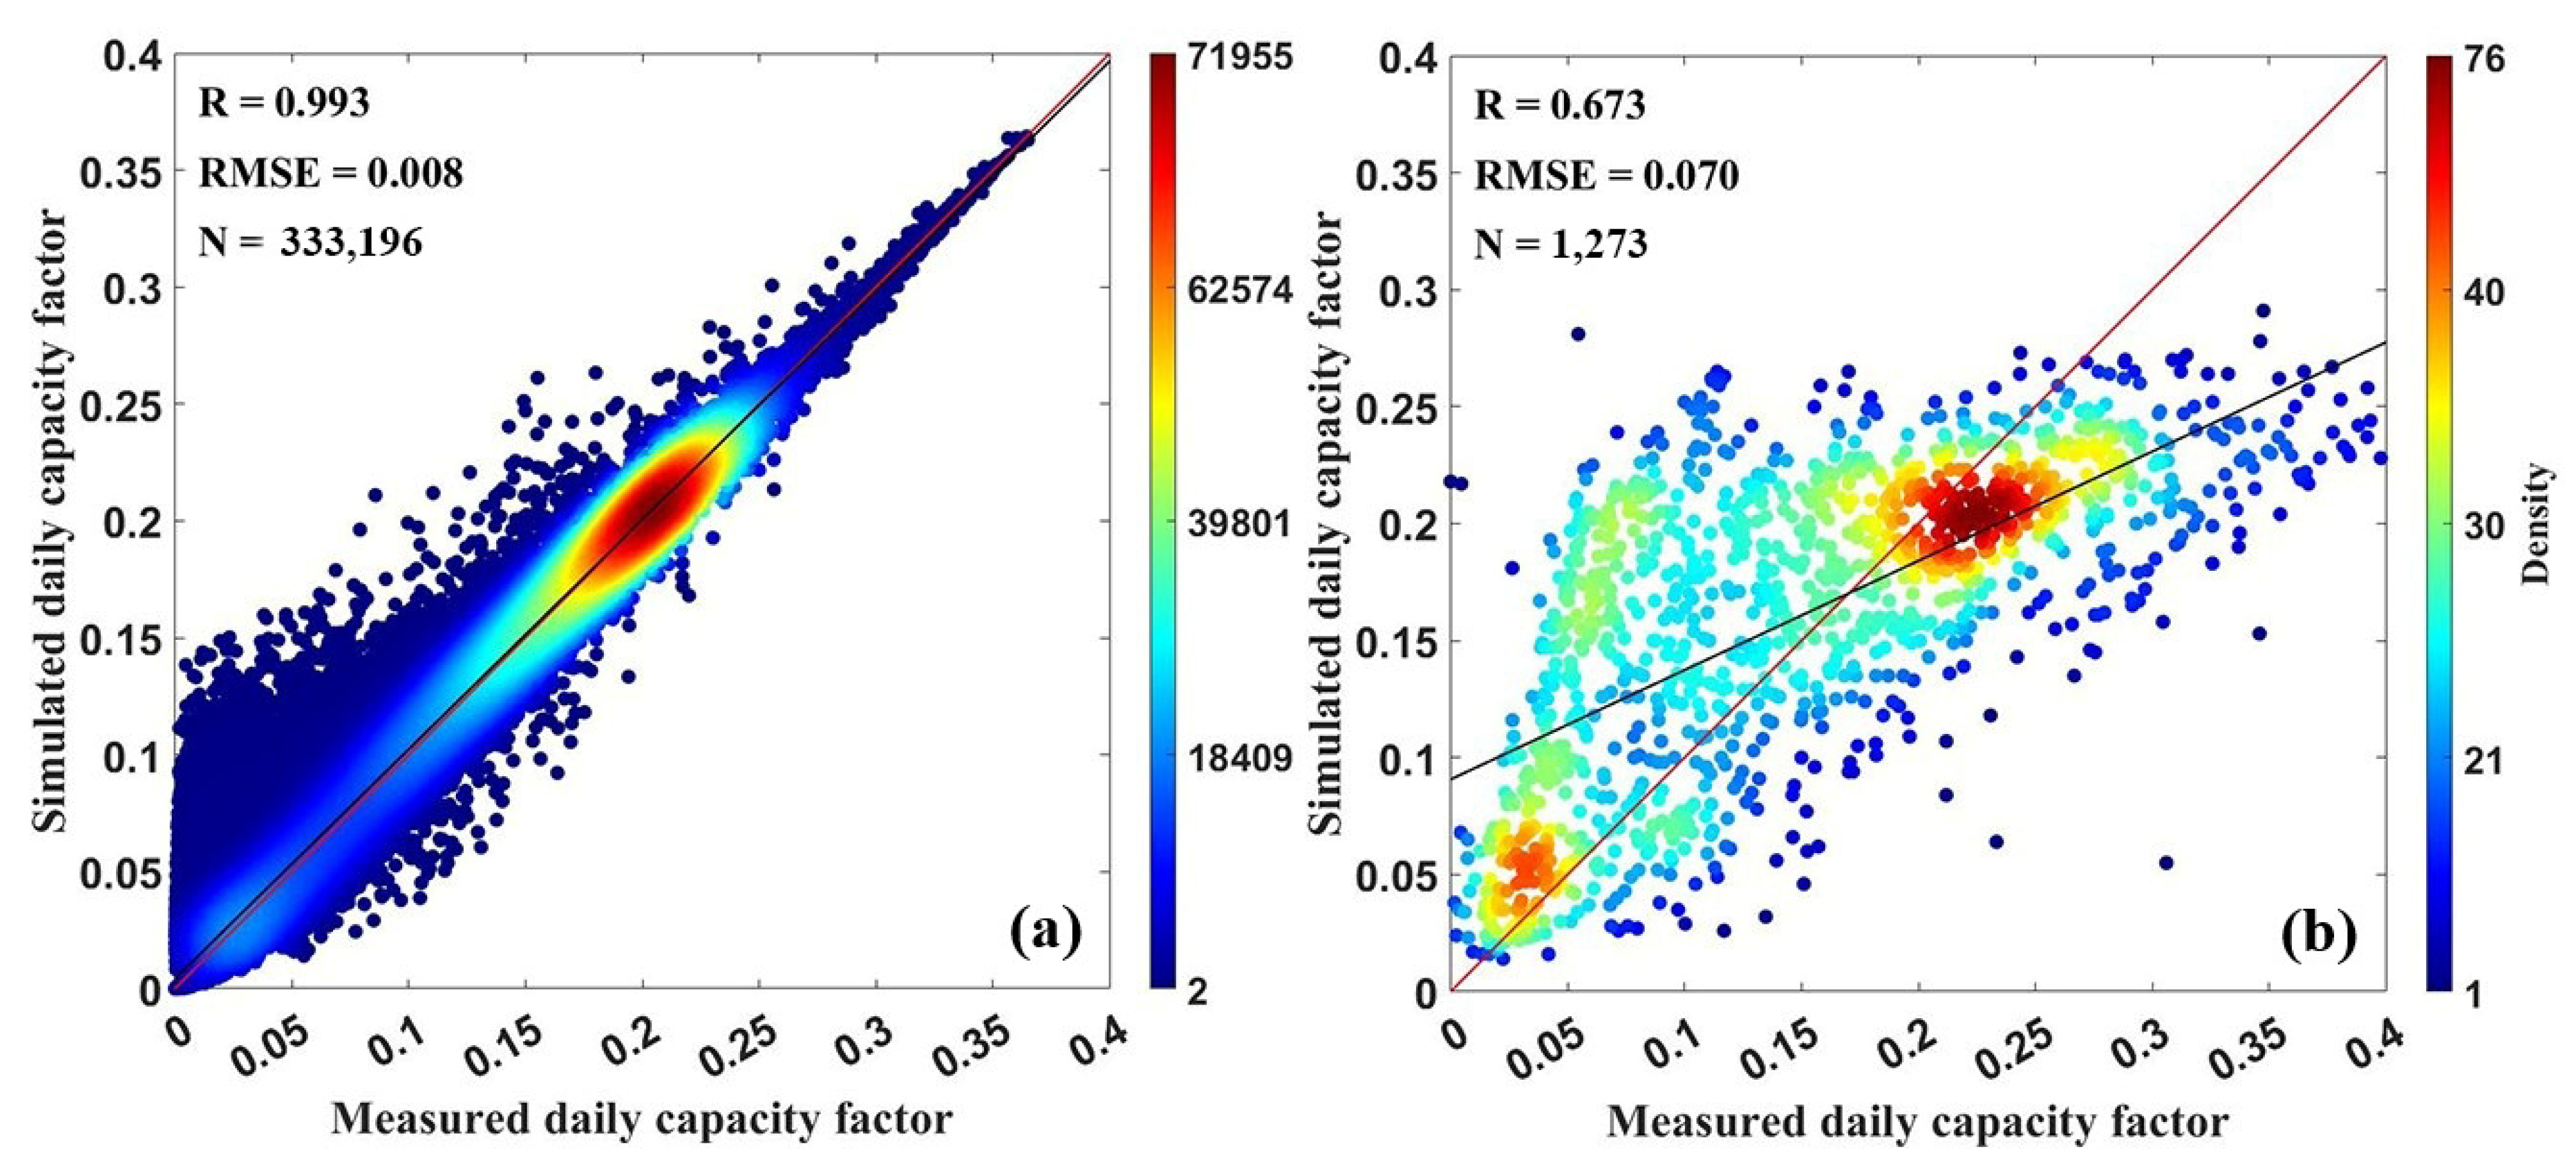
The estimated daily CF were validated using two independent datasets to assess both the accuracy and generalizability of the model. The first dataset, referred to as the model-exposed dataset, is based on the ground measured diffuse solar radiation data used in the training phase. The second, termed model-unexposed, is an independent observational dataset collected from actual PV power stations. The validation results are presented in Figure 4a and Figure 4b, respectively.
Model-exposed validation was performed using observed diffuse radiation data from 70 CMA radiation stations. To isolate the influence of diffuse solar radiation estimation on CF calculations, we replaced the reconstructed diffuse solar radiation values with corresponding ground measurements, while keeping all other input parameters unchanged. As shown in Figure 4a, the estimated CFs exhibit excellent agreement with reference values derived from measured diffuse solar radiation, achieving a R of 0.993 and a RMSE of 0.008 across 333,196 daily records. There is a strong 1:1 correspondence between model outputs and observed CFs, with most points tightly clustered along the diagonal line, indicating minimal bias and high internal consistency. To evaluate the model’s generalization capability beyond the training dataset, a second validation was conducted using model-unexposed data from the PV power output dataset (PVOD) [65]. The PVOD contains every 15 min PV power records from 10 PV stations in Hebei Province for the period 2018–2019. Four PV stations were selected based on their proximity to nearby CMA meteorological stations (with the matched station pairs detailed in Table S2), in order to minimize spatial discrepancies while retaining realistic variability in both meteorological and operational conditions. Figure 4b indicated that despite the relatively smaller sample size (N = 1273), our model maintains a reasonable level of accuracy, with an R of 0.673 and RMSE of 0.070. While greater scatter is observed compared to the model-exposed validation, a clear positive correlation remains, supporting the model’s transferability.
All validations were conducted at the daily scale to align with the temporal resolution of the diffuse radiation estimation. Despite the inherent challenges of comparing reconstructed gridded inputs with point-based observations, the model demonstrates strong and consistent performance across both validation scenarios. These results confirm the reliability of the CF estimates and support the dataset’s utility for large-scale PV potential assessment and system planning.

3.3. Optimal Tilt Angles of PV Panels over China

3.3.1. The Spatial Distribution of Optimized Tilt Angles

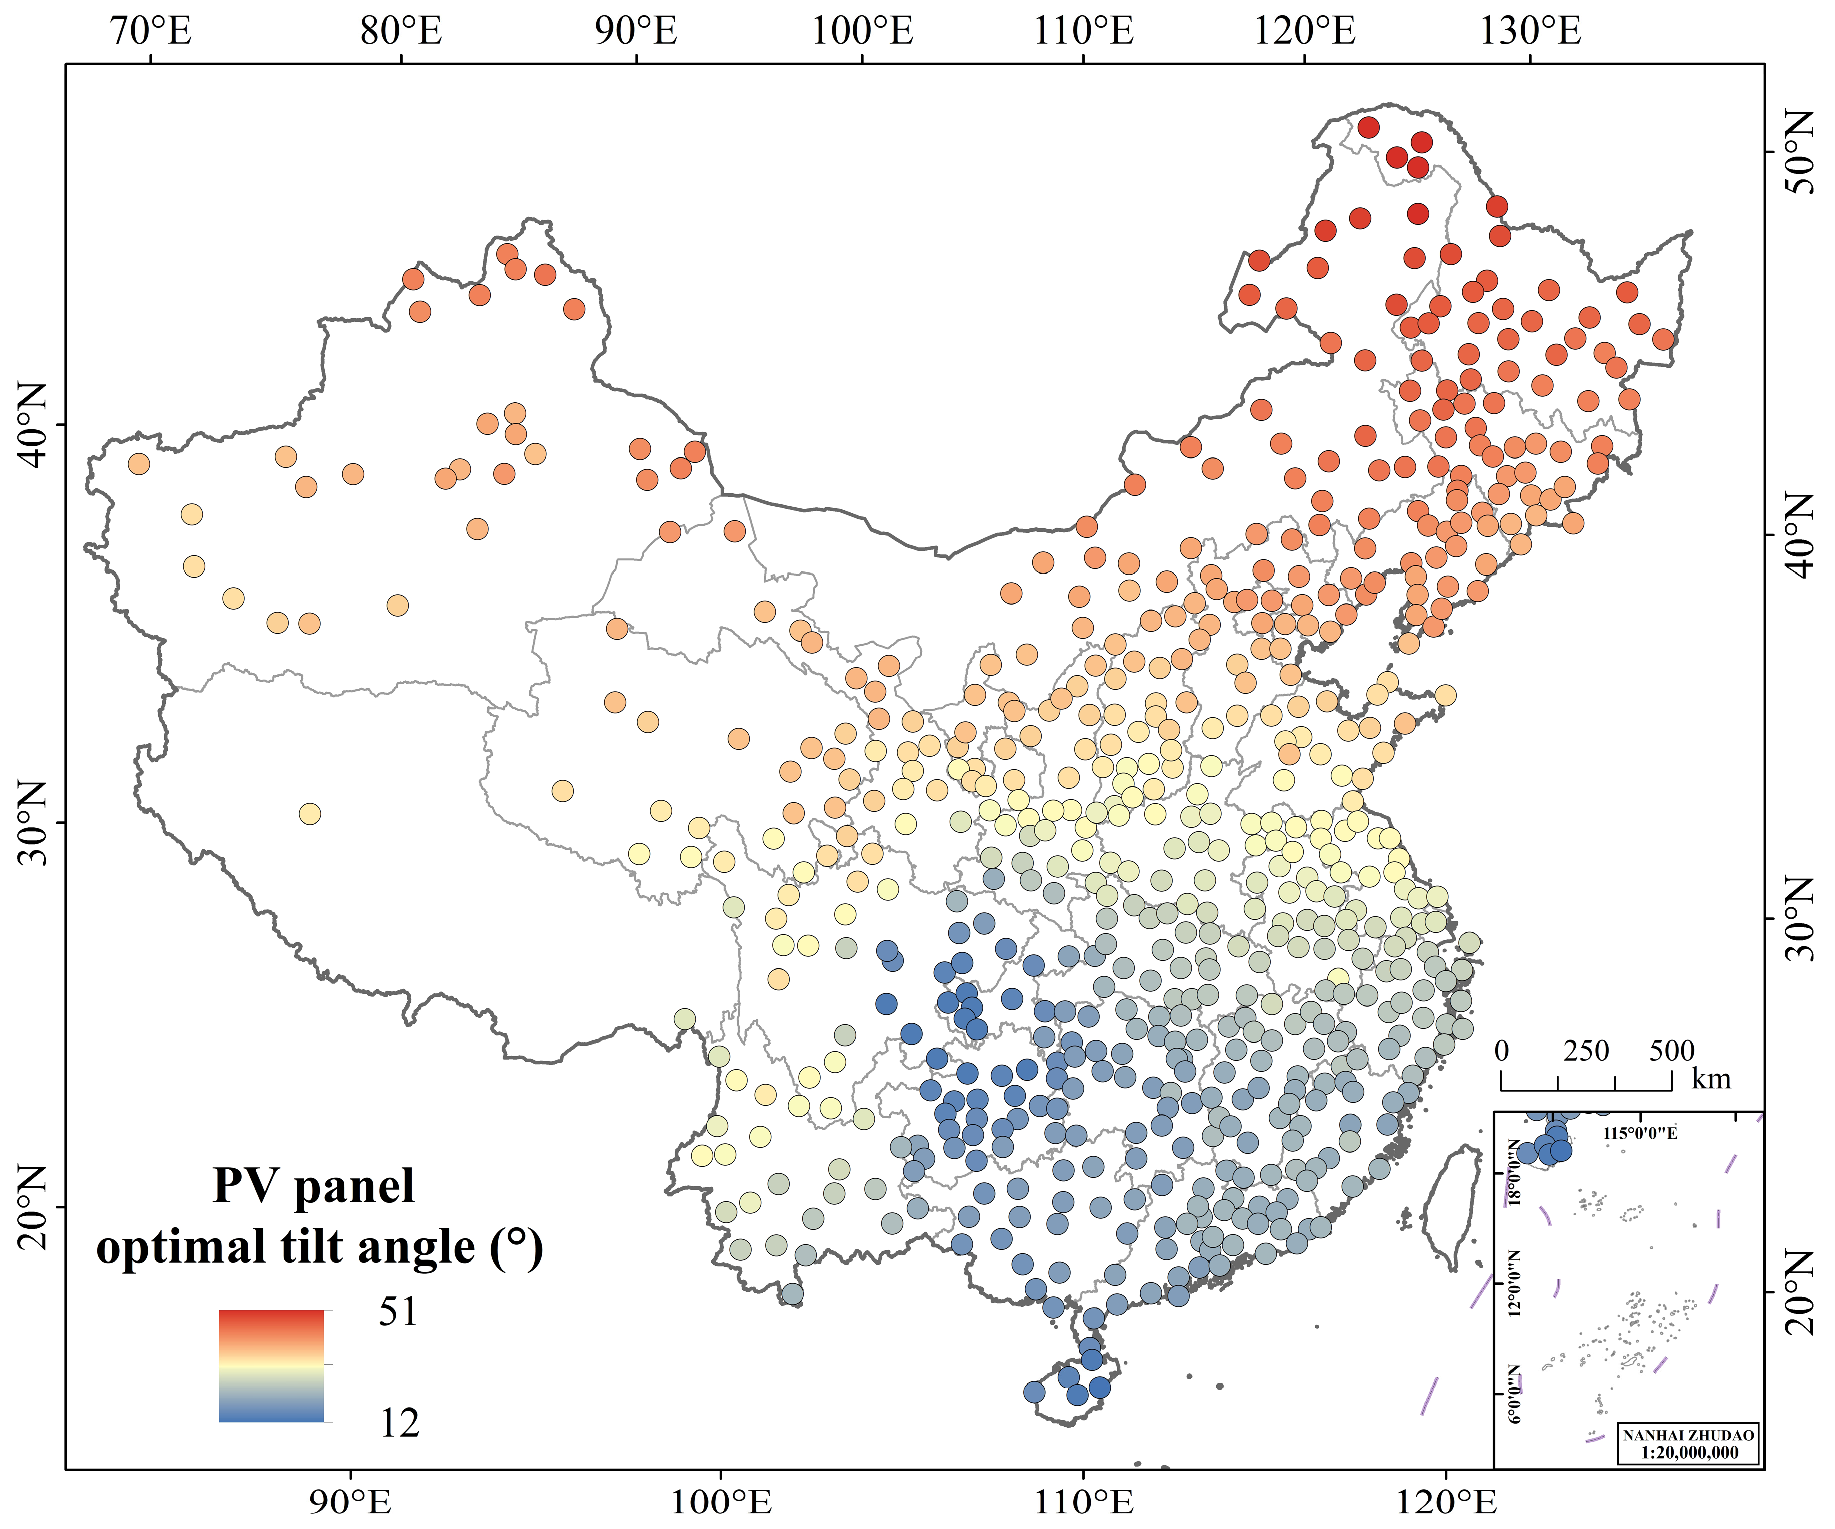
Based on the reconstructed Rdif data, the optimized tilt angles for PV panels at 609 stations across China ( θ c n ) were determined using the method outlined in Section 2.2.2. As illustrated in Figure 5, θ c n decreases progressively from northern to southern China. Notably, the lowest optimal tilt angles are observed in the Sichuan Basin and Guizhou Province, whereas the Qinghai–Tibet Plateau and Yunnan Province—despite being at similar latitudes—exhibit significantly higher optimal tilt angles. This discrepancy suggests that, beyond latitude, factors like topography and solar radiation patterns play a crucial role in determining optimized tilt angles. The Sichuan Basin and Guizhou Province frequently experience cloudy weather, leading to a higher proportion of diffuse radiation. In contrast, the Qinghai–Tibet Plateau and Yunnan Province, characterized by higher altitudes and more frequent clear skies, receive a larger share of direct radiation. This variation reveals a key strategy for PV panels to enhance annual PV energy yield: adjusting the tilt angle according to the local solar radiation pattern to capture more radiation. In regions dominated by diffuse radiation, appropriately reducing the tilt angle enables PV panels to capture more solar radiation, thereby enhancing PV power output. Conversely, in areas with higher levels of direct radiation, maintaining a higher tilt angle is more effective for maximizing energy production. These findings emphasize the critical need to utilize long-term weather data for optimizing PV panel tilt angles.

3.3.2. An Optimal Tilt Angle Model Based on Diffuse Fraction

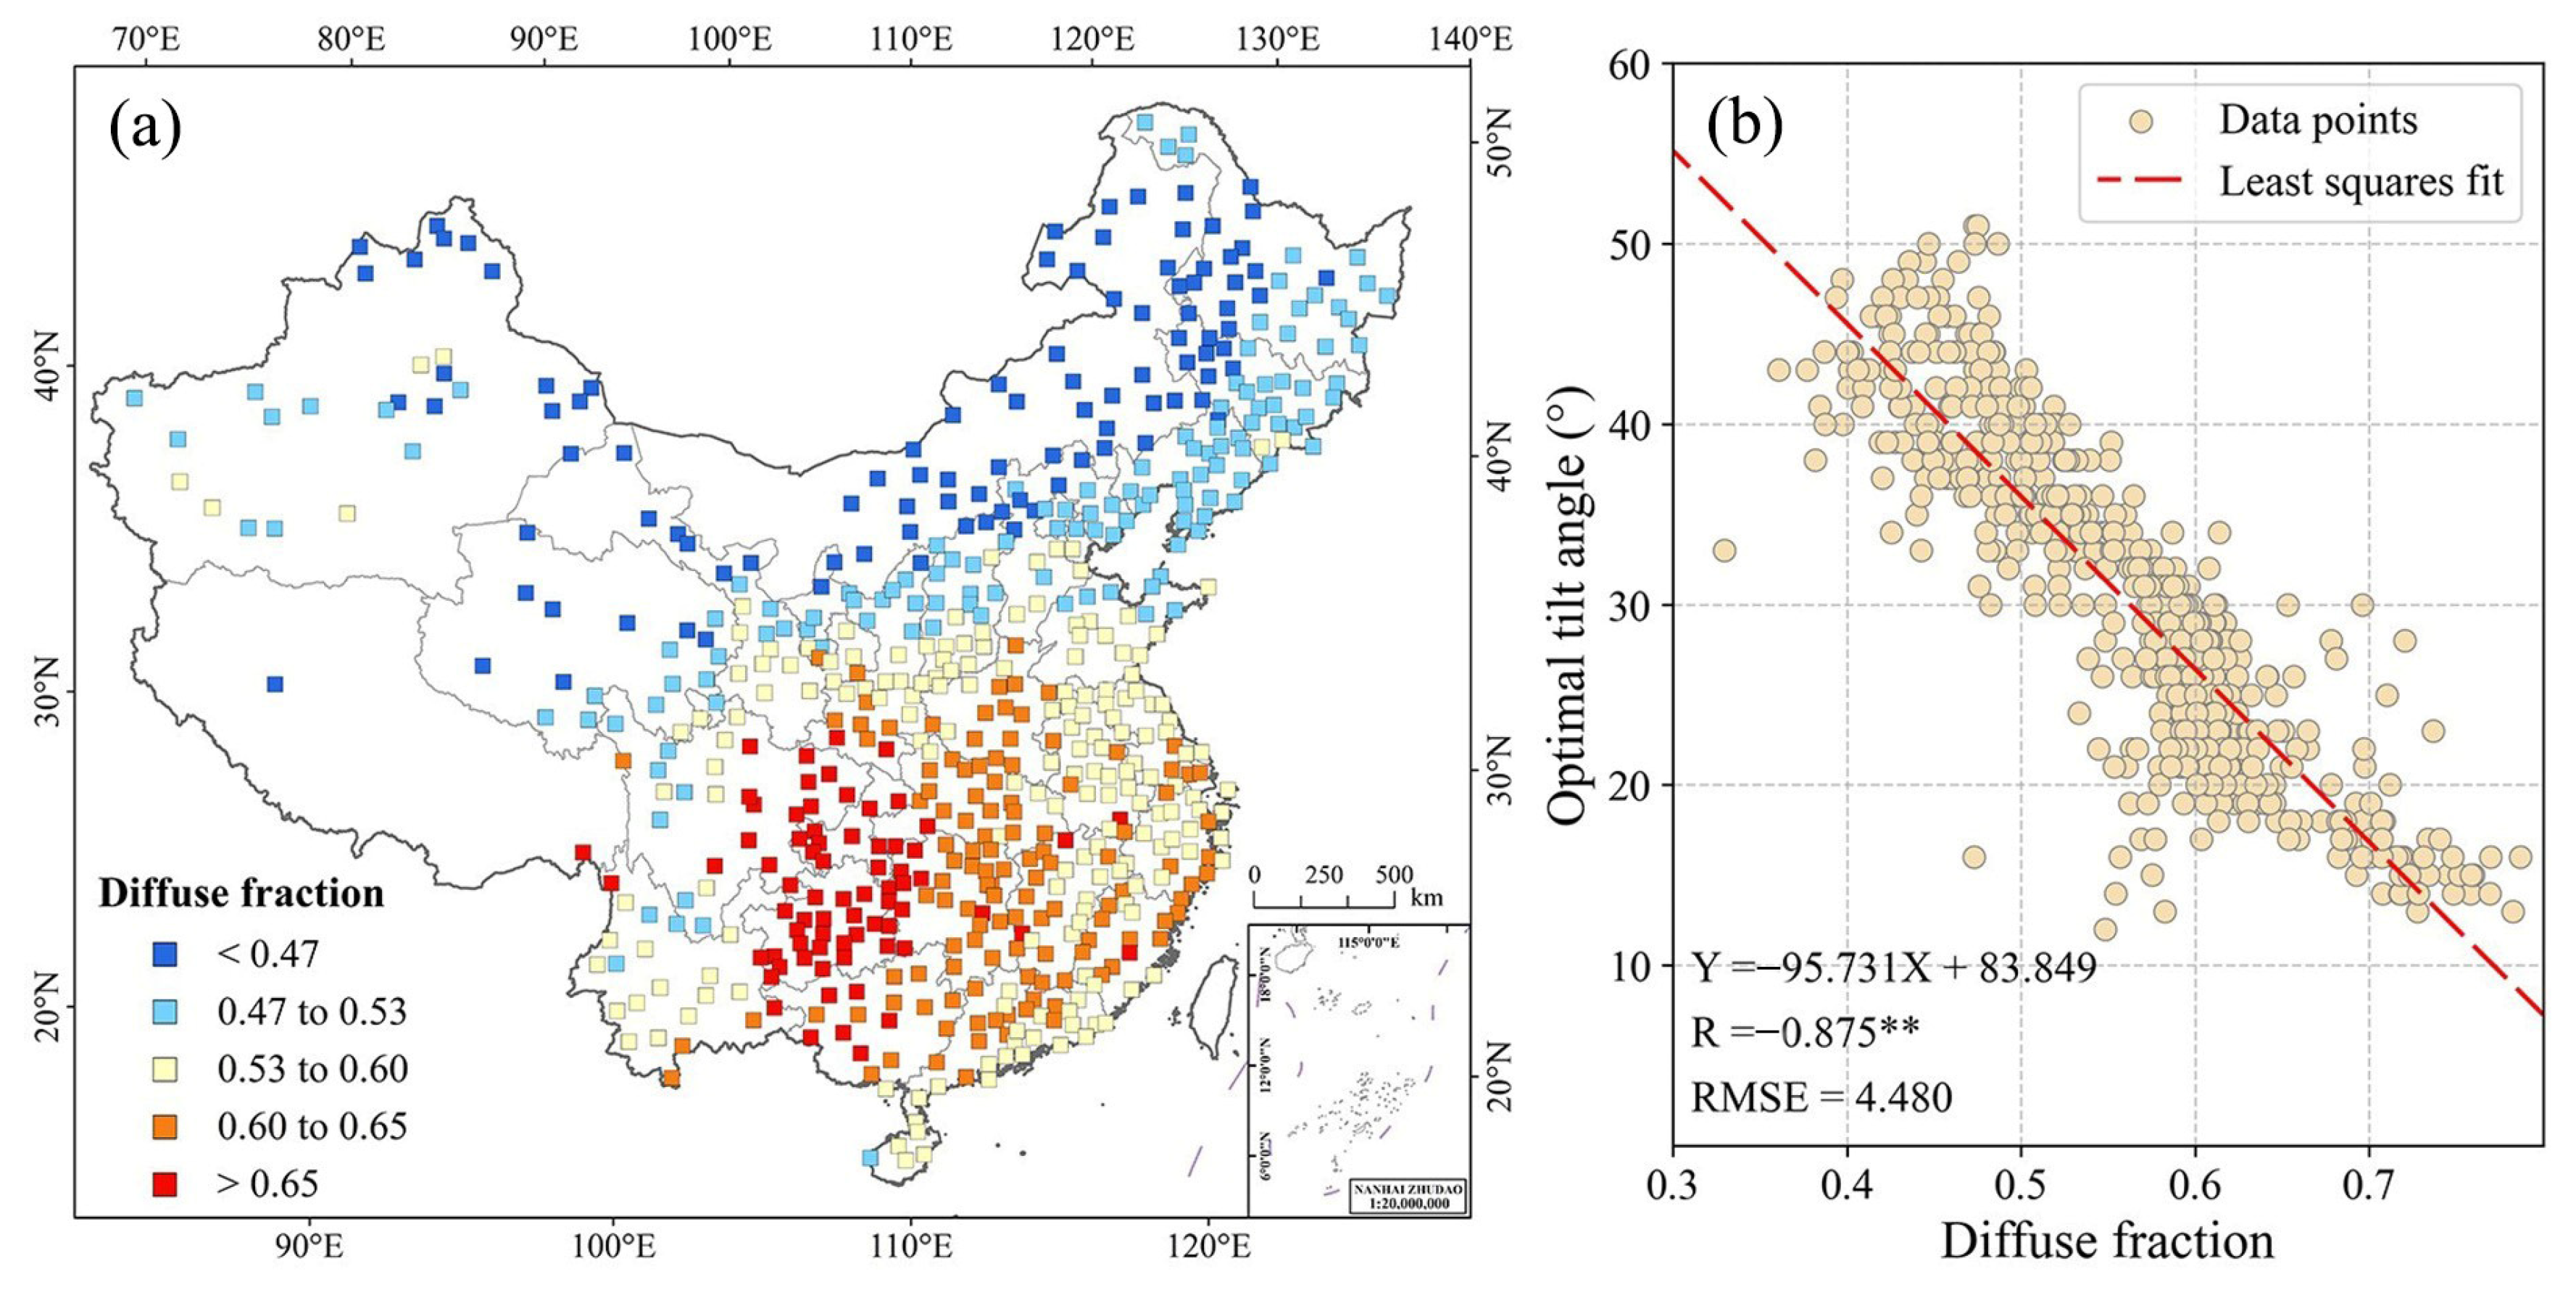
DF, defined as the ratio of Rdif to Rs, serves as a useful indicator of local weather conditions and solar radiation patterns. To explore the potential connection between DF and the optimal tilt angle, we calculated the mean annual DF at 609 stations, as shown in Figure 6a. The results reveal that DF exhibits a spatial distribution similar to that of θ c n (Figure 5). Northern provinces tend to have lower DF values and correspondingly higher optimal tilt angles, while southern provinces, which experience higher DF values, show a more pronounced reduction in optimal tilt angles. For example, in the Sichuan Basin, the highest DF values align closely with the lowest optimal tilt angles. This observation suggests a potential correlation between DF and optimal tilt angle. To validate this hypothesis, we plotted the relationship between DF and θ c n (Figure 6b). The analysis demonstrates a significant negative correlation (p < 0.01) with an R-value of −0.875. The fitted linear regression equation indicates that a 0.1 increase in DF results in a 9.57% decrease in the optimal tilt angle, with an RMSE of 4.48. This strong correlation suggests that local DF may have a significant impact on tilt angle optimization.
Based on the above relationship, we developed an estimation model for the optimal tilt angle using DF and latitude as independent variables in a multiple linear regression. The model parameters were fitted using the least squares method, and the model is expressed as Equation (10):
θ = a + b φ + c D F
where a, b, and c are 29.0551, 0.7792, and −45.0991, respectively. φ represents the local latitude, and DF is the typical value of the local diffuse fraction.
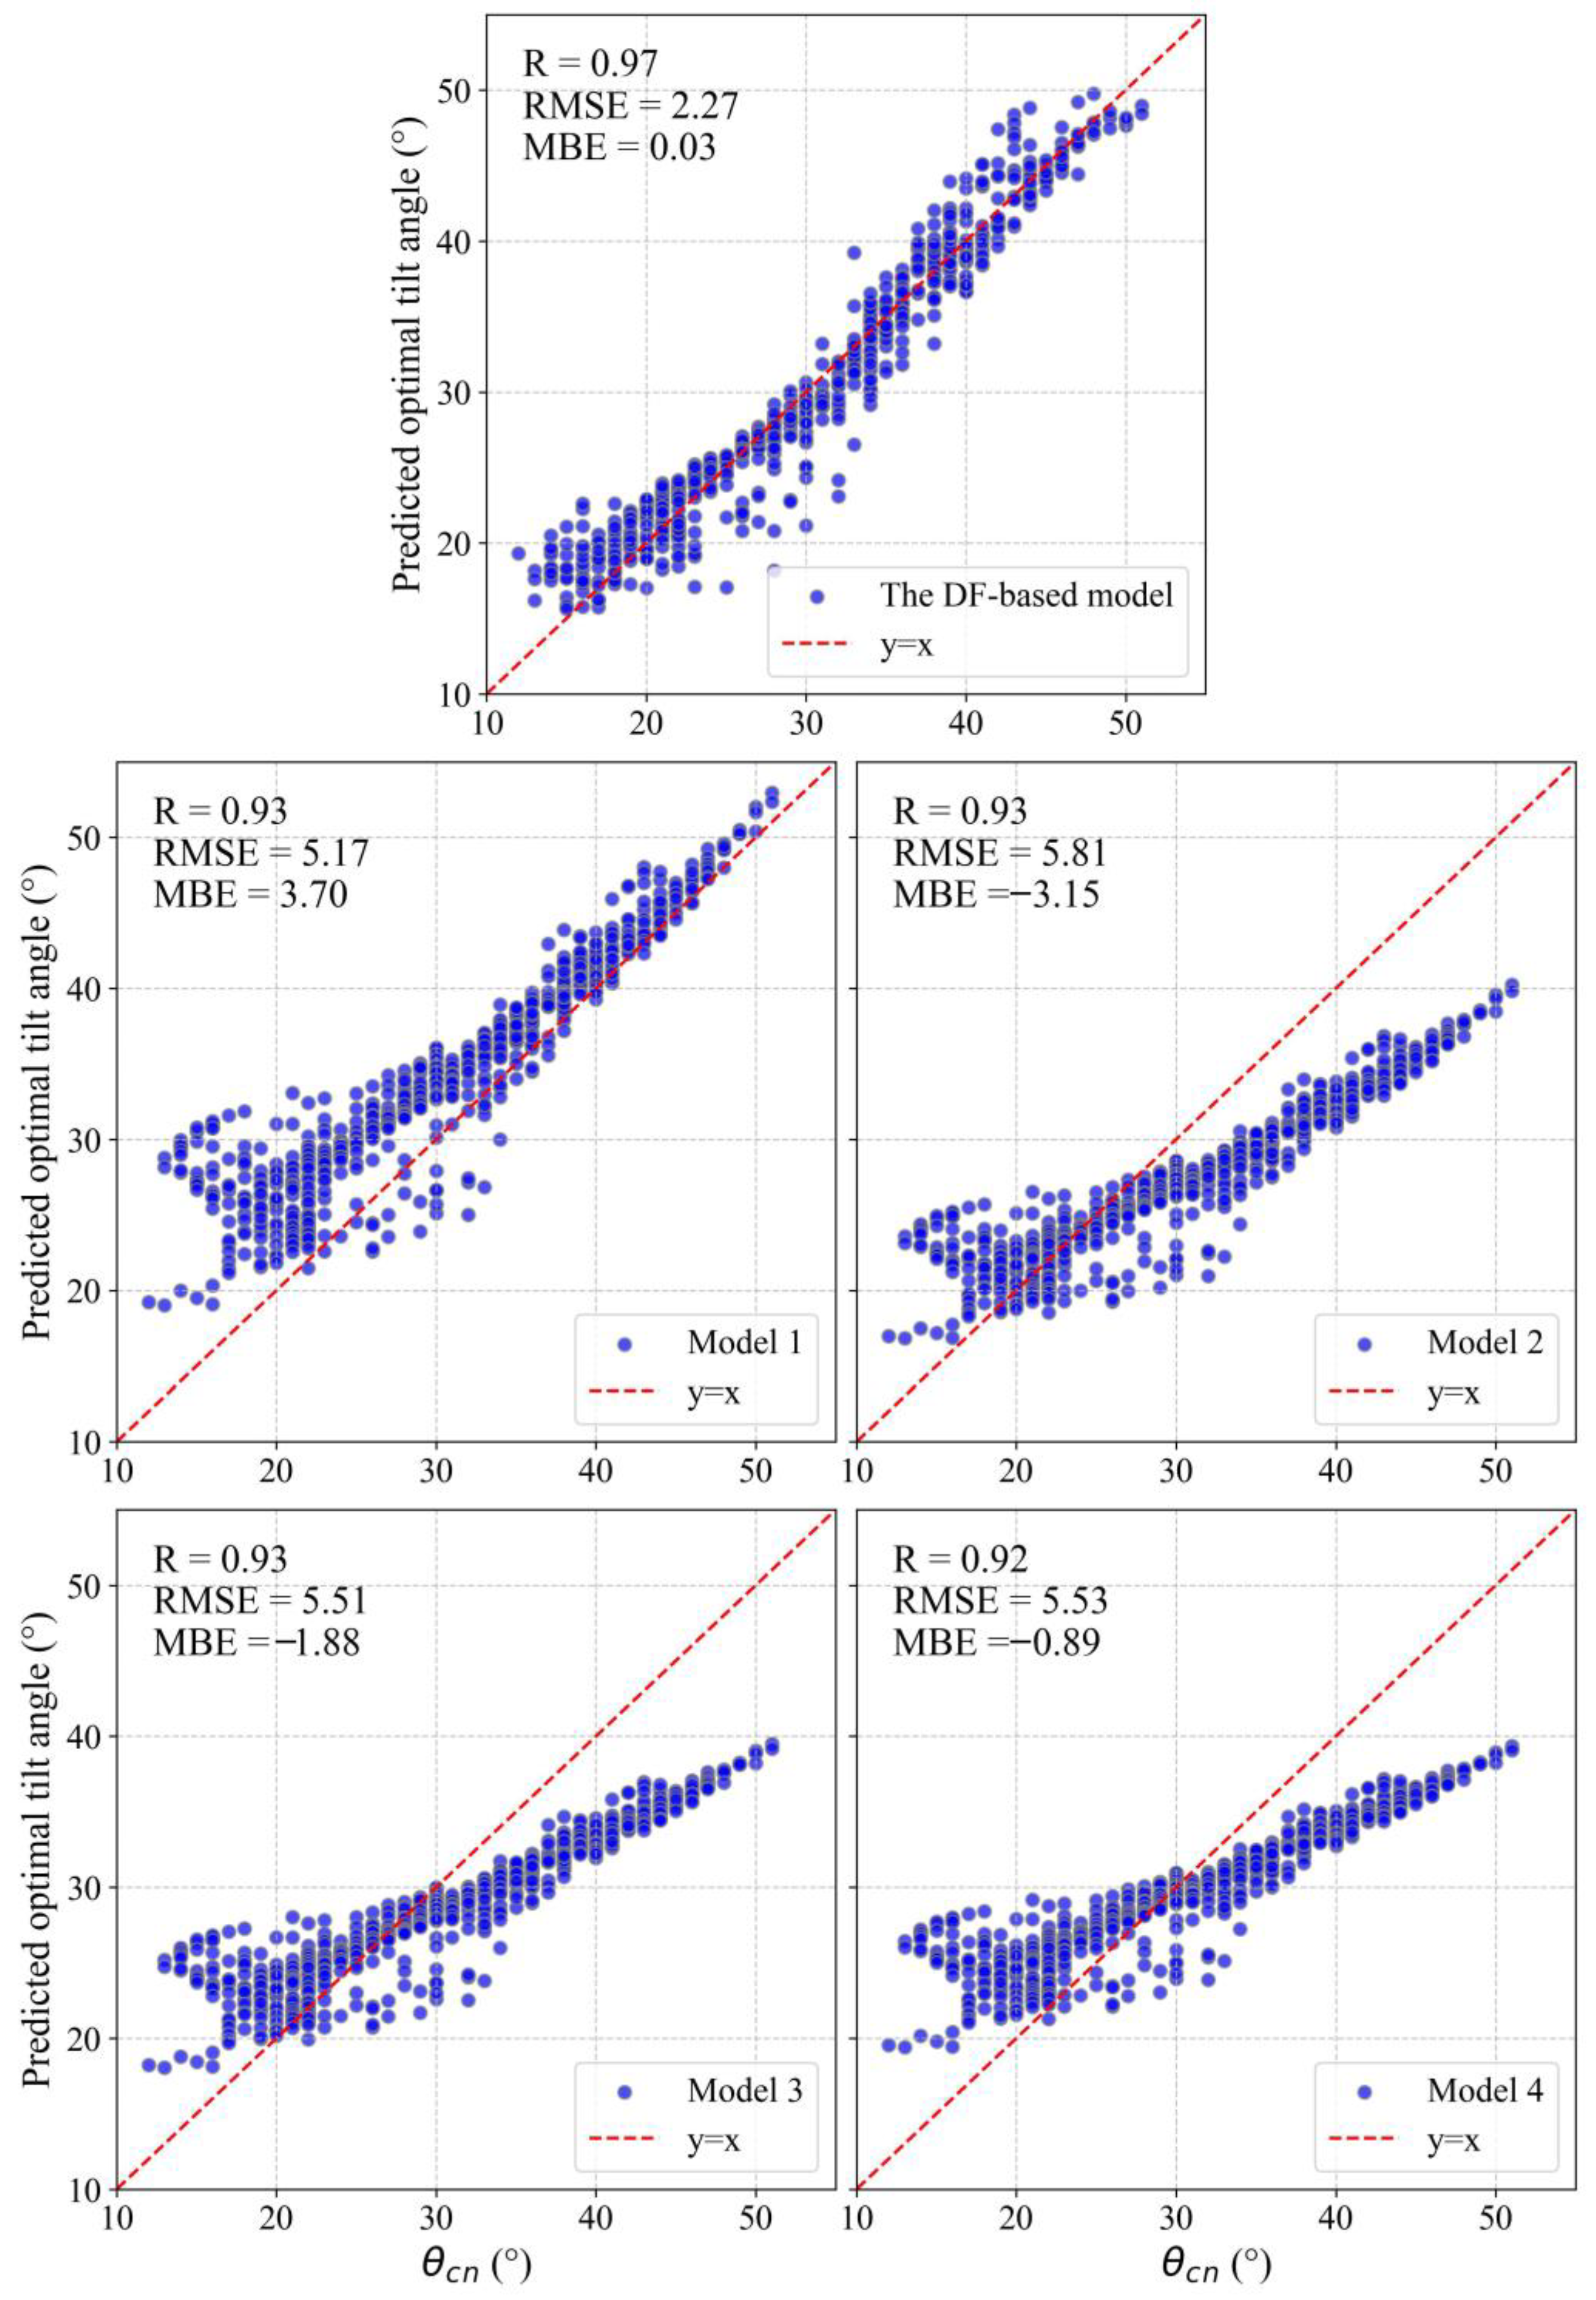
To evaluate the performance of the proposed DF-based model, we compared its predicted optimal tilt angles with those of four commonly used latitude-based models (Table 1), and θ c n were treated as the true values for validation. As shown in Figure 7, the DF-based model exhibits the best agreement with the true optimal tilt angles, achieving the highest R-value and the lowest RMSE and MBE. All four latitude-based models overestimate tilt angles at regions with lower optimal tilt angle (around 20°). Notably, these regions are characterized by higher DF values. This result underscores the superior performance of the DF-based model, which effectively accounts for local solar radiation patterns, particularly in areas with unique radiation characteristics (such as the Sichuan Basin).

3.3.3. The Impacts on PV Power Generation

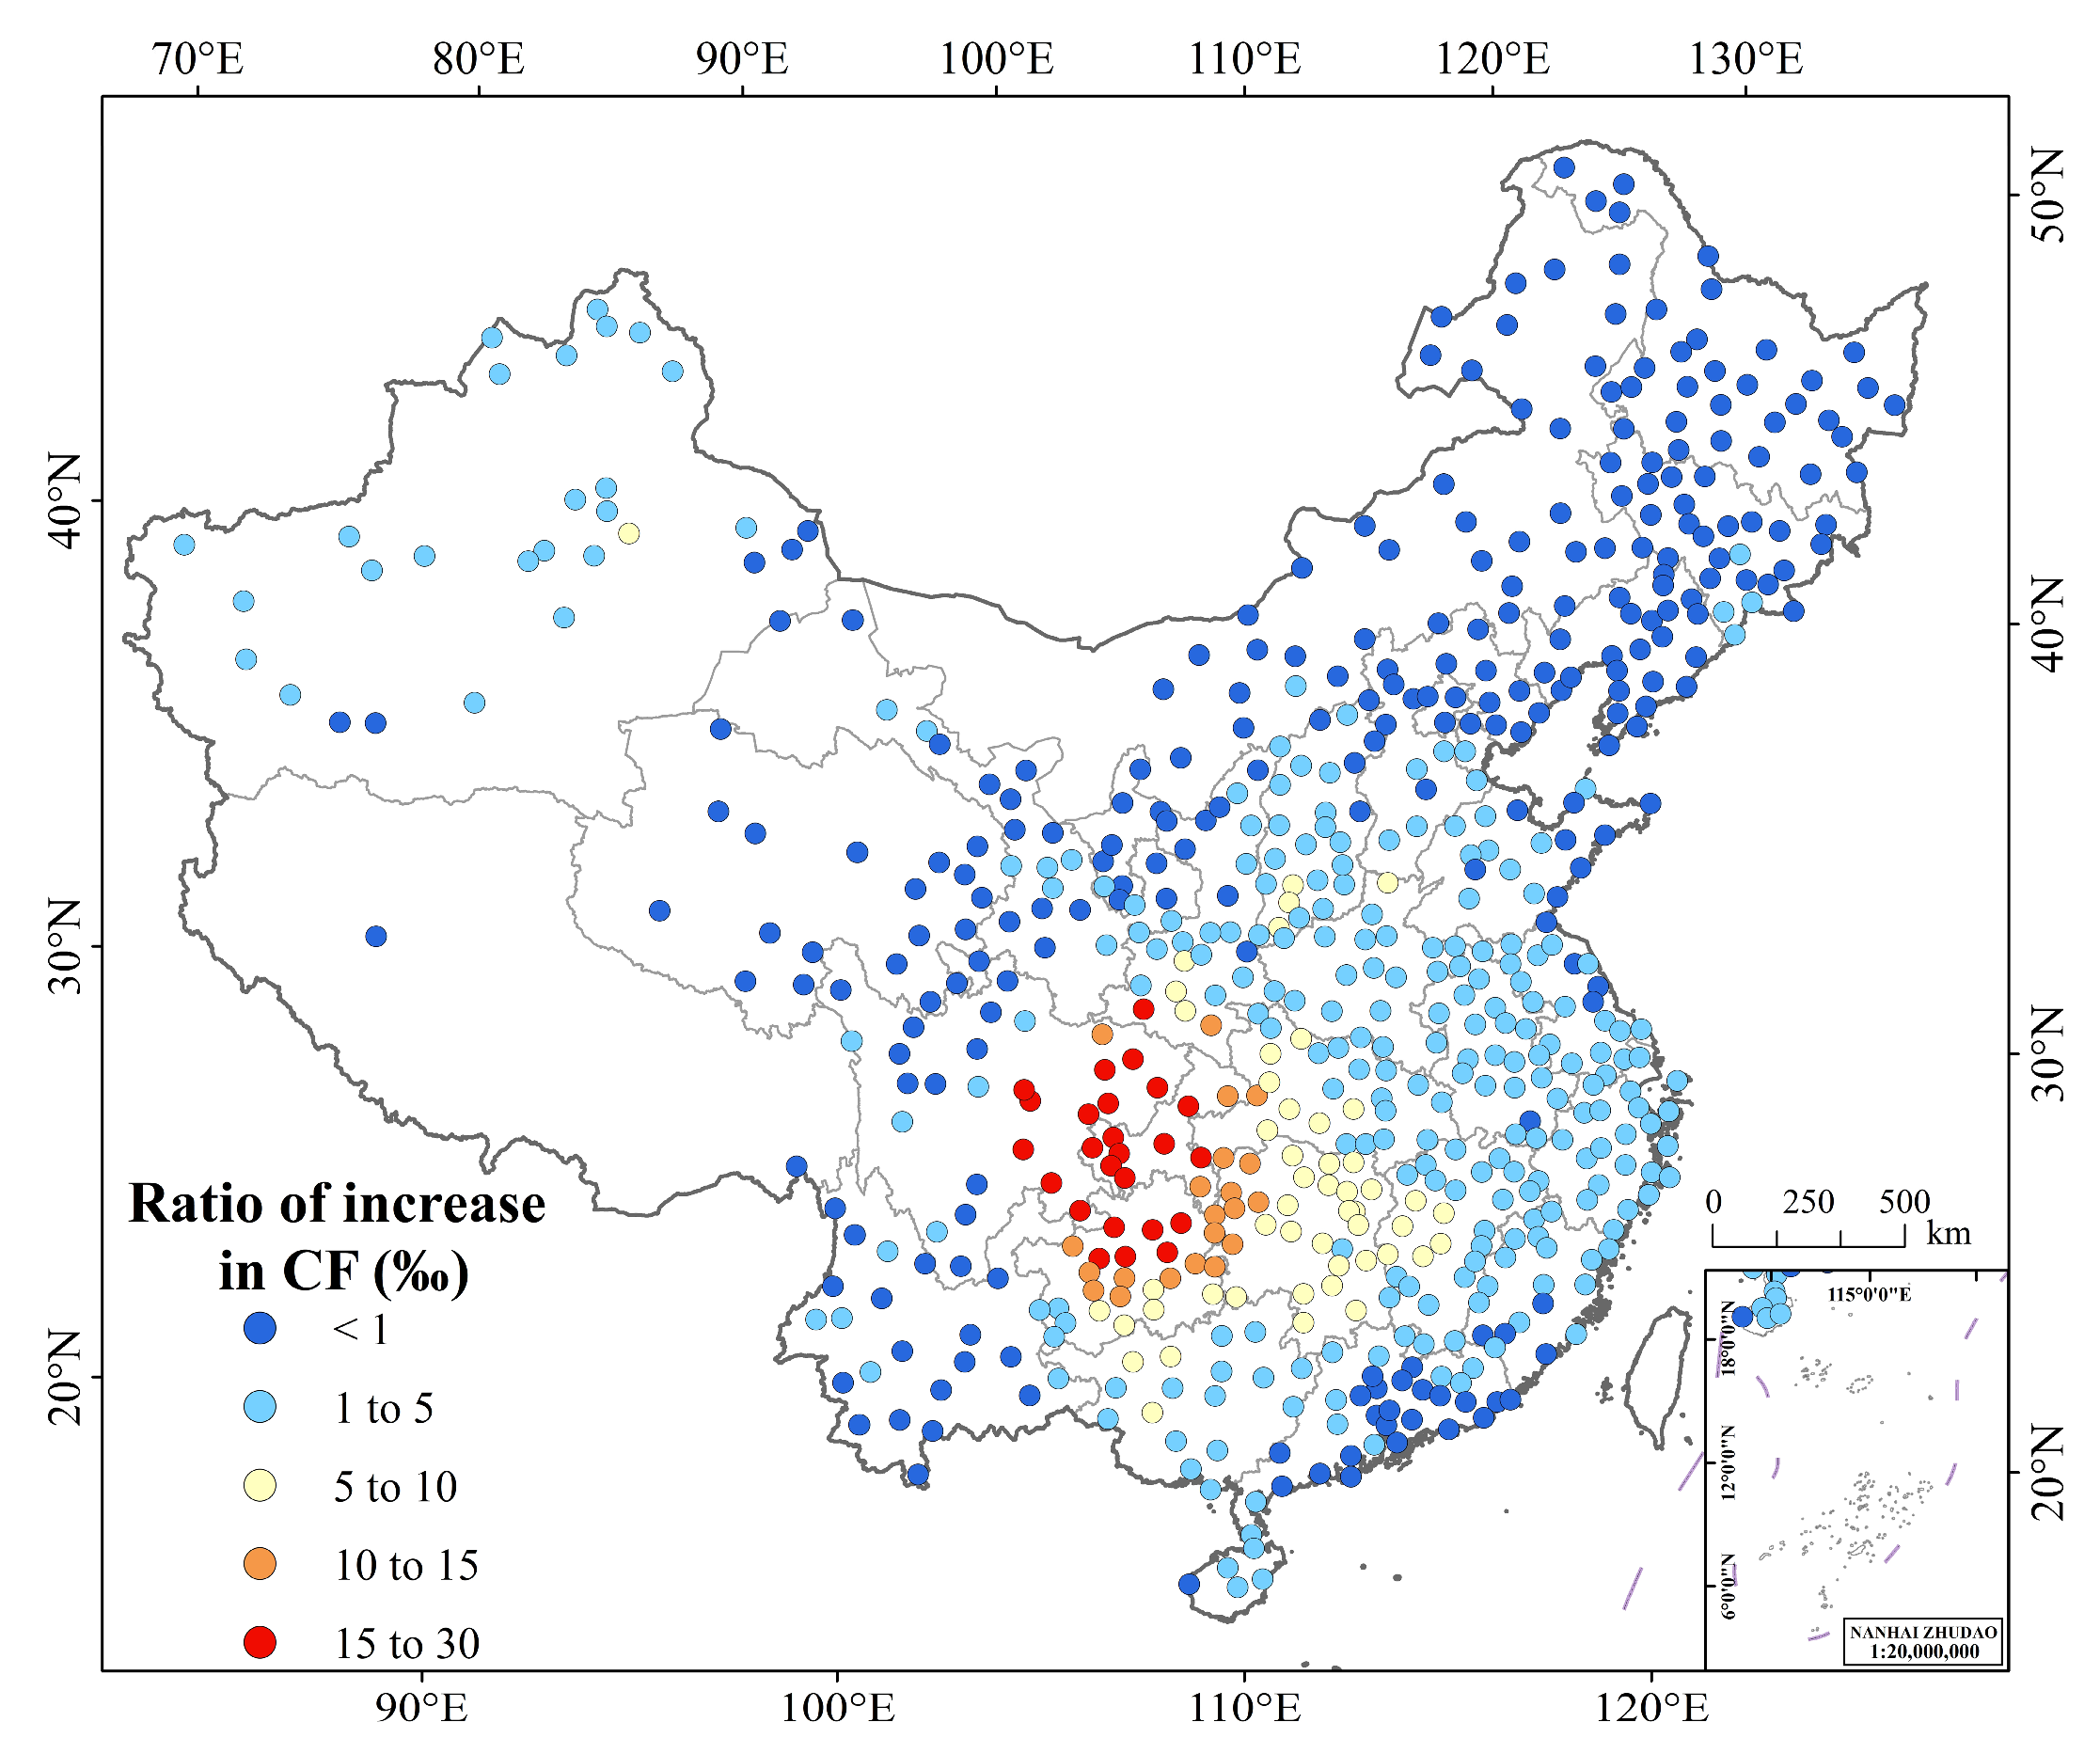
To evaluate the impacts of optimized tilt angles on PV system energy yield, we calculated the mean annual CF at 609 stations based on θ cn and compared these with results from the best-performing latitude-based tilt angle scheme. As validated in Section 3.3.2, Model 1 ( θ = φ ) provides the most accurate simulation of optimal tilt angles among latitude-based models, making it the most suitable choice for comparison. Figure 8 shows the ratio of increases in CF resulting from tilt angle optimization. On average, China’s long-term mean annual CF increases by 2.8‰ when the optimized tilt angles are applied instead of those derived from Model 1. Using the International Renewable Energy Agency’s (IRENA) statistics, which indicate that China’s cumulative installed PV capacity reached 609 GW by 2023 [4], this improvement can result in an additional 14.9 TWh/year of total PV power generation for the whole country. The increase in CF in northern China is generally lower than that in southern China, with the most significant improvements observed in southwestern China. This aligns with previous findings that Model 1 performs well in simulating optimal tilt angles in higher-latitude regions, such as northern China, but exhibits greater inaccuracies in southern regions, where the optimal tilt angles are typically lower than local latitude. In summary, optimizing tilt angles plays a critical role in unlocking future PV power generation, especially in regions where latitude-based models underperform. These results underscore the importance of incorporating localized, long-term weather data into PV system design to maximize energy yield across diverse geographical and climatic conditions.

3.4. Long-Term PV Power Potential over China

3.4.1. Spatial Patterns

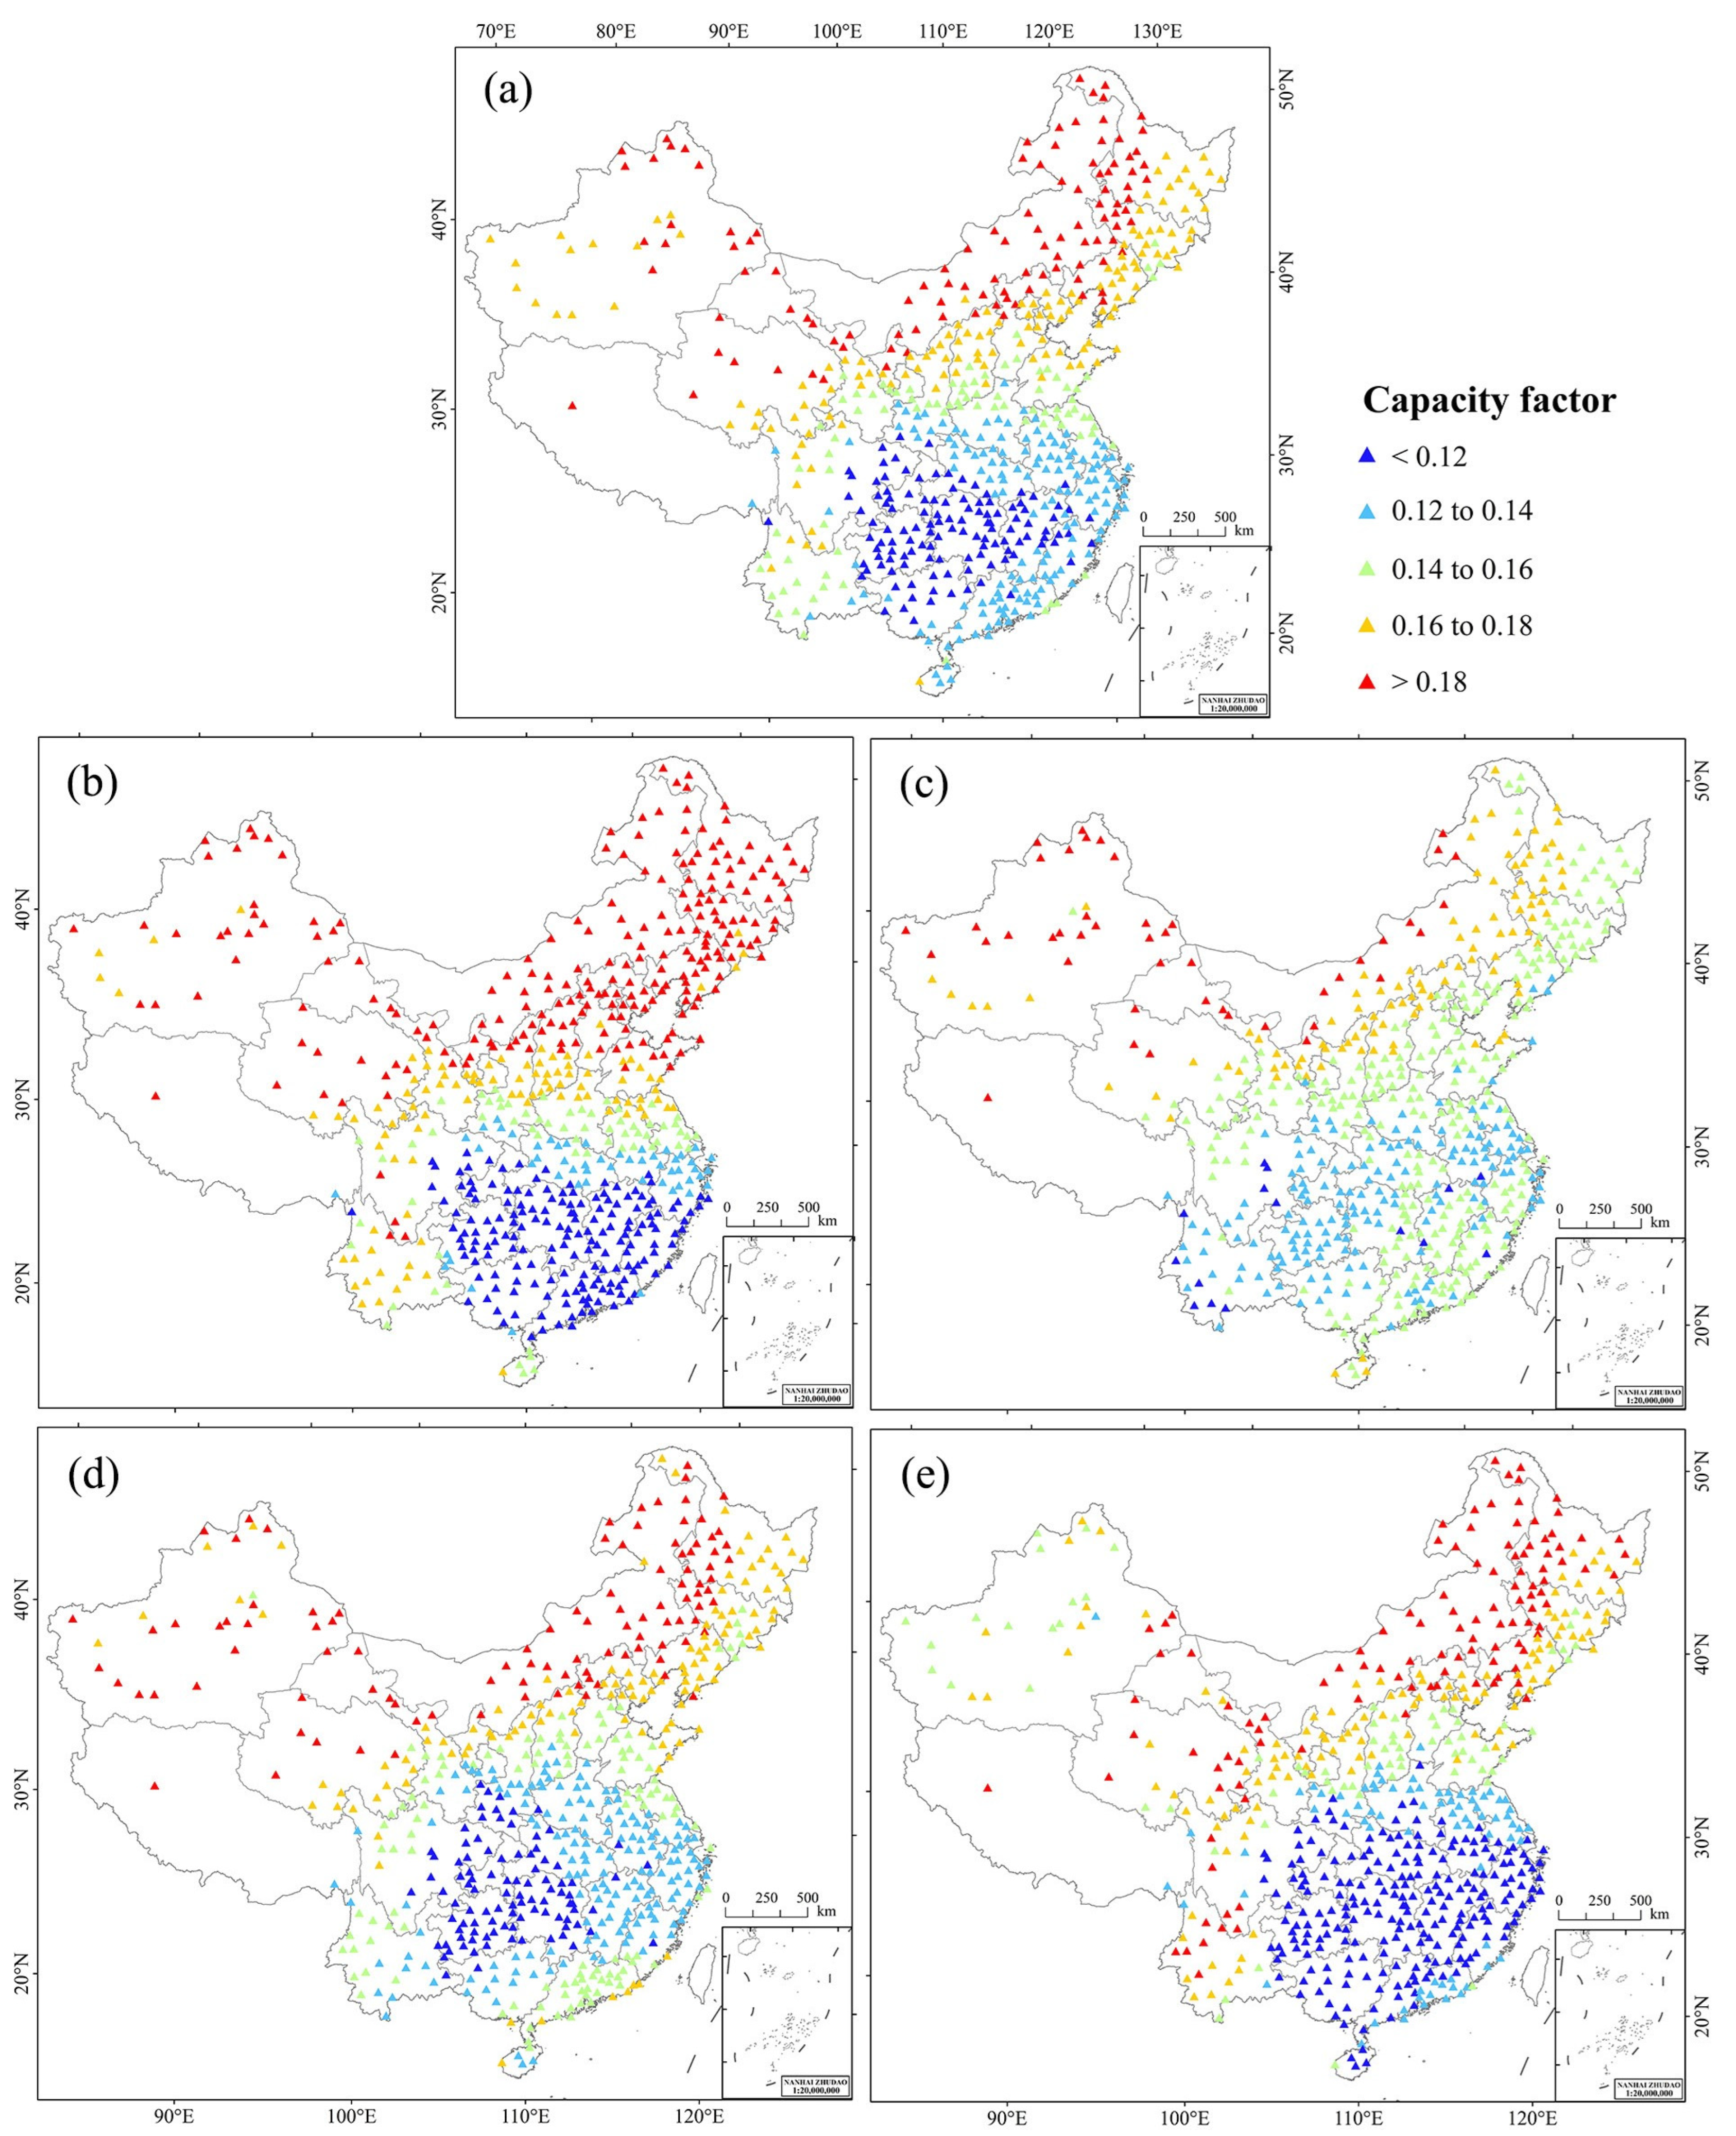
Based on θ cn , the PV power potential at 609 stations across China was quantified using CF. Figure 9a depicts the mean annual CF from 1980 to 2019, which exhibits a spatial pattern with higher potential in the northern provinces and lower potential in the southern provinces. The highest potential is concentrated in Xinjiang Province, Inner Mongolia Province and their surrounding areas, with CF values exceeding 0.180. In contrast, southern China exhibits generally lower CF values, mostly below 0.140, with the Sichuan Basin standing out as a particularly low-potential region, where CF values predominantly remain below 0.120. This spatial distribution of PV power potential is primarily influenced by variations in surface solar radiation and ambient temperature. Our analysis of three key influencing variables—direct solar radiation, diffuse solar radiation, and ambient temperature (see Figure S3)—shows that northern China receives significantly higher levels of direct solar radiation and experiences lower ambient temperatures than southern China. Higher ambient temperatures can reduce the electrical efficiency of PV modules, negatively impacting power output [15]. The spatial distribution of seasonal mean CF values exhibits slight variations compared to the annual mean CF, as shown in Figure 9b–e. In spring and winter, PV power potential declines significantly from northern to southern China, whereas in summer and autumn, this latitude-dependent trend is less pronounced. These seasonal differences highlight variations in PV power generation potential throughout the year, offering insights into the influence of seasonal solar radiation and atmospheric conditions on PV system performance.
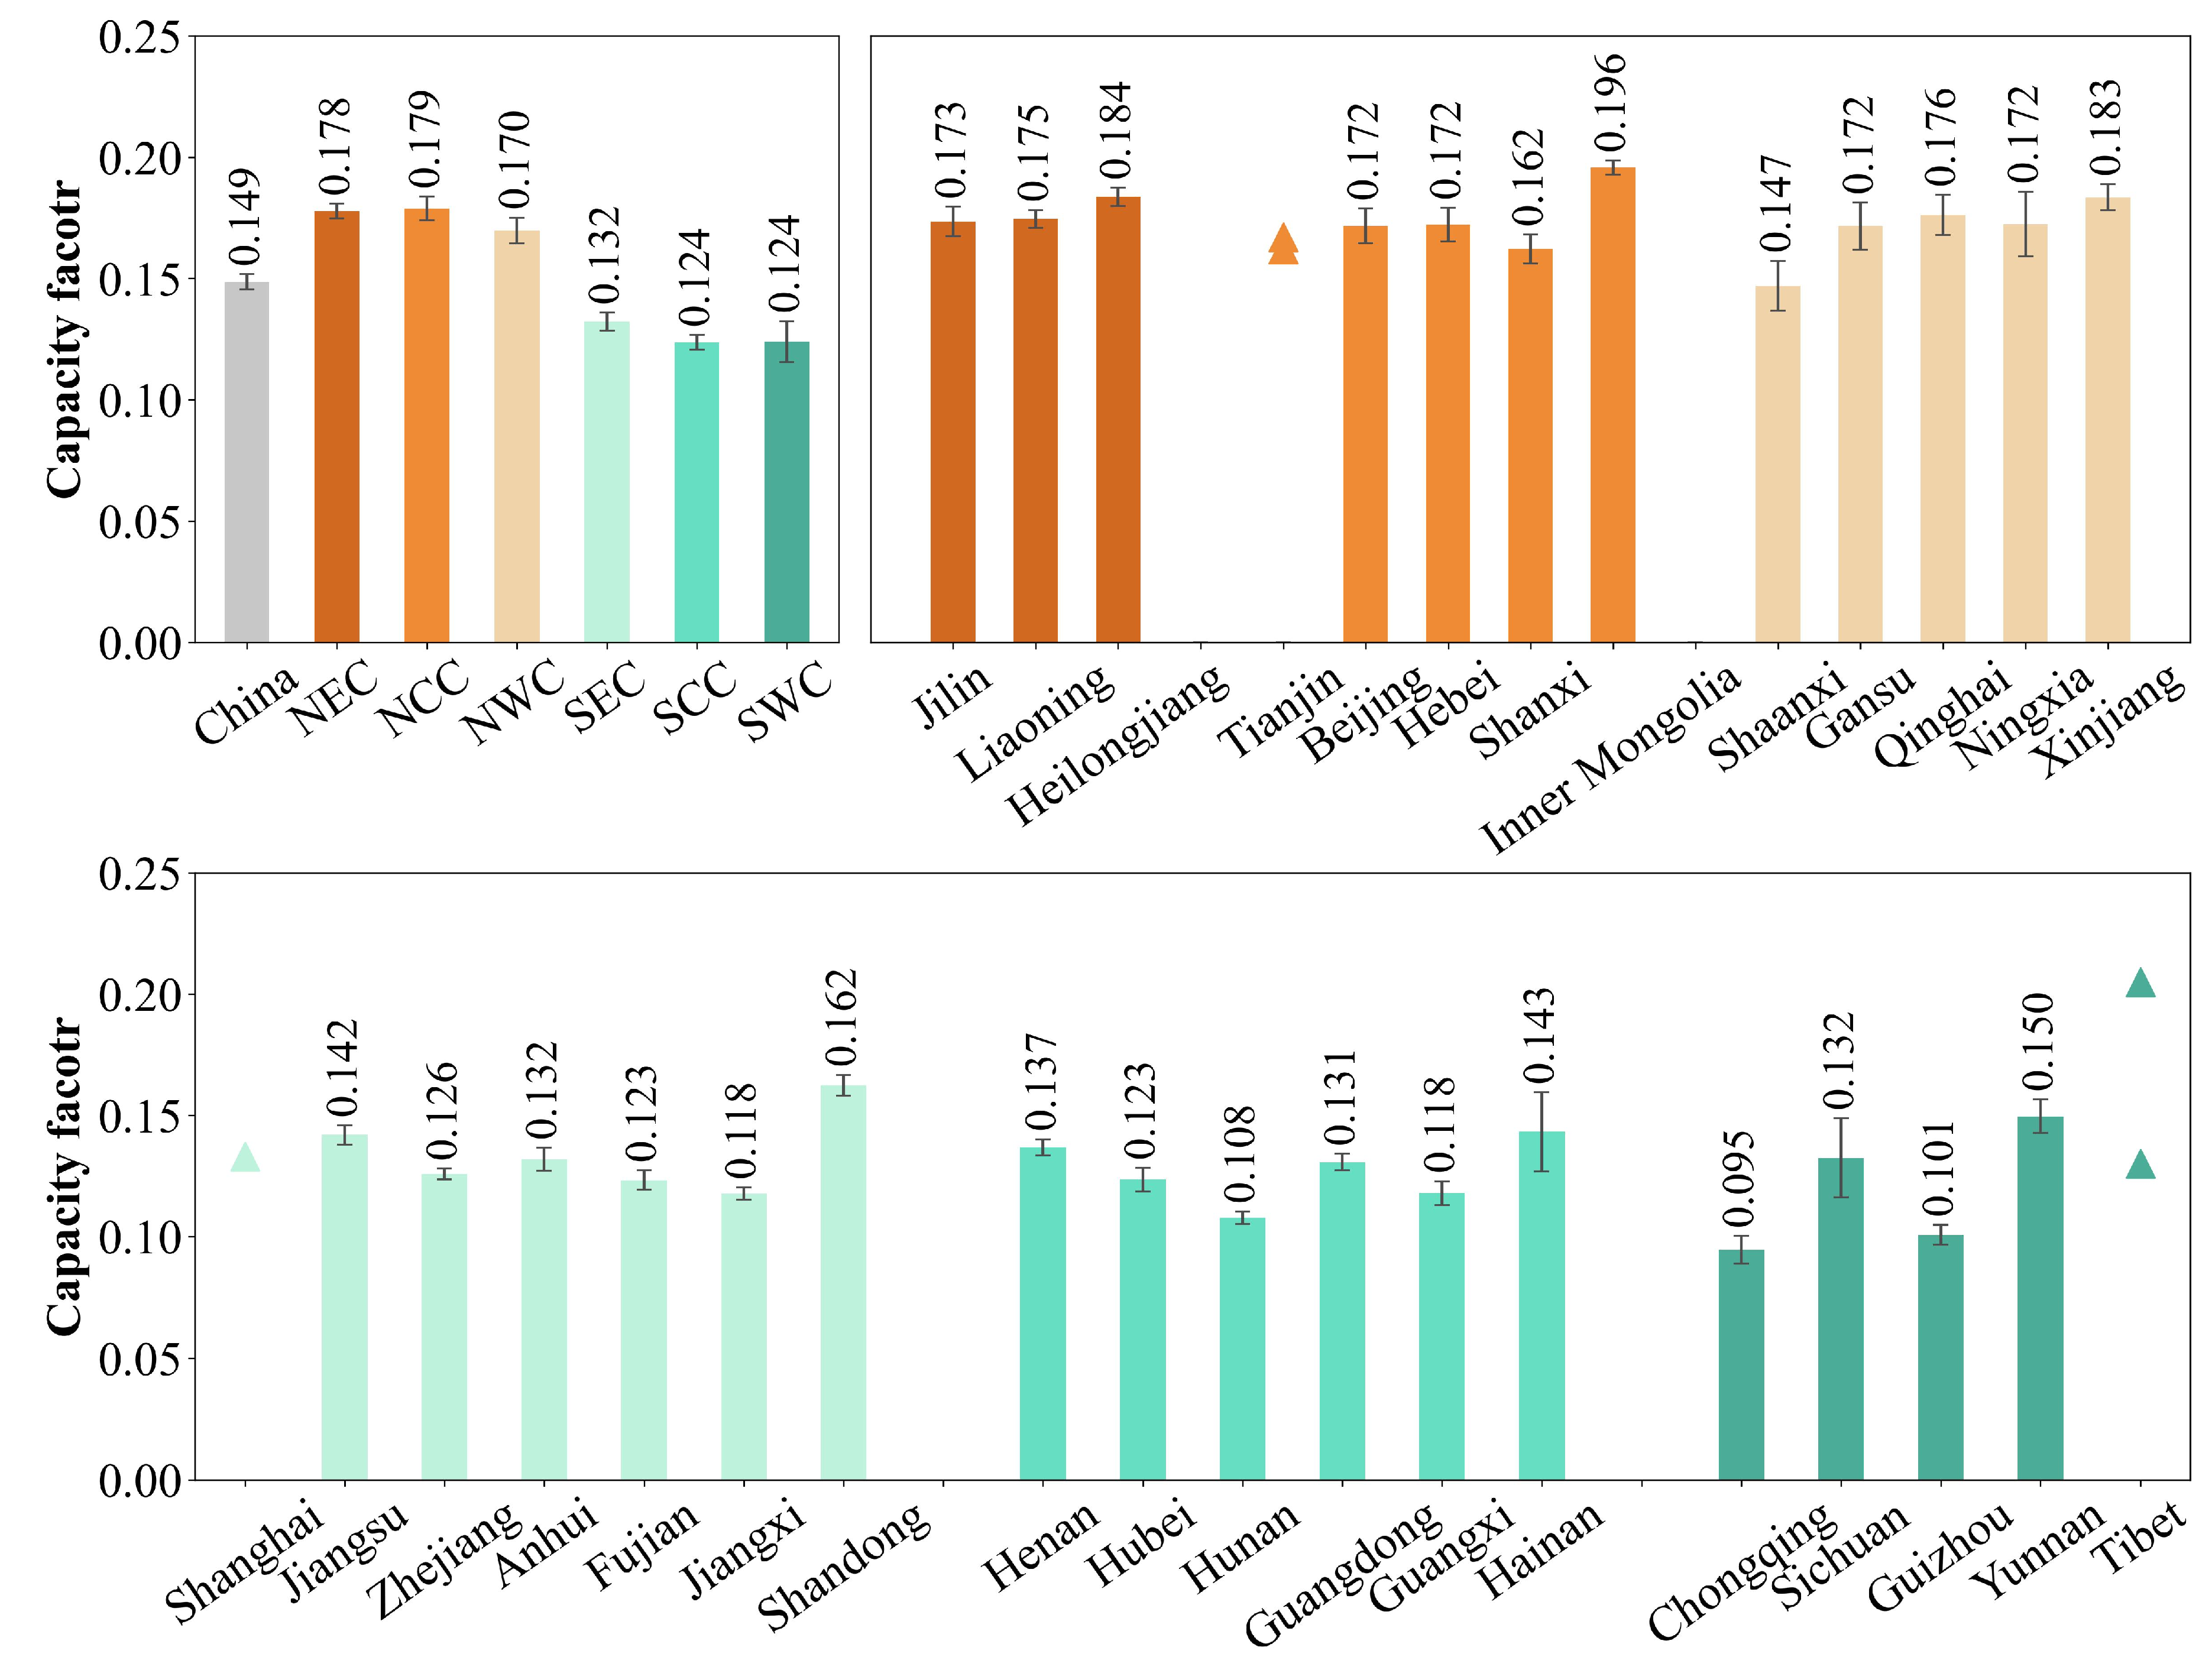
At the regional and provincial levels, the PV power potential varies significantly, as depicted in Figure 10. The NCC region exhibits the highest PV potential, with a mean CF of 0.179 ± 0.018. Among provinces, Inner Mongolia stands out with the highest potential nationwide at 0.196 ± 0.007. In contrast, the SCC and SWC regions exhibit the lowest PV potential, with mean CF values of 0.124 ± 0.021 and 0.124 ± 0.030, respectively. Chongqing City in SWC has the lowest potential among all provinces, with a mean CF of 0.095 ± 0.007. Despite the inclusion of the Qinghai–Tibet Plateau, which is recognized as one of the richest solar energy resource areas in China, the SWC region exhibits relatively low PV potential. This anomaly can be explained by the uneven distribution of ground stations within the region. Specifically, the Qinghai–Tibet Plateau, with its large land area and higher PV potential, has fewer ground stations, whereas regions with lower potential, such as the Sichuan Basin and Guizhou Province, are overrepresented.

3.4.2. Long-Term Variabilities

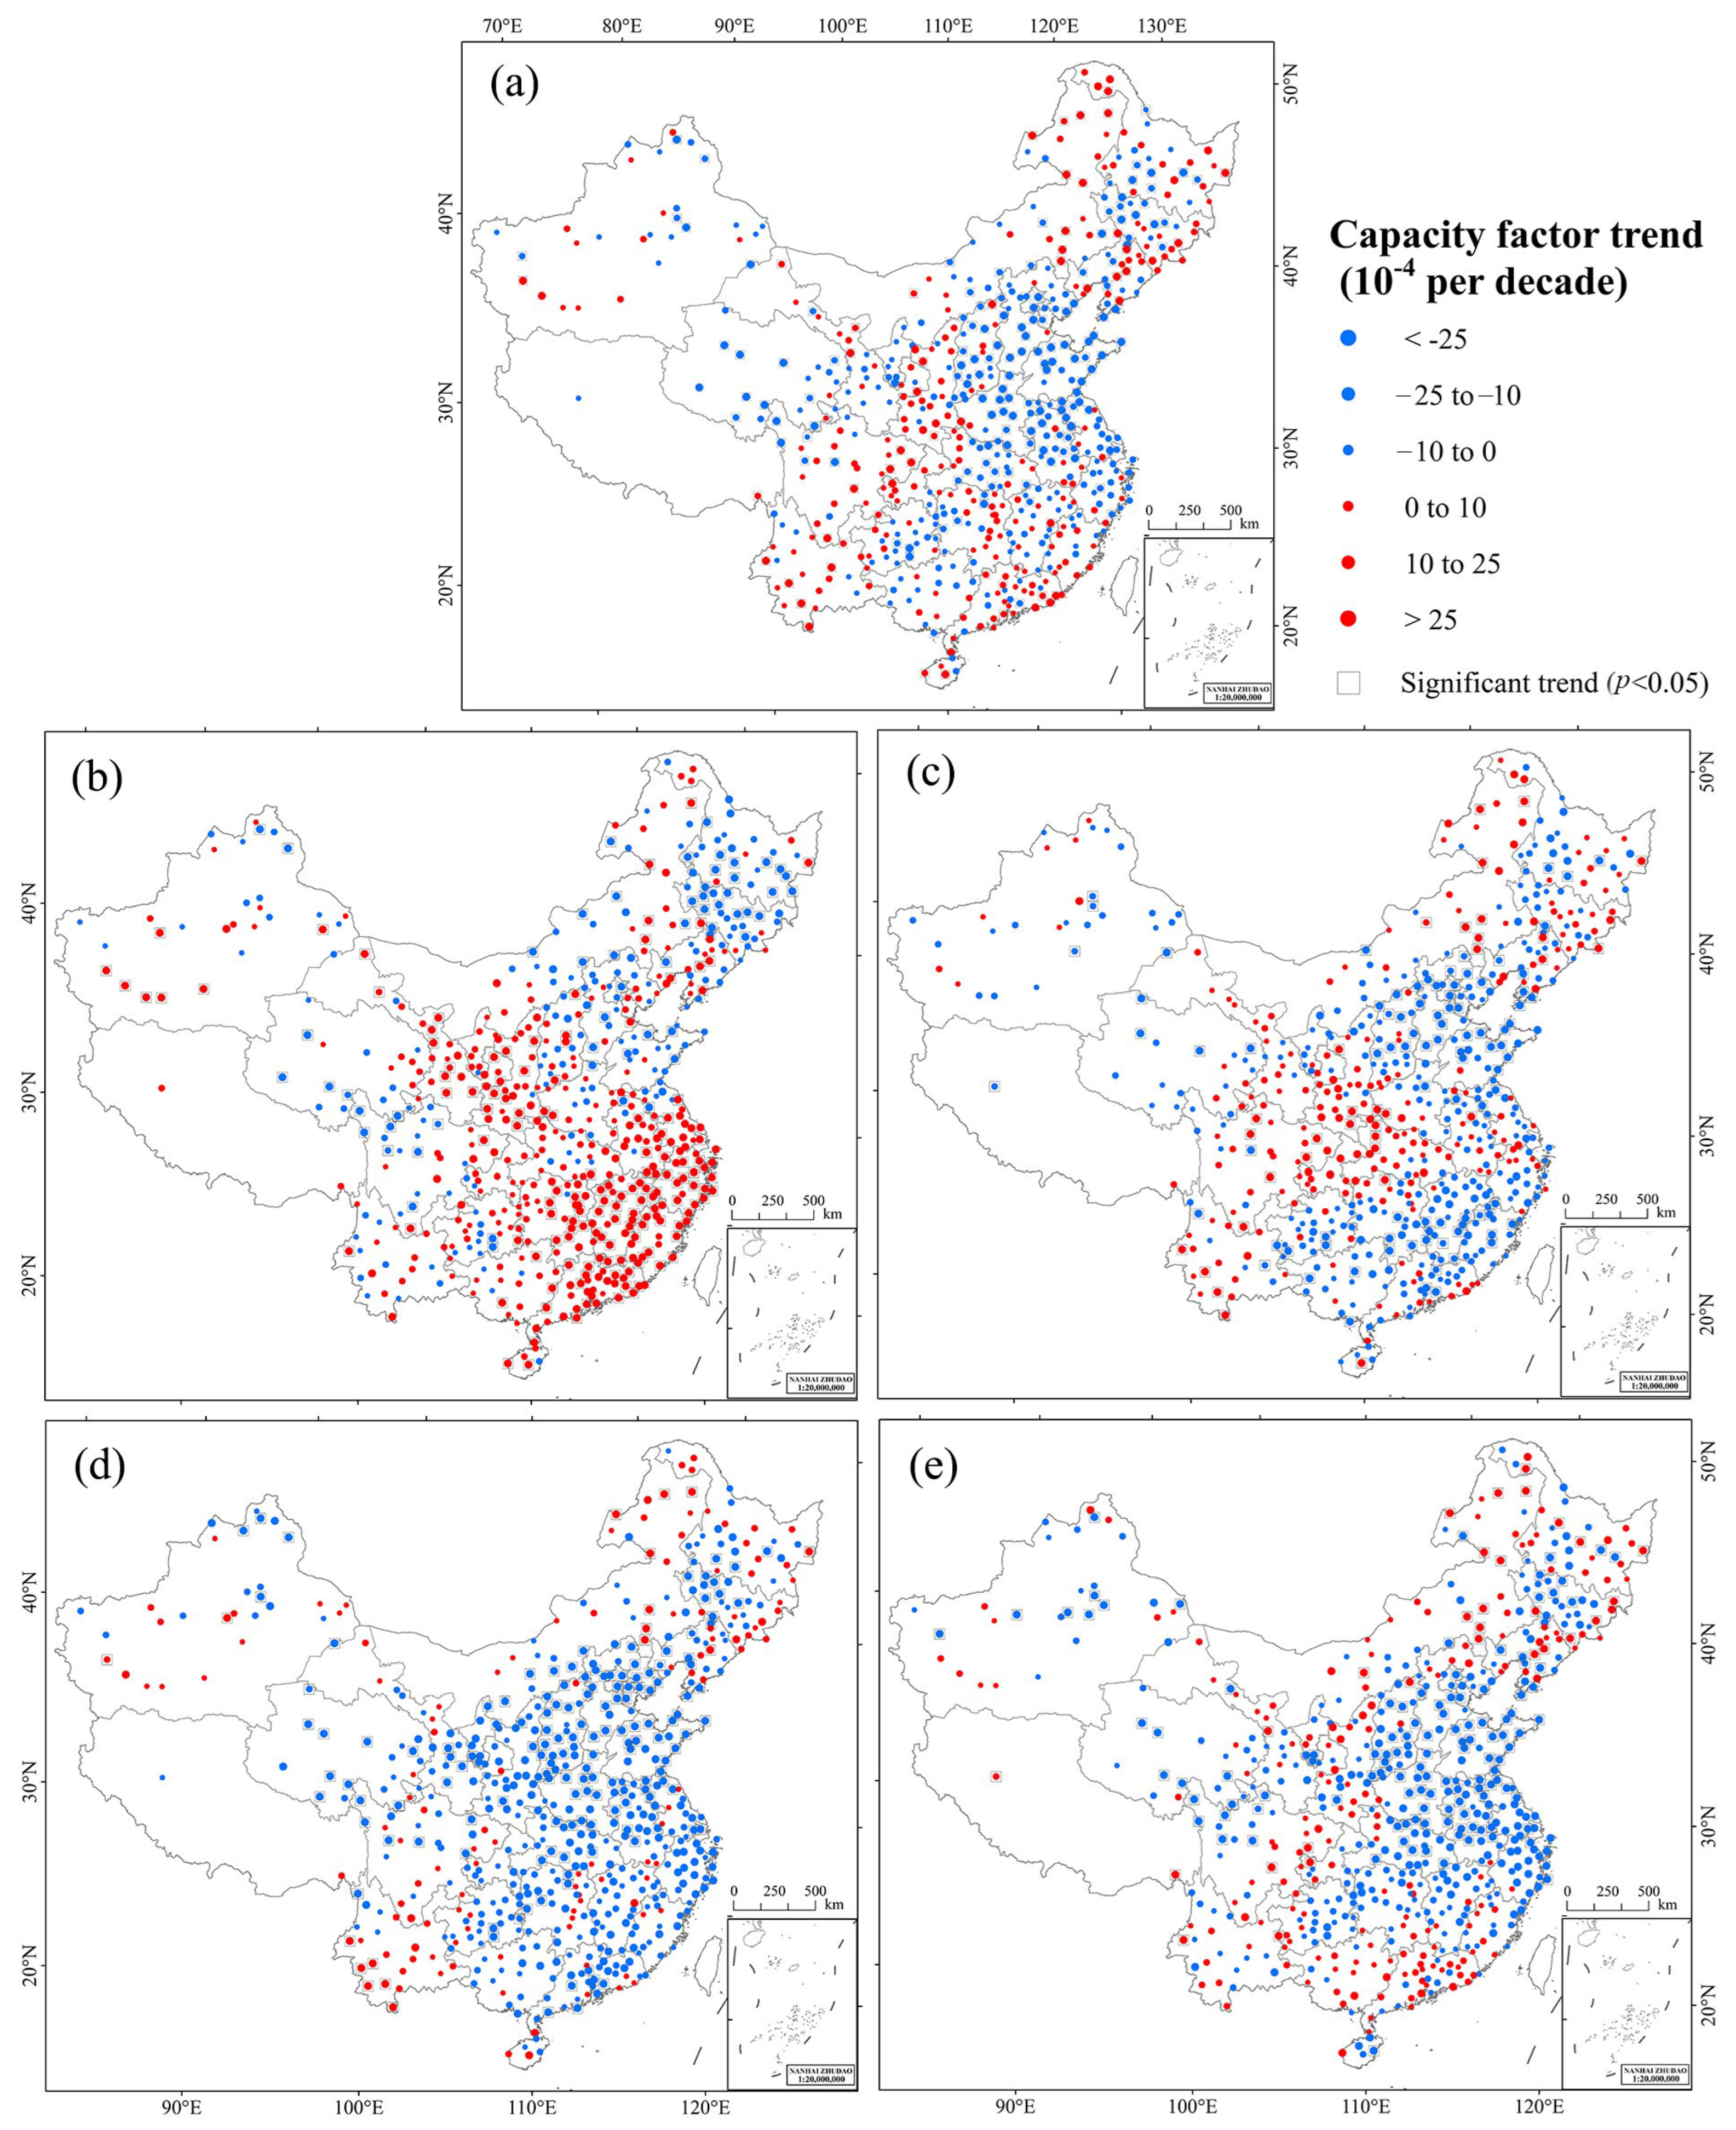
In this section, we present the long-term trends in China’s PV power potential from 1980 to 2019. The annual and seasonal trends of mean CF at 609 stations are displayed in Figure 11, with statistical significance evaluated using the Mann–Kendall test. Among these stations, 350 exhibit a declining CF trend from 1980 to 2019, with 144 showing statistically significant decreases. Most significantly declining stations are concentrated in the North China Plain, where rapid economic development and industrialization have led to increasing anthropogenic aerosols and pollutants [70,71], likely contributing to the reduction in surface PV resources. The seasonal CF trends display notable spatial variability (see Figure 11b–e). In spring, 395 stations (~64.5%) show an increasing trend, with significant increases concentrated in southeastern China. Conversely, autumn exhibits the most widespread declines, with 475 stations (~78.0%) showing downward trends, particularly significant in the North China Plain.
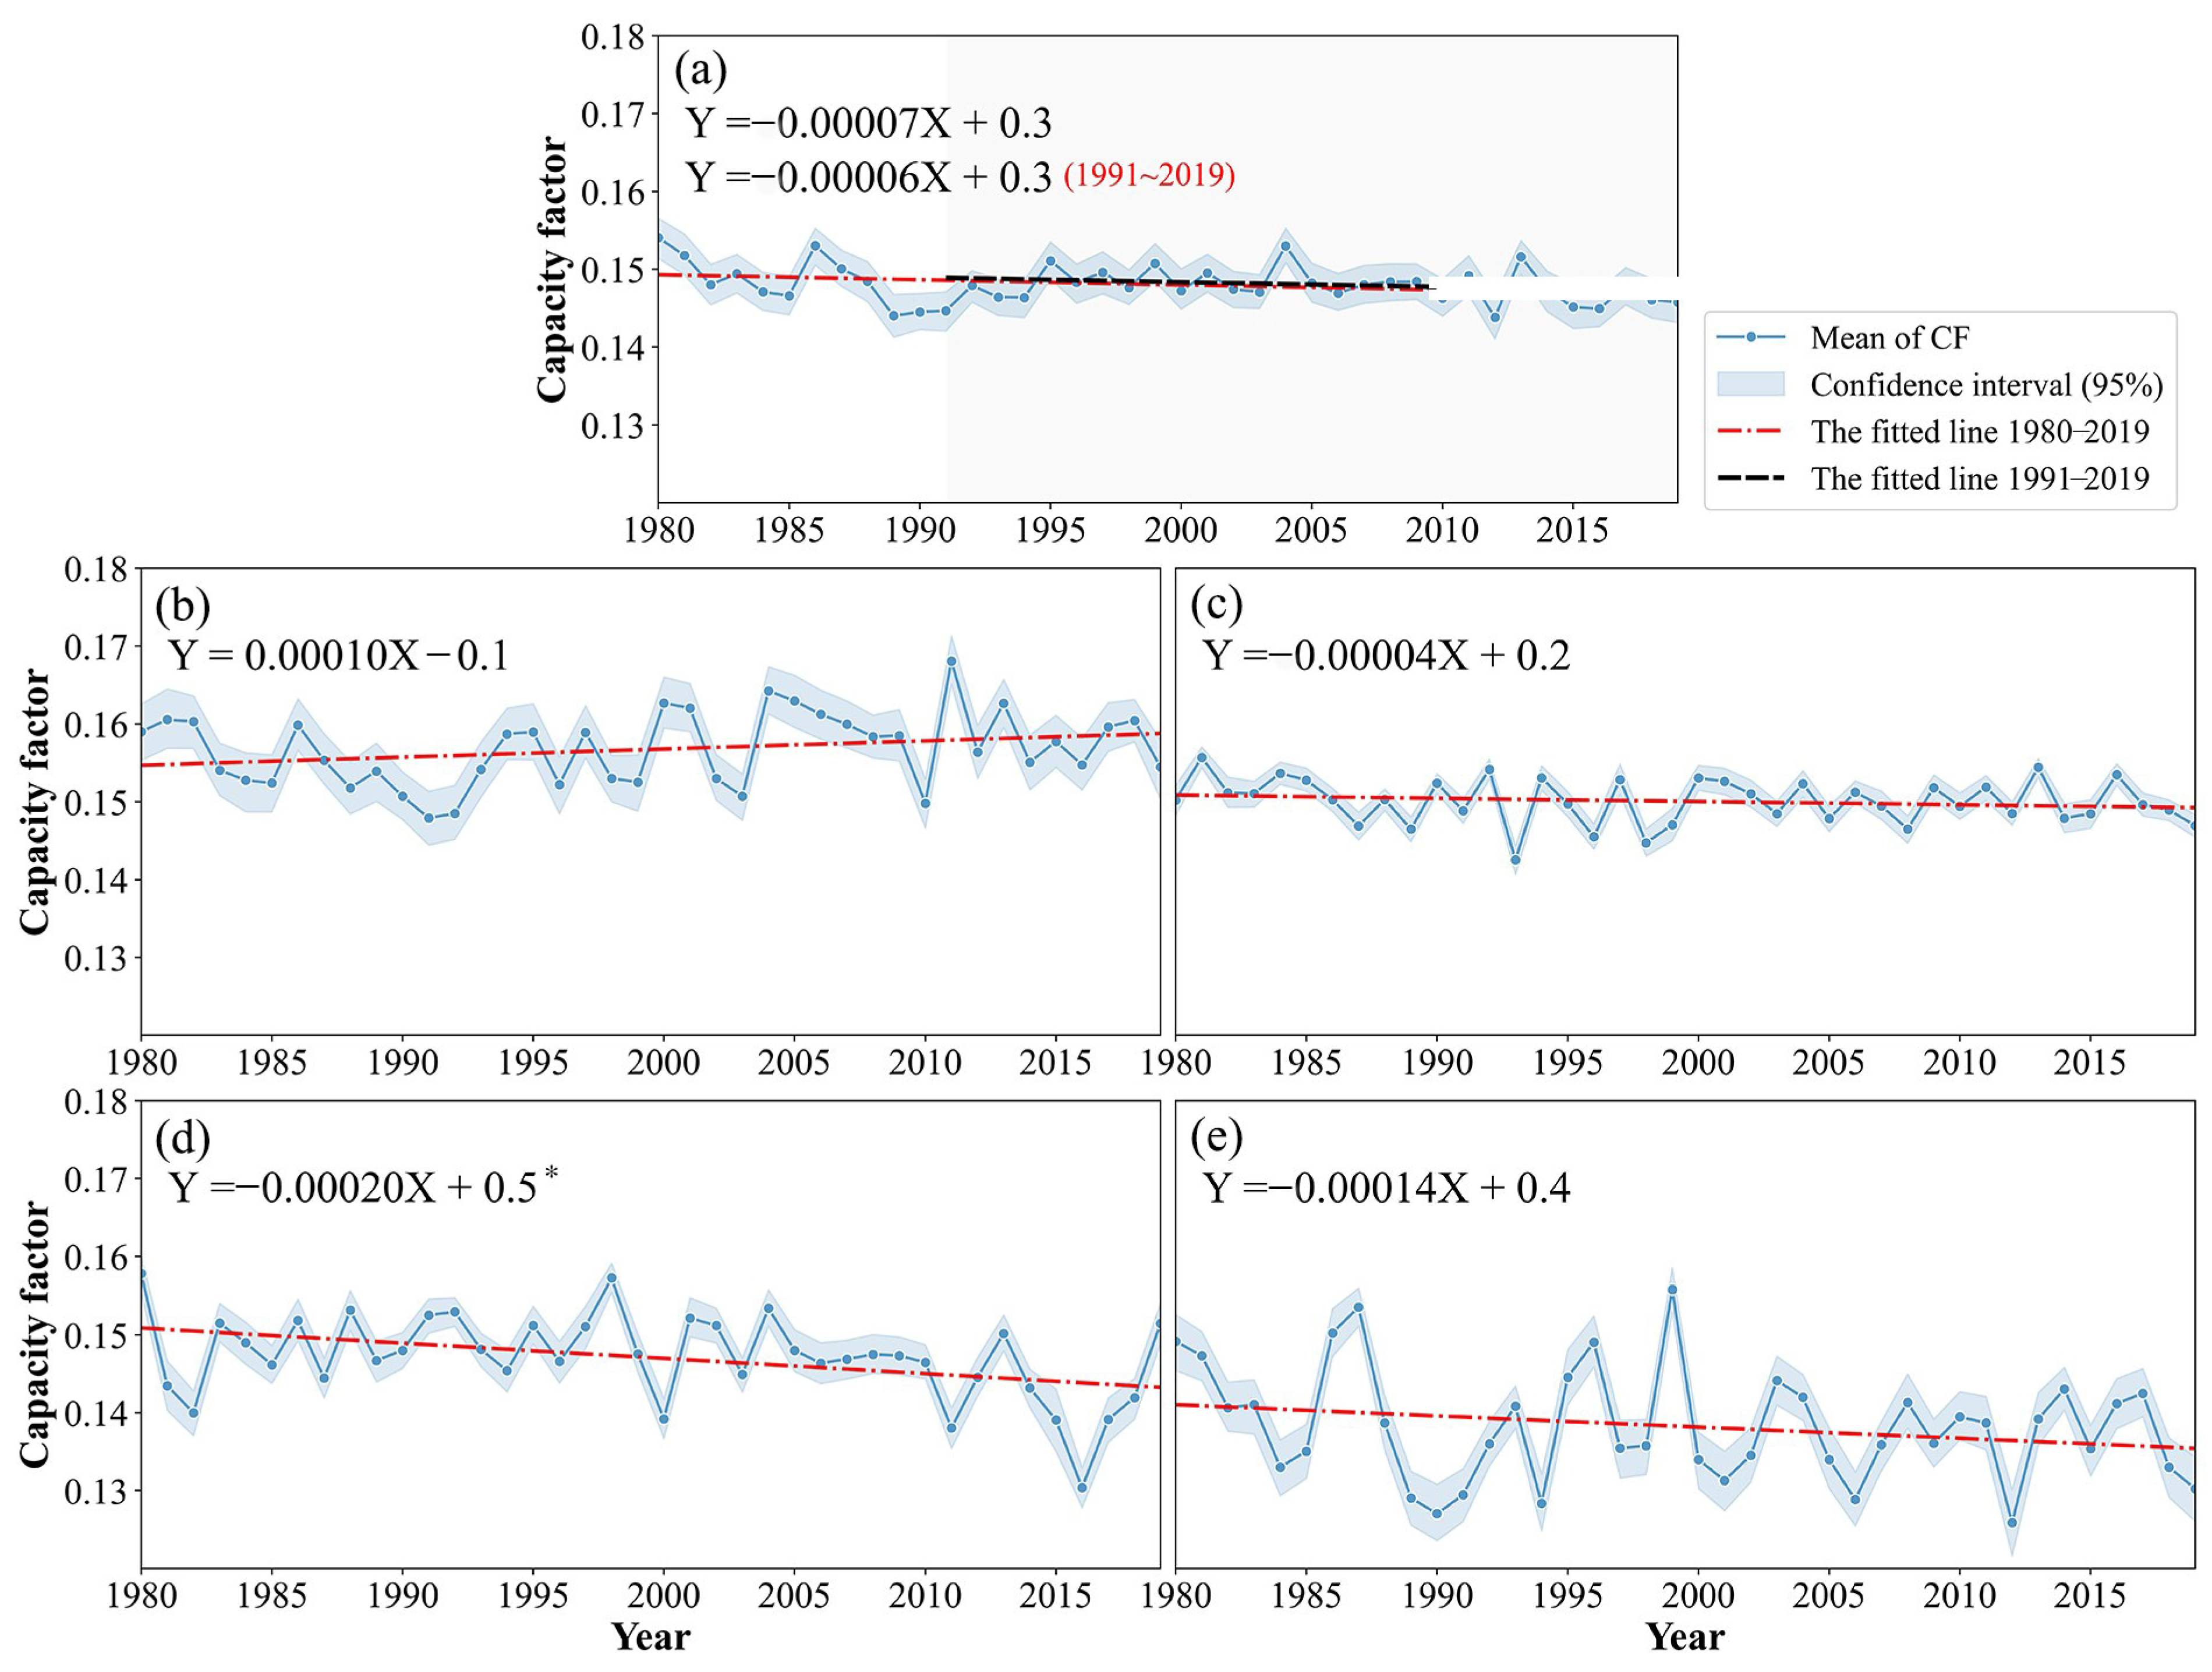
Figure 12 shows the annual and seasonal CF trends for China as a whole, with least squares fit results and asterisks marking statistically significant trends (p < 0.05). From 1980 to 2019, annual PV power potential exhibits a decreasing trend of approximately −7 × 10⁻⁴ per decade, though the decline was not statistically significant. The widely recognized concepts of “global dimming” and “global brightening” describe changes in global surface solar radiation before and after the 1990s [72]. To further investigate, we independently computed the CF trend for 1991–2019, corresponding to the global brightening period (see Figure 12a). Contrary to the increase in incident solar radiation during this period, China’s mean CF continues to decline at approximately −6 × 10⁻⁴ per decade. Recent studies indicate that while global brightening occurred from 1990 to 2010, Rs over China continued to decline until 2005—later than previously concluded [73]. The decadal Rs trend from 1990 to 2016 is nearly neutral (0.01 W/m2 per decade) [24], which partially explains the observed decrease in China’s PV power potential. Since 2013, the Chinese government has implemented some of the strictest air pollution control measures in history, such as the Air Pollution Prevention and Control Action Plan and the Battle for Pollution Prevention and Control. These efforts have led to significant improvements in air quality [74,75] and a recovery in surface solar radiation levels [76], which may partly explain the reduced annual decline rate of CF in China since 1990. In addition, the long-term global rise in temperature may have also contributed slightly to the decline in CF, particularly in high-latitude regions where PV potential is relatively low [77]. Seasonal CF trends reveal an increasing trend in spring and decreasing trends in other seasons. The increase in spring is approximately 10 × 10−4 per decade but is not statistically significant. In contrast, autumn exhibits a significant decline, with the steepest decrease reaching approximately −20 × 10−4 per decade.

4. Discussion

4.1. The Impacts of Atmospheric Parameters on Rdif Estimation

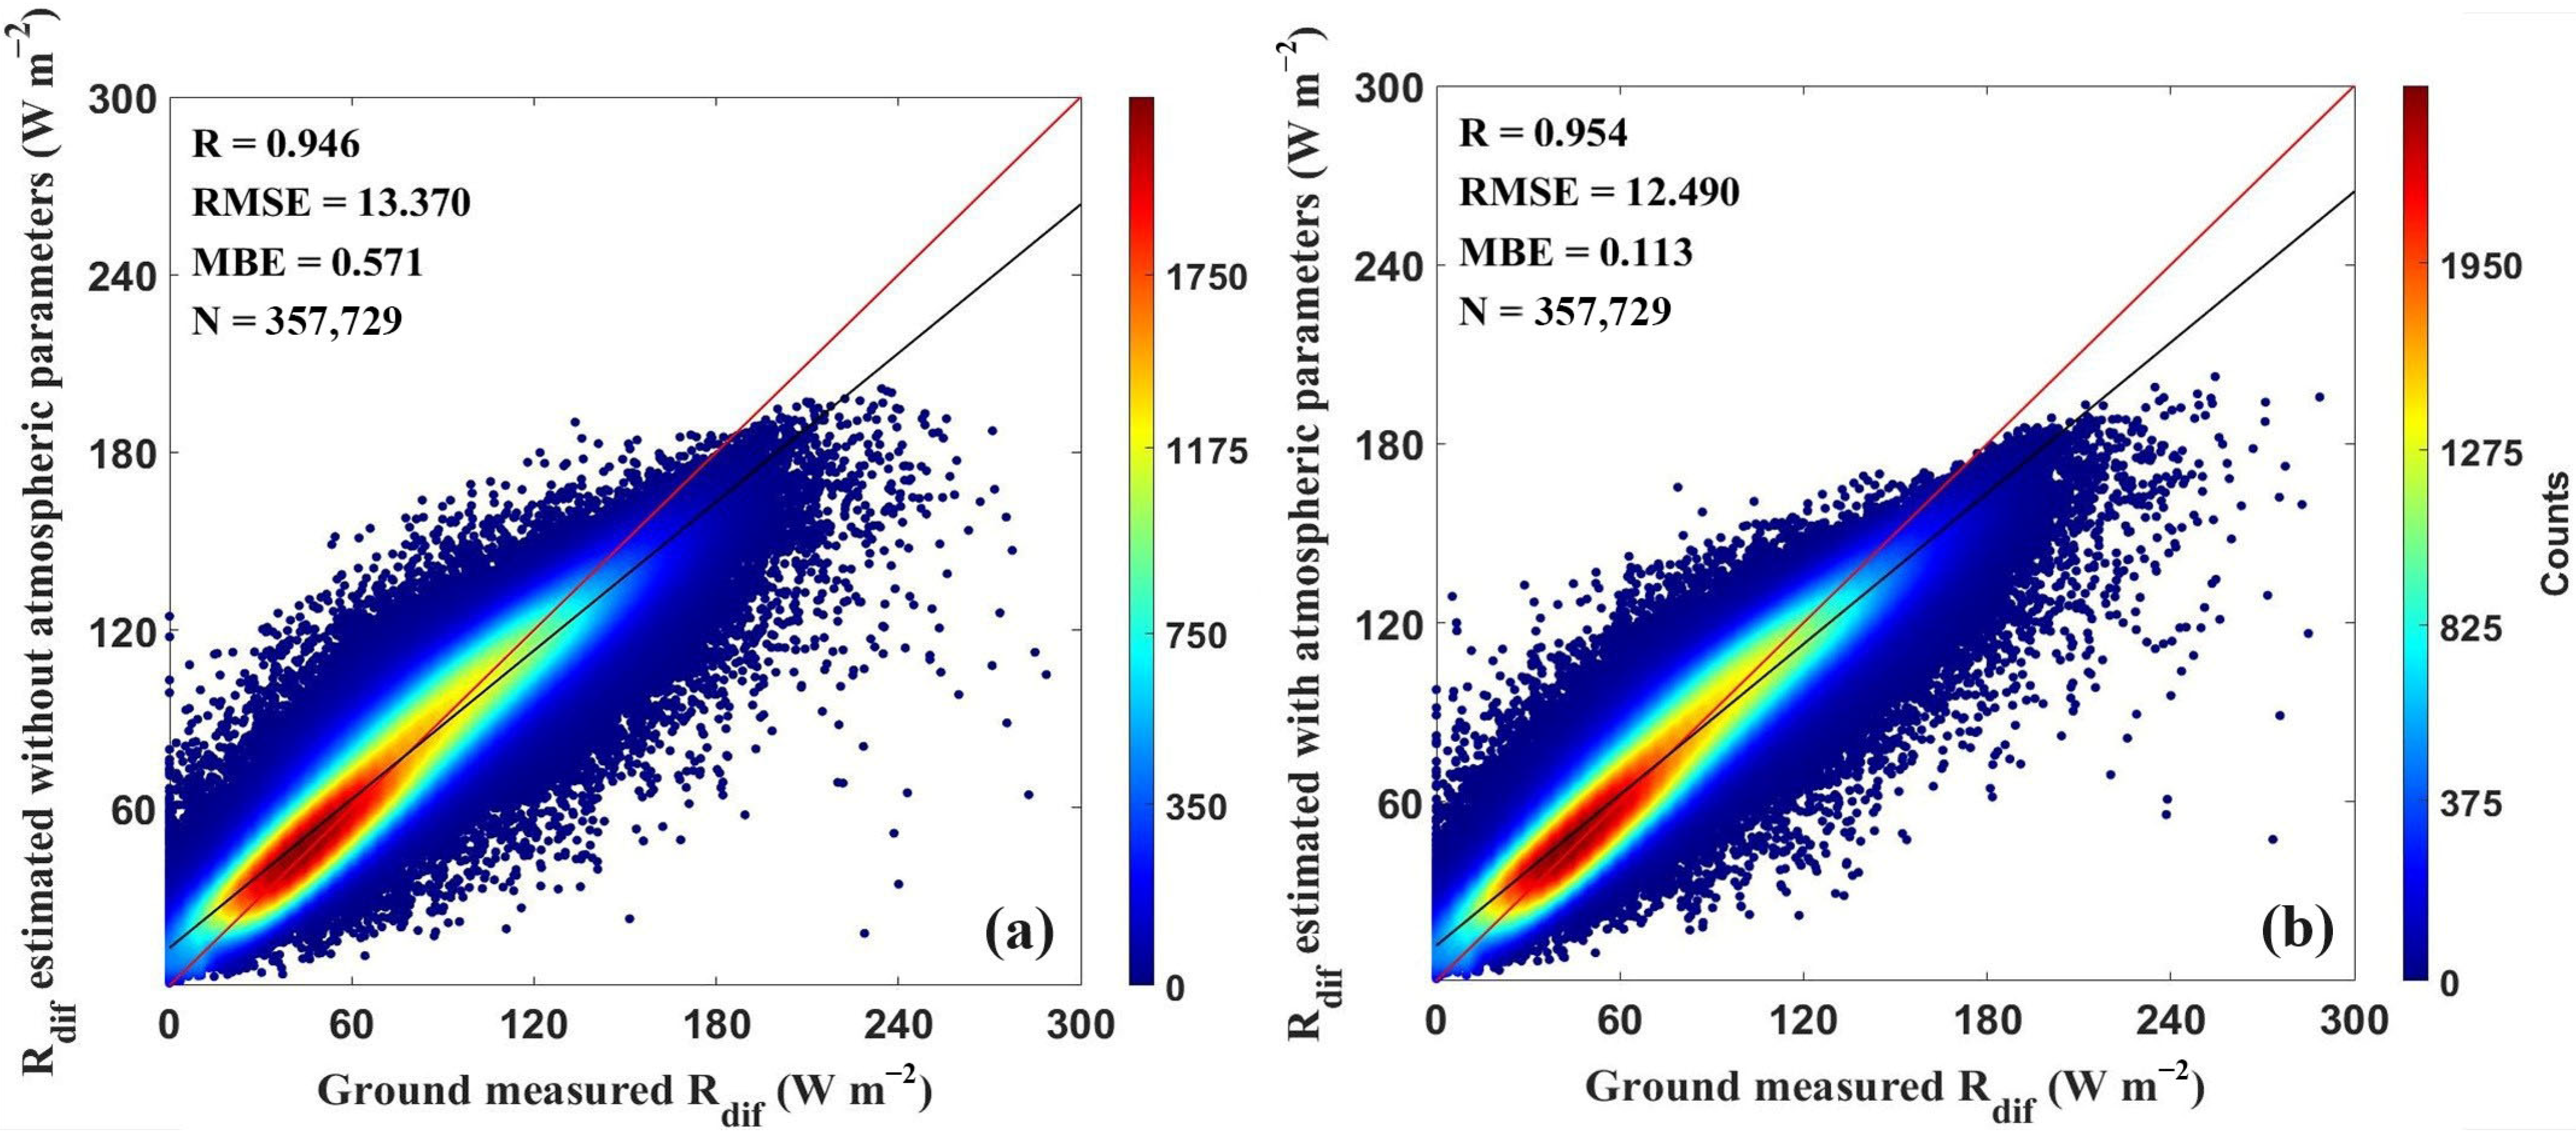
Rdif is primarily influenced by atmospheric components, particularly aerosols and clouds, due to their strong scattering effects [78]. Variations in aerosol and cloud levels often result in fluctuations in Rdif. For example, an increase in aerosol load generally leads to higher Rdif, whereas the proportion of diffuse radiation initially increases and then decreases as cloud thickness increases [79,80]. Given the well-established physical relationship between aerosols, clouds, and Rdif, we assumed that three atmospheric parameters—AOT, CLF, and COT—can be used to capture their relationship with Rdif through the RF model. To evaluate the impact of incorporating atmospheric parameters, we re-estimated Rdif without atmospheric parameters while keeping all other input variables and model parameters unchanged. Figure 13 presents a comparison of Rdif estimates with and without atmospheric parameters, validated against ground measurements. The results demonstrate a comprehensive improvement in accuracy, with R increasing from 0.946 to 0.954, RMSE decreasing from 13.37 to 12.49 W/m2, and MBE decreasing from 0.571 to 0.113 W/m2.
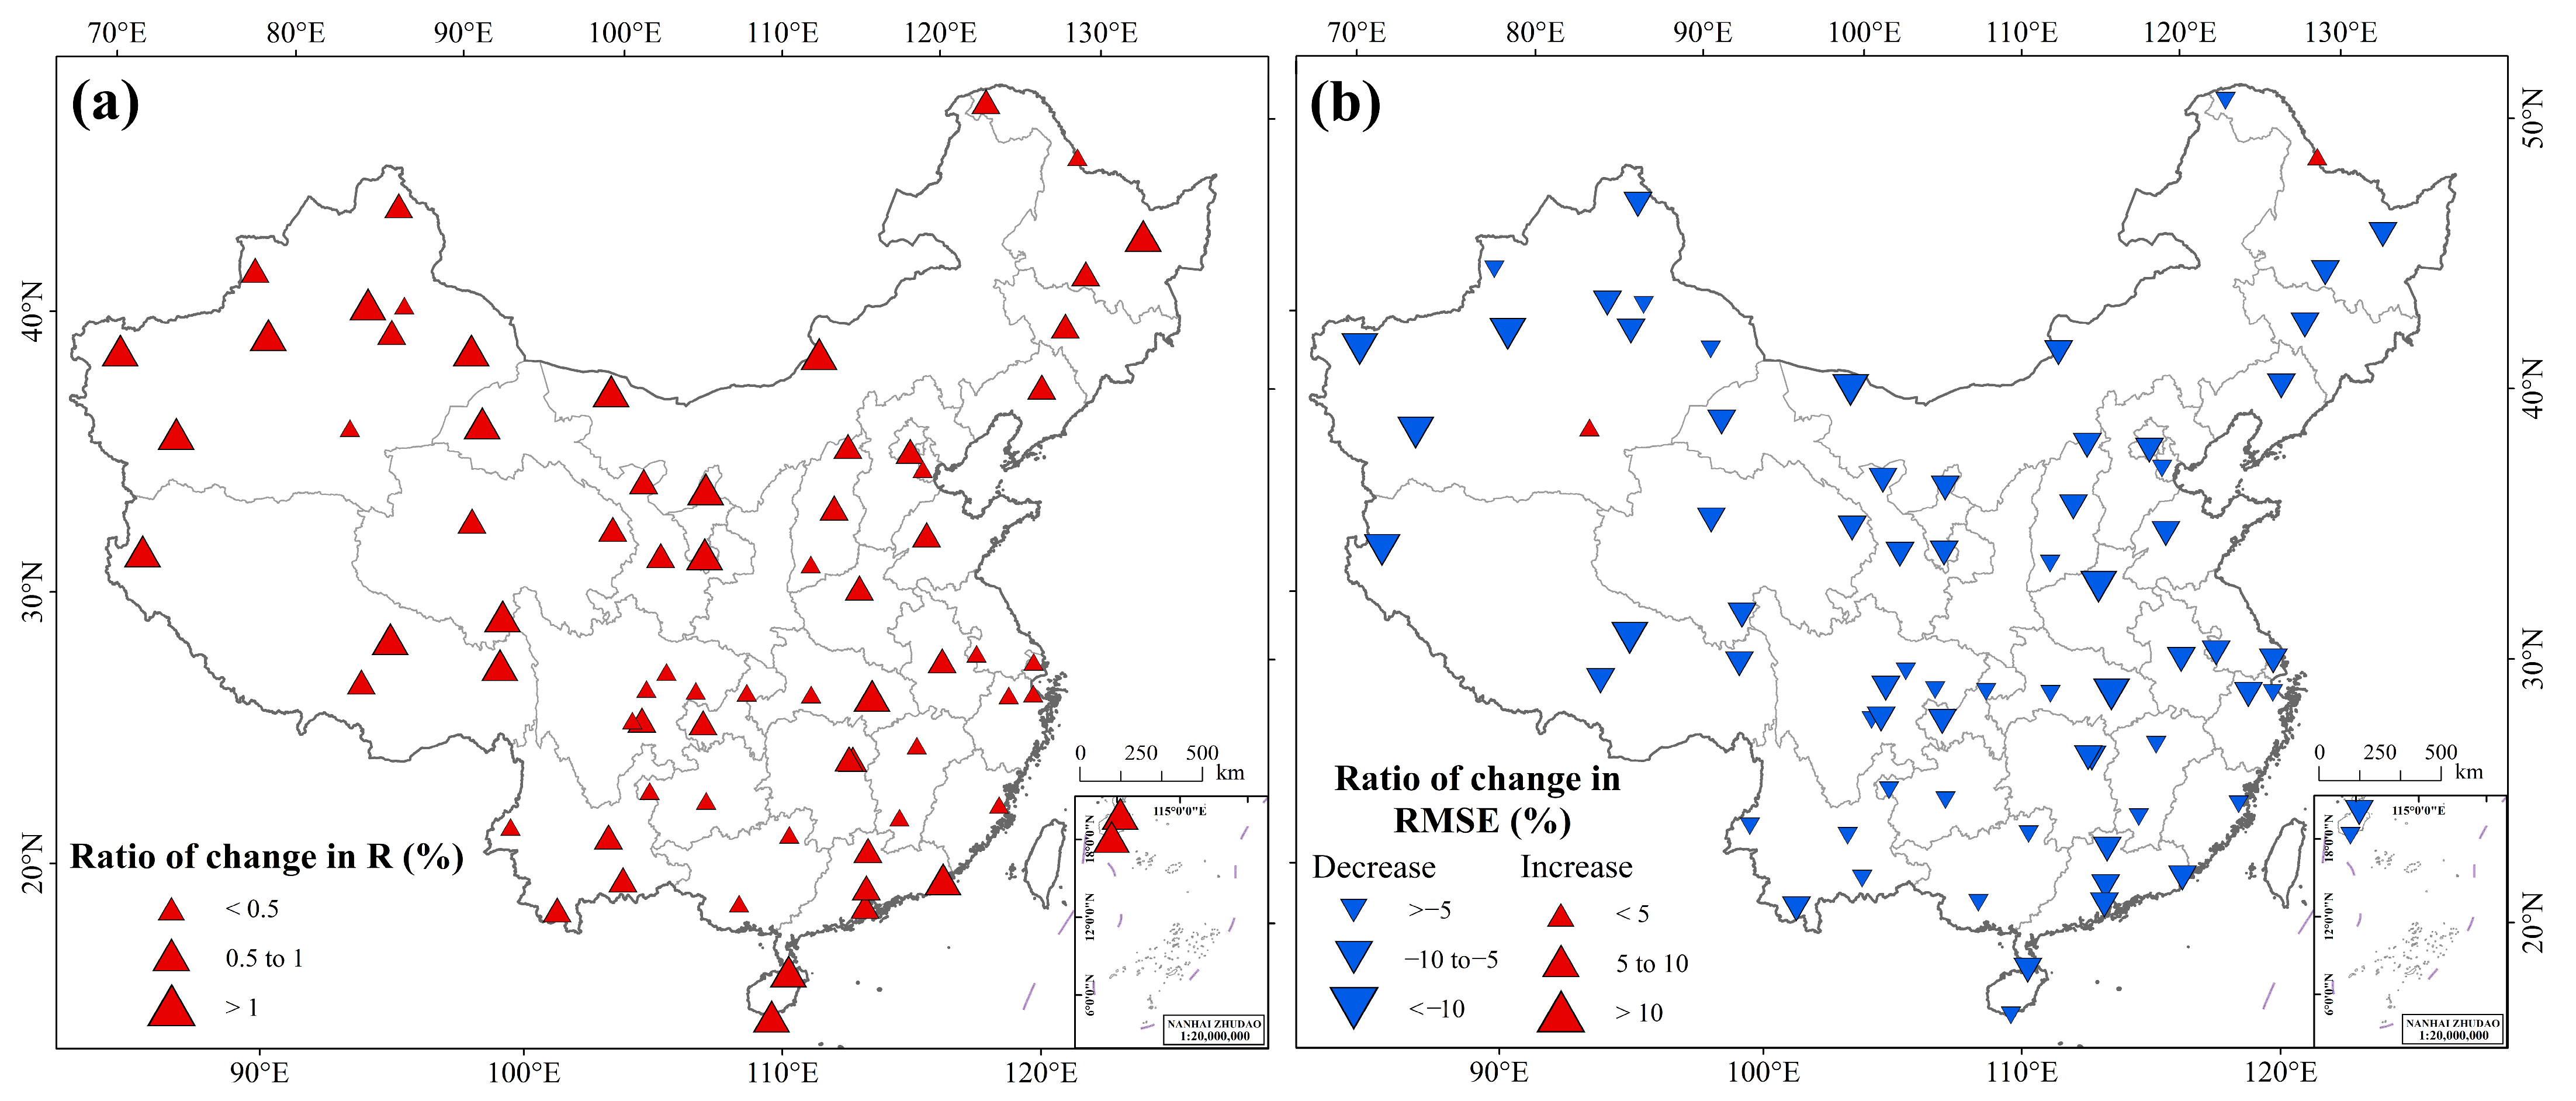
We also analyzed the impact of coupled atmospheric parameters on the training accuracy of individual stations. The impact of the improved model on the estimation accuracy was quantified by calculating the ratio of the change in R and RMSE in Figure 14. A general improvement in accuracy can be observed, with an increase in R for all 70 training stations and a decrease in RMSE for 68 stations. It is worth noting that the stations with smaller improvements are relatively densely distributed in humid areas (southern China). Provided that the surface Rdif measurements used for training pass quality inspection, this phenomenon may be attributed to the frequent cloudy conditions in southern China, which complicate the accurate characterization of relationships between atmospheric parameters and Rdif. In contrast, the prevalence of cloudless weather in northern China results in more stable and consistent variations in atmospheric parameters and Rdif, making them easier to capture. This highlights a limitation of the method—its inability to effectively learn contextual information from solar radiation time series. Recurrent neural networks, which can model temporal dynamics, present a promising solution. These findings underscore the importance of incorporating atmospheric parameters into the Rdif estimation model to enhance accuracy at both global and regional scales.

4.2. Comparison of Optimized and Latitude-Dependent Tilt Angle Schemes

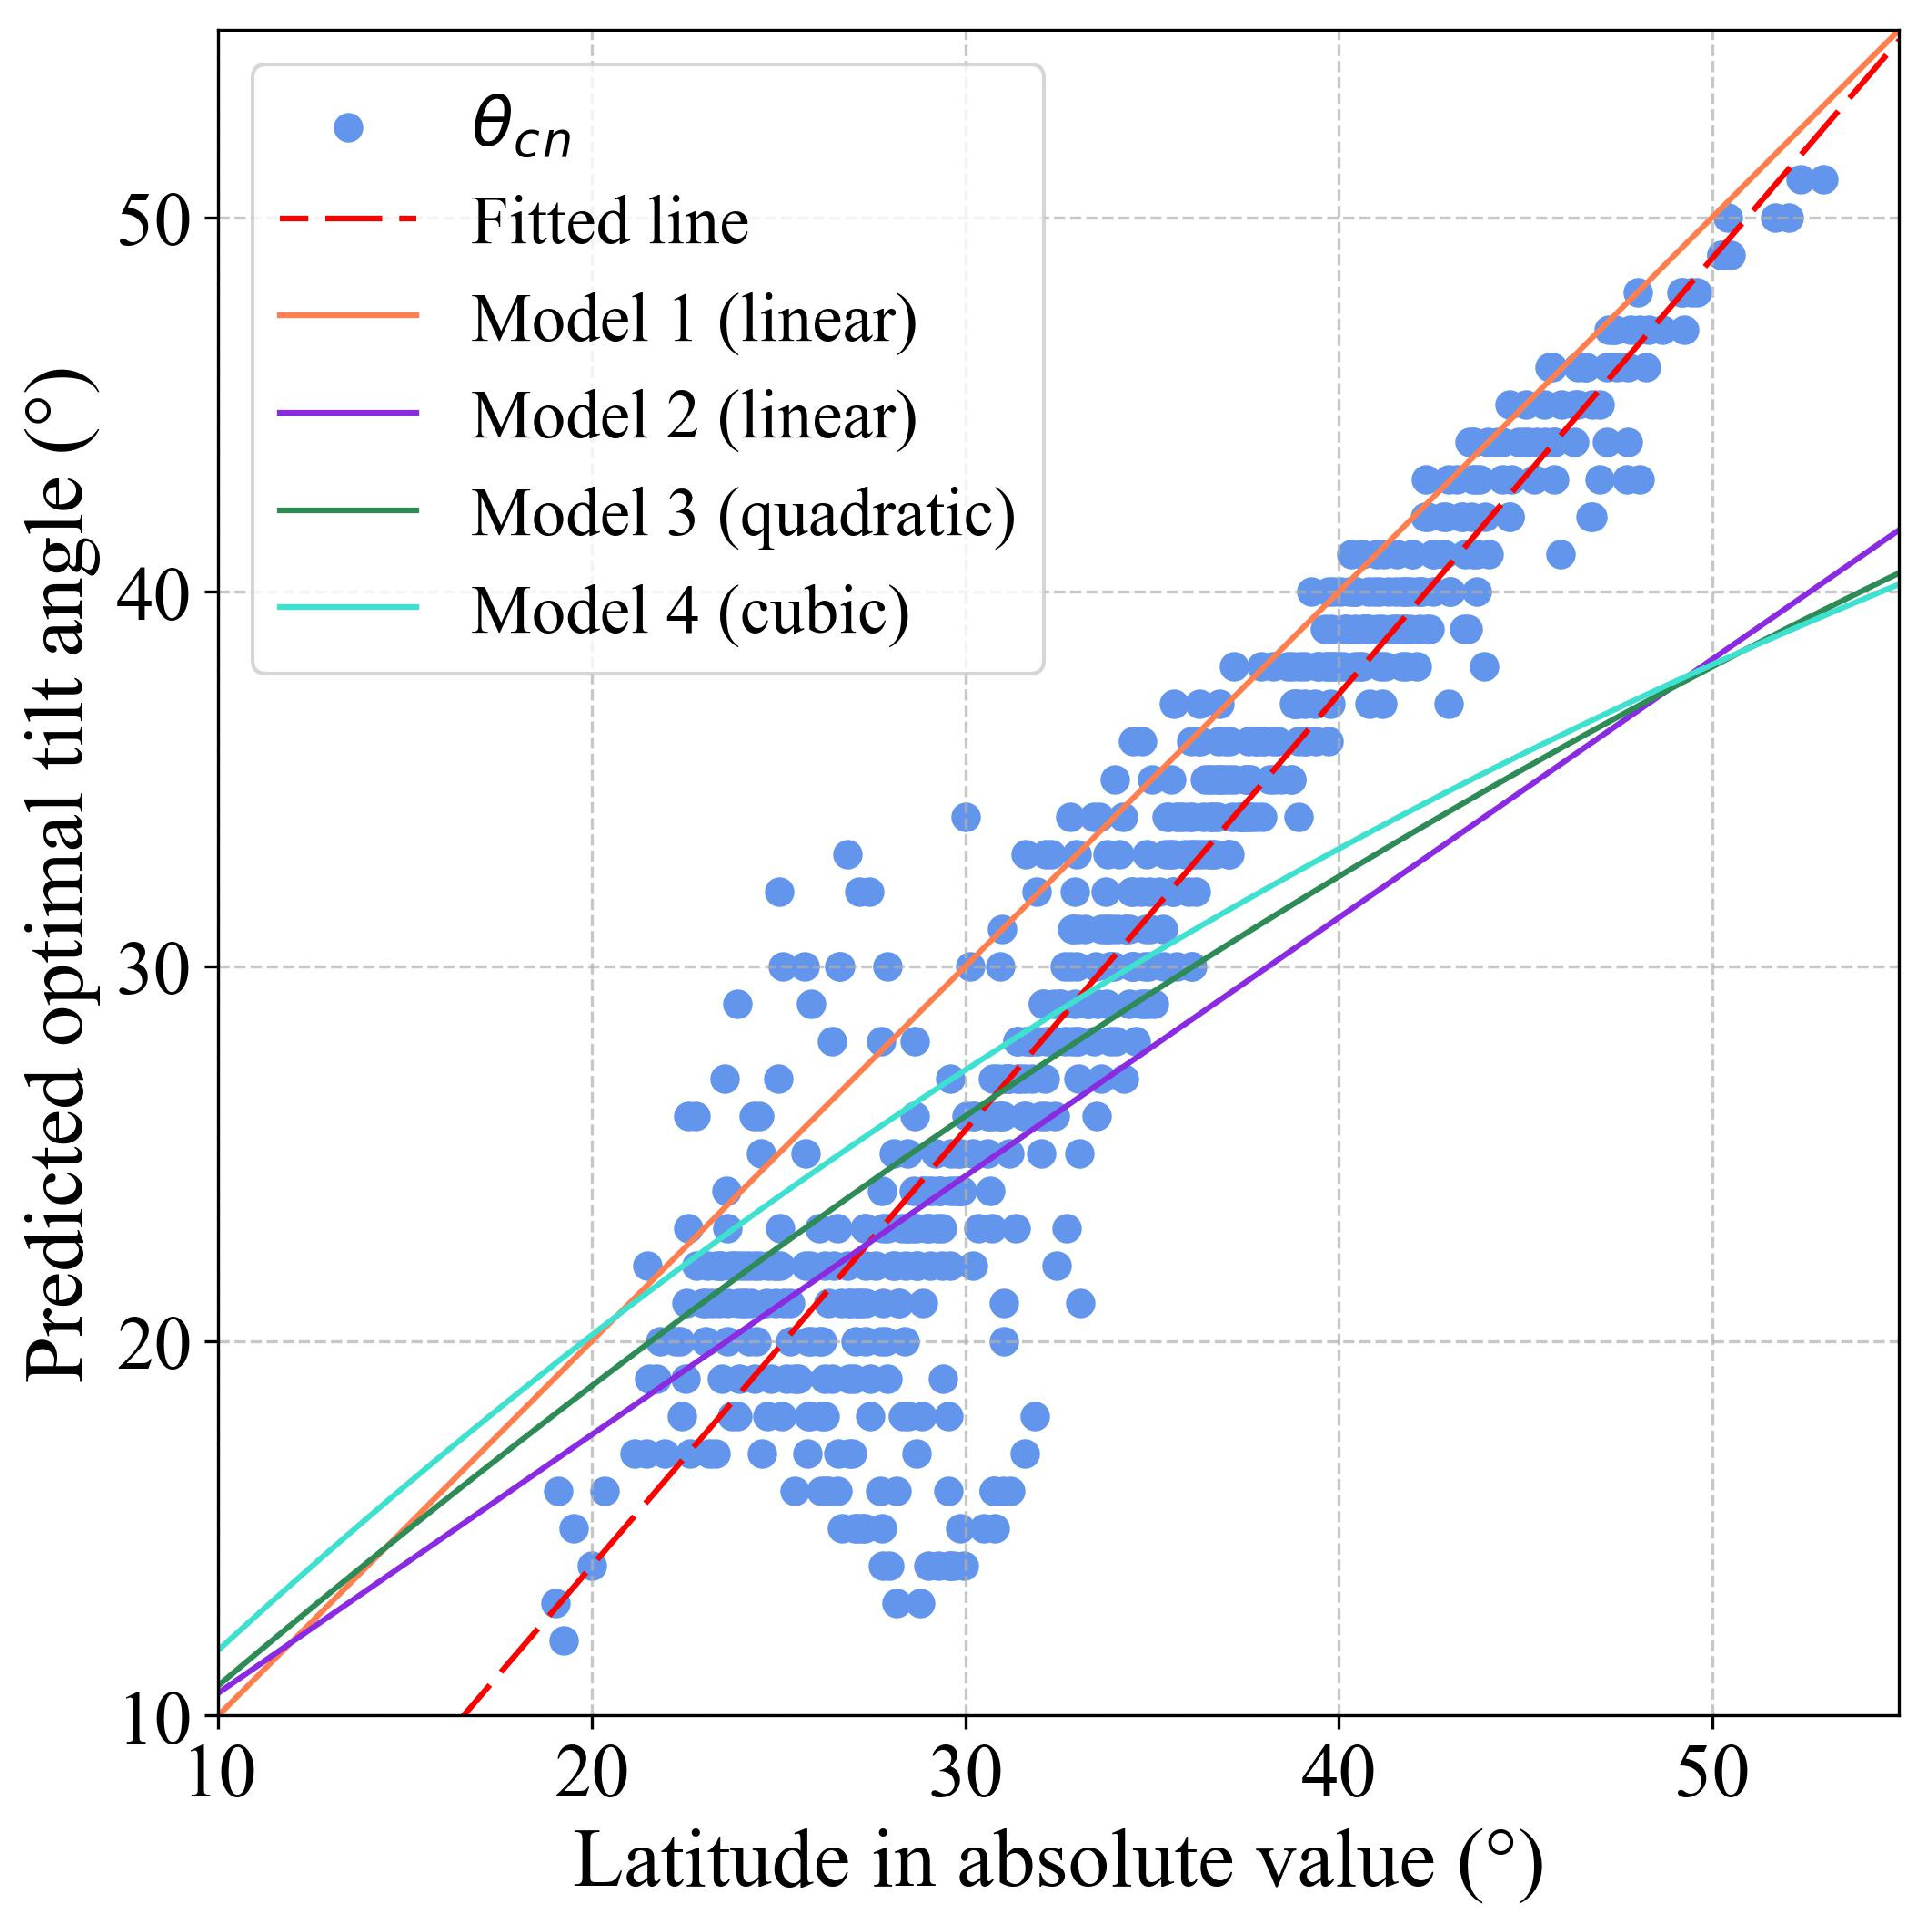
Latitude-dependent optimal tilt angle models are limited for their inability to take account for temporal patterns in solar radiation. To investigate discrepancies among different tilt angle optimization schemes, we compare θ cn with four representative latitude-dependent models (see Table 1). As can be seen from Figure 15, the optimized tilt angles are lower than the corresponding local latitudes at most stations (551 out of 609, ~90%), with the underestimation increasing toward lower latitudes. In northern China, the optimized tilt angles closely align with local latitudes, whereas in southern China, they are substantially lower. Among the latitude-dependent models, Model 1 exhibits the closest agreement with the optimized values, particularly in northern China (>40° latitude). In contrast, the other three models demonstrate relatively strong performance in southern regions (30–40° latitude) but perform poorly in northern China. Despite its relative superiority, Model 1, like the other models, severely overestimates the optimal tilt angle in the 20–30° latitude range, highlighting the systematic limitation of latitude-based approaches.
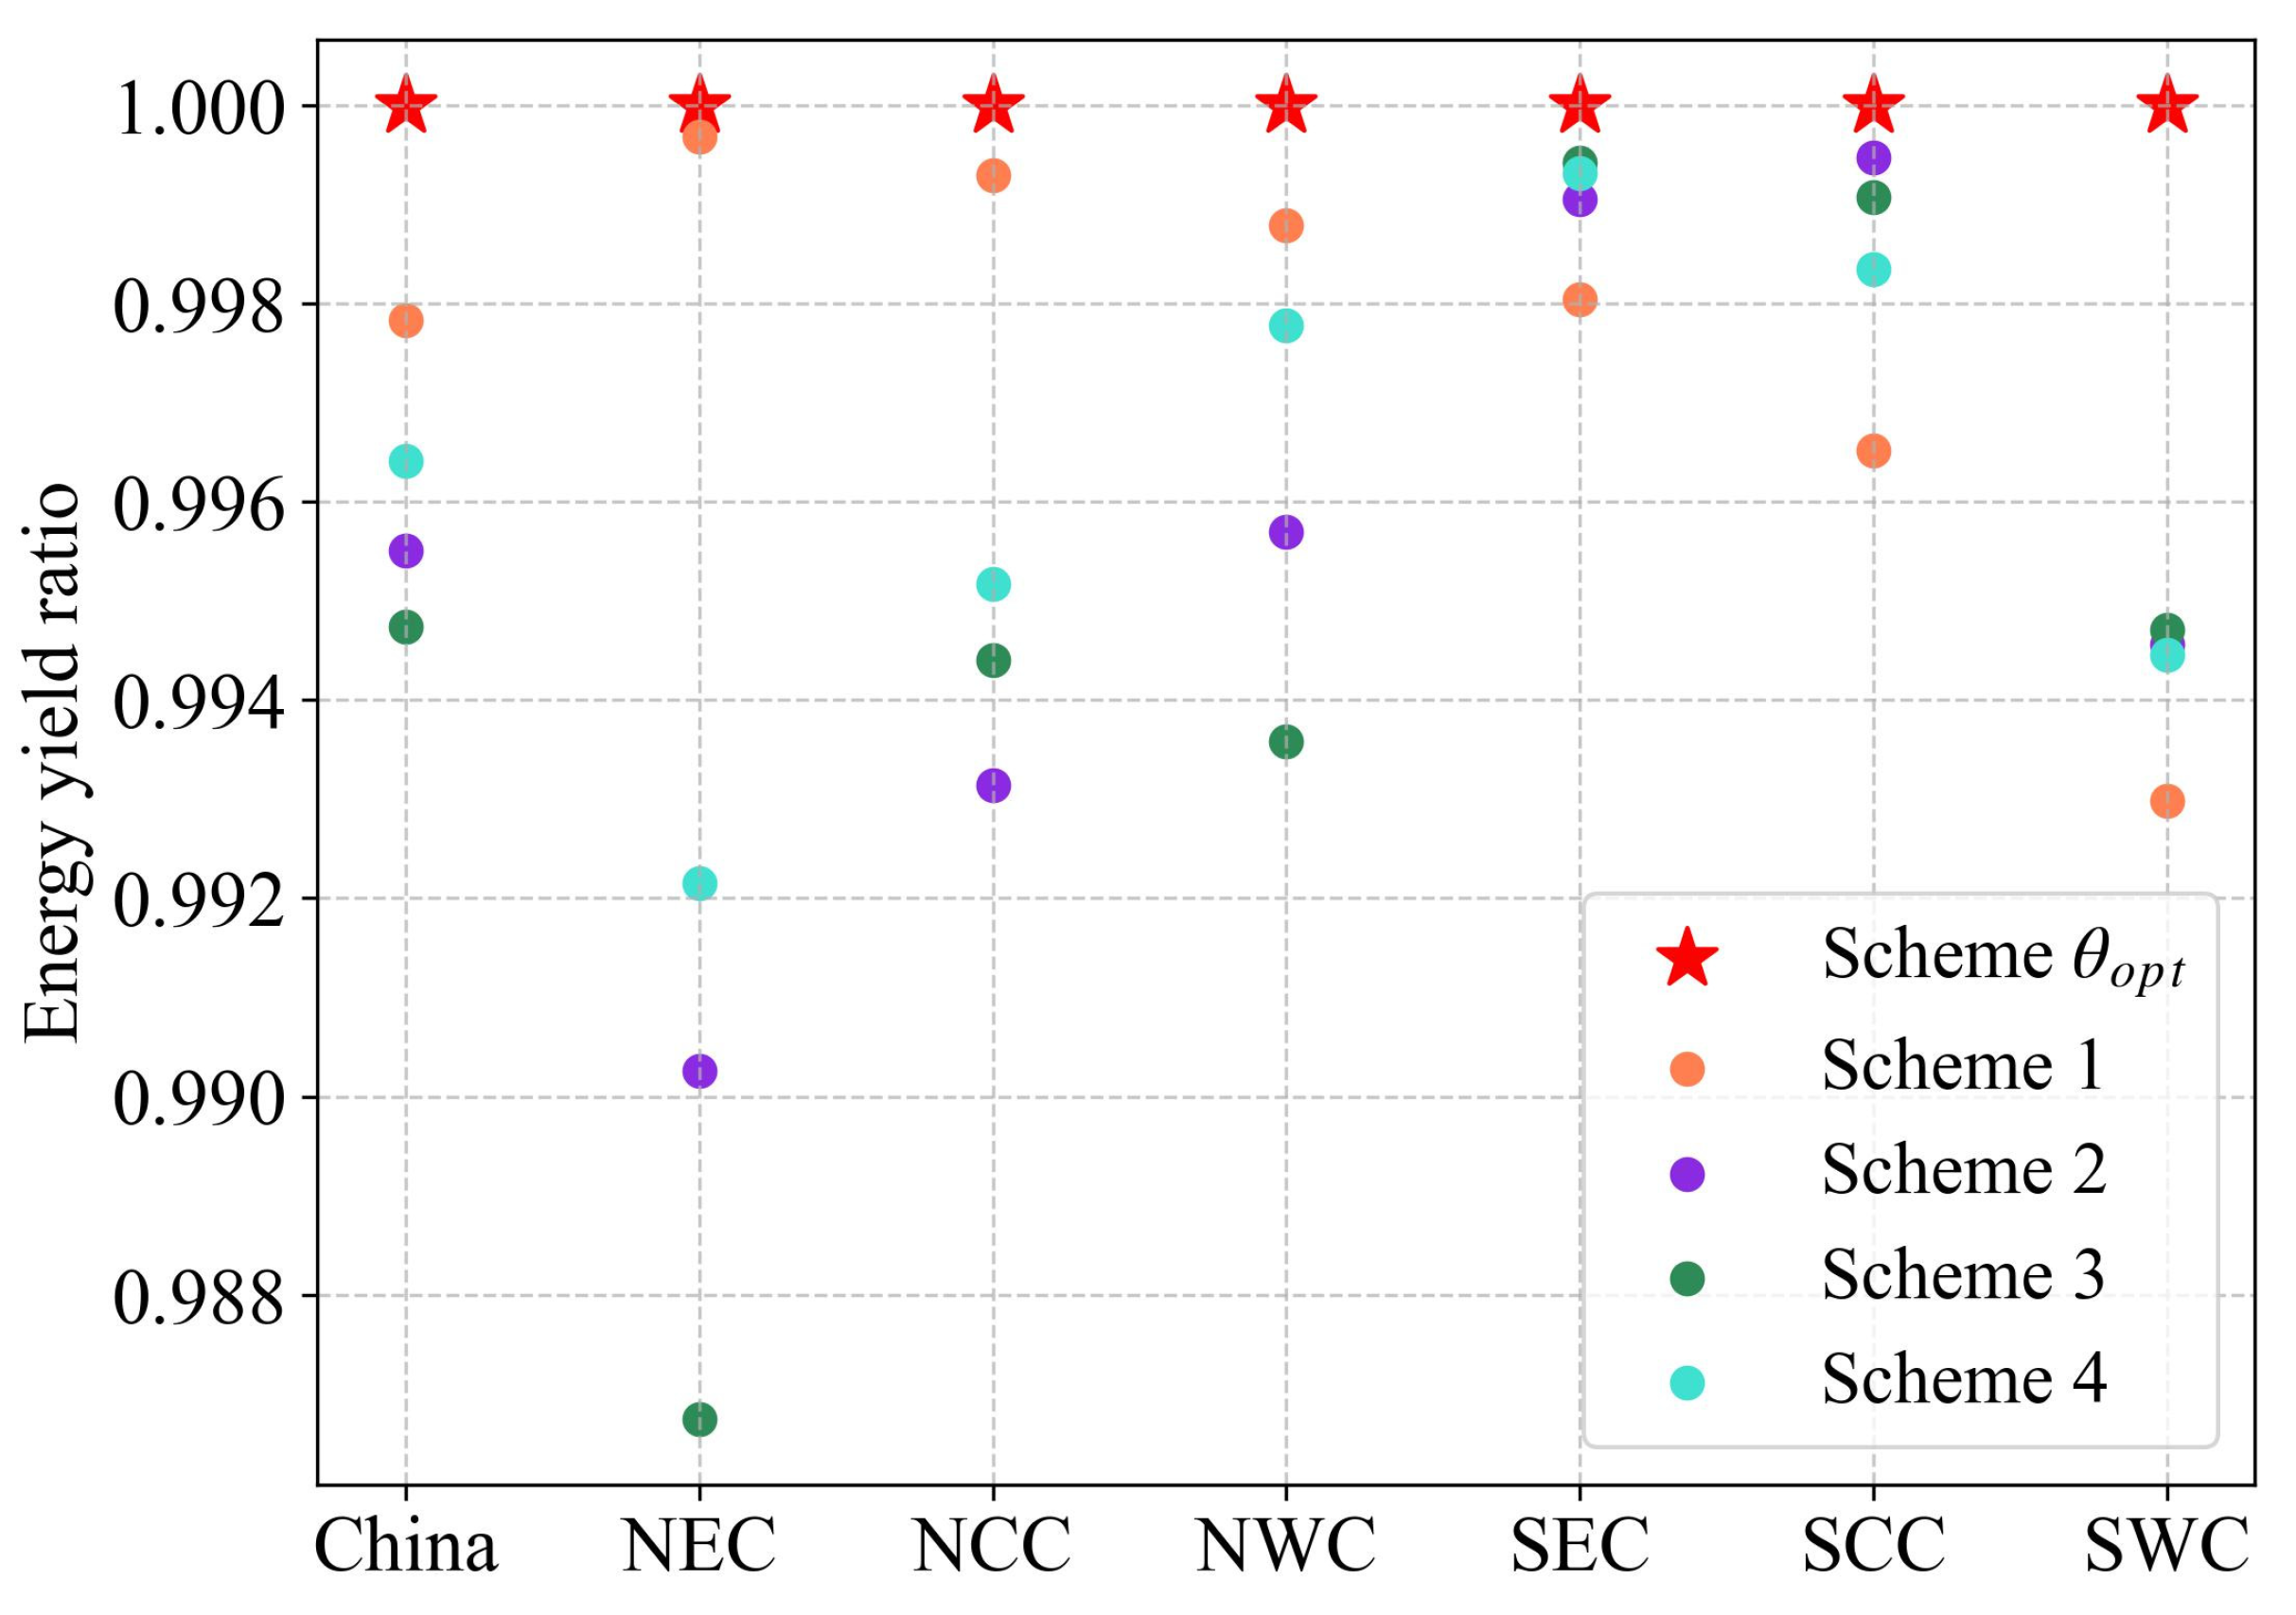
The power generation performance of various tilt angle optimization schemes across different regions of China was also investigated. To clearly display the distinction between these schemes, the annual energy yield using θ cn was used to normalize those derived from the four latitude-dependent models. In Figure 16, the optimized tilt angles result in substantially higher annual power generation across China compared to the latitude-dependent models, with the most pronounced improvements observed in the SWC region. Among the latitude-dependent models, Model 1 exhibits the best performance, followed by Models 4, 2, and 3. At the regional scale, Model 1 also achieves the best performance in northern China but underperforms in southern China relative to the other models. While latitude-dependent models demonstrate certain regional applicability, their capacity to approximate optimal tilt angles remains constrained to specific latitudinal zones. The above analysis further indicates the importance of using long-term weather data to optimize the tilt angle for maximizing the energy yield of PV systems across geographic regions.

4.3. Comparison with Previous Studies on PV Potential over China

The PV potential assessed in this study is generally consistent with previous research. In terms of spatial distribution, although different metrics have been used to quantify PV potential, all studies reveal a similar pattern, with higher potential in western and northern China and lower potential in eastern and southern China [44,47,81]. Regions of high potential are mainly located in the Qinghai–Tibet Plateau, Xinjiang, and Inner Mongolia province, whereas areas of low potential are concentrated in eastern Sichuan and Chongqing province. The long-term temporal variations in our results also show a similar trend with Sweerts et al., both with a declining trend in annual mean CF over the past few decades. However, the decline observed in our study is smaller, they found an average CF decrease from 0.162 to 0.142 (a 12% reduction), while our analysis indicates a less pronounced decline from 0.157 to 0.132 (a 6% reduction). This discrepancy may be attributed to differences in spatial coverage and assessment period length, as the previous study relied on only 119 stations, whereas our analysis includes 609 stations, likely providing better spatial representation. Seasonally, the widespread increases in PV potential during spring and general decreases in other seasons align with Song et al. [46], but the extent and severity of the declines are less pronounced in our study. This discrepancy may stem from differences in assessment periods: our study excludes the 1961–1980, during which China experiences a significant decline in Rs levels [73]. Furthermore, significant declines in PV potential are observed in northern China, highlighting the long-term impact of anthropogenic aerosol emissions in this region.

4.4. Uncertainty Analysis and Future Perspectives

The PV potential assessment framework developed in this study provides a methodological basis for analyzing both the spatial distribution and long-term temporal variations in PV potential in China. However, some uncertainties remain, mainly due to limitations in the input Rdif data and the assumption of constant PV module performance.
First, as a key input to PV models, the reconstructed Rdif data used in this study have inherent limitations. The performance of machine learning models is highly dependent on the quality of training samples. Although station-based observations are the most accurate way to obtain Rdif data, uncertainties still exist because of the anisotropic nature of Rdif [82] and quality issues in long-term records, such as station relocation and missing data [83]. Moreover, the Rdif observations used for training were derived from only 70 solar radiation stations, and this limited spatial coverage reduces the model’s ability to capture Rdif patterns across different regions of China. While the Baseline Surface Radiation Network (BSRN) [84] provides high-precision solar radiation measurements worldwide, it has only seven stations in China, which limits its usefulness at the national scale. The future establishment of a dense, high-precision Rdif observation network will be important for improving the accuracy of Rdif estimates.
The lack of consideration for PV module degradation represents another potential source of uncertainty. In our work, long-term PV power generation was estimated under the assumption of constant conversion efficiency. In reality, however, installed PV modules are subject to ongoing chemical, photochemical, and thermomechanical stresses [85], which lead to various degradation modes [86] and reduce their maximum output over time. A comprehensive review of more than 200 published studies up to 2015 reported that crystalline silicon modules have a median annual degradation rate of about 0.5–0.6% [87]. As a result, the CF values estimated in this study may be higher than those under real operating conditions. Developing quantitative models of PV module degradation in the future will be essential for producing more accurate CF estimates.

5. Conclusions

To address the challenges posed by non-renewable energy depletion and environmental pollution, China has established ambitious targets for carbon peaking and neutrality. Solar PV power generation is an important way to achieve national carbon reduction goals. Successful implementation of solar PV projects hinges on a comprehensive understanding of the spatial and temporal patterns of PV power potential, making accurate assessment essential. This study developed a comprehensive estimation framework including high-quality Rdif reconstruction, PV panel tilt angle optimization and PV power output calculation to assess the PV power potential at 609 stations in China from 1980 to 2019. The main conclusions are elucidated as follows:
(1) The daily Rdif values estimated by the proposed RF model show excellent accuracy, with overall R, RMSE and MBE of 0.954, 12.490 W/m2 and 0.113 W/m2, respectively. The developed Rdif estimation model that integrates aerosol and cloud parameters demonstrates strong scalability across various climatic regions and multi-temporal scales.
(2) The long-term temporal patterns of solar radiation influence the optimal tilt angle of PV panels. The optimization of tilt angle based on long-term weather data is essential for maximizing PV power generation. Based on China’s cumulative PV installed capacity of 609 GW in 2023, optimizing the tilt angle is projected to increase the country’s total PV energy yield by 14.9 TWh per year compared to the best-performing latitude-based tilt angle scheme.
(3) A significant negative correlation (p < 0.01) exists between the DF and the optimized tilt angles, with an R-value of −0.875. The DF-based optimal tilt angle model, developed based on this relationship, accounts for local solar radiation patterns by incorporating DF. Compared to four representative latitude-dependent models, the proposed DF-based model most accurately simulates the true optimal tilt angles.
(4) The mean annual PV power potential for China is 0.149 ± 0.031. Its spatial distribution generally follows a pattern of higher potential in northern provinces and lower potential in southern provinces. The greater PV potential in northern China can be attributed to lower ambient temperatures and abundant direct solar radiation.
(5) From 1980 to 2019, China’s annual mean PV power potential exhibited a slight but statistically insignificant decline of −7 × 10⁻⁴ per decade. Most stations showed a decreasing trend, with the most significant declines occurring in regions with severe air pollution, such as the North China Plain. This decline may be linked to rapid urbanization, which increased the concentration of anthropogenic aerosols and other pollutants.
This study has several limitations. Although 609 stations were utilized to enhance the spatial representativeness of the assessment, certain regions, such as the Qinghai–Tibet Plateau, remain underrepresented due to low station density. The combination of satellite remote sensing products or reanalysis data with high spatial coverage will help to make up for this shortcoming. Secondly, this study assumes a uniform albedo value of 0.25 for the surface beneath the PV system. However, considering the effects of varying surface albedo on POA_diffuse in real-world solar projects would further improve the accuracy of the assessment. Additionally, we used a specific PV module to estimate the PV power outputs in this research. Amidst the quick development of the PV industry, newer PV modules with stronger power generation performance have been developed. The potential assessment of PV power based on these new PV modules will become a meaningful topic. Last but not least, this assessment was only conducted using historical weather data. The question of how China’s PV power potential will change in the future remains and needs to be answered urgently.

Supplementary Materials

The following supporting information can be downloaded at: https://www.mdpi.com/article/10.3390/rs17183235/s1. Figure S1: Geographic info of provinces and elevation in China. Figure S2: Validation of the Rdif estimated by different machine learning models on training and test datasets: (a, b) extremely randomized trees model; (c, d) random forest model; (e, f) gradient boosting regression trees model. Figure S3: The seasonal mean values of CF and impact variables (direct solar radiation, diffuse solar radiation and air temperature) for different regions of China from 1980 to 2019. Table S1: Geographic info of provinces and elevation in China. Table S2: Station ID and coordinates of the four matched pairs (PVOD stations and CMA stations) based on relative distance.

Author Contributions

Conceptualization, W.Z. and X.Z.; Data curation, S.Y.; Formal analysis, W.Z. and X.Z.; Methodology, W.Z., X.Z. and S.Y.; Software, W.Z. and L.L.; Supervision, Y.D., L.L., X.H., L.B., R.J. and Y.Y.; Validation, W.Z.; Visualization, W.Z.; Writing—original draft, W.Z.; Writing—review and editing, X.Z. All authors have read and agreed to the published version of the manuscript.

Funding

This work was funded by the National Natural Science Foundation of China (Grant 42171320), the National Natural Science Foundation of China Major Program (Grant 42192584), and the Open Fund of the State Key Laboratory of Remote Sensing Science and Beijing Engineering Research Center for Global Land Remote Sensing Products (Grant OF202412).

Data Availability Statement

The data presented in this study are openly available in Zenodo at https://zenodo.org/records/15770973, accessed on 16 September 2025.

Acknowledgments

The authors gratefully acknowledge the efforts of the MERRA2 and ERA5 teams for providing data. We would also like to thank the Climate Data Center of the Chinese Meteorological Administration for providing daily meteorological and solar radiation data and the PVLIB-Python project (https://pvlib-python.readthedocs.io/en/stable/, accessed on 16 September 2025) for public codes. We are also grateful to the four anonymous reviewers and the editors for their constructive comments, which have greatly improved the completeness of this work.

Conflicts of Interest

The authors declare no conflicts of interest.

References

  1. Höök, M.; Tang, X. Depletion of Fossil Fuels and Anthropogenic Climate Change—A Review. Energy Policy 2013, 52, 797–809. [Google Scholar] [CrossRef]
  2. Sayed, E.; Olabi, A.; Alami, A.; Radwan, A.; Mdallal, A.; Rezk, A.; Abdelkareem, M. Renewable Energy and Energy Storage Systems. Energies 2023, 16, 1415. [Google Scholar] [CrossRef]
  3. Kabir, E.; Kumar, P.; Kumar, S.; Adelodun, A.A.; Kim, K.-H. Solar Energy: Potential and Future Prospects. Renew. Sustain. Energy Rev. 2018, 82, 894–900. [Google Scholar] [CrossRef]
  4. Renewable Capacity Statistics 2024. Available online: https://www.irena.org/Publications/2024/Mar/Renewable-capacity-statistics-2024 (accessed on 22 September 2024).
  5. Wang, Y.; He, J.; Chen, W. Distributed Solar Photovoltaic Development Potential and a Roadmap at the City Level in China. Renew. Sustain. Energy Rev. 2021, 141, 110772. [Google Scholar] [CrossRef]
  6. All Analysis—Analysis. Available online: https://www.iea.org/analysis (accessed on 4 June 2024).
  7. Ghosh, S.; Yadav, V.K.; Mukherjee, V.; Yadav, P. Evaluation of Relative Impact of Aerosols on Photovoltaic Cells through Combined Shannon’s Entropy and Data Envelopment Analysis (DEA). Renew. Energy 2017, 105, 344–353. [Google Scholar] [CrossRef]
  8. Gutiérrez, C.; Somot, S.; Nabat, P.; Mallet, M.; Gaertner, M.Á.; Perpiñán, O. Impact of Aerosols on the Spatiotemporal Variability of Photovoltaic Energy Production in the Euro-Mediterranean Area. Sol. Energy 2018, 174, 1142–1152. [Google Scholar] [CrossRef]
  9. Li, X.; Wagner, F.; Peng, W.; Yang, J.; Mauzerall, D.L. Reduction of Solar Photovoltaic Resources Due to Air Pollution in China. Proc. Natl. Acad. Sci. USA 2017, 114, 11867–11872. [Google Scholar] [CrossRef] [PubMed]
  10. Jiang, Y.; Yi, B. An Assessment of the Influences of Clouds on the Solar Photovoltaic Potential over China. Remote Sens. 2023, 15, 258. [Google Scholar] [CrossRef]
  11. Yang, J.; Yi, B.; Wang, S.; Liu, Y.; Li, Y. Diverse Cloud and Aerosol Impacts on Solar Photovoltaic Potential in Southern China and Northern India. Sci. Rep. 2022, 12, 19671. [Google Scholar] [CrossRef]
  12. AlSkaif, T.; Dev, S.; Visser, L.; Hossari, M.; van Sark, W. A Systematic Analysis of Meteorological Variables for PV Output Power Estimation. Renew. Energy 2020, 153, 12–22. [Google Scholar] [CrossRef]
  13. Chen, X.M.; Li, Y.; Zhao, Z.G.; Ma, T.; Wang, R.Z. General Method to Obtain Recommended Tilt and Azimuth Angles for Photovoltaic Systems Worldwide. Sol. Energy 2018, 172, 46–57. [Google Scholar] [CrossRef]
  14. Jacobson, M.Z.; Jadhav, V. World Estimates of PV Optimal Tilt Angles and Ratios of Sunlight Incident upon Tilted and Tracked PV Panels Relative to Horizontal Panels. Sol. Energy 2018, 169, 55–66. [Google Scholar] [CrossRef]
  15. Dubey, S.; Sarvaiya, J.N.; Seshadri, B. Temperature Dependent Photovoltaic (PV) Efficiency and Its Effect on PV Production in the World—A Review. Energy Procedia 2013, 33, 311–321. [Google Scholar] [CrossRef]
  16. Skoplaki, E.; Palyvos, J.A. On the Temperature Dependence of Photovoltaic Module Electrical Performance: A Review of Efficiency/Power Correlations. Sol. Energy 2009, 83, 614–624. [Google Scholar] [CrossRef]
  17. Chepp, E.D.; Krenzinger, A. A Methodology for Prediction and Assessment of Shading on PV Systems. Sol. Energy 2021, 216, 537–550. [Google Scholar] [CrossRef]
  18. Ramli, M.A.M.; Twaha, S.; Ishaque, K.; Al-Turki, Y.A. A Review on Maximum Power Point Tracking for Photovoltaic Systems with and without Shading Conditions. Renew. Sustain. Energy Rev. 2017, 67, 144–159. [Google Scholar] [CrossRef]
  19. Ghosh, S.; Kumar, A.; Ganguly, D.; Dey, S. India’s Photovoltaic Potential amidst Air Pollution and Land Constraints. Iscience 2023, 26, 107856. [Google Scholar] [CrossRef]
  20. Gunderson, I.; Goyette, S.; Gago-Silva, A.; Quiquerez, L.; Lehmann, A. Climate and Land-Use Change Impacts on Potential Solar Photovoltaic Power Generation in the Black Sea Region. Environ. Sci. Policy 2015, 46, 70–81. [Google Scholar] [CrossRef]
  21. Martín-Chivelet, N. Photovoltaic Potential and Land-Use Estimation Methodology. Energy 2016, 94, 233–242. [Google Scholar] [CrossRef]
  22. Huld, T.; Gottschalg, R.; Beyer, H.G.; Topič, M. Mapping the Performance of PV Modules, Effects of Module Type and Data Averaging. Sol. Energy 2010, 84, 324–338. [Google Scholar] [CrossRef]
  23. Tang, W.; He, J.; Qi, J.; Yang, K. A Dense Station-Based, Long-Term and High-Accuracy Dataset of Daily Surface Solar Radiation in China. Earth Syst. Sci. Data 2023, 15, 4537–4551. [Google Scholar] [CrossRef]
  24. Yang, S.; Wang, X.L.; Wild, M. Homogenization and Trend Analysis of the 1958–2016 In Situ Surface Solar Radiation Records in China. J. Clim. 2018, 31, 4529–4541. [Google Scholar] [CrossRef]
  25. Khorasanizadeh, H.; Mohammadi, K. Diffuse Solar Radiation on a Horizontal Surface: Reviewing and Categorizing the Empirical Models. Renew. Sustain. Energy Rev. 2016, 53, 338–362. [Google Scholar] [CrossRef]
  26. Zhu, T.; Li, J.; He, L.; Wu, D.; Tong, X.; Mu, Q.; Yu, Q. The Improvement and Comparison of Diffuse Radiation Models in Different Climatic Zones of China. Atmos. Res. 2021, 254, 105505. [Google Scholar] [CrossRef]
  27. López-Escalante, M.C.; Navarrete-Astorga, E.; Gabás Perez, M.; Ramos-Barrado, J.R.; Martín, F. Photovoltaic Modules Designed for Architectural Integration without Negative Performance Consequences. Appl. Energy 2020, 279, 115741. [Google Scholar] [CrossRef]
  28. Hafez, A.Z.; Soliman, A.; El-Metwally, K.A.; Ismail, I.M. Tilt and Azimuth Angles in Solar Energy Applications—A Review. Renew. Sustain. Energy Rev. 2017, 77, 147–168. [Google Scholar] [CrossRef]
  29. Yadav, A.K.; Chandel, S.S. Tilt Angle Optimization to Maximize Incident Solar Radiation: A Review. Renew. Sustain. Energy Rev. 2013, 23, 503–513. [Google Scholar] [CrossRef]
  30. de Vries, B.J.M.; van Vuuren, D.P.; Hoogwijk, M.M. Renewable Energy Sources: Their Global Potential for the First-Half of the 21st Century at a Global Level: An Integrated Approach. Energy Policy 2007, 35, 2590–2610. [Google Scholar] [CrossRef]
  31. Šúri, M.; Huld, T.A.; Dunlop, E.D.; Ossenbrink, H.A. Potential of Solar Electricity Generation in the European Union Member States and Candidate Countries. Sol. Energy 2007, 81, 1295–1305. [Google Scholar] [CrossRef]
  32. Gaiddon, B.; Jedliczka, M. Compared Assessment of Selected Environmental Indicators of Photovoltaic Electricity in OECD Cities. Int. Energy Agency Photovolt. Power Syst. Programme 2006, 11, 363–385. [Google Scholar]
  33. Kroposki, B.; Emery, K.; Myers, D.; Mrig, L. A Comparison of Photovoltaic Module Performance Evaluation Methodologies for Energy Ratings. In Proceedings of 1994 IEEE 1st World Conference on Photovoltaic Energy Conversion-WCPEC (A Joint Conference of PVSC, PVSEC and PSEC), Waikoloa, HI, USA, 5–9 December 1994; Volume 1, pp. 858–862. [Google Scholar]
  34. Bessho, K.; Date, K.; Hayashi, M.; Ikeda, A.; Imai, T.; Inoue, H.; Kumagai, Y.; Miyakawa, T.; Murata, H.; Ohno, T.; et al. An Introduction to Himawari-8/9—Japan’s New-Generation Geostationary Meteorological Satellites. J. Meteorol. Soc. Japan. Ser. II 2016, 94, 151–183. [Google Scholar] [CrossRef]
  35. Min, M.; Wu, C.; Li, C.; Liu, H.; Xu, N.; Wu, X.; Chen, L.; Wang, F.; Sun, F.; Qin, D.; et al. Developing the Science Product Algorithm Testbed for Chinese Next-Generation Geostationary Meteorological Satellites: Fengyun-4 Series. J. Meteorol. Res. 2017, 31, 708–719. [Google Scholar] [CrossRef]
  36. Gelaro, R.; McCarty, W.; Suárez, M.J.; Todling, R.; Molod, A.; Takacs, L.; Randles, C.A.; Darmenov, A.; Bosilovich, M.G.; Reichle, R.; et al. The Modern-Era Retrospective Analysis for Research and Applications, Version 2 (MERRA-2). J. Clim. 2017, 30, 5419–5454. [Google Scholar] [CrossRef]
  37. Hersbach, H.; Bell, B.; Berrisford, P.; Hirahara, S.; Horányi, A.; Muñoz-Sabater, J.; Nicolas, J.; Peubey, C.; Radu, R.; Schepers, D.; et al. The ERA5 Global Reanalysis. Quart. J. R. Meteoro Soc. 2020, 146, 1999–2049. [Google Scholar] [CrossRef]
  38. Zhang, H.; Cao, Y.; Zhang, Y.; Terzija, V. Quantitative Synergy Assessment of Regional Wind-Solar Energy Resources Based on MERRA Reanalysis Data. Appl. Energy 2018, 216, 172–182. [Google Scholar] [CrossRef]
  39. Magaña-González, R.C.; Rodríguez-Hernández, O.; Canul-Reyes, D.A. Analysis of Seasonal Variability and Complementarity of Wind and Solar Resources in Mexico. Sustain. Energy Technol. Assess. 2023, 60, 103456. [Google Scholar] [CrossRef]
  40. Sterl, S.; Liersch, S.; Koch, H.; van Lipzig, N.P.M.; Thiery, W. A New Approach for Assessing Synergies of Solar and Wind Power: Implications for West Africa. Environ. Res. Lett. 2018, 13, 094009. [Google Scholar] [CrossRef]
  41. Ramirez Camargo, L.; Schmidt, J. Simulation of Multi-Annual Time Series of Solar Photovoltaic Power: Is the ERA5-Land Reanalysis the next Big Step? Sustain. Energy Technol. Assess. 2020, 42, 100829. [Google Scholar] [CrossRef]
  42. Pfenninger, S.; Staffell, I. Long-Term Patterns of European PV Output Using 30 Years of Validated Hourly Reanalysis and Satellite Data. Energy 2016, 114, 1251–1265. [Google Scholar] [CrossRef]
  43. Jiang, H.; Yang, Y.; Bai, Y.; Wang, H. Evaluation of the Total, Direct, and Diffuse Solar Radiations From the ERA5 Reanalysis Data in China. IEEE Geosci. Remote Sens. Lett. 2020, 17, 47–51. [Google Scholar] [CrossRef]
  44. Qiu, T.; Wang, L.; Lu, Y.; Zhang, M.; Qin, W.; Wang, S.; Wang, L. Potential Assessment of Photovoltaic Power Generation in China. Renew. Sustain. Energy Rev. 2022, 154, 111900. [Google Scholar] [CrossRef]
  45. Sweerts, B.; Pfenninger, S.; Yang, S.; Folini, D.; Van Der Zwaan, B.; Wild, M. Estimation of Losses in Solar Energy Production from Air Pollution in China Since 1960 Using Surface Radiation Data. Nat. Energy 2019, 4, 657–663. [Google Scholar] [CrossRef]
  46. Song, Z.; Cao, S.; Yang, H. Assessment of Solar Radiation Resource and Photovoltaic Power Potential across China Based on Optimized Interpretable Machine Learning Model and GIS-Based Approaches. Appl. Energy 2023, 339, 121005. [Google Scholar] [CrossRef]
  47. Tang, W.; Qi, J.; Wang, Y.; He, J. Dense Station-Based Potential Assessment for Solar Photovoltaic Generation in China. J. Clean. Prod. 2023, 414, 137607. [Google Scholar] [CrossRef]
  48. Hou, N.; Zhang, X.; Zhang, W.; Xu, J.; Feng, C.; Yang, S.; Jia, K.; Yao, Y.; Cheng, J.; Jiang, B. A New Long-Term Downward Surface Solar Radiation Dataset over China from 1958 to 2015. Sensors 2020, 20, 6167. [Google Scholar] [CrossRef]
  49. Breiman, L. Random Forests. Mach. Learn. 2001, 45, 5–32. [Google Scholar] [CrossRef]
  50. Benali, L.; Notton, G.; Fouilloy, A.; Voyant, C.; Dizene, R. Solar Radiation Forecasting Using Artificial Neural Network and Random Forest Methods: Application to Normal Beam, Horizontal Diffuse and Global Components. Renew. Energy 2019, 132, 871–884. [Google Scholar] [CrossRef]
  51. Hassan, M.A.; Khalil, A.; Kaseb, S.; Kassem, M.A. Exploring the Potential of Tree-Based Ensemble Methods in Solar Radiation Modeling. Appl. Energy 2017, 203, 897–916. [Google Scholar] [CrossRef]
  52. Husain, S.; Khan, U.A. Machine Learning Models to Predict Diffuse Solar Radiation Based on Diffuse Fraction and Diffusion Coefficient Models for Humid-Subtropical Climatic Zone of India. Clean. Eng. Technol. 2021, 5, 100262. [Google Scholar] [CrossRef]
  53. Benghanem, M.; Mellit, A.; Alamri, S.N. ANN-Based Modelling and Estimation of Daily Global Solar Radiation Data: A Case Study. Energy Convers. Manag. 2009, 50, 1644–1655. [Google Scholar] [CrossRef]
  54. Yadav, A.K.; Chandel, S.S. Solar Radiation Prediction Using Artificial Neural Network Techniques: A Review. Renew. Sustain. Energy Rev. 2014, 33, 772–781. [Google Scholar] [CrossRef]
  55. Lu, N.; Qin, J. Optimization of Tilt Angle for PV in China with Long-Term Hourly Surface Solar Radiation. Renew. Energy 2024, 229, 120741. [Google Scholar] [CrossRef]
  56. Müller, J.; Folini, D.; Wild, M.; Pfenninger, S. CMIP-5 Models Project Photovoltaics Are a No-Regrets Investment in Europe Irrespective of Climate Change. Energy 2019, 171, 135–148. [Google Scholar] [CrossRef]
  57. Stein, J.S.; Holmgren, W.F.; Forbess, J.; Hansen, C.W. PVLIB: Open Source Photovoltaic Performance Modeling Functions for Matlab and Python. In Proceedings of the 2016 IEEE 43rd Photovoltaic Specialists Conference (PVSC), Portland, OR, USA, 5–10 June 2016; pp. 3425–3430. [Google Scholar]
  58. Pvlib.Irradiance—Pvlib Python 0.11.2 Documentation. Available online: https://pvlib-python.readthedocs.io/en/v0.11.2/_modules/pvlib/irradiance.html#get_total_irradiance (accessed on 31 August 2025).
  59. Li, X.; Mauzerall, D.L.; Bergin, M.H. Global Reduction of Solar Power Generation Efficiency Due to Aerosols and Panel Soiling. Nat. Sustain. 2020, 3, 720–727. [Google Scholar] [CrossRef]
  60. Feng, Y.; Cui, N.; Zhang, Q.; Zhao, L.; Gong, D. Comparison of Artificial Intelligence and Empirical Models for Estimation of Daily Diffuse Solar Radiation in North China Plain. Int. J. Hydrogen Energy 2017, 42, 14418–14428. [Google Scholar] [CrossRef]
  61. Jia, D.; Yang, L.; Lv, T.; Liu, W.; Gao, X.; Zhou, J. Evaluation of Machine Learning Models for Predicting Daily Global and Diffuse Solar Radiation under Different Weather/Pollution Conditions. Renew. Energy 2022, 187, 896–906. [Google Scholar] [CrossRef]
  62. Jiang, H.; Yang, Y.; Wang, H.; Bai, Y.; Bai, Y. Surface Diffuse Solar Radiation Determined by Reanalysis and Satellite over East Asia: Evaluation and Comparison. Remote Sens. 2020, 12, 1387. [Google Scholar] [CrossRef]
  63. Jiang, H.; Lu, N.; Qin, J.; Yao, L. Hourly 5-Km Surface Total and Diffuse Solar Radiation in China, 2007–2018. Sci. Data 2020, 7, 311. [Google Scholar] [CrossRef] [PubMed]
  64. Qi, Q.; Wu, J.; Gueymard, C.A.; Qin, W.; Wang, L.; Zhou, Z.; Niu, J.; Zhang, M. Mapping of 10-Km Daily Diffuse Solar Radiation across China from Reanalysis Data and a Machine-Learning Method. Sci. Data 2024, 11, 756. [Google Scholar] [CrossRef]
  65. Yao, T.; Wang, J.; Wu, H.; Zhang, P.; Li, S.; Wang, Y.; Chi, X.; Shi, M. A Photovoltaic Power Output Dataset: Multi-Source Photovoltaic Power Output Dataset with Python Toolkit. Sol. Energy 2021, 230, 122–130. [Google Scholar] [CrossRef]
  66. GOPINATHAN, K.K. Optimization of Tilt Angle of Solar Collectors for Maximum Irradiation on Sloping Surfaces. Int. J. Sol. Energy 1991, 10, 51–61. [Google Scholar] [CrossRef]
  67. Luque, A.; Hegedus, S. Handbook of Photovoltaic Science and Engineering; John Wiley & Sons: Hoboken, NJ, USA, 2011; ISBN 978-0-470-97612-8. [Google Scholar]
  68. Santos-Martin, D.; Lemon, S. SoL—A PV Generation Model for Grid Integration Analysis in Distribution Networks. Sol. Energy 2015, 120, 549–564. [Google Scholar] [CrossRef]
  69. Chinchilla, M.; Santos-Martín, D.; Carpintero-Rentería, M.; Lemon, S. Worldwide Annual Optimum Tilt Angle Model for Solar Collectors and Photovoltaic Systems in the Absence of Site Meteorological Data. Appl. Energy 2021, 281, 116056. [Google Scholar] [CrossRef]
  70. van Donkelaar, A.; Martin, R.V.; Brauer, M.; Kahn, R.; Levy, R.; Verduzco, C.; Villeneuve, P.J. Global Estimates of Ambient Fine Particulate Matter Concentrations from Satellite-Based Aerosol Optical Depth: Development and Application. Environ. Health Perspect. 2010, 118, 847–855. [Google Scholar] [CrossRef]
  71. Zhao, S.; Yu, Y.; Yin, D.; He, J.; Liu, N.; Qu, J.; Xiao, J. Annual and Diurnal Variations of Gaseous and Particulate Pollutants in 31 Provincial Capital Cities Based on in Situ Air Quality Monitoring Data from China National Environmental Monitoring Center. Environ. Int. 2016, 86, 92–106. [Google Scholar] [CrossRef]
  72. Wild, M.; Gilgen, H.; Roesch, A.; Ohmura, A.; Long, C.N.; Dutton, E.G.; Forgan, B.; Kallis, A.; Russak, V.; Tsvetkov, A. From Dimming to Brightening: Decadal Changes in Solar Radiation at Earth’s Surface. Science 2005, 308, 847–850. [Google Scholar] [CrossRef]
  73. He, Y.; Wang, K.; Zhou, C.; Wild, M. A Revisit of Global Dimming and Brightening Based on the Sunshine Duration. Geophys. Res. Lett. 2018, 45, 4281–4289. [Google Scholar] [CrossRef]
  74. Zhang, Q.; Zheng, Y.; Tong, D.; Shao, M.; Wang, S.; Zhang, Y.; Xu, X.; Wang, J.; He, H.; Liu, W.; et al. Drivers of Improved PM2.5 Air Quality in China from 2013 to 2017. Proc. Natl. Acad. Sci. USA 2019, 116, 24463–24469. [Google Scholar] [CrossRef] [PubMed]
  75. Zhao, H.; Chen, K.; Liu, Z.; Zhang, Y.; Shao, T.; Zhang, H. Coordinated Control of PM2.5 and O3 Is Urgently Needed in China after Implementation of the “Air Pollution Prevention and Control Action Plan”. Chemosphere 2021, 270, 129441. [Google Scholar] [CrossRef]
  76. Zhang, Y.; Qin, W.; Wang, L.; Yang, C.; Su, X.; Wu, J. Enhancement of Photovoltaic Power Potential in China from 2010 to 2020: The Contribution of Air Pollution Control Policies. Remote Sens. 2023, 15, 228. [Google Scholar] [CrossRef]
  77. Gernaat, D.E.H.J.; de Boer, H.S.; Daioglou, V.; Yalew, S.G.; Müller, C.; van Vuuren, D.P. Climate Change Impacts on Renewable Energy Supply. Nat. Clim. Change 2021, 11, 119–125. [Google Scholar] [CrossRef]
  78. Tang, W.; He, J.; Shao, C.; Song, J.; Yuan, Z.; Yan, B. Constructing a Long-Term Global Dataset of Direct and Diffuse Radiation (10 Km, 3 h, 1983–2018) Separating from the Satellite-Based Estimates of Global Radiation. Remote Sens. Environ. 2024, 311, 114292. [Google Scholar] [CrossRef]
  79. Li, H.; Zhang, M.; Wang, L.; Lu, Y.; Yu, L.; Ma, Y.; Gong, W. Effects of Aerosol on Downward Diffuse Radiation under Blowing Dust and Haze Conditions. Atmos. Environ. 2024, 334, 120682. [Google Scholar] [CrossRef]
  80. Pfister, G.; McKenzie, R.L.; Liley, J.B.; Thomas, A.; Forgan, B.W.; Long, C.N. Cloud Coverage Based on All-Sky Imaging and Its Impact on Surface Solar Irradiance. J. Appl. Meteorol. Climatol. 2003, 42, 1421–1434. [Google Scholar] [CrossRef]
  81. Feng, Y.; Zhang, X.; Jia, Y.; Cui, N.; Hao, W.; Li, H.; Gong, D. High-Resolution Assessment of Solar Radiation and Energy Potential in China. Energy Convers. Manag. 2021, 240, 114265. [Google Scholar] [CrossRef]
  82. Jamil, B.; Siddiqui, A.T. Generalized Models for Estimation of Diffuse Solar Radiation Based on Clearness Index and Sunshine Duration in India: Applicability under Different Climatic Zones. J. Atmos. Sol.-Terr. Phys. 2017, 157–158, 16–34. [Google Scholar] [CrossRef]
  83. Yang, L.; Cao, Q.; Yu, Y.; Liu, Y. Comparison of Daily Diffuse Radiation Models in Regions of China without Solar Radiation Measurement. Energy 2020, 191, 116571. [Google Scholar] [CrossRef]
  84. Driemel, A.; Augustine, J.; Behrens, K.; Colle, S.; Cox, C.; Cuevas-Agulló, E.; Denn, F.M.; Duprat, T.; Fukuda, M.; Grobe, H.; et al. Baseline Surface Radiation Network (BSRN): Structure and Data Description (1992–2017). Earth Syst. Sci. Data 2018, 10, 1491–1501. [Google Scholar] [CrossRef]
  85. Ullah Khan, Z.; Daud Khan, A.; Khan, K.; Abdul Karim Al Khatib, S.; Khan, S.; Qasim Khan, M.; Ullah, A. A Review of Degradation and Reliability Analysis of a Solar PV Module. IEEE Access 2024, 12, 185036–185056. [Google Scholar] [CrossRef]
  86. Kaaya, I.; Koehl, M.; Mehilli, A.P.; de Cardona Mariano, S.; Weiss, K.A. Modeling Outdoor Service Lifetime Prediction of PV Modules: Effects of Combined Climatic Stressors on PV Module Power Degradation. IEEE J. Photovolt. 2019, 9, 1105–1112. [Google Scholar] [CrossRef]
  87. Jordan, D.C.; Kurtz, S.R.; VanSant, K.; Newmiller, J. Compendium of Photovoltaic Degradation Rates. Prog. Photovolt. Res. Appl. 2016, 24, 978–989. [Google Scholar] [CrossRef]
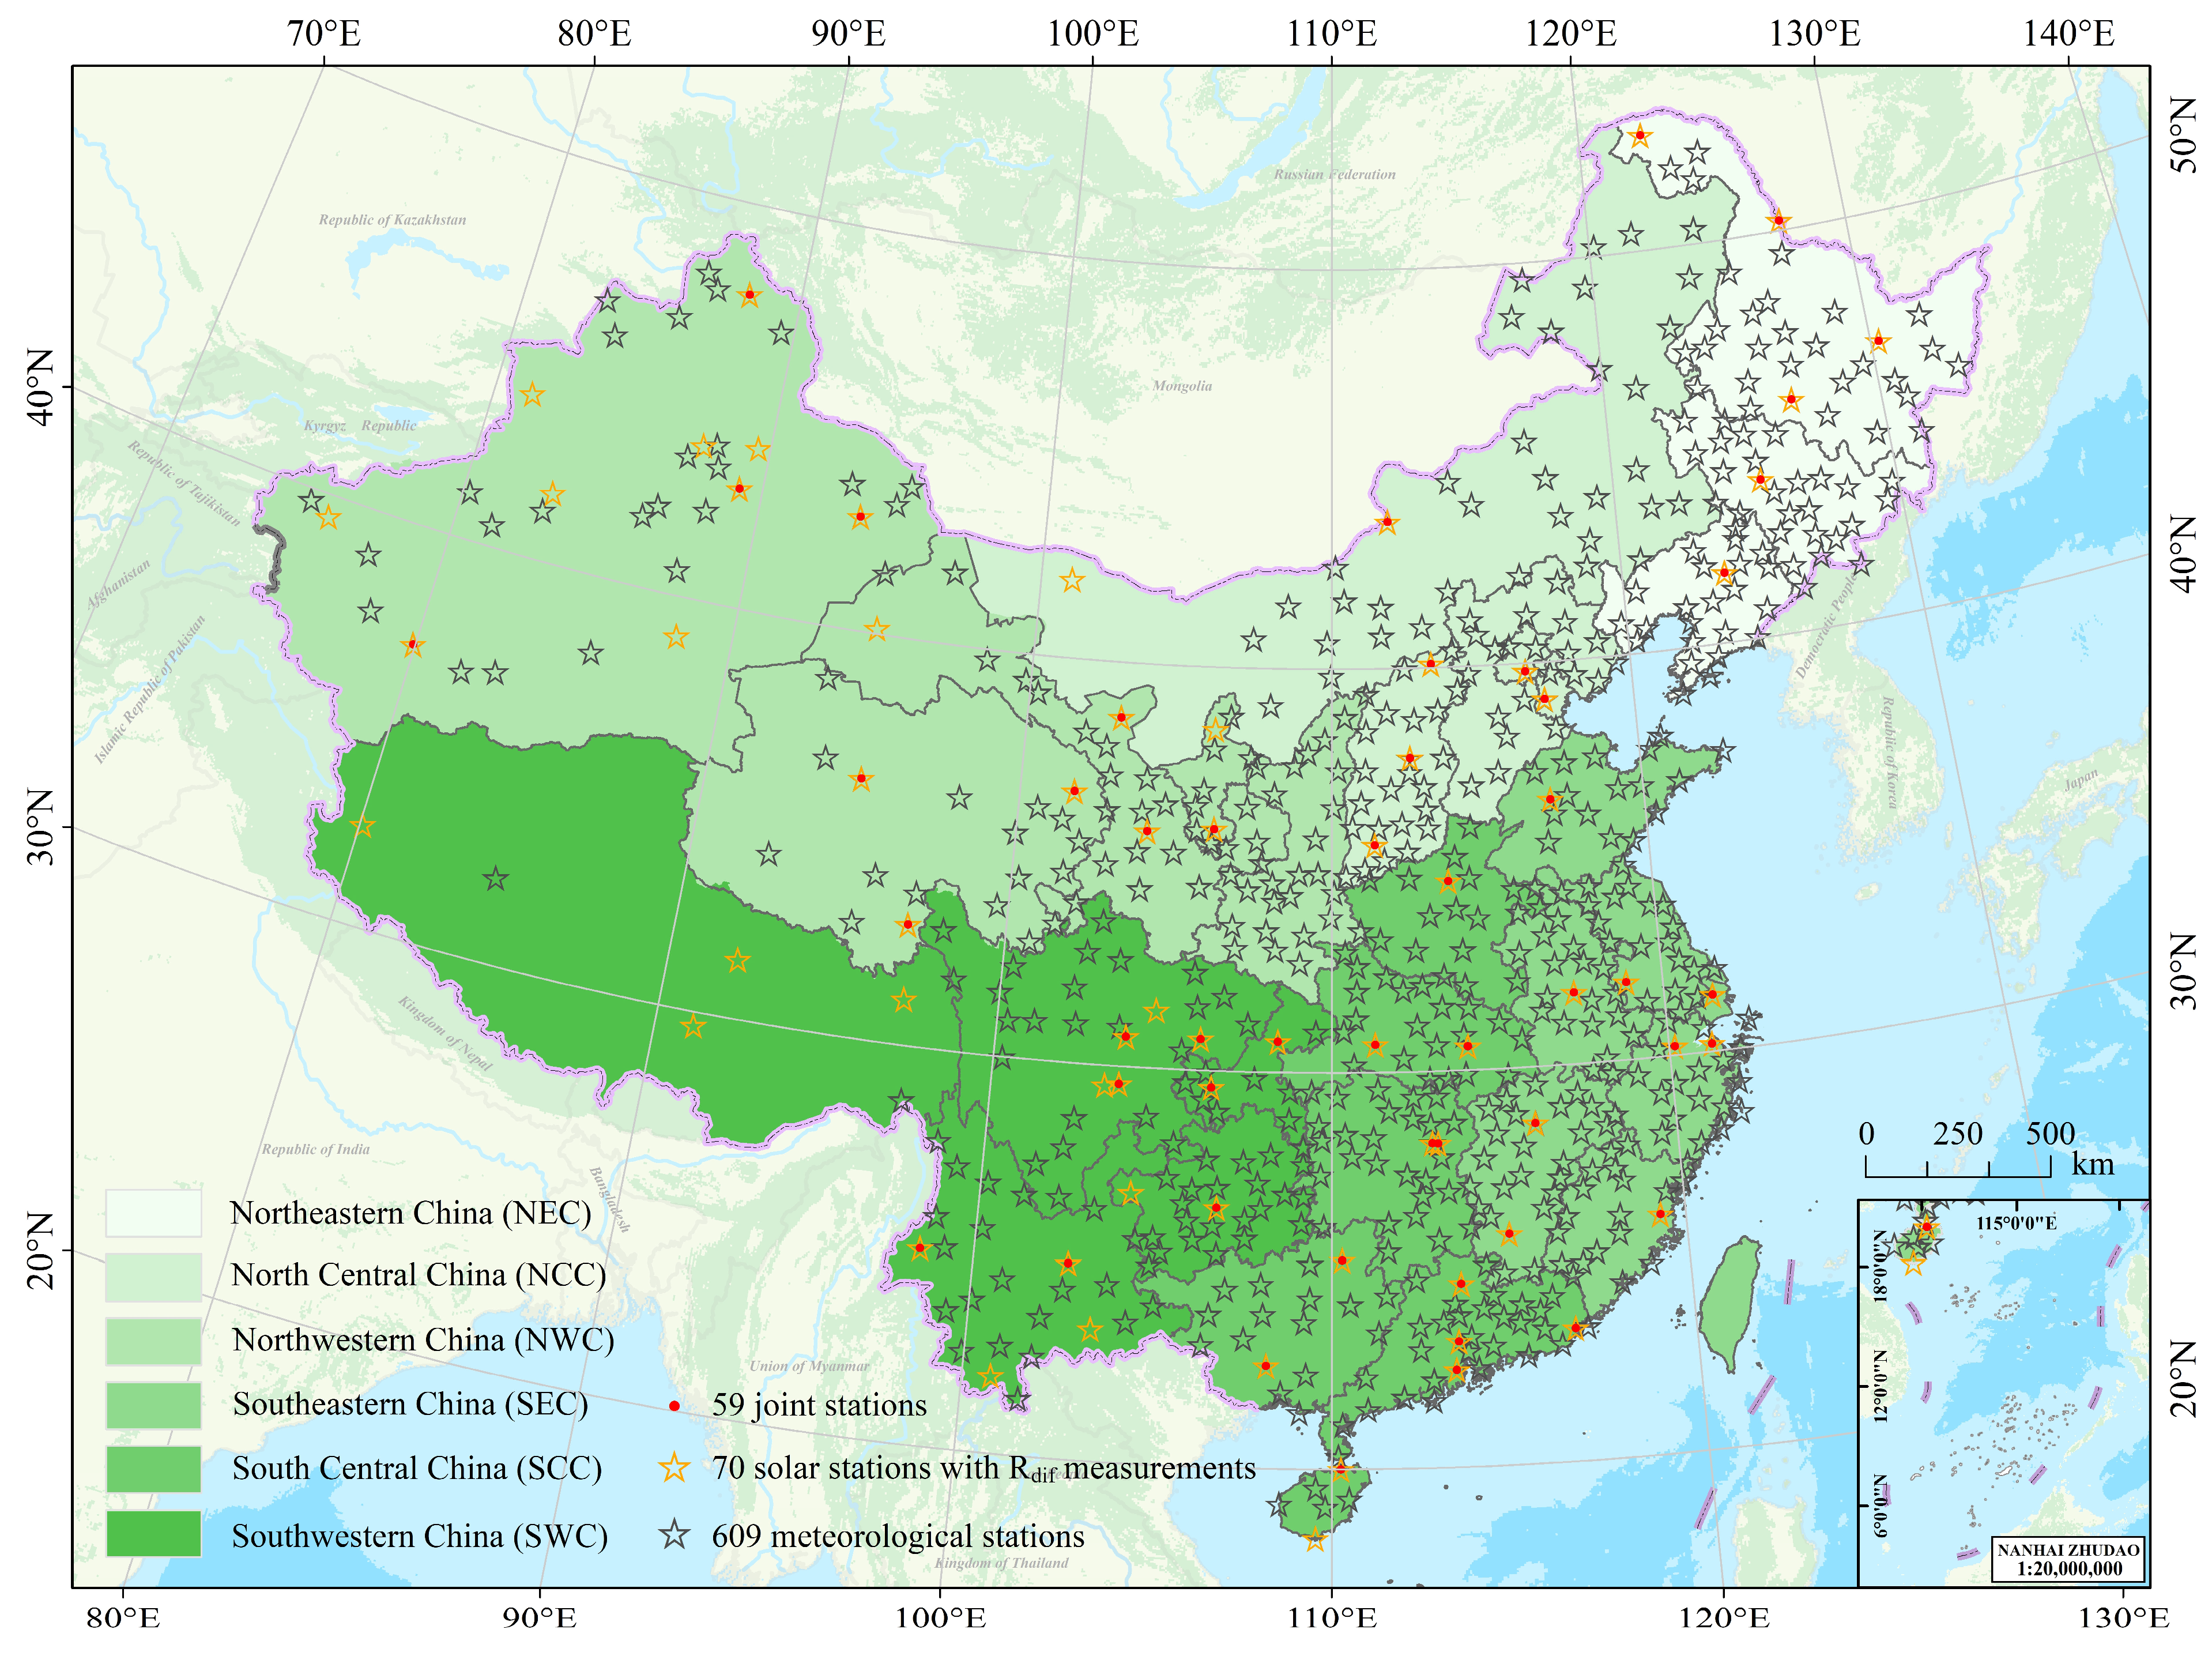
Figure 1. The spatial distribution of the selected 609 stations, the 70 solar radiation stations and the six geographic regions in China.
Remotesensing 17 03235 g001
Figure 2. Validation of the Rdif estimated by the RF model on different datasets and temporal scales. (a,c,e) The validation of daily, monthly and annual Rdif on the training dataset; (b,d,f) the validation of daily, monthly and annual Rdif on the test dataset. The red line represents the 1:1 reference, and the black line shows the least-squares regression fit.
Remotesensing 17 03235 g002
Figure 3. Validation of the Rdif estimated by the RF model at 70 training stations. (a) R; (b) RMSE.
Remotesensing 17 03235 g003
Figure 4. Validation of estimated daily CFs using different reference datasets: (a) Comparison with CFs derived from Rdif measurements at 70 solar radiation stations. (b) Comparison with observed power outputs from four PV power plants. The red line represents the 1:1 reference, and the black line shows the least-squares regression fit.
Remotesensing 17 03235 g004
Figure 5. The spatial distribution of the θ cn .
Remotesensing 17 03235 g005
Figure 6. (a) The long-term mean annual DF at 609 stations; (b) the relationship between θ cn and the mean annual DF, fitted by the least squares method. “**” represents that the significance test has been passed at the p < 0.01 level.
Remotesensing 17 03235 g006
Figure 7. Validation of the predicted optimal tilt angle by the DF-based model and four latitude-based models. R, RMSE and MBE were calculated using θ cn .The red line represents the 1:1 reference.
Remotesensing 17 03235 g007
Figure 8. The ratio of increase in CF due to tilt angle optimization.
Remotesensing 17 03235 g008
Figure 9. The mean CF at 609 stations. (a) Annual mean. (be) Seasonal means: (b) spring (March–May), (c) summer (June–August), (d) autumn (September–November), and (e) winter (December–February).
Remotesensing 17 03235 g009
Figure 10. The mean annual CF at regional and provincial levels, with error bars representing 95% confidence intervals. The correspondence between provinces and their regions is indicated by color, with all provinces within the same region shown in the same color. Regions with fewer than three stations (Tianjin City, Shanghai City, Tibet Province) display individual data points as scatter plots instead of showing averages with bar charts.
Remotesensing 17 03235 g010
Figure 11. The CF trends at 609 stations in China from 1980 to 2019. (a) Annual trends; (be) seasonal trends: (b) spring, (c) summer, (d) autumn, and (e) winter. Red indicates that the station’s trend is increasing, while blue indicates a decreasing trend. Stations that passed the significance test are marked with non-filled black boxes. The unit of trends is 10−4 per decade.
Remotesensing 17 03235 g011
Figure 12. The trends of mean CF in China from 1980 to 2019. (a) The annual trend; (be) the seasonal trends: (b) spring, (c) summer, (d) autumn, and (e) winter. Also shown in panel (a) is the annual mean CF in China during the “global brightening” period. “*” represents that the significance test has been passed at the p < 0.05 level.
Remotesensing 17 03235 g012
Figure 13. Comparison of daily Rdif validation without and with atmospheric parameters. (a) Without atmospheric parameters; (b) with atmospheric parameters. The red line represents the 1:1 reference, and the black line shows the least-squares regression fit.
Remotesensing 17 03235 g013
Figure 14. Improvement of the accuracy at 70 ground stations, represented by the percentage change ratio (calculated as the change in accuracy after improvement divided by the original accuracy × 100%). (a) R; (b) RMSE.
Remotesensing 17 03235 g014
Figure 15. The optimal tilt angle estimates from θ cn and four latitude-dependent empirical models.
Remotesensing 17 03235 g015
Figure 16. The relative multi-year mean energy yield ratio of PV systems under different tilt angle schemes.
Remotesensing 17 03235 g016
Table 1. Four typical optimal tilt angle models that based solely on latitude.
Model CodeModel EquationSource
Model 1 θ = φ [66]
Model 2 θ = a + b φ
a = 3.7, b = 0.69
[67]
Model 3 θ = a + b φ + c φ 2
a = 2, b = 0.92, c = −0.004
[68]
Model 4 θ = a + b φ + c φ 2 + d φ 3
a = 1.819, b = 1.074, c = −0.008437, d = 2.904 × 10⁻⁵
[69]
Disclaimer/Publisher’s Note: The statements, opinions and data contained in all publications are solely those of the individual author(s) and contributor(s) and not of MDPI and/or the editor(s). MDPI and/or the editor(s) disclaim responsibility for any injury to people or property resulting from any ideas, methods, instructions or products referred to in the content.