Article

Detection of Small-Scale Potential Landslides in Vegetation-Covered Areas of the Hengduan Mountains Using LT-1 Imagery: A Case Study of the Luding Seismic Zone

1
Sichuan Geological Big Data Center, Chengdu 610072, China
2
Faculty of Geosciences and Engineering, Southwest Jiaotong University, Chengdu 611756, China
*
Author to whom correspondence should be addressed.
These authors contributed equally to this work.
Remote Sens. 2025, 17(18), 3225; https://doi.org/10.3390/rs17183225
Submission received: 11 August 2025 / Revised: 3 September 2025 / Accepted: 12 September 2025 / Published: 18 September 2025

Abstract

Highlights

What are the main findings?
  • By conducting Stacking-InSAR monitoring with LT-1 and Sentinel-1 in the Luding seismic zone, a total of 23 landslide hazards were identified, of which 22 were effectively detected by LT-1 and 18 by Sentinel-1. Optical imagery shows that these landslides exhibit distinct geomorphic boundaries and continuous deformation features, indicating that they remain in an unstable state.
  • In complex mountainous and densely vegetated environments, LT-1, with its long-wavelength penetration capability and high spatial resolution, can more accurately delineate the extent, boundaries, and spatial deformation characteristics of small-scale landslides. Moreover, integrating multi-source and multi-orbit satellite monitoring helps mitigate the impact of geometric distortions and enhances the completeness and accuracy of landslide detection.
What is the implication of the main finding?
  • The study verifies the advantages of LT-1 in detecting small-scale landslides in complex mountainous and densely vegetated areas, providing new technical support for geological hazard monitoring and risk assessment.
  • Future efforts to expand LT-1 archived data, optimize data processing methods, and integrate multi-source satellite monitoring can further enhance the completeness, accuracy, and stability of landslide identification, providing important reference for related research and applications.

Abstract

The rugged terrain and dense vegetation in the mountainous area of Luding after the strong earthquake have made geologic hazards hidden and difficult to verify, and there are limitations in the fine-resolution monitoring of small-scale landslides, especially in the area covered by high vegetation. Currently, there is a lack of research on the application of L-band LuTan-1 (LT-1) for landslide detection in the dense vegetation-covered area of the Luding strong earthquake zone, and it is necessary to carry out the analysis of the detection capability of LT-1 for small-scale landslide hazards under the complex terrain and dense vegetation area. In this study, the Stacking-InSAR method was employed using LT-1 and Sentinel-1 satellites to conduct deformation monitoring and landslide detection in the Luding seismic area and to investigate the small-scale landslide detection capability of LT-1 in vegetation-covered areas. The results show that LT-1 and Sentinel-1 identified 23 landslide hazards, and their obvious deformation and landslide characteristics indicate that they are still in an unstable state with a continuous deformation trend. At the same time, through the detection analysis of LT-1’s landslide detection capability under high vegetation cover and small-scale landslide detection capability, the results show that the long wavelength LT-1 can be more effective in landslide hazard identification and monitoring than the short wavelength, and LT-1 with high spatial resolution can be more refined to depict the landslide deformation characteristics in space, which demonstrates the great potential of LT-1 in the refinement of landslide detection. It shows the significant potential of the LT-1 satellite data in landslide detection. Finally, the effects of geometric distortion on landslide detection under different satellite orbits are analyzed, and it is necessary to adopt the combined monitoring method of elevating and lowering orbits for landslide detection to ensure the integrity and reliability of landslide detection. This study highlights the capability of the LT-1 satellite in monitoring landslides in complex mountainous terrain and underscores its potential for detecting small-scale landslides. The findings also offer valuable insights for future research on landslide detection using LT-1 data in similar challenging environments.

1. Introduction

As one of the most widely distributed geological hazards in the world, landslides are characterized by high concealment, suddenness, and unpredictability, which often lead to catastrophic damages and cause significant casualties and property losses [1,2,3,4,5]. Among the numerous regions threatened by landslides, Luding County—located on the southeast edge of the Tibetan Plateau and within the Hengduan Mountain Range—features a typical alpine canyon geomorphology shaped by tectonic uplift and river undercutting [6,7,8,9,10,11]. This unique geomorphology makes it a high-risk area for landslides. The 2022 Luding earthquake further compromised slope stability across the region, triggering frequent geological hazards such as landslides and debris flows, and consequently, this area has become one of the most severely impacted regions by geological disasters in southwestern China, designated as a key zone for the prevention and mitigation of geological disasters in alpine canyon environments. Moreover, the rugged terrain and dense vegetation in the mountainous area of Luding after the strong earthquake make geologic hazards more concealed and difficult to verify, and there remain limitations in the fine-resolution monitoring of small-scale landslides (smaller than 104 m3) [12,13,14], particularly in densely vegetated areas. Therefore, the identification and monitoring of landslides in this region have become a critical component of local disaster prevention and risk reduction strategies [15,16,17,18,19].
However, to address the specific needs of landslide identification and monitoring in such alpine canyon areas (e.g., Luding County), existing traditional methods of geohazard investigation and monitoring, such as manual measurement, photogrammetry, and GNSS—have certain limitations in application: they are often constrained by environmental factors like adverse weather and complex terrain, and generally suffer from low efficiency, making them unable to meet the practical demands of landslide monitoring in this region. In contrast, Interferometric Synthetic Aperture Radar (InSAR) technology, characterized by its all-weather, day-and-night imaging capability, wide spatial coverage, high efficiency, and high precision, has been widely applied in the monitoring of regional subsidence, oil and mining areas, as well as earthquake-related hazards [20,21,22,23,24,25,26,27]. Commonly used time-series InSAR techniques include Permanent Scatterer InSAR (PS-InSAR) [28], Small Baseline Subset InSAR (SBAS-InSAR) [29,30], and the Stanford Method for Persistent Scatterers (StaMPS) [31]. These methods enable the retrieval of surface deformation patterns and the spatiotemporal evolution characteristics of geological hazards such as landslides, making time-series InSAR a widely adopted tool in landslide monitoring. However, in the complex mountainous regions of southwestern China, severe terrain undulations and dense vegetation often result in low-coherence or decorrelated signals during interferometric processing, significantly limiting the applicability of conventional time-series InSAR methods. Stacking-InSAR, which enhances coherence by averaging interferograms over multiple acquisition periods, has demonstrated superior performance in low-coherence environments. Additionally, Stacking-InSAR offers faster processing efficiency compared to other time-series techniques, making it increasingly popular in landslide detection studies. Zhang et al. [32] conducted an efficient identification of potential landslides in the mountainous regions surrounding Wenchuan, focusing on national highway corridors, using the Stacking-InSAR method. Their results demonstrated that Stacking-InSAR can detect potential landslides in low-coherence areas that are often missed by the SBAS-InSAR method. Liang et al. [33] investigated landslide detection in the Ya’an and Garzê Tibetan Autonomous Prefecture regions using Sentinel-1 and ALOS-2 satellite data, comparing SBAS-InSAR and Stacking-InSAR techniques. Their study highlighted the superior capability of Stacking-InSAR in identifying potential landslides. Li et al. [34] further applied an improved seasonal Stacking-InSAR method for the detection of potential landslides in Mao County, Wenchuan, showing enhanced sensitivity to terrain deformation patterns.
At present, mainstream L-band SAR satellites used for surface deformation monitoring include ALOS-2 and SAOCOM-1. As a newly launched L-band satellite in recent years, LT-1 has high spatial resolution and a return cycle of eight days per satellite, introducing a new data source for landslide monitoring in the complex mountainous areas of southwest China [35,36,37,38,39]. It is worth noting that as a newly launched satellite in 2022, LT-1 currently has certain limitations in terms of its amount of archived data and monitoring cycle, and still faces certain challenges in long-term monitoring. Recent studies have demonstrated the application of the LT-1 satellite in monitoring surface deformation in various contexts, including mining areas, seismic zones, and glaciers. Ji et al. [40] utilized both single and dual-satellite LT-1 SAR data to conduct DSM reconstruction and to monitor surface deformation in the Datong mining area using Stacking-InSAR and SBAS-InSAR methods. Yang et al. [37] employed D-InSAR techniques based on LT-1 and Sentinel-1 data to monitor ground deformation in the Shenmu mining area, identifying nine significant subsidence zones and systematically comparing the monitoring performance of the two SAR satellite systems. Li et al. [41] combined LT-1 and Sentinel-1 data, applying both D-InSAR and pixel offset tracking (POT) techniques to reveal the short-term acceleration and post-seismic recovery of glacier flow in Mount Gongga triggered by the Luding earthquake. Xiong et al. [42] investigated the identification of potential landslides using LT-1 satellite data in the mountainous regions of Dafang and Nayong counties in Guizhou Province, which are characterized by complex topography and dense vegetation cover. Their study assessed the effectiveness of LT-1 in landslide detection and explored its potential for landslide monitoring in mountainous areas.
Although existing studies have demonstrated the capability of LT-1 in monitoring mining areas, glacier movements, and landslides, no research has yet been conducted on landslide monitoring using LT-1 in the Luding mountainous region. There is a notable lack of systematic evaluation of LT-1’s potential for identifying landslides in southwestern China, particularly in the seismically affected Luding area. Moreover, limited attention has been given to the application of LT-1 for landslide monitoring at high spatial resolution. Given this gap, it is worth investigating whether LT-1, with its L-band characteristics and high spatial resolution, can more effectively detect potential landslides of varying scales in complex terrain and densely vegetated environments, and whether it demonstrates strong monitoring capabilities in earthquake-triggered alpine canyon regions. To address this research gap, this study aims to assess the performance of LT-1 in identifying and monitoring landslides in the seismically affected Luding region, evaluating its potential for detecting landslides of different scales under complex topographic and densely vegetated conditions.
To effectively carry out landslide detection in the strong earthquake area of Luding, to provide reliable landslide monitoring information for the local area, and to assess the potential of the LT-1 satellite for landslide detection of different scales in complex terrain and dense vegetation environments. This study employs ascending and descending data from the LT-1 satellite using the Stacking-InSAR method to conduct deformation monitoring and potential landslide detection in the mountainous canyon region of the Dadu River Basin in Luding County. Sentinel-1 data are further integrated for joint validation and comparative analysis. Additionally, high-resolution optical satellite imagery is utilized to assess the capability of LT-1 data in detecting landslides of different scales and spatial extents. The objective is to explore the detection capability and potential of the LT-1 satellite in monitoring landslides and other geological hazards in mountainous canyon regions, thereby providing a scientific basis for landslide monitoring, risk assessment, and disaster prevention and mitigation using LT-1 in such complex terrains.

2. Study Area and Datasets

2.1. Study Area

Luding County is located in the southeastern part of the Garzê Tibetan Autonomous Prefecture, Sichuan Province. As shown in Figure 1a, it lies in the transitional zone between the Qinghai–Tibet Plateau and the Sichuan Basin, characterized by typical alpine gorge terrain. This topography results in significant vertical climatic variations and complex, changeable weather conditions. The region experiences abundant annual precipitation, primarily concentrated during the flood season, and exhibits the characteristics of a typical subtropical monsoon climate. The Dadu River flows from north to south through the county, carving deep V-shaped valleys. The relative elevation difference between the valley bottom and the mountain ridges on either side exceeds 3000 m. Geologically, as illustrated in Figure 1b, the study area is situated at the intersection of the southern segment of the Xianshuihe Fault Zone and the Longmenshan Fault Zone [43,44]. The bedrock in this region is complex, mainly consisting of diorite, plagioclase granite, granite, limestone, and sandstone. Under the long-term action of river erosion, the lateral support of the rock mass and the stability of the slope base structure are affected. Finally, under the influence of internal factors such as gravity or powerful external forces such as earthquakes, the possibility of deformation is indirectly increased. In addition, multiple north–south trending faults are developed within the area, further fragmenting the riverbank rock masses, increasing permeability and deformation potential, and thus elevating the risk of geological hazards [45,46]. Following the 6.8-magnitude Luding earthquake in 2022, numerous paleo-landslides and coseismic landslides were reactivated. This has posed severe threats to key transportation routes such as Provincial Highway S211 and adjacent infrastructure. Some large-scale landslides even posed risks of blocking rivers, potentially leading to the formation of landslide-dammed lakes, which could result in secondary disasters and pose significant threats to the safety of residents and their property. Based on the spatial extent of remote sensing imagery coverage, this study focuses on the Dadu River corridor near the earthquake epicenter [16], covering an area of approximately 143 km2.

2.2. Datasets and Processing

The LT-1 satellite constellation, China’s first L-band (23.6 cm) full-polarimetric SAR system dedicated to interferometric applications, consists of two satellites—LT-1A and LT-1B—launched in January and February 2022, respectively. Both satellites operate in sun-synchronous repeat orbits at an average altitude of approximately 607 km. Equipped with L-band multi-polarization and multi-channel SAR payloads, the constellation supports five strip map imaging modes and one scan mode. In strip map mode, the system achieves a maximum spatial resolution of 3 m, while the scan mode enables a swath width of up to 400 km.
This study employed two types of SAR datasets collected from four orbital tracks. Specifically, the L-band LT-1 data consisted of 9 ascending SAR images (acquired between August 2023 and April 2024) and 7 descending SAR images (from September 2023 to April 2024). The C-band Sentinel-1 data included 27 ascending SAR images (January 2023 to April 2024) and 31 descending SAR images (February 2023 to April 2024). Table 1 shows the parameters associated with LT-1 and Sentinel-1 images. The LT-1 SAR data were acquired in Strip1 mode, while the Sentinel-1 SAR data were acquired in Interferometric Wide (IW) swath mode. A summary of the acquisition parameters for the LT-1 and Sentinel-1 SAR datasets is presented in the table below. In addition, Interferometric processing of the SAR data was performed using GAMMA software (2024), and a 30 m resolution Digital Elevation Model (DEM) from the Shuttle Radar Topography Mission (SRTM) was used to simulate and remove the topographic phase during interferometric processing. In subsequent landslide identification, we also utilized GaoFen-2 (GF-2) satellite imagery with a spatial resolution of 1 m for optical interpretation. The imagery was acquired on 20 March 2024.

3. Methodology

This study used the Stacking InSAR technique, L-band ascending and descending orbit images from the LuTan-1 (LT-1) satellite were utilized to identify and monitor landslides in the Luding area. To evaluate the monitoring capabilities and performance of LT-1 imagery, a comparative analysis was conducted using Sentinel-1 ascending and descending orbit data from similar periods, also processed with the Stacking InSAR method. This analysis served to validate the results derived from LT-1 data. In addition, high spatial resolution optical satellite imagery was integrated to analyze and identify the characteristics of typical landslides. The study further explores the potential and performance of the LT-1 satellite in landslide detection and monitoring in mountainous regions.
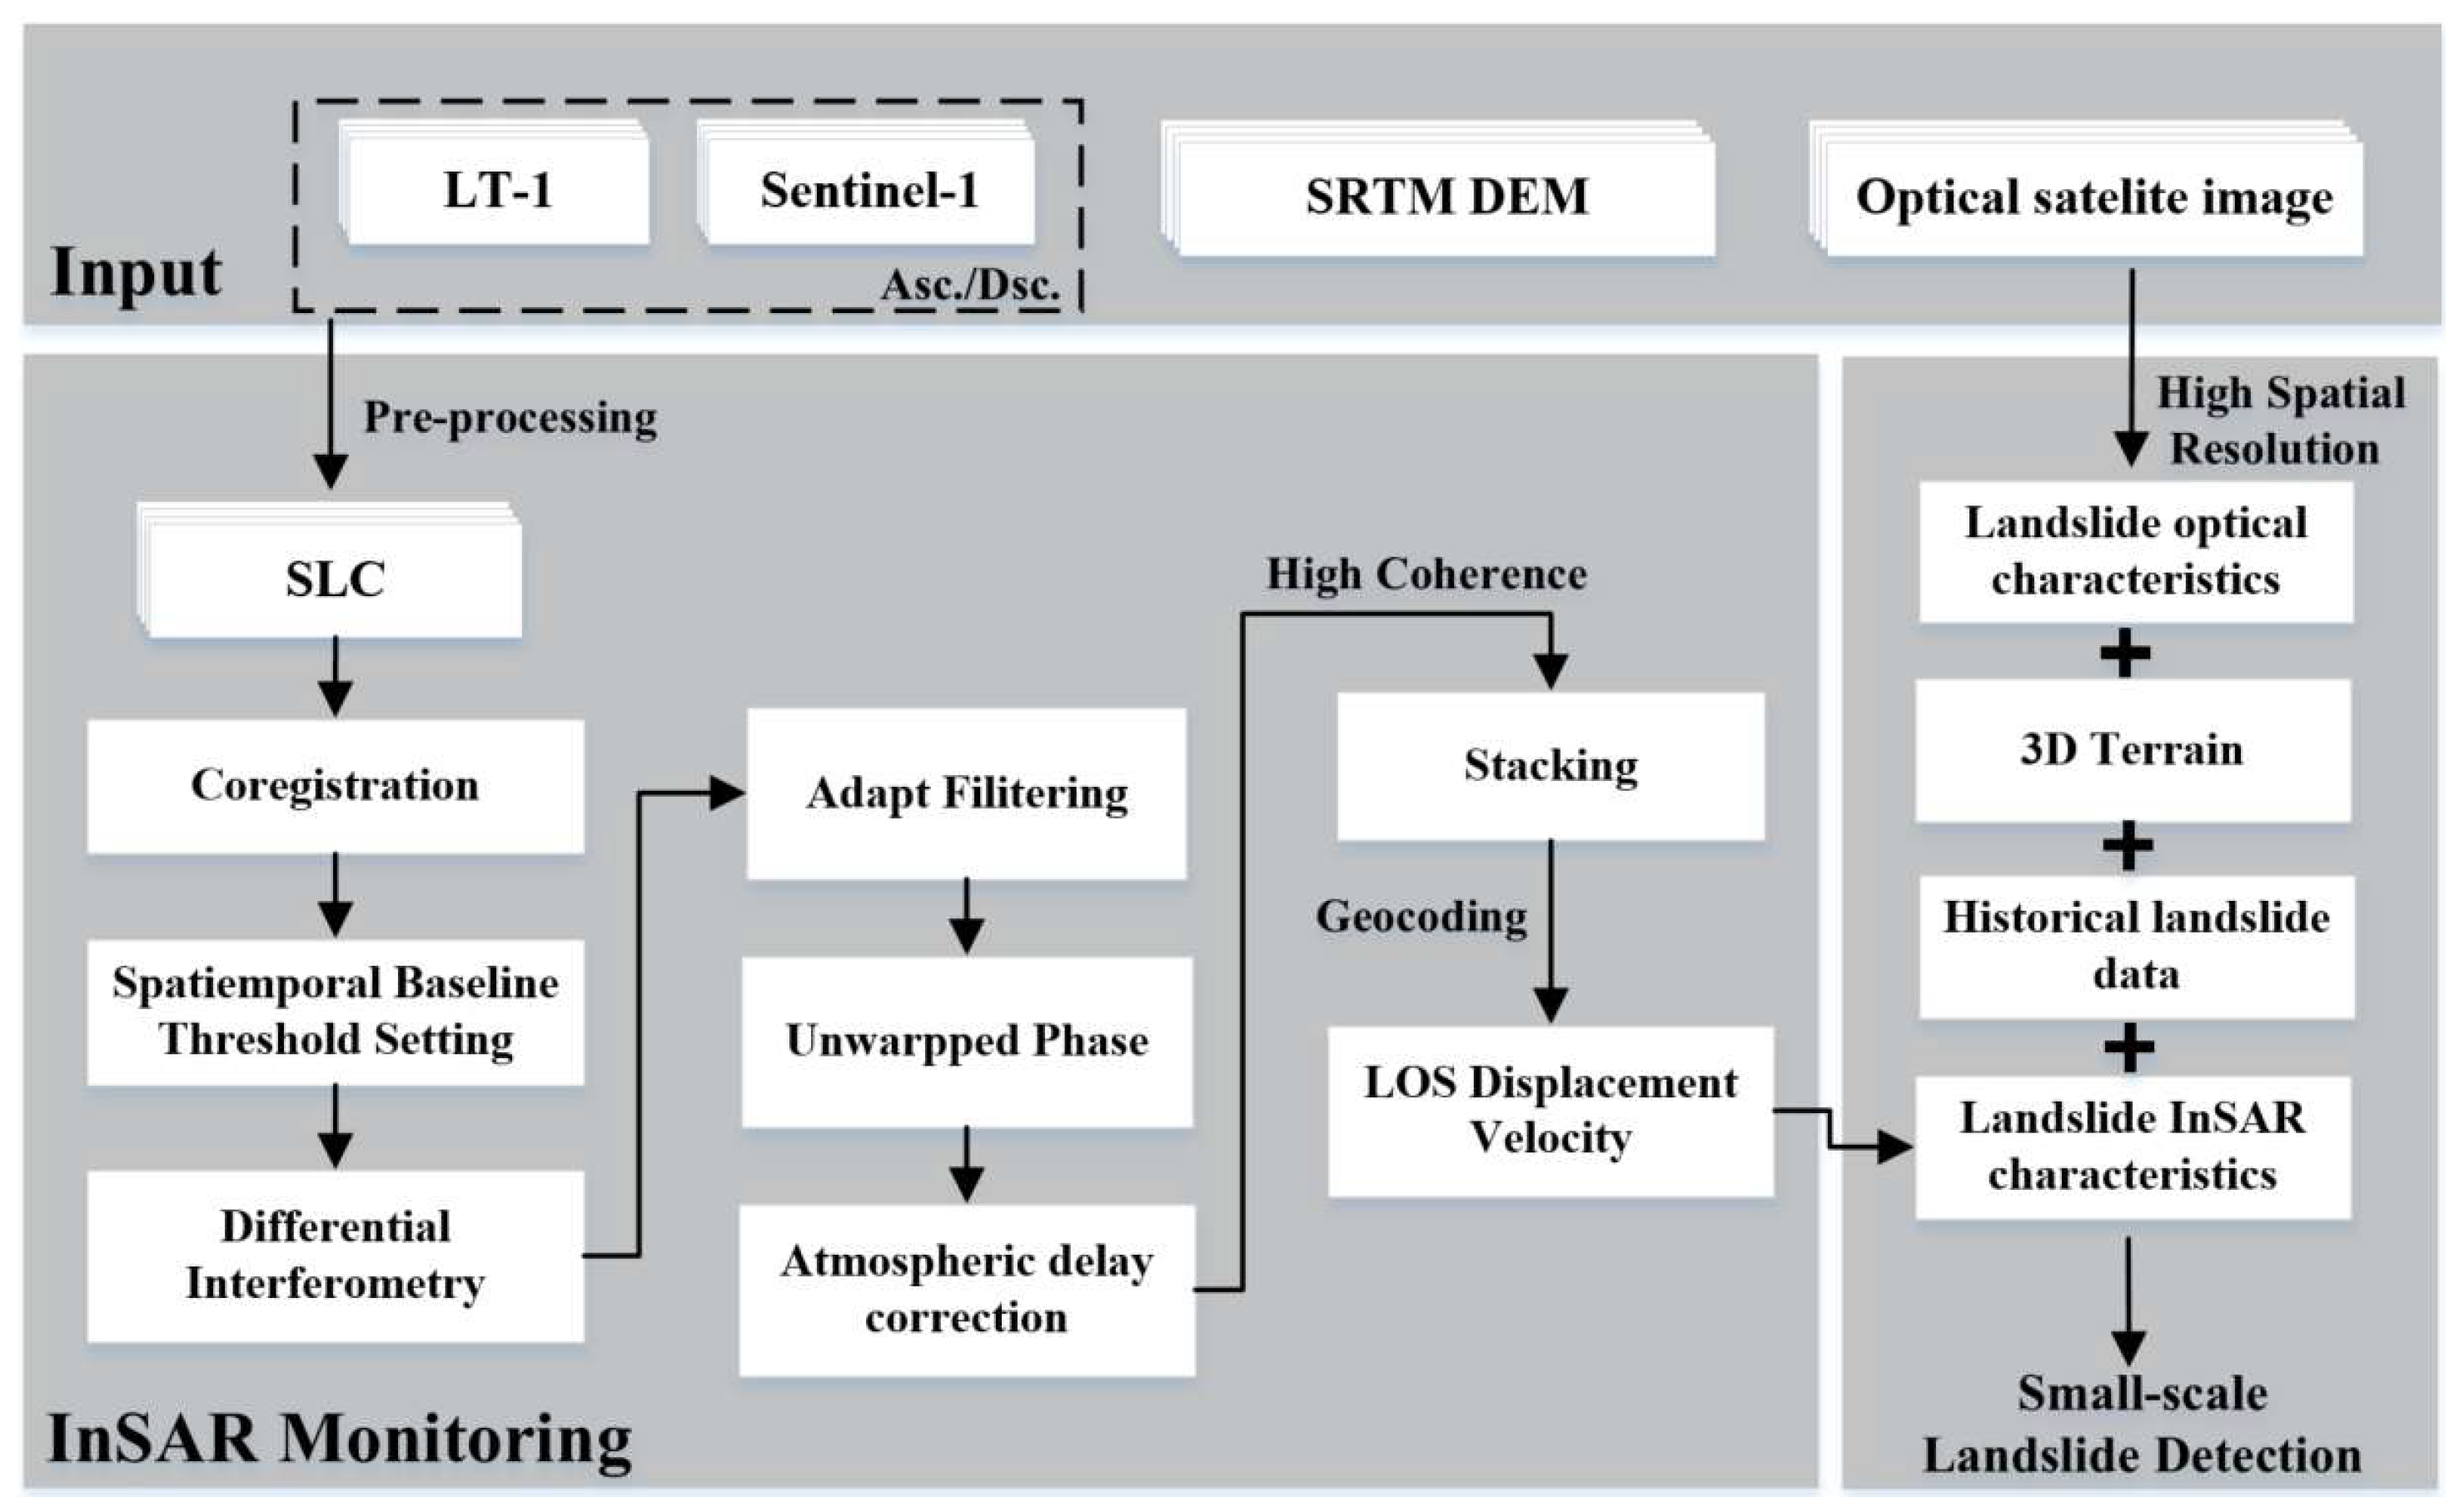
The overall technical flow chart is illustrated in Figure 2. First, ascending and descending SAR images from the LuTan-1 (LT-1) and Sentinel-1 satellites covering the same study area are acquired, along with their corresponding precise orbit data and external Digital Elevation Model (DEM) data. Co-registration is then performed, and temporal and spatial baseline thresholds are set to generate interferometric pairs. After producing differential interferograms, adaptive filtering and phase unwrapping are applied to obtain unwrapped differential interferograms. A linear model is subsequently used to mitigate topography-correlated atmospheric phase delays [47], while the Generic Atmospheric Correction Online Service (GACOS) data were also introduced to further correct for atmospheric delays. Only interferometric pairs with high-quality coherence are selected for stacking analysis. The final Line-of-Sight (LOS) average deformation velocity map is derived through phase-to-deformation conversion and geocoding. Finally, a comprehensive analysis and identification of typical landslides is conducted by integrating high-resolution optical satellite imagery with historical landslide inventories. The monitoring and recognition capabilities of the LT-1 satellite for landslides in mountainous regions are also evaluated.

3.1. Stacking-InSAR Method

The Stacking-InSAR algorithm was first proposed by Sandwell in 1998 [48]. It primarily involves performing pairwise differential interferometry on multiple images from the study area, with specific spatiotemporal baseline constraints. Subsequently, the unwrapped interferometric phases are linearly stacked, followed by a weighted average of the stacked phases, ultimately providing the line-of-sight (LOS) deformation results. Among time-series InSAR methods, although Stacking-InSAR may not achieve the same level of accuracy as other techniques such as PS-InSAR and SBAS-InSAR, it demonstrates superior performance in landslide monitoring in high mountainous regions, where issues like vegetation cover or large deformation gradients lead to significant phase decorrelation. In such cases, Stacking-InSAR proves more effective in identifying landslides [34]. It is worth noting that the Stacking-InSAR technique can only provide the average deformation velocity and operates under the assumption of linear ground motion. As a result, it cannot effectively capture seasonal variations or accelerated deformation associated with landslide processes. Therefore, significant challenges remain in applying this method for the time-series monitoring of landslides.
In the Stacking-InSAR method, when unwrapping the phase of the differential interferograms, it is assumed that the atmospheric phase is random and that the surface deformation follows a linear trend. The weight assigned to each interferometric pair is related to the time interval between the pairs. By linearly stacking the interferometric phases, the signal-to-noise ratio can be effectively improved, and the interferometric phases can be separated. To ensure the accuracy of Stacking-InSAR processing, high-quality interferometric pairs are selected after phase unwrapping for extraction and stacking. The average rate of change in the interferometric phase after stacking is given by:
V φ = i = 1 n φ i Δ T i i = 1 n Δ T i 2
where V φ represents the average phase velocity, φ i denotes the interferometric phase of the i-th interferogram, and Δ T i indicates the temporal baseline of the i-th interferometric pair.
To better analyze the deformation characteristics of potential landslides, the average rate of interferometric phase change is further converted from radians per year to meters per year. The average line-of-sight (LOS) deformation velocity a is given by:
V d i s p = λ V φ 4 π
where λ is the radar wavelength, which is 23.6 cm for the LT-1 satellite and 5.6 cm for the Sentinel-1 satellite.

3.2. Accuracy Assessment of Deformation Results

To evaluate the accuracy of the deformation results obtained from the LT-1 and Sentinel-1 satellites within the same area, histogram statistics and the calculation of the standard deviation of deformation rates can be used. The formula for calculating the standard deviation of the deformation rate is as follows:
σ V = λ 4 π i = 1 N φ i 4 π λ V Δ T i Δ T i 2
where σ V represents the standard deviation of the deformation rate, N denotes the number of interferometric pairs, and the deformation phase value at the i-th point of the differential interferogram, V is the average deformation rate, and the temporal baseline between the i-th interferometric pairs.

3.3. Geometric Distortion Visibility Analysis

Due to the side-looking imaging geometry of SAR satellites, the visibility of the terrain surface is determined by the relative orientation between the radar sensor and the local topography. Complex geomorphological conditions frequently lead to geometric distortions in regions with highly rugged terrain, such as mountainous valleys, including layover, shadowing, and foreshortening. These distortion-affected areas introduce phase discontinuities in interferograms, which can result in significant errors during phase unwrapping. Consequently, these effects severely compromise the accuracy and reliability of the surface deformation measurements derived [49,50,51]. Geometric distortions in SAR images are primarily influenced by geometric parameters such as the satellite sensor’s flight direction, incidence angle, look direction, and terrain parameters like slope and aspect. As illustrated in Figure 3, when the slope faces the satellite and has a steep gradient, the mountain top at point B will be imaged before point A, forming an inverted image of B’A’ on the SAR image, which is known as the layover phenomenon. When the slope gradient decreases, i.e., the foot of the slope is smaller than the incidence angle, the imaged distance between points C’ and D’ will be shorter than the distance between C and D, leading to the foreshortening effect. When the slope faces away from the satellite and the gradient is steep (i.e., the slope angle exceeds the complementary angle of the incidence angle), the area will be shadowed because it cannot be illuminated by the satellite, resulting in a shadowing effect where no backscatter signal is generated. The area remains unobserved [52,53].
To investigate surface visibility under different geological conditions, Notti [53] proposed the R-Index method based on layover and shadow effects. This index represents the ratio between the slant range in the radar line-of-sight (LOS) direction and the ground distance. Building upon this, Ren et al. [51] developed an improved R-Index algorithm to identify geometrically distorted areas in SAR imagery, particularly those affected by passive layover at greater distances:
R - I n d e x = cos ( γ ) = sin { θ + arctan [ tan α × cos ( φ β ) ] } × S h × L a × F a
where γ refers to the angle formed between the radar signal path and the local surface orientation; α denotes the terrain slope; β corresponds to the terrain aspect direction; The satellite’s line-of-sight (LOS) incidence angle is represented by θ, and φ stands for the azimuth direction of the satellite LOS. The Sh denotes the shadow coefficient, La denotes the layover coefficient, and Fa denotes the far passive layover coefficient. The impact of different terrain features on the results can be intuitively understood by performing a visibility analysis.

4. Results

4.1. Identification of Potential Landslides

After processing the ascending and descending orbit data using the Stacking-InSAR method, combined with high-resolution optical imagery and geological data such as slope and aspect, it becomes highly beneficial for effectively identifying and analyzing potential landslides in mountainous regions. Assessing whether areas exhibiting significant deformation correspond to potential landslides is necessary. The primary factor in this assessment is whether the area with significant deformation possesses the necessary topographical conditions for landslide development. The key influencing factor is the terrain slope, as landslides are fundamentally a process of instability in the rock and soil mass under the influence of gravity. The steeper the slope, the stronger the component of gravitational force along the slope direction. A landslide will only occur when the slope is sufficiently steep and the shear strength of the rock and soil is insufficient to resist the sliding force. Secondly, it is essential to determine whether the significant deformation is caused by human engineering activities, even if the topographical conditions are conducive to landslide development. Therefore, for landslide identification, if the terrain conditions, such as slope, are conducive to landslide development and no signs of human engineering disturbances are found, the area can be identified as a potential landslide [33,42]. Specifically, the following three examples illustrate the identification of potential landslides.
(1)
Areas of significant surface deformation that do not have the topographic conditions for landslide development.
As shown in Figure 4, the study area is located in a flat region along the Dadu River, where the overall slope is relatively gentle, with terrain slopes within 10°. The topographic gradient used in this study was generated based on the SRTM DEM, which has a resolution of 30 m. The InSAR results from the LT-1 data indicate that the maximum deformation rate in the region exceeds −200 mm/yr. However, combined with high-resolution optical satellite imagery, it is apparent that the deformation in this area is caused by human engineering activities and does not possess the topographical and geological conditions necessary for landslide development. Therefore, this area cannot be classified as a potential landslide zone.
(2)
Areas of significant surface deformation due to human engineering activities.
As shown in Figure 5, the InSAR results from LT-1 data indicate that the maximum deformation rate is approximately −245 mm/yr, and the overall terrain slope in this area is around 30°, which is conducive to developing landslides based on topographical conditions. However, high-resolution optical satellite imagery reveals multiple Z-shaped roads and terraced platforms in the area, with an overall distribution of silver-white rock and soil. This suggests that the surface deformation in this area is likely due to human engineering activities such as quarrying and mining. Although the region meets the topographical conditions for landslide development, it cannot be classified as a potential landslide zone.
(3)
Areas of significant deformation with landslide development (potential landslide areas).
As shown in Figure 6, a slope located on the bank of the Dadu River Basin has significant deformation. The InSAR results of LT-1 data show that the whole slope has different degrees of deformation, with a wide distribution of deformation, and the topography of the deformation area has a steep slope, with the overall slope gradient ranging from 25° to 45°. At the same time, combined with optical satellite images, it can be seen that the central part of the overall slope body and the bottom of the slope body are distributed by a large number of gray-white rock sliding signs, and the deformation area of the InSAR results of the LT-1 data is mainly concentrated in the area of the back edge of the body of the landslide, as well as the top of the body of the slope, which means that the surface deformation of the InSAR results may be the result of the overall sliding of the regional slopes. Therefore, the area is classified as a potential landslide area.
Therefore, a comprehensive approach to identifying potential landslide areas is proposed by integrating InSAR deformation results, high-resolution optical satellite imagery, and topographical factors such as slope. Specifically, after defining a deformation threshold of 10 mm/yr and identifying suspicious deformation regions with slopes greater than 15°, high-resolution optical satellite imagery is used to assess whether the region exhibits suitable topographical conditions for landslide development and whether human engineering activities are the main drivers [42,54]. The final step involves delineating the landslide boundary by integrating the corresponding slopes’ deformation areas and threat zones. For isolated deformation signals located in areas with poor coherence, such as dense vegetation, or errors caused by significant geometric distortions or incomplete atmospheric phase removal in InSAR data, these signals are classified as “pseudo-deformation” and should be excluded from the analysis.

4.2. Overall Identification Result

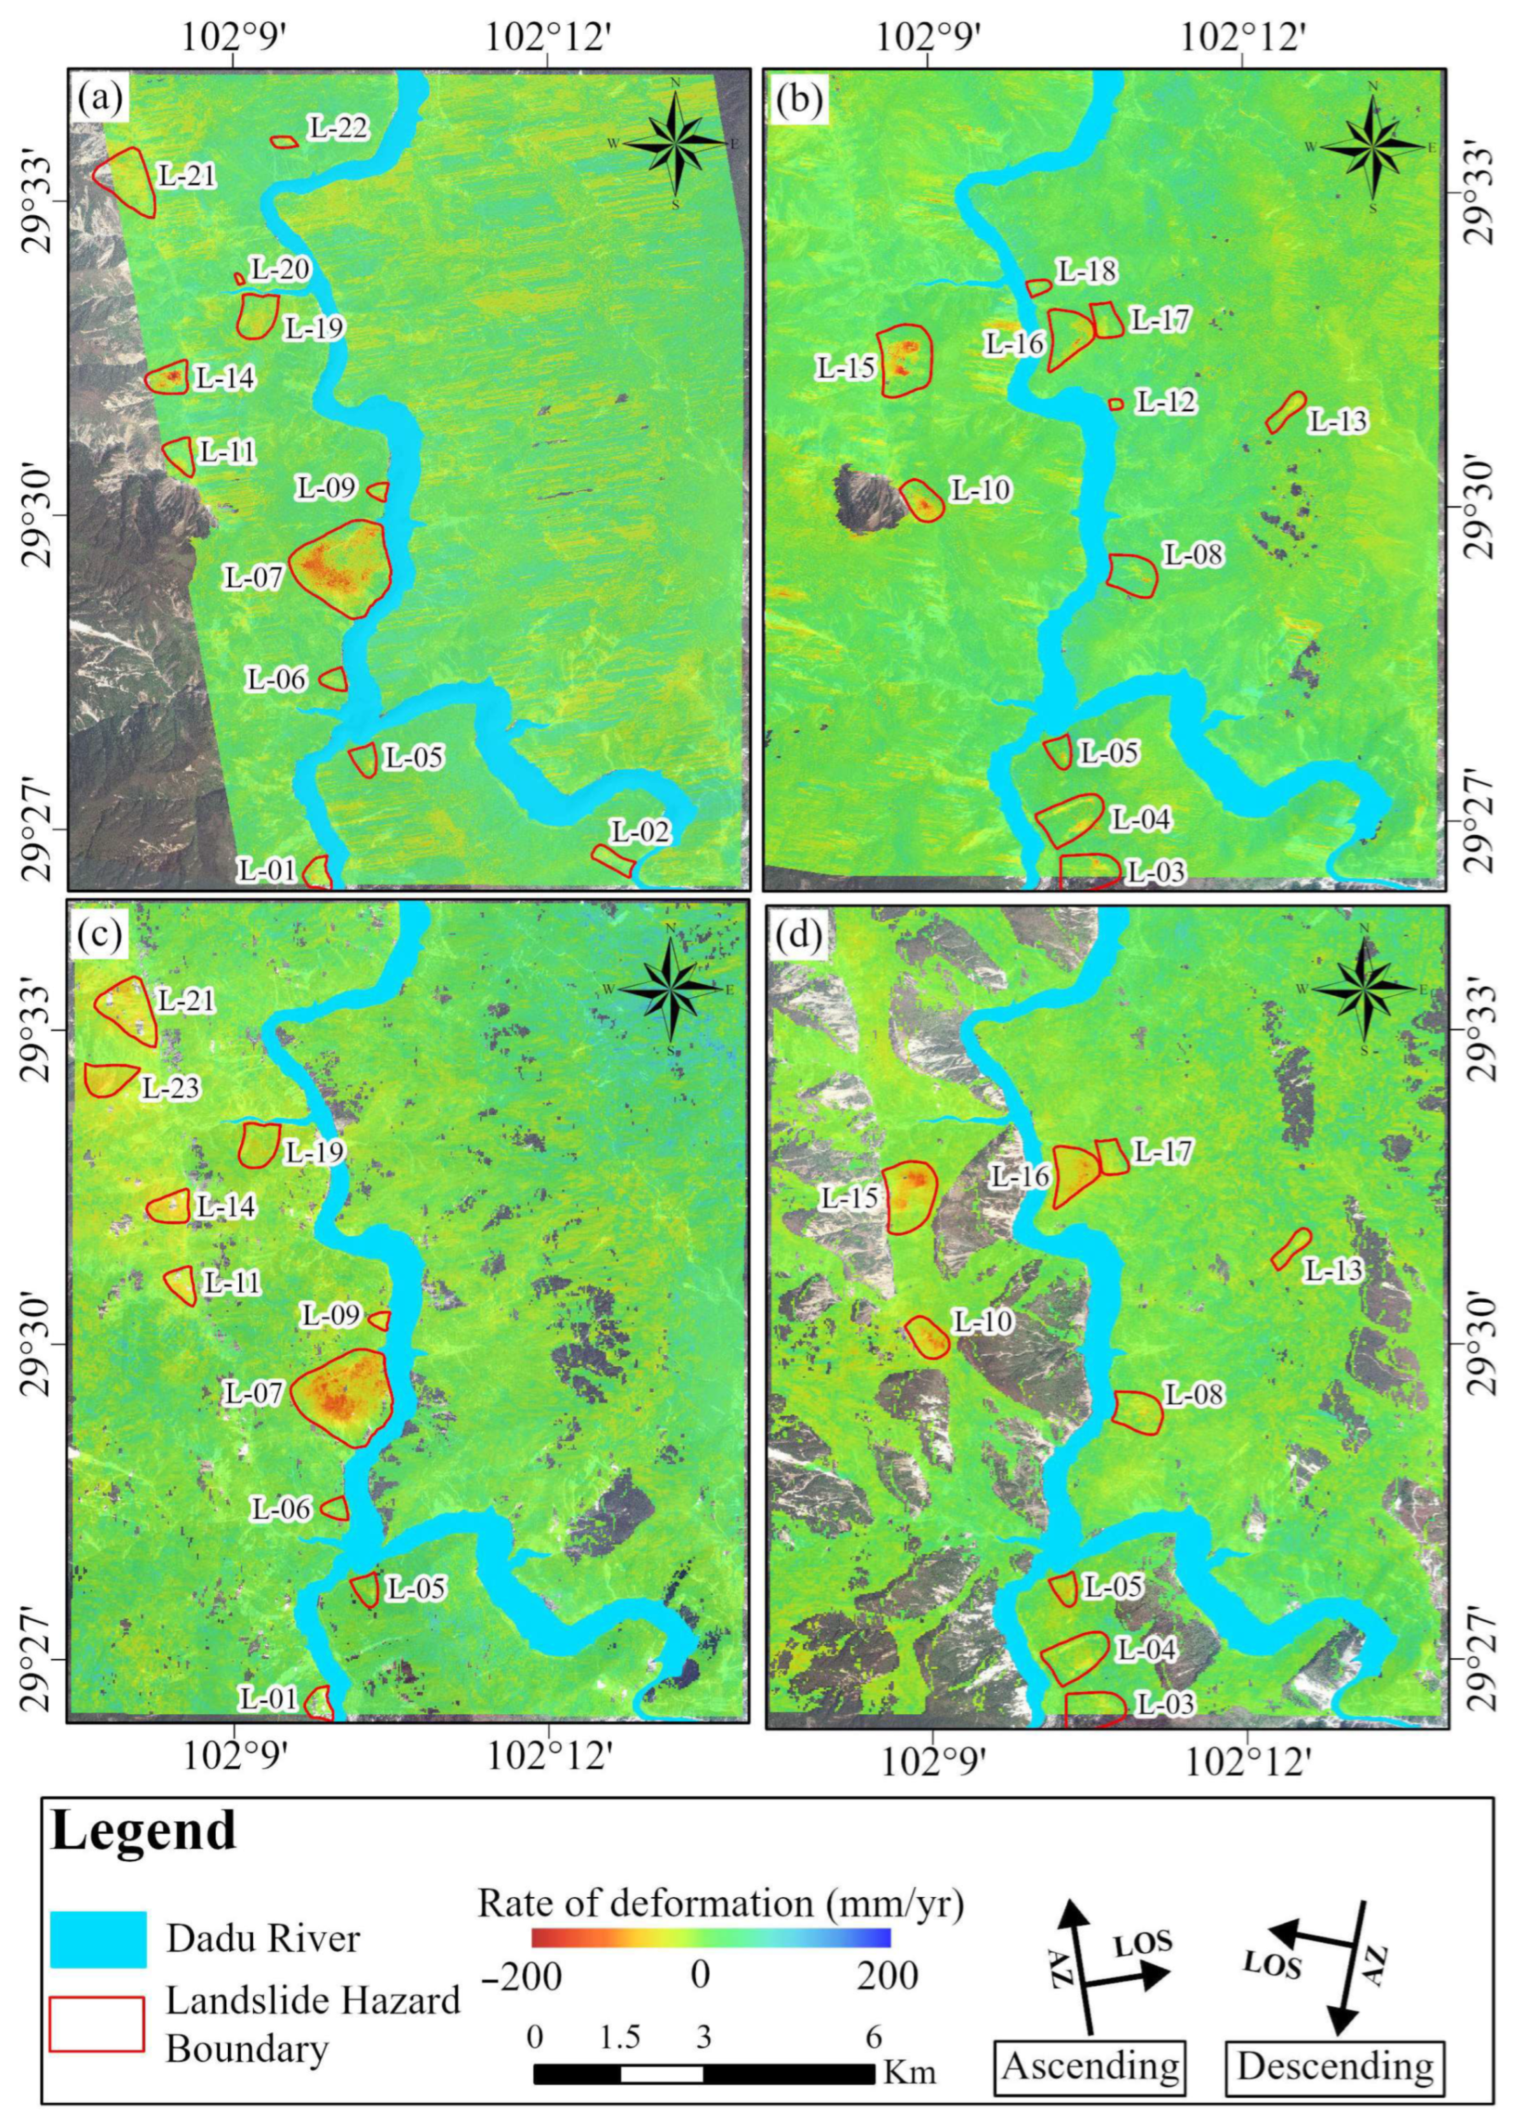
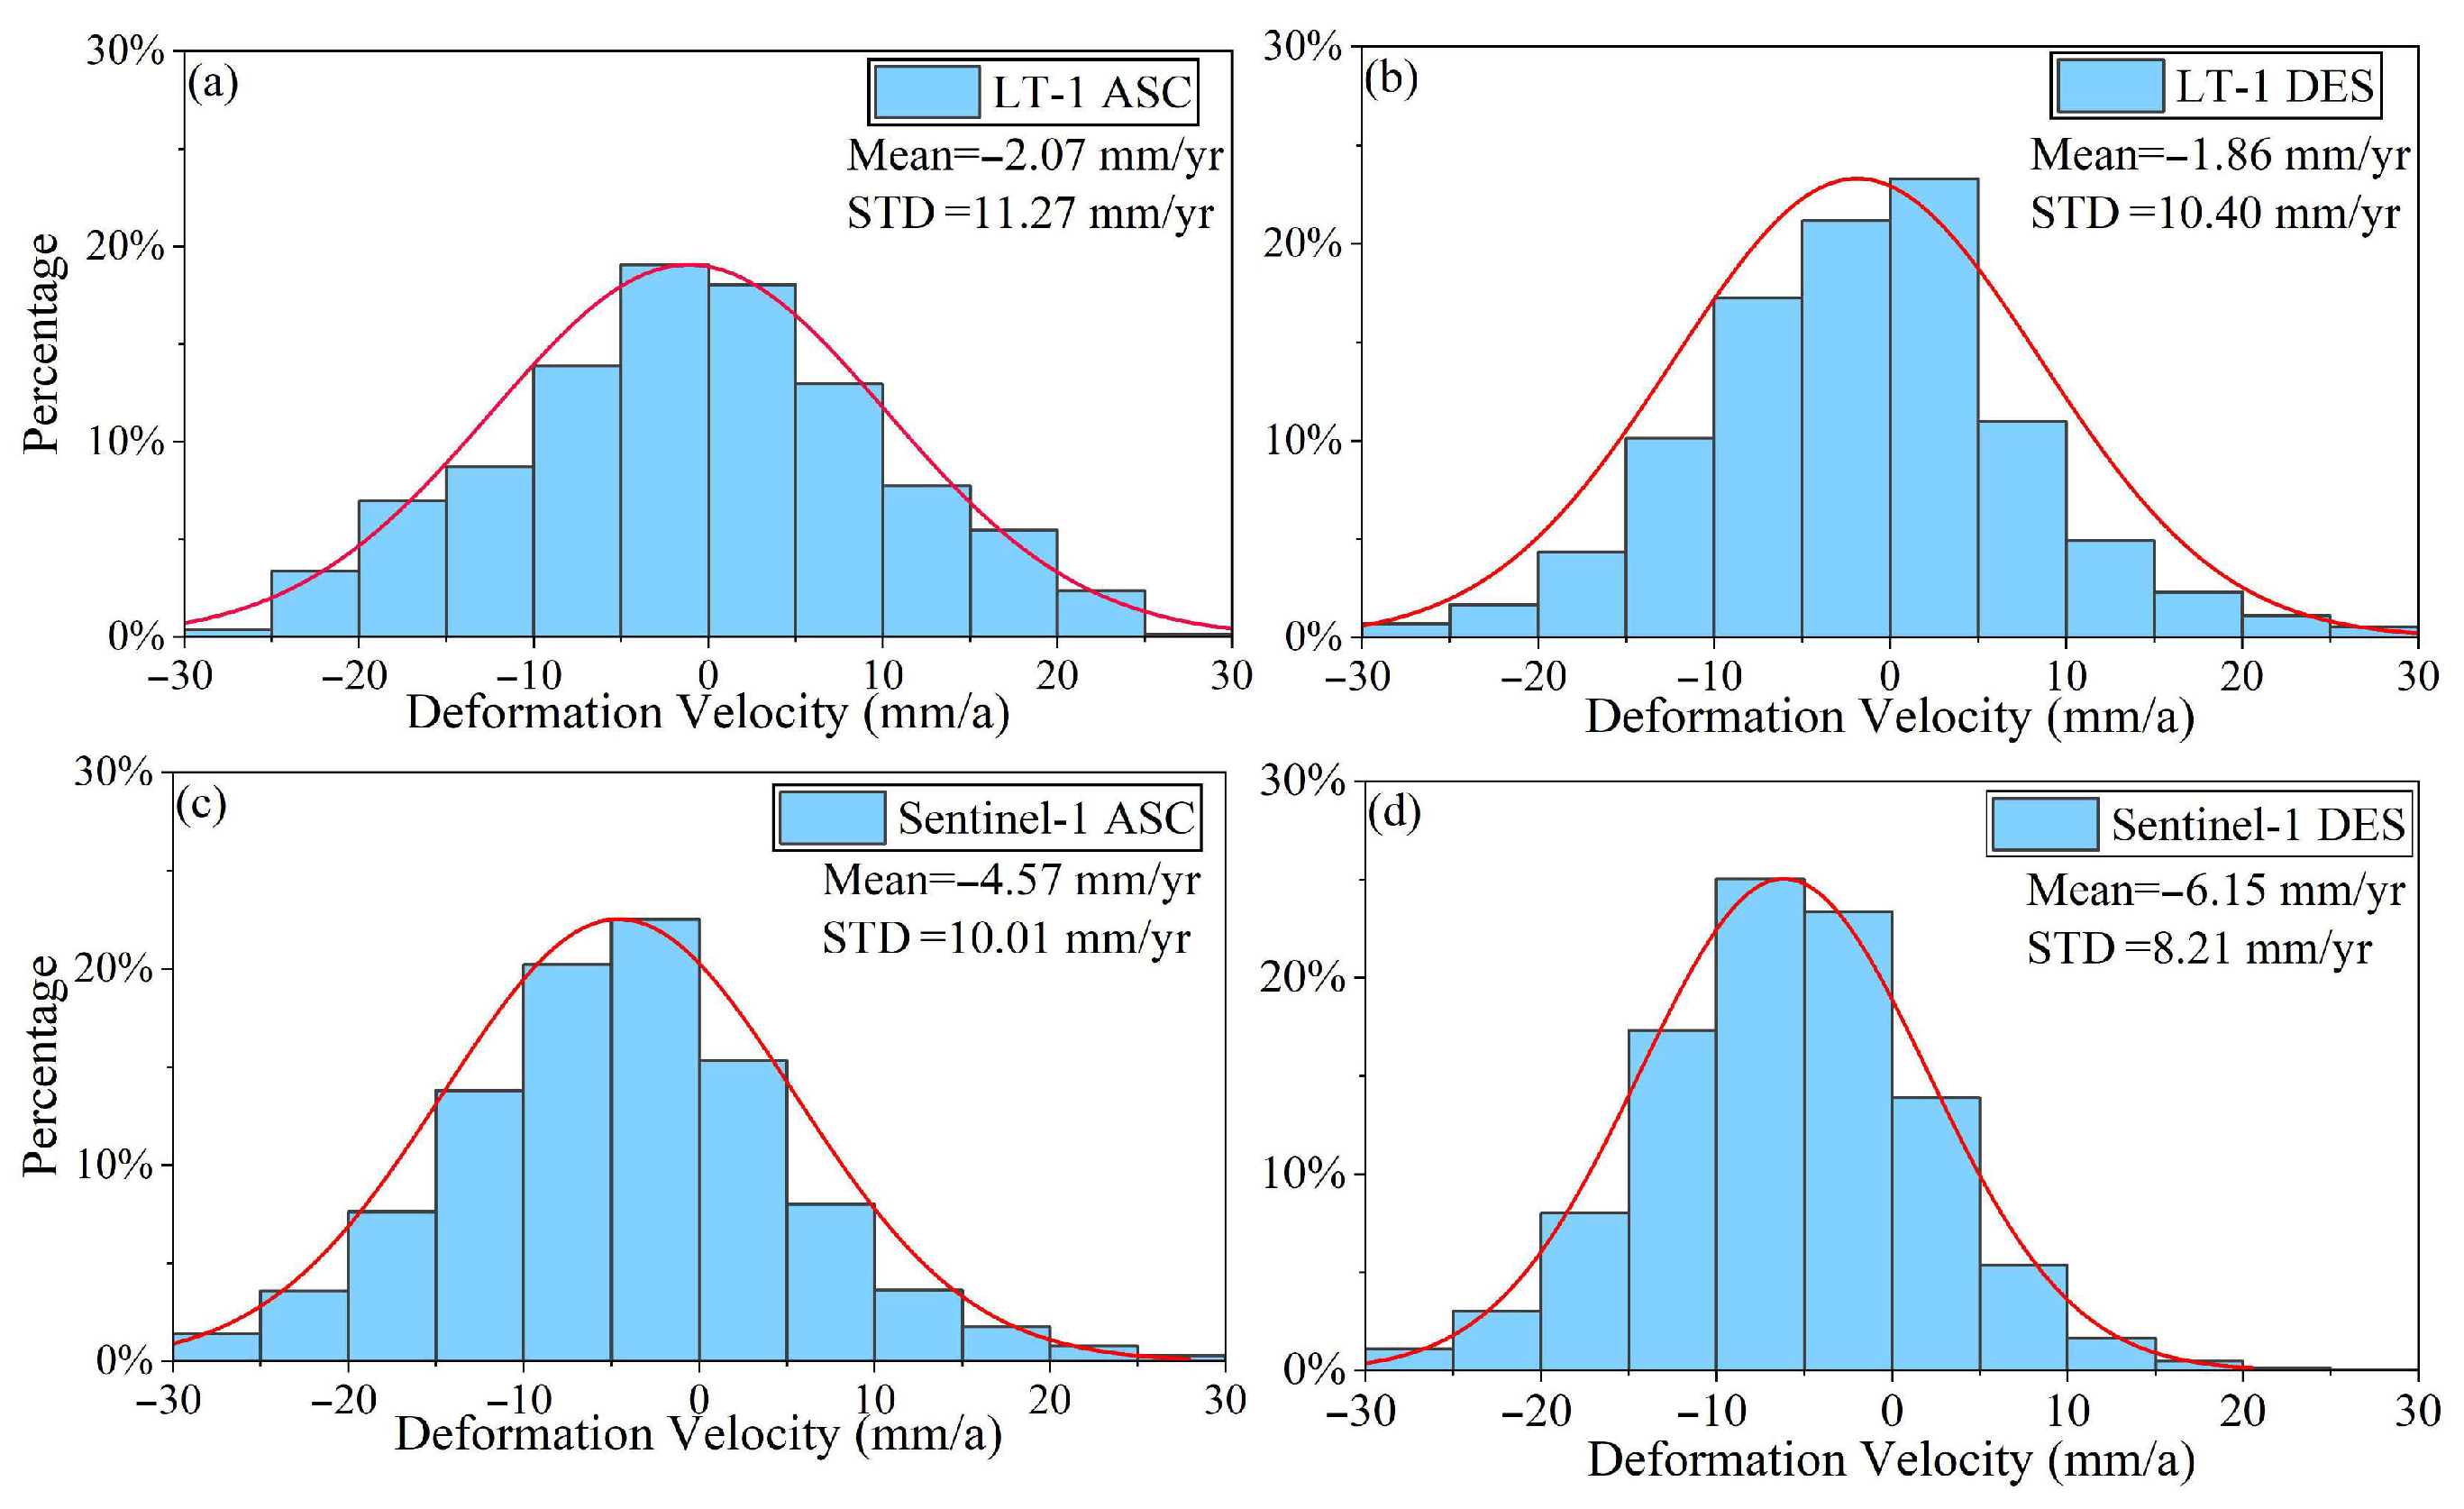
Based on the Stacking-InSAR technique, time-series deformation results of the Dadu River Basin in Luding County were obtained using ascending and descending LT-1 satellite data from 2023 to 2024. To evaluate and validate the landslide detection capability of LT-1 data, deformation monitoring and landslide identification were also conducted using Sentinel-1 ascending and descending data acquired during a comparable time frame. The average deformation rate maps derived from both LT-1 and Sentinel-1 datasets are shown in Figure 7. To evaluate the accuracy of the deformation rates obtained from LT-1 and Sentinel-1 data, we performed histogram analysis and calculated the mean and standard deviation of the deformation rates. The final statistical results are shown in Figure 8. Most deformation values in the study area fall within ±10 mm/yr, and the fitted deformation curves exhibit a normal distribution. The average deformation rates from both ascending and descending tracks of LT-1 are closer to zero than those from Sentinel-1, indicating that LT-1 provides slightly better stability in deformation measurements. In terms of standard deviation, LT-1’s ascending and descending orbits have values of 11.27 mm/yr and 10.40 mm/yr, respectively, while Sentinel-1’s ascending and descending orbits have values of 10.01 mm/yr and 8.21 mm/yr, indicating that Sentinel-1’s data are more tightly clustered around the average deformation rates. The statistical analysis suggests that the deformation results obtained from LT-1 and Sentinel-1 are reliable and can provide a solid accuracy foundation for subsequent landslide identification and monitoring.
By integrating high-resolution optical satellite imagery and topographic data, 23 potential landslides were identified using LT-1 data, including 12 detected from ascending track and 11 from descending track imagery. In comparison, the deformation monitoring and landslide identification results derived from Sentinel-1 data revealed 18 potential landslides—10 from the ascending data and 9 from the descending data. Among these, 17 landslides were consistent with those identified from LT-1 data. Table 2 summarizes the basic information about the detected landslides. An analysis of the topographic distribution indicates that nearly 70% of the landslides occurred at elevations above 1600 m, with a significant proportion located on steep ridge slopes. This spatial pattern aligns well with the geomorphological conditions conducive to landslide development, further underscoring the critical role of topography in the landslide formation process.
Due to the side-looking imaging geometry of SAR satellites, high-altitude mountainous areas with rugged terrain are subject to significant geometric distortions. These distortions, particularly layover and shadowing, are more pronounced in river valleys affected by terrain slope and incision depth [33]. In this study, based on the digital terrain model and orbital parameters such as the satellite incidence angle, we analyzed the distribution of geometric distortions in SAR data acquisitions for each orbit within the study area. The geometric parameters of the four SAR orbital tracks are summarized in Table 3.
The geometric distortion visibility results are shown in Figure 9. The results indicate that in the complex mountainous terrain of the Luding earthquake zone, all four SAR tracks suffer from severe geometric distortion, with the proportion of well-visible areas being only around 50%. Foreshortening and layover effects are predominantly concentrated on the western slopes when monitored by ascending orbit SAR data, and on the eastern slopes when observed by descending orbit SAR data. Moreover, the incidence angle of the SAR data has a significant impact on the extent of layover areas. The LT-1 ascending orbit data, with an incidence angle of 30.38°, exhibits the largest layover area proportion at 16.23%. This is followed by Sentinel-1 descending orbit data with an incidence angle of 33.89°, where the layover area accounts for 11.43%. Conversely, the layover proportions for LT-1 descending orbit data and Sentinel-1 ascending orbit data are comparatively smaller. These findings suggest that smaller incidence angles increase layover and shadowing regions. Therefore, SAR data acquired at larger incidence angles can more effectively mitigate the adverse effects of layover and shadowing geometric distortions on landslide detection in complex mountainous environments. Finally, we analyzed the geometric distortion distribution statistically when fusing ascending and descending orbit data. The results demonstrate that the well-visible areas of LT-1 and Sentinel-1 data reach 93.82% and 92.58%, respectively, significantly suppressing the effects of foreshortening, layover, and geometric distortion. Based on the potential landslide detection results in the study area, 13 landslides were identified using ascending data, while 11 landslides were detected using descending data. However, only one landslide was simultaneously detected by both ascending and descending tracks. The significant difference between the two datasets is primarily due to some of the identified landslides being located in layover areas of the other orbit’s data, which prevented effective detection. Consequently, in complex mountainous regions, combining ascending and descending orbit data for landslide detection not only effectively reduces geometric distortion effects and minimizes false negatives and false positives but also enables mutual validation of detected landslide areas monitored by both orbit directions, thereby enhancing the reliability of landslide detection.
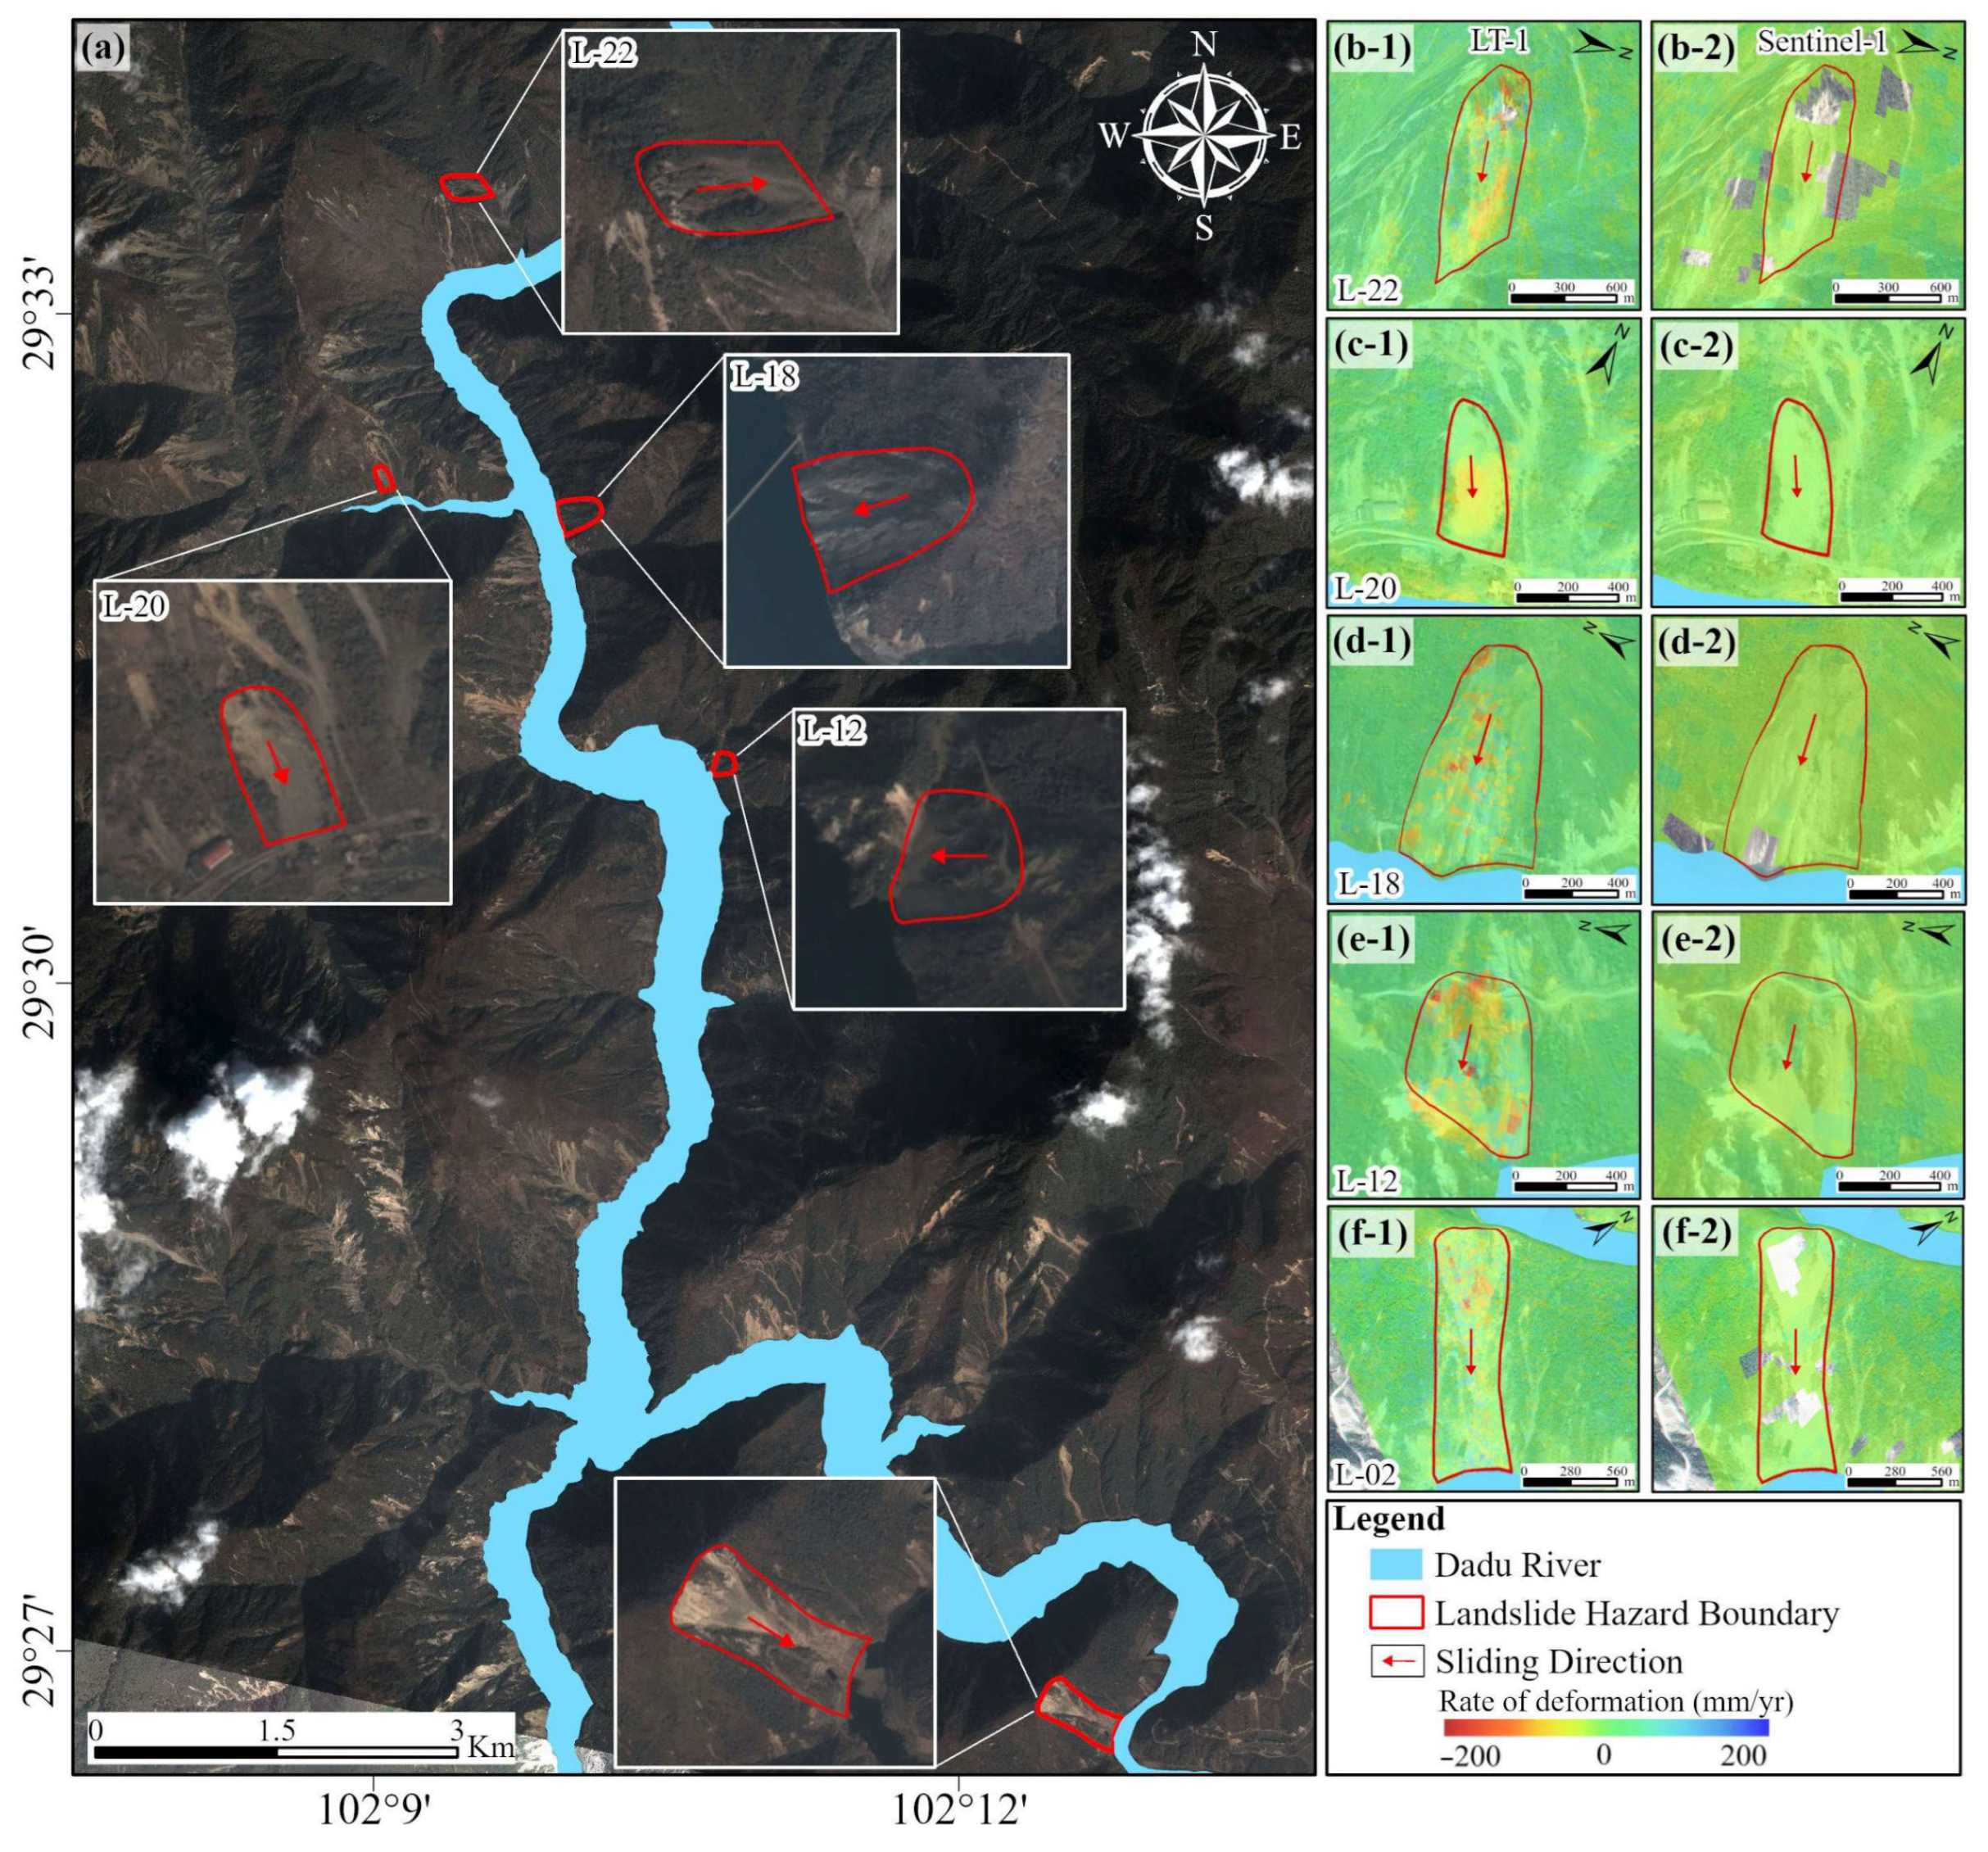
To further investigate the landslide detection capability of LT-1 data in mountainous areas, this study analyzed the discrepancies in detection results between LT-1 and Sentinel-1 for both ascending and descending tracks. Differences were observed among the 23 identified potential landslide sites at six locations. Notably, landslide site L-23 was detected exclusively by Sentinel-1, while LT-1 failed to capture it. This is primarily attributed to the incomplete spatial coverage of the site by the ascending LT-1 data. In contrast, the remaining five sites (L-02, L-12, L-18, L-20, and L-22) were detected solely by LT-1, with no corresponding detection in the Sentinel-1 results. Two main reasons may account for this discrepancy: (1) Sentinel-1 detected only low-magnitude deformation at these locations, with no concentrated deformation signals; and (2) some of the landslides had relatively small spatial extents, making it difficult for Sentinel-1 data to capture their deformation features effectively due to its lower spatial resolution in deformation point distribution.
As shown in Figure 10, landslide site L-22 is located in the middle portion of a slope, while L-20 is situated at the base of a slope along a tributary of the Dadu River, with its toe extending into a dry riverbed. The remaining three landslide sites are positioned along the banks of the Dadu River, with their toe areas adjacent to the river. Various degrees of surface displacement indicative of landslide activity can be observed in optical imagery at these locations. The deformation results derived from LT-1 data show distinct deformation signals for all five sites. Specifically, the deformation of L-22 and L-20 is primarily concentrated in the lower and middle-lower portions of the slopes. In contrast, deformation in L-12 and L-02 is mainly observed in the upper and upper-middle parts. L-18 exhibits a more scattered deformation pattern, primarily concentrated in the mid-slope region. In contrast, Sentinel-1 deformation results reveal no significant deformation features at these five locations. These landslide sites are all relatively small in spatial extent; for instance, L-20 covers only 0.017 km2. Such small-scale features are difficult to detect effectively with Sentinel-1 due to its lower spatial resolution. These findings demonstrate that LT-1 data can effectively capture subtle deformations in small areas, highlighting its significant potential for detecting minor landslides in mountainous terrain. Compared to LT-1, Sentinel-1 is better suited for monitoring large-scale landslides across broader regions.

4.3. Validation and Analysis of Landslide Detection Results

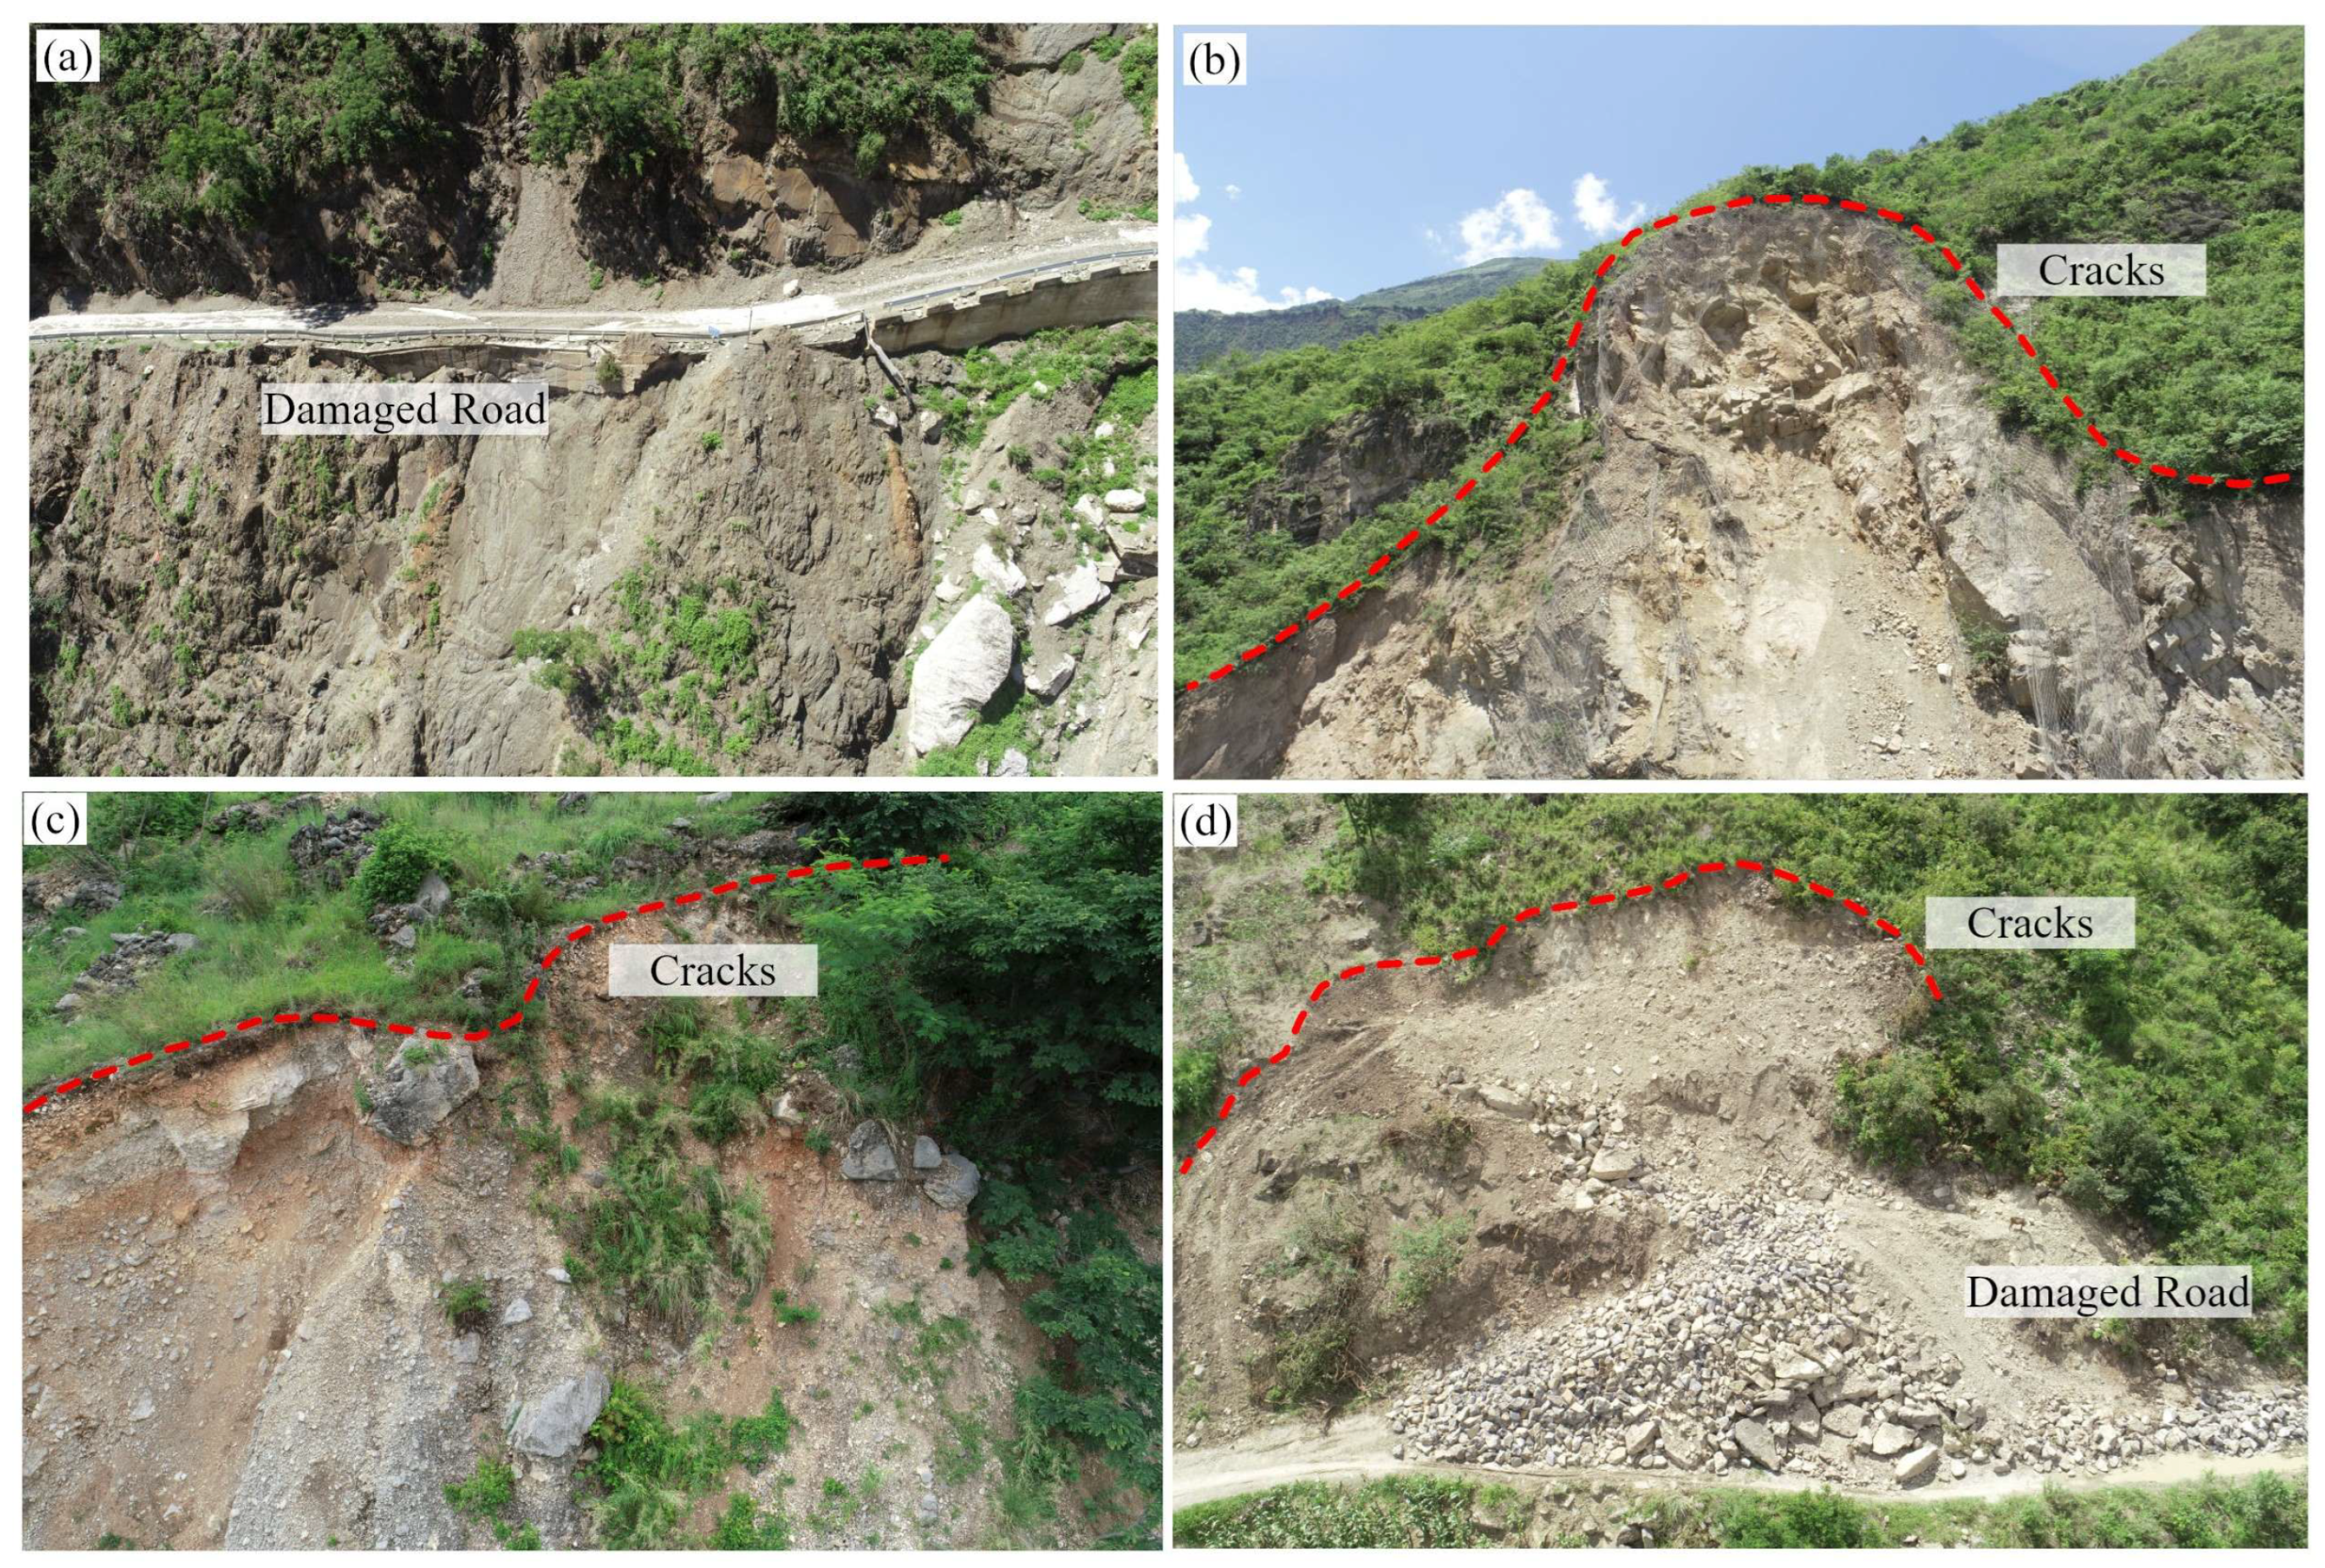
To further validate the accuracy of the landslide detection results in this study, we conducted field investigations in selected landslide areas, as shown in Figure 11. The surveyed sites include four landslide zones: L-12, L-17, L-16, and L-18. The results indicate that all four locations exhibit varying surface deformation features. In the L-12 landslide area (a), there is clear evidence of debris accumulation near the roadside, tilted vegetation on the slope, a free face beneath the road, and partial road damage. In the L-17 area (b), visible erosion gullies and scattered rock fragments are on the slope, indicating apparent signs of deformation. At the L-16 site (c), prominent cracks can be observed on the slope surface, and there is a significant contrast in deformation between the vegetated upper slope and the exposed lower slope. In the L-18 area (d), distinct surface cracks are observed, along with debris blocking the road caused by landslide activity, suggesting evident deformation. These field observations support the reliability of the landslide detection results derived from LT-1 and Sentinel-1 data.
This study also utilized a shallow landslide inventory dataset derived from optical image interpretation following the 2022 Luding earthquake. This dataset serves as a benchmark to validate the accuracy of landslide detection and as a means to further analyze the presence of newly formed landslides that may pose potential hazards in the region. The historical landslide inventory reveals a large number of landslides triggered by the 2022 Luding earthquake, as shown in Figure 12. It is noteworthy that all 23 landslide areas identified during the monitoring period in this study correspond well with shallow landslides recorded in the historical coseismic landslide inventory. This correspondence indicates that these landslides are still undergoing varying degrees of deformation. Furthermore, InSAR-derived deformation results allow for the assessment of whether these landslides exhibit signs of lateral expansion or intensified deformation. However, the absence of significant InSAR-detected deformation in some landslides listed in the historical coseismic inventory does not necessarily imply that these features are in a stable state. Due to the influence of various environmental and geological factors, these landslides still possess the potential for reactivation.
To further evaluate the accuracy of the identified potential landslides, we conducted a spatial overlap analysis based on the historical landslide inventory data, aiming to investigate the spatial correlation between the detected landslides and previously recorded events. The final statistical results of the spatial overlap analysis are presented in Table 4. The results indicate that each of the identified potential landslide areas shows varying degrees of spatial overlap with the historical inventory. Although some areas exhibit relatively low overlap ratios, the majority demonstrate a high degree of spatial correspondence. These findings further support the reliability of the landslide detection results in this study.
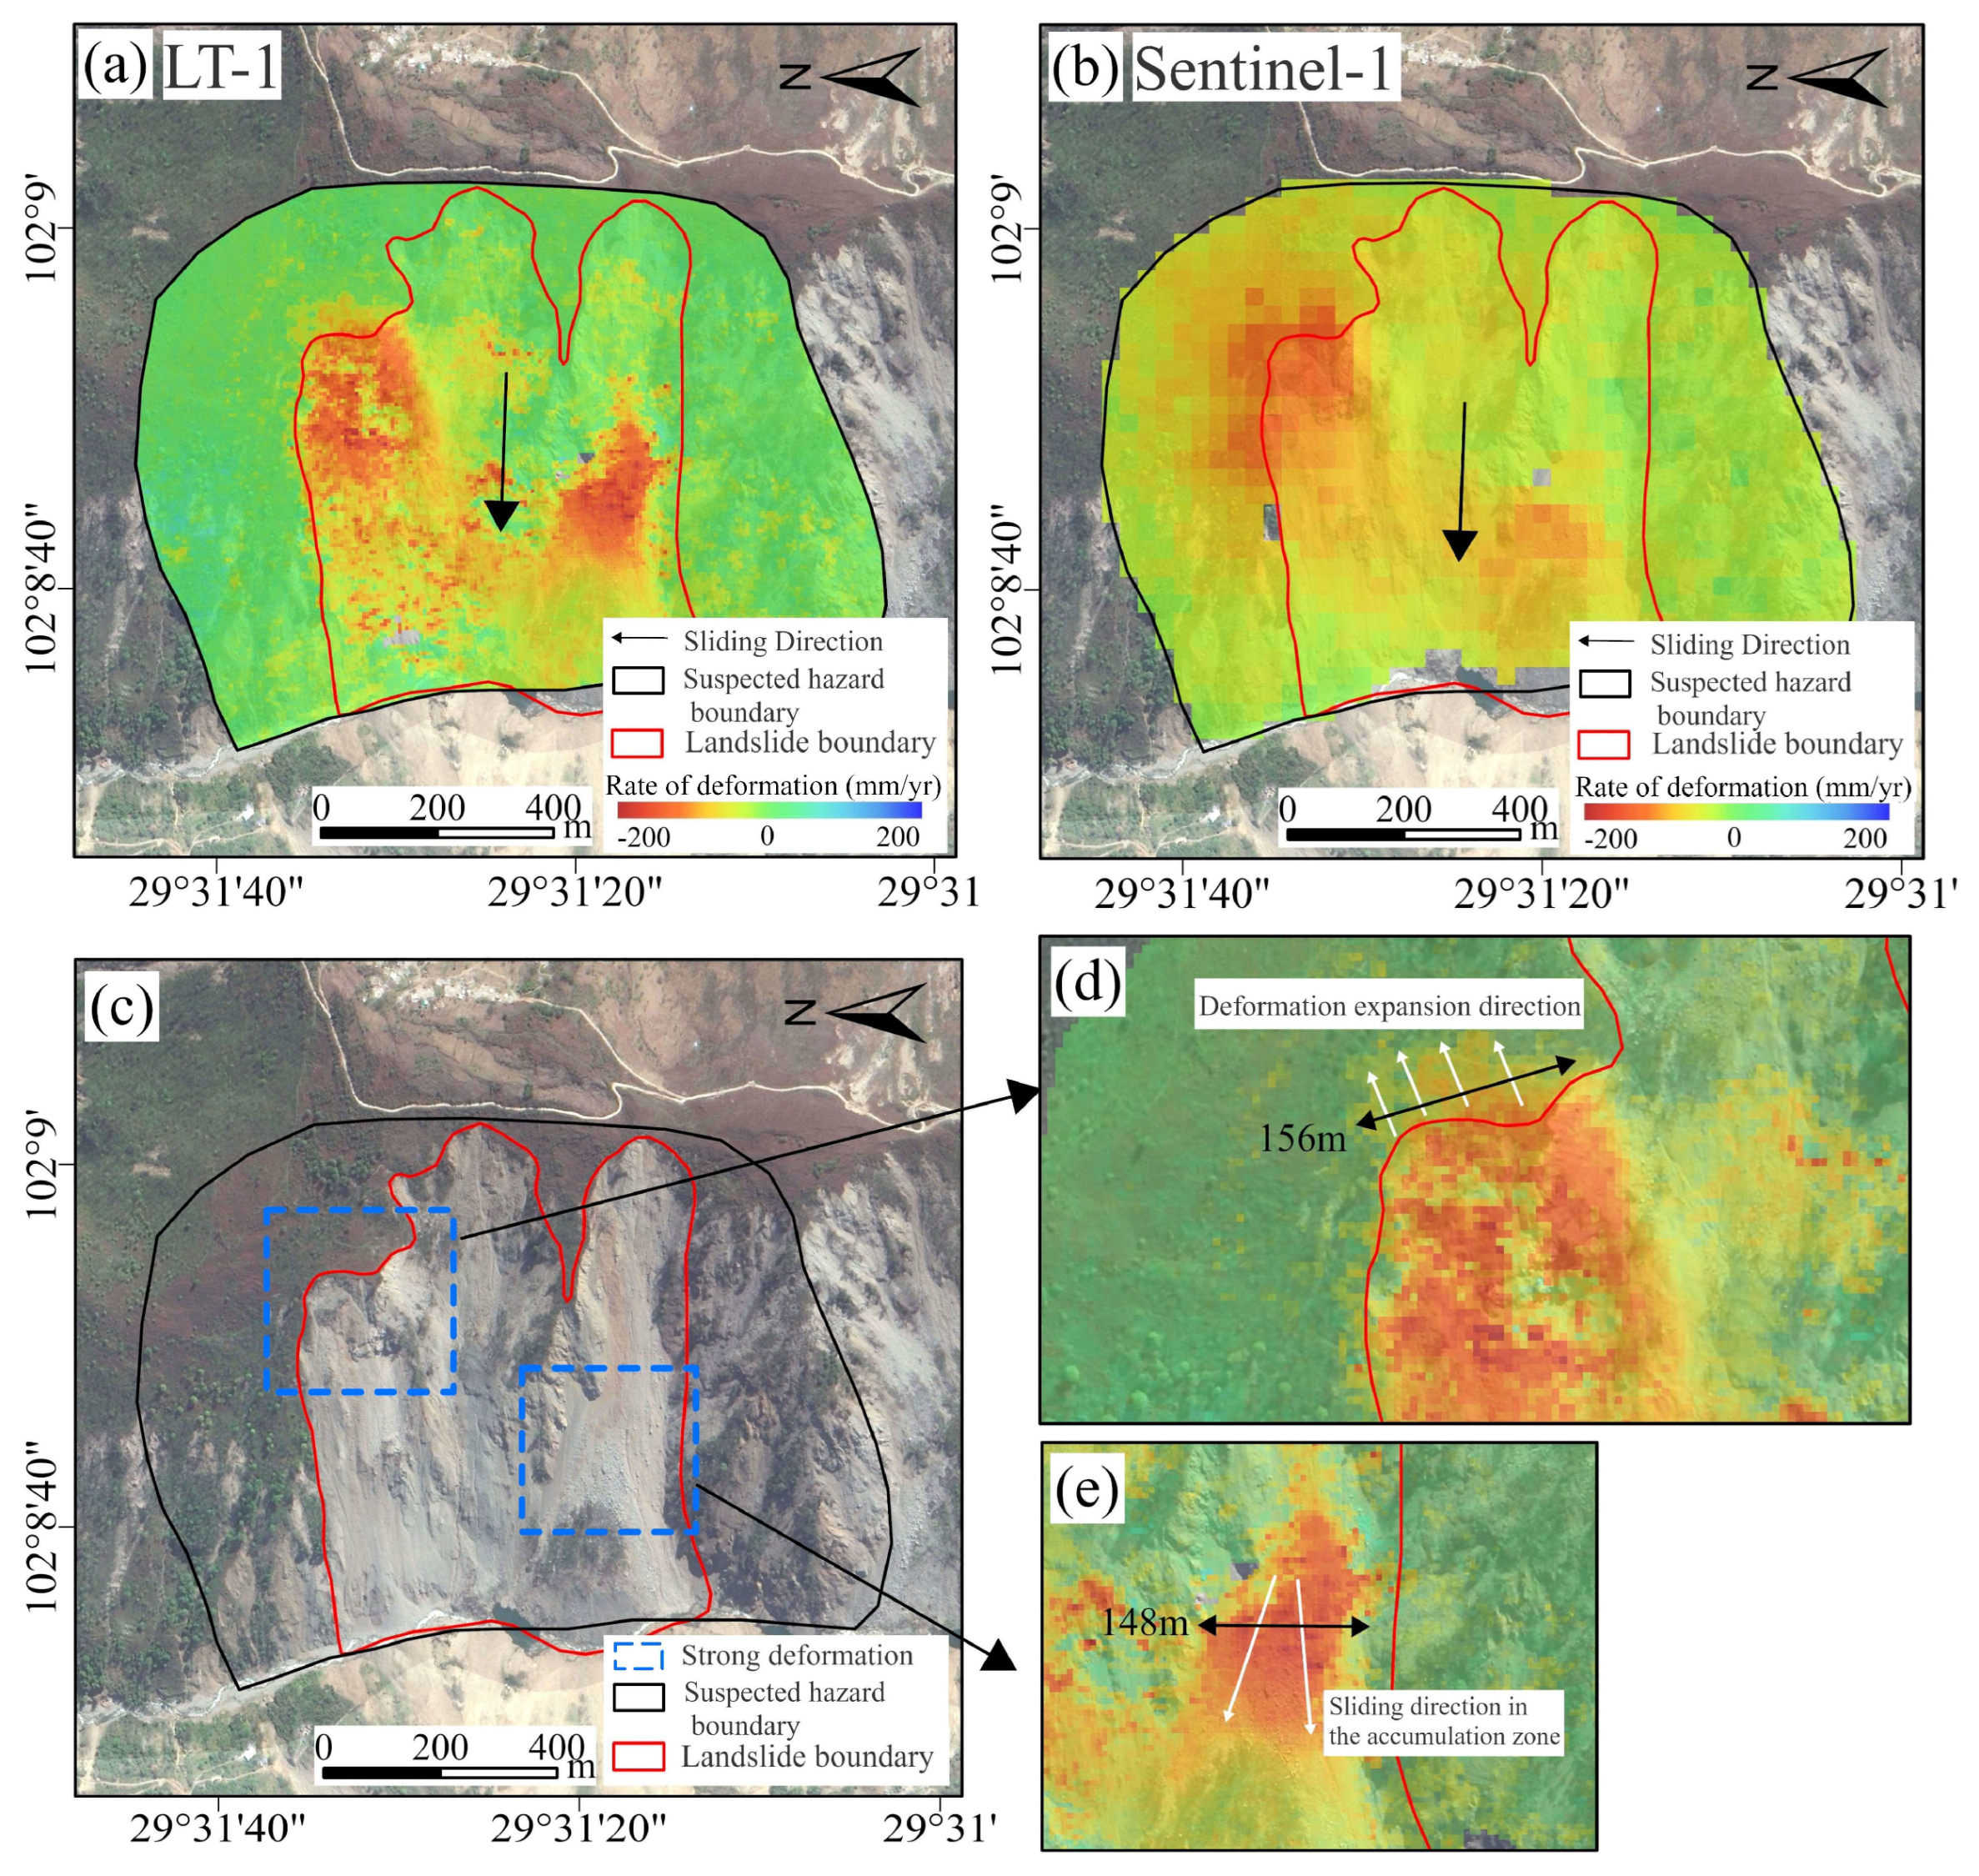
Meanwhile, by integrating InSAR deformation results, the historical landslide inventory, and optical imagery, we identified a large landslide (L-07) exhibiting typical characteristics not documented in the historical landslide dataset or optical imagery. As shown in Figure 13, the L-07 landslide is located on the right bank of the Dadu River. The entire slope faces east and displays a distinct conical shape, narrowing at the top and widening toward the base. The slope is steep overall, with most areas exceeding a gradient of 30°, and the average slope at the lower left reaches over 45°. The landslide body measures approximately 1676 m in width, 1589 m in length, with an elevation difference of about 969 m. The landslide covers an extensive area of 1.87 km2. Within the L-07 landslide region, the shallow landslide features recorded in the historical inventory correspond well with those visible in optical imagery. These shallow landslides are mainly concentrated near the base of the slope and along the adjacent gullies on both sides. In contrast, the central portion of the slope body shows almost no signs of shallow landslides and is covered by dense low-lying shrub vegetation.
According to LT-1 and Sentinel-1 deformation results, the deformation within the shallow landslide areas visible in optical imagery is relatively small and spatially scattered. This indicates that these zones have largely stabilized, with only a few localized areas exhibiting minor deformation. Notably, LT-1 and Sentinel-1 detect extensive and concentrated deformation in the mid-to-upper slope areas of the landslide. The deformation patterns are consistent across both datasets, with LT-1 measuring a maximum annual deformation rate of approximately −183 mm/yr and Sentinel-1 recording about −148 mm/yr. Meanwhile, geological data reveal that the upper part of the landslide area is primarily composed of the Moxi diorite (δo2) and the Wandong plagiogranite (γo2), both classified as intermediate-acid intrusive rocks that are susceptible to weathering. The middle section consists of dark gray sandstone and siltstone from the Triassic Xujiahe Formation (T3x), which are more prone to weathering and erosion, often resulting in the collapse of the overlying harder rocks due to undercutting. The lower part of the slope is composed of the Huangcaoshan granite (γ2), which generally exhibits higher mechanical strength. According to InSAR-derived deformation results, the lower and middle parts of the landslide area show weak deformation, indicating relatively stable conditions in the granite bedrock at the base. In contrast, the upper part is likely affected by weathering processes, leading to the accumulation of loose debris materials. During the rainy season, fracture development facilitates water infiltration and accumulation at the interface between the weathered layer and the relatively impermeable underlying bedrock, leading to an increase in pore water pressure. The elevated pore water pressure reduces the effective stress and shear strength of slope materials [55,56], potentially triggering progressive slope failures or high-elevation debris flows. In addition, several north–south trending faults are developed near the landslide area. Notably, the Detuo Fault and its subsidiary branches pass through the central part of the landslide body, constituting important internal factors contributing to potential deformation.

5. Discussion

5.1. Analysis of Potential Landslide Detection in Densely Vegetated Areas

Previous studies have demonstrated that longer radar wavelengths possess greater penetration capability through surface vegetation, thereby reducing the influence of vegetation cover on SAR imagery [42]. Due to the dense vegetation cover in the Luding mountainous area, the penetration capability of the C-band Sentinel-1 radar over high-vegetation regions is limited. The signal is significantly affected by vegetation, resulting in pronounced temporal decorrelation, which degrades the quality of some monitoring data and hampers the reliable retrieval of the true deformation signals of landslides. In contrast, the L-band LT-1 satellite, with its longer wavelength and stronger penetration capability, demonstrates improved monitoring performance under dense vegetation cover.
As shown in Figure 14(a-1–a-3), the L-13 landslide is located in the central part of the mountain. Optical imagery reveals distinct landslide features, with clear and well-defined landslide boundaries contrasting with the surrounding vegetation. Deformation results from Sentinel-1 indicate the presence of some deformation within this landslide area; however, due to dense vegetation cover, the deformation signals are contaminated by significant noise, making it difficult to accurately identify the landslide and its boundaries. In contrast, the deformation results derived from LT-1 delineate concentrated deformation zones within the landslide body that are distinctly different from the surrounding stable areas. The deformation boundaries closely correspond to those observed in optical imagery. Notably, the left boundary of the deformation zone exhibits a clear leftward expansion relative to the optical landslide boundary, which is particularly evident along the rear and central portions of the landslide body. As shown in Figure 14(b-1–b-3), the L-22 landslide is situated along a mountain valley adjacent to the Dadu River. Optical images show multiple landslide indications, including scattered rock debris, with the landslide area being densely vegetated. LT-1 deformation results reveal significant displacement at both the frontal and rear margins of the landslide. The primary deformation is concentrated at the accumulation zone of rock debris at the landslide’s frontal edge, where the maximum annual deformation rate reaches up to 90 mm. Conversely, Sentinel-1 deformation data show only slight displacement near the rear edge of the landslide. This discrepancy is attributed mainly to the influence of dense vegetation, which degrades the quality of deformation monitoring and results in the ineffective detection of the landslide deformation by Sentinel-1.
As shown in Figure 14(c-1–c-3), the L-14 landslide exhibits a characteristic conical shape with a narrower upper slope widening toward the base. Optical imagery reveals several signs of sliding in the mid-to-lower slope and on the right side, with clearly defined landslide boundaries and conspicuous accumulation deposits at the toe of the slope. In the InSAR deformation results, LT-1 data indicate significant and concentrated deformation in the mid-to-lower slope areas. Sentinel-1 data also show deformation across the slope, with a maximum annual deformation rate of approximately −102 mm/yr. The upper and middle portions of the landslide are covered by extensive vegetation. Within this vegetated area, LT-1 detects a maximum deformation rate of −120 mm/yr, whereas Sentinel-1 records only weak deformation signals, reflecting the disparity in monitoring performance between the different radar bands. Notably, Sentinel-1 does not provide deformation measurements in the central part of the landslide, where LT-1 records a maximum deformation rate exceeding −300 mm/yr. This discrepancy is likely due to deformation exceeding the maximum detectable deformation rate of Sentinel-1’s C-band radar, rendering effective monitoring impossible in that area.
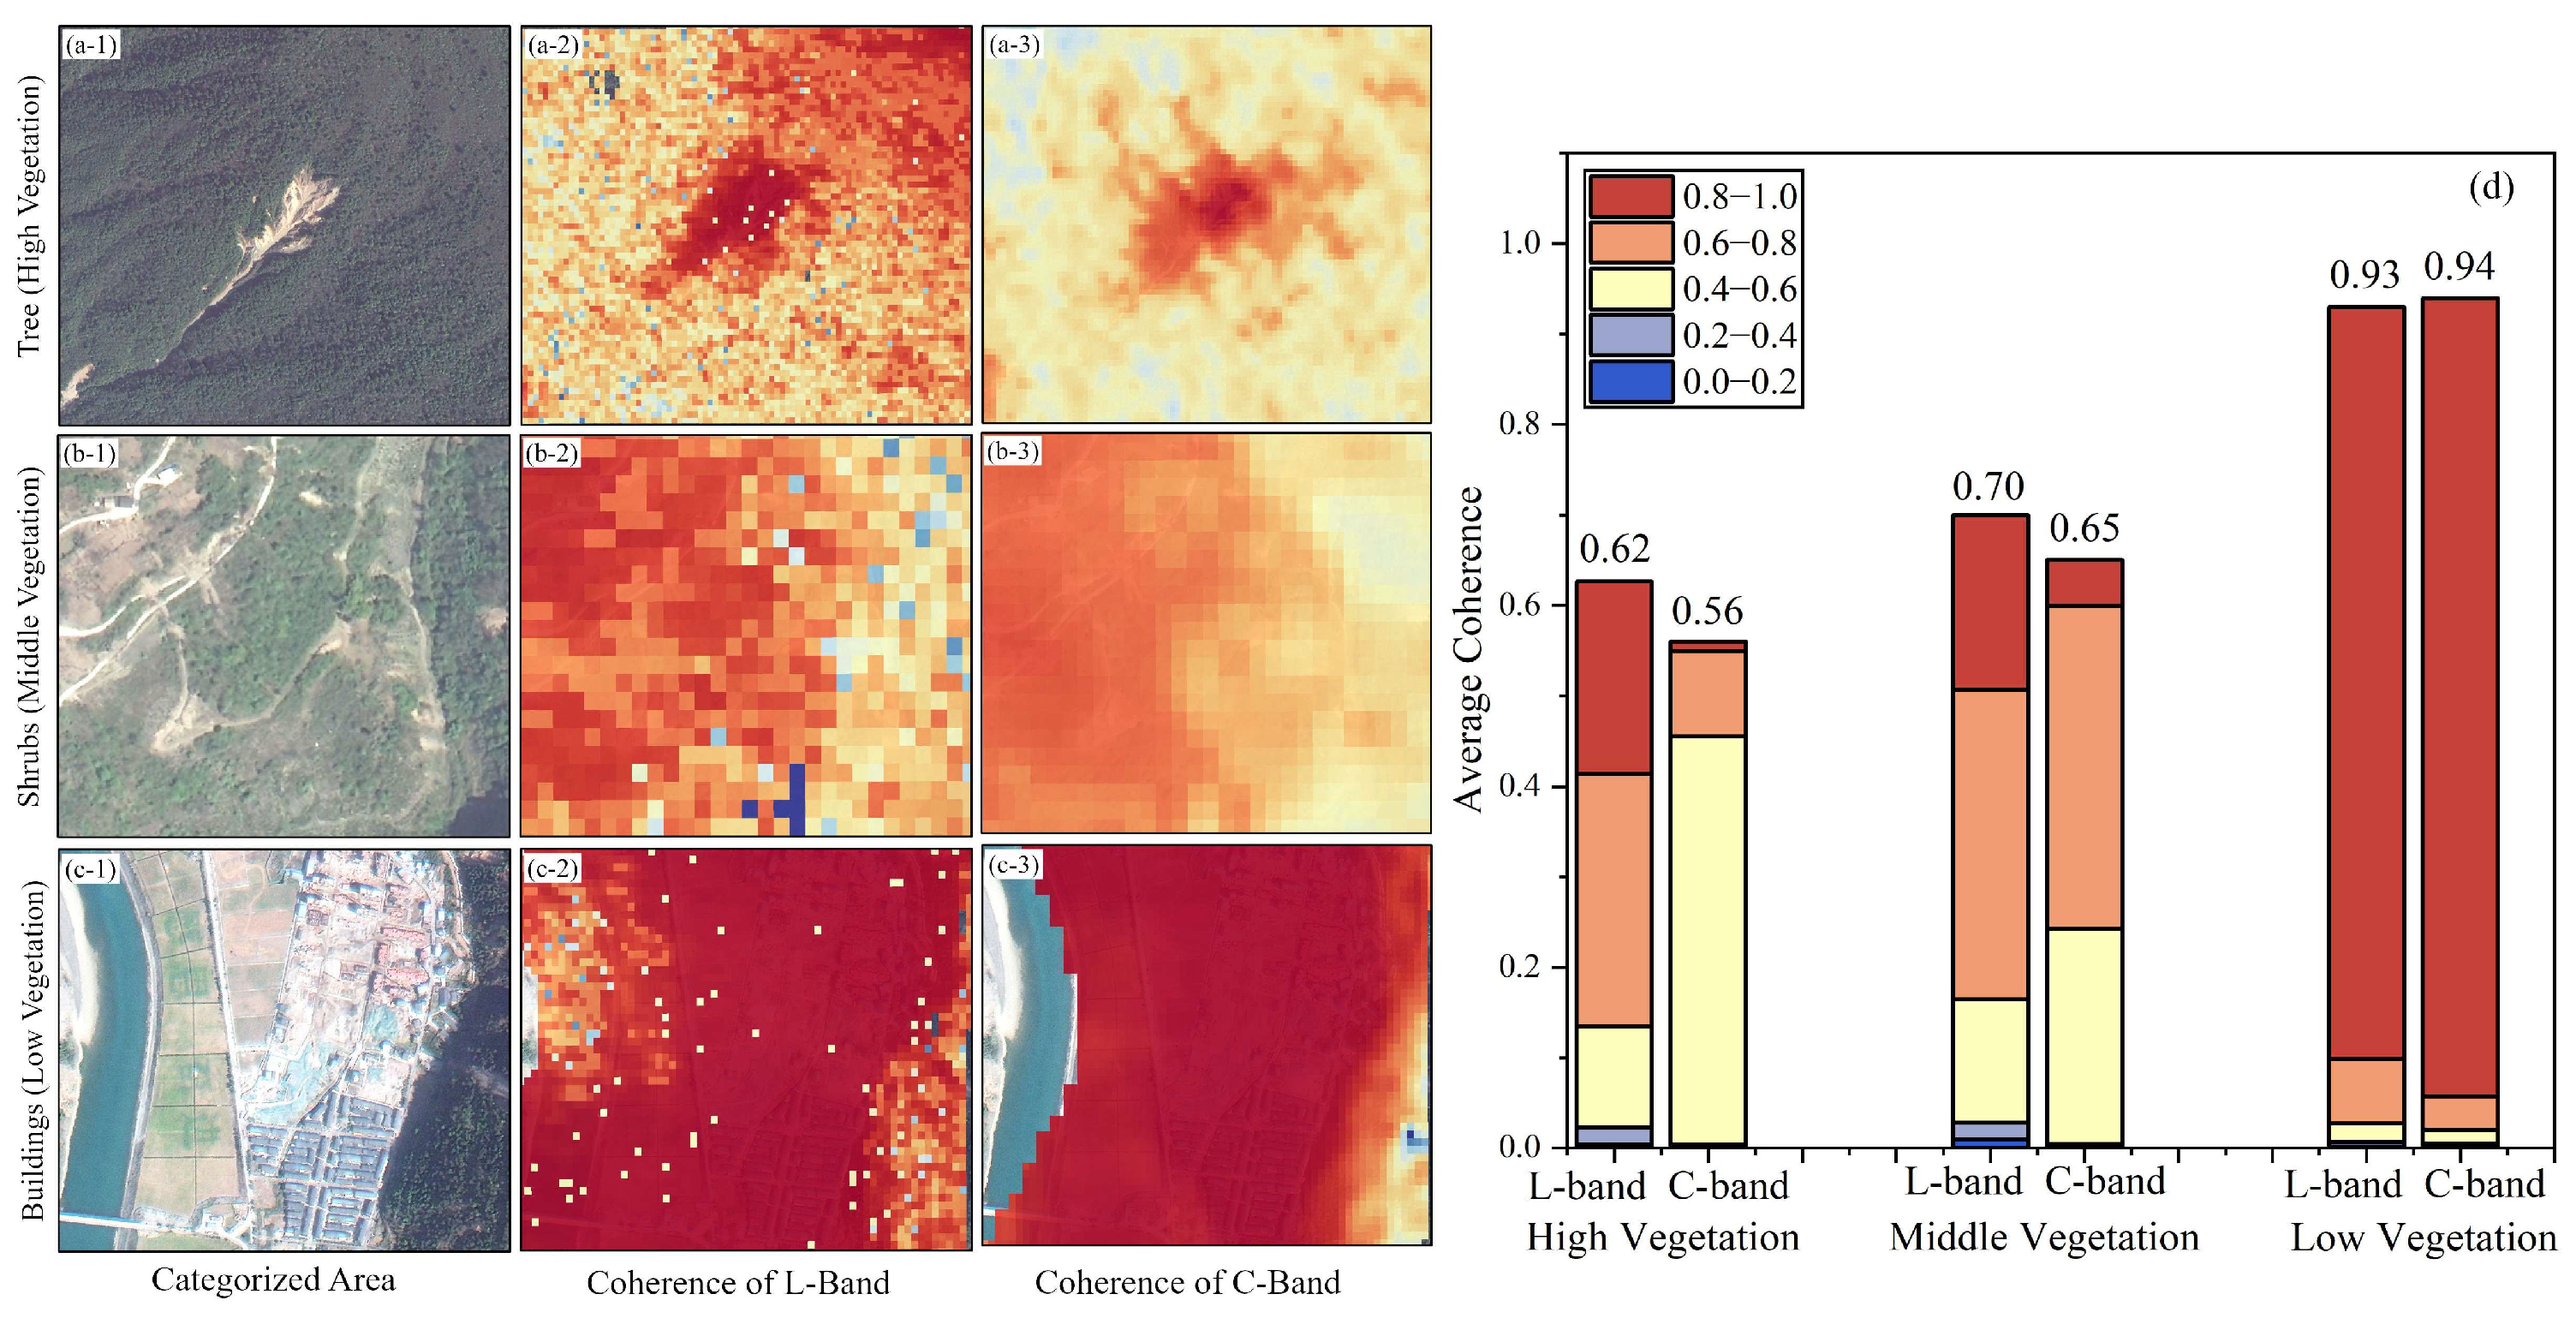
To further compare and analyze the coherence performance of L-band and C-band under different vegetation cover conditions, three representative areas with varying vegetation densities were selected for coherence comparison. Specifically, we chose a densely forested region with high vegetation cover, a shrub-dominated area with medium vegetation cover, and a built-up and bare land region with low vegetation cover. As shown in Figure 15, in the low-vegetation areas of bare land and settlements, both L-band and C-band exhibited high coherence, with mean values of 0.93 and 0.94, respectively. In the shrub-covered medium vegetation area, both bands were affected to some extent, where the L-band maintained an average coherence of 0.70, while the C-band showed a mean value of 0.65. In the densely forested, high-vegetation region, coherence was more significantly degraded, with mean values of 0.62 for L-band and 0.56 for C-band. The comparison indicates that, on the one hand, both L- and C-band are subject to varying degrees of vegetation-induced decorrelation; on the other hand, L-band is less affected in areas of dense vegetation, thus providing stronger detection capability. It is noteworthy that, despite its stronger penetration enabling more effective detection in vegetated environments, the L-band also tends to introduce greater noise, as illustrated in Figure 15(a-2–c-2), where the coherence point distribution appears noisier compared to that of the C-band. Therefore, exploiting the complementary advantages of multi-band InSAR for landslide monitoring constitutes an important approach to improving monitoring accuracy.

5.2. Analysis of Small-Scale Potential Landslide Detection

The LT-1 satellite, operating in strip 1 mode, supports a spatial resolution of up to 3 m, providing a significant advantage for refined landslide detection and interpretation. This capability allows for effective identification of internal deformation characteristics within landslide bodies as well as multiple secondary landslides. Additionally, it enables more precise detection of the deformation extent of small-scale unstable landslides and more effective capture of their deformation features. To further investigate the detection capability of LT-1 for small-scale landslides, this study analyzes three cases: the L-03, L-04, and L-15 landslides.
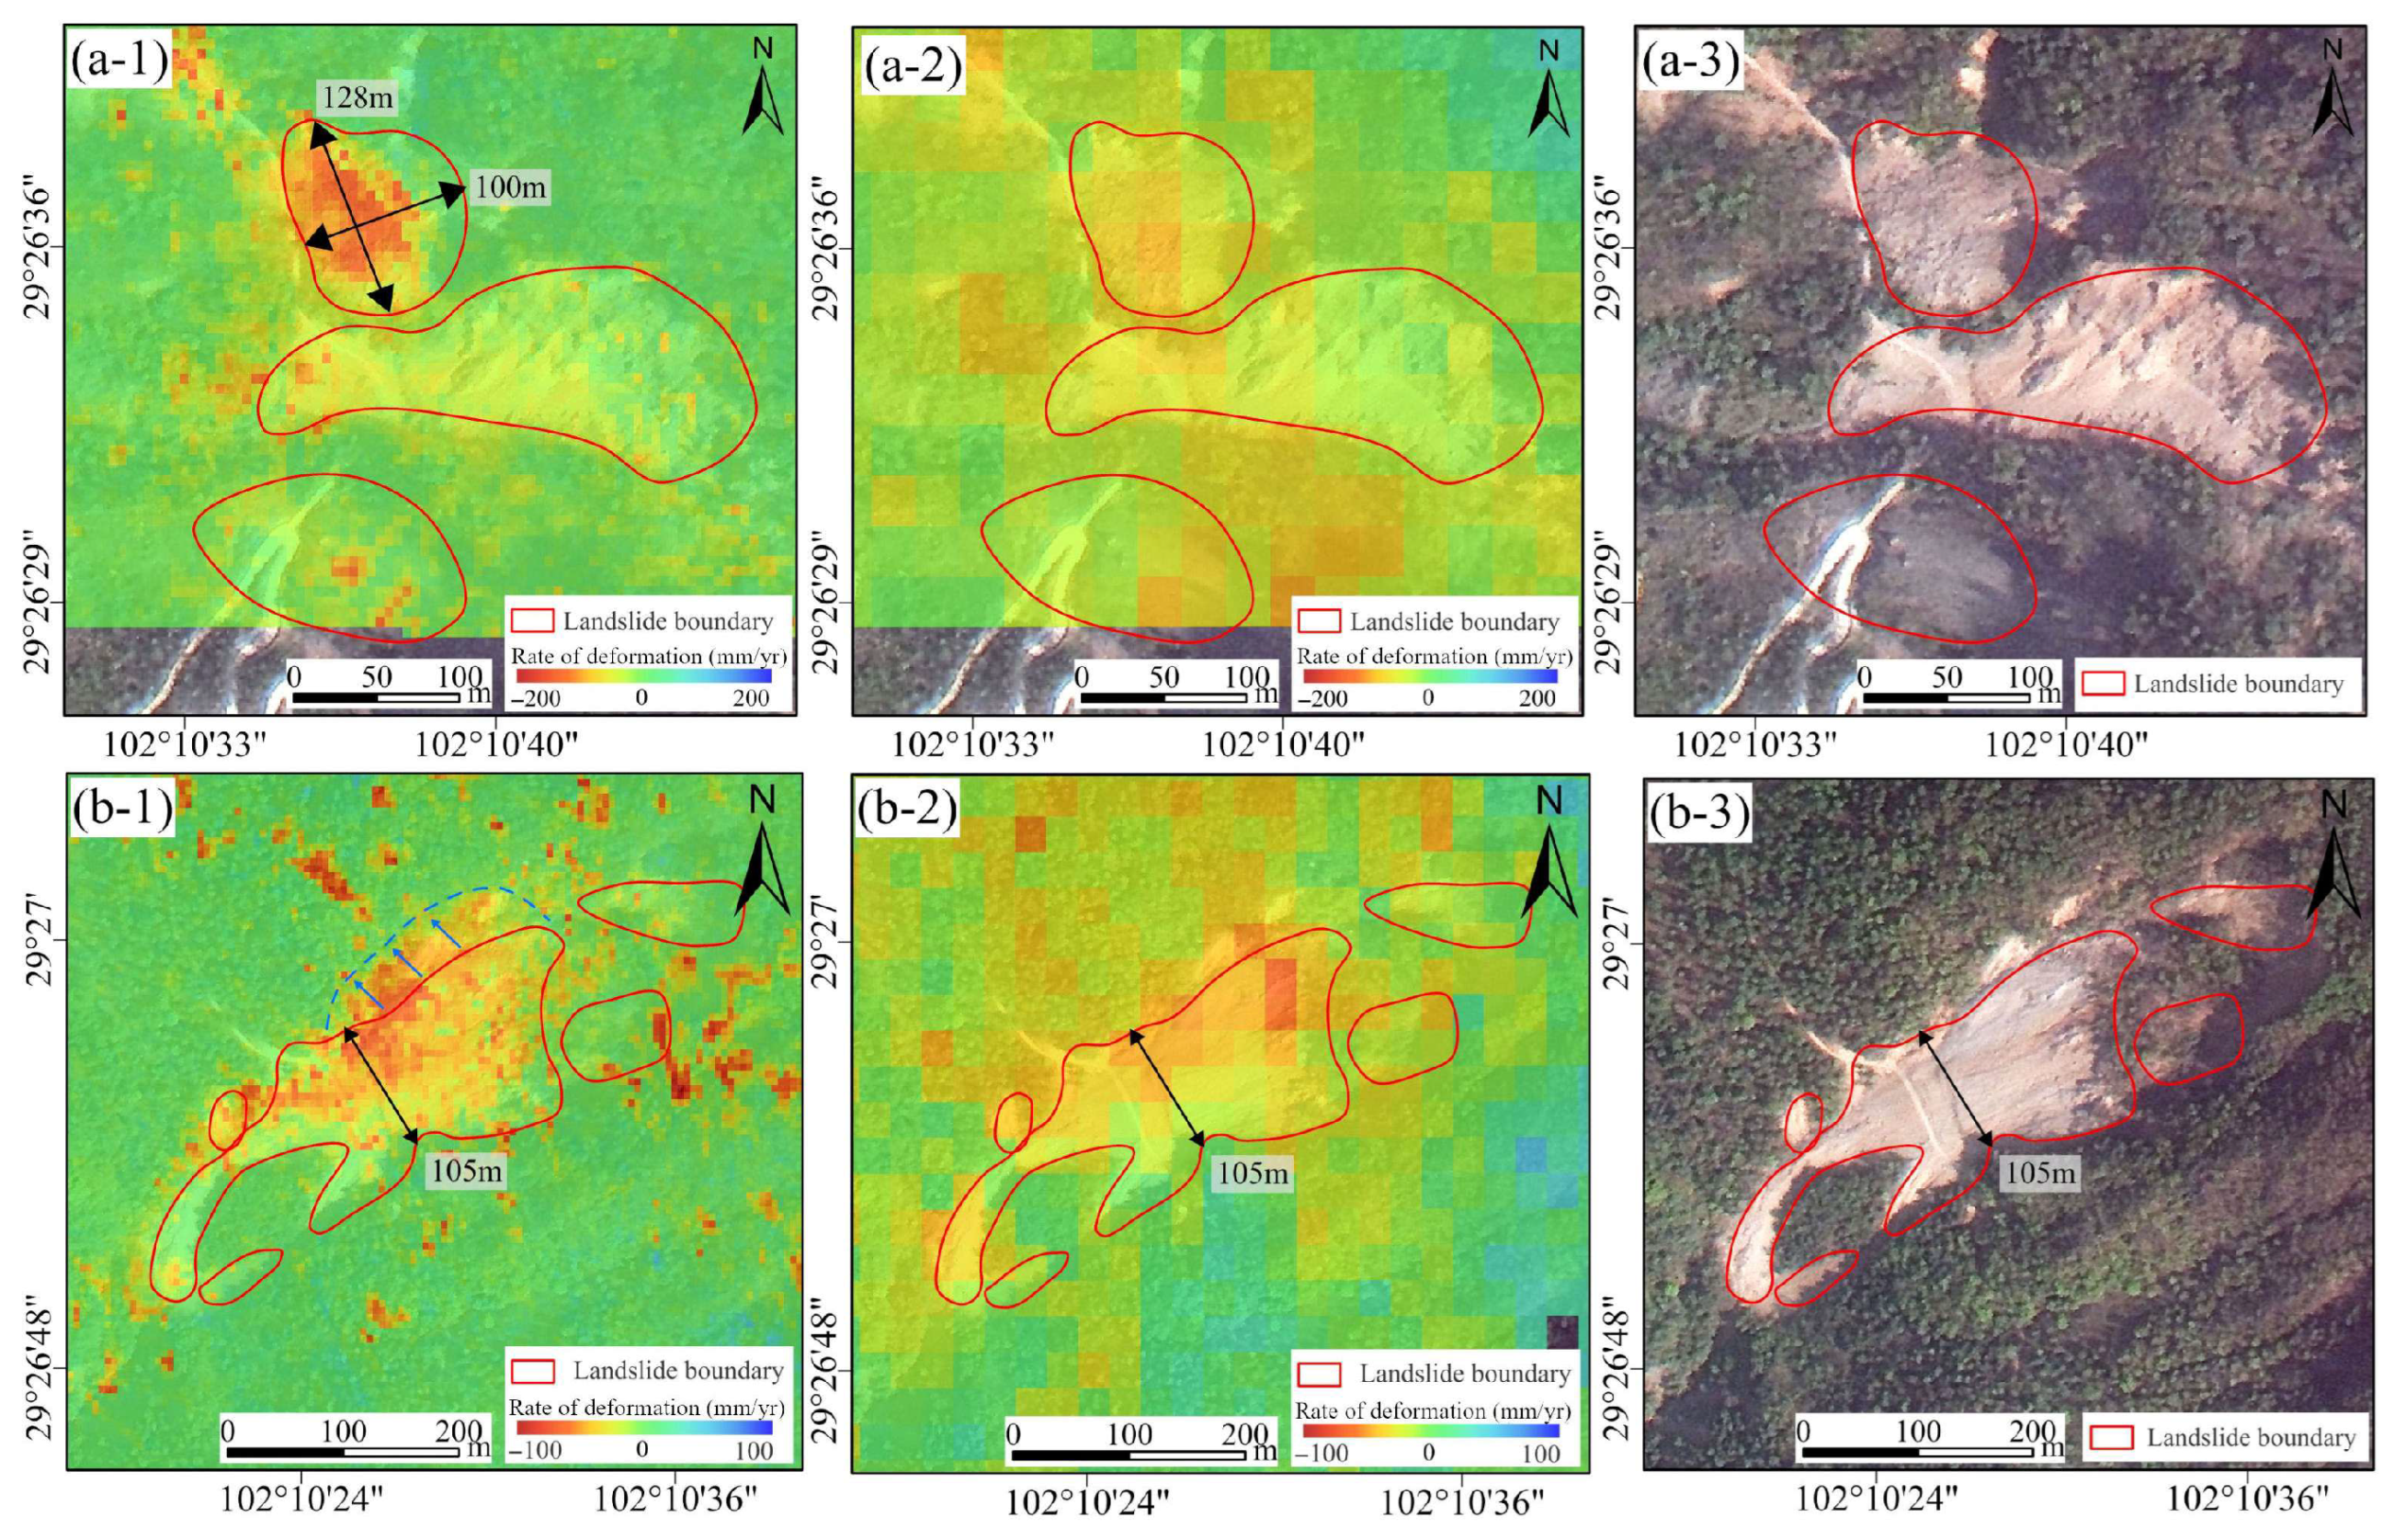
As shown in Figure 16, the L-03 and L-04 landslides are typical examples of small-scale landslides, characterized by relatively limited deformation areas. Deformation is detectable in Sentinel-1 results, but LT-1’s higher spatial resolution allows for a clearer depiction of internal deformation features. For the L-03 landslide, two distinct landslide zones with clear boundaries are evident. The smaller landslide area measures approximately 100 m in length and 128 m in width, covering a total area of only 0.011 km2. Although Sentinel-1 monitoring shows deformation in this region, its spatial resolution limits the accurate delineation of landslide boundaries. In contrast, LT-1 data reveal concentrated and significant deformation in the northernmost landslide zone, with a maximum deformation rate reaching −117 mm/yr. Corresponding optical imagery shows substantial accumulation of post-landslide debris in this area, indicating that LT-1 deformation monitoring aligns well with optical landslide characteristics. This confirms a significant sliding deformation trend in the frontal accumulation zone of the landslide. In the case of the L-04 landslide, both LT-1 and Sentinel-1 detect noticeable deformation patterns that largely coincide with landslide areas visible in optical imagery. However, LT-1 provides more precise delineation of the landslide deformation boundaries. Notably, LT-1 deformation results show a distinct outward expansion trend along the left boundary of the landslide body, with the maximum deformation rate at the left boundary reaching −83 mm/yr. This deformation boundary extends beyond the landslide limits observed in optical images. This phenomenon is likely caused by reduced stability in the boundary area behind the landslide due to rainfall and gravitational forces, resulting in sustained deformation and an outward expansion of the landslide boundary.
As shown in Figure 17, the L-15 landslide exhibits a relatively large overall deformation area, with an estimated boundary area of approximately 0.37 km2 and a perimeter of about 3 km as delineated in optical imagery. The rear and left boundaries of the landslide are visible in the optical images, with numerous scattered, granular, silvery-white debris deposits observed within the landslide body. Outside the landslide boundaries, low-lying shrub vegetation is prevalent. The LT-1 deformation monitoring results show that deformation is primarily concentrated in the tensile crack zone along the left rear boundary. The left deformation boundary detected by LT-1 closely coincides with the left landslide boundary observed in optical satellite imagery. However, the deformation boundary in the left rear region extends noticeably beyond the optical landslide boundary, indicating an outward expansion trend in the tensile crack zone, with an expansion width of approximately 156 m. Meanwhile, deformation on the right side of the landslide is mainly concentrated at the accumulation zone along the landslide front. The area of concentrated deformation on the landslide front corresponds closely with debris accumulation visible in the optical images, suggesting poor stability and an ongoing downward sliding deformation trend. Sentinel-1 deformation results generally align with the overall trends observed by LT-1, although some differences in the spatial distribution of deformation are evident. These discrepancies are likely attributable to differences in monitoring periods and satellite sensor characteristics.

5.3. Limitations and Challenges of LT-1 in Landslide Detection

Although LT-1 has demonstrated superior landslide detection capabilities in the complex mountainous terrain of Luding, it still faces certain limitations and challenges in practical monitoring applications. Firstly, since its launch in 2022, the existing archived data from LT-1 can only support monitoring applications for the past two years. Due to limitations in archived data and monitoring cycles, LT-1 still faces challenges in long-term monitoring, particularly for the early detection of landslides [42,54]. In contrast, Sentinel-1 or ALOS data can effectively provide archived data spanning nearly a decade, giving them a significant advantage for long-term landslide monitoring. Second, in terms of monitoring range, LT-1’s Strip Mode 1 has a swath width of 50 km, and Strip Mode 2 has a swath width of 100 km. In Sentinel-1’s IW mode, the maximum swath width supported is 250 km. In terms of wide-area landslide monitoring, LT-1 still faces certain challenges. Moreover, under vegetated conditions, the LT-1 satellite, with its long-wavelength L-band advantage, can effectively enhance landslide monitoring performance. However, in areas with dense and fully developed vegetation cover, its monitoring capability remains limited. The effective identification of concealed potential landslides under such conditions continues to pose a significant challenge. Finally, some inaccurate real-time orbit data from the LT-1 satellite can lead to low initial registration accuracy, which limits processing efficiency and precision. However, as the volume of LT-1 satellite archived data increases and orbital parameters or registration algorithms are optimized in the future, LT-1 can still serve as an ideal data source for long-term landslide monitoring. In addition, due to the advantages of Sentinel-1 data being freely and openly accessible, along with its ability to provide long-term and stable large-scale observations, Sentinel-1 will continue to play a key role in sustained monitoring and historical data accumulation in future landslide monitoring systems. By integrating Sentinel-1 with LT-1’s high spatial resolution and L-band characteristics, multi-source satellite data fusion can be achieved in the future, enabling more accurate and stable long-term landslide monitoring and early warning capabilities.

6. Conclusions

This study focuses on the Luding Dadu River Basin as the key research area and employs ascending and descending LT-1 and Sentinel-1 SAR images acquired between August 2023 and April 2024 to identify small-scale landslide hazards using the Stacking-InSAR method, in combination with high-resolution optical imagery, and presents the results of landslide identification based on the historical landslide inventory. We also verified the small-scale landslide monitoring capability of LT-1 in complex mountainous areas covered with vegetation. The main conclusions are as follows:
(1)
A total of 23 landslide hazards were identified by LT-1 and Sentinel-1, of which 22 were effectively identified by LT-1 and 18 by Sentinel-1. Strong signs of landslide movement and obvious landslide boundaries in the landslide areas can be seen in the optical satellite images, which indicate that these landslides continued to deform during the monitoring period and are still in an unstable state. These active landslides not only exhibit distinct geomorphic boundaries in the optical images but also show significant deformation during the monitoring period, indicating that they are in an unstable state.
(2)
In the analysis of landslide characteristics in complex mountainous environments and small-scale environments identified by LT-1, LT-1 performs better than short-wave bands in long-wave band identification and monitoring, especially in environments with vegetation. With its high spatial resolution advantage, LT-1 can more accurately detect the range and boundaries of deformation and more precisely outline the spatial deformation characteristics of landslides.
Overall, the LT-1 satellite has achieved a relatively good recognition effect in monitoring potential landslides in complex mountainous environments. However, certain limitations remain for long-term landslide monitoring, particularly in terms of the volume of archived data and orbital control. Future work can further enhance LT-1’s capability for sustained and stable landslide monitoring by increasing the volume of archived data and optimizing data processing techniques. Moreover, integrating multi-source satellite data for joint monitoring is also an effective approach to improving the accuracy of potential landslide identification. Ultimately, this study provides effective support for utilizing the LT-1 satellite in potential landslide identification, as well as in landslide prevention, mitigation, and risk-informed decision-making in mountainous regions.

Author Contributions

All the authors participated in editing and reviewing the manuscript. Conceptualization, H.J. and X.Y.; methodology, H.J. and X.Y.; investigation, H.W. and C.L.; data curation, H.W. and X.W.; writing—original draft preparation, H.J. and X.Y.; writing—review and editing, H.J. and X.Y.; visualization, R.Z.; funding acquisition, R.Z. and X.Y. All authors have read and agreed to the published version of the manuscript.

Funding

This work was supported by funding of the Project of Sichuan Geological Survey and Research Institute (SCIGS-CZDZX-2024004); the National Natural Science Foundation of China (42371460); the National Key Research and Development Program of China (2023YFB2604001); the Sichuan Science and Technology Program (2023ZDZX0030) and the Tibet Autonomous Region Key Research and Development Program (XZ202401ZY0057).

Data Availability Statement

The Sentinel-1A SAR images were obtained from the Alaska Satellite Facility (https://search.asf.alaska.edu/ (accessed on 1 August 2024)), with precise orbit data accessed via ESA’s auxiliary data portal (https://step.esa.int/auxdata/orbits/Sentinel-1/ (accessed on 1 August 2024)). We gratefully acknowledge these data providers for enabling this research.

Acknowledgments

The Sentinel-1 data used in this study were kindly provided by the European Space Agency (ESA) through their open data policy. Digital elevation data were obtained from NASA’s Shuttle Radar Topography Mission (SRTM).

Conflicts of Interest

The authors declare no conflicts of interest.

References

  1. Froude, M.J.; Petley, D.N. Global Fatal Landslide Occurrence from 2004 to 2016. Nat. Hazards Earth Syst. Sci. 2018, 18, 2161–2181. [Google Scholar] [CrossRef]
  2. Meng, W.; Xu, Y.; Cheng, W.-C.; Arulrajah, A. Landslide Event on 24 June in Sichuan Province, China: Preliminary Investigation and Analysis. Geosciences 2018, 8, 39. [Google Scholar] [CrossRef]
  3. Bostjančić, I.; Gulam, V.; Pollak, D.; Frangen, T. Comparative Analysis of Slope and Relief Energy for Small-Scale Landslide Susceptibility Mapping: Insights from Croatia. Remote Sens. 2025, 17, 2142. [Google Scholar] [CrossRef]
  4. Deđanski, V.; Durlević, U.; Kovjanić, A.; Lukić, T. GIS-Based Spatial Modeling of Landslide Susceptibility Using BWM-LSI: A Case Study—City of Smederevo (Serbia). Open Geosci. 2024, 16, 20220688. [Google Scholar] [CrossRef]
  5. Lv, J.; Zhang, R.; Shama, A.; Hong, R.; He, X.; Wu, R.; Bao, X.; Liu, G. Exploring the Spatial Patterns of Landslide Susceptibility Assessment Using Interpretable Shapley Method: Mechanisms of Landslide Formation in the Sichuan-Tibet Region. J. Environ. Manag. 2024, 366, 121921. [Google Scholar] [CrossRef]
  6. Suhail, H.A.; Yang, R.; Chen, H.; Rao, G. The Impact of River Capture on the Landscape Development of the Dadu River Drainage Basin, Eastern Tibetan Plateau. J. Asian Earth Sci. 2020, 198, 104377. [Google Scholar] [CrossRef]
  7. Huang, H.; Ju, S.; Duan, W.; Jiang, D.; Gao, Z.; Liu, H. Landslide Monitoring along the Dadu River in Sichuan Based on Sentinel-1 Multi-Temporal InSAR. Sensors 2023, 23, 3383. [Google Scholar] [CrossRef]
  8. Huang, R.; Li, W. Post-Earthquake Landsliding and Long-Term Impacts in the Wenchuan Earthquake Area, China. Eng. Geol. 2014, 182, 111–120. [Google Scholar] [CrossRef]
  9. Ouimet, W.B.; Whipple, K.X.; Granger, D.E. Beyond Threshold Hillslopes: Channel Adjustment to Base-Level Fall in Tectonically Active Mountain Ranges. Geology 2009, 37, 579–582. [Google Scholar] [CrossRef]
  10. Cook, K.L.; Hovius, N.; Wittmann, H.; Heimsath, A.M.; Lee, Y.-H. Causes of Rapid Uplift and Exceptional Topography of Gongga Shan on the Eastern Margin of the Tibetan Plateau. Earth Planet. Sci. Lett. 2018, 481, 328–337. [Google Scholar] [CrossRef]
  11. Clark, M.K.; House, M.A.; Royden, L.H.; Whipple, K.X.; Burchfiel, B.C.; Zhang, X.; Tang, W. Late Cenozoic Uplift of Southeastern Tibet. Geology 2005, 33, 525–528. [Google Scholar] [CrossRef]
  12. McColl, S.T.; Cook, S.J. A Universal Size Classification System for Landslides. Landslides 2024, 21, 111–120. [Google Scholar] [CrossRef]
  13. Hancox, G.T.; Perrin, N.D.; Dellow, G.D. Recent Studies of Historical Earthquake-Induced Landsliding, Ground Damage, and MM Intensity in New Zealand. Bull. N. Z. Soc. Earthq. Eng. 2002, 35, 59–95. [Google Scholar] [CrossRef]
  14. Hancox, G.T.; Perrin, N.D. Green Lake Landslide and Other Giant and Very Large Postglacial Landslides in Fiordland, New Zealand. Quat. Sci. Rev. 2009, 28, 1020–1036. [Google Scholar] [CrossRef]
  15. Zhang, R.; Lv, J.; Yang, Y.; Wang, T.; Liu, G. Analysis of the Impact of Terrain Factors and Data Fusion Methods on Uncertainty in Intelligent Landslide Detection. Landslides 2024, 21, 1849–1864. [Google Scholar] [CrossRef]
  16. Zhang, R.; Yang, Y.; Wang, T.; Liu, A.; Lv, J.; He, X.; Fu, Y.; Zhang, B.; Dai, K.; Liu, G. Co-Seismic Landslide Susceptibility Mapping for the Luding Earthquake Area Based on Heterogeneous Ensemble Machine Learning Models. Int. J. Digit. Earth 2024, 17, 2409337. [Google Scholar] [CrossRef]
  17. Liang, X.; Ge, Y.; Zeng, L.; Lyu, L.; Sun, Q.; Sun, Y.; Wang, X. Debris Flow Susceptibility Based on the Connectivity of Potential Material Sources in the Dadu River Basin. Eng. Geol. 2023, 312, 106947. [Google Scholar] [CrossRef]
  18. Bai, Y.; Wang, Y.; Ge, H.; Tie, Y. Slope Structures and Formation of Rock-Soil Aggregate Landslides in Deeply Incised Valleys. J. Mt. Sci. 2020, 17, 316–328. [Google Scholar] [CrossRef]
  19. Zhou, X.; Fan, S.; Sun, H.; Tang, L.; Ma, F. Practices of Environmental Protection, Technological Innovation, Economic Promotion and Social Equity in Hydropower Development: A Case Study of Cascade Hydropower Exploitation in China’s Dadu River Basin. Clean Technol. Environ. Policy 2021, 23, 2827–2841. [Google Scholar] [CrossRef]
  20. Bao, X.; Zhang, R.; Shama, A.; Li, S.; Xie, L.; Lv, J.; Fu, Y.; Wu, R.; Liu, G. Ground Deformation Pattern Analysis and Evolution Prediction of Shanghai Pudong International Airport Based on PSI Long Time Series Observations. Remote Sens. 2022, 14, 610. [Google Scholar] [CrossRef]
  21. Wang, T.; Zhang, R.; Zhan, R.; Shama, A.; Liao, M. Subsidence Monitoring and Mechanism Analysis of Anju Airport in Suining Based on InSAR and Numerical Simulation. Remote Sens. 2022, 14, 3759. [Google Scholar] [CrossRef]
  22. Zheng, L.; Zhu, L.; Wang, W.; Guo, L.; Chen, B. Land Subsidence Related to Coal Mining in China Revealed by L-Band InSAR Analysis. Int. J. Environ. Res. Public. Health 2020, 17, 1170. [Google Scholar] [CrossRef] [PubMed]
  23. Xiang, W.; Zhang, R.; Liu, G.; Wang, X.; Mao, W.; Zhang, B.; Fu, Y.; Wu, T. Saline-Soil Deformation Extraction Based on an Improved Time-Series InSAR Approach. ISPRS Int. J. Geo-Inf. 2021, 10, 112. [Google Scholar] [CrossRef]
  24. Jiang, H.; Zhang, R.; Zhang, B.; Chen, K.; Liu, A.; Wang, T.; Yu, B.; Deng, L. Liaohe Oilfield Reservoir Parameters Inversion Based on Composite Dislocation Model Utilizing Two-Dimensional Time-Series InSAR Observations. Remote Sens. 2024, 16, 3314. [Google Scholar] [CrossRef]
  25. Liu, A.; Zhang, R.; Yang, Y.; Wang, T.; Wang, T.; Shama, A.; Zhan, R. Oilfield Reservoir Parameter Inversion Based on 2D Ground Deformation Measurements Acquired by a Time-Series MSBAS-InSAR Method. Remote. Sens. 2023, 16, 154. [Google Scholar] [CrossRef]
  26. Intrieri, E.; Raspini, F.; Fumagalli, A.; Lu, P.; Del Conte, S.; Farina, P.; Allievi, J.; Ferretti, A.; Casagli, N. The Maoxian Landslide as Seen from Space: Detecting Precursors of Failure with Sentinel-1 Data. Landslides 2018, 15, 123–133. [Google Scholar] [CrossRef]
  27. Lv, J.; Zhang, R.; Bao, X.; Wu, R.; Hong, R.; He, X.; Liu, G. Time-Series InSAR Landslide Three-Dimensional Deformation Prediction Method Considering Meteorological Time-Delay Effects. Eng. Geol. 2025, 350, 107986. [Google Scholar] [CrossRef]
  28. Ferretti, A.; Prati, C.; Rocca, F. Permanent Scatterers in SAR Interferometry. IEEE Trans. Geosci. Remote Sens. 2001, 39, 8–20. [Google Scholar] [CrossRef]
  29. Berardino, P.; Fornaro, G.; Lanari, R.; Sansosti, E. A New Algorithm for Surface Deformation Monitoring Based on Small Baseline Differential SAR Interferograms. IEEE Trans. Geosci. Remote Sens. 2002, 40, 2375–2383. [Google Scholar] [CrossRef]
  30. Cigna, F.; Tapete, D. Sentinel-1 Big Data Processing with P-SBAS InSAR in the Geohazards Exploitation Platform: An Experiment on Coastal Land Subsidence and Landslides in Italy. Remote Sens. 2021, 13, 885. [Google Scholar] [CrossRef]
  31. Hooper, A.; Zebker, H.; Segall, P.; Kampes, B. A New Method for Measuring Deformation on Volcanoes and Other Natural Terrains Using InSAR Persistent Scatterers. Geophys. Res. Lett. 2004, 31, 1–5. [Google Scholar] [CrossRef]
  32. Zhang, L.; Dai, K.; Deng, J.; Ge, D.; Liang, R.; Li, W.; Xu, Q. Identifying Potential Landslides by Stacking-InSAR in Southwestern China and Its Performance Comparison with SBAS-InSAR. Remote Sens. 2021, 13, 3662. [Google Scholar] [CrossRef]
  33. Liang, J.; Dong, J.; Zhang, S.; Zhao, C.; Liu, B.; Yang, L.; Yan, S.; Ma, X. Discussion on InSAR Identification Effectivity of Potential Landslides and Factors That Influence the Effectivity. Remote. Sens. 2022, 14, 1952. [Google Scholar] [CrossRef]
  34. Li, Z.; Dai, K.; Deng, J.; Liu, C.; Shi, X.; Tang, G.; Yin, T. Identifying Potential Landslides in Steep Mountainous Areas Based on Improved Seasonal Interferometry Stacking-InSAR. Remote Sens. 2023, 15, 3278. [Google Scholar] [CrossRef]
  35. Li, T.; Tang, X.; Li, S.; Zhou, X.; Zhang, X.; Xu, Y. Classification of Basic Deformation Products of L-Band Differential Interferometric SAR Satellite. Acta Geod. Cartogr. Sin. 2023, 52, 769. [Google Scholar] [CrossRef]
  36. Lin, H.; Deng, Y.; Zhang, H.; Liang, D.; Fang, T.; Wang, R. Impacts of Ionospheric Effects on Spaceborne Single-Pass SAR Imaging and Interferometry of LuTan-1. In Proceedings of the 2021 IEEE International Geoscience and Remote Sensing Symposium IGARSS, Brussels, Belgium, 12–16 July 2021; pp. 2282–2285. [Google Scholar]
  37. Yang, F.; Shi, X.; Dai, K.; Zhang, W.; Yang, S.; Han, J.; Wen, N.; Deng, J.; Li, T.; Yao, Y.; et al. Utilizing LuTan-1 SAR Images to Monitor the Mining-Induced Subsidence and Comparative Analysis with Sentinel-1. Remote. Sens. 2024, 16, 4281. [Google Scholar] [CrossRef]
  38. Strozzi, T.; Farina, P.; Corsini, A.; Ambrosi, C.; Thüring, M.; Zilger, J.; Wiesmann, A.; Wegmüller, U.; Werner, C. Survey and Monitoring of Landslide Displacements by Means of L-Band Satellite SAR Interferometry. Landslides 2005, 2, 193–201. [Google Scholar] [CrossRef]
  39. Delgado, F.; Shreve, T.; Borgstrom, S.; León-Ibáñez, P.; Castillo, J.; Poland, M. A Global Assessment of SAOCOM-1 L-Band Stripmap Data for InSAR Characterization of Volcanic, Tectonic, Cryospheric, and Anthropogenic Deformation. IEEE Trans. Geosci. Remote Sens. 2024, 62, 5216821. [Google Scholar] [CrossRef]
  40. Ji, Y.; Zhang, X.; Li, T.; Fan, H.; Xu, Y.; Li, P.; Tian, Z. Mining Deformation Monitoring Based on Lutan-1 Monostatic and Bistatic Data. Remote Sens. 2023, 15, 5668. [Google Scholar] [CrossRef]
  41. Li, H.; Li, B.; Li, Y.; Duan, H. The Stability Analysis of Mt. Gongga Glaciers Affected by the 2022 Luding MS 6.8 Earthquake Based on LuTan-1 and Sentinel-1 Data. Remote Sens. 2023, 15, 3882. [Google Scholar] [CrossRef]
  42. Xiong, J.; Chen, T.; Yang, G.; Wang, R.; Li, M.; Zhao, L.; Chen, C. Discussion on the Effectiveness of Landslide Hazard Identification and Factors Affecting the Effectiveness of LT-1 Satellite Based on InSAR Technology. Geocarto Int. 2025, 40, 2461539. [Google Scholar] [CrossRef]
  43. Xu, G.; Kamp, P.J.J. Tectonics and Denudation Adjacent to the Xianshuihe Fault, Eastern Tibetan Plateau: Constraints from Fission Track Thermochronology. J. Geophys. Res. Solid Earth 2000, 105, 19231–19251. [Google Scholar] [CrossRef]
  44. Li, C.; Wang, X.; He, C.; Wu, X.; Kong, Z.; Li, X. China National Digital Geological Map (Public Version at 1:200000 Scale) Spatial Database. Geol. China 2019, 46 (Suppl. S1), 1–10. [Google Scholar]
  45. Bai, M.; Chevalier, M.-L.; Leloup, P.H.; Li, H.; Pan, J.; Replumaz, A.; Wang, S.; Li, K.; Wu, Q.; Liu, F.; et al. Spatial Slip Rate Distribution Along the SE Xianshuihe Fault, Eastern Tibet, and Earthquake Hazard Assessment. Tectonics 2021, 40, e2021TC006985. [Google Scholar] [CrossRef]
  46. Bufe, A.; Cook, K.L.; Galy, A.; Wittmann, H.; Hovius, N. The Effect of Lithology on the Relationship between Denudation Rate and Chemical Weathering Pathways—Evidence from the Eastern Tibetan Plateau. Earth Surf. Dyn. 2022, 10, 513–530. [Google Scholar] [CrossRef]
  47. Li, Z.W.; Ding, X.L.; Huang, C.; Wadge, G.; Zheng, D.W. Modeling of Atmospheric Effects on InSAR Measurements by Incorporating Terrain Elevation Information. J. Atmospheric Sol.-Terr. Phys. 2006, 68, 1189–1194. [Google Scholar] [CrossRef]
  48. Sandwell, D.T.; Price, E.J. Phase Gradient Approach to Stacking Interferograms. J. Geophys. Res. Solid Earth 1998, 103, 30183–30204. [Google Scholar] [CrossRef]
  49. Colesanti, C.; Wasowski, J. Investigating Landslides with Space-Borne Synthetic Aperture Radar (SAR) Interferometry. Eng. Geol. 2006, 88, 173–199. [Google Scholar] [CrossRef]
  50. Novellino, A.; Cigna, F.; Brahmi, M.; Sowter, A.; Bateson, L.; Marsh, S. Assessing the Feasibility of a National InSAR Ground Deformation Map of Great Britain with Sentinel-1. Geosciences 2017, 7, 19. [Google Scholar] [CrossRef]
  51. Ren, T.; Gong, W.; Bowa, V.M.; Tang, H.; Chen, J.; Zhao, F. An Improved R-Index Model for Terrain Visibility Analysis for Landslide Monitoring with InSAR. Remote Sens. 2021, 13, 1938. [Google Scholar] [CrossRef]
  52. Dai, K.; Tie, Y.; Xu, Q. Early Identification of Potential Landslide Geohazards in Alpine-Canyon Terrain Based on SAR Interferometry—A Case Study of the Middle Section of Yalong River. J. Radars 2020, 9, 554–568. [Google Scholar] [CrossRef]
  53. Notti, D.; Herrera, G.; Bianchini, S.; Meisina, C.; García-Davalillo, J.C.; Zucca, F. A methodology for improving landslide PSI data analysis. Int. J. Remote Sens. 2014, 35, 2186–2214. [Google Scholar] [CrossRef]
  54. Chen, H.; Qin, Z.; Liu, B.; Peng, R.; Yu, Z.; Yao, T.; Yang, Z.; Feng, G.; Wang, W. Assessing the Landslide Identification Capability of LuTan-1 in Hilly Regions: A Case Study in Longshan County, Hunan Province. Remote Sens. 2025, 17, 960. [Google Scholar] [CrossRef]
  55. Dai, F.C.; Lee, C.F.; Ngai, Y.Y. Landslide Risk Assessment and Management: An Overview. Eng. Geol. 2002, 64, 65–87. [Google Scholar] [CrossRef]
  56. Iverson, R.M. Landslide Triggering by Rain Infiltration. Water Resour. Res. 2000, 36, 1897–1910. [Google Scholar] [CrossRef]
Figure 1. (a) The location of Luding County. (b) Study area and image coverage. (The blue and red rectangles represent the ascending and descending orbit coverage of Sentinel-1, while the purple and green rectangles represent the ascending and descending orbit coverage of LT-1.) (c) 1:200,000 geologic map of the study area.
Remotesensing 17 03225 g001
Figure 2. The overall technical flow chart.
Remotesensing 17 03225 g002
Figure 3. SAR Geometric Distortions. (A–G denote the actual terrain surface points, while A’–G’ represent their corresponding imaging positions in the SAR geometry.)
Remotesensing 17 03225 g003
Figure 4. (a) InSAR deformation map; (b) Slope map; (c) Optical satellite imagery. (The optical basemap is derived from GF-2 imagery, and the slope data are extracted from the 30 m resolution SRTM DEM).
Remotesensing 17 03225 g004
Figure 5. (a) InSAR deformation map; (b) Slope map; (c) Optical satellite imagery. (The optical basemap is derived from GF-2 imagery, and the slope data are extracted from the 30 m resolution SRTM DEM).
Remotesensing 17 03225 g005
Figure 6. (a) InSAR deformation map; (b) Slope map; (c) Optical satellite imagery. (The optical basemap is derived from GF-2 imagery, and the slope data are extracted from the 30 m resolution SRTM DEM).
Remotesensing 17 03225 g006
Figure 7. Average deformation rate maps. (a) LT-1 ascending; (b) LT-1 descending; (c) Sentinel-1 ascending; (d) Sentinel-1 descending. (The optical basemap is derived from GF-2 imagery).
Remotesensing 17 03225 g007
Figure 8. Statistical histogram of deformation rates for LT-1 and Sentinel-1 (a) LT-1 ascending; (b) LT-1 descending; (c) Sentinel-1 ascending; (d) Sentinel-1 descending.
Remotesensing 17 03225 g008
Figure 9. Geometric distortion maps. (a) LT-1 ascending; (b) LT-1 descending; (c) combined ascending and descending of LT-1; (d) Sentinel-1 ascending; (e) Sentinel-1 descending; (f) combined ascending and descending of Sentinel-1.
Remotesensing 17 03225 g009
Figure 10. (a) Landslide difference distribution; (b1f1) The LT-1 deformation results of the L-22, L-20, L-18, L-12, and L-02 landslides. (b2f2) The Sentinel-1 deformation results of the L-22, L-20, L-18, L-12, and L-02 landslides. (The optical basemap is derived from GF-2 imagery).
Remotesensing 17 03225 g010
Figure 11. Field investigation results. (a) L-12 landslide; (b) L-17 landslide; (c) L-16 landslide; (d) L-18 landslide.
Remotesensing 17 03225 g011
Figure 12. Distribution map of the historical landslide dataset. (The optical basemap is derived from GF-2 imagery).
Remotesensing 17 03225 g012
Figure 13. L-07 landslide. (a) LT-1 deformation distribution; (b) Sentinel-1 deformation distribution; (c) Spatial characteristics of the L-07 landslide. (The optical basemap is derived from GF-2 imagery).
Remotesensing 17 03225 g013
Figure 14. (a-1a-3) represent the LT-1, Sentinel-1 deformation results, and optical images of the L-13 landslide, respectively. (b-1b-3) represent the LT-1, Sentinel-1 deformation results, and optical images of the L-22 landslide, respectively. (c-1c-3) represent the LT-1, Sentinel-1 deformation results, and optical images of the L-14 landslide, respectively. (The optical basemap is derived from GF-2 imagery).
Remotesensing 17 03225 g014
Figure 15. Effects of different vegetation cover on coherence: (a-1c-1) Optical satellite image of tree, Shrubs and Build area; (a-2c-2) coherence of L-band; (a-3c-3) coherence of C-band; (d) coherence statistics.
Remotesensing 17 03225 g015
Figure 16. (a-1a-3) represent the LT-1, Sentinel-1 deformation results, and optical images of the L-03 landslide, respectively. (b-1b-3) represent the LT-1, Sentinel-1 deformation results, and optical images of the L-04 landslide, respectively. (The optical basemap is derived from GF-2 imagery).
Remotesensing 17 03225 g016
Figure 17. (a,b) show the LT-1 and Sentinel-1 deformation results of the L-15 landslide, respectively. (c) presents the optical image, while (d,e) display detailed LT-1 deformation patterns in the areas of significant displacement. (The optical basemap is derived from GF-2 imagery).
Remotesensing 17 03225 g017
Table 1. Basic parameters of LT-1 and Sentinel-1 images.
ParameterLT-1Sentinel-1
Orbit directionAscendingDescendingAscendingDescending
Band/Wavelength (cm)L(23.6)C(5.6)
Pixel spacing (Azimuth/range m)1.7/1.92.3/13.9
Image ModeSTRIP1IW
Image Width (km)50250
PolarizationHHVV
Acquisition timeAugust 2023–April 2024September 2023–April 2024January 2023–April 2024February 2023–April 2024
Number of data972731
Table 2. Basic parameters of Sentinel-1 images.
LandslidesOrbitSatellite
Platform
Longitude (°)Latitude (°)Area (km2)Max Velocity
(mm/yr)
AspectElevation (m)
L-01AscendingLT-1 & S1102°09′40″29°26′31″0.177−91 & −71E1129–1469
L-02AscendingLT-1102°12′25″29°26′46″0.172−85SE961–1576
L-03DescendingLT-1 & S1102°10′52″29°26′31″0.525−117 & −55W1239–1725
L-04DescendingLT-1 & S1102°10′37″29°27′11″0.584−83 & −71W1247–1769
L-05Ascending & DescendingLT-1 & S1102°10′19″29°27′29″0.165−90 & −85N1186–1645
L-06AscendingLT-1 & S1102°09′47″29°28′23″0.117−69 & −46E1153–1447
L-07AscendingLT-1 & S1102°09′29″29°29′31″1.845−183 & −148E1144–2113
L-08DescendingLT-1 & S1102°11′10″29°29′17″0.441−102 & −83W1169–1699
L-09AscendingLT-1 & S1102°10′16″29°30′11″0.071−80 & −75E1121–1345
L-10DescendingLT-1 & S1102°09′04″29°29′53″0.319−160 & −131NW1743–2133
L-11AscendingLT-1 & S1102°08′17″29°30′40″0.204−93 & −86E1518–1877
L-12DescendingLT-1102°10′52″29°30′58″0.031−65W1148–1306
L-13DescendingLT-1 & S1102°12′32″29°31′01″0.174−86 & −72SW2063–2643
L-14AscendingLT-1 & S1102°08′06″29°31′16″0.283−196 & −102E1391–1811
L-15DescendingLT-1 & S1102°09′04″29°31′30″0.810−191 & −134W1371–1888
L-16DescendingLT-1 & S1102°07′05″29°37′05″0.495−138 & −114W1231–1698
L-17DescendingLT-1 & S1102°10′44″29°31′37″0.144−105 & −90N1370–1777
L-18DescendingLT-1102°10′08″29°32′06″0.079−69W1140–1467
L-19AscendingLT-1 & S1102°09′11″29°31′41″0.389−88 & −71N1183–1756
L-20AscendingLT-1102°09′04″29°32′17″0.017−66N1204–1378
L-21AscendingLT-1 & S1102°07′37″29°33′11″0.674−111 & −101E1608–2242
L-22AscendingLT-1102°09′22″29°33′32″0.063−101SE1388–1696
L-23AscendingS1102°07′41″29°32′20″0.339−87N1492–2054
Table 3. Geometric characteristics of the LT-1 and Sentinel-1 satellites.
SAR SatelliteOrbit DirectionAzimuth AngleHeading AngleIncidence Angle
LT-1Ascending79.43°349.28°30.38°
Descending289.93°189.93°41.86°
Sentinel-1Ascending77.43°347.43°39.27°
Descending282.65°192.65°33.89°
Table 4. Spatial overlap rate statistics table.
LandslidesLandslide
Hazard Area
Historical Landslide AreaOverlap RateLandslidesLandslide
Hazard Area
Historical Landslide AreaOverlap Rate
L-010.18 km20.13 km273.0%L-130.17 km20.05 km226.9%
L-020.17 km20.15 km287.1%L-140.28 km20.18 km263.8%
L-030.53 km20.07 km213.3%L-150.86 km20.58 km267.4%
L-040.58 km20.11 km218.0%L-160.50 km20.05 km29.2%
L-050.16 km20.02 km212.1%L-170.22 km20.05 km222.7%
L-060.12 km20.07 km257.1%L-180.08 km20.07 km287.3%
L-071.85 km20.53 km228.8%L-190.39 km20.11 km228.7%
L-080.44 km20.10 km222.4%L-200.02 km20.01 km280.3%
L-090.07 km20.06 km289.1%L-210.67 km20.35 km252.5%
L-100.32 km20.21 km264.7%L-220.06 km20.04 km262.5%
L-110.20 km20.17 km283.3%L-230.34 km20.13 km238.8%
L-120.03 km20.02 km251.2%
Disclaimer/Publisher’s Note: The statements, opinions and data contained in all publications are solely those of the individual author(s) and contributor(s) and not of MDPI and/or the editor(s). MDPI and/or the editor(s) disclaim responsibility for any injury to people or property resulting from any ideas, methods, instructions or products referred to in the content.