Article

Seventeen-Year Reconstruction of Tropical Forest Aboveground Biomass Dynamics in Borneo Using GEDI L4B and Multi-Sensor Data Fusion

1
College of Geography and Environment, Shandong Normal University, Jinan 250014, China
2
Key Laboratory of Comprehensive Observation of Polar Environment (Sun Yat-sen University), Ministry of Education, Zhuhai 519082, China
*
Author to whom correspondence should be addressed.
Remote Sens. 2025, 17(18), 3231; https://doi.org/10.3390/rs17183231
Submission received: 16 August 2025 / Revised: 13 September 2025 / Accepted: 17 September 2025 / Published: 18 September 2025
(This article belongs to the Special Issue Advances in Multi-Sensor Remote Sensing for Vegetation Monitoring)

Abstract

Highlights

What are the main findings?
  • Reconstructed a 17-year record (2007–2023) of tropical forest aboveground biomass in Borneo using GEDI L4B and multi-sensor fusion.
  • Detected heterogeneous biomass dynamics, with extensive losses in lowland forests and localized regrowth in protected areas.
What is the implication of the main finding?
  • Provides consistent long-term evidence to support carbon accounting, REDD+ monitoring, and forest policy in Southeast Asia.
  • Demonstrates a scalable framework for extending GEDI-based biomass monitoring beyond the mission’s lifetime.

Abstract

Forest aboveground biomass (AGB) is a key component of terrestrial carbon storage, essential for understanding the carbon cycle and evaluating carbon sink potential. However, estimating long-term AGB in tropical forests and detecting its spatial and temporal trends remain challenging due to observational gaps and methodological constraints. Here, we integrate GEDI L4B gridded biomass data with features from MODIS, PALSAR/PALSAR-2, SRTM, and climate datasets, and apply the AutoGluon ensemble learning framework to develop AGB retrieval models. We generated annual AGB maps at 1 km resolution for Borneo’s forests from 2007 to 2023, achieving high predictive accuracy (R2 = 0.92, RMSE = 32.84 Mg/ha, rRMSE = 21.06%). Residuals were generally balanced and close to a symmetric distribution, indicating no strong bias within the moderate biomass range (50–350 Mg/ha). However, in very high-biomass stands, the model tended to underestimate AGB, reflecting saturation effects that persist despite clear improvements over existing products. Estimated mean AGB values ranged from 180.52 to 214.09 Mg/ha, with total AGB varying between 13.05 and 14.10 Pg. Trend analysis using Sen’s slope and the Mann–Kendall test revealed significant AGB trends in 31.31% of forested areas, with 68.76% showing increases. This study offers a robust and scalable framework for continuous tropical forest carbon monitoring, providing critical support for carbon accounting, forest management, and policy-making.

1. Introduction

Forest ecosystems cover approximately 30% of the Earth’s land surface and constitute the largest terrestrial carbon sink [1,2]. Tropical forest ecosystems account for about 40% of terrestrial carbon storage and play a critical role in regulating both regional and global carbon cycles and climate change [3]. Aboveground biomass (AGB) represents the living woody biomass in stems, branches, and leaves, and serves as a key indicator for estimating forest carbon stocks and fluxes [4]. Accurate AGB information is essential for quantifying carbon sequestration, monitoring the impacts of climate change and human disturbance, and supporting policies aimed at mitigating greenhouse gas emissions [5,6]. Long-term, spatially explicit AGB datasets are particularly valuable for tracking the effectiveness of forest management and conservation programs, as well as for informing initiatives such as REDD+ that target emission reductions through avoided deforestation and degradation [7,8].
Traditional AGB estimation relies on field inventory plots combined with species-specific allometric equations [1]. While these methods provide accurate local measurements, their application is constrained by high costs, intensive labor requirements, and limited spatial coverage [9,10]. With advances in remote sensing technology, satellite-based mapping has emerged as an effective approach for AGB estimation, offering notable improvements in accuracy and spatiotemporal coverage [11,12,13,14]. Passive optical sensors such as Landsat and MODIS have been widely used due to their long historical records and rich spectral information, enabling vegetation indices to be linked with biomass metrics [7,15]. However, optical data are limited by cloud contamination in humid tropical regions and exhibit signal saturation in high-biomass forests, where increases in vegetation density no longer translate into proportional changes in spectral response [16,17,18,19]. Synthetic Aperture Radar (SAR), particularly at L-band wavelengths, can partially penetrate the canopy and acquire data regardless of cloud cover, improving sensitivity to forest structure [20]. Nonetheless, SAR backscatter also saturates at moderate to high biomass levels, especially in dense tropical rainforests, and its relationship with biomass can be influenced by soil moisture, incidence angle, and forest structural complexity [21,22].
Light Detection and Ranging (LiDAR) provides three-dimensional measurements of vegetation structure and is less prone to saturation effects than optical or SAR sensors [23]. Airborne LiDAR campaigns have demonstrated high accuracy in biomass estimation but are limited in spatial and temporal coverage due to cost and logistical constraints [24]. The launch of spaceborne LiDAR missions, particularly NASA’s Global Ecosystem Dynamics Investigation (GEDI) and the Ice, Cloud, and Land Elevation Satellite-2 (ICESat-2), has significantly advanced large-scale forest structure and biomass mapping [25,26,27,28]. Compared with ICESat-2, GEDI is specifically designed for forest structural assessment and demonstrates superior performance in canopy height retrieval [29,30], making it particularly well-suited for large-scale AGB estimation.
GEDI’s full-waveform LiDAR captures detailed vertical profiles of vegetation and terrain, enabling direct retrieval of canopy height, vertical structure metrics, and AGB estimates [31]. The mission delivers both footprint-level products and gridded biomass datasets, covering nearly all tropical and temperate forests between 51.6°N and 51.6°S [32]. GEDI-based studies have applied two main approaches: scaling waveform or forest structure information to continuous maps using small-scale field measurement of AGB data, and directly integrating footprint-level or gridded biomass products with optical or SAR predictors into predictive models [33,34]. These methods have achieved high accuracy in various biomes, from subtropical plantations to temperate mixed forests, and have been increasingly used for national-scale and regional biomass assessments. For example, May et al. [33] integrated GEDI L2A relative height metrics, airborne LiDAR data, and field plot measurements to generate AGB maps of Indonesian lowland forests at multiple spatial resolutions. Chen et al. [27] incorporated GEDI L2B footprint-level canopy cover and vertical profile metrics with multi-source remote sensing data, employing geographic stratification to improve AGB mapping of heterogeneous forests in northeastern China. In addition, several studies have directly utilized GEDI biomass products for continuous AGB mapping. For instance, Shendryk [34] combined GEDI L4A footprint-level biomass estimates with Sentinel-1/2 data to produce 100 m resolution AGB maps for Australia and the contiguous United States. Similarly, Khan et al. [35] employed the GEDI L4B gridded biomass product alongside Sentinel-2A imagery to assess land-use change and forest AGB distribution in subtropical southwestern China. Collectively, these studies underscore GEDI’s growing capability in supporting large-scale forest AGB retrieval.
Despite these advances, most GEDI-based biomass studies focus on single-year or short-term estimates, leaving a gap in the ability to monitor multi-year trends at fine spatial resolution. Long-term biomass records are critical for detecting gradual ecological changes, quantifying recovery after disturbance, and assessing the cumulative impact of land-use change [36]. Existing global biomass products, such as those from the European Space Agency’s (ESA) Climate Change Initiative (CCI) [37], provide multi-year coverage but often at coarse resolution, with methodological differences between years that limit temporal consistency in high-biomass tropical regions. At the regional scale, multi-year biomass mapping efforts remain scarce, particularly in biodiversity-rich and carbon-dense tropical forests. There is a need for approaches that integrate the structural sensitivity of GEDI with the temporal continuity of multi-source satellite observations, using advanced modeling frameworks that can generalize across years while maintaining accuracy.
This study addresses these gaps by developing a framework for reconstructing annual aboveground biomass maps from 2007 to 2023 for tropical forests using GEDI L4B gridded biomass data in combination with multi-source remote sensing predictors, including MODIS optical indices, PALSAR/PALSAR-2 SAR backscatter, topographic metrics, and climate variables. The approach employs an automated machine learning framework to integrate multiple algorithms in a stacked ensemble, enhancing predictive performance and temporal stability. By generating consistent, spatially explicit biomass estimates over a 17-year period, the study enables pixel-level trend analysis to identify areas of biomass gain or loss and relate these patterns to environmental gradients and disturbance regimes. The framework offers a scalable methodology for long-term biomass monitoring in tropical ecosystems, with potential applications in carbon accounting, forest conservation planning, and evaluation of policy interventions.

2. Materials and Methods

2.1. Study Area

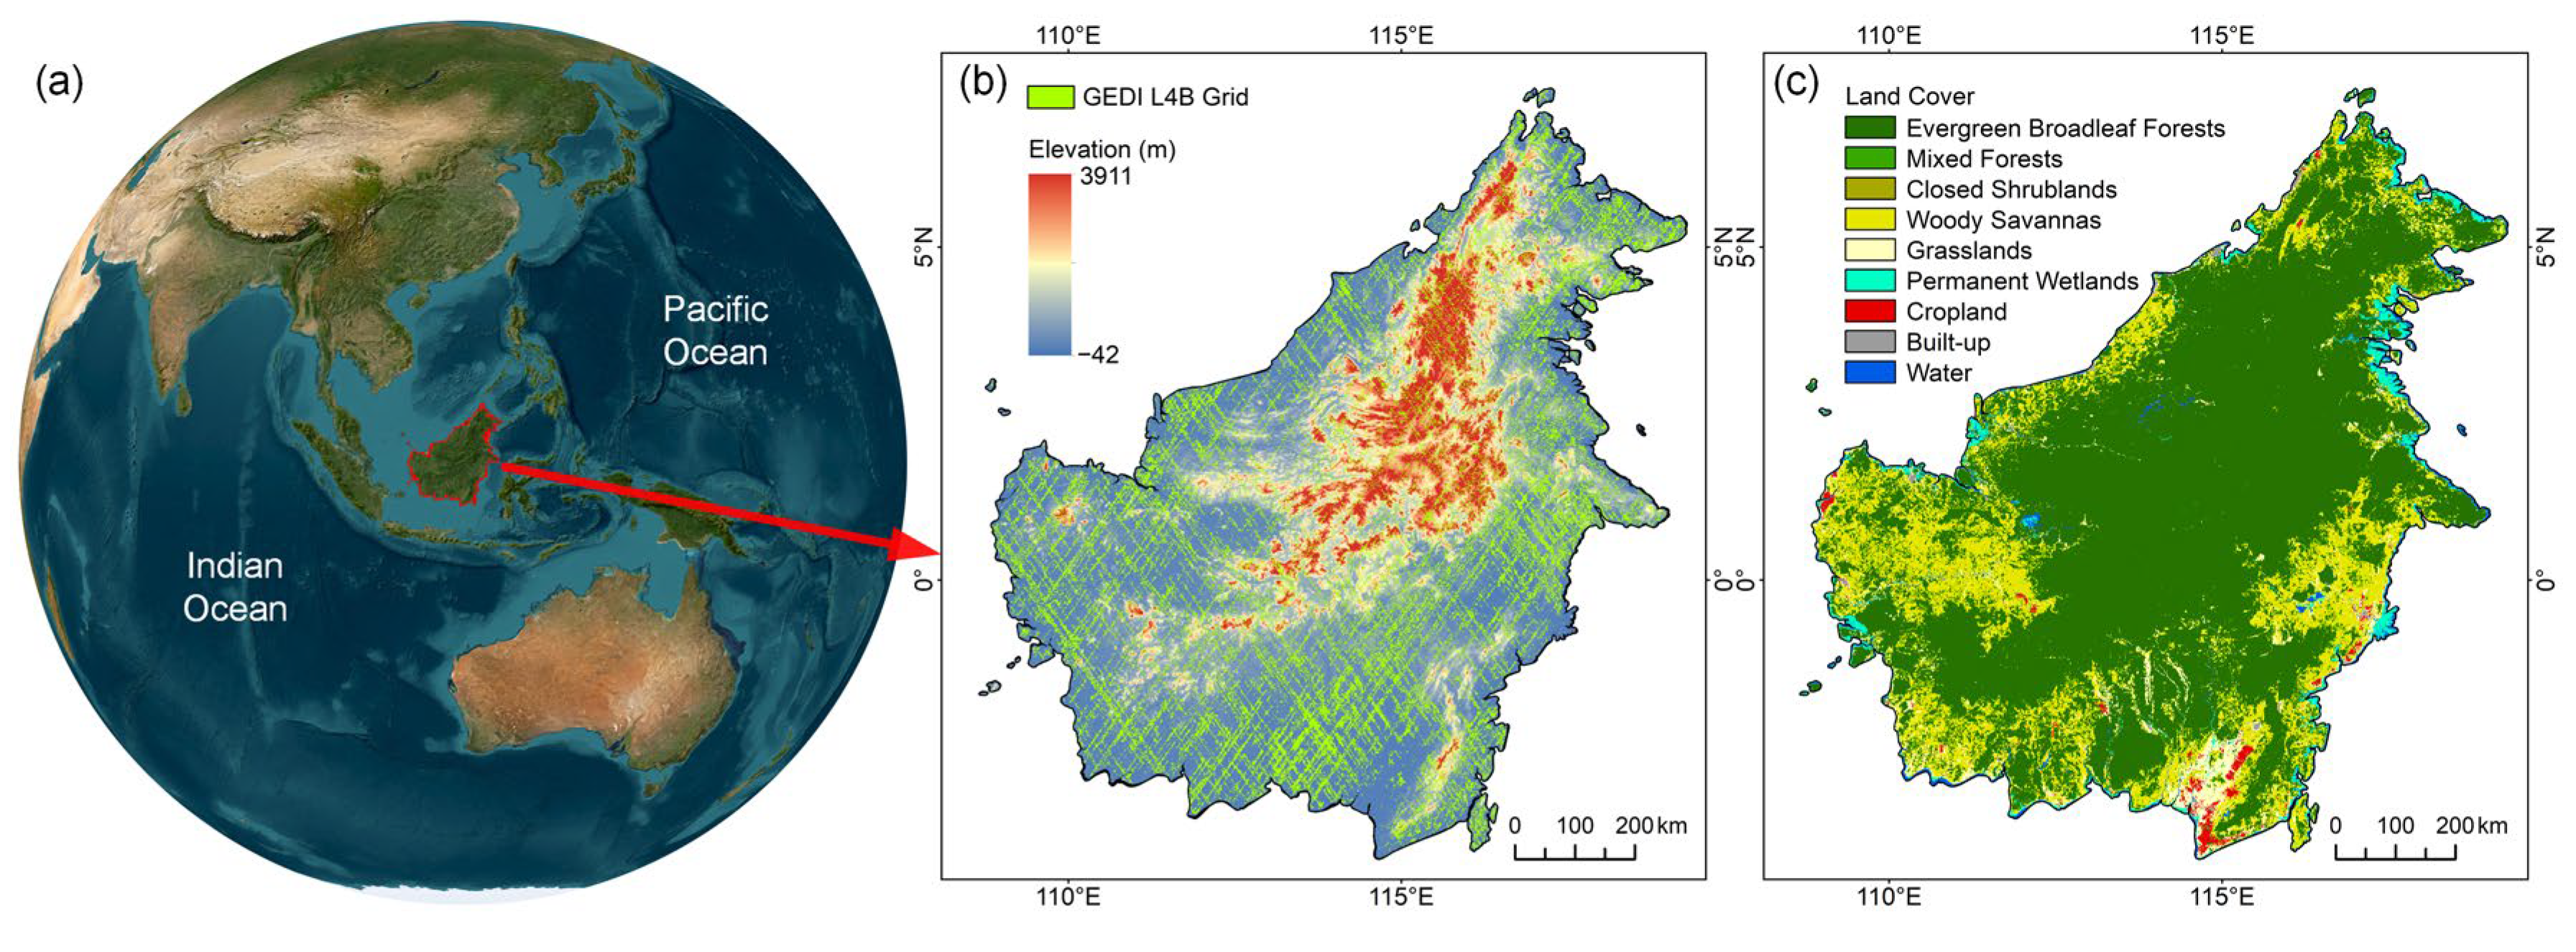
Borneo, the third-largest island in the world, is situated in Southeast Asia between the Pacific Ocean to the east and the Indian Ocean to the west, covering about 743,330 km2 [38] (Figure 1). The island is divided among Indonesia, Malaysia, and Brunei Darussalam, spanning from 108°40′ to 119°5′E and from 4°17′S to 7°20′N. The climate is equatorial tropical rainforest, influenced by the southwest monsoon during May–June and September–October, and the northeast monsoon from November to April [39]. Mean annual temperatures range from 24 °C to 28 °C, and annual precipitation varies between 1700 mm and 4100 mm [40]. These warm and humid conditions support highly diverse vegetation, making Borneo one of the most species-rich and ancient tropical forests globally.
The island’s topography is dominated by extensive mountain ranges, with Mount Kinabalu in Sabah, Malaysia, reaching 4095 m [41]. According to the International Geosphere-Biosphere Programme (IGBP) classification scheme, the predominant land cover is evergreen broadleaf forest, mainly distributed in the interior highlands. Other major classes include mixed forests, woody savannas, croplands, and areas of permanent wetlands along the lowlands and coasts (Figure 1c). Dipterocarp mixed forests are characteristic of the region, with tall, dense canopies that store substantial biomass. Over recent decades, deforestation, wildfires, and the expansion of industrial plantations have driven significant forest loss. Between 2001 and 2017, the area of primary forest declined by approximately 14% [42], reducing the island’s capacity for carbon storage.
Figure 1. (a) Location of Borneo in Southeast Asia. (b) Elevation from SRTM [43] with GEDI L4B grid [44]. (c) Land cover distribution in 2023 based on the MCD12Q1 IGBP classification [45].
Remotesensing 17 03231 g001

2.2. Data and Preprocessing

2.2.1. GEDI L4B Product

GEDI is a LiDAR mission launched by NASA aboard the International Space Station in 2018 to improve understanding of forest structure and ecosystem dynamics through three-dimensional measurements of vegetation [31]. Equipped with three full-waveform LiDAR instruments, GEDI provides high-resolution, dense sampling of observations between 51.6°N and 51.6°S, which is critical for constructing high-accuracy forest AGB models. The mission delivers waveform-based data, resulting in four product levels: L1 (waveform and elevation metrics), L2 (footprint-level canopy cover and vertical structure), L3 (gridded vegetation structure), and L4 (biomass estimates at footprint and grid scales). Specifically, the L4B product uses a hybrid inference model to estimate average aboveground biomass density (AGBD) within 1 km grids, based on L4A footprint-level AGBD samples [46]. Compared with airborne LiDAR and the L4A product, L4B offers denser sampling and wider spatial coverage, making it well-suited for training machine learning models together with continuous satellite imagery.
This study utilized the GEDI L4B 1 km gridded aboveground biomass density Version 2.1 product [44], based on observations collected between April 2019 and March 2023. This product was obtained free of charge from the official NASA Earthdata portal (https://www.earthdata.nasa.gov/, accessed on 16 August 2025), and subsequently uploaded to the Google Earth Engine (GEE) platform for preprocessing. GEDI data contain 351,536 grid sampling points within Borneo. To ensure data quality, we followed the GEDI L1 mission requirements by excluding grid cells with a standard error >20 Mg/ha or a relative standard error > 20%. Additionally, non-forested areas were masked out using a land cover classification product. After quality filtering and preprocessing, a total of 155,283 grid samples were retained for model training and evaluation (Figure 1b).

2.2.2. MODIS Data

We used the MOD09A1 Version 6.1 surface reflectance product from the GEE platform (https://developers.google.com/earth-engine/datasets/, accessed on 16 August 2025) to support long-term AGB estimation in Borneo. The dataset provides 500 m spatial resolution and 8-day temporal resolution from 2000 onward. It is atmospherically corrected for gases, aerosols, and Rayleigh scattering, and includes seven spectral bands, one quality layer, and four observation bands [47].
Due to minimal seasonal variability and persistent cloud cover in Borneo’s tropical rainforests, all 46 MOD09A1 8-day surface reflectance images available each year were included in the annual processing to ensure complete spatial coverage. Clouds and shadows were removed using the stateQA quality flags and bitmask rules [48]. Annual composites were generated after filtering, and spectral bands together with derived vegetation indices were extracted as predictors for AGB modeling. All composites were median-aggregated and resampled to 1 km to match the spatial resolution of the GEDI L4B product.

2.2.3. PALSAR/PALSAR-2 Data

The Phased Array L-Band Synthetic Aperture Radar (PALSAR and PALSAR-2) instruments onboard the ALOS and ALOS-2 satellites operate at a wavelength of 23.6 cm, enabling deeper canopy penetration than X- or C-band systems and providing all-weather, day-and-night observations [20,22]. This capability is particularly useful for estimating forest structural parameters in tropical rainforests.
We acquired and processed the PALSAR/PALSAR-2 Yearly Mosaic Version 2 product [49] from the GEE platform, which provides seamless global mosaics at 25 m resolution. Because of the mission gap between ALOS and ALOS-2, no mosaics are available for 2011–2014. To maintain temporal continuity, we substituted 2010 mosaics for 2011–2012 and 2015 mosaics for 2013–2014, following common practice in large-scale biomass mapping studies. While this substitution inevitably introduces additional uncertainty, its impact is mitigated by the integration of independent predictors (e.g., MODIS spectral indices, climate variables). In total, 13 mosaics were included, all of which were orthorectified, slope-corrected, and de-striped to reduce striping artifacts and intensity differences [50]. We further report in the Discussion the potential implications of this gap-filling strategy.
HH and HV polarization backscatter coefficients were derived by converting 16-bit DN values to gamma-zero (γ0) backscatter in decibels using Equation (1).
γ 0 = 10 log 10 D N 2 + C F
where CF is the calibration factor of −83.0 dB. The HH/HV ratio was also calculated to enhance AGB estimation.

2.2.4. Ancillary Data

To improve AGB estimation and account for environmental controls on tropical rainforest growth, topographic and climatic variables were included as predictors. All datasets were obtained from the GEE platform and resampled to match the target resolution.
Topographic variables were derived from the Shuttle Radar Topography Mission (SRTM), which provides elevation data with a spatial resolution of 30 m and an average vertical accuracy of 10 m [43]. Elevation was extracted directly, while slope and aspect were calculated to improve model prediction performance. Temperature data were obtained from the MOD21A1D product provided by NASA at 1 km resolution, which offers daily land surface temperature records since 2000 [51]. Annual mean surface temperature was computed via median synthesis. Climatic variables were extracted from the TerraClimate dataset, which provides monthly global terrestrial climate and water balance data [52]. From this, annual precipitation and soil moisture characteristics were derived for use as predictive variables.
To distinguish forest from non-forest areas, masking was conducted using the MCD12Q1 land cover dataset, which provides annual global land cover classification at a spatial resolution of 500 m from 2001 to 2023 [45]. This study employed the IGBP classification scheme. In accordance with definitions adopted by parties to the United Nations Framework Convention on Climate Change, a forest is typically defined as an area with tree cover exceeding 10%, 25%, or 30% [1]. To reduce uncertainties associated with MCD12Q1 classification, a conservative threshold of 30% tree cover was used to define forested areas in this study.

2.3. Methods

Figure 2 presents the AGB reconstruction framework developed in this study, comprising the following components: (1) Quality filtering of GEDI gridded data and multi-source remote sensing inputs, followed by extraction of complementary features. (2) Feature selection based on machine learning and feature importance assessment. (3) Model training using the AutoGluon automated machine learning framework, which supports multiple algorithms. (4) Evaluation of model performance and feature importance using independent test data. (5) Generate long-term AGB maps and use nonparametric statistical methods for trend analysis.

2.3.1. Feature Selection

After preprocessing the MODIS, PALSAR/PALSAR-2, and auxiliary datasets, we extracted spectral, polarimetric, topographic, and climatic features based on prior studies and domain expertise to support the construction of the AGB inversion model. Spectral features included the seven MODIS surface reflectance bands (Red, Blue, Green, Near-infrared (NIR), Shortwave infrared 1 (SWIR1), Shortwave infrared 2 (SWIR2), and Shortwave infrared 3 (SWIR3)) and commonly used vegetation indices such as NDVI and EVI, which have been widely applied in forest structural parameter estimation [53]. Extraction formulas are listed in Table 1. Polarimetric features, including HH and HV backscatter coefficients, were derived from SAR data, and the HH/HV ratio was calculated to enhance sensitivity to vegetation structure. Topographic and climatic variables, including elevation, slope, aspect, land surface temperature (LST), precipitation (Pr), and soil moisture (SM), were incorporated to complement the spectral and SAR features.
We compiled 28 candidate predictors encompassing spectral, SAR, topographic, and climatic information. To address potential multicollinearity and regional variability, a hybrid feature selection procedure was applied. Highly correlated variables were first screened out using correlation analysis and variance inflation factor thresholds to reduce redundancy.
Feature importance was then assessed using SHapley Additive exPlanations (SHAP) [64] and permutation feature importance (PFI) [65]. SHAP quantifies the marginal contribution of each predictor to the model output based on cooperative game theory, allowing both magnitude and direction of influence to be evaluated. PFI measures the decrease in model performance when a variable’s values are randomly permuted, providing an independent estimate of its predictive value. By combining SHAP and PFI, predictors with consistently low importance or unstable contributions were excluded, resulting in a more concise set that retains key explanatory variables while mitigating overfitting risk and improving interpretability [66].

2.3.2. Model Construction

We developed a modeling framework using the AutoGluon automated machine learning framework (Version 1.1.0) [67] to extrapolate GEDI L4B gridded AGB to the regional scale and enable long-term monitoring. High-quality GEDI L4B 1 km AGB grids served as target variables. The dataset was randomly split, with 80% (124,226 samples) used for model training and 20% (31,057 samples) reserved for independent testing. Predictor variables included spectral, polarimetric, topographic, and climatic features derived from multi-source datasets.
By automating critical processes such as data preprocessing, model selection, hyperparameter tuning, and ensemble learning, AutoGluon substantially enhances model predictive performance and robustness [68]. Unlike traditional single-model approaches, AutoGluon leverages the strengths of diverse classification and regression techniques—such as decision trees and neural networks—through model ensembling to improve accuracy and reduce overfitting. While traditional ensemble methods aggregate base model predictions to form a meta-model by capitalizing on individual model complementarities, AutoGluon adopts a more advanced multi-layer ensemble strategy [69]. This approach applies the same set of learning algorithms across successive layers and incorporates both raw features and base model predictions as inputs to stacked layers. The final meta-model aggregates outputs from heterogeneous algorithms. In this study, a two-layer ensemble strategy was adopted: the base layer consists of multiple models trained on raw input features, whose predictions, along with the original features, are then used in the stacked layer to train higher-level models. These stacked models are finally combined through weighted integration to produce a robust and accurate AGB estimation model.
In this study, seven algorithms were incorporated into the base learning layer of the AutoGluon framework: k-nearest neighbors [70], random forest [71], neural networks [72], extremely randomized trees [73], XGBoost [74], LightGBM [75], and CatBoost [76]. These models were initially configured with default parameters to enable automated hyperparameter optimization during training. The AutoGluon training process was configured with num_bag_folds set to 5 for five-fold cross-validation, time_limit set to 7200 s, and auto_stack set to True to activate stacking ensemble learning. Model training was executed using the fit function with the good_quality preset.

2.3.3. Accuracy Assessment

The accuracy of the AGB inversion model was assessed using an independent test set comprising 20% of the GEDI L4B grid samples (31,057 points). Model performance was quantified using the coefficient of determination (R2), root mean square error (RMSE), and relative root mean square error (rRMSE), as given in Formulas (2)–(4).
R 2 = 1 i = 1 n y i y i ^ 2 i = 1 n y i y ¯ 2
R M S E = i = 1 n y i y ^ i 2 n
r R M S E = R M S E y ¯ × 100 %
where n is the sample size of the test dataset, y ^ i is the AGB predicted by the model, y i is the GEDI L4B AGB in the test dataset, and y ¯ is the mean of the GEDI L4B AGB.
To further evaluate accuracy and temporal extrapolation, we compared our results with the ESA CCI Biomass product [37] and the biomass dataset of Santoro et al. [77]. The CCI product algorithm is based on a semi-empirical model that integrates L-band and C-band estimates from multiple SAR satellites to generate global biomass estimates, providing discontinuous inversion results for the period 2007–2022. To ensure consistency, the published data were masked using the MCD12Q1 product to match the forest extent defined in this study, and corresponding years were selected for pixel-level comparisons.

2.3.4. Trend Analysis

Long-term trends and spatial patterns of AGB in Borneo forests (2007–2023) were quantified at the pixel level using nonparametric statistics applied to annual 1 km AGB maps. Sen’s Slope estimator and the Mann–Kendall significance test were applied jointly. Sen’s Slope calculates the median slope from all pairwise differences in a time series, providing a robust, distribution-free estimate of monotonic change that is less sensitive to outliers [78]. The Mann–Kendall test assesses the statistical significance and direction of these trends by ranking all observations, computing the S statistic, and evaluating its sign and magnitude [79]. In this study, trends were considered statistically significant at p < 0.05. This combined approach is widely used in climate, hydrological, and ecological research to detect and quantify temporal trends without assuming normality. For example, previous studies have applied Sen’s Slope to evaluate regional disturbance and demonstrated its effectiveness in detecting land surface changes [80,81,82].

3. Results

3.1. Model Performance Comparison

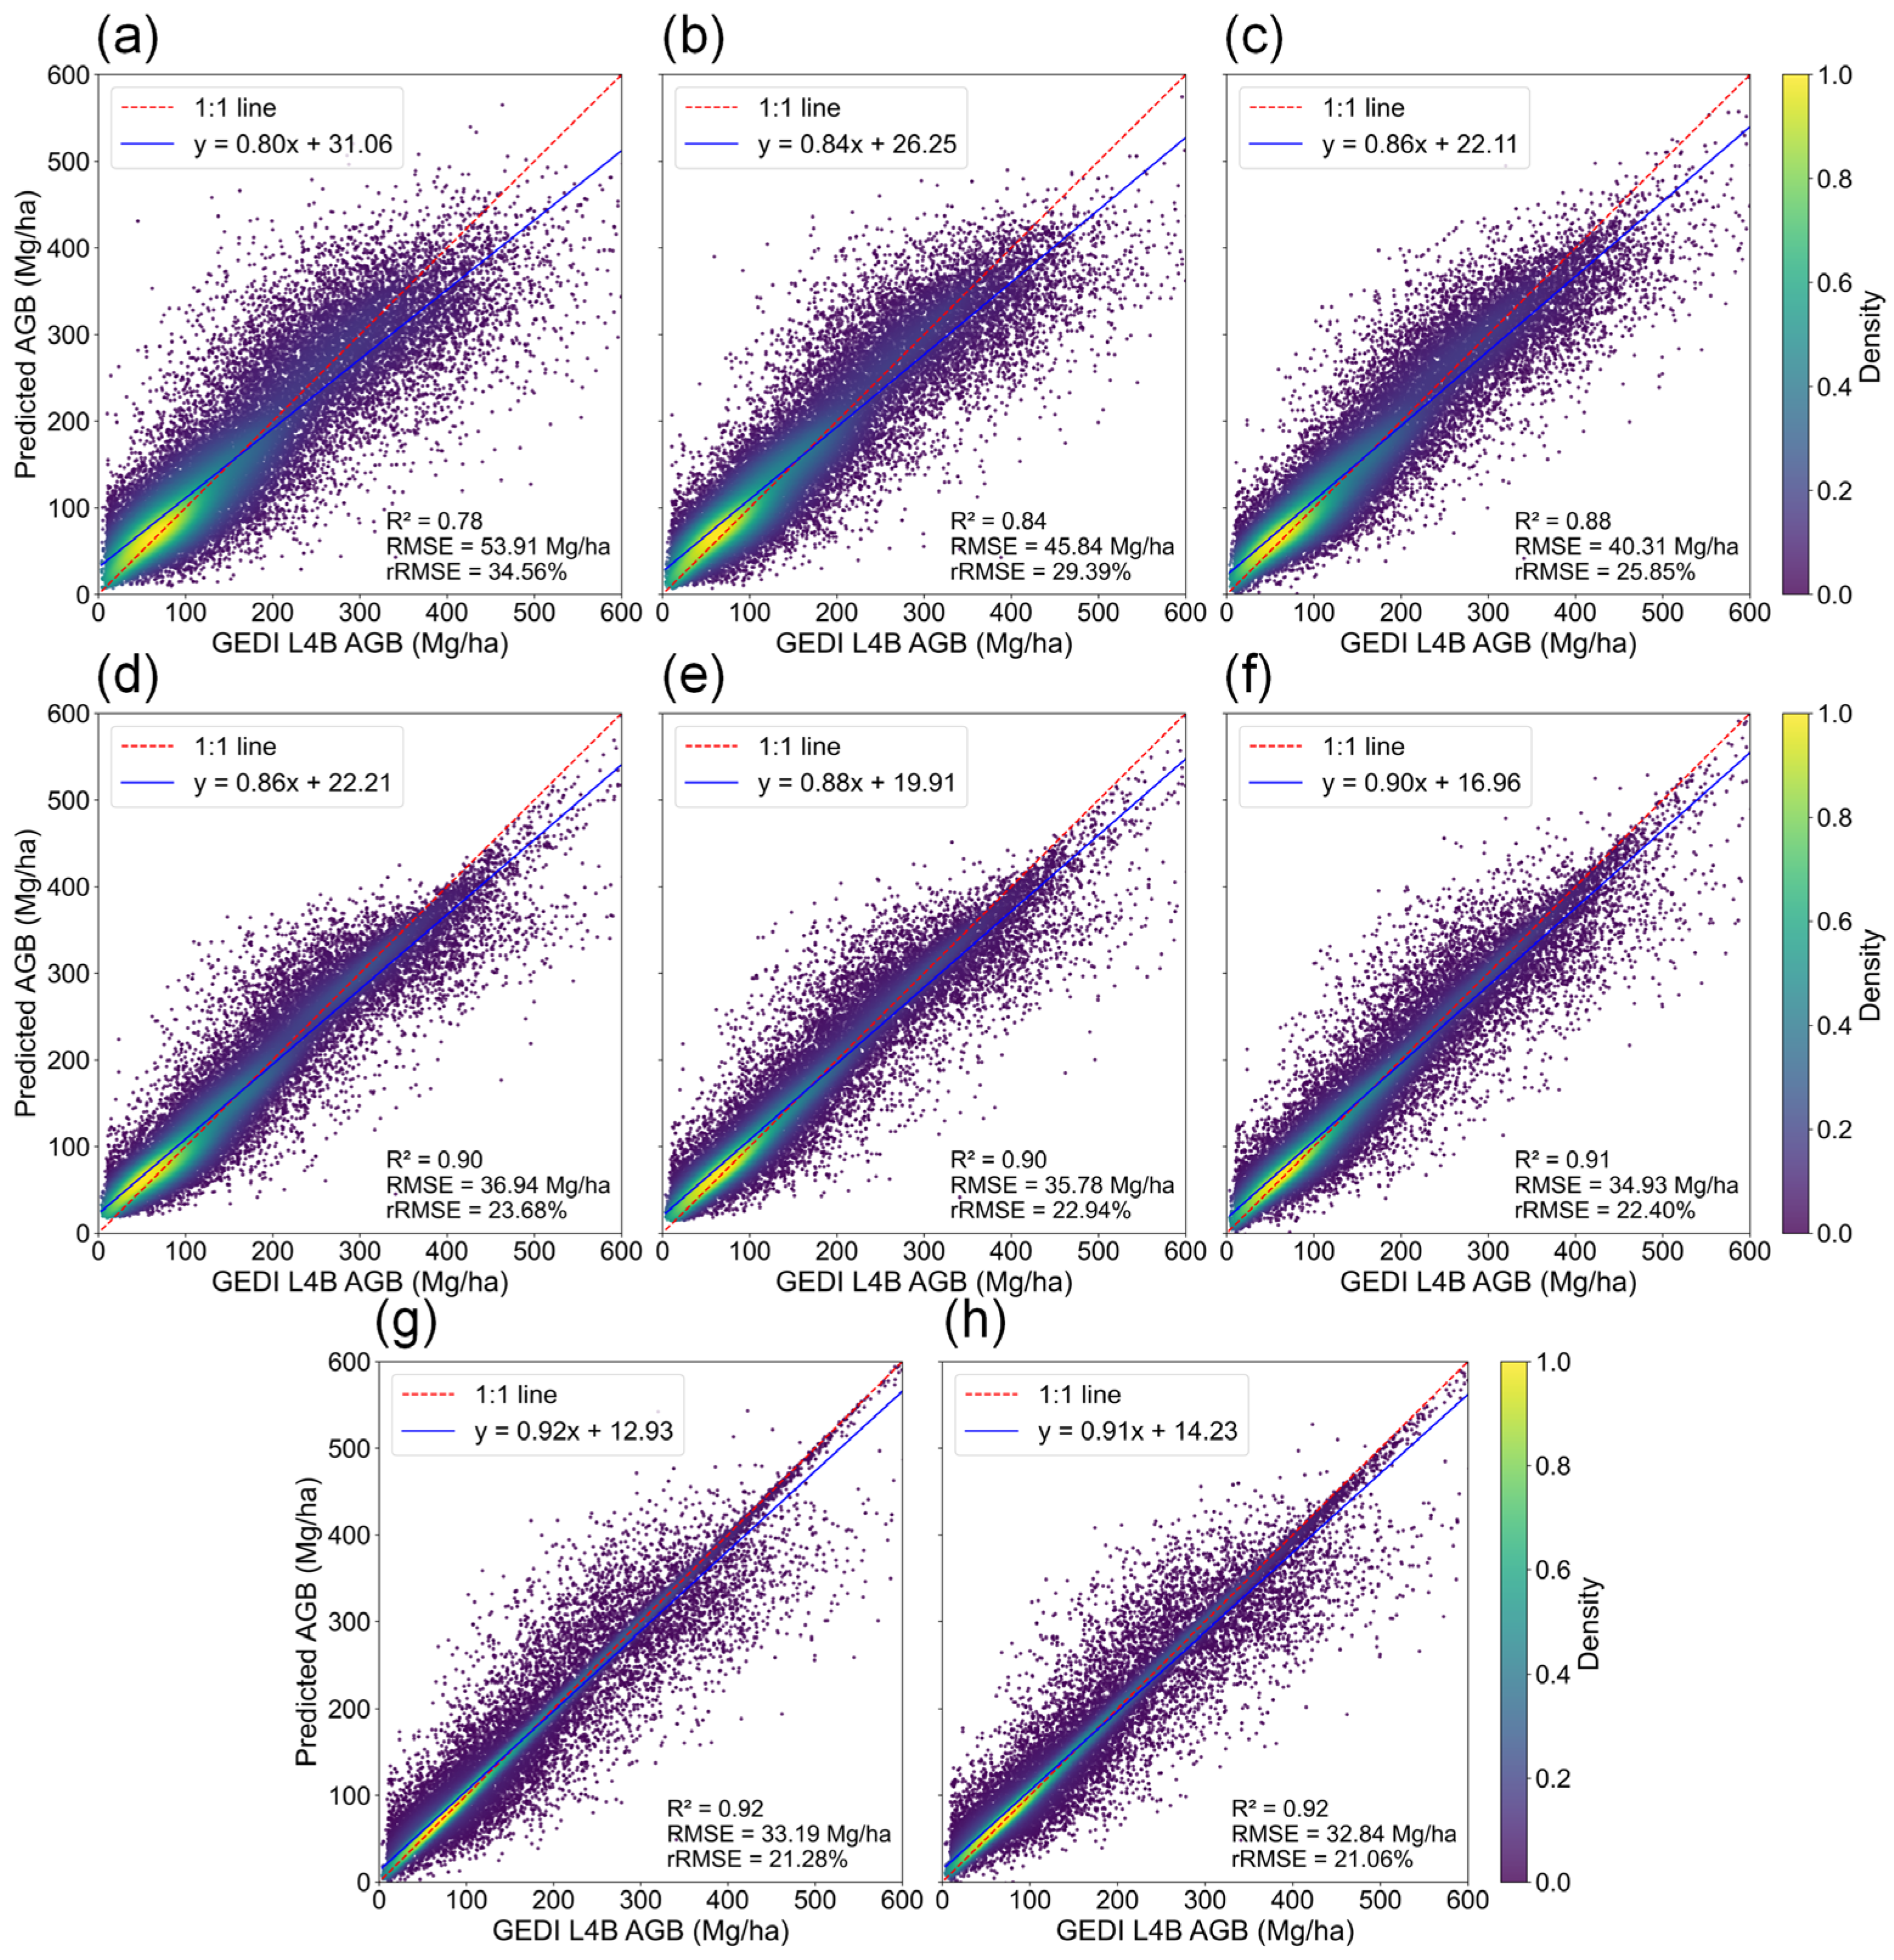
To assess the applicability of the GEDI L4B product for tropical forest AGB mapping, we employed the AutoGluon framework with multi-source remote sensing features at 1 km resolution to develop multiple base models and a weighted ensemble model. Figure 3 presents the performance evaluation of all models on the GEDI L4B test dataset, with each scatter plot displaying three accuracy metrics (R2, RMSE, and rRMSE) alongside the relationship between predicted and observed AGB values.
All models demonstrated relatively strong predictive performance, benefiting from both the advanced machine learning framework and the large training dataset (over 120,000 samples). Among them, the weighted ensemble model based on a multi-layer stacking algorithm achieved the best results (R2 = 0.92, RMSE = 32.84 Mg/ha, rRMSE = 21.06%). The XGBoost model (R2 = 0.92, RMSE = 33.19 Mg/ha, rRMSE = 21.28%) and the LightGBM model (R2 = 0.91, RMSE = 34.93 Mg/ha, rRMSE = 22.40%) followed closely, demonstrating the advantages of gradient-boosted decision tree (GBDT) algorithms. The method does not require explicit assumptions about the data distribution or the relationship between variables, making it well-suited for capturing nonlinear patterns and high-order interactions. Random Forests, a widely used algorithm in AGB inversion studies, showed moderate performance in this study and contributed positively to the ensemble’s effectiveness. In contrast, the k-nearest neighbors model (R2 = 0.78, RMSE = 53.91 Mg/ha, rRMSE = 34.56%) exhibited the weakest performance, reflecting its limitations in modeling AGB under complex vegetation conditions of tropical forests.
Furthermore, the inversion accuracy achieved in this study is substantially higher than that reported in previous GEDI-based biomass mapping efforts. For example, Shendryk et al. [34] applied LightGBM to forests in the United States and Australia, obtaining R2 values of 0.66–0.74 and rRMSE values of 41–77%, while Liang et al. [28] used Random Forests for African forests with an R2 of 0.64 and rRMSE of 42%. In contrast, our ensemble model attained R2 = 0.92 and rRMSE = 21.06%. This improvement can be attributed to the tailored feature set that captures key structural and environmental signals, together with the stacking-based ensemble strategy that integrates complementary strengths of diverse base learners to enhance accuracy and robustness.

3.2. Feature Importance Analysis

To enhance computational efficiency and reduce the effects of multicollinearity, this study evaluated 28 initial variables and selected an optimal subset. Based on a comprehensive importance assessment using SHAP values and the PFI method, the 16 most influential variables were retained for constructing the AGB inversion model.
Figure 4 presents the importance ranking of the final predictive variables in the AutoGluon-based AGB inversion model. Both SHAP and PFI methods consistently identify LST as the most important predictor, highlighting its strong correlation with tropical vegetation growth. LST is closely linked to vegetation evapotranspiration and moisture conditions, indirectly capturing forest structure and growth status by reflecting vegetation sensitivity to environmental variability. HV and Elevation also emerge as key features. HV polarization is more influential than HH, aligning with previous studies (e.g., [38]). Unlike HH, HV is sensitive to volume scattering from complex ground structures and better captures forest canopy and foliage characteristics, making it particularly valuable in densely vegetated tropical rainforests. The high importance of Elevation likely reflects its role in shaping forest structure and species distribution across Borneo. Spectral features such as Green, kNDVI, and EVI also rank highly. Compared to traditional indices, kNDVI, developed based on kernel theory, effectively mitigates the nonlinear saturation issues of NDVI, while EVI increases sensitivity to chlorophyll content and reduces soil background noise, thereby extending the saturation threshold in high biomass regions.
To examine how key predictors contribute to modeled AGB variation, SHAP dependence plots were generated for the four most influential variables (Figure 5). In the regression context, a positive SHAP value indicates that the variable configuration increases the predicted AGB relative to the mean prediction, whereas a negative value indicates a decrease. These relationships reflect the model’s learned associations rather than direct ecological causation, but they can be interpreted in light of known biophysical processes. For LST, SHAP values are generally positive below ~32 °C, suggesting that cooler surface temperatures are associated with higher predicted AGB. Above this threshold, SHAP values become negative, indicating reduced AGB predictions, with the inhibitory effect stabilizing beyond ~35 °C. This pattern may reflect both the physiological limits of tropical forest growth under high temperatures and the fact that dense, high-biomass forests tend to moderate surface temperatures through canopy shading and evapotranspiration. The Green band shows a nonlinear negative association with SHAP values at higher reflectance, consistent with saturation effects in dense vegetation where high biomass no longer produces proportionally higher greenness signals. HV polarization displays a positive trend, with low values linked to reduced AGB predictions and higher values enhancing them, in line with the ability of cross-polarized SAR backscatter to capture woody biomass structure. Elevation shows a nonlinear pattern in which low-lying areas correspond to negative SHAP values, mid-elevations around 300 m correspond to positive values, and higher elevations correspond to negative values again. This may reflect changes in dominant forest types and structural complexity along altitudinal gradients, as well as differences in disturbance regimes and soil conditions.

3.3. Residual Analysis and Cross-Product Comparisons

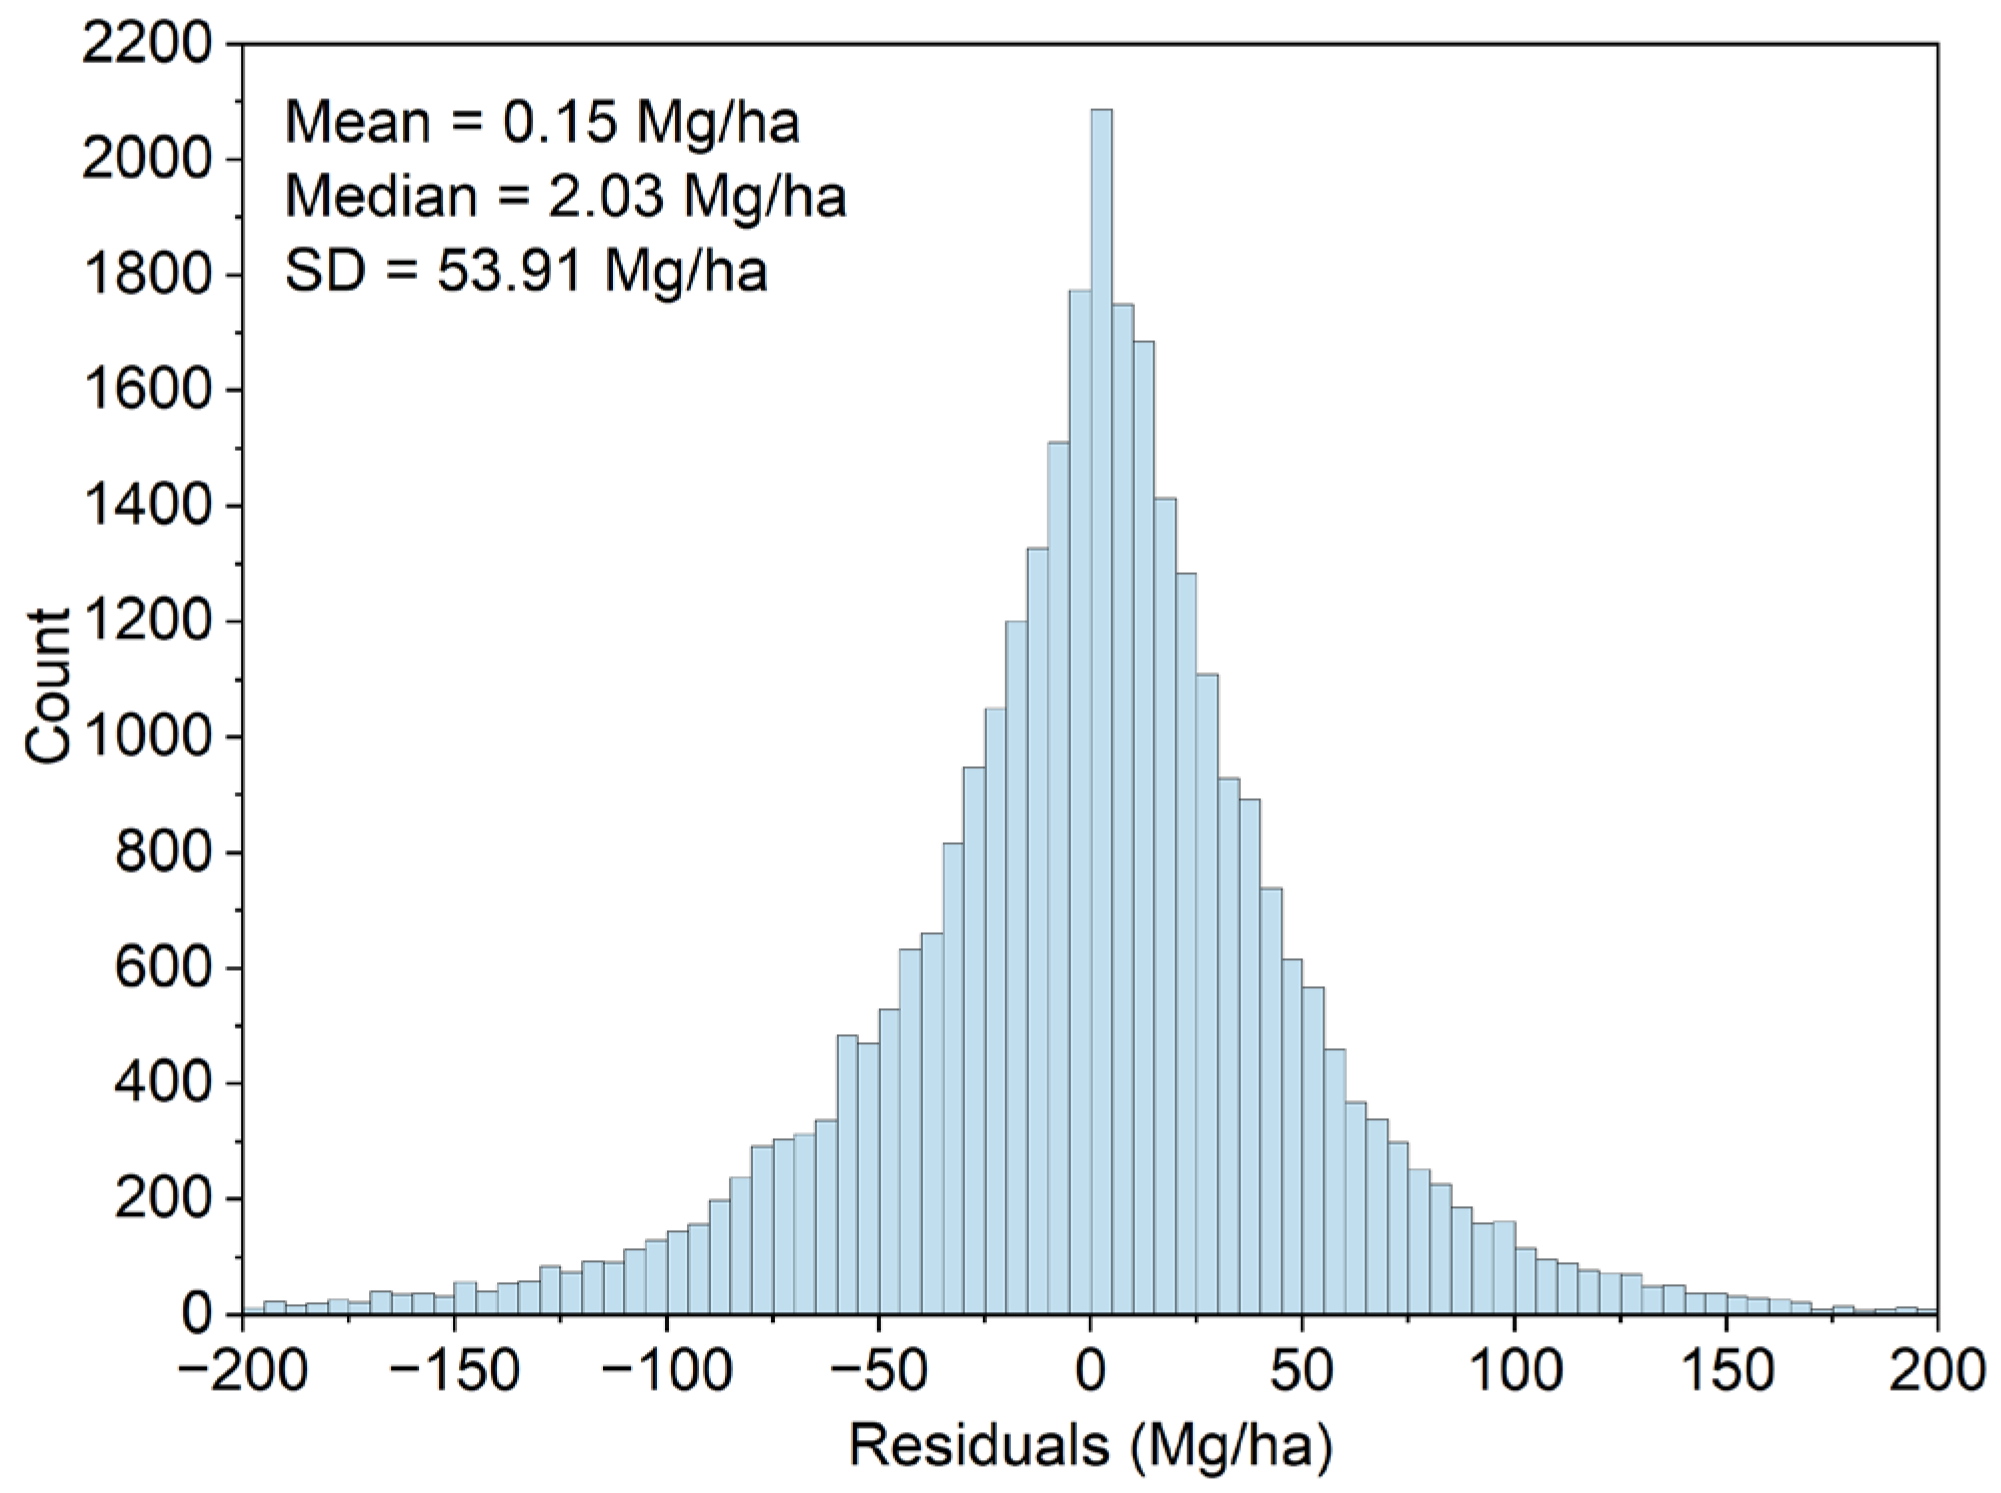
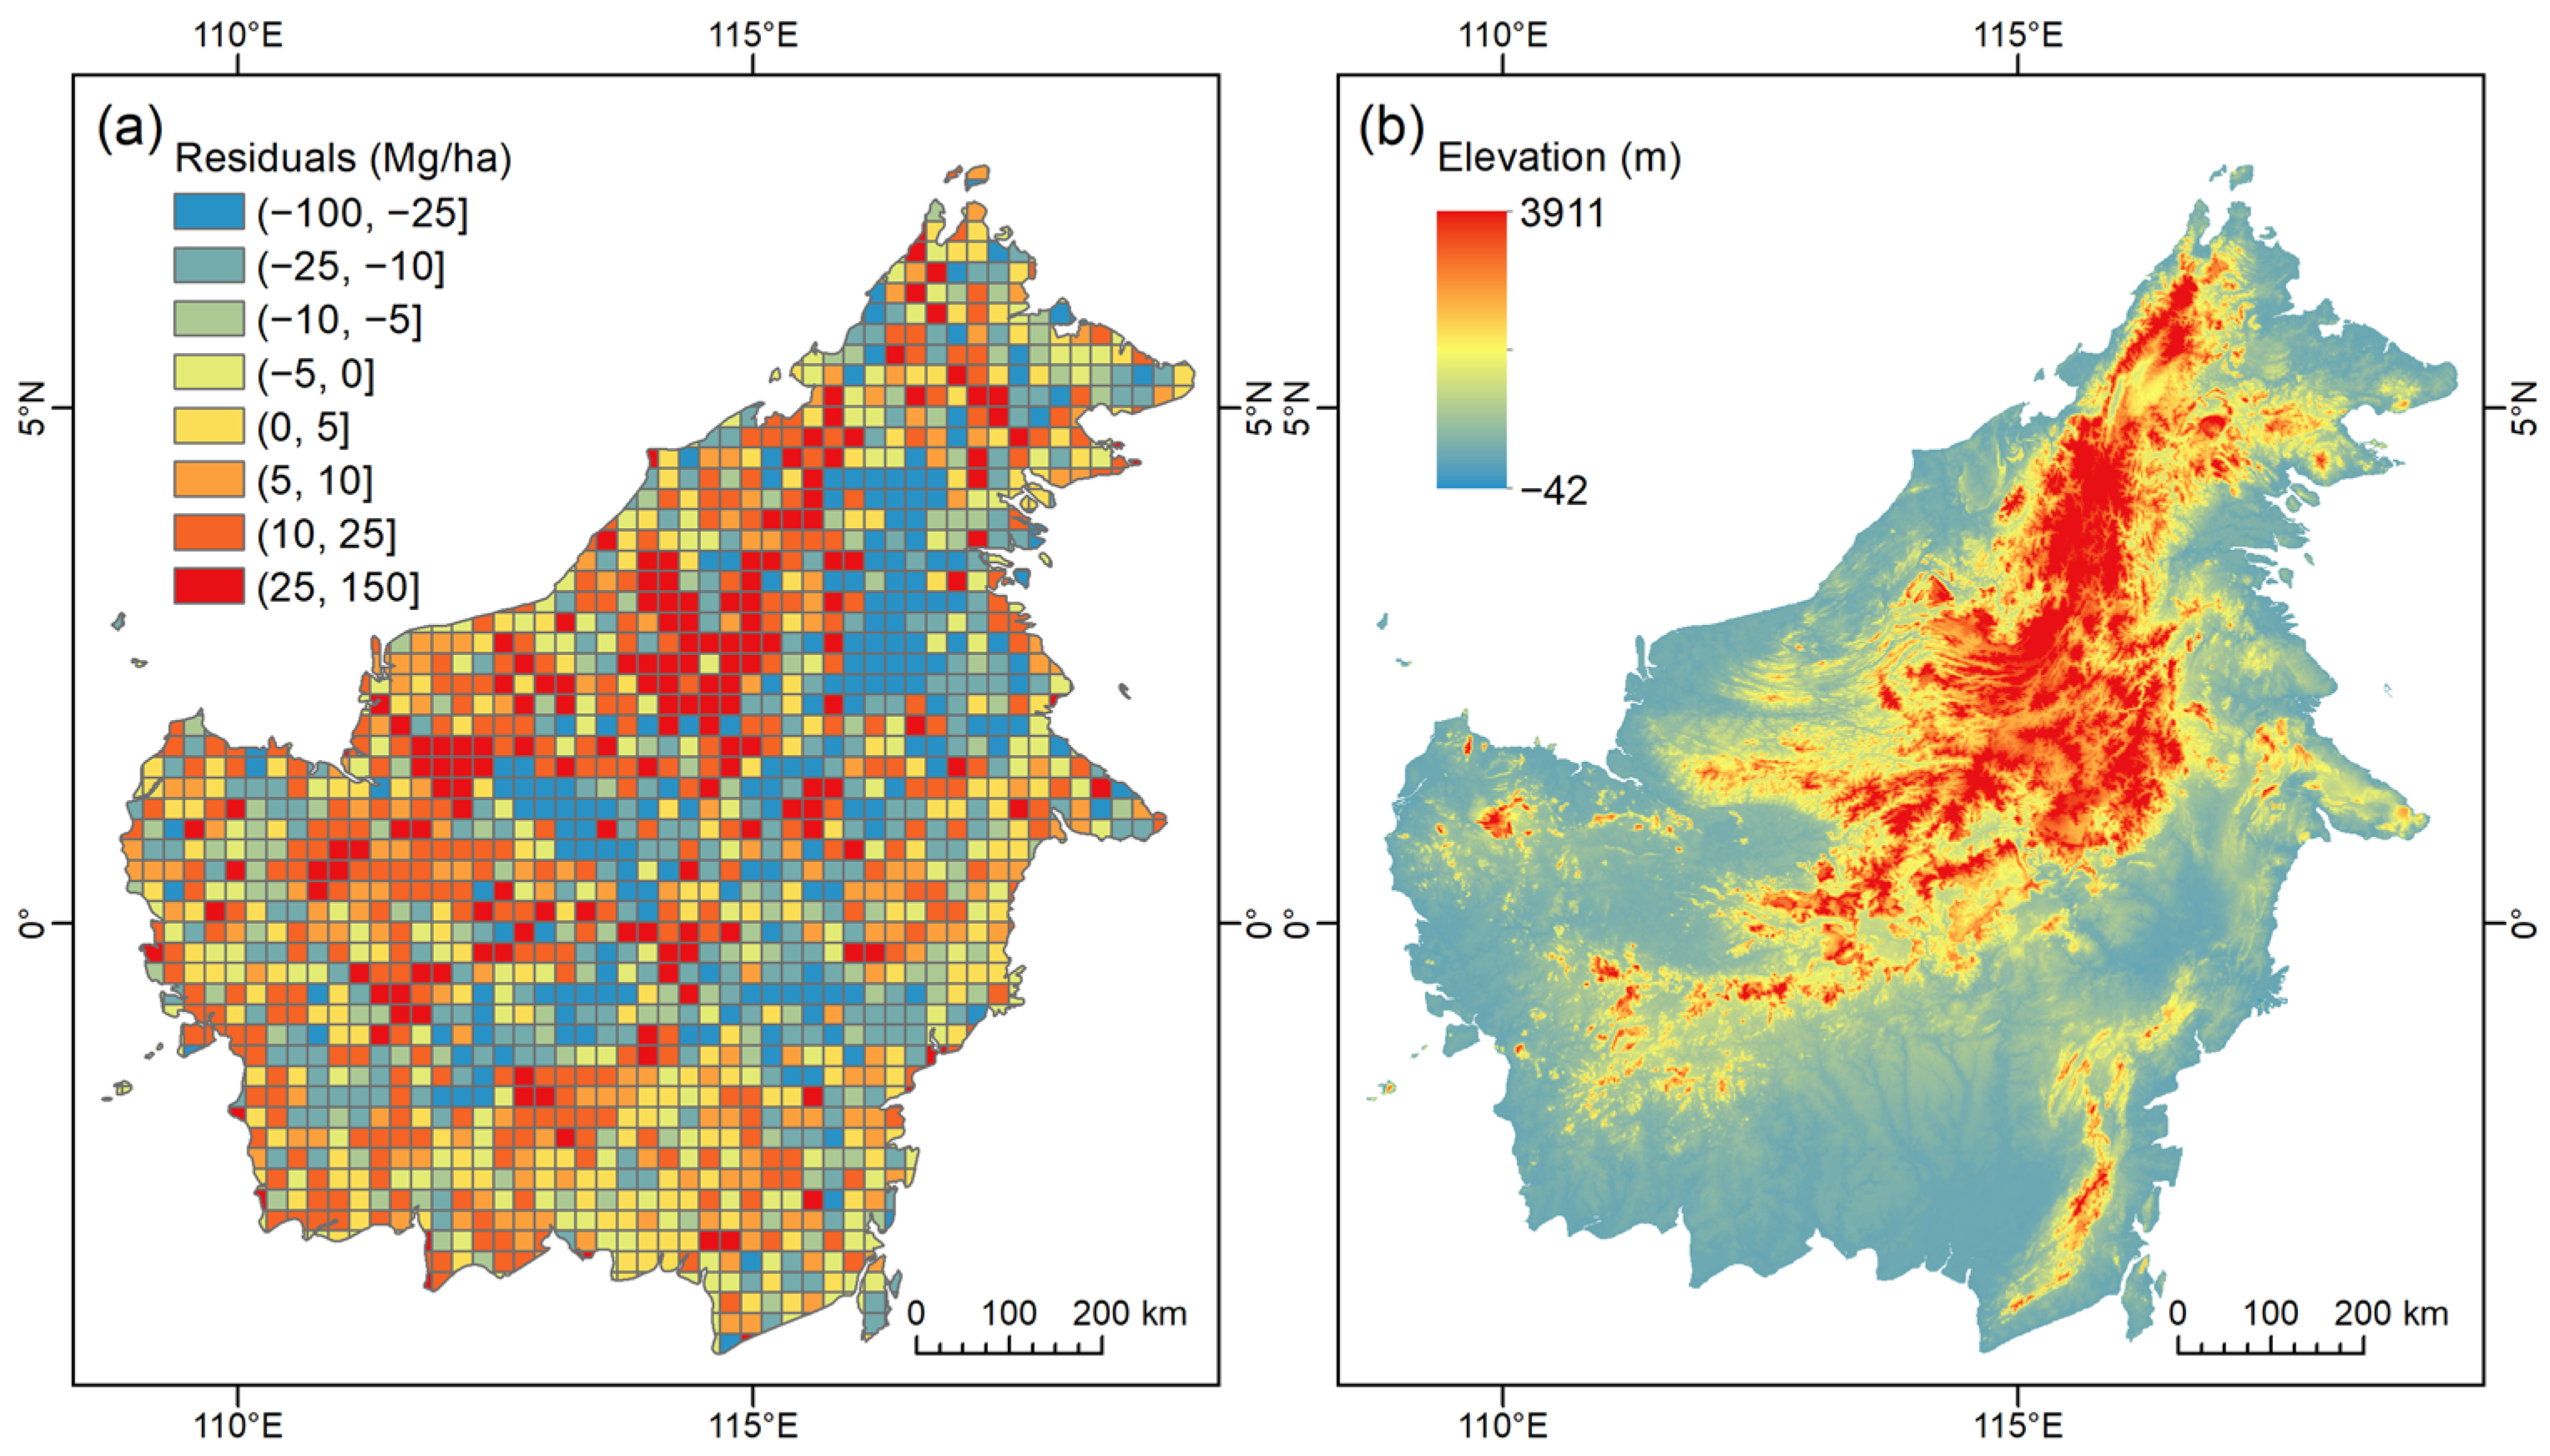
To further evaluate the performance of the stacked ensemble model, we analyzed the residual distribution of the retrieved AGB. The histogram (Figure 6) shows that residuals are approximately symmetrically distributed around zero, with a mean of 0.15 Mg/ha and a median of 2.03 Mg/ha, indicating minimal overall bias. The standard deviation of 53.91 Mg/ha suggests moderate variability in prediction errors. Slightly positive mean and median values imply a small systematic tendency toward overestimation, though this bias is not pronounced. Spatially (Figure 7a), overestimation (positive residuals) occurs in scattered patches, mainly in the northwestern lowland regions, whereas underestimation (negative residuals) is more concentrated in high-elevation zones. When compared with the elevation map (Figure 7b), these high-bias areas coincide with the mountainous interior of Borneo, where both elevation and AGB are generally higher. This pattern suggests that part of the underestimation may be due to the model’s difficulty in capturing extremely high biomass values in montane forests, possibly because such conditions are underrepresented in the training dataset (Figure 1b). Conversely, overestimation in lowland areas may be associated with mixed land cover types, seasonal canopy changes, or higher LST values that are not fully accounted for in the model.
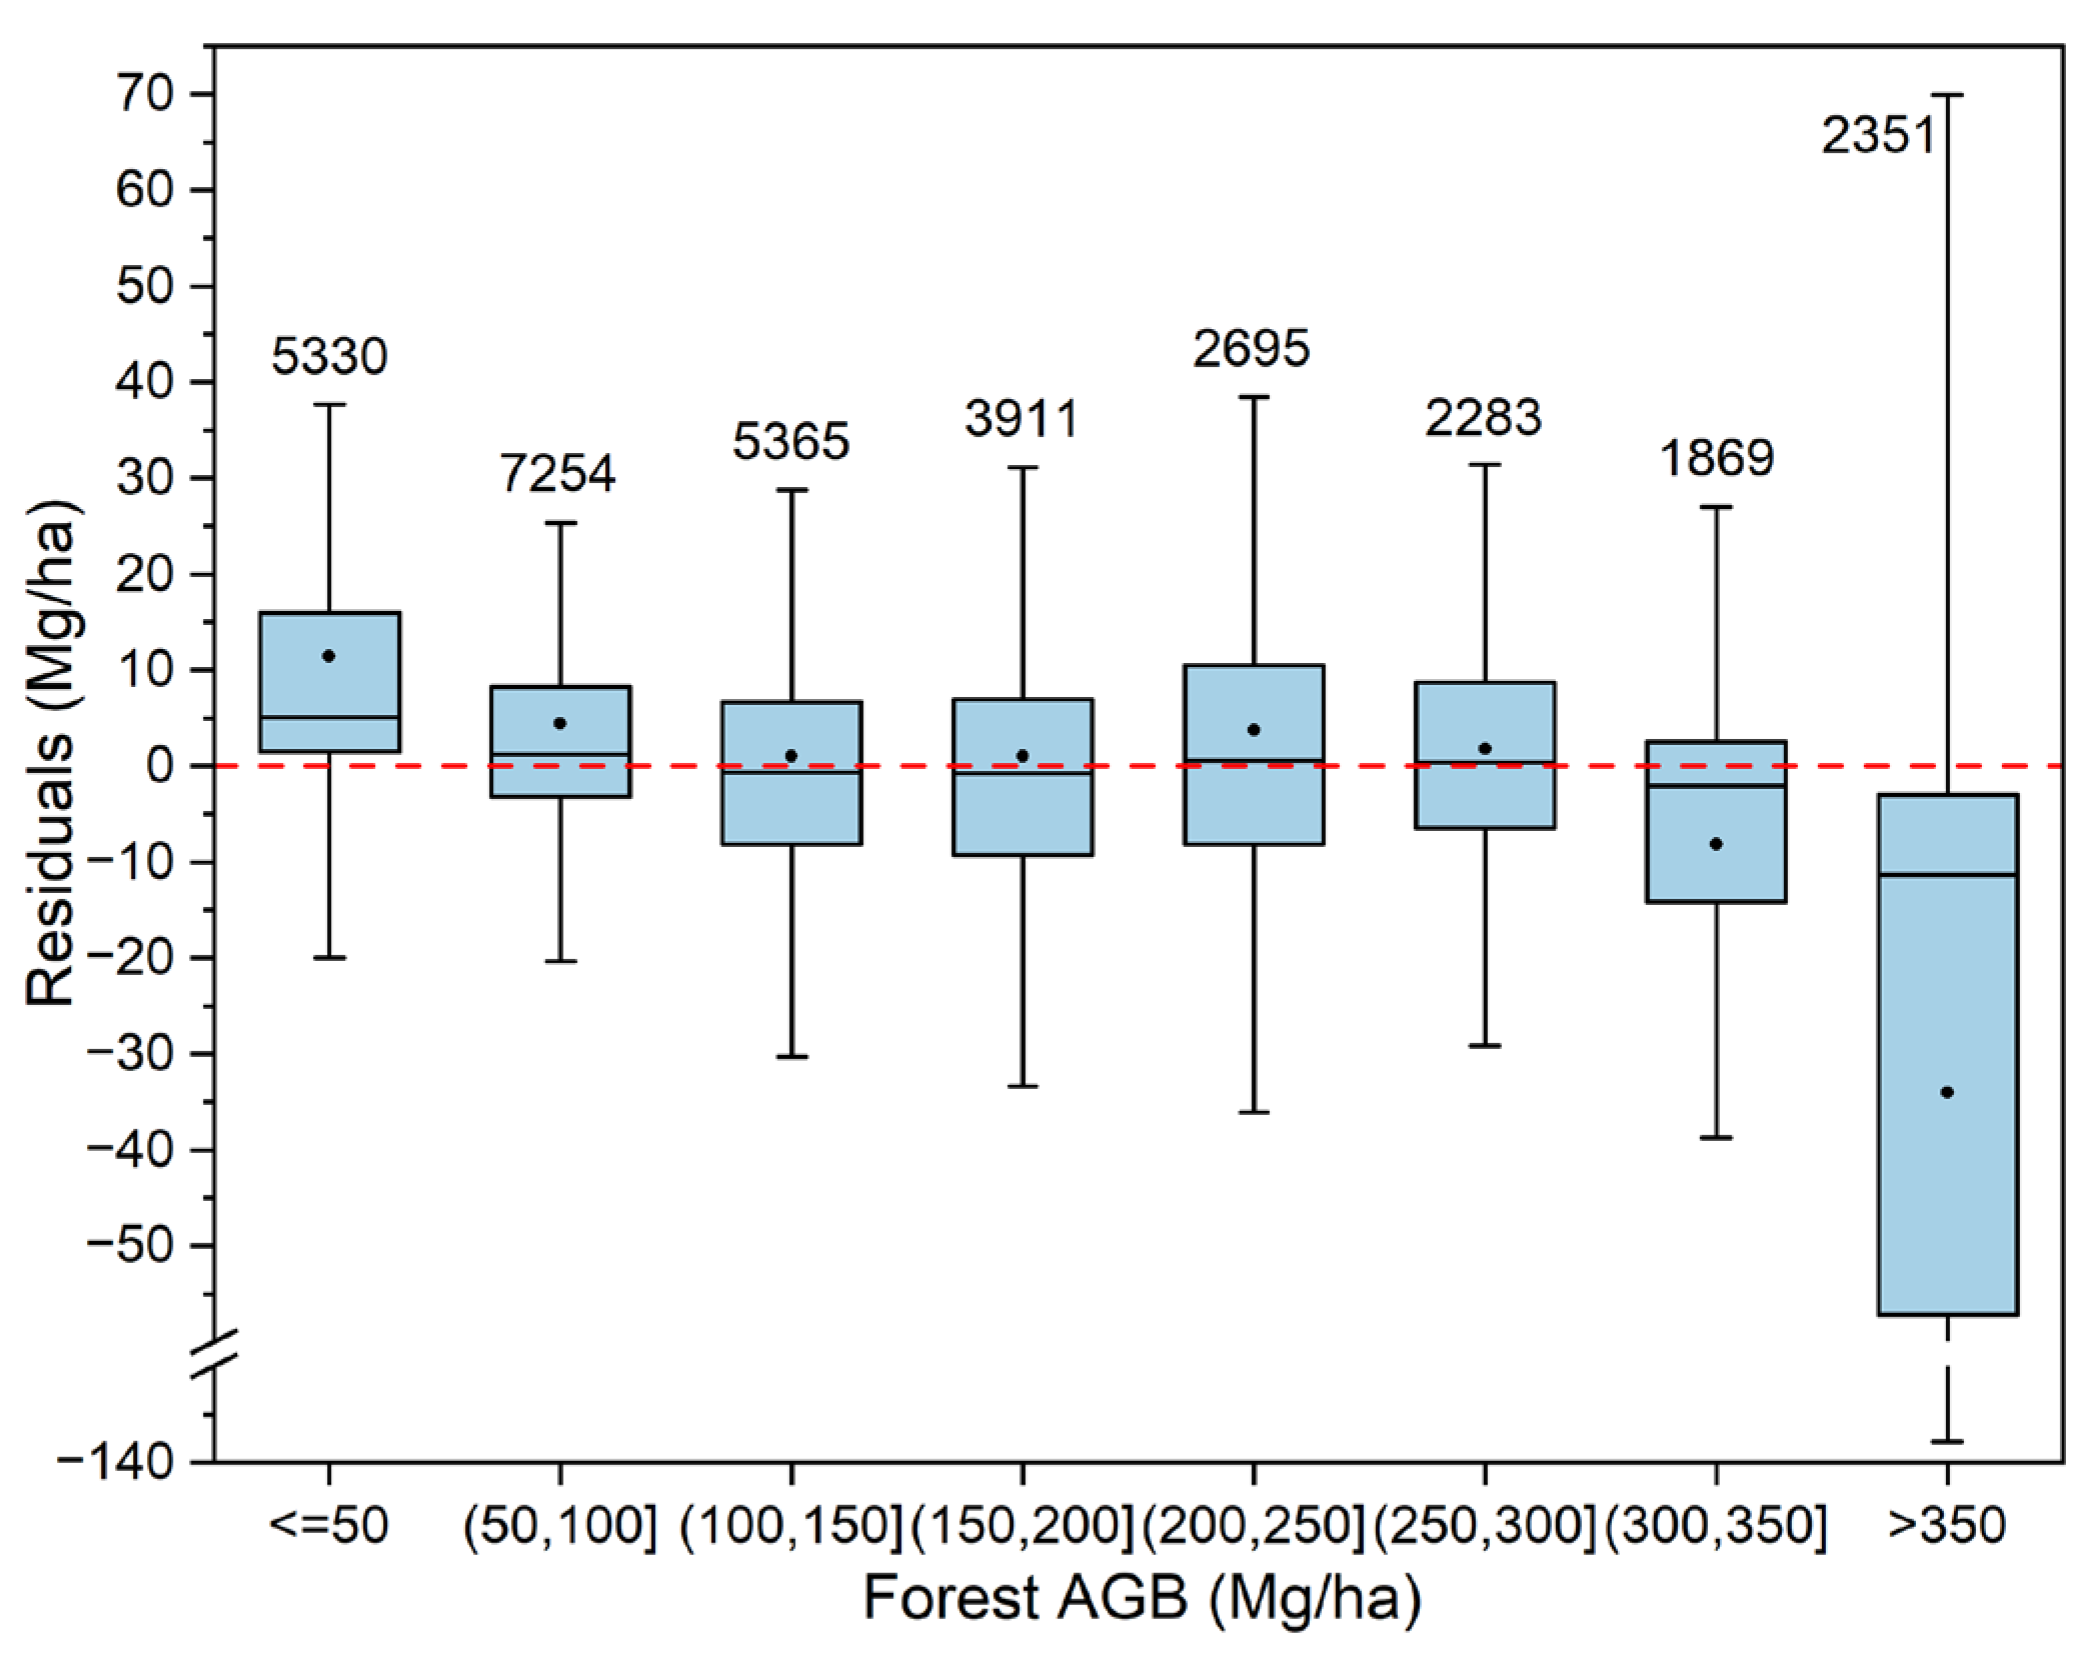
Grouping residuals by reference AGB reveals systematic patterns across biomass gradients (Figure 8). For low-biomass forests (≤50 Mg/ha), over 75% of residuals are positive, with a mean bias exceeding 10 Mg/ha, indicating consistent overestimation. In the intermediate range (50–350 Mg/ha), the mean residuals vary between −8 and 4 Mg/ha, showing no substantial bias. In contrast, for very high-biomass forests (>350 Mg/ha), more than 75% of residuals are negative, with a mean bias of −34 Mg/ha, indicating pronounced underestimation. To further assess model behavior at the extremes, we conducted supplementary experiments motivated by the residual patterns observed in Figure 8. In these experiments, the training dataset was restricted to either the low-biomass (≤ 50 Mg/ha) or the high-biomass (>350 Mg/ha) subset, and new models were trained specifically for these ranges. Compared with the original full-range model, the targeted models yielded more symmetric residual distributions, with a marked reduction in mean bias for both the low- and high-AGB groups (Figure 9). These results demonstrate that the heteroscedastic bias observed at the biomass extremes can be alleviated when models are optimized for specific ranges. While the full model remains the most appropriate for wall-to-wall spatial mapping, the targeted analyses highlight the potential benefits of range-specific modeling strategies for improving accuracy at distribution tails.
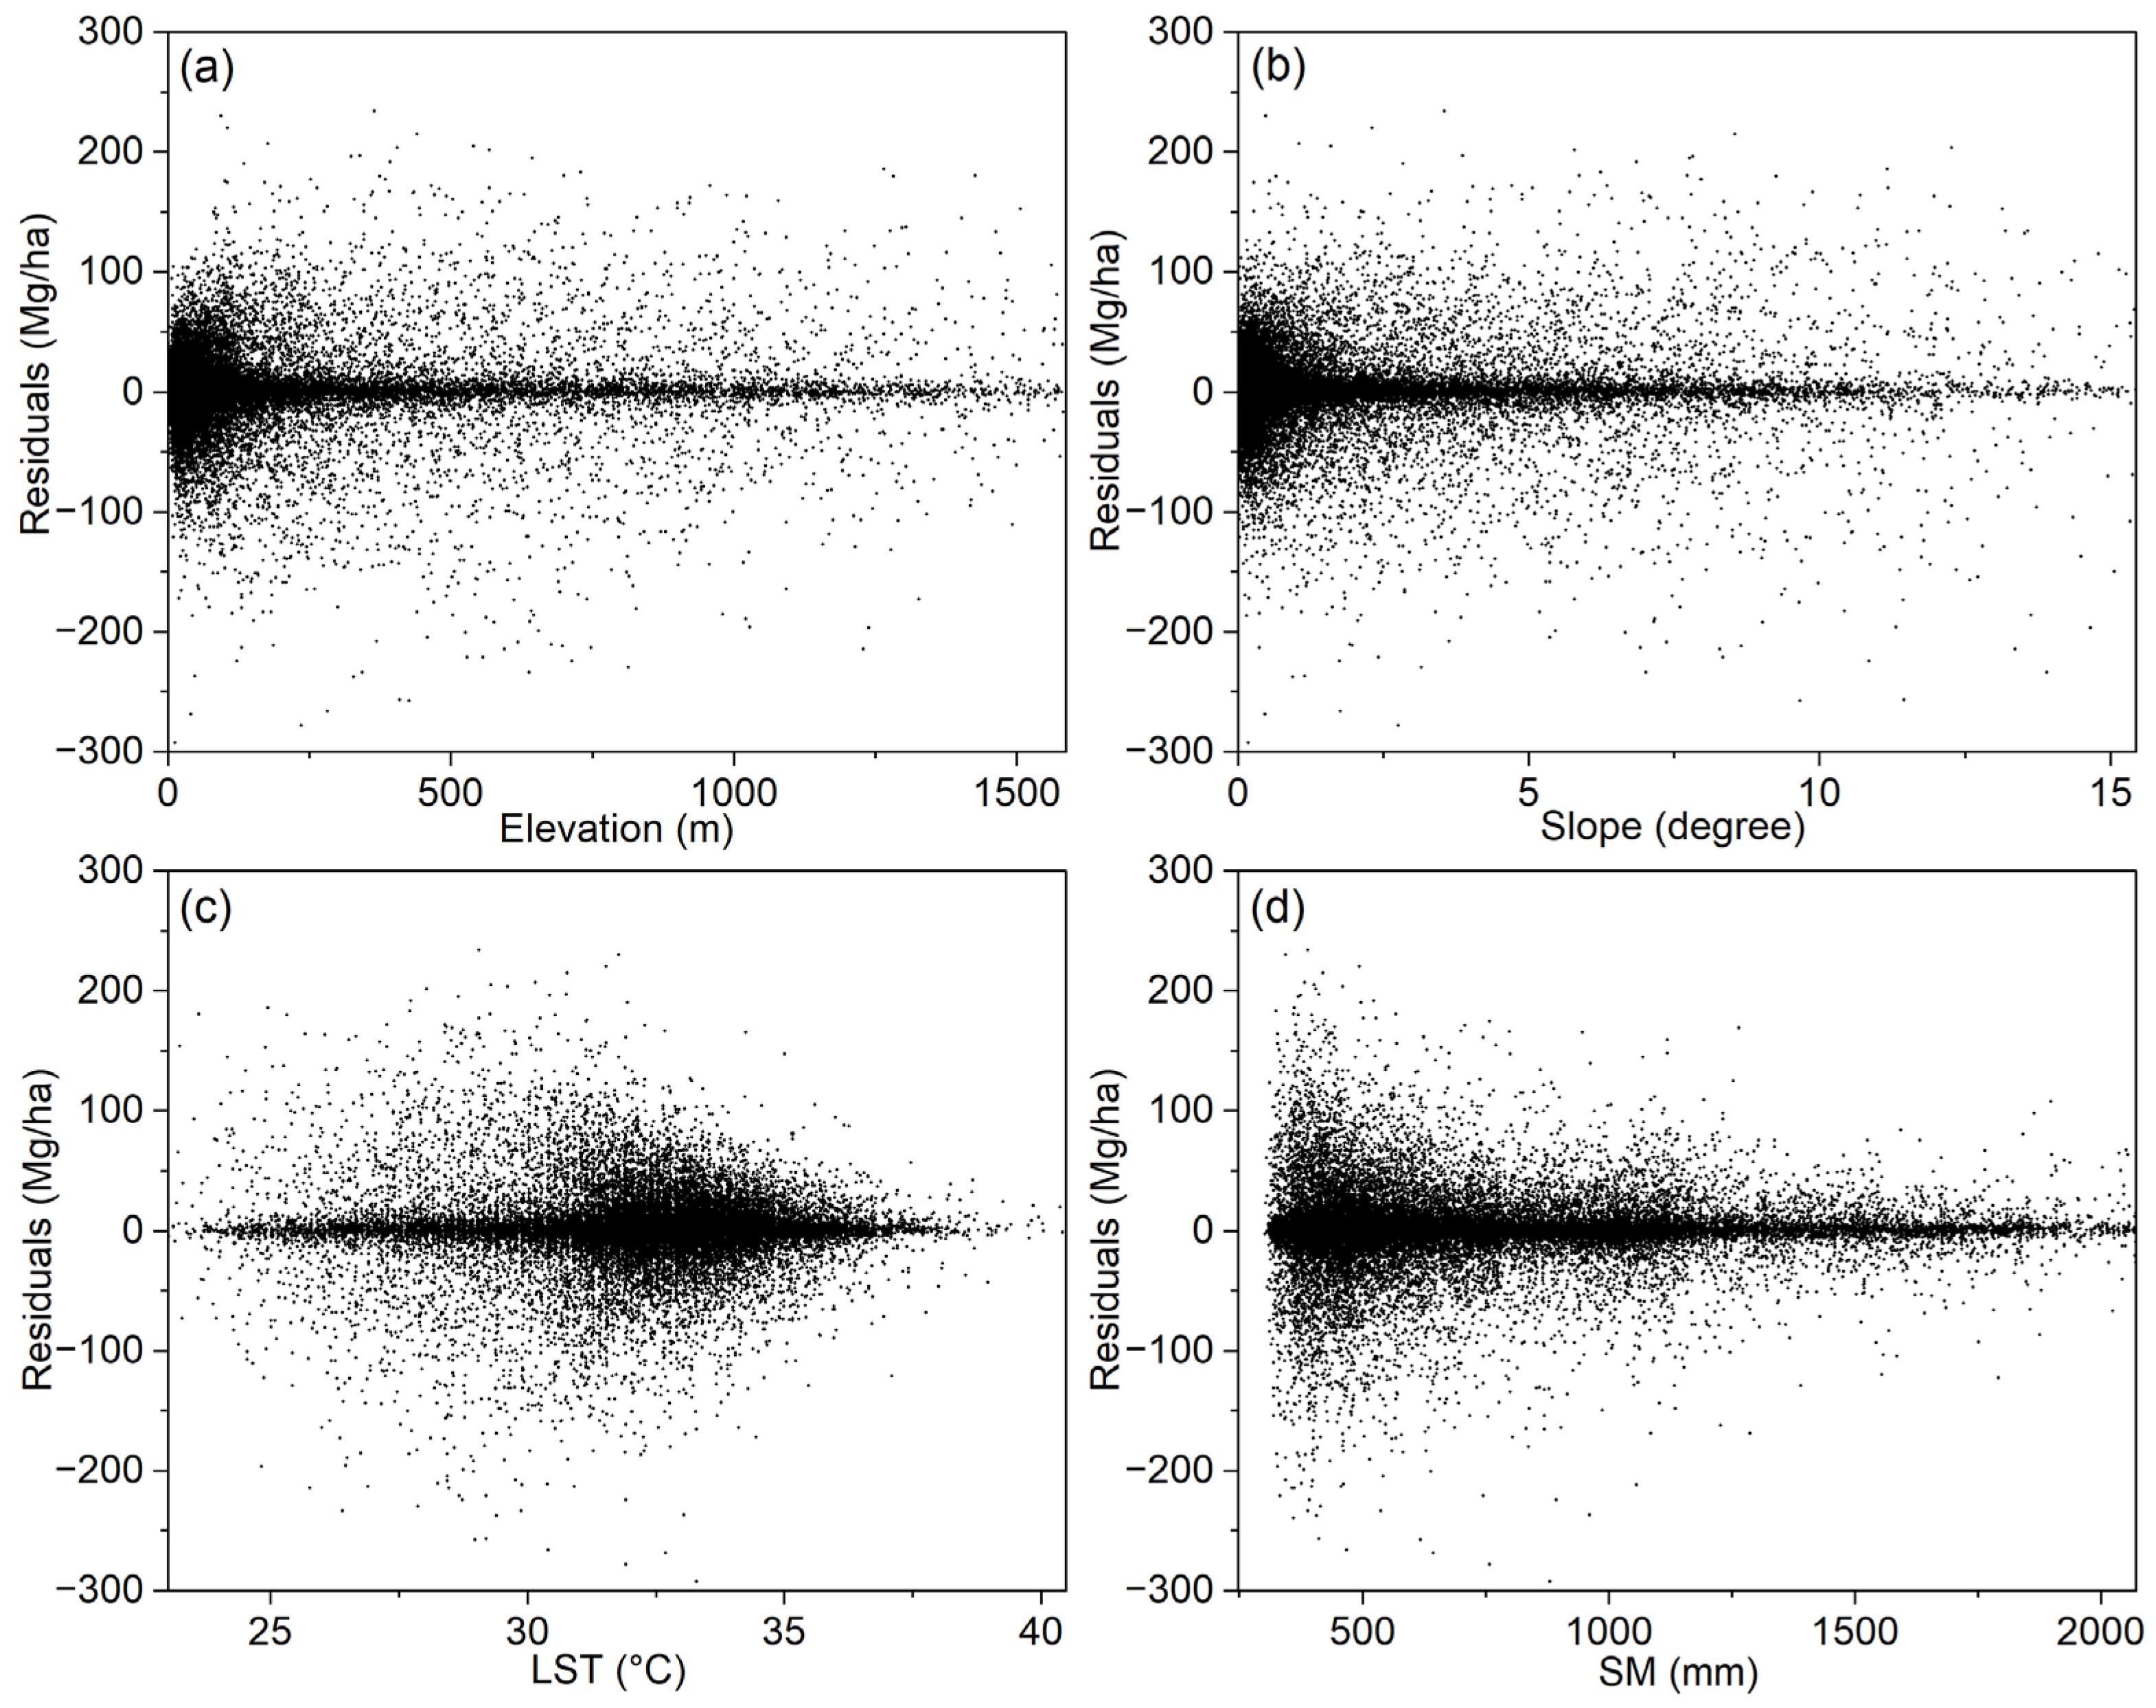
Scatter plots of residuals versus elevation, slope, land surface temperature, and soil moisture (Figure 10) show no strong linear or monotonic relationships, with residuals generally centered near zero across the full range of each variable. However, the dispersion of residuals increases at higher elevations and steeper slopes, suggesting greater prediction uncertainty in rugged terrain. Wider residual spreads are also observed at the upper extremes of land surface temperature and soil moisture, but without a consistent directional bias. These results indicate that errors are largely heteroscedastic and more pronounced under extreme environmental conditions, rather than being systematically associated with specific factor ranges. Taken together with the AGB-stratified residual analysis (Figure 8), we suggest that the primary bias of the retrieval model occurs in forests with extremely high aboveground biomass, where underestimation is most evident. This pattern is attributable to the saturation effect inherent in both optical and SAR data [21], which have limited penetration in dense tropical canopies, as well as to known limitations in canopy height retrievals from GEDI footprints [22]. The reduced sensitivity of these predictors at high biomass levels constrains the model’s ability to capture the true structural variability of these forests, leading to systematic underestimation.
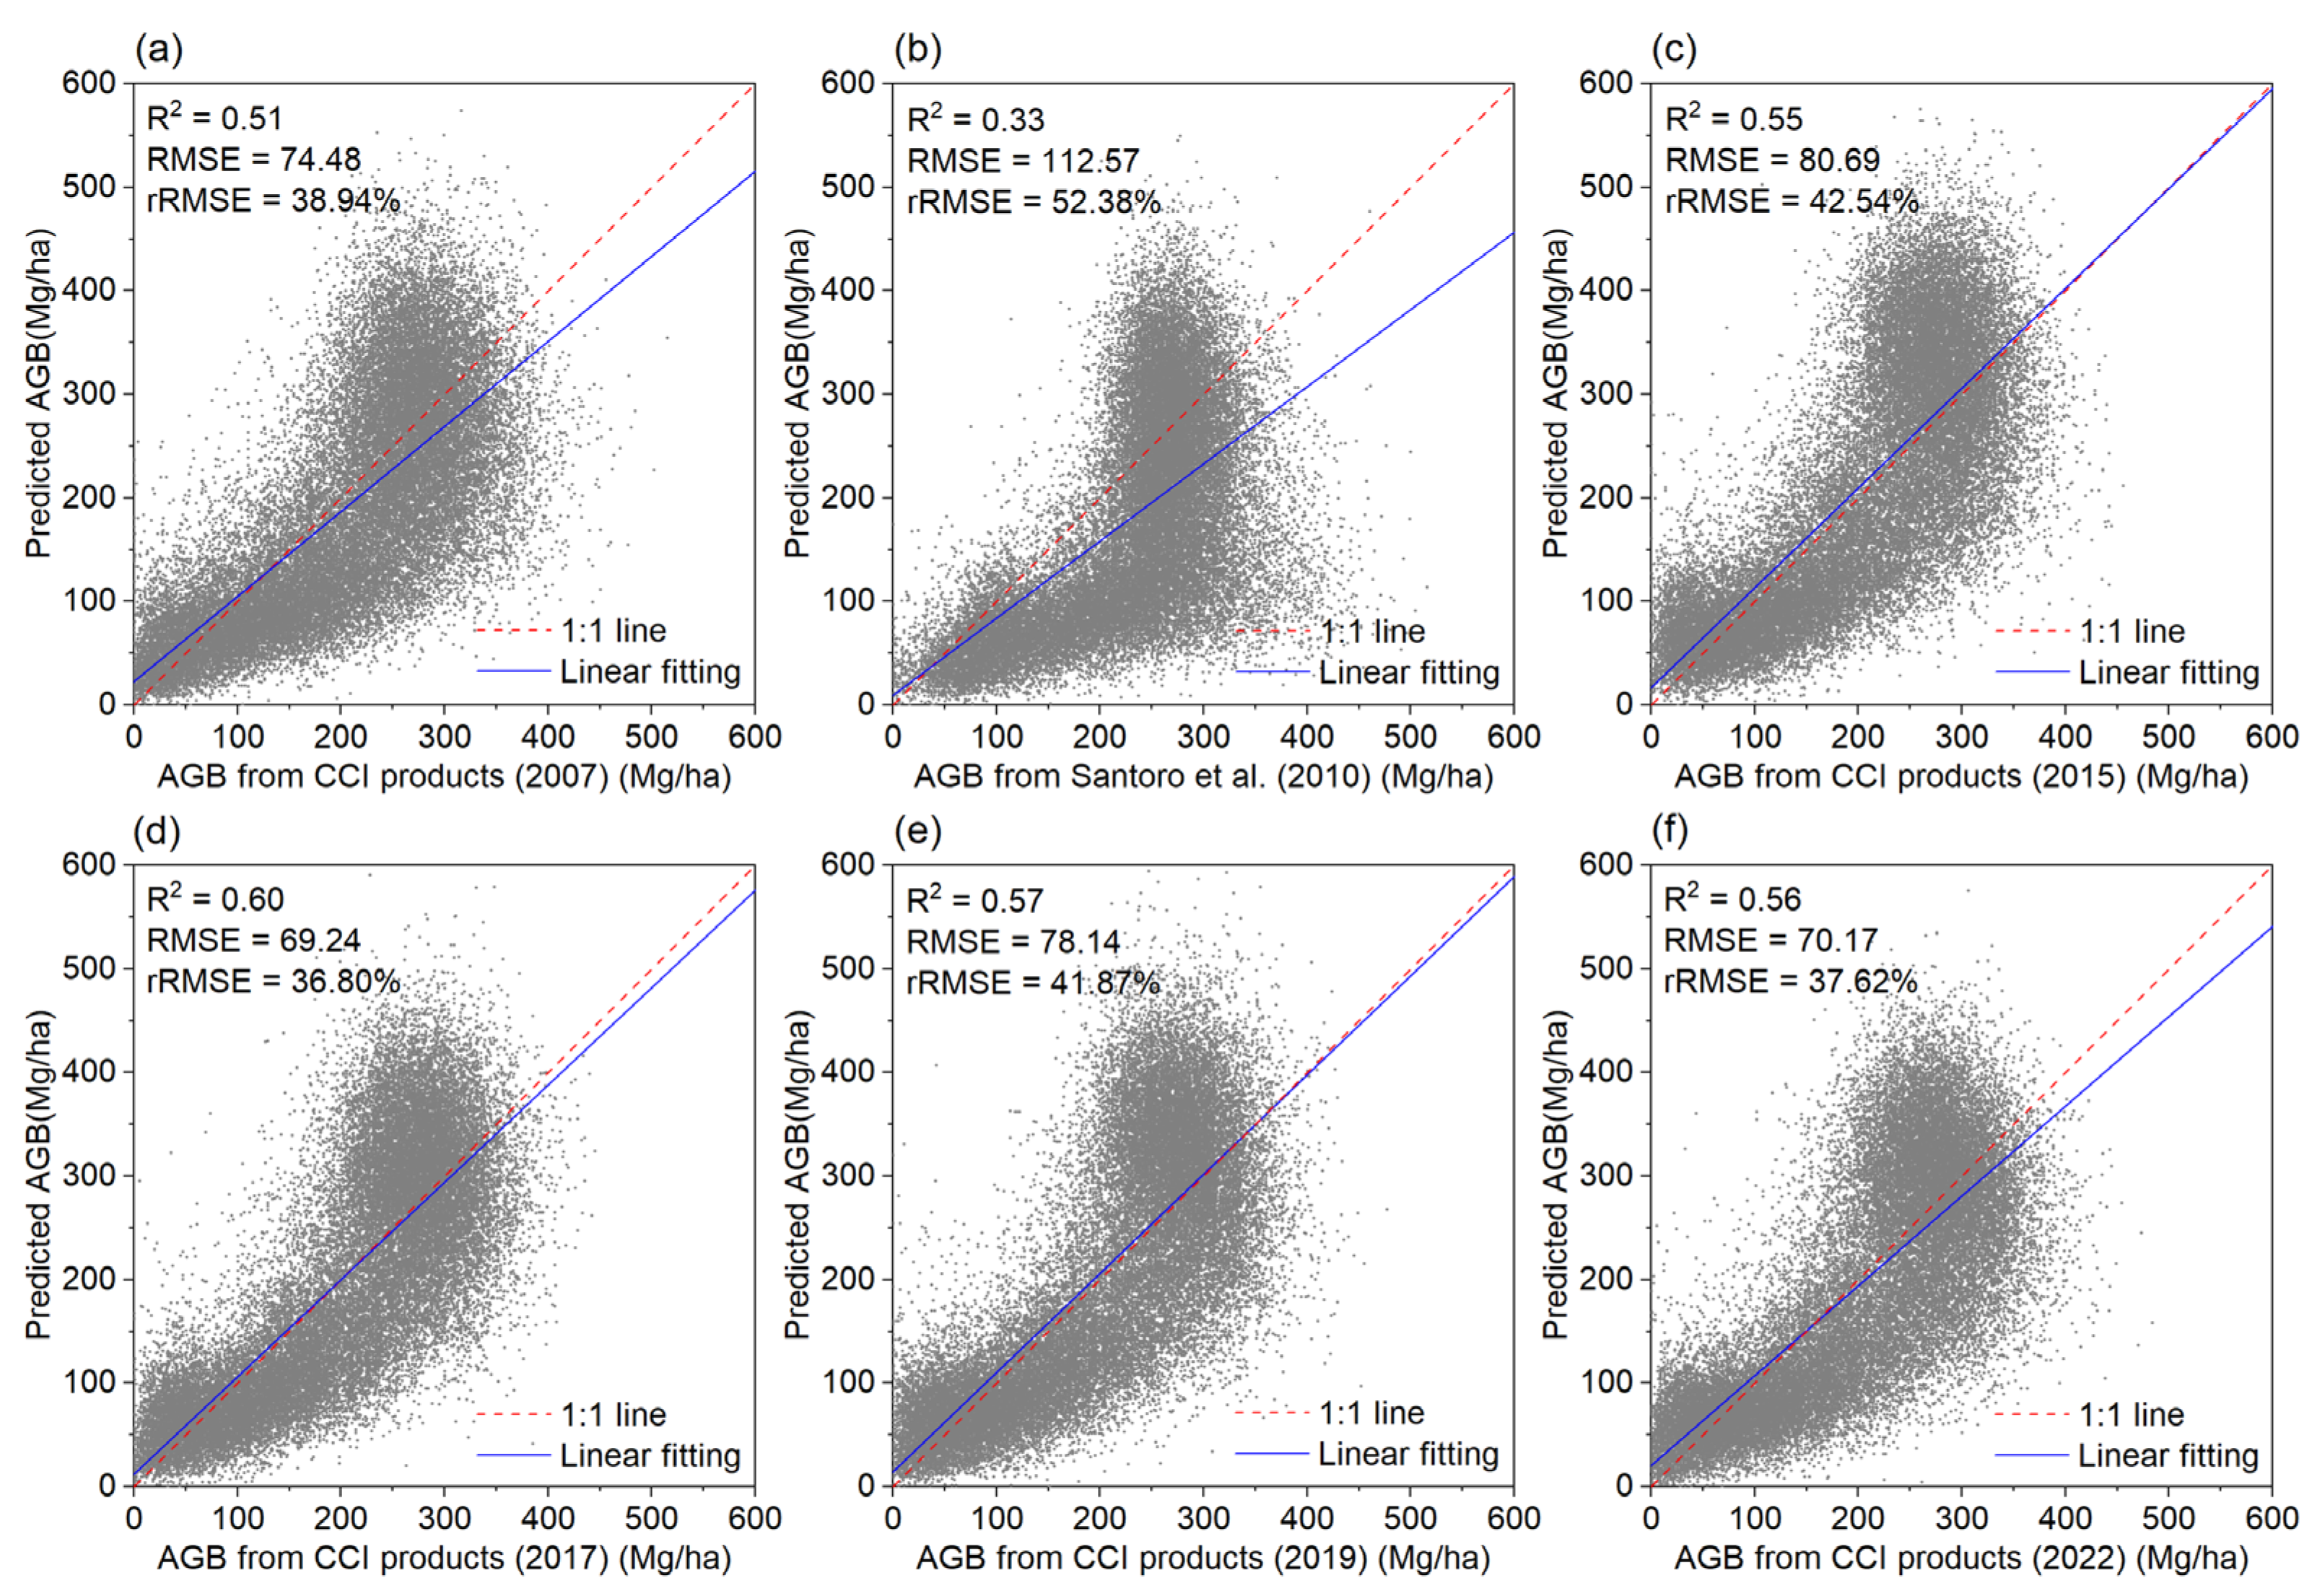
To assess temporal extrapolation and cross-product consistency, we compared our annual AGB maps with the ESA CCI Biomass product [37] for 2007, 2015, 2017, 2019, and 2022 and with the map of Santoro et al. [77] for 2010, as shown in Figure 11. Agreement with CCI is moderate with R2 0.51–0.60, RMSE 69.24–80.69 Mg/ha, and rRMSE 36.80–42.54%. Agreement with Santoro et al. [77] is lower with R2 0.33, RMSE 112.57 Mg/ha, and rRMSE 52.38%. The scatter plots show a systematic divergence above 300 Mg/ha, where our estimates are higher than both products. Together with the AGB-stratified residuals in Figure 8 that still indicate underestimation in the extreme class, this pattern shows that the CCI and Santoro products exhibit a stronger low bias at very high biomass, whereas our estimates reduce this bias and provide more accurate retrievals in high-biomass forests.

3.4. Spatiotemporal Dynamics and Long-Term Trends of AGB

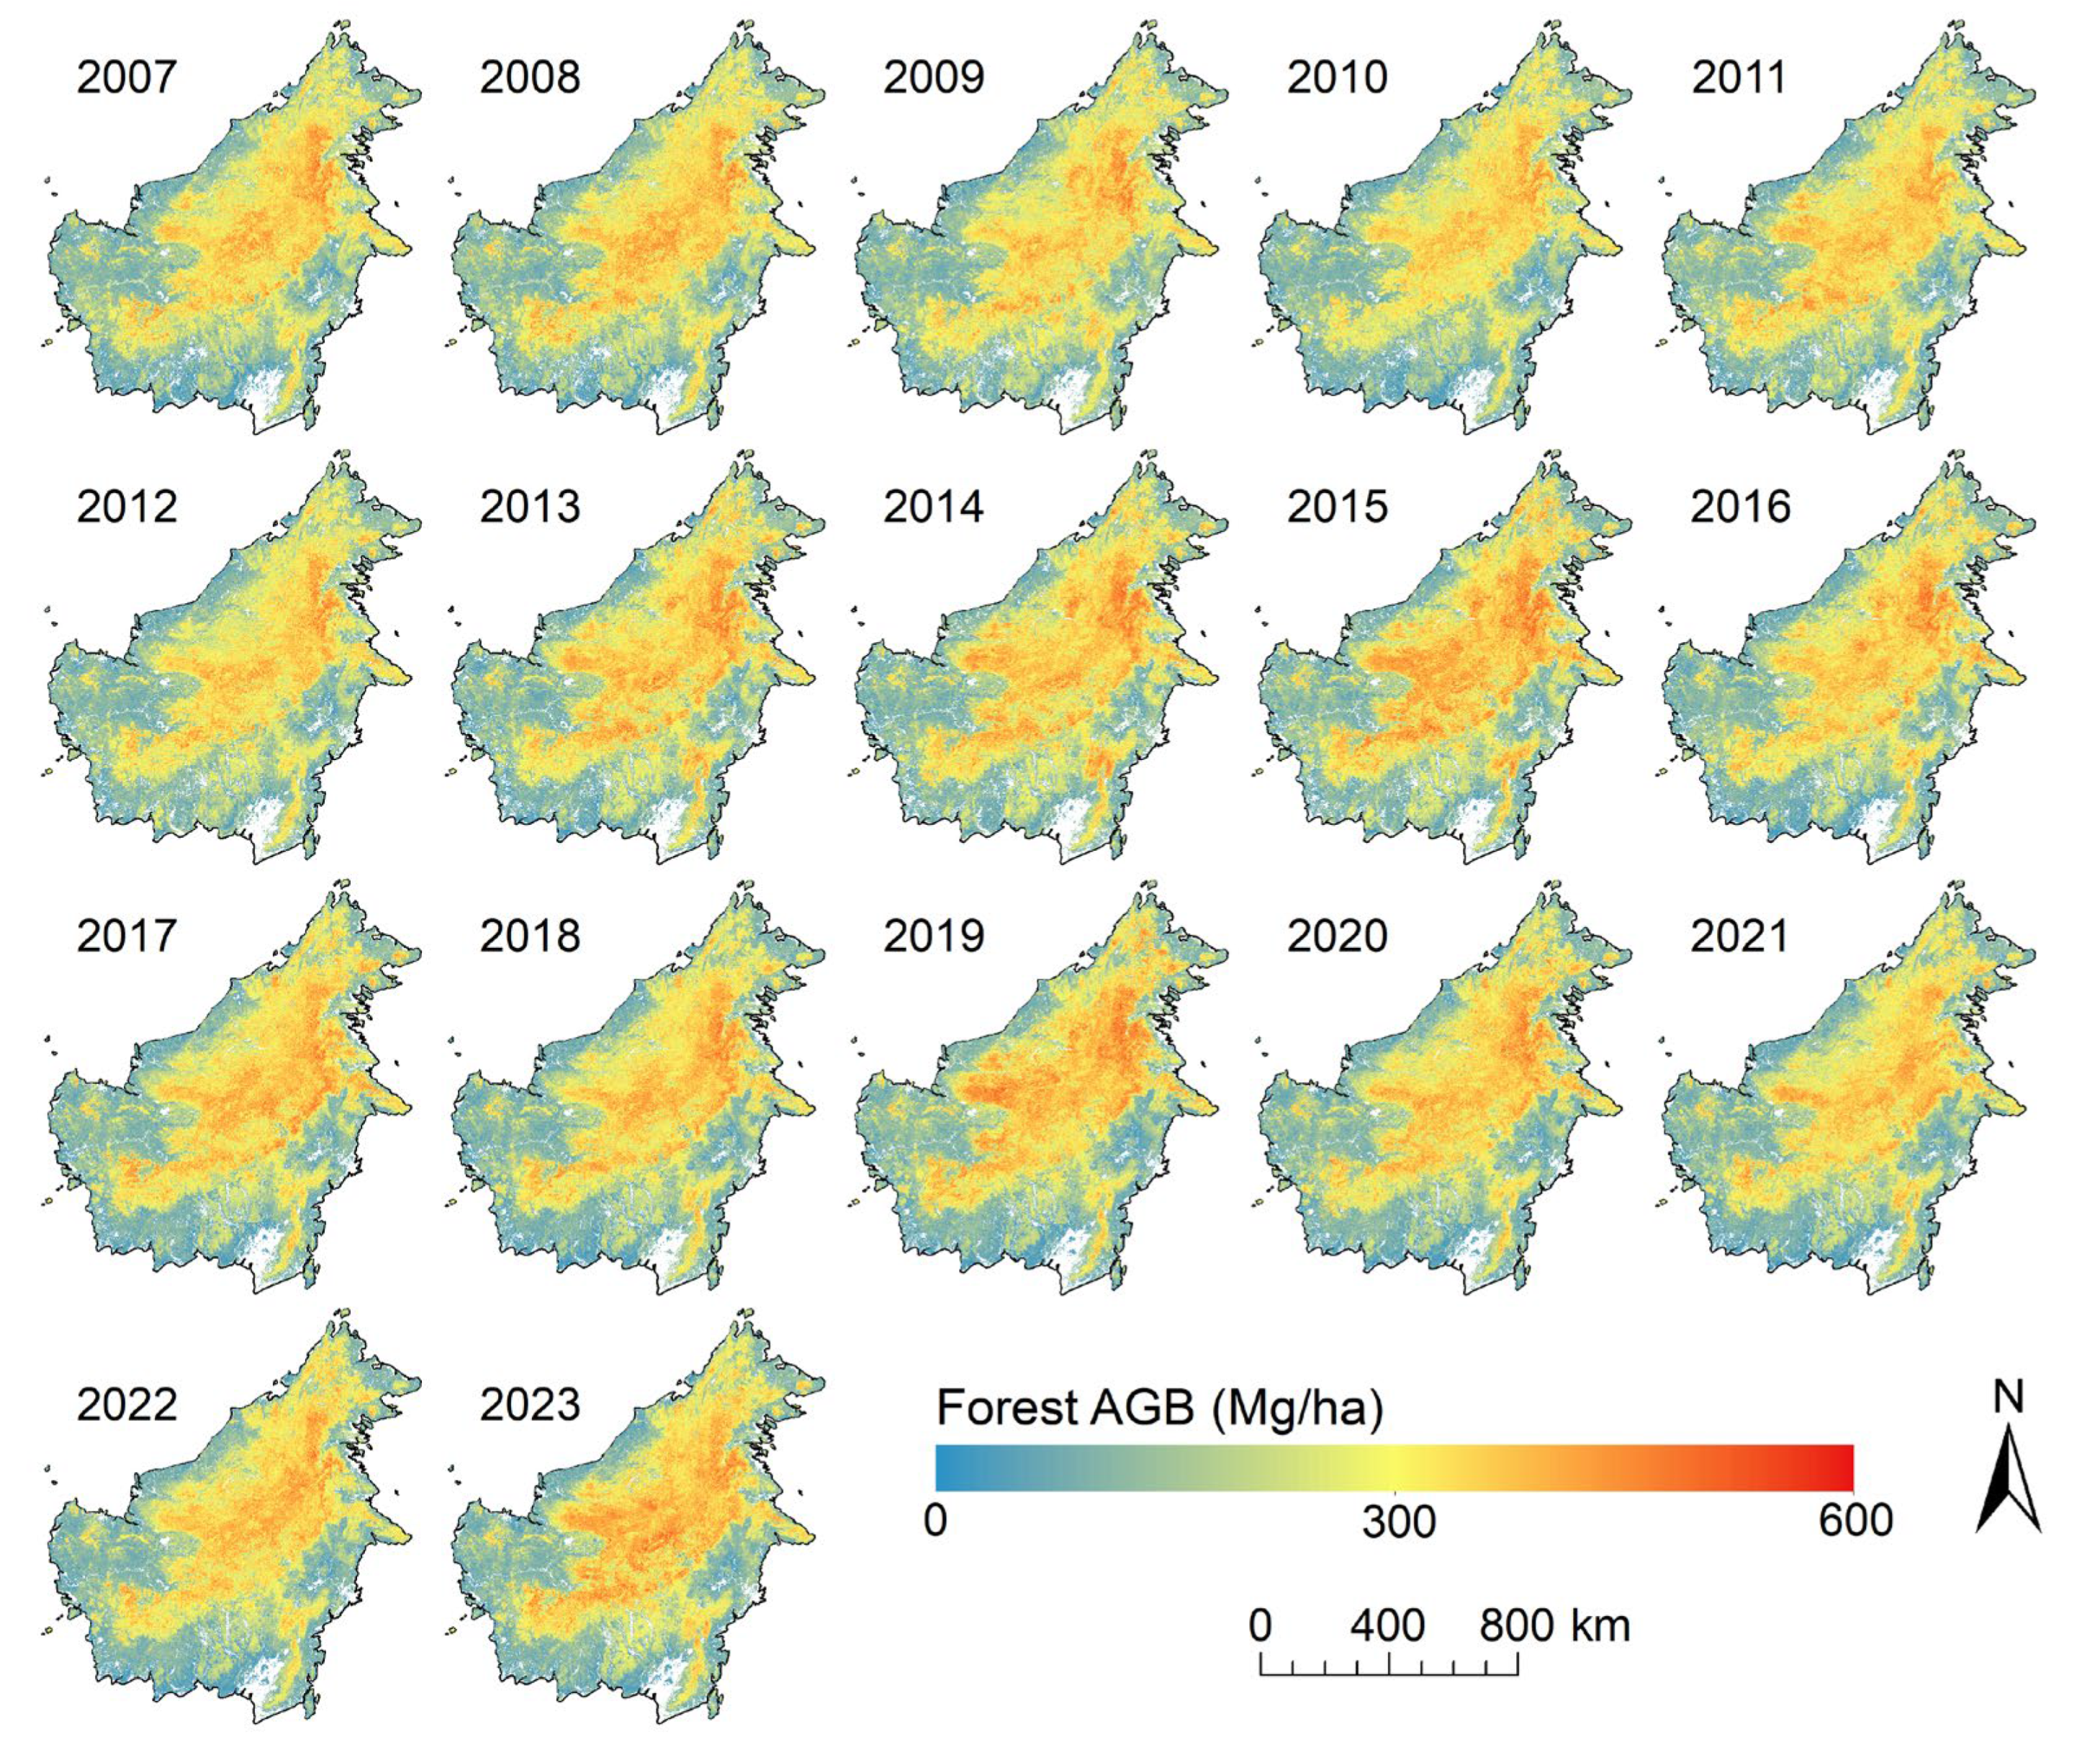
Using the stacked ensemble model integrating multi-source remote sensing data, we mapped Borneo’s AGB annually at 1 km resolution from 2007 to 2023 (Figure 12). The spatial distribution exhibits marked heterogeneity, with the highest biomass values occurring in the island’s central mountainous regions, while coastal lowlands generally show lower biomass. This pattern reflects the combined influence of topography and human activity. Dense, high-biomass tropical forests are more prevalent inland, where rugged terrain limits accessibility and disturbance, whereas coastal zones experience more logging, plantation expansion, and other anthropogenic pressures.
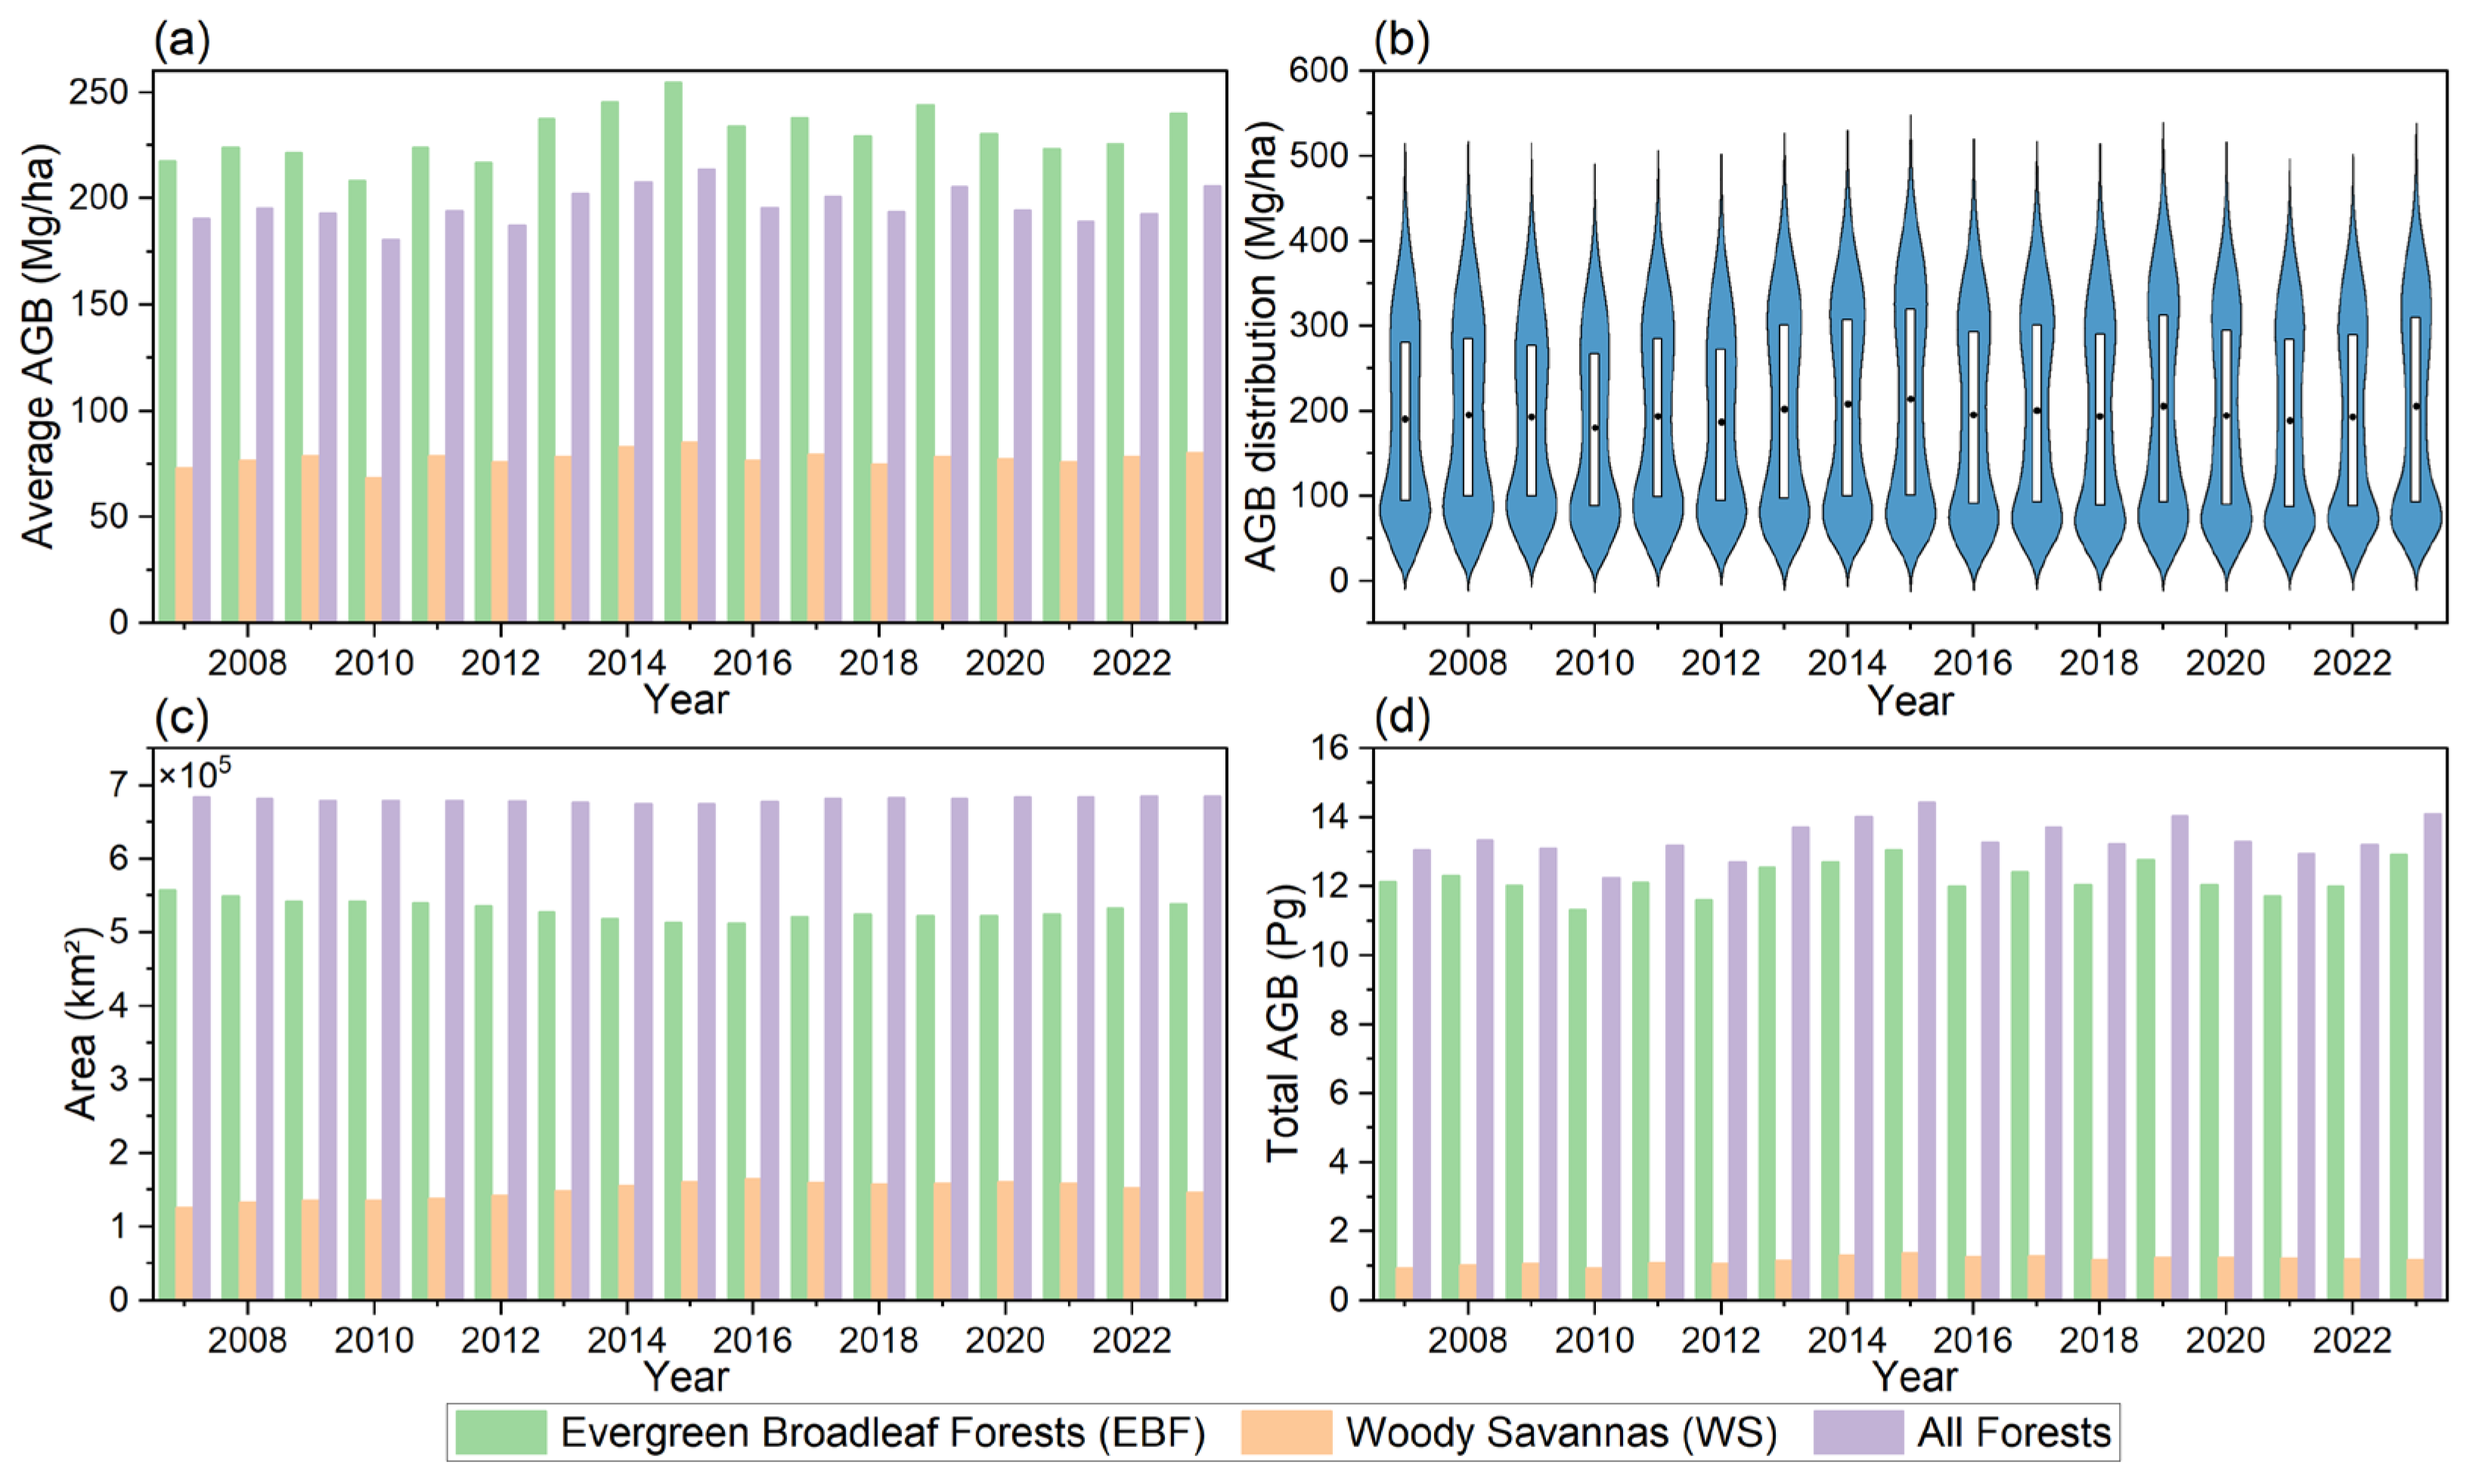
Figure 13 quantifies changes in forest area, average AGB, and total AGB of major forest types in Borneo from 2007 to 2023, along with the annual AGB distribution range. According to the IGBP classification, most of Borneo’s forests are evergreen broadleaf forests (EBF, tree cover > 60%) and woody savannas (WS, tree cover 30–60%); thus, only these two types are reported. Average AGB across all forest types shows slight fluctuations (Figure 13a): EBF ranges from 208.64 to 254.56 Mg/ha, WS from 68.65 to 85.17 Mg/ha, and the overall average from 180.52 to 214.09 Mg/ha. Figure 13b presents the annual AGB distribution, exhibiting a bimodal pattern with peaks around 80 and 300 Mg/ha, likely due to strong spatial gradients from central mountains to coastal zones, causing dramatic changes in AGB and clustering near these values. Changes in total AGB mirror the average AGB trends (Figure 13d): EBF ranges from 12.13 to 12.92 Pg, WS from 0.92 to 1.18 Pg, and Borneo overall from 13.05 to 14.10 Pg. EBF consistently dominates both biomass stock and area, though it declined until 2016 before a modest recovery, whereas WS expanded over the same period and contracted slightly thereafter (Figure 13c). These shifts likely reflect conversion of primary forests to plantations, classified as WS due to lower canopy cover and cyclic harvesting, and subsequent conservation or reforestation efforts.
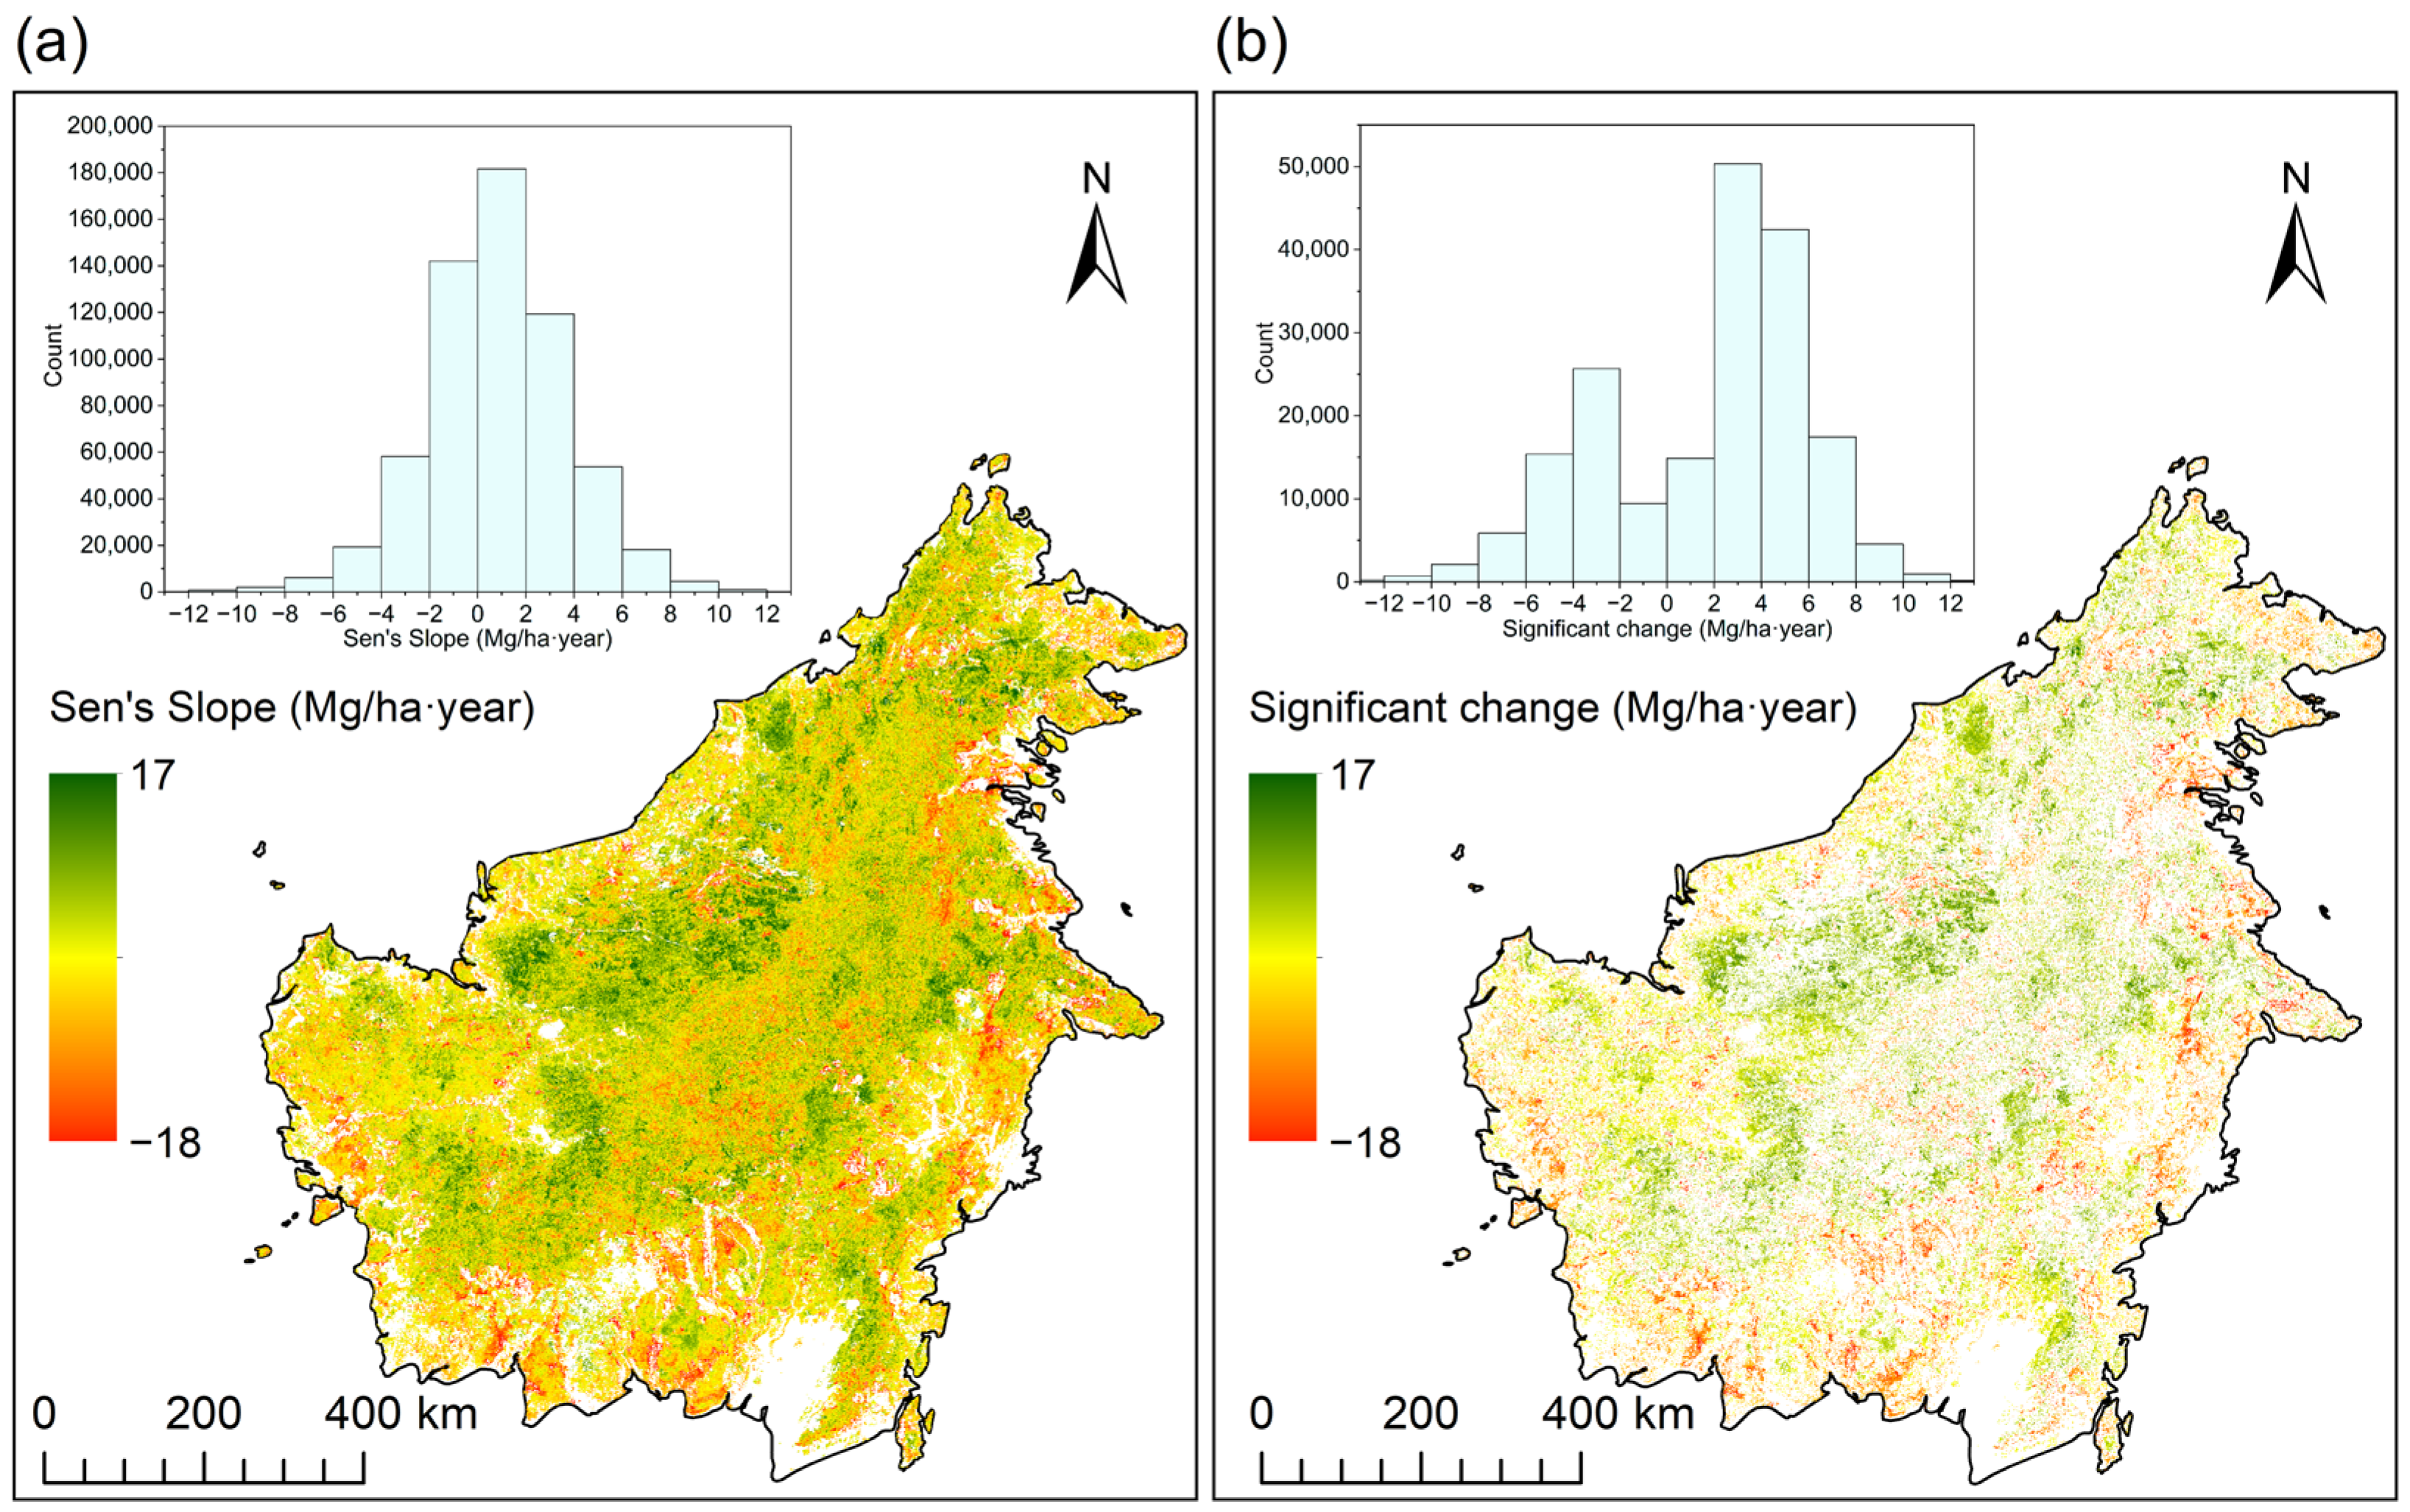
To further assess pixel-level AGB trajectories, Sen’s slope and Mann–Kendall tests were applied over the 2007–2023 period (Figure 14). The Sen’s slope results indicate that 62.34% of forest pixels experienced a positive rate of change, while 37.66% showed a negative rate of change. The Mann–Kendall test further identifies that 31.31% of all pixels exhibited statistically significant monotonic trends (p < 0.05). Among these significant pixels, 68.76% showed increasing trends, suggesting sustained biomass gains, and the remaining 31.24% showed decreasing trends, indicating persistent biomass losses. Spatially, significant gains are clustered in the western and northern interior forests, which are largely intact and less disturbed, likely reflecting natural forest growth and recovery. In contrast, significant losses are concentrated along the eastern and southern coastal regions, spatially coinciding with areas of intensive human activity such as logging, plantation expansion, and infrastructure development. These findings highlight that, although the overall island-wide biomass budget remains relatively stable, spatially explicit trend analysis can reveal clear hotspots of both growth and degradation. Such information is critical for prioritizing conservation and restoration efforts to maintain and enhance tropical forest carbon stocks in Borneo.

4. Discussion

By integrating multi-source remote sensing datasets with an automated ensemble learning framework, we reconstructed annual AGB dynamics in Borneo from 2007 to 2023 with improved accuracy in high-biomass tropical forests. The use of a large-scale GEDI LiDAR training dataset, combined with MODIS, PALSAR/PALSAR-2, SRTM, and climate variables, and implemented through a stacking ensemble learning strategy, reduced systematic bias that often arises when relying solely on optical indices affected by saturation. Our estimates indicate that the average AGB of Borneo forests over this period ranged from 180.52 to 214.09 Mg/ha, with total biomass between 13.05 and 14.10 Pg. These values are broadly consistent with previous assessments, such as 173.3 Mg/ha and 12.8 Pg reported by Hayashi et al. [38] using PALSAR-2 and ICESat/GLAS, 196.36 Mg/ha in pristine northern mangroves from airborne LiDAR reported by Wong et al. [83], and 211.8 ± 12.7 Mg/ha for Kalimantan reported by Ferraz et al. [84] using field plots, airborne LiDAR, and multi-sensor data. Differences among studies can be explained by the more spatially extensive sampling provided by GEDI and the greater sensitivity to biomass variation achieved through combining spectral, polarization, topographic, and climatic predictors within an ensemble framework. The continuous, annual mapping at 1 km resolution achieved in this study provides spatial and temporal consistency that was lacking in earlier products, enabling more reliable detection of biomass changes and assessment of carbon dynamics across Borneo.
Validation against independent GEDI samples confirmed the robustness of our mapping framework, yielding an R2 of 0.92, RMSE of 32.84 Mg/ha, and rRMSE of 21.06%. The combination of a stacking ensemble strategy with over 120,000 training samples substantially improved the predictive skill of the final ensemble model. Compared with earlier studies, the present model achieved markedly lower error than Hayashi et al. [38] (RMSE = 62.8 Mg/ha) and higher explanatory power than the Indonesian portion of Berninger et al. [3] (R2 = 0.69–0.77). Moreover, RMSE values here are lower than those reported in comparable large-scale efforts in the Amazon rainforest [85], Chinese tropical mangroves [86], and African tropical forests [87], all of which exceeded 50 Mg/ha. This demonstrates that integrating dense, spaceborne LiDAR sampling with multi-sensor predictors within an automated ensemble learning framework can deliver consistently higher accuracy and generalization capability for AGB mapping at regional to continental scales.
Despite the high overall accuracy, several factors limit the robustness of the results. GEDI sampling is inherently uneven, and strict quality filtering leaves gaps in coverage, especially in mountainous and persistently cloudy areas. The 1 km L4B biomass grids also carry footprint-level uncertainties that are larger in very tall canopies and on steep slopes, introducing spatially variable label noise into model training. Temporal and processing inconsistencies among predictors further add uncertainty: MODIS, PALSAR, and climate products are generated on different acquisition schedules with varying quality controls, and missing SAR years had to be filled with the closest available mosaics, which can smooth genuine interannual variation and bias trend estimates. Remaining radiometric and geometric artifacts, particularly in rugged terrain, also affect predictor stability. In addition, scaling predictors at 25–500 m to match the 1 km biomass target blends plantations and old-growth forest within single pixels, leading the model to learn averaged relationships that compress extremes, causing overestimation in low-biomass areas and underestimation at the high end. A key assumption of our reconstruction is that the relationships between predictors and AGB remain stable when extrapolating the model trained on 2019–2023 GEDI data back to earlier years. To evaluate this assumption, we carried out a leave-one-year-out cross-validation using the 2019–2023 GEDI samples. The results showed stable performance across all temporal splits, with R2 values consistently around 0.90–0.92 and only minor variations in RMSE. These findings suggest that predictor–AGB relationships are temporally robust and support the reliability of our backcasting approach, though we recognize that localized disturbances or land-use changes may still introduce additional uncertainties.
Future work could aim to incorporate more diverse and better-matched datasets while improving the adaptability of the modeling framework. Our supplementary experiments demonstrate that targeted training on high-biomass samples (> 350 Mg/ha) reduces systematic underestimation, highlighting the potential of range-specific strategies. Nevertheless, saturation effects remain a limitation. The upcoming L-band and P-band SAR missions, such as NISAR [88] and BIOMASS [89], will provide stronger canopy penetration and greater sensitivity to forest structural variation, which could directly enhance prediction accuracy. Additional GEDI acquisitions over extended operational years, or targeted airborne LiDAR campaigns in mountainous and persistently cloudy regions, would help densify reference data and improve the spatial representativeness of training samples. Furthermore, applying transfer learning and domain adaptation techniques could further enable the framework to be extended to other tropical forest regions, supporting consistent biomass and carbon change monitoring at broader scales.

5. Conclusions

Using the AutoGluon ensemble learning framework with GEDI L4B biomass data and multi-source predictors from MODIS, PALSAR/PALSAR-2, SRTM, and climate records, we developed a high-accuracy model for mapping forest AGB in Borneo and tracked its changes from 2007 to 2023. The main conclusions are as follows: (1) The stacked ensemble model achieved high accuracy with R2 = 0.92, RMSE = 32.84 Mg/ha, and rRMSE = 21.06%, outperforming all baseline models. (2) SHAP values and the PFI method consistently identified LST as the most important predictor, with HV and Elevation also playing key roles in enhancing model performance. (3) The central mountainous regions of Borneo exhibited higher biomass, while coastal areas showed relatively lower values; from 2007 to 2023, the average forest AGB ranged from 180.52 to 214.09 Mg/ha, and total AGB varied between 13.05 and 14.10 Pg. (4) Results from Sen’s Slope and Mann–Kendall tests indicated that 31.31% of forest areas exhibited statistically significant trends, of which 68.76% showed significant increases in AGB. In conclusion, the long-term AGB distribution maps generated in this study provide valuable data for Borneo and offer practical references for the monitoring and conservation of tropical forest ecosystems. Given the near-global coverage of GEDI data, the proposed framework can be extended to broader forest studies and support forest monitoring and management initiatives such as REDD+.

Author Contributions

Conceptualization, A.L. and C.Y.; methodology, C.Y.; software, C.Y.; validation, C.Y.; formal analysis, A.L. and C.Y.; data curation, C.Y.; writing—original draft preparation, C.Y.; writing—review and editing, A.L. and Y.C.; visualization, C.Y.; supervision, A.L. and Y.C.; project administration, Y.C.; funding acquisition, A.L. and Y.C. All authors have read and agreed to the published version of the manuscript.

Funding

This research was funded by the National Natural Science Foundation of China (Grant No. 42306254 and 42301148), the Natural Science Foundation of Shandong Province, China (Grant No. ZR2024QD110 and ZR2023QD022), and the Young Taishan Scholars Program of Shandong Province (Grant No. tsqn202408142).

Data Availability Statement

The data can be sourced from the following providers: The MOD09A1 surface reflectance data, PALSAR-2/PALSAR yearly mosaic, SRTM data, MOD21A1D, TerraClimate, and MCD12Q1 are available through Google Earth Engine (https://developers.google.com/earth-engine/datasets/, accessed on 16 August 2025). The GEDI L4B product can be obtained from https://www.earthdata.nasa.gov/data/catalog/ornl-cloud-gedi-l4b-gridded-biomass-v2-1-2299-2.1 (accessed on 16 August 2025).

Acknowledgments

We would like to express our gratitude to the GEDI team for providing public data. We would also like to thank the teams behind the Google Earth Engine platform for providing important remote sensing datasets.

Conflicts of Interest

The authors declare no conflicts of interest.

References

  1. Su, Y.; Guo, Q.; Xue, B.; Hu, T.; Alvarez, O.; Tao, S.; Fang, J. Spatial distribution of forest aboveground biomass in China: Estimation through combination of spaceborne lidar, optical imagery, and forest inventory data. Remote Sens. Environ. 2016, 173, 187–199. [Google Scholar] [CrossRef]
  2. Senf, C.; Pflugmacher, D.; Zhiqiang, Y.; Sebald, J.; Knorn, J.; Neumann, M.; Hostert, P.; Seidl, R. Canopy mortality has doubled in Europe’s temperate forests over the last three decades. Nat. Commun. 2018, 9, 4978. [Google Scholar] [CrossRef]
  3. Berninger, A.; Lohberger, S.; Stängel, M.; Siegert, F. SAR-Based Estimation of Above-Ground Biomass and Its Changes in Tropical Forests of Kalimantan Using L- and C-Band. Remote Sens. 2018, 10, 831. [Google Scholar] [CrossRef]
  4. Yang, Z.; Li, W.; Chen, Q.; Wu, S.; Liu, S.; Gong, J. A scalable cyberinfrastructure and cloud computing platform for forest aboveground biomass estimation based on the Google Earth Engine. Int. J. Digit. Earth 2018, 12, 995–1012. [Google Scholar] [CrossRef]
  5. Zhang, R.; Zhou, X.; Ouyang, Z.; Avitabile, V.; Qi, J.; Chen, J.; Giannico, V. Estimating aboveground biomass in subtropical forests of China by integrating multisource remote sensing and ground data. Remote Sens. Environ. 2019, 232, 111341. [Google Scholar] [CrossRef]
  6. Araza, A.; Herold, M.; de Bruin, S.; Ciais, P.; Gibbs, D.A.; Harris, N.; Santoro, M.; Wigneron, J.-P.; Yang, H.; Málaga, N.; et al. Past decade above-ground biomass change comparisons from four multi-temporal global maps. Int. J. Appl. Earth Obs. Geoinf. 2023, 118, 103274. [Google Scholar] [CrossRef]
  7. Puliti, S.; Breidenbach, J.; Schumacher, J.; Hauglin, M.; Klingenberg, T.F.; Astrup, R. Above-ground biomass change estimation using national forest inventory data with Sentinel-2 and Landsat. Remote Sens. Environ. 2021, 265, 112644. [Google Scholar] [CrossRef]
  8. Kashongwe, H.B.; Roy, D.P.; Skole, D.L. Examination of the amount of GEDI data required to characterize central Africa tropical forest aboveground biomass at REDD+ project scale in Mai Ndombe province. Sci. Remote Sens. 2023, 7, 100091. [Google Scholar] [CrossRef]
  9. Chang, Z.; Hobeichi, S.; Wang, Y.-P.; Tang, X.; Abramowitz, G.; Chen, Y.; Cao, N.; Yu, M.; Huang, H.; Zhou, G.; et al. New Forest Aboveground Biomass Maps of China Integrating Multiple Datasets. Remote Sens. 2021, 13, 2892. [Google Scholar] [CrossRef]
  10. Zeng, W.; Fu, L.; Xu, M.; Wang, X.; Chen, Z.; Yao, S. Developing individual tree-based models for estimating aboveground biomass of five key coniferous species in China. J. For. Res. 2017, 29, 1251–1261. [Google Scholar] [CrossRef]
  11. Han, H.; Wan, R.; Li, B. Estimating Forest Aboveground Biomass Using Gaofen-1 Images, Sentinel-1 Images, and Machine Learning Algorithms: A Case Study of the Dabie Mountain Region, China. Remote Sens. 2021, 14, 176. [Google Scholar] [CrossRef]
  12. Chen, Q.; McRoberts, R.E.; Wang, C.; Radtke, P.J. Forest aboveground biomass mapping and estimation across multiple spatial scales using model-based inference. Remote Sens. Environ. 2016, 184, 350–360. [Google Scholar] [CrossRef]
  13. Li, H.; Hiroshima, T.; Li, X.; Hayashi, M.; Kato, T. High-resolution mapping of forest structure and carbon stock using multi-source remote sensing data in Japan. Remote Sens. Environ. 2024, 312, 114322. [Google Scholar] [CrossRef]
  14. David, R.M.; Rosser, N.J.; Donoghue, D.N.M. Improving above ground biomass estimates of Southern Africa dryland forests by combining Sentinel-1 SAR and Sentinel-2 multispectral imagery. Remote Sens. Environ. 2022, 282, 113232. [Google Scholar] [CrossRef]
  15. Tang, Z.; Xia, X.; Huang, Y.; Lu, Y.; Guo, Z. Estimation of National Forest Aboveground Biomass from Multi-Source Remotely Sensed Dataset with Machine Learning Algorithms in China. Remote Sens. 2022, 14, 5487. [Google Scholar] [CrossRef]
  16. Wang, Y.; Zhang, X.; Guo, Z. Estimation of tree height and aboveground biomass of coniferous forests in North China using stereo ZY-3, multispectral Sentinel-2, and DEM data. Ecol. Indic. 2021, 126, 107645. [Google Scholar] [CrossRef]
  17. Fu, H.; Zhao, H.; Liu, G.; Zhang, Y.; Huangfu, X.; Jiang, J. Forest aboveground carbon storage estimation and uncertainty analysis by coupled multi-source remote sensing data in Liaoning Province. Ecol. Indic. 2025, 176, 113729. [Google Scholar] [CrossRef]
  18. Qi, S.; Zhang, H.; Zhang, M. Net Primary Productivity Estimation of Terrestrial Ecosystems in China with Regard to Saturation Effects and Its Spatiotemporal Evolutionary Impact Factors. Remote Sens. 2023, 15, 2871. [Google Scholar] [CrossRef]
  19. Zhen, Z.; Chen, S.; Yin, T.; Chavanon, E.; Lauret, N.; Guilleux, J.; Henke, M.; Qin, W.; Cao, L.; Li, J.; et al. Using the Negative Soil Adjustment Factor of Soil Adjusted Vegetation Index (SAVI) to Resist Saturation Effects and Estimate Leaf Area Index (LAI) in Dense Vegetation Areas. Sensors 2021, 21, 2115. [Google Scholar] [CrossRef]
  20. Deng, S.; Katoh, M.; Guan, Q.; Yin, N.; Li, M. Estimating Forest Aboveground Biomass by Combining ALOS PALSAR and WorldView-2 Data: A Case Study at Purple Mountain National Park, Nanjing, China. Remote Sens. 2014, 6, 7878–7910. [Google Scholar] [CrossRef]
  21. Nian, Y.; Chen, S.; Chen, J.; Che, M.; Zhang, W.; Ali, J.S.; Zhang, H.; Wang, X.; Liao, B.; Wang, X. Mapping Subalpine Forest Aboveground Biomass in Qilian Mountain National Park Using UAV-LiDAR, GEDI, and Multisource Satellite Data. IEEE J. Sel. Top. Appl. Earth Obs. Remote Sens. 2025, 18, 12407–12420. [Google Scholar] [CrossRef]
  22. Liu, A.; Chen, Y.; Cheng, X. Evaluating ICESat-2 and GEDI with Integrated Landsat-8 and PALSAR-2 for Mapping Tropical Forest Canopy Height. Remote Sens. 2024, 16, 3798. [Google Scholar] [CrossRef]
  23. Yang, Q.; Niu, C.; Liu, X.; Feng, Y.; Ma, Q.; Wang, X.; Tang, H.; Guo, Q. Mapping high-resolution forest aboveground biomass of China using multisource remote sensing data. GISci. Remote Sens. 2023, 60, 2203303. [Google Scholar] [CrossRef]
  24. Coops, N.C.; Irwin, L.A.K.; Seely, H.S.; Hardy, S.J. Advances in Laser Scanning to Assess Carbon in Forests: From Ground-Based to Space-Based Sensors. Curr. For. Rep. 2025, 11, 11. [Google Scholar] [CrossRef]
  25. Liu, M.; Popescu, S. Estimation of biomass burning emissions by integrating ICESat-2, Landsat 8, and Sentinel-1 data. Remote Sens. Environ. 2022, 280, 113172. [Google Scholar] [CrossRef]
  26. Wei, C.; Qin, H.; Ji, J.; Wang, W.; Hua, Y.; Yao, Y.; Yu, W.; Hou, H.; Zhou, W. Estimating aboveground biomass of urban trees based on ICESat-2 LiDAR and Zhuhai-1 hyperspectral data. Phys. Chem. Earth Parts A/B/C 2024, 135, 103605. [Google Scholar] [CrossRef]
  27. Chen, L.; Ren, C.; Zhang, B.; Wang, Z.; Man, W.; Liu, M. Improved Object-Based Mapping of Aboveground Biomass Using Geographic Stratification with GEDI Data and Multi-Sensor Imagery. Remote Sens. 2023, 15, 2625. [Google Scholar] [CrossRef]
  28. Liang, M.; Duncanson, L.; Silva, J.A.; Sedano, F. Quantifying aboveground biomass dynamics from charcoal degradation in Mozambique using GEDI Lidar and Landsat. Remote Sens. Environ. 2023, 284, 113367. [Google Scholar] [CrossRef]
  29. Zhu, X.; Nie, S.; Wang, C.; Xi, X.; Lao, J.; Li, D. Consistency analysis of forest height retrievals between GEDI and ICESat-2. Remote Sens. Environ. 2022, 281, 113244. [Google Scholar] [CrossRef]
  30. Liu, A.; Cheng, X.; Chen, Z. Performance evaluation of GEDI and ICESat-2 laser altimeter data for terrain and canopy height retrievals. Remote Sens. Environ. 2021, 264, 112571. [Google Scholar] [CrossRef]
  31. Dubayah, R.; Blair, J.B.; Goetz, S.; Fatoyinbo, L.; Hansen, M.; Healey, S.; Hofton, M.; Hurtt, G.; Kellner, J.; Luthcke, S.; et al. The Global Ecosystem Dynamics Investigation: High-resolution laser ranging of the Earth’s forests and topography. Sci. Remote Sens. 2020, 1, 100002. [Google Scholar] [CrossRef]
  32. Ni-Meister, W.; Rojas, A.; Lee, S. Direct use of large-footprint lidar waveforms to estimate aboveground biomass. Remote Sens. Environ. 2022, 280, 113147. [Google Scholar] [CrossRef]
  33. May, P.B.; Schlund, M.; Armston, J.; Kotowska, M.M.; Brambach, F.; Wenzel, A.; Erasmi, S. Mapping aboveground biomass in Indonesian lowland forests using GEDI and hierarchical models. Remote Sens. Environ. 2024, 313, 114384. [Google Scholar] [CrossRef]
  34. Shendryk, Y. Fusing GEDI with earth observation data for large area aboveground biomass mapping. Int. J. Appl. Earth Obs. Geoinf. 2022, 115, 103108. [Google Scholar] [CrossRef]
  35. Khan, M.N.; Tan, Y.; Gul, A.A.; Lodhi, M.K.; Wang, J. A regional-level spatiotemporal perspective of land use and land cover change impact on forest aboveground biomass in three gorges reservoir region, China. Geocarto Int. 2024, 39, 2397468. [Google Scholar] [CrossRef]
  36. Zhang, Y.; Zou, Y.; Wang, Y. Remote Sensing of Forest Above-Ground Biomass Dynamics: A Review. Forests 2025, 16, 821. [Google Scholar] [CrossRef]
  37. Santoro, M.; Cartus, O. ESA Biomass Climate Change Initiative (Biomass_cci): Global datasets of forest above-ground biomass for the years 2007, 2010, 2015, 2016, 2017, 2018, 2019, 2020, 2021 and 2022, v6.0. NERC EDS Cent. Environ. Data Anal. 2025. [Google Scholar] [CrossRef]
  38. Hayashi, M.; Motohka, T.; Sawada, Y. Aboveground Biomass Mapping Using ALOS-2/PALSAR-2 Time-Series Images for Borneo’s Forest. IEEE J. Sel. Top. Appl. Earth Obs. Remote Sens. 2019, 12, 5167–5177. [Google Scholar] [CrossRef]
  39. Shiraishi, T.; Hirata, R.; Hayashi, M.; Hirano, T. Carbon dioxide emissions through land use change, fire, and oxidative peat decomposition in Borneo. Sci. Rep. 2023, 13, 13067. [Google Scholar] [CrossRef]
  40. Sa’adi, Z.; Samikan Mazilamani, L.; Sa’adi, N.; Basri, M.H.A.; Alias, N.E.; Yusop, Z.; Zainon Noor, Z.; Kemarau, R.A.; Shiru, M.S.; Masood, A. The likelihood of a significant trend based on a family of Mann-Kendall tests for extreme rainfall in Borneo. Phys. Chem. Earth Parts A/B/C 2025, 139, 103959. [Google Scholar] [CrossRef]
  41. Hiyama, T.; Fujinami, H.; Kanamori, H.; Kumagai, T.o.; Takahashi, A.; Hara, M. Impact of Tropical Deforestation and Forest Degradation on Precipitation over Borneo Island. J. Hydrometeorol. 2017, 18, 2907–2922. [Google Scholar] [CrossRef]
  42. Gaveau, D.L.A.; Locatelli, B.; Salim, M.A.; Yaen, H.; Pacheco, P.; Sheil, D. Rise and fall of forest loss and industrial plantations in Borneo (2000–2017). Conserv. Lett. 2018, 12, e12622. [Google Scholar] [CrossRef]
  43. Farr, T.G.; Rosen, P.A.; Caro, E.; Crippen, R.; Duren, R.; Hensley, S.; Kobrick, M.; Paller, M.; Rodriguez, E.; Roth, L.; et al. The Shuttle Radar Topography Mission. Rev. Geophys. 2007, 45, RG2004. [Google Scholar] [CrossRef]
  44. Dubayah, R.O.; Armston, J.; Healey, S.P.; Yang, Z.; Patterson, P.L.; Saarela, S.; Stahl, G.; Duncanson, L.; Kellner, J.R.; Bruening, J.; et al. GEDI L4B Gridded Aboveground Biomass Density, Version 2.1; The Oak Ridge National Laboratory (ORNL) Distributed Active Archive Center (DAAC) (ORNL_DAAC): Oak Ridge, TN, USA, 2023. [CrossRef]
  45. Friedl, M.; Sulla-Menashe, D. MODIS/Terra+ Aqua Land Cover Type Yearly L3 Global 500 m SIN grid V061; Land Processes Distributed Active Archive Center (LP DAAC): Sioux Falls, SD, USA, 2022; Volume 10. [Google Scholar] [CrossRef]
  46. Dubayah, R.; Armston, J.; Healey, S.P.; Bruening, J.M.; Patterson, P.L.; Kellner, J.R.; Duncanson, L.; Saarela, S.; Ståhl, G.; Yang, Z.; et al. GEDI launches a new era of biomass inference from space. Environ. Res. Lett. 2022, 17, 095001. [Google Scholar] [CrossRef]
  47. Vermote, E. MODIS/Terra Surface Reflectance 8-Day L3 Global 500m SIN Grid V061; Land Processes Distributed Active Archive Center (LP DAAC): Sioux Falls, SD, USA, 2021. [Google Scholar] [CrossRef]
  48. Zhang, J.; Zhou, T. Coupling Coordination Degree between Ecological Environment Quality and Urban Development in Chengdu–Chongqing Economic Circle Based on the Google Earth Engine Platform. Sustainability 2023, 15, 4389. [Google Scholar] [CrossRef]
  49. Shimada, M.; Itoh, T.; Motooka, T.; Watanabe, M.; Shiraishi, T.; Thapa, R.; Lucas, R. New global forest/non-forest maps from ALOS PALSAR data (2007–2010). Remote Sens. Environ. 2014, 155, 13–31. [Google Scholar] [CrossRef]
  50. Shen, W.; Li, M.; Huang, C.; Wei, A. Quantifying Live Aboveground Biomass and Forest Disturbance of Mountainous Natural and Plantation Forests in Northern Guangdong, China, Based on Multi-Temporal Landsat, PALSAR and Field Plot Data. Remote Sens. 2016, 8, 595. [Google Scholar] [CrossRef]
  51. Hulley, G.; Hook, S. MODIS/Terra Land Surface Temperature/3-Band Emissivity Daily L3 Global 1 km SIN Grid Day V061; Land Processes Distributed Active Archive Center (LP DAAC): Sioux Falls, SD, USA, 2021. [Google Scholar] [CrossRef]
  52. Abatzoglou, J.T.; Dobrowski, S.Z.; Parks, S.A.; Hegewisch, K.C. TerraClimate, a high-resolution global dataset of monthly climate and climatic water balance from 1958-2015. Sci. Data 2018, 5, 170191. [Google Scholar] [CrossRef] [PubMed]
  53. Das, B.; Patnaik, S.K.; Bordoloi, R.; Paul, A.; Tripathi, O.P. Prediction of forest aboveground biomass using an integrated approach of space-based parameters, and forest inventory data. Geol. Ecol. Landsc. 2022, 8, 381–393. [Google Scholar] [CrossRef]
  54. Rouse, J.W.H.; Haas, R.H.; Schell, J.A.; Deering, D.W. Monitoring vegetation systems in the Great Plains with ERTS. In Proceedings of the Third NASA Earth Resources Technology Satellite Symposium, Washington, DC, USA, 10–14 December 1973; Volume 351, pp. 309–317. [Google Scholar]
  55. Qi, J.; Chehbouni, A.; Huete, A.R.; Kerr, Y.H.; Sorooshian, S. A modified soil adjusted vegetation index. Remote Sens. Environ. 1994, 48, 119–126. [Google Scholar] [CrossRef]
  56. Jordan, C.F. Derivation of Leaf-Area Index from Quality of Light on the Forest Floor. Ecology 1969, 50, 663–666. [Google Scholar] [CrossRef]
  57. Tucker, C.J. Red and photographic infrared linear combinations for monitoring vegetation. Remote Sens. Environ. 1979, 8, 127–150. [Google Scholar] [CrossRef]
  58. Kaufman, Y.J.; Tanre, D. Atmospherically resistant vegetation index (ARVI) for EOS-MODIS. IEEE Trans. Geosci. Remote Sens. 1992, 30, 261–270. [Google Scholar] [CrossRef]
  59. Huete, A.; Didan, K.; Miura, T.; Rodriguez, E.P.; Gao, X.; Ferreira, L.G. Overview of the radiometric and biophysical performance of the MODIS vegetation indices. Remote Sens. Environ. 2002, 83, 195–213. [Google Scholar] [CrossRef]
  60. Crippen, R.E. Calculating the vegetation index faster. Remote Sens. Environ. 1990, 34, 71–73. [Google Scholar] [CrossRef]
  61. Wilson, E.H.; Sader, S.A. Detection of forest harvest type using multiple dates of Landsat TM imagery. Remote Sens. Environ. 2002, 80, 385–396. [Google Scholar] [CrossRef]
  62. Camps-Valls, G.; Campos-Taberner, M.; Moreno-Martínez, Á.; Walther, S.; Duveiller, G.; Cescatti, A.; Mahecha, M.D.; Muñoz-Marí, J.; García-Haro, F.J.; Guanter, L.; et al. A unified vegetation index for quantifying the terrestrial biosphere. Sci. Adv. 2021, 7, eabc7447. [Google Scholar] [CrossRef]
  63. Lobser, S.E.; Cohen, W.B. MODIS tasselled cap: Land cover characteristics expressed through transformed MODIS data. Int. J. Remote Sens. 2007, 28, 5079–5101. [Google Scholar] [CrossRef]
  64. Xu, Y.; Zhang, D.; Lin, J.; Peng, Q.; Lei, X.; Jin, T.; Wang, J.; Yuan, R. Prediction of phytoplankton biomass and identification of key influencing factors using interpretable machine learning models. Ecol. Indic. 2024, 158, 111320. [Google Scholar] [CrossRef]
  65. Khan, A.; Ali, A.; Khan, J.; Ullah, F.; Faheem, M. Using Permutation-Based Feature Importance for Improved Machine Learning Model Performance at Reduced Costs. IEEE Access 2025, 13, 36421–36435. [Google Scholar] [CrossRef]
  66. Chen, Y.; Cheng, X.; Liu, A.; Chen, Q.; Wang, C. Tracking lake drainage events and drained lake basin vegetation dynamics across the Arctic. Nat. Commun. 2023, 14, 7359. [Google Scholar] [CrossRef]
  67. Erickson, N.; Mueller, J.; Shirkov, A.; Zhang, H.; Larroy, P.; Li, M.; Smola, A. Autogluon-tabular: Robust and accurate automl for structured data. arXiv 2020, arXiv:2003.06505. [Google Scholar]
  68. Liu, A.; Chen, Y.; Cheng, X. Improving Tropical Forest Canopy Height Mapping by Fusion of Sentinel-1/2 and Bias-Corrected ICESat-2–GEDI Data. Remote Sens. 2025, 17, 1968. [Google Scholar] [CrossRef]
  69. César de Sá, N.; Baratchi, M.; Buitenhuis, V.; Cornelissen, P.; van Bodegom, P.M. AutoML for estimating grass height from ETM+/OLI data from field measurements at a nature reserve. GIScience Remote Sens. 2022, 59, 2164–2183. [Google Scholar] [CrossRef]
  70. Fukunaga, K.; Narendra, P.M. A branch and bound algorithm for computing k-nearest neighbors. IEEE Trans. Comput. 1975, 100, 750–753. [Google Scholar] [CrossRef]
  71. Breiman, L. Random Forests. Mach. Learn. 2001, 45, 5–32. [Google Scholar] [CrossRef]
  72. Abdi, H.; Valentin, D.; Edelman, B. Neural Networks; SAGE: Thousand Oaks, CA, USA, 1999. [Google Scholar]
  73. Geurts, P.; Ernst, D.; Wehenkel, L. Extremely randomized trees. Mach. Learn. 2006, 63, 3–42. [Google Scholar] [CrossRef]
  74. Chen, T.; Guestrin, C. XGBoost: A Scalable Tree Boosting System. In Proceedings of the 22nd ACM SIGKDD International Conference on Knowledge Discovery and Data Mining, San Francisco, CA, USA, 13–17 August 2016; pp. 785–794. [Google Scholar]
  75. Ke, G.; Meng, Q.; Finley, T.; Wang, T.; Chen, W.; Ma, W.; Ye, Q.; Liu, T.-Y. Lightgbm: A highly efficient gradient boosting decision tree. In Proceedings of the Advances in Neural Information Processing Systems 30 (NIPS 2017), Long Beach, CA, USA, 4–9 December 2017; Volume 30. [Google Scholar]
  76. Prokhorenkova, L.; Gusev, G.; Vorobev, A.; Dorogush, A.V.; Gulin, A. CatBoost: Unbiased boosting with categorical features. In Proceedings of the Advances in Neural Information Processing Systems 31 (NeurIPS 2018), Montreal, QC, Canada, 3–8 December 2018; Volume 31. [Google Scholar]
  77. Santoro, M.; Cartus, O.; Carvalhais, N.; Rozendaal, D.M.A.; Avitabile, V.; Araza, A.; de Bruin, S.; Herold, M.; Quegan, S.; Rodríguez-Veiga, P.; et al. The global forest above-ground biomass pool for 2010 estimated from high-resolution satellite observations. Earth Syst. Sci. Data 2021, 13, 3927–3950. [Google Scholar] [CrossRef]
  78. Yang, D.; Yang, Z.; Wen, Q.; Ma, L.; Guo, J.; Chen, A.; Zhang, M.; Xing, X.; Yuan, Y.; Lan, X.; et al. Dynamic monitoring of aboveground biomass in inner Mongolia grasslands over the past 23 Years using GEE and analysis of its driving forces. J. Env. Manag. 2024, 354, 120415. [Google Scholar] [CrossRef]
  79. Yue, S.; Pilon, P.; Cavadias, G. Power of the Mann–Kendall and Spearman’s rho tests for detecting monotonic trends in hydrological series. J. Hydrol. 2002, 259, 254–271. [Google Scholar] [CrossRef]
  80. Chen, Y.; Liu, A.; Cheng, X. Landsat-Based Monitoring of Landscape Dynamics in Arctic Permafrost Region. J. Remote Sens. 2022, 2022, 9765087. [Google Scholar] [CrossRef]
  81. Liu, A.; Chen, Y.; Cheng, X. Monitoring Thermokarst Lake Drainage Dynamics in Northeast Siberian Coastal Tundra. Remote Sens. 2023, 15, 4396. [Google Scholar] [CrossRef]
  82. Liu, A.; Chen, Y.; Cheng, X. Effects of Thermokarst Lake Drainage on Localized Vegetation Greening in the Yamal–Gydan Tundra Ecoregion. Remote Sens. 2023, 15, 4561. [Google Scholar] [CrossRef]
  83. Wong, C.J.; Chai, L.T.; James, D.; Besar, N.A.; Kamlun, K.U.; Phua, M.-H. Assessment of anthropogenic disturbances on mangrove aboveground biomass in Malaysian Borneo using airborne LiDAR data. Egypt. J. Remote Sens. Space Sci. 2024, 27, 547–554. [Google Scholar] [CrossRef]
  84. Ferraz, A.; Saatchi, S.; Xu, L.; Hagen, S.; Chave, J.; Yu, Y.; Meyer, V.; Garcia, M.; Silva, C.; Roswintiart, O.; et al. Carbon storage potential in degraded forests of Kalimantan, Indonesia. Environ. Res. Lett. 2018, 13, 095001. [Google Scholar] [CrossRef]
  85. Arévalo, P.; Baccini, A.; Woodcock, C.E.; Olofsson, P.; Walker, W.S. Continuous mapping of aboveground biomass using Landsat time series. Remote Sens. Environ. 2023, 288, 113483. [Google Scholar] [CrossRef]
  86. Wang, D.; Wan, B.; Liu, J.; Su, Y.; Guo, Q.; Qiu, P.; Wu, X. Estimating aboveground biomass of the mangrove forests on northeast Hainan Island in China using an upscaling method from field plots, UAV-LiDAR data and Sentinel-2 imagery. Int. J. Appl. Earth Obs. Geoinf. 2020, 85, 101986. [Google Scholar] [CrossRef]
  87. Liu, X.; Neigh, C.S.R.; Pardini, M.; Forkel, M. Estimating forest height and above-ground biomass in tropical forests using P-band TomoSAR and GEDI observations. Int. J. Remote Sens. 2024, 45, 3129–3148. [Google Scholar] [CrossRef]
  88. Ferdowsi, B.; Bhanu, M.; Rao, C.; Stieglitz, A.; Loganathan, D.; Schubert, C.; Adams, T.; CH, P.R. NASA-ISRO Synthetic Aperture Radar (NISAR): The Last Steps to Launch. In Proceedings of the 2024 IEEE Aerospace Conference, Big Sky, MT, USA, 2–9 March 2024; pp. 1–10. [Google Scholar]
  89. Quegan, S.; Le Toan, T.; Chave, J.; Dall, J.; Exbrayat, J.-F.; Minh, D.H.T.; Lomas, M.; D’Alessandro, M.M.; Paillou, P.; Papathanassiou, K.; et al. The European Space Agency BIOMASS mission: Measuring forest above-ground biomass from space. Remote Sens. Environ. 2019, 227, 44–60. [Google Scholar] [CrossRef]
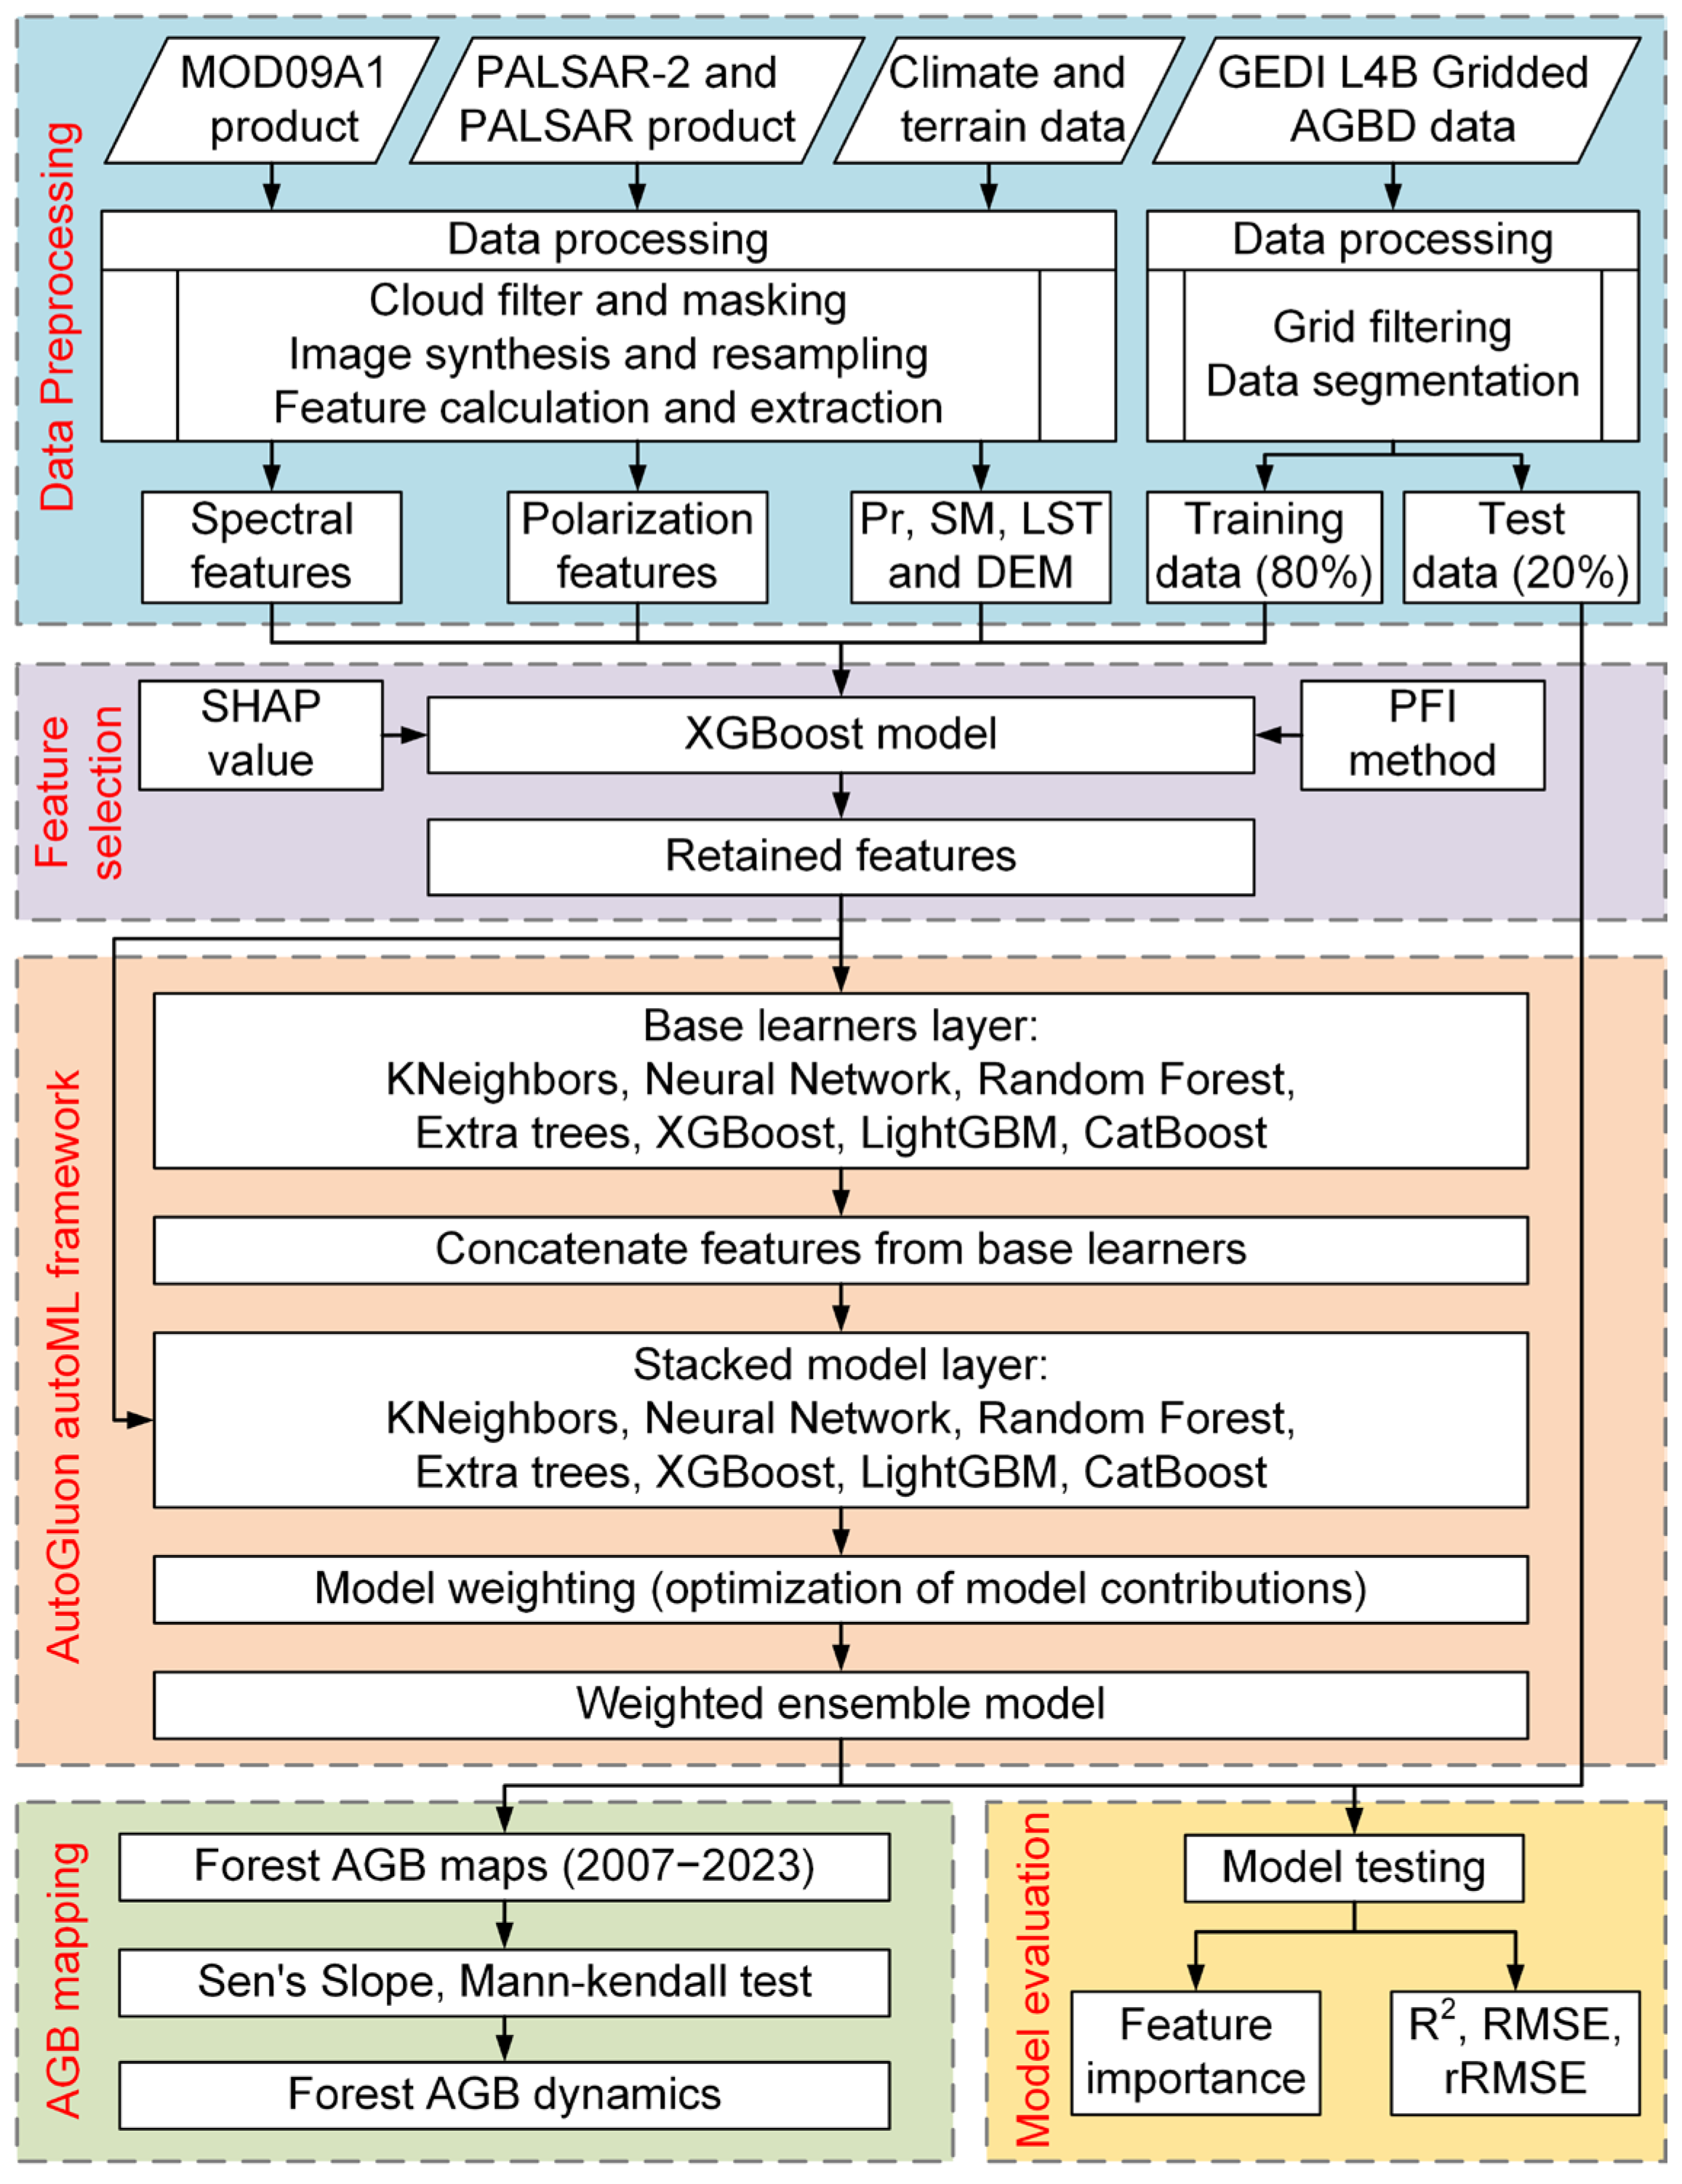
Figure 2. The proposed tropical forest AGB estimation workflow using AutoGluon and multi-source remote sensing data.
Remotesensing 17 03231 g002
Figure 3. Accuracy comparison of all AutoGluon-based models for forest AGB inversion using GEDI L4B test data. (a) k-nearest neighbors, (b) neural networks, (c) CatBoost, (d) extremely randomized trees, (e) random forests, (f) LightGBM, (g) XGBoost, (h) the stacking ensemble model.
Remotesensing 17 03231 g003
Figure 4. Feature importance rankings of variables in the AutoGluon-based forest AGB inversion model, assessed using (a) SHAP values and (b) PFI method.
Remotesensing 17 03231 g004
Figure 5. SHAP dependence plot of feature variables (a) LST, (b) HV, (c) Elevation, and (d) Green. The red dashed lines represent zero.
Remotesensing 17 03231 g005
Figure 6. Residual distribution of the AGB inversion model.
Remotesensing 17 03231 g006
Figure 7. (a) Spatial distribution of model residuals based on grid statistics. The value of each grid comes from the mean of all residuals within it. (b) Elevation from SRTM product.
Remotesensing 17 03231 g007
Figure 8. Residual distributions of the stacking ensemble model-based forest AGB predictions across different AGB intervals. Boxes represent the interquartile range (IQR; 25–75%), whiskers extend to 1.5 × IQR, the horizontal lines in the box indicate the median, and points indicate the mean. Sample size per AGB interval is labeled above each box. The red dashed line represents zero.
Remotesensing 17 03231 g008
Figure 9. Residual distributions of models trained on specific biomass ranges compared with the full-range model. (a) For low-biomass samples (AGB ≤ 50 Mg/ha), the range-specific model substantially reduces positive bias compared with the full-range model. (b) For high-biomass samples (AGB > 350 Mg/ha), the range-specific model alleviates systematic underestimation. Statistics of mean, median, and standard deviation of residuals are shown for each model.
Remotesensing 17 03231 g009
Figure 10. Scatter plot of residuals versus (a) Elevation, (b) Slope, (c) LST, and (d) SM.
Remotesensing 17 03231 g010
Figure 11. Scatterplot comparison with CCI products [37] from (a) 2007, (c) 2015, (d) 2017, (e) 2019, (f) 2022, and Santoro et al. product [77] from (b) 2010.
Remotesensing 17 03231 g011
Figure 12. The time-series maps of AGB distribution in Borneo from 2007 to 2023 showing consistently high biomass in central mountainous regions and markedly lower values in coastal lowlands.
Remotesensing 17 03231 g012
Figure 13. Temporal changes in forest indicators in Borneo from 2007 to 2023, including (a) average AGB of evergreen broadleaf forests (EBF), woody savannas (WS), and all forests combined; (b) annual distribution of AGB across all forest pixels, showing a bimodal pattern driven by interior–coastal gradients. In the boxplots, the white box represents the interquartile range and the black dot denotes the median. (c) forest area dynamics; and (d) total AGB of EBF, WS, and all forests combined.
Remotesensing 17 03231 g013
Figure 14. Spatial trends of forest AGB in Borneo (2007–2023). (a) Sen’s slope values indicating the direction and magnitude of change. (b) Pixels with statistically significant trends (p < 0.05) from the Mann–Kendall test, highlighting interior regions with biomass gains and coastal regions with biomass losses.
Remotesensing 17 03231 g014
Table 1. Calculate multiple vegetation-related indices using MODIS original bands.
Vegetation IndicesExpressionReference
NDVI ( N I R R e d ) / ( N I R + R e d ) [54]
MSAVI 2 N I R + 1 ( 2 N I R + 1 ) 2 8 ( N I R R e d ) 2 [55]
RVI N I R / R e d [56]
DVI N I R R e d [57]
ARVI N I R 2 × R e d + B l u e N I R + 2 × R e d + B l u e [58]
EVI 2.5 × ( N I R R e d ) N I R + 6 × R e d 7.5 × B l u e + 1 [59]
IPVI N I R / ( N I R + R e d ) [60]
NDMI ( N I R S W I R 2 ) / ( N I R + S W I R 2 ) [61]
kNDVI t a n h ( N D V I 2 ) [62]
TCBTCB, TCG, and TCW are calculated by multiplying MODIS band pixel values with TC coefficients. See the coefficients in reference.[63]
TCG
TCW
Disclaimer/Publisher’s Note: The statements, opinions and data contained in all publications are solely those of the individual author(s) and contributor(s) and not of MDPI and/or the editor(s). MDPI and/or the editor(s) disclaim responsibility for any injury to people or property resulting from any ideas, methods, instructions or products referred to in the content.