Article

Precipitation Data Accuracy and Extreme Rainfall Detection for Flood Risk Analysis in the Akçay Sub-Basin

1
Department of Civil and Environmental Engineering, University of Virginia, Charlottesville, VA 22904, USA
2
Department of Civil Engineering, Graduate School of Natural and Applied Sciences, Suleyman Demirel University, Isparta 32260, Turkey
*
Author to whom correspondence should be addressed.
Remote Sens. 2025, 17(18), 3199; https://doi.org/10.3390/rs17183199
Submission received: 15 May 2025 / Revised: 18 August 2025 / Accepted: 15 September 2025 / Published: 16 September 2025
(This article belongs to the Section Engineering Remote Sensing)

Abstract

Highlights

What are the main findings?
  • GPM-IMERG outperforms CHIRPS in the Türkiye’s Akçay Sub-Basin, with higher accuracy at the monthly scale (Pearson = 0.943; RMSE = 50.81 mm) but lower performance at the daily scale (Pearson = 0.592; RMSE = 12.45 mm).
  • Extreme rainfall analysis indicated that the Beta distribution best fits monthly precipitation, while the Weibull distribution fits daily precipitation, improving threshold-based flood risk assessments.
What is the implication of the main finding?
  • GPM-IMERG is suitable for long-term precipitation monitoring and monthly extreme event detection in data-scarce basins, supporting hydrological modeling and flood risk management.

Abstract

This study evaluates GPM-IMERG (Global Precipitation Measurement-Integrated Multi-satellite Retrievals) and CHIRPS (Climate Hazards Group InfraRed Precipitation with Stations) satellite precipitation data in Türkiye’s Akçay Sub-Basin by comparing them with rain gauge observations from the Finike and Elmali meteorological stations. Statistical metrics including Pearson’s correlation coefficient, Nash-Sutcliffe Efficiency (NSE), and Root Mean Square Error (RMSE) were used to assess performance. The study also examines distributional fit via the Kolmogorov–Smirnov (K-S) test and evaluates extreme rainfall detection accuracy using metrics like Probability of Detection (POD), False Alarm Ratio (FAR), and Critical Success Index (CSI). Results indicate that GPM-IMERG agrees well with rain gauge observations at the monthly scale (Pearson = 0.943; RMSE = 50.81 mm), but shows reduced accuracy at the daily scale (Pearson = 0.592; RMSE = 12.45 mm). The K-S test showed that the Beta distribution best fits monthly rainfall (threshold = 253.39 mm), while the Weibull distribution suits daily rainfall (threshold = 5.34 mm). GPM-IMERG achieved a POD of 0.778 and FAR of 0.222 for monthly extremes, while daily performance was lower (POD = 0.478; FAR = 0.388). These findings highlight the value of comparing satellite and ground-based data to improve flood risk assessment and enhance climate resilience in data-scarce basins.

1. Introduction

Climate change has emerged as one of the most critical challenges of the 21st century, profoundly impacting various aspects of the environment, especially precipitation patterns and water resources, with recent studies highlighting an intensification of extreme weather events and variability in hydrological cycles [1,2,3]. Rising global temperatures have led to significant alterations in the hydrological cycle, causing an increase in extreme weather events such as intense rainfall, floods, and droughts [4]. This intensification of precipitation not only poses risks to ecosystems and biodiversity but also endangers human lives, infrastructure, and economies [5,6]. As the frequency and severity of extreme rainfall events continue to rise, understanding and accurately assessing rainfall patterns is essential for effective water resource management, disaster prevention, and climate resilience [7,8,9,10,11].
In regions where meteorological stations are sparse or non-existent, specifically in remote and mountainous areas, the scarcity of ground-based rainfall data presents a major obstacle for climate-related studies [12]. In such areas, remotely sensed precipitation data obtained from satellite-based sources provide a valuable alternative, enabling the monitoring of rainfall across vast and inaccessible terrains [13,14]. Satellite-derived precipitation datasets, such as CHIRPS and GPM-IMERG are widely used in hydrological and agricultural research due to their high spatial and temporal resolution [15]. These datasets are invaluable for their ability to provide continuous, consistent, and global coverage, making them an essential tool for studying precipitation patterns in regions with limited ground data availability [9,16,17,18,19].
The integration and comparison of satellite rainfall data with ground-based meteorological measurements are crucial for ensuring the accuracy and reliability of remote sensing datasets [11,20,21,22]. Numerous studies have demonstrated the importance of correlating satellite-derived precipitation with in situ data to assess the strengths and limitations of satellite observations in capturing regional rainfall characteristics [23,24,25,26]. Correlation analyses, which employ metrics such as the correlation coefficient, Nash-Sutcliffe Efficiency (NSE), and Root Mean Square Error (RMSE), help quantify the alignment between satellite data and ground observations, thereby enhancing the validity of satellite products in various applications [21,25,27,28]. Such evaluations not only improve the accuracy of satellite data but also strengthen their credibility for use in predictive modeling and risk assessment [18].
Moreover, statistical tests like the Kolmogorov–Smirnov (K-S) test play a valuable role in understanding the distributional characteristics of rainfall data, particularly for detecting extreme rainfall events [29]. By analyzing how well the data fits certain probability distributions (e.g., Beta, Weibull, and GEV distributions), K-S tests enable more accurate modeling of extreme events, which are vital for flood risk prediction and effective water management [30,31].
Additionally, performance metrics specific to extreme rainfall event detection, such as POD, FAR, and the CSI, provide insights into the accuracy of satellite data in identifying these events [32]. POD represents the proportion of actual extreme rainfall events correctly identified by the model, while FAR indicates the rate of incorrect alerts for extreme events [33,34]. The Critical Success Index (CSI) further combines true detections, missed events, and false alarms to give an overall performance measure of the dataset [35,36]. These metrics, along with accuracy (ACC) measures, are essential for assessing the practical reliability of satellite precipitation data for timely and effective flood risk assessment [34,37].
This study aims to compare meteorological station rain gauge observations with CHIRPS and GPM-IMERG satellite datasets in Türkiye’s Akçay Sub-Basin, evaluating their correlation, distributional fit using the K-S test, and performance in extreme rainfall event detection through metrics like POD, FAR, and CSI. By comparing ground-based and satellite observations, this research provides insights into the potential of satellite-derived precipitation data in supporting flood risk analysis and climate resilience strategies, particularly in regions with limited meteorological infrastructure [10,18,19].

2. Materials and Methods

2.1. Study Area and Datasets

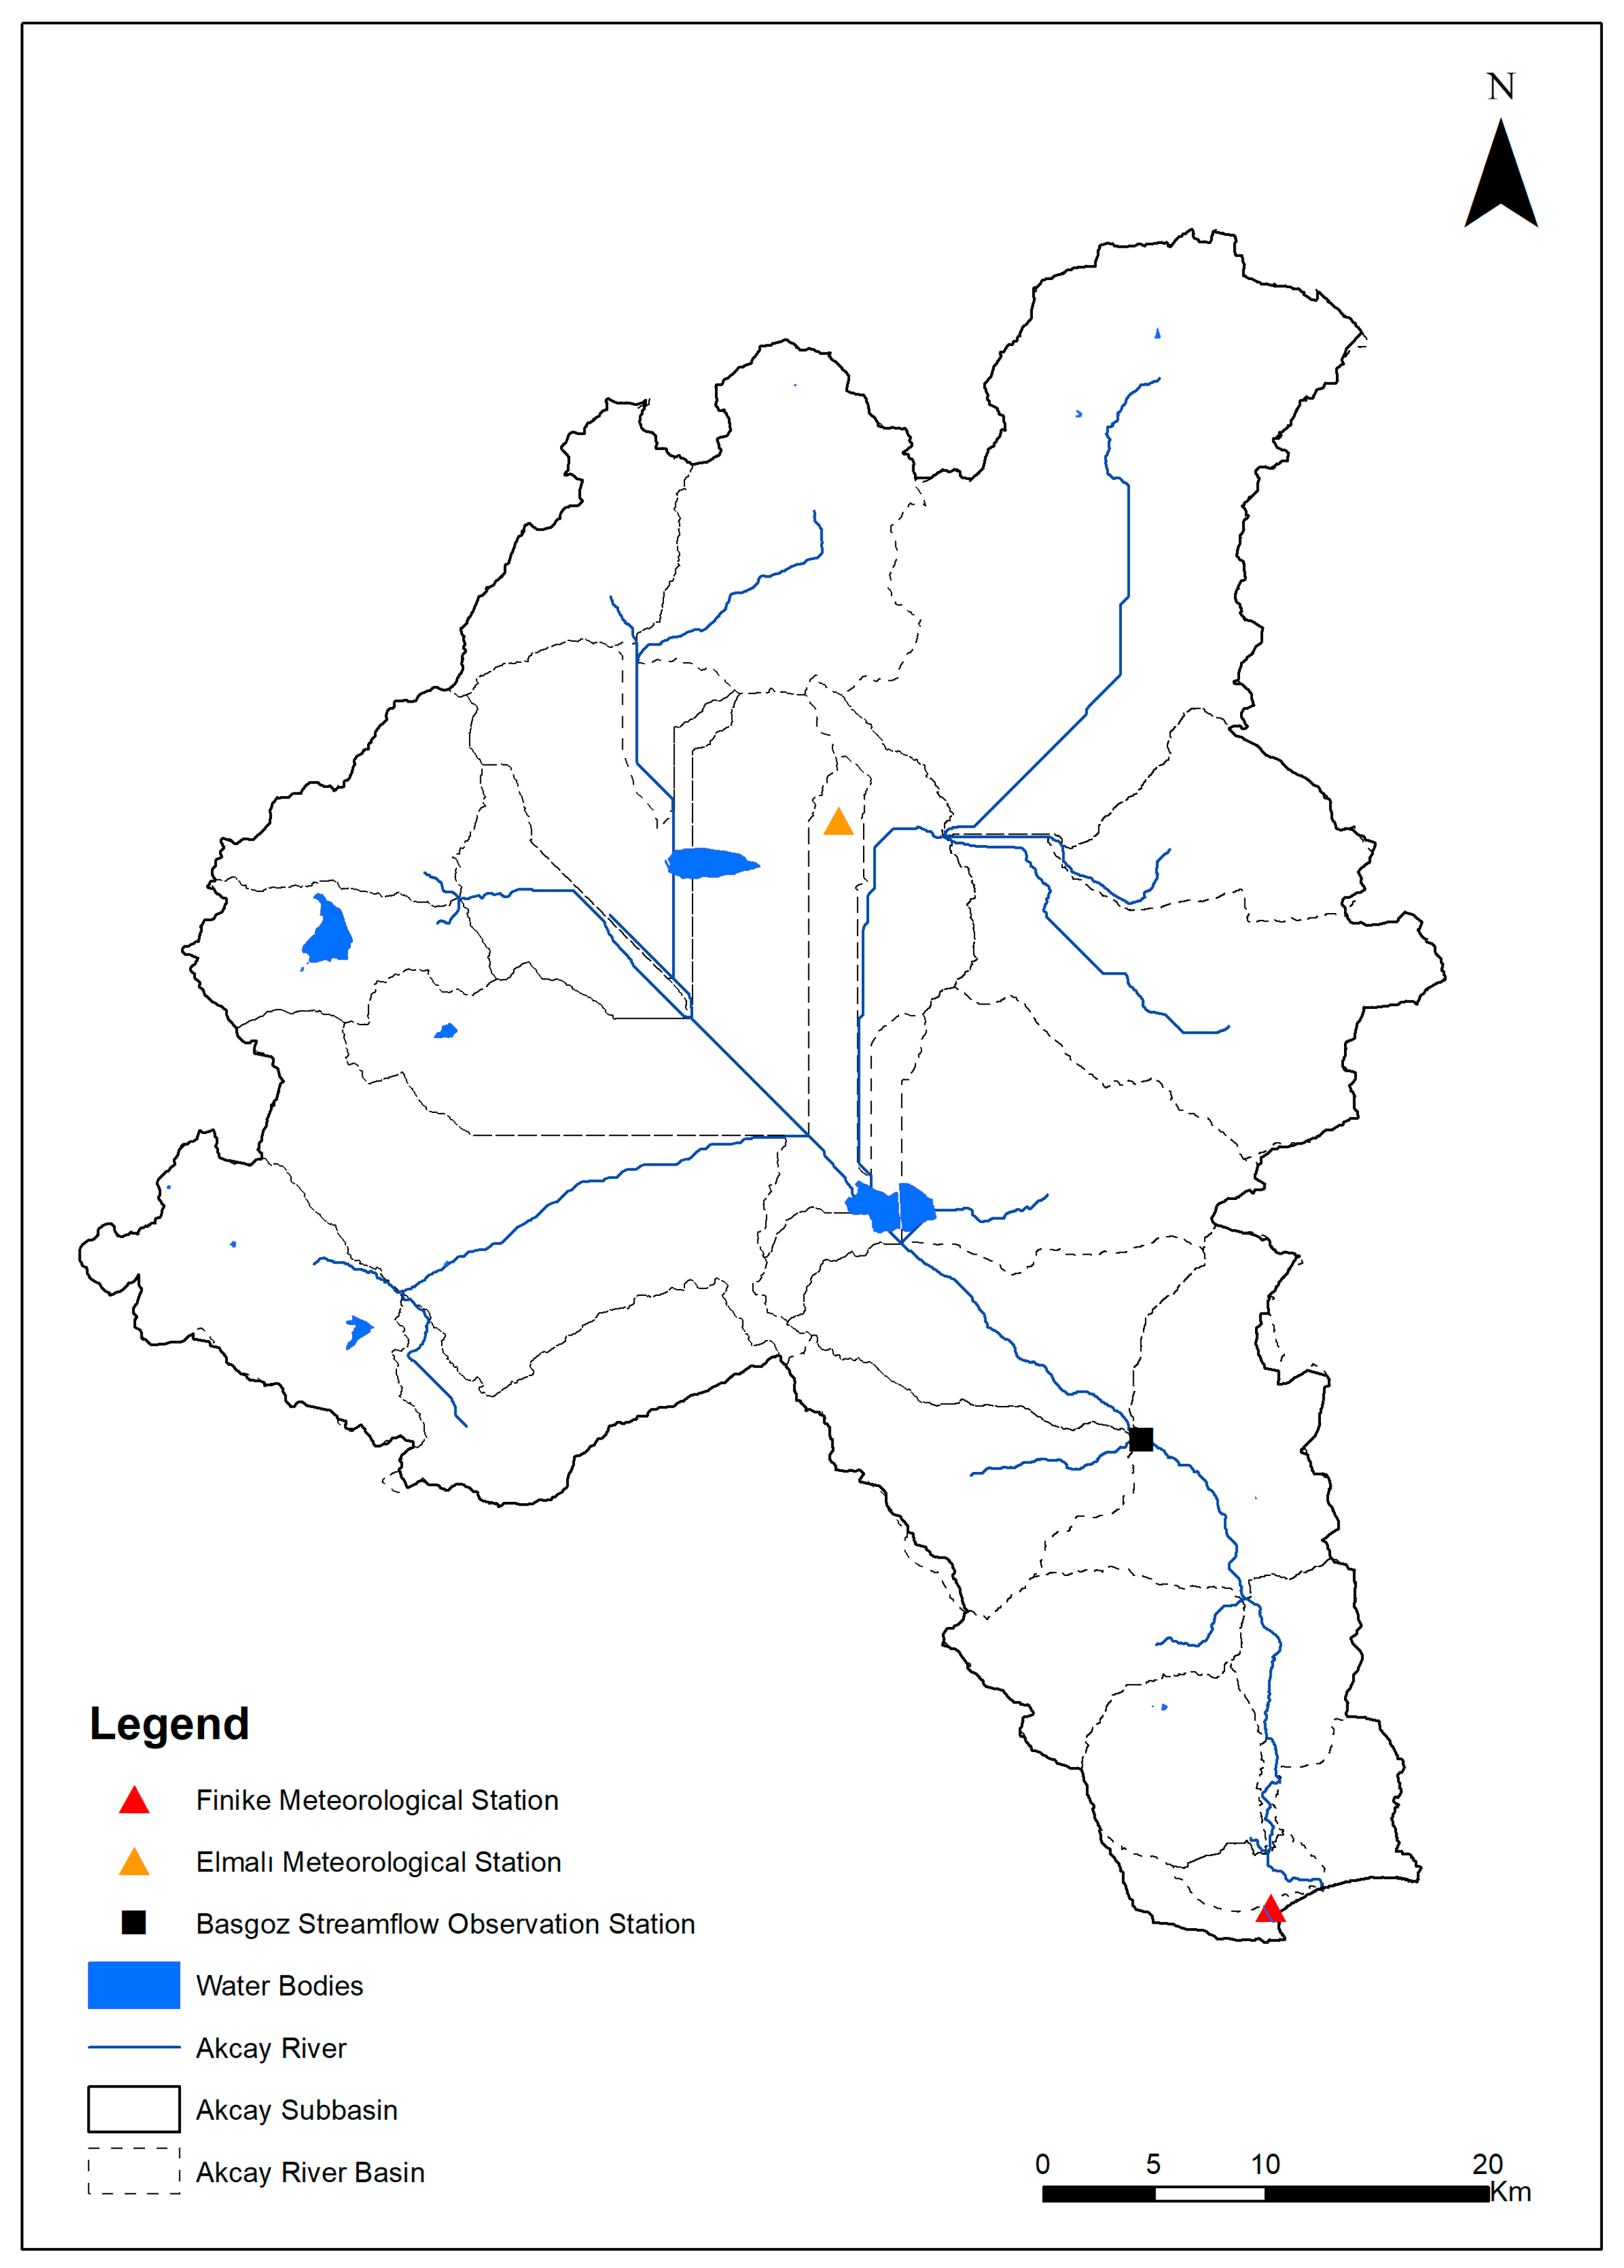
The Akçay Sub-Basin, situated within Türkiye’s Western Mediterranean Basin, which is one of the country’s 25 hydrological basins, covers a drainage area of 2497 km2, with elevations ranging from sea level to 3059 m (Figure 1). This area is characterized by extensive agricultural land use and greenhouse farming, along with a high population density. Given these characteristics, research in this region often focuses on the agricultural use of water resources. Meteorological and flow observation stations are strategically located within the Akçay Sub-Basin to capture data relevant to these studies. The locations of these observation stations are displayed in Figure 2, which provides a visual overview of the study area’s spatial and environmental context.
Watershed delineation for the Akçay Sub-Basin is carried out using the 30 m resolution SRTM (Shuttle Radar Topography Mission) elevation data for the Western Mediterranean Basin. These digital elevation data provide a measure of the Earth’s surface elevation relative to sea level, enabling the creation of a detailed elevation map [38]. After obtaining the SRTM data, they were visualized and processed within the ArcGIS v.10.8 program, where the data were reprojected to the appropriate geographic coordinate system. This reprojection step includes correcting resolution-based errors and filling minor gaps to improve data accuracy.
With the elevation data refined, the river flow direction was then determined, allowing for the identification of flow accumulation areas on the map. Using these accumulation areas, watershed boundaries were established, delineating the Akçay Sub-Basin accurately. The step-by-step methodology used for delineating the watershed boundaries in this study area is summarized in Figure 3.
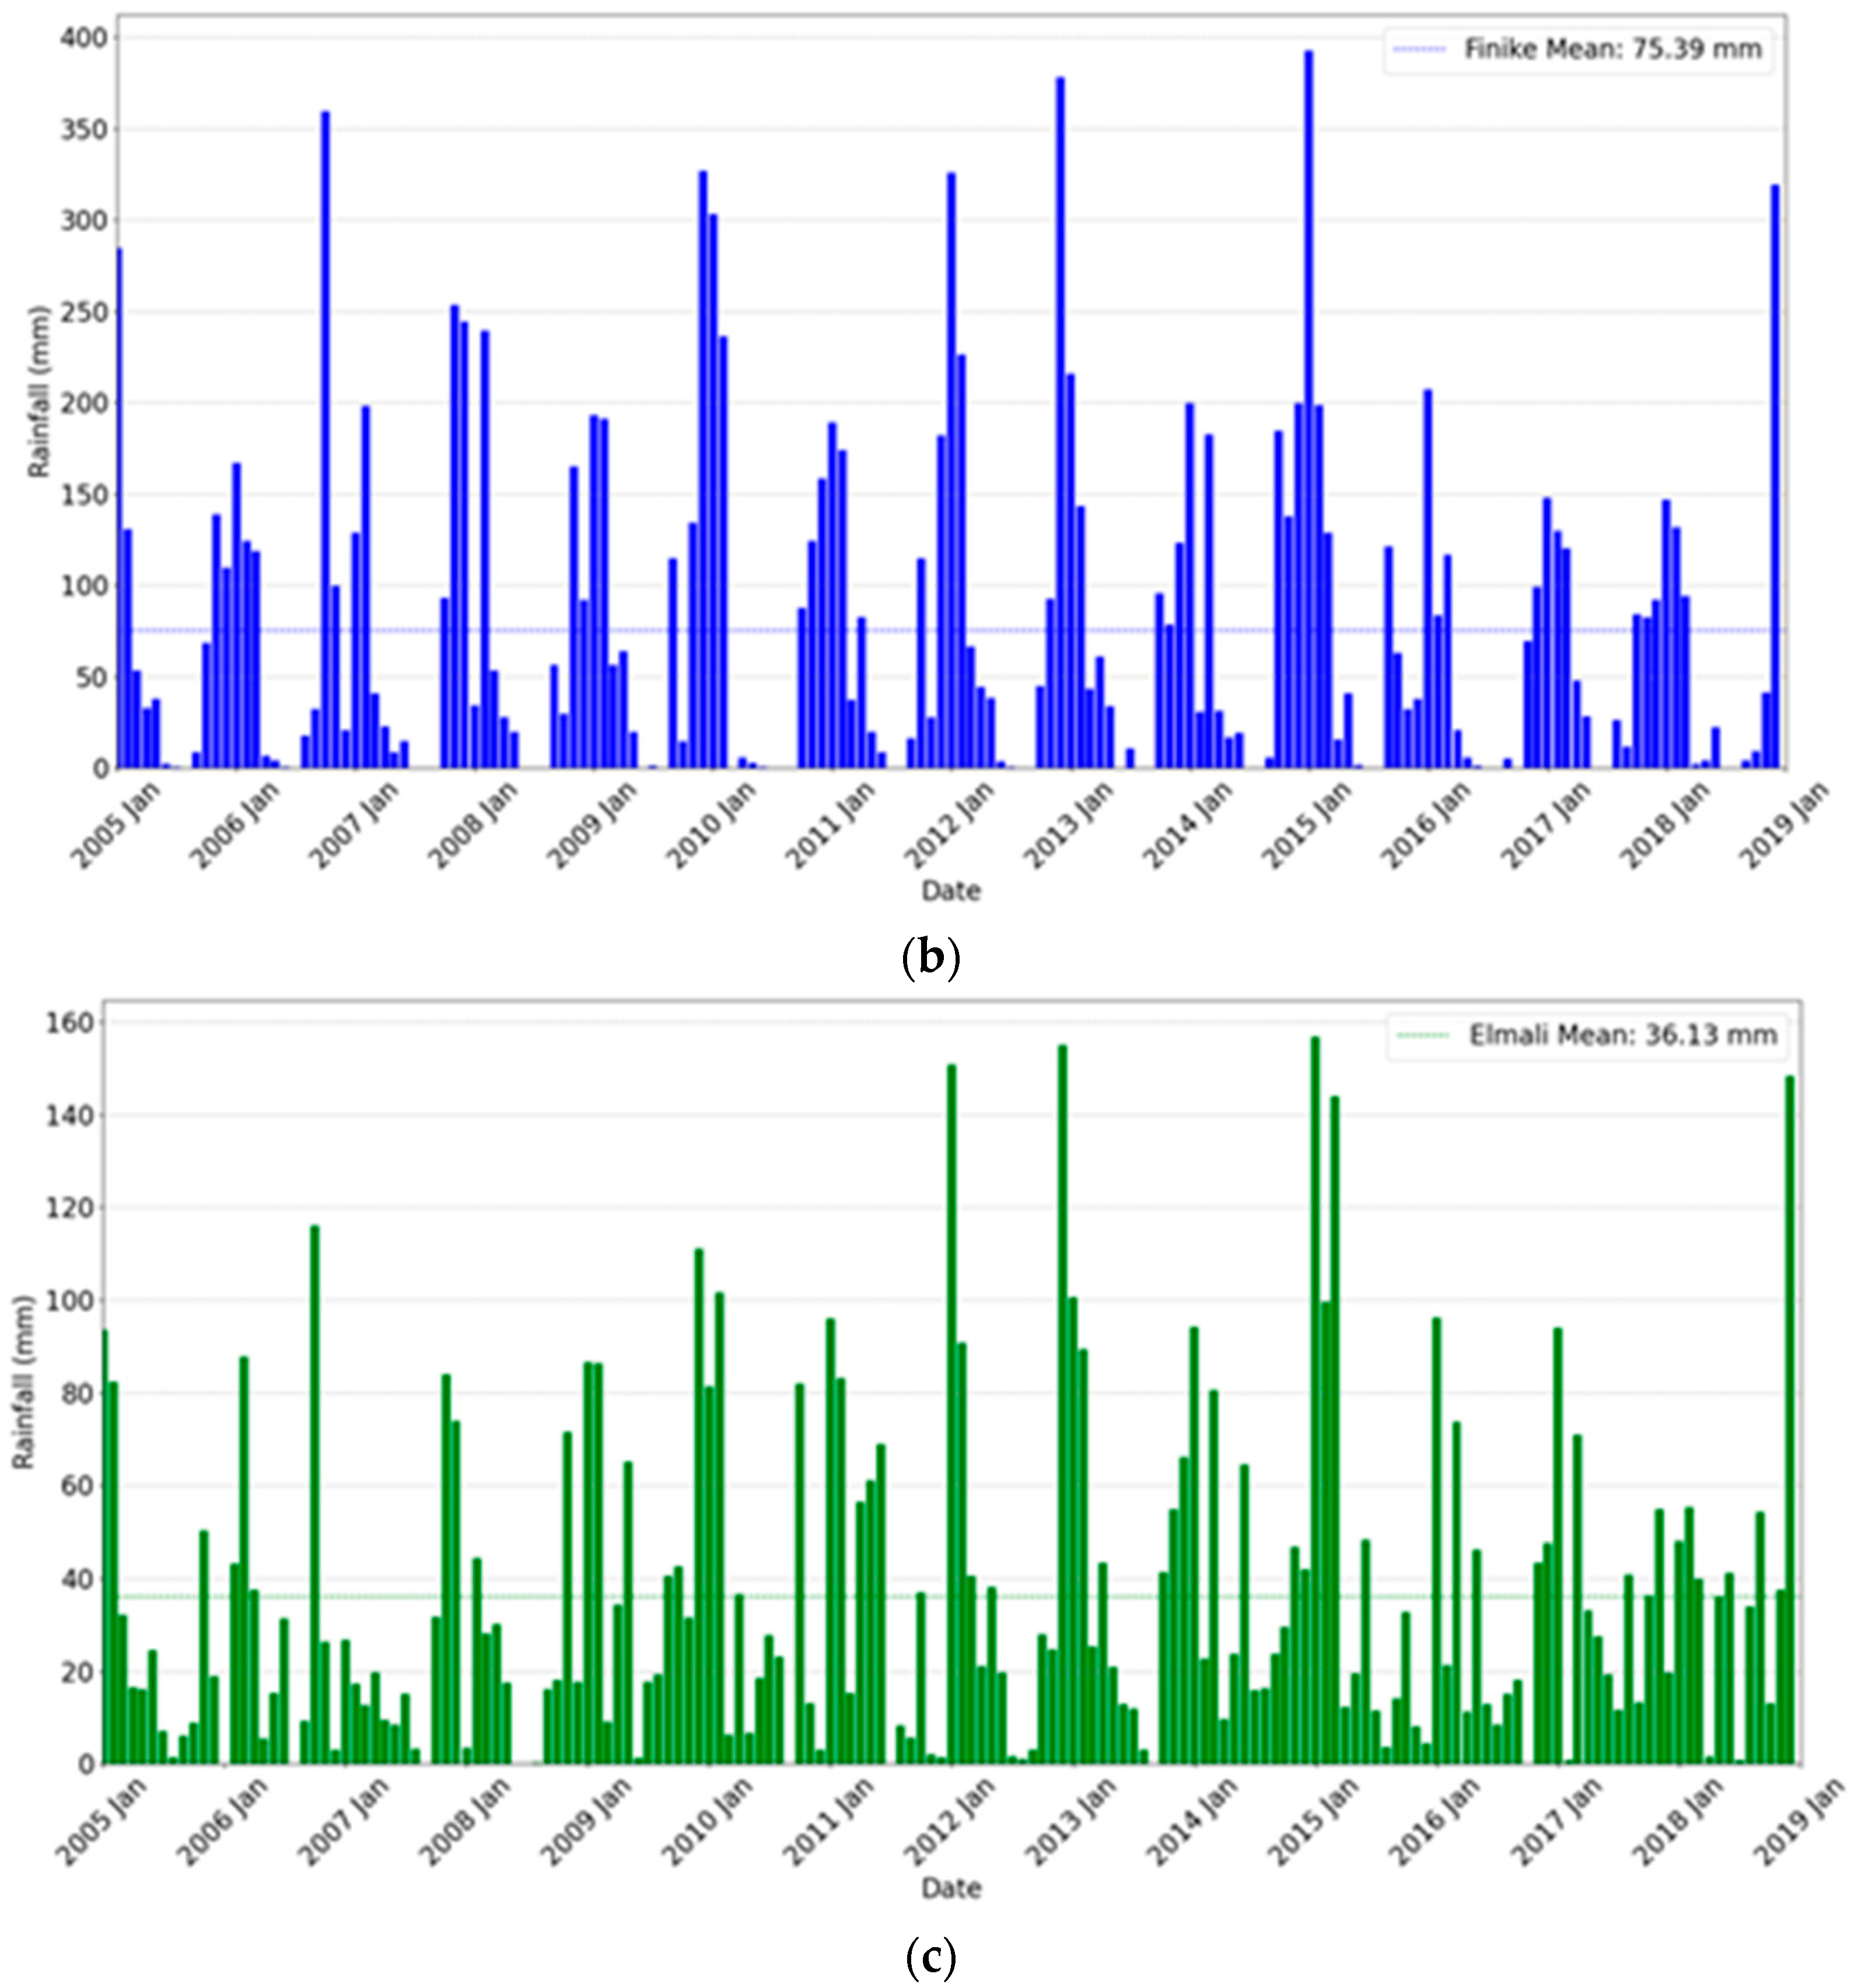
Following the delineation of watershed boundaries, precipitation and stream flow data were gathered from meteorological stations in Finike and Elmali, and the Basgoz Catallar flow observation station (covering 770 km2 with an average flow rate of 3.284 m3/s from 1955 to 2015). Figure 4 illustrates these data: (a) a hydrograph showing the relationship between precipitation (blue bars) and stream flow (green line) from 1 October 2011 to 30 September 2015, (b) monthly precipitation at Finike Station, revealing seasonal rainfall patterns and (c) monthly precipitation at Elmali Station.
The data presented in Figure 4a illustrate a direct relationship between precipitation and flow rates at the Basgoz Catallar station. High-precipitation events, particularly in January 2015, December 2014, and January 2013, resulted in notable increases in flow rates. For instance, on 13 January 2015, 87.3 mm of precipitation led to a peak flow rate of 19.7 m3/s. Similarly, 49.2 mm of rain on 27 January 2014, produced a flow rate of 4.4 m3/s, and 18.2 mm of precipitation on 8 February 2013, generated 6.07 m3/s. Following the peak flows triggered by intense rainfall events, the streamflow rates typically showed a significant decline within a few days. For instance, after the peak of 19.7 m3/s on 13 January 2015, the flow rate dropped to approximately 6.13 m3/s by 14 January 2015, representing a reduction of about 68% in one day as the precipitation intensity decreased. Similarly, in other instances, streamflow reduced by roughly 50–70% within one or two days following high-precipitation events. This pattern highlights the basin’s hydrological response to intense rainfall events, underscoring the role of precipitation monitoring in water resource management.
Figure 4b displays the monthly precipitation at the Finike Meteorological Observation Station from 2005 to 2018, revealing a clear seasonal pattern with peaks in winter and declines in summer. Notably, extreme rainfall events, such as those in January 2015 (392.6 mm, compared to the long-term average of 75.39 mm) and December 2012 (378.2 mm), indicate periods of high-water availability, which are critical for developing effective water management strategies.
Figure 4c shows the monthly precipitation data for the Elmali Meteorological Station over the same period, highlighting variability within the Akçay Sub-Basin. The average monthly precipitation is 36.13 mm, with winter and spring showing higher levels. Rainfall events above 100 mm, as recorded in January 2015 (156.8 mm) and December 2012 (155.0 mm), compared to the average value at 36.13 mm, emphasize the importance of localized data for water resource management and agricultural planning.
Precipitation data can be acquired through ground-based rain gauge stations and satellite sensors. While rain gauges provide reliable data, their spatial and temporal limitations, especially in complex terrains, can hinder comprehensive precipitation analysis. To address these limitations, this study utilized high-resolution remote sensing data from CHIRPS and GPM-IMERG, known for their extensive spatial and temporal coverage. CHIRPS, with a 0.05° spatial resolution, combines ground and satellite observations, offering consistent precipitation data from 1981 to the present, suitable for hydrological and agricultural applications [15]. GPM-IMERG, available since 2000, provides global precipitation data at 0.1° resolution, making it valuable for short-term and extreme event analysis [14].
Both CHIRPS (Version 2.0) and GPM-IMERG (Final Run, V06) precipitation datasets were processed using Python (Jupyter Notebook 7.0.8) and clipped to the spatial extent of the study area. CHIRPS data were obtained from the Climate Hazards Center (https://www.chc.ucsb.edu/data/chirps, accessed on 15 November 2024) and GPM-IMERG data from NASA’s Precipitation Processing System portal (https://gpm.nasa.gov/data/imerg, accessed on 28 November 2024) No spatial or temporal resampling was applied; instead, precipitation values were extracted directly from the native-resolution grid cells containing the coordinates of each ground station using a nearest-neighbor approach. This ensured consistency with the original data structure and enabled accurate correlation with gauge-based observations. Table 1 summarizes the main characteristics of these remotely sensed precipitation datasets.
In this study, CHIRPS and GPM-IMERG datasets were utilized to analyze rainfall patterns in Türkiye’s Akçay Sub-Basin, and these datasets were compared with ground-based meteorological data. While satellite-derived datasets have been validated in previous studies for hydrological and climate analyses [18,39,40], localized assessments are often lacking. In this context, for each ground station, satellite precipitation values were extracted directly from the grid cells containing the station’s geographic coordinates (latitude and longitude), using a nearest-neighbor approach, without applying any spatial resampling. This enabled direct point-to-pixel comparisons while preserving the native spatial resolution of the CHIRPS (0.05°) and GPM-IMERG (0.1°) datasets. This research addresses the unique topographical and climatic features of the Akçay Sub-Basin, where rainfall patterns are highly variable due to complex terrain and frequent extreme events.
The accuracy of CHIRPS and GPM-IMERG data was evaluated at both monthly and daily timescales, providing a fine-scale analysis critical for flood-prone regions. Beyond general accuracy metrics, the dataset performance in detecting extreme rainfall events was assessed using metrics to gauge their reliability for real-time monitoring and disaster preparedness in areas with sparse observational networks.
Overall, this study contributes a comprehensive evaluation of satellite precipitation data specifically tailored to the Akçay Sub-Basin, offering valuable insights that can enhance water management strategies and support local flood monitoring efforts in Türkiye’s complex terrain.

2.2. Correlation Analysis Between Meteorological Station and Remotely Sensed Datasets

Comparing rainfall data from meteorological stations with remotely sensed precipitation data is essential for validating satellite-derived datasets. This study employs various analytical methods to evaluate the alignment between ground-based and satellite precipitation data, including the correlation coefficient ( r ) [41], Nash-Sutcliffe Efficiency (NSE) [27], Root Mean Square Error (RMSE) [42], Percent Bias (PBIAS) [28], and Mean Absolute Error (MAE) [43]. These metrics are vital for assessing the degree of correlation between the ground-based observations and remotely sensed data, thereby evaluating the reliability of satellite-derived measurements.
Each of these metrics provides unique insights into the relationship between the datasets: the correlation coefficient ( r ) measures the linear relationship between two datasets; NSE evaluates the alignment between model predictions and observations; RMSE quantifies the average deviation of predictions from actual observations; PBIAS indicates the average bias in the model’s predictions compared to observations; and MAE assesses the absolute and percentage magnitude of prediction errors, respectively [18,44,45,46].
In the equations, O i represents the observed values, P i the model or predicted values, O ¯ the mean of the observed values, P ¯ the mean of the predicted values, and n denotes the number of observations.
r = i = 1 n O i O ¯ P i P ¯ i = 1 n O i O ¯ 2 i = 1 n P j P ¯ 2
N S E = i = 1 n O i P i 2 i = 1 n O i O ¯ 2
R M S E = 1 n i = 1 n P i O i 2  
P B I A S = 100 × i = 1 n P i O i i = 1 n O i
M A E = 1 n i = 1 n P i O i
For this study, correlation analyses were conducted on precipitation data from the Finike and Elmali meteorological stations in conjunction with the CHIRPS and GPM-IMERG remote sensing datasets, covering the period from 2005 to 2018. These analyses provide insights into the extent to which satellite-derived data correlate with meteorological station observations and the accuracy of the precipitation estimates. All statistical evaluations were computed separately for each station. Satellite precipitation values were extracted from the nearest native-resolution grid cell corresponding to each station’s coordinates using a nearest-neighbor approach in Python (Jupyter Notebook). Table 2 presents the monthly correlation analysis results, comparing data from the Finike and Elmali stations with the CHIRPS and GPM-IMERG datasets.
According to Table 2, the GPM-IMERG dataset exhibits higher correlation coefficients than CHIRPS for both Elmali and Finike stations (Elmali: 0.818, Finike: 0.943), indicating a stronger linear relationship between GPM-IMERG data and ground-based meteorological observations. The GPM-IMERG dataset performed best at the Finike station, with a high and positive Nash-Sutcliffe Efficiency (NSE) value of 0.887, which suggests a strong linear agreement with observed data. In contrast, both datasets for the Elmali station displayed negative NSE values, indicating greater deviations from observed data; however, the NSE for GPM-IMERG (−0.549) was still better than that for CHIRPS (−0.993).
The Root Mean Square Error (RMSE) values for GPM-IMERG were also lower than those for CHIRPS at both stations (Elmali: 43.800 mm vs. 49.682 mm; Finike: 30.146 mm vs. 50.813 mm), reflecting less error in GPM’s precipitation predictions. Furthermore, the Percent Bias (PBIAS) for GPM-IMERG at the Elmali station (65.283%) was lower than that of CHIRPS, while the negative bias at the Finike station (−4.870%) suggests minimal systematic deviation from observations, highlighting the accuracy of GPM-IMERG data in this region. Additionally, GPM-IMERG data showed lower Mean Absolute Error (MAE) values (Elmali: 28.056 mm, Finike: 18.117 mm).
Overall, the GPM-IMERG dataset for Finike exhibited the best performance across all statistical metrics, achieving the closest alignment with observed data. In contrast, CHIRPS data showed notably lower performance at the Elmali station, with higher error rates and greater deviations from observed values.
Table 3 summarizes the results of the daily correlation analysis for the Finike and Elmali meteorological stations, comparing the CHIRPS and GPM-IMERG remote sensing datasets.
As shown in Table 3, the daily analysis results reveal that GPM-IMERG data also exhibit higher correlation coefficients than CHIRPS data for both Elmali (0.420) and Finike (0.592) stations, indicating a stronger linear relationship with meteorological station data. The GPM-IMERG data for the Finike station again showed the best performance with a positive NSE value (0.239), whereas the NSE values for Elmali were negative for both datasets, suggesting deviations from observed data. Nevertheless, the NSE for GPM-IMERG in Elmali (−0.868) was an improvement over that of CHIRPS (−2.000).
In terms of RMSE, GPM-IMERG data also demonstrated lower values at both stations (Elmali: 5.812 mm, Finike: 8.341 mm), indicating a reduced error in daily precipitation predictions. The bias values for GPM-IMERG were lower compared to CHIRPS, with the negative PBIAS at the Finike station (−4.673%) suggesting minimal systematic deviation, which enhances the accuracy of GPM-IMERG data. Furthermore, GPM-IMERG data showed lower MAE values at both stations (Elmali: 2.034 mm, Finike: 2.632 mm), reflecting smaller average errors.
To further examine the relationship between GPM-IMERG precipitation data and the Finike meteorological station data, detailed analyses were conducted on both monthly and daily scales. This involved calculating Pearson’s correlation coefficient [41] and Spearman’s Rho [47], along with performing linear regression analysis [48]. The Spearman correlation coefficient ( ρ ) is used to measure the strength and direction of a monotonic relationship between two variables based on the ranked values of paired observations. It is calculated using the differences in ranks ( i ) between each pair of observations ( x i and y i ), where n denotes the number of observations. Linear regression analysis, on the other hand, is a statistical method used to examine the relationship between a dependent variable ( y ) and one or more independent variables ( x ). In this context, β 0 represents the intercept and β 1 is the slope coefficient.
ρ = 1 6 Σ i 2 n n 2 1  
β 1 = x i x ¯ y i y ¯ x i x ¯ 2
β 0 = y ¯ β 1 x ¯  
For monthly rainfall data, the Pearson correlation coefficient was 0.943 and Spearman’s Rho was 0.951, both indicating a very strong positive correlation between GPM-IMERG data and ground observations at the Finike station. Linear regression analysis yielded a slope of 0.871, an intercept of 6.046, a standard error of 0.024, and an R-squared value of 0.889, suggesting a robust alignment between satellite-derived and observed precipitation data, as shown in Figure 5a.
For daily rainfall data, the Pearson correlation coefficient was 0.592, and Spearman’s Rho was 0.499, indicating a moderate positive correlation. Linear regression analysis resulted in a slope of 0.547, an intercept of 1.005, a standard error of 0.010, and an R-squared value of 0.35. Although the correlation at the daily scale was lower compared to monthly data, it still demonstrates a statistically significant relationship, as shown in Figure 5b.
As shown in Figure 5, linear regression analysis between observed precipitation at the Finike meteorological station and satellite-based GPM-IMERG data reveals that GPM-IMERG explains 88.9% of the variance in observed monthly precipitation, while capturing only 35% of the variability in daily data. This indicates that GPM-IMERG is a reliable source for capturing monthly rainfall patterns. The strong alignment between satellite data and ground observations at the monthly scale suggests that satellite data accuracy improves over larger time scales. However, the lower performance at the daily scale highlights the challenges satellite products face in detecting short-duration precipitation events. Previous studies have shown that GPM-IMERG may either underestimate or overestimate precipitation extremes, particularly in arid or mountainous regions and during flash flood conditions [44,49,50,51].
Therefore, satellite-based precipitation data are particularly reliable at the monthly scale but may struggle to fully capture the variability of daily rainfall events. Consequently, while GPM-IMERG data are suitable for monthly analyses, daily analyses require cautious interpretation due to higher variability.

2.3. Extreme Rainfall Detection Metrics

To evaluate the accuracy of extreme rainfall event detection from the Finike meteorological station and GPM-IMERG satellite data, several performance metrics were used, including POD, FAR, POFD, CSI, and ACC [32,52,53]. These metrics provide insights into detection success and error rates, with POD indicating correctly detected extreme events, FAR representing false positive rates, POFD showing misclassified non-extreme events, CSI evaluating overall detection success while accounting for errors, and ACC representing total detection accuracy. The formulas used are:
P O D = T P T P + F N
F A R = F P T P + F P
P O F D = F P F P + T N
C S I = T P T P + F P + F N
A C C = T P + T N T P + T N + F P + F N
where TP (True Positive) represents correctly detected extreme rainfall events, FN (False Negative) denotes extreme events that were not identified, FP (False Positive) refers to non-extreme events that were incorrectly classified as extreme, and TN (True Negative) corresponds to correctly identified non-extreme events. These metrics collectively provide a robust framework for validating satellite-based precipitation products in hydrologically sensitive areas.

3. Results

3.1. Kolmogorov–Smirnov (K-S) Tests and Probability Distribution Analysis

In this section, Kolmogorov–Smirnov (K-S) tests [29] and probability distribution analyses were conducted to examine the distributional characteristics of the rainfall data obtained from the Finike meteorological station. These tests were used to evaluate how well the rainfall data fit specific probability distributions, allowing for a more accurate modeling of extreme rainfall events. The study investigated various distributions, including Gamma [54], Lognormal [55], Normal [56], Weibull [57], Exponential [58], Gumbel [59], Pareto [60], Beta [58], and Generalized Extreme Value (GEV) [61]. The K-S test results for both monthly and daily rainfall data are summarized in Table 4, with distributions showing smaller K-S statistic values and larger p-values indicating a better fit to the data.
Based on the K-S test results, the most suitable probability distributions for the monthly and daily rainfall datasets at the Finike meteorological station were identified. For the monthly dataset, the Beta distribution demonstrated the best fit (K-S statistic = 0.11, p-value = 0.033), while the Weibull distribution provided the best fit for the daily dataset (K-S statistic = 0.36, p-value = 0.001), indicating that daily rainfall data align well with this distribution.
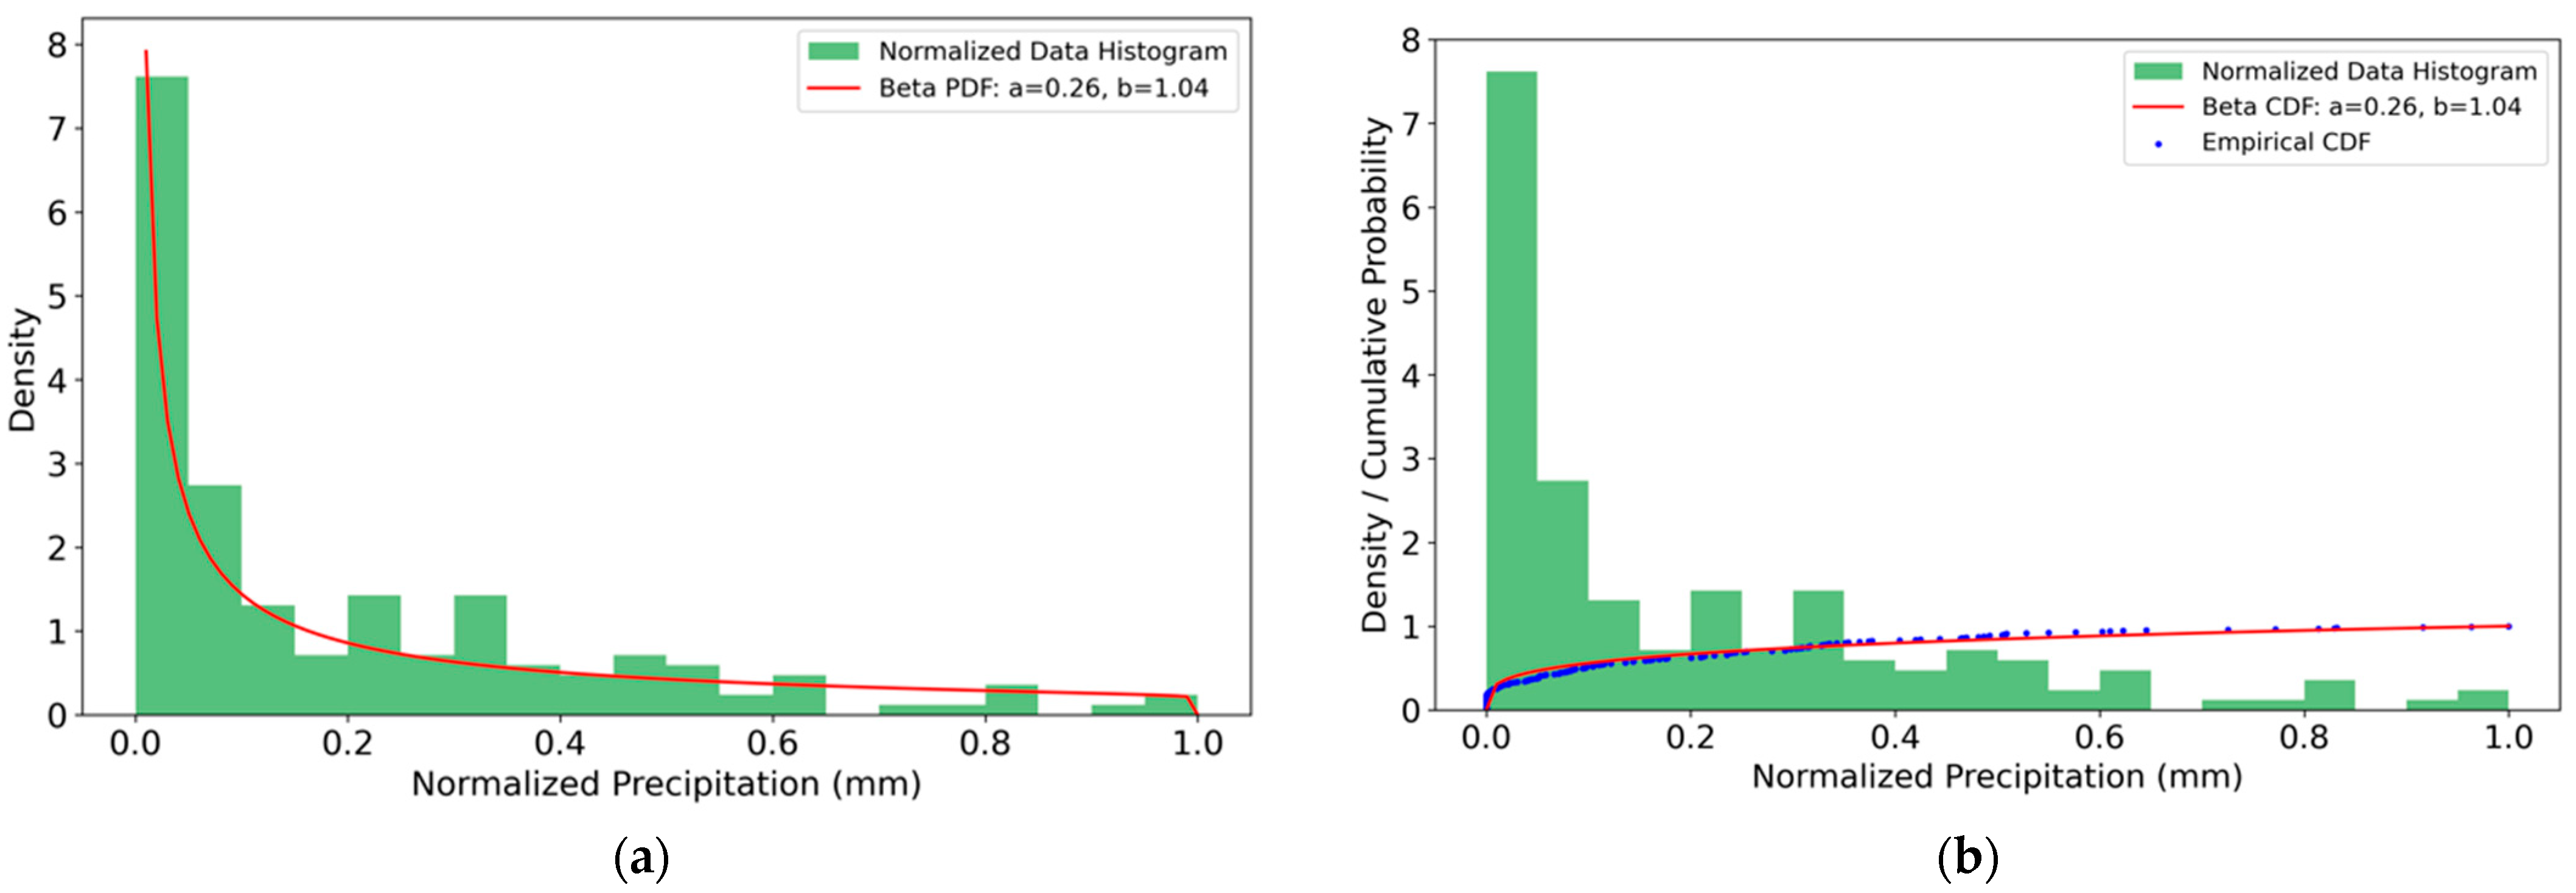
Figure 6a shows a histogram and Probability Density Function (PDF) for the monthly rainfall data fitted to the Beta distribution, highlighting a strong alignment for lower rainfall values. Figure 6b displays the Cumulative Distribution Function (CDF) of the normalized monthly rainfall data with respect to the Beta distribution.
Figure 6a,b reveal that lower rainfall values (in the range of 0.0–0.2 mm) are predominant, with the Beta distribution (red curve) accurately reflecting this trend. Although the fit declines for higher rainfall values, the overall distribution is well-represented by the Beta distribution, especially in the case of low rainfall events. In Figure 6a, the Probability Density Function (PDF) illustrates how the Beta distribution aligns closely with the histogram (green bars) of observed rainfall values, capturing the high frequency of lower values effectively. Figure 6b, showing the Cumulative Distribution Function (CDF), further supports this by depicting a steep increase in cumulative probability at lower rainfall values, confirming that a large portion of the data lies in this range. The empirical CDF (blue dots) shows the cumulative probability of the normalized data, representing the proportion of values less than or equal to a given point. This alignment suggests that the Beta distribution is a suitable model for the dataset, especially when analyzing the likelihood of low rainfall occurrences.
Figure 7a,b illustrate the Probability Density Functions (PDFs) and threshold values for monthly and daily rainfall data, respectively, highlighting the identification of extreme rainfall events.
Figure 7a presents the threshold analysis for monthly rainfall data. The 90%, 95%, and 99% threshold lines are positioned at approximately 253.39 mm, 315.49 mm, and 375.09 mm, respectively. In the dataset, 9 rainfall events exceeded the 90th percentile threshold, marking periods of significant hydrological risk due to potential flood and waterlogging (e.g., 284.8 mm, 359.6 mm, 253.4 mm). These thresholds delineate boundaries for extreme monthly rainfall, enabling the identification of high-risk months. Monthly rainfall exceeding the 99th percentile (375.09 mm) signifies exceptionally high rainfall, indicating some of the most intense and disruptive hydrological events of the year. Notably, the months of December 2012 and January 2015 recorded exceptionally high rainfall totals of 378.2 mm and 392.6 mm, respectively, both surpassing the 99th percentile threshold. These events underscore the occurrence of rare and extreme hydrometeorological conditions within the study period.
Figure 7b shows the daily rainfall data fitted to a Weibull distribution, with thresholds of 5.34 mm for the 90th percentile, 9.85 mm for the 95th percentile, and 26.77 mm for the 99th percentile. In this dataset, 23 rainfall events surpassed the 90th percentile, while only 8 events exceeded the 99th percentile (e.g., 182.0 mm, 94 mm, and 62 mm), identifying rare, high-risk events. These thresholds are critical for identifying days with heightened hydrological risk, where even a single extreme rainfall event may lead to infrastructure strain and rapid-onset flooding. Notably, on 18 October 2006, a total of 182 mm of rainfall was recorded in a single day, which resulted in a major flash flood event across the region. Similarly, on 8 February 2010, 94 mm of daily rainfall triggered another significant flood event. These historical extremes emphasize the importance of threshold-based rainfall analysis as a foundation for evaluating how effectively extreme events can be detected using ground-based observation systems.

3.2. Performance of Extreme Rainfall Event Detection

The threshold values determined from Finike meteorological station rainfall data—253.39 mm for the 90th percentile of monthly rainfall and 5.34 mm for the 90th percentile of daily rainfall—served as input parameters for classifying rainfall events as “extreme”. Based on this classification, several categorical performance metrics were applied to evaluate the accuracy of GPM-IMERG satellite-based extreme rainfall detection. These included the POD, FAR, POFD, CSI and ACC, each providing a distinct perspective on detection skill and classification errors, as detailed in Section 2.3. By employing these threshold values, the satellite data’s ability to accurately detect extreme rainfall events was assessed, and the performance metrics are presented in Table 5.
According to Table 5, the GPM-IMERG dataset shows strong performance in detecting extreme rainfall events for monthly data. Using a 253.9 mm threshold, the dataset achieved a high detection rate (POD: 0.778) and low false alarm rate (FAR: 0.222), with a minimal Probability of False Detection (1.3%) and high accuracy (ACC: 97.6%). These values suggest that GPM-IMERG data are effective for monthly extreme event identification.
In contrast, when applied to daily rainfall data with a threshold of 5.34 mm, the detection rate was lower (POD: 0.478), and the false alarm rate was higher (FAR: 0.388), with an overall accuracy of 88.7% (ACC: 0.887). These findings indicate that, while GPM-IMERG data perform reliably for monthly extreme event detection, the accuracy in identifying daily extremes could benefit from further enhancement, likely due to the increased temporal variability at finer scales.
These differences in performance can be primarily attributed to the temporal and spatial resolutions of satellite-based precipitation products. At the daily scale, the GPM-IMERG dataset may fail to accurately capture extreme rainfall events—especially in coastal regions like Finike—due to challenges in detecting short-duration, high-intensity storms. The 0.1° spatial resolution of the satellite can lead to underestimation of peak rainfall values and temporal mismatches with ground-based observations, contributing to higher false alarm rates and lower detection accuracy. In contrast, monthly aggregations smooth out short-term variability and help mitigate these temporal and spatial inconsistencies, thereby improving the reliability of extreme rainfall detection at coarser temporal scales.

4. Discussion and Future Work

Numerous international studies support the findings of this research, confirming the applicability of satellite-based precipitation datasets—particularly GPM-IMERG and CHIRPS—for hydrological assessments in regions with limited ground observations. CHIRPS has shown reliable performance in semi-arid areas, though its accuracy decreases in mountainous regions due to topographic variability in Türkiye [62]. Some studies have emphasized the utility of satellite and grid-based precipitation data in water resource planning and basin-scale management [63,64], while several have demonstrated the potential of GPM-IMERG for identifying extreme precipitation events and flood risks [65,66,67]. In addition to these studies in Türkiye, CHIRPS and GPM-IMERG have been evaluated in various basins, including the Mekong [11] and in Vietnamese catchments [18], and have been validated for hydrological modeling and monitoring applications. Many studies conducted in the U.S. [25] and globally [10,44] also confirm the effectiveness of these products for capturing hydro-meteorological extremes. Collectively, these findings align with the results observed in the Akçay Sub-Basin, where GPM-IMERG outperformed CHIRPS—particularly at the monthly scale—reinforcing the growing relevance of satellite-based precipitation products for operational use in climate adaptation, early warning systems, and water management strategies in data-scarce environments.
In the Akçay Sub-Basin, GPM-IMERG data demonstrated superior performance over CHIRPS in capturing extreme precipitation events, particularly at the monthly scale. This advantage is largely attributed to the higher spatiotemporal resolution and advanced retrieval algorithms used in the GPM-IMERG product. The monthly scale consistency observed in GPM-IMERG results is likely due to the temporal smoothing effect, which reduces local variability and compensates for over- or underestimation across time. In contrast, daily scale analysis revealed noticeable discrepancies, especially during high-intensity and short-duration rainfall events, underscoring the limitations of satellite products in resolving localized convective systems.
Topographic complexity in the Akçay Sub-Basin further exacerbates satellite estimation errors. Orographic uplift, variable wind fields, and sub-cloud evaporation introduce uncertainties that are difficult to capture from spaceborne sensors. These conditions often lead to spatial mismatches between satellite pixels and ground station point measurements, particularly in mountainous areas. While CHIRPS relies heavily on interpolated station data, its limited spatial coverage in rugged terrain contributes to underrepresentation of peak rainfall events. Conversely, GPM-IMERG’s algorithm benefits from real-time microwave and radar data fusion but still struggles with short-term variability and storm-scale dynamics. These findings highlight the importance of evaluating satellite precipitation products in basin-specific contexts before operational use. Although both datasets offer valuable insight for hydrological planning in data-scarce regions, their performance varies significantly with temporal resolution and regional characteristics. As such, integrating satellite data with ground observations—especially through bias correction or machine learning-based fusion methods—could enhance reliability in short-term precipitation monitoring.
Future research should focus on enhancing the temporal accuracy of satellite-based precipitation products, particularly for daily scale applications in topographically complex basins. Improving retrieval algorithms to better account for orographic effects, convective activity, and localized storm dynamics is essential to reduce estimation errors. A promising approach involves the development of hybrid models that integrate satellite observations with ground-based data using techniques such as statistical downscaling, bias correction, or machine learning. In particular, artificial intelligence and deep learning methods—trained on region-specific meteorological and terrain characteristics—have the potential to improve the detection and prediction of extreme rainfall events by capturing nonlinear patterns that traditional algorithms often overlook. Furthermore, ensemble modeling frameworks that combine multiple satellite products (e.g., GPM, CHIRPS, TMPA) with in situ observations may yield more robust and consistent precipitation estimates, especially for use in operational flood forecasting and climate adaptation planning. In addition, further applications should examine the transferability of the methodology employed in this study to other hydrological basins with diverse climatic and physiographic conditions in Türkiye and beyond. Such comparative analyses would help identify basin-specific limitations and enhance the broader applicability of satellite-derived precipitation products for water resource management and disaster resilience in data-scarce regions.

5. Conclusions

This study evaluated the performance of GPM-IMERG and CHIRPS satellite precipitation datasets against ground observations from Finike and Elmali stations in Türkiye, focusing on extreme rainfall events in the Akçay Sub-Basin. Monthly and daily data were analyzed using statistical and performance metrics to assess their suitability for hydrological applications.
GPM-IMERG data exhibited stronger agreement with ground-based observations than CHIRPS, particularly at the monthly scale, with higher correlation coefficients (Pearson: 0.943; Spearman: 0.951) and lower error metrics (RMSE: 50.81 mm; MAE: 30.81 mm). In contrast, daily correlations were weaker (Pearson: 0.592; RMSE: 12.46 mm), indicating GPM-IMERG’s greater reliability in capturing long-term precipitation trends. The monthly performance likely reflects the smoothing effect of temporal averaging, whereas daily discrepancies stem from the localized and variable nature of rainfall events.
Kolmogorov–Smirnov tests indicated that the Beta distribution best fits monthly rainfall data, while the Weibull distribution suits daily data, supporting more accurate flood risk assessments. The 90th percentile thresholds (253.39 mm for monthly; 5.34 mm for daily) were used to define extreme events and assess GPM-IMERG’s detection performance. Results showed high accuracy for monthly extremes (POD: 0.778; FAR: 0.222; ACC: 97.6%), whereas daily detection was less reliable (POD: 0.478; FAR: 0.388; ACC: 88.7%), underscoring limitations in capturing short-term variability.
In conclusion, GPM-IMERG data are well-suited for monitoring monthly precipitation and identifying extreme events, offering valuable support for hydrological applications and flood risk assessment in data-scarce regions. However, its limited accuracy at the daily scale highlights the need for supplementary ground observations or improved satellite techniques. Future research should focus on enhancing daily detection capabilities and integrating satellite and in situ data to improve short-term precipitation estimates and climate resilience planning.

Author Contributions

Conceptualization, V.L., E.G.K. and B.F.; methodology, E.G.K. and B.F.; software, E.G.K.; validation, V.L. and B.F.; formal analysis, E.G.K.; investigation, E.G.K.; resources, V.L.; data curation, E.G.K.; writing—original draft preparation, E.G.K.; writing—review and editing, V.L. and B.F.; visualization, E.G.K.; supervision, V.L. All authors have read and agreed to the published version of the manuscript.

Funding

The APC was 50% waived for this article thanks to an invitation extended to Venkataraman Lakshmi by the journal. No other external funding was received for this research.

Acknowledgments

The author Elif Gulen Kir thanks the Turkish State Meteorological Service (MGM) for providing meteorological data, and the Scientific and Technological Research Council of Türkiye (TÜBİTAK) for their financial and technical support (grant number 1059B142201431). The author Elif Gulen Kir also thanks Venkataraman Lakshmi’s team and institution for their academic collaboration and support throughout this research. The authors have reviewed and edited the output and take full responsibility for the content of this publication.

Conflicts of Interest

The authors declare no conflicts of interest. The funders had no role in the design of the study; in the collection, analyses, or interpretation of data; in the writing of the manuscript; or in the decision to publish the results.

References

  1. Intergovernmental Panel on Climate Change. Climate Change 2021: The Physical Science Basis; Cambridge University Press: Cambridge, UK, 2021. [Google Scholar] [CrossRef]
  2. Ali, S.; Zhang, Q.; He, Y. Impacts of climate change on extreme precipitation and river flow in Asia: A systematic review. J. Hydrol. 2022, 602, 126689. [Google Scholar]
  3. Gudmundsson, L.; Decharme, B.; Blöschl, G. Observed climate variability and extremes in global river flow. Nat. Rev. Earth Environ. 2023, 4, 44–59. [Google Scholar]
  4. Westra, S.; Fowler, H.J.; Evans, J.P.; Alexander, L.V.; Berg, P.; Johnson, F.; Kendon, E.J.; Lenderink, G.; Roberts, N.M. Future changes to the intensity and frequency of short-duration extreme rainfall. Rev. Geophys. 2014, 52, 522–555. [Google Scholar] [CrossRef]
  5. Dottori, F.; Szewczyk, W.; Ciscar, J.-C.; Zhao, F.; Alfieri, L.; Hirabayashi, Y.; Bianchi, A.; Mongelli, I.; Frieler, K.; Betts, R.A.; et al. Increased human and economic losses from river flooding with anthropogenic warming. Nat. Clim. Change 2018, 8, 781–786. [Google Scholar] [CrossRef]
  6. Kundzewicz, Z.W.; Kanae, S.; Seneviratne, S.I.; Handmer, J.; Nicholls, N.; Peduzzi, P.; Mechler, R.; Bouwer, L.M.; Arnell, N.; Mach, K.; et al. Flood risk and climate change: Global and regional perspectives. Hydrol. Sci. J. 2014, 59, 1–28. [Google Scholar] [CrossRef]
  7. Hirabayashi, Y.; Mahendran, R.; Koirala, S.; Konoshima, L.; Yamazaki, D.; Watanabe, S.; Kim, H.; Kanae, S. Global flood risk under climate change. Nat. Clim. Change 2013, 3, 816–821. [Google Scholar] [CrossRef]
  8. Arnell, N.W.; Gosling, S.N. The impacts of climate change on river flood risk at the global scale. Clim. Change 2016, 134, 387–401. [Google Scholar]
  9. Mondal, A.; Lakshmi, V.; Hashemi, H. Intercomparison of trend analysis of multi satellite monthly precipitation products and gage measurements for river basins of India. J. Hydrol. 2018, 565, 779–790. [Google Scholar] [CrossRef]
  10. Lakshmi, V. Remote Sensing of the Terrestrial Water Cycle; John Wiley & Sons: Hoboken, NJ, USA, 2019. [Google Scholar]
  11. Dandridge, C.; Lakshmi, V.; Bolten, J.; Srinivasan, R. Evaluation of satellite-based rainfall estimates in the Lower Mekong River Basin. Remote Sens. 2019, 11, 2709. [Google Scholar] [CrossRef]
  12. Maidment, R.I.; Grimes, D.I.F.; Allan, R.P.; Greatrex, H.; Rojas, O.; Leo, O. Evaluation of satellite based and model re analysis rainfall estimates for Uganda. Meteorol. Appl. 2013, 20, 308–317. [Google Scholar]
  13. Kidd, C.; Levizzani, V. Status of satellite precipitation retrievals. Hydrol. Earth Syst. Sci. 2011, 15, 1109–1116. [Google Scholar] [CrossRef]
  14. Huffman, G.J.; Bolvin, D.T.; Braithwaite, D.; Hsu, K.; Joyce, R.; Xie, P. Integrated Multi satellite Retrievals for GPM (IMERG) Algorithm Theoretical Basis Document; NASA Goddard Space Flight Center. 2020. Available online: https://gpm.nasa.gov (accessed on 15 April 2024).
  15. Funk, C.; Peterson, P.; Landsfeld, M.; Pedreros, D.; Verdin, J.; Rowland, J.; Michaelsen, J. The climate hazards infrared precipitation with stations—A new environmental record for monitoring extremes. Sci. Data 2015, 2, 150066. [Google Scholar] [CrossRef]
  16. Beck, H.E.; Vergopolan, N.; Pan, M.; Levizzani, V.; van Dijk, A.I.J.M.; Weedon, G.P.; Brocca, L.; Pappenberger, F.; Huffman, G.J.; Wood, E.F. Global-scale evaluation of 22 precipitation datasets using gauge observations and hydrological modeling. Hydrol. Earth Syst. Sci. 2017, 21, 6201–6217. [Google Scholar] [CrossRef]
  17. Maidment, R.I.; Grimes, D.; Black, E.; Tarnavsky, E.; Young, M.; Greatrex, H.; Allan, R.P.; Stein, T.H.M.; Nkonde, E.; Senkunda, S.; et al. A new, long-term daily satellite-based rainfall dataset for operational monitoring in Africa. Sci. Data 2017, 4, 170063. [Google Scholar] [CrossRef]
  18. Le, M.-H.; Lakshmi, V.; Bolten, J.; Bui, D. Adequacy of satellite derived precipitation estimate for hydrological modeling in Vietnam basins. J. Hydrol. 2020, 586, 124820. [Google Scholar] [CrossRef]
  19. Tran, D.; Le, M.-H.; Zhang, R.; Nguyen, B.; Bolten, J.; Lakshmi, V. Robustness of gridded precipitation products for Vietnam basins using the comprehensive assessment framework of rainfall. Atmos. Res. 2023, 293, 106293. [Google Scholar] [CrossRef]
  20. Prat, O.P.; Nelson, B.R. Evaluation of precipitation estimates over CONUS derived from satellite, radar, and rain gauge data sets at daily to annual scales (2002–2012). Hydrol. Earth Syst. Sci. 2015, 19, 2037–2056. [Google Scholar] [CrossRef]
  21. Hashemi, H.; Nordin, M.; Lakshmi, V.; Huffman, G.; Knight, R. Bias correction of long term satellite monthly precipitation product (TRMM 3B43) over the conterminous United States. J. Hydrometeorol. 2017, 18, 2491–2509. [Google Scholar] [CrossRef]
  22. Zhang, S.; Wang, D.; Qin, Z.; Zheng, Y.; Guo, J. Assessment of the GPM and TRMM precipitation products using the rain gauge network over the Tibetan Plateau. J. Meteorol. Res. 2018, 32, 324–336. [Google Scholar] [CrossRef]
  23. Alijanian, M.; Rakhshandehroo, G.R.; Mishra, A.K.; Dehghani, M. Evaluation of satellite rainfall climatology using CMORPH, PERSIANN-CDR, PERSIANN, TRMM, MSWEP over Iran. Int. J. Climatol. 2017, 37, 4896–4914. [Google Scholar] [CrossRef]
  24. Ayehu, G.T.; Tadesse, T.; Gessesse, B.; Dinku, T. Validation of new satellite rainfall products over the Upper Blue Nile Basin, Ethiopia. Atmos. Meas. Tech. 2018, 11, 1921–1936. [Google Scholar] [CrossRef]
  25. Fayne, J.; Hashemi, H.; Huffman, G.; Lakshmi, V. Very high resolution altitude corrected, TMPA based monthly satellite precipitation product over the CONUS. Sci. Data 2020, 7, 96. [Google Scholar] [CrossRef]
  26. Tran, D.; Nguyen, B.; Zhang, R.; Aryal, A.; Grodzka Lukaszewska, M.; Sinicyn, G.; Lakshmi, V. Quantification of gridded precipitation products on the Mekong River Basin: A case study for the Srepok River subbasin, Central Highland Vietnam. Remote Sens. 2023, 15, 1030. [Google Scholar] [CrossRef]
  27. Nash, J.E.; Sutcliffe, J.V. River flow forecasting through conceptual models part I—A discussion of principles. J. Hydrol. 1970, 10, 282–294. [Google Scholar] [CrossRef]
  28. Gupta, H.V.; Sorooshian, S.; Yapo, P.O. Status of automatic calibration for hydrologic models: Comparison with multilevel expert calibration. J. Hydrol. Eng. 1999, 4, 135–143. [Google Scholar] [CrossRef]
  29. Massey, F.J. The Kolmogorov–Smirnov test for goodness of fit. J. Am. Stat. Assoc. 1958, 46, 68–76. [Google Scholar] [CrossRef]
  30. Beguería, S. Uncertainties in partial duration series modelling of extremes related to the choice of the threshold value. J. Hydrol. 2005, 303, 215–230. [Google Scholar] [CrossRef]
  31. Koutsoyiannis, D. Statistics of extremes and estimation of extreme rainfall: I. Theoretical investigation. Hydrol. Sci. J. 2004, 49, 575–590. [Google Scholar] [CrossRef]
  32. Yu, Y.; Choi, Y.J.; Kim, J.H.; Lee, S. Evaluating the performance of satellite precipitation products for extreme rainfall detection. Remote Sens. 2022, 14, 567. [Google Scholar] [CrossRef]
  33. Doswell, C.A., III; Davies-Jones, R.; Keller, D.L. On summary measures of skill in rare event forecasting based on contingency tables. Wea. Forecast. 1990, 5, 576–585. [Google Scholar] [CrossRef]
  34. Jolliffe, I.T.; Stephenson, D.B. Forecast Verification: A Practitioner’s Guide in Atmospheric Science, 2nd ed.; John Wiley & Sons: Hoboken, NJ, USA, 2012. [Google Scholar]
  35. Schaefer, J.T. The critical success index as an indicator of warning skill. Wea. Forecast. 1990, 5, 570–575. [Google Scholar] [CrossRef]
  36. Marzban, C. Scalar measures of performance in rare-event situations. Wea. Forecast. 1998, 13, 753–763. [Google Scholar] [CrossRef]
  37. Wilks, D.S. Statistical Methods in the Atmospheric Sciences, 3rd ed.; Academic Press: Amsterdam, The Netherlands, 2011. [Google Scholar]
  38. United States Geological Survey. Shuttle Radar Topography Mission (SRTM) Elevation Data; USGS: Reston, VA, USA, 2000. Available online: https://www.usgs.gov (accessed on 18 April 2024).
  39. Gupta, P.; Singh, P.; Singh, P.; Joshi, V. Assessment of satellite based precipitation products for hydrological applications in the Himalayan region. J. Hydrol. 2020, 591, 125579. [Google Scholar] [CrossRef]
  40. Hordofa, T.; Kiggundu, N.; Girma, M. Performance evaluation of satellite based rainfall estimates for drought monitoring in the Upper Blue Nile Basin, Ethiopia. Meteorol. Appl. 2021, 28, e2007. [Google Scholar] [CrossRef]
  41. Pearson, K. Notes on regression and inheritance in the case of two parents. Proc. R. Soc. Lond. 1895, 58, 240–242. [Google Scholar] [CrossRef]
  42. Chai, T.; Draxler, R.R. Root mean square error (RMSE) or mean absolute error (MAE)?—Arguments against avoiding RMSE in the literature. Geosci. Model Dev. 2014, 7, 1247–1250. [Google Scholar] [CrossRef]
  43. Willmott, C.J.; Matsuura, K. Advantages of the mean absolute error (MAE) over the root mean square error (RMSE) in assessing average model performance. Clim. Res. 2005, 30, 79–82. [Google Scholar] [CrossRef]
  44. Tang, G.; Clark, M.P.; Papalexiou, S.M.; Ma, Z.; Hong, Y. Have satellite precipitation products improved over the last two decades? A comprehensive comparison of GPM IMERG with nine satellite and reanalysis datasets. Remote Sens. Environ. 2020, 240, 111697. [Google Scholar] [CrossRef]
  45. Zhang, X.; Zhang, L.; Zhao, J.; Duan, J.; Liu, X. Assessment of the accuracy of satellite based precipitation products in the Tibetan Plateau. Water 2020, 12, 510. [Google Scholar] [CrossRef]
  46. Peng, J.; Loew, A.; Chen, X.; Ma, Y.; Su, Z. Assessing the quality of satellite based precipitation estimates over the Tibetan Plateau. Atmos. Res. 2021, 249, 105307. [Google Scholar] [CrossRef]
  47. Spearman, C. The proof and measurement of association between two things. Am. J. Psychol. 1904, 15, 72–101. [Google Scholar] [CrossRef]
  48. Draper, N.R.; Smith, H. Applied Regression Analysis, 3rd ed.; John Wiley & Sons: New York, NY, USA, 1998. [Google Scholar]
  49. Da Silva, N.A.; Webber, B.G.M.; Matthews, A.J.; Feist, M.M.; Stein, T.H.M.; Holloway, C.E.; Abdullah, M.F.A.B. Validation of GPM IMERG extreme precipitation in the Maritime Continent by station and radar data. Earth Space Sci. 2021, 8, e2021EA001738. [Google Scholar] [CrossRef]
  50. Ji, H.; Peng, D.; Gu, Y.; Liang, Y.; Luo, X. Evaluation of multiple satellite precipitation products and their potential utilities in the Yarlung Zangbo River Basin. Sci. Rep. 2022, 12, 14071. [Google Scholar] [CrossRef]
  51. Hameed, I.A.; Al Nuaimi, K.; Idrees, N.M. Reliability of GPM IMERG satellite precipitation data for modelling flash flood events in selected watersheds in the UAE. Remote Sens. 2023, 15, 3991. [Google Scholar] [CrossRef]
  52. Ebert, E.E.; Damrath, U.; Wergen, W.; Baldwin, M.E. The WGNE assessment of short-term quantitative precipitation forecasts. Bull. Am. Meteorol. Soc. 2007, 84, 483–494. [Google Scholar] [CrossRef]
  53. Öztopal, A. Forecast verification: A practitioner’s guide in atmospheric science. Meteorol. Atmos. Phys. 2007, 101, 279–280. [Google Scholar]
  54. Thom, H.C.S. A note on the gamma distribution. Mon. Weather Rev. 1958, 86, 117–122. [Google Scholar] [CrossRef]
  55. Aitchison, J.; Brown, J.A.C. The Lognormal Distribution; Cambridge University Press: Cambridge, UK, 1957. [Google Scholar]
  56. Fisher, R.A. On the mathematical foundations of theoretical statistics. Philos. Trans. R. Soc. Lond. A 1922, 222, 309–368. [Google Scholar] [CrossRef]
  57. Weibull, W. A statistical distribution function of wide applicability. J. Appl. Mech. 1951, 18, 293–297. [Google Scholar] [CrossRef]
  58. Johnson, N.L.; Kotz, S.; Balakrishnan, N. Continuous Univariate Distributions, 2nd ed.; Wiley: New York, NY, USA, 1994; Volume 1. [Google Scholar]
  59. Gumbel, E.J. Statistics of Extremes; Columbia University Press: New York, NY, USA, 1958. [Google Scholar]
  60. Pareto, V. Cours d’économie Politique; Rouge: Lausanne, Switzerland, 1896. [Google Scholar]
  61. Jenkinson, A.F. The frequency distribution of the annual maximum (or minimum) values of meteorological elements. Q. J. R. Meteorol. Soc. 1955, 81, 158–171. [Google Scholar] [CrossRef]
  62. Aksu, H.; Akgül, M.A. Performance evaluation of CHIRPS satellite precipitation estimates over Turkey. Theor. Appl. Climatol. 2020, 142, 71–84. [Google Scholar] [CrossRef]
  63. Hisam, E. Evaluation of Grid Based Precipitation Products over the Mediterranean Region in Turkey. M.S. Thesis, İstanbul Technical University, Graduate School, İstanbul, Turkey, 2022. Available online: http://hdl.handle.net/11527/25494 (accessed on 18 October 2024).
  64. Hafizi, H.; Sorman, A.A. Performance assessment of CHIRPSv2.0 and MERRA 2 gridded precipitation datasets over complex topography of Turkey. Environ. Sci. Proc. 2022, 19, 21. [Google Scholar] [CrossRef]
  65. Aksu, H.; Taflan, G.Y.; Yaldiz, S.G.; Akgül, M.A. Evaluation of IMERG for GPM satellite-based precipitation products for extreme precipitation indices over Turkiye. Atmos. Res. 2023, 291, 106826. [Google Scholar] [CrossRef]
  66. Aksu, H.; Yaldiz, S.G.; Taflan, G.Y.; Akgül, M.A. Frequency analysis based on peaks-over-threshold approach for GPM IMERG precipitation product. Theor. Appl. Climatol. 2023, 154, 275–289. [Google Scholar] [CrossRef]
  67. Koçak, R.; Dönmez, S.; Tor, M.A.; Tekeli, A. Utilizing GPM IMERG Early, Late and Final Runs for Flood Estimation over Aralık District, Iğdır City; General Assembly of the International Union of Geodesy and Geophysics (IUGG): Berlin, Germany, 2023. [Google Scholar] [CrossRef]
Figure 1. Location of the Akçay Subbasin Study Area within Türkiye.
Remotesensing 17 03199 g001
Figure 2. Hydrological Map of the Study Area Showing River Systems.
Remotesensing 17 03199 g002
Figure 3. Workflow of Watershed Delineation Using ArcGIS.
Remotesensing 17 03199 g003
Figure 4. (a) Daily Hydrograph of Finike Sub-Basin (1 October 2011–30 September 2015), (b) Monthly precipitation at the Finike Station, (c) Monthly precipitation at the Elmali Station (2005–2018).
Remotesensing 17 03199 g004aRemotesensing 17 03199 g004b
Figure 5. (a) Monthly Precipitation Comparison between Finike Meteorological Station and GPM-IMERG Data, (b) Daily Precipitation Comparison between Finike Meteorological Station and GPM-IMERG Data.
Remotesensing 17 03199 g005
Figure 6. (a) Histogram and PDF Plot for Finike Monthly Precipitation Data with Beta Distribution, (b) CDF Plot for Normalized Monthly Precipitation Data.
Remotesensing 17 03199 g006
Figure 7. (a) Beta Distribution with Threshold Values for Monthly Rainfall Data, (b) Weibull Distribution with Threshold Values for Daily Rainfall Data.
Remotesensing 17 03199 g007
Table 1. Characteristics of Remotely Sensed Datasets Used in the Analysis.
Remote Datasets
(Precipitation)
Temporal CoverageTemporal ResolutionSpatial ResolutionFile Format
CHIRPS (Observation)1981–PresentDaily0.05°netCDF
GPM-IMERG (Observation)2000–PresentDaily, half hourly0.1°netCDF
Table 2. Monthly Analysis Results (1 January 2005 and 31 December 2018).
Statistical MetricsElmaliFinike
CHIRPSGPM-IMERGCHIRPSGPM-IMERG
Correlation Coefficient (r)0.7650.8180.8990.943
Nash-Sutcliffe Efficiency (NSE)−0.993−0.5490.6790.887
Root Mean Square Error (RMSE) (mm)49.68243.80050.81330.146
Percent Bias (PBIAS) (%)71.69865.28319.045−4.870
Mean Absolute Error (MAE) (mm)32.13328.05630.81118.117
Table 3. Daily Analysis Results (1 January 2005 and 31 December 2018).
Statistical MetricsElmaliFinike
CHIRPSGPM-IMERGCHIRPSGPM-IMERG
Correlation Coefficient (r)0.3450.4200.3500.592
Nash-Sutcliffe Efficiency (NSE)−2−0.868−0.6970.239
Root Mean Square Error (RMSE) (mm)7.3675.81212.4558.341
Percent Bias (PBIAS) (%)71.46665.06019.291−4.673
Mean Absolute Error (MAE) (mm)2.3842.0343.7722.632
Table 4. Kolmogorov–Smirnov (K-S) Test Results.
DistributionsMonthly DatasetDaily Dataset
Statisticp-ValueStatisticp-Value
Gamma0.120.0130.420.001
Lognormal0.170.0010.410.001
Normal0.750.0010.540.001
Weibull0.140.0030.360.001
Exponential0.220.0010.750.001
Gumbel0.150.0010.470.001
Pareto0.300.0010.700.001
Beta0.110.0330.430.001
Generalized Extreme Value0.360.0010.580.001
Table 5. Performance Comparison for Monthly and Daily Rainfall Data from Finike Meteorological Station and GPM-IMERG.
Performance MetricsMonthly Comparison
(Finike vs. GPM-IMERG)
Daily Comparison
(Finike vs. GPM-IMERG)
POD (Probability of Detection)0.7780.478
FAR (False Alarm Ratio)0.2220.388
POFD (Probability of False Detection)0.0130.048
CSI (Critical Success Index)0.6360.366
ACC (Accuracy)0.9760.887
Disclaimer/Publisher’s Note: The statements, opinions and data contained in all publications are solely those of the individual author(s) and contributor(s) and not of MDPI and/or the editor(s). MDPI and/or the editor(s) disclaim responsibility for any injury to people or property resulting from any ideas, methods, instructions or products referred to in the content.