Article

Machine Learning-Constrained Semi-Analysis Model for Efficient Bathymetric Mapping in Data-Scarce Coastal Waters

1
State Key Laboratory of Satellite Ocean Environment Dynamics, Second Institute of Oceanography, Ministry of Natural Resources, Hangzhou 310012, China
2
Shanghai Institute of Technical Physics, Chinese Academy of Sciences, Shanghai 200083, China
3
School of Information Science and Technology, Hainan Normal University, Haikou 571158, China
4
Hainan Engineering Research Center for Extended Reality and Digital Intelligent Education, Hainan Normal University, Haikou 571158, China
5
Ocean College, Zhejiang University, Hangzhou 316000, China
6
Key Laboratory of Space Active Opto-Electronics Technology, Shanghai Institute of Technical Physics, Chinese Academy of Sciences, Shanghai 200083, China
*
Author to whom correspondence should be addressed.
Remote Sens. 2025, 17(18), 3179; https://doi.org/10.3390/rs17183179
Submission received: 10 August 2025 / Revised: 5 September 2025 / Accepted: 12 September 2025 / Published: 13 September 2025
(This article belongs to the Special Issue Remote Sensing of Coastal, Wetland, and Intertidal Zones)

Abstract

Highlights

What are the main findings?
  • Substrate classification maps effectively constrain bottom reflectance albedo in the semi-analytical bathymetry inversion algorithm.
  • The improved HOPE-PW achieves promising accuracy in Case I/II transitional waters with a 56% reduction in runtime and 68% lower memory usage.
What is the implication of the main finding?
  • Provides an efficient, practical framework for bathymetric mapping in data-scarce coastal waters without relying on extensive in-situ measurements.
  • Establishes a robust validation paradigm by extending ICESat-2 applications to anthropogenically impacted coastal zones with complex water types.

Abstract

Nearshore bathymetry is critical for coastal management and ecology. While airborne hyperspectral remote sensing provides high-resolution image data, obtaining rapid and accurate bathymetric inversion in coastal areas lacking in situ data remains challenging. The widely used Hyperspectral Optimization Process Exemplar (HOPE) achieves high accuracy but suffers from computational inefficiency, making it impractical for large-scale, high-resolution datasets. By contrast, HOPE-Pure Water (HOPE-PW) offers computational efficiency but exhibits limitations in capturing fine-scale spatial patterns of bottom reflectance (ρ), and its applicability in transitional waters between Case I and II types requires further validation. Against this background, we employed machine learning-based substrate classification (support vector machine, random forest, maximum likelihood) in Wenchang coastal waters, China, to constrain ρ estimation in HOPE-PW, with validation using ICESat-2 data that extends its conventional application scenarios. Results demonstrate that when constrained by the optimal classifier (random forest), HOPE-PW achieves comparable accuracy to HOPE in shallow water while reducing runtime by 56% and memory usage by 68%. However, HOPE-PW exhibits slight underestimation in deeper areas, likely because simplification reduces sensitivity to water optical properties. Future research will focus on this issue. This study proposes an efficient and reliable framework for monitoring and evaluating water depth in areas lacking in situ data, offering a practical solution for integrated coastal zone management.

1. Introduction

Coastal bathymetric data within the 0–20 m depth range constitutes the foundational basis for precision coastal management, directly influencing nearshore navigation safety, ecological conservation, disaster mitigation, and resource development [1,2,3]. This critical depth interval encompasses both ecologically significant systems (coral reefs and seagrass beds providing carbon sequestration and coastal protection) and economically vital areas such as aquaculture zones and coastal tourism belts [3,4,5]. Depth in this zone profoundly impacts marine community health, storm surge erosion patterns, coastal engineering site selection, and small-vessel navigation safety [6,7,8,9]. Traditional bathymetric surveying methods face substantial limitations: shipborne single-beam/multibeam sonar systems deliver high accuracy but are time-intensive, laborious, and impractical for large-scale or remote marine areas [10,11,12]. Satellite multispectral remote sensing offers broad coverage yet is constrained by low spatial/spectral resolution and persistent cloud interference in tropical coastal regions [13]. Even high-resolution satellite sensors providing rich spatial details remain hindered by lengthy revisit cycles and challenges in acquiring cloud-free imagery [5,10]. Within this context, airborne hyperspectral remote sensing demonstrates distinct advantages [14,15]. The technology integrates cost-effectiveness with high resolution while enabling concurrent retrieval of bathymetry and water quality parameters through radiative transfer equations [16,17]. Its flexible mission planning capability effectively mitigates environmental constraints, minimizes atmospheric interference, and ensures high-quality data acquisition—key attributes establishing it as the optimal solution for nearshore ecological mapping and long-term monitoring [18]. Notably, most current remote sensing bathymetry inversion algorithms remain dependent on prior bathymetric data for model training [13,18,19,20,21]. While satellite-derived datasets (e.g., ICESat-2) can substitute in situ measurements in open oceans due to abundant high-quality observations, their applicability in continental coastal zones is severely restricted by satellite orbital cycles, tidal dynamics, and complex topographies [12,19]. Consequently, insufficient satellite data often preclude robust model development, necessitating extensive field measurements, which contradicts the basic objective of remote sensing to reduce fieldwork [22]. Thus, developing radiative transfer inversion algorithms independent of in situ data carries significant scientific and practical importance for these critical coastal regions [23].
Lee et al. pioneered the semi-analytical hyperspectral bathymetric inversion method without requiring in situ data, termed the hyperspectral optimization process exemplar (HOPE), based on radiative transfer theory [17,23]. This model requires bottom reflectance, water depth, and five other inherent optical properties (IOPs) related parameters, using the Levenberg–Marquardt algorithm to minimize discrepancies between forward modeled and observed remote sensing reflectance (Rrs) [14,17]. In recent decades, the refinements to the HOPE have focused on: (1) Bottom reflectance modifications, BRUCE treats substrates as linear combinations of sediment, vegetation, and coral [24], while SAMBUCA expresses substrate spectra as two-endmember linear mixtures with parameterized chlorophyll and colored dissolved organic matter (CDOM) concentrations [25]. (2) Optimization algorithm improvement, MILE and MILEBI incorporate probabilistic models into HOPE [26], whereas RASC-LSD not only accounts for four substrate classes but also employs spectral derivative least squares as the cost function [27]. Subsequently, HOPE-LUT aims to select optimal spectral matches for benthic endmembers [28]. (3) Adaptation of semi-analytical methods to multispectral sensors [29,30,31]. Still, most approaches introduce additional parameters, increasing computational costs, overfitting risks, and relying on impractical prior knowledge of benthic classes [32], while excessively long runtime and high memory consumption with large datasets severely limit their practical utility. The HOPE-PW model addresses these challenges by exploiting strong pure water absorption in the 570–600 nm spectral window, where CDOM absorption is negligible. Moreover, normalized algal absorption and particle backscattering coefficients exhibit spectral invariance, which enables linear approximations in forward modeling [16]. This reduces parameters to four, significantly lowering memory requirements and computational time.
While HOPE-PW has already demonstrated its excellent performance in pristine reef waters [16], its applicability in nearshore environments with mixed substrates and anthropogenic impacts remains unvalidated. Particularly regarding bottom reflectance estimation, HOPE-PW exhibits significant errors in detailed retrieval and fails to capture spatial patterns. This inaccuracy constrains its engineering applications in continental nearshore zones. However, there is an urgent need for efficient, independent solutions for integrated coastal management in situations where bathymetry data are not sufficiently available for accurate modeling. To address this limitation, we propose a ground control point-free bathymetric inversion framework. By incorporating machine learning-derived substrate classification maps to constrain HOPE-PW’s reflectance estimation, due to HOPE’s stability in data-scarce scenarios among many Hyperspectral bathymetric inversion methods, we use it as a reference [33]. Meanwhile, ICESat-2 ATL03 data were employed as validation benchmarks, extending their conventional use in remote reefs to continental seaside zones [10,13,34,35,36,37]. This study establishes a robust and creative validation paradigm for coastal management in regions lacking in situ bathymetric data.

2. Materials and Methods

2.1. Areas of Study

As shown in Figure 1a, the study area is located along the coast of Wenchang City, Hainan Province, China (19°30′–19°33′N, 110°51′–110°54′E), adjacent to the Dongjiao Coconut Plantation tourist zone. The seabed features complex reef distributions and anthropogenic impacts, with water quality inferior to oceanic reef environments (typical bathymetric study areas). As studied by Xu et al., the presence of extensive shrimp farming ponds located near the study area significantly impacts the water quality [38]. Due to practices such as excessive feeding and sediment resuspension from these ponds, certain water quality parameters exceed the standards established for Case 1 waters and instead align with the criteria defining Case 2 waters, as referenced against recognized seawater quality classification standards. Making it suitable for evaluating substrate classification methods and validating bathymetric inversion algorithms in coastal zones.

2.2. Data

2.2.1. Hyperspectral Data

Hyperspectral imagery was acquired using the Airborne Multimodal Spectral Imager Visible and Near-Infrared Module (AMMIS-VNIR), independently developed by the Shanghai Institute of Technical Physics, Chinese Academy of Sciences, and the Anhui Institute of Optics and Fine Mechanics [39]. The AMMIS-VNIR system features 256 spectral bands (400–1000 nm), with an average spectral resolution of 2.4 nm, an instantaneous field of view (IFOV) of 0.25 mrad, spatial resolution of 1 m, and signal-to-noise ratio (SNR) exceeding 500, achieving world-leading technical specifications [39].
This instrument has been widely applied in water quality monitoring, nearshore bathymetry, mineral resource exploration, land use mapping, and atmospheric studies [19,39,40,41,42]. Data acquisition was conducted via a fixed-wing aircraft platform on 1 April 2021, at 15:08 local time, with a flight altitude of 4 km, a speed of 200–240 km/h. The sky condition was clear, the wind speed was low, and the sea surface was stable. Figure 1b displays the geometrically corrected and registered true-color composite image. Figure 1c shows the AMMIS module, which is taken from Jia et al. [39].

2.2.2. Satellite LiDAR Data

The ICESat-2 satellite operates at ~500 km altitude with a 91-day repeat cycle, carrying the ATLAS single-photon LiDAR system that emits six 532 nm laser beams at 10 kHz.
The beams are divided into three pairs: each pair contains strong and weak beams (energy ratio ~ 4:1), spaced 3.3 km cross-track, with intra-pair separation of 90 m, spot diameter of 17 m, and along-track spacing of 0.7 m [43].
Among NASA’s 23 ICESat-2/ATLAS data products (https://icesat-2.gsfc.nasa.gov/science/data-products, accessed on 13 February 2025), we utilized Level 2 Global Geolocated Photon Data Version 6 (ATL03 V6), which provides photon-level latitude, longitude, time, ellipsoid height, and confidence metrics after precise orbit attitude determination and geophysical corrections. Data are accessible at (https://nsidc.org/data/atl03/versions/6, accessed on 13 February 2025). We downloaded all ICESat-2 tracks over the study area since 13 October 2018, selecting trajectories with clear air–water interface signals and minimal noise, ultimately retaining only ATL03_20210724194537_GT2R. The red line in Figure 1b marks the selected laser track.

2.3. Methodology

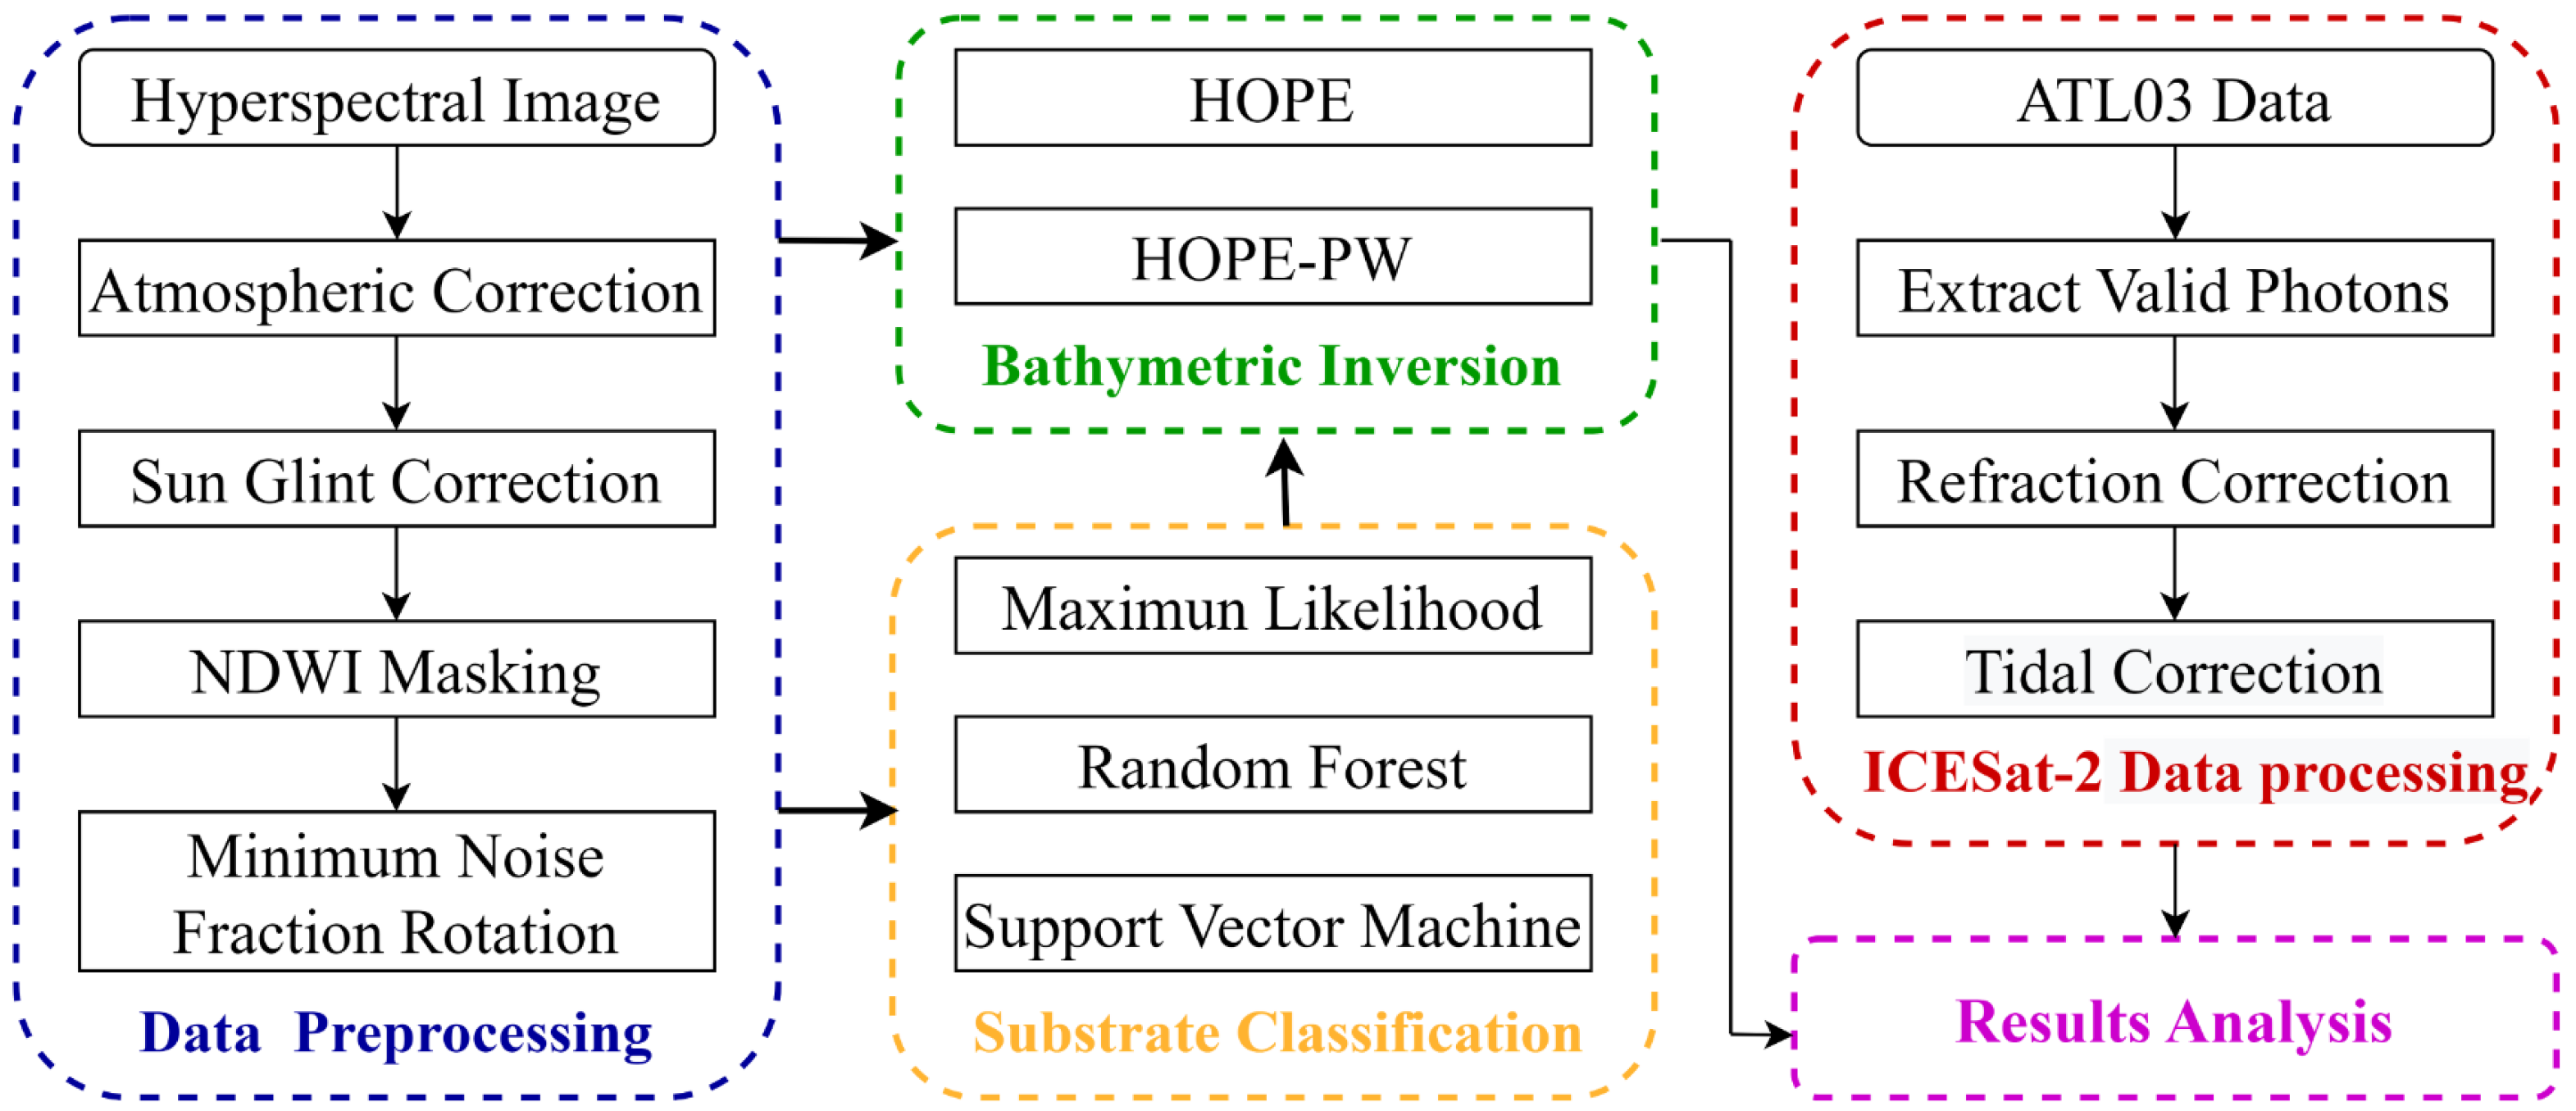
This study integrates airborne hyperspectral data (AMMIS-VNIR) with machine learning substrate classification (RF, SVM, ML), semi-analytical bathymetric inversion algorithms (HOPE, HOPE-PW), and ICESat-2 validation to evaluate the performance in anthropogenically impacted coastal waters. Figure 2 illustrates the data processing workflow.
The acquired hyperspectral raw imagery has undergone radiometric calibration and precise geometric correction. It can directly use preprocessing steps such as atmospheric correction, glint correction, masking, and data dimensionality reduction (MNF). Subsequently, machine learning-based substrate classification was applied to the preprocessed data within selected regions of interest (ROIs), with the highest accuracy results integrated into spectral information for bathymetric inversion using HOPE and HOPE-PW models. Finally, valid ICESat-2 data points were extracted, refraction-corrected following the method of Parrish et al. [44], and tidal-corrected using measured tidal data. These processed data served as reference depths for evaluating and comparing the performance of the two models in nearshore shallow water bathymetry.

2.3.1. Data Processing

Atmospheric correction was performed using the FLAASH module (Fast Line-of-sight Atmospheric Analysis of Spectral Hypercubes) in ENVI software version 5.6. It is based on the MODTRAN 6 radiative transfer model. FLAASH accurately removes atmospheric absorption and scattering effects to retrieve true surface reflectance, demonstrating excellent performance in coastal regions and widespread application in marine remote sensing studies [45,46,47,48]. Glint correction was applied using the method proposed by Kuster et al., which relies on two principles: (1) glint-free water exhibits zero reflectance at 760 nm; (2) the depth of the oxygen absorption feature at 760 nm is proportional to glint intensity [49].
D = R 740 + R 860 / 2 R 760 ,
D n o r m x , y = D / D m a x d e e p ,
R w λ = R λ G λ × D n o r m x , y ,
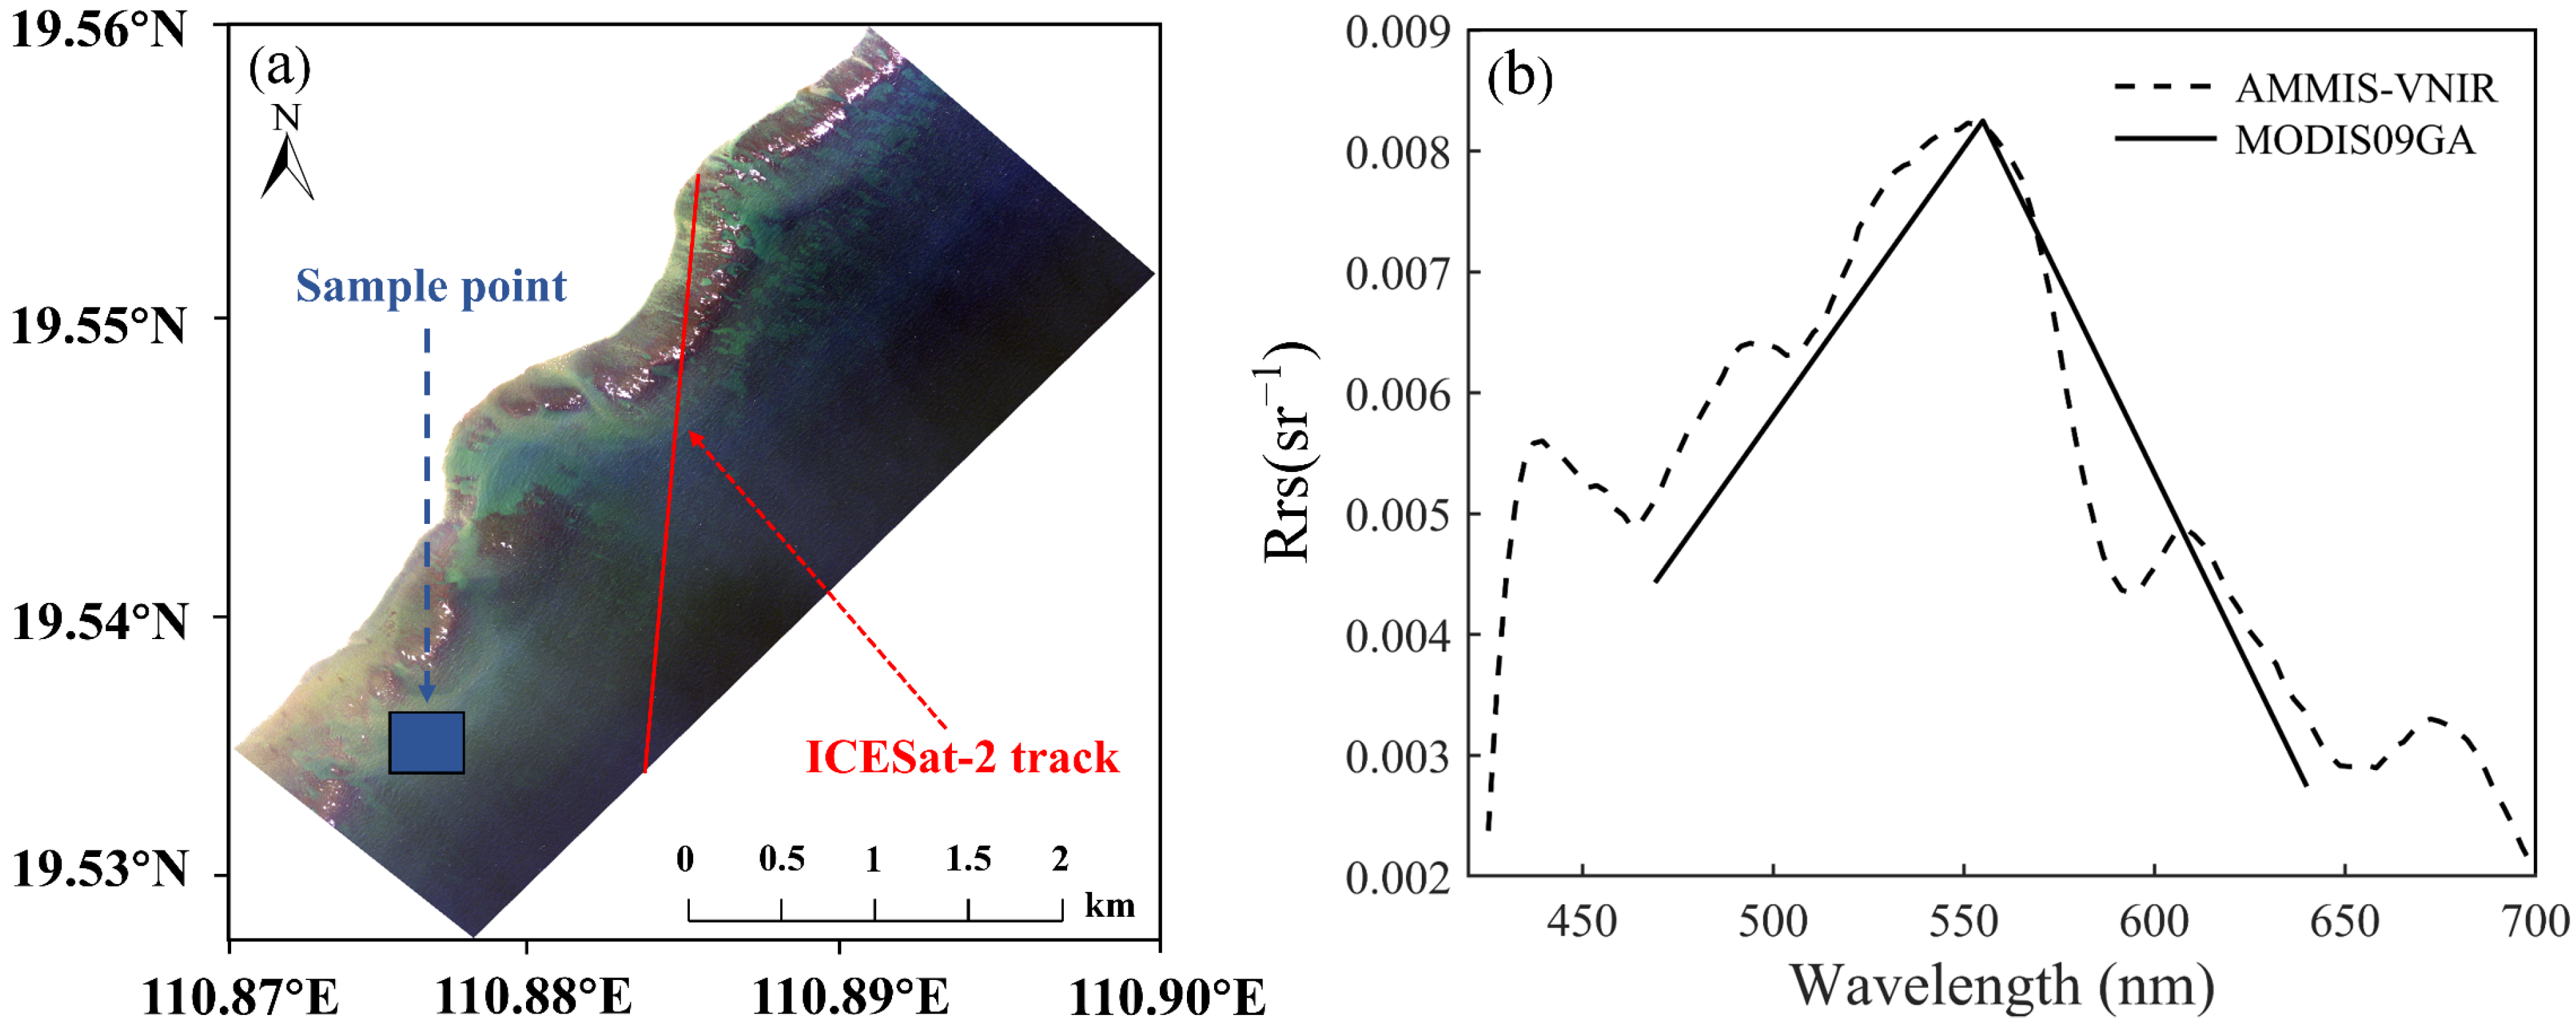
where D denotes the oxygen absorption feature depth, D m a x d e e p represents the maximum D in deep-water pixels, D n o r m x , y quantifies glint intensity distribution, G λ describes the glint spectral signature, R λ is the original reflectance, and R w λ is the glint-corrected reflectance. After glint correction, an NDWI mask was applied to extract water bodies, followed by single-band threshold masking to remove whitecap pixels, with final spectral smoothing using the Savitsky–Golay filter, as shown in Figure 3a.
To validate the accuracy of preprocessed surface reflectance, the MODIS surface reflectance product (MOD09) acquired on the same date was downloaded from NASA (https://ladsweb.modaps.eosdis.nasa.gov, accessed on 17 February 2025) and compared at coordinates 19°31′44″N, 110°52′35″E. The agreement shown in Figure 3b confirms the accuracy of our preprocessing workflow, enabling subsequent analyses.
To enhance classification accuracy and computational efficiency, the Minimum Noise Fraction (MNF) transformation was applied to extract principal components, with the first eight bands (capturing > 95% variance) selected as inputs for classification algorithms. Given the absence of ground control points, ROIs were manually delineated through visual interpretation with advice from local marine science experts. A total of 1023 sand substrate training samples and 1042 validation samples, along with 1089 coral reef training samples and 987 validation samples, were uniformly distributed across the study area.
For ICESat-2 ATL03 for validation purposes, data products were processed using the open-source tool PhoREAL-v3.30 (https://github.com/icesat-2UT/PhoREAL, accessed on 18 February 2025) to extract photon latitude, longitude, ellipsoid height, and confidence values. Photons with a confidence level of four were selected for subsequent noise removal. Sea surface photons were identified through the Gaussian fitting of elevation histograms, where the histogram peak defined the instantaneous sea surface elevation [34,36]. Photons within three standard deviations of the peak were classified as sea surface returns. Subsurface photons were denoised using a density-based spatial clustering algorithm (DBSCAN), where photons exceeding neighborhood density thresholds were retained as seafloor signals [34,36]. Manual outlier removal was performed to ensure data fidelity. The Parrish method was applied to correct photon elevations for water refraction effects [44]. Temporal discrepancies between LiDAR and hyperspectral acquisitions were resolved using tidal corrections from the National Marine Data and Information Service platform (https://global-tide.nmdis.org.cn/Default.html, accessed on 24 April 2025) to align datasets.

2.3.2. Machine Learning-Based Substrate Classification

Although deep learning-based substrate classification has gained increasing attention, its high annotation costs, computational demands, and incompatibility with a priori inputs from semi-analytical algorithms led us to adopt machine learning methods for this study. Table 1 summarizes coastal substrate classification studies for the past five years, detailing remote sensing platforms, classification models, and maximum operational depths. The analysis reveals that machine learning-based substrate classification methods are applicable to both multispectral and hyperspectral sensors and can partially overcome water column electromagnetic interference for high-precision underwater substrate mapping [6,45,48,50]. Furthermore, supervised classification dominates coastal habitat mapping, with support vector machine (SVM) employed in eight studies (four times achieve optimal performance), random forest (RF) in five studies (four times), maximum likelihood (ML) in five studies (three times), spectral angle mapper and artificial neural networks in three studies each (one times). This study selects SVM, RF, and ML—the most frequently used and best performing classifiers—for substrate classification, with optimal results determined by overall accuracy (OA) and Kappa coefficient comparisons for subsequent bathymetric inversion.
SVM operates by identifying an optimal hyperplane that separates distinct classes while maximizing inter-class margins, utilizing kernel functions to map linearly inseparable samples into higher-dimensional feature spaces for effective classification. RF employs ensemble learning through bootstrap sampling to train multiple decision trees, with random feature subset selection at each node to enhance generalization. Classification outcomes are determined by majority voting across all trees. ML constructs likelihood functions describing the probability distribution of observed data under given parameters, then derives optimal parameters through maximum likelihood estimation to classify new samples effectively.
Upon completion of the classification process, the generated sediment classification map assigns a specific substrate type to each pixel. This categorical information is then directly utilized in the subsequent semi-analytical bathymetry inversion phase to select the corresponding endmember sediment spectrum. This selection provides essential constraints on the plausible range of bottom reflectance values, enhancing the stability and accuracy of the water depth retrieval by reducing solution ambiguity.

2.3.3. Semi-Analytical Bathymetric Inversion Models

Semi-analytical algorithms comprise three components: a forward model of remote sensing reflectance (Rrs), IOPs parameterization, and spectral matching inversion methods [17,23]. The forward model first decomposes subsurface remote sensing reflectance into deep water and shallow water contributions:
r r s λ ; a , b b , H , ρ 0.084 + 0.170 u λ u λ × 1 e x p 1 cos θ w + 1.03 1 + 2.4 u λ 0.5 cos θ v a λ + b b λ H + ρ λ π e x p 1 cos θ w + 1.04 1 + 5.4 u λ 0.5 cos θ v a λ + b b λ H
u λ = b b λ / a λ + b b λ
where r r s represents subsurface Rrs, a λ denotes the seawater absorption coefficient, b b λ is the seawater backscattering coefficient, θ w and θ v respectively are subsurface solar and sensor zenith angles, which can correct the effects of the solar angles in different seasons. It then converts the subsurface remote sensing reflectance to sea surface remote sensing reflectance:
R r s m o d 0.5 r r s 1 1.5 r r s
where R r s m o d denotes modeled sea surface Rrs. With provided IOP parameters, the forward model generates sea surface Rrs. Then Levenberg–Marquardt algorithm minimizes the cost function by iteratively adjusting variables to reduce discrepancies between modeled and measured Rrs, expressed as
e r r = R r s m e a s R r s m o d 2 R r s m e a s
where R r s m e a s denotes measured sea surface Rrs.
HOPE-PW retains the forward model and cost function but modifies the water optical parameterization [16,17]. It operates exclusively within the 570–600 nm spectral range for depth retrieval. In that spectral window, pure water absorption increases dramatically, with the combined contribution of pure water and chlorophyll absorption exceeding 80% across varying chlorophyll concentrations. At the same time, CDOM’s contribution is negligible, mean-normalized phytoplankton absorption and scattering coefficients exhibit minimal spectral variability (±10% for absorption, ±5% for particle backscattering), demonstrating flat spectral shapes. Normalized bottom reflectance spectra similarly show <10% spectral variation, mirroring IOP characteristics. Based on these observations, the water optical model is
a λ = a w λ + a p h y λ = a w λ + P
b b λ = b b w λ + b b p λ = b b w λ + X
ρ = B
where a w λ denotes pure water absorption coefficient [54], a p h y λ represents chlorophyll absorption coefficient, b b w λ represents pure water backscattering coefficient, b b p λ is particle backscattering coefficient. Parameters P , X and B separately represent the mean values of a p h y λ , b b p λ and ρ over 570–600 nm. Table 2 compares the water optical parameterization differences between HOPE and HOPE-PW. Table 3 specifies the initial values and constraints for the nonlinear optimization of both models.
HOPE-PW initially assumed a constant mean reflectance for all substrate types within the 570–600 nm band due to observed minimal spectral variation there, theoretically allowing water depth retrieval independent of substrate type. In practice, this simplification may not adequately capture the spatial transformations of different substrates. We selected a small spatial subregion of the image for comparison of bottom reflectance estimates. Figure 4a,b shows the true color image of the subregion and the classification map used for substrate constraints, respectively. Without the constraint of substrate spectra, the estimated ρ in HOPE-PW tends to exhibit more noise and failed to capture the spatial patterns of the substrate (Figure 4c). In contrast, incorporating substrate type and spectral constraints yields significantly improved ρ estimates (Figure 4d). Furthermore, with the help of substrate constraints, the sandy substrate achieved higher reflectance, which is more reasonable.

2.3.4. Evaluating the Accuracy of Results

Multiple evaluations were employed as metrics to assess models’ performance. For substrate classification, Overall Accuracy (OA) and the Kappa coefficient were used. OA quantifies global classification correctness, while the Kappa coefficient accounts for random agreement and class imbalance, collectively offering a robust assessment of result consistency and reliability. The best substrate map was treated as input to semi-analytical algorithms. The behavior of bathymetric inversion was evaluated through linear regression analysis between model-derived depths and ICESat-2 elevations. The root mean square error (RMSE), mean absolute error (MAE), mean absolute percentage error (MAPE), and coefficient of correlation (R2) were calculated to holistically assess prediction accuracy through goodness of fit and error magnitude analysis. In addition, Kolmogorov–Smirnov normality tests were further applied to residuals, leveraging their statistical power for small sample validation of distribution normality and model reliability assessment. To comprehensively evaluate computational efficiency, we employed two critical metrics: Throughput (processing pixels per second) and Memory Footprint (Resident Set Size).
O A = 1 N j = 1 k x j j
K a p p a = N j = 1 k x j j j = 1 k ( x j + × x + j ) N 2 j = 1 k ( x j + × x + j )
R 2 = 1 i = 1 n y ^ i y i 2 i = 1 n y ¯ i y i 2
R M S E = 1 n i = 1 n y ^ i y i 2
M A E = 1 n i = 1 n y ^ i y i
M A P E = 100 % n i = 1 n y ^ i y i y i
T h r o u g h p u t = N / t
where x j j is the number of pixels in class j were correctly classified, x j + is the total number of pixels predicted to be j , x + j is the number of pixels that are true to j , N is the total number of all pixels, n is the number of matching points, and y ^ i is water depth data inverted from a hyperspectral image. y i is ICESat-2 validated water depth data. y ¯ i is the average water depth data. t is the total running time.

3. Results

3.1. Substrate Classification Results

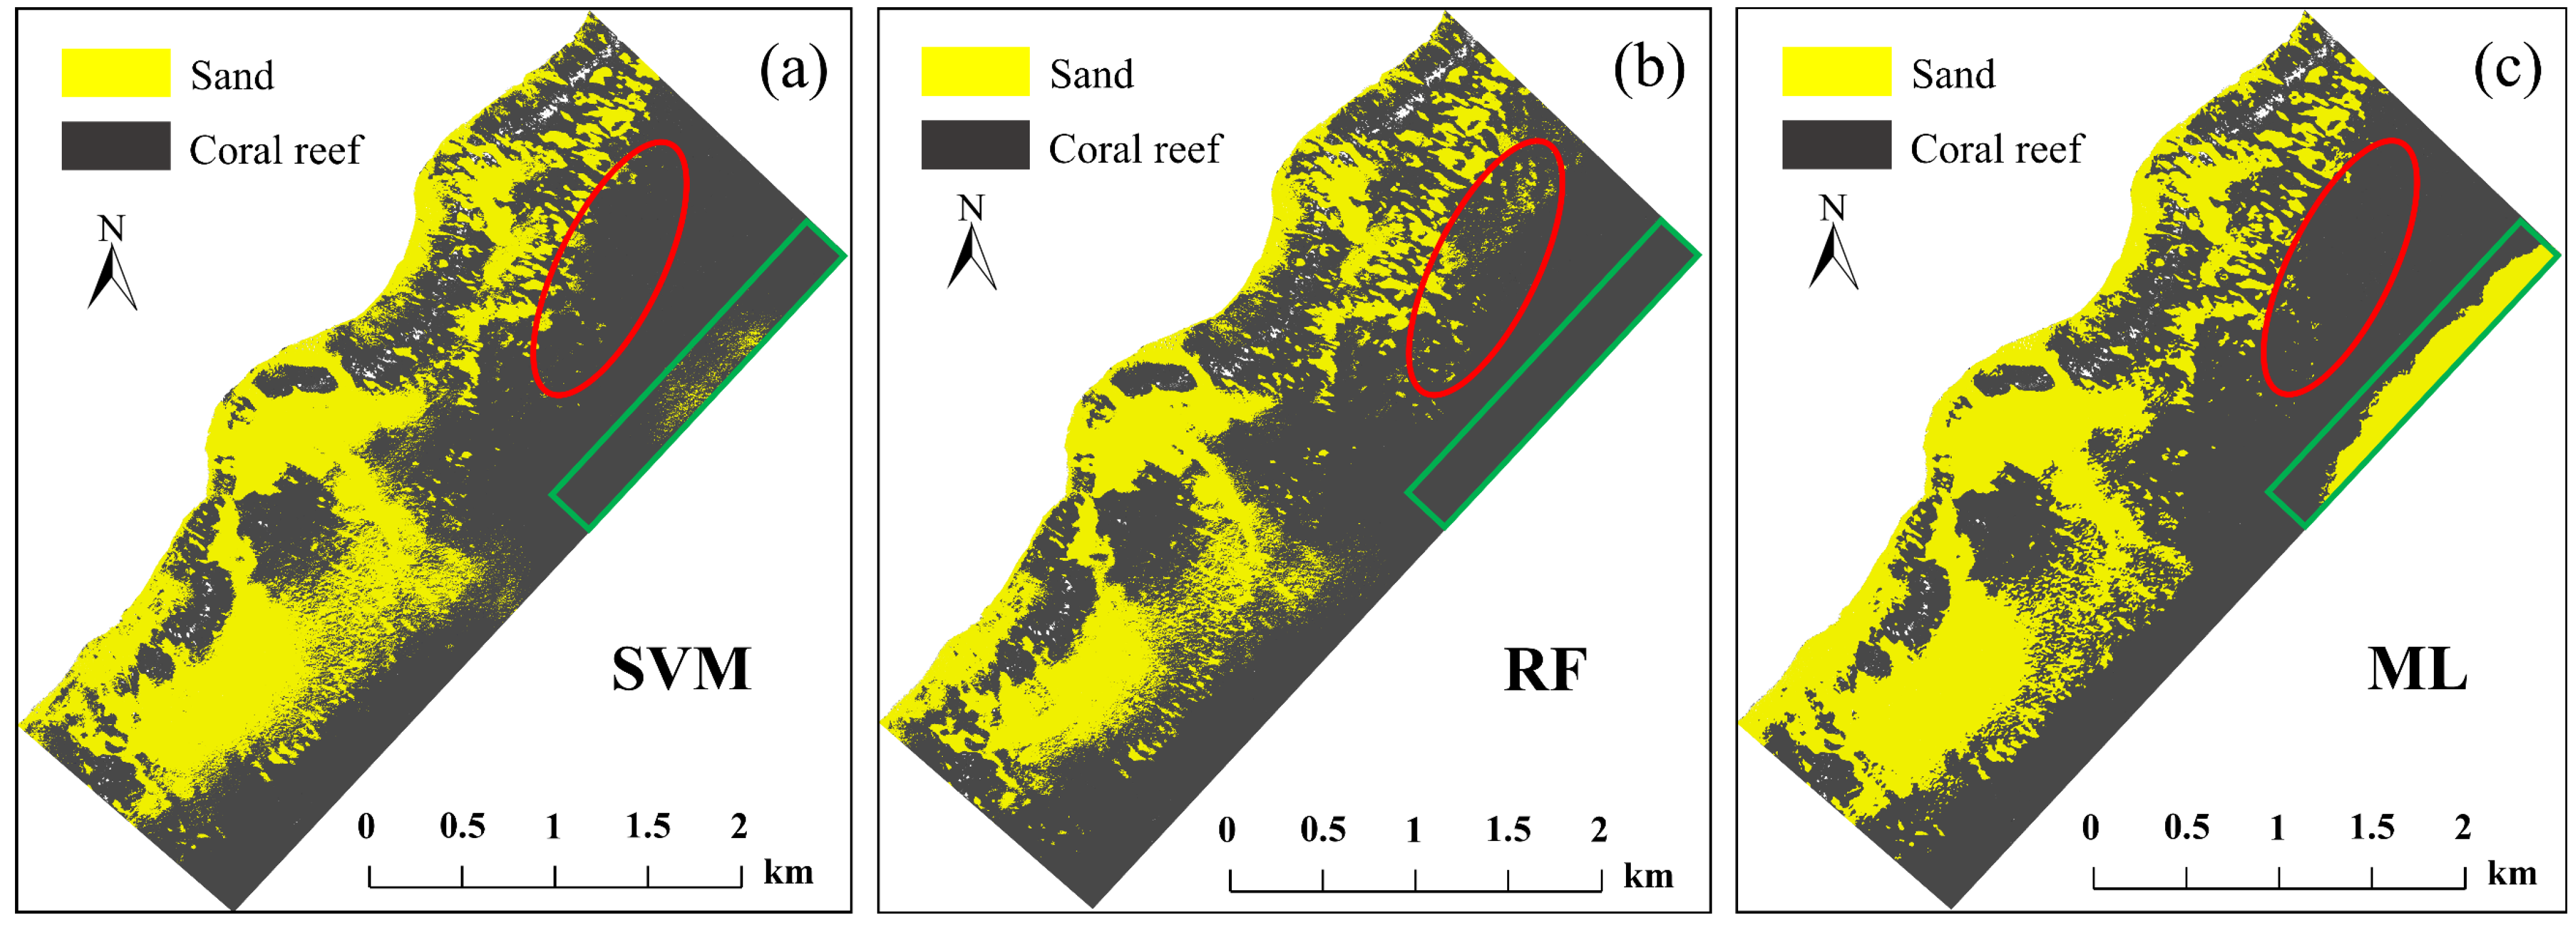
SVM, RF, and ML models are applied to MNF transformed hyperspectral image and compared to select the best performing results as input for the next step. Figure 5a–c visually compares 1 × 1 m resolution substrate classification maps from three classifiers. All of them produced broadly consistent spatial patterns aligned with true color airborne imagery and high-resolution Google Earth data, showing high agreement in very shallow waters but diverging significantly in deeper regions.
The main differences are marked by red circles (have test ROIs) and green squares (no test ROIs). In the red circle area, combined with the true color image (Figure 1b), RF provides richer detail of substrate distribution, and in the deeper area of the water column, RF has a better ability to capture the bright reflectivity characteristics of sand, more effectively minimizing the impact of the water body. In contrast, both SVM and ML misclassified sandy substrates as coral reef substrates in this region, losing bottom distribution details. In the green square box in the southeast corner, water is so deep that it is not possible to truly tell the substrate distribution from the water surface. In that case, the pixels in this area are not involved in the evaluation. And SVM classified a few pixels as sand, RF classified all as coral reef substrate, and ML classified most as sand substrate. Metrics of the different classifiers in Table 4 demonstrate RF’s superiority (OA: 96.76%, Kappa: 0.93), outperforming SVM (91.49%, 0.89) and ML (86.47%, 0.83). The highest performing RF classification (Figure 1b) was selected for bathymetric inversion, with sand and coral classified pixels assigned substrate-specific normalized reflectance spectra.

3.2. Bathymetric Inversion Results

The spectral data and RF substrate classification map were input into HOPE and HOPE-PW to derive bathymetry results, followed by the application of a 3 × 3 mean filter to eliminate high frequency noise, as shown in Figure 6. These algorithms process data on a pixel-by-pixel basis. Consequently, the spatial resolution (1 × 1 m) and coverage area (7.9 km2) of the depth results are consistent with those of the input imagery. The maximum water depths output by HOPE (Figure 6a) and HOPE-PW (Figure 6b) were 6.95 m and 7.07 m, respectively. Since this study focuses on evaluating bathymetric performance, the inversion results for phytoplankton absorption coefficient a p h y λ and particle backscattering coefficient b b p λ are not presented.
Spatially, both models captured a prominent southwest-to-northeast gradient, with deeper waters in the eastern region and shallower waters in the west. When combined with the substrate classification map (Figure 5b), it was observed that in extremely shallow areas (0–3 m), depth inversion results for sandy pixels were deeper than those for coral reef pixels. This suggests that both models effectively resolve fine scale nearshore bathymetric details. However, as water depth increases, differences between the models become more pronounced, particularly in the southern region. This divergence is especially evident in the depth estimates produced by HOPE-PW, which may be attributed to its modeling approach that emphasizes the optical properties of water in specific spectral bands. In the southeastern corner of the image, corresponding to the green box in Figure 5, the seabed conditions are visually indiscernible. Under uniform water quality conditions, this area should represent the maximum depth across the entire image. Nevertheless, neither HOPE nor HOPE-PW accurately reflected this expectation, with HOPE-PW exhibiting a more significant underestimation.
Notably, despite the absence of in situ bathymetric data for calibration, both algorithms performed robustly in heterogeneous seabed environments. A key advantage of HOPE-PW lies in its simplified parameter design, which substantially reduces computational demands. For processing 20,177,506 pixels, HOPE-PW achieved a 56% reduction in processing time and a 68% decrease in memory usage compared to HOPE. This efficiency makes it particularly suitable for large-scale coastal mapping applications.

3.3. Quantitative Validation

To quantitatively validate the performance of the inversion algorithms in turbid waters, the model-derived coastal bathymetry was linearly regression and cross-sectionally analyzed against photon elevations extracted from the ICESat-2 ATL03 dataset, with results presented in Figure 7. It should be noted that, compared to island reef regions, the ICESat-2 ATL03 product exhibited a generally sparse photon distribution in the study area. This sparsity poses challenges to the validation process. It is likely due to factors such as nearshore water quality, tides, or satellite overpass timing. Only the initial 1 km segment of ATL03_20210724194537_GT2R displayed a reliable photon elevation distribution, consequently, photons within this segment were selected as validation data.
As shown in Figure 7a, data from both models are widely scattered around the 1:1 line. The HOPE model achieved good performance (R2: 0.53, RMSE: 0.38 m, MAE: 0.30 m, and MAPE: 19.9%) while the HOPE-PW model yielded comparable results (R2: 0.47, RMSE: 0.48 m, MAE: 0.32 m, and MAPE: 21.1%). However, the R2 is relatively small. Several factors may account for the low R2 values. First, in extremely shallow water areas (0–3 m), high concentrations of suspended particulate matter can influence the particulate backscattering coefficient ( b b p λ ) and, subsequently, the Rrs. Thereby, power function models and linear models (Table 2) may be hard to accurately describe these spectral impacts. Second, the ICESat-2 data and hyperspectral data were not acquired simultaneously, over the three-year interval, the seabed morphology may have changed due to wave action. In summary, an R2 ~ 0.5 is considered reasonable for complex water bodies [19]. Arranging the points from Figure 7a by along-track distance produced the bathymetric profile shown in Figure 7b. Given that the ICESat-2 ground track crosses an underwater reef, the depth profile exhibits a distinct deep-shallow-deep pattern, which both models successfully characterized.
Integrating the spatial patterns (Figure 6a) with the cross-sensor validation (Figure 7a) demonstrates that both algorithms can resolve meter-scale topographic features critical for coastal zone management.
To assess the applicability of semi-analytical algorithms in complex water bodies and determine whether structural deficiencies exist, we conducted a detailed analysis of the residuals between model predicted and validation values. The residual distribution in extremely shallow water areas (0–3 m) is illustrated in Figure 7c,d. Initial observations from the scatter plot (Figure 7c) reveals a random dispersion around zero (black reference line), with no apparent trends or heteroscedasticity. For the HOPE model, 60.1% of residuals fell within a ±10% error range, and 88.5% within ±20%. Similarly, the HOPE-PW model recorded 58.9% within ±10% and 87.6% within ±20%. However, over 80% of the residuals for HOPE-PW were negative, indicating a systematic underestimation of depth in shallow waters (0–3 m).
To further validate the distribution characteristics, the residual histogram (Figure 7d) demonstrates symmetric, bell-shaped patterns that closely align with the normal distribution curve. Both models passed the Kolmogorov–Smirnov normality tests. These findings suggest that the errors are primarily due to random factors rather than structural flaws in the physical model, while also affirming the applicability of the linear water optical model in continental coastal waters. Nevertheless, the consistent underestimation by HOPE-PW highlights its greater dependence on sensor signal-to-noise ratio and data preprocessing quality.

4. Discussion

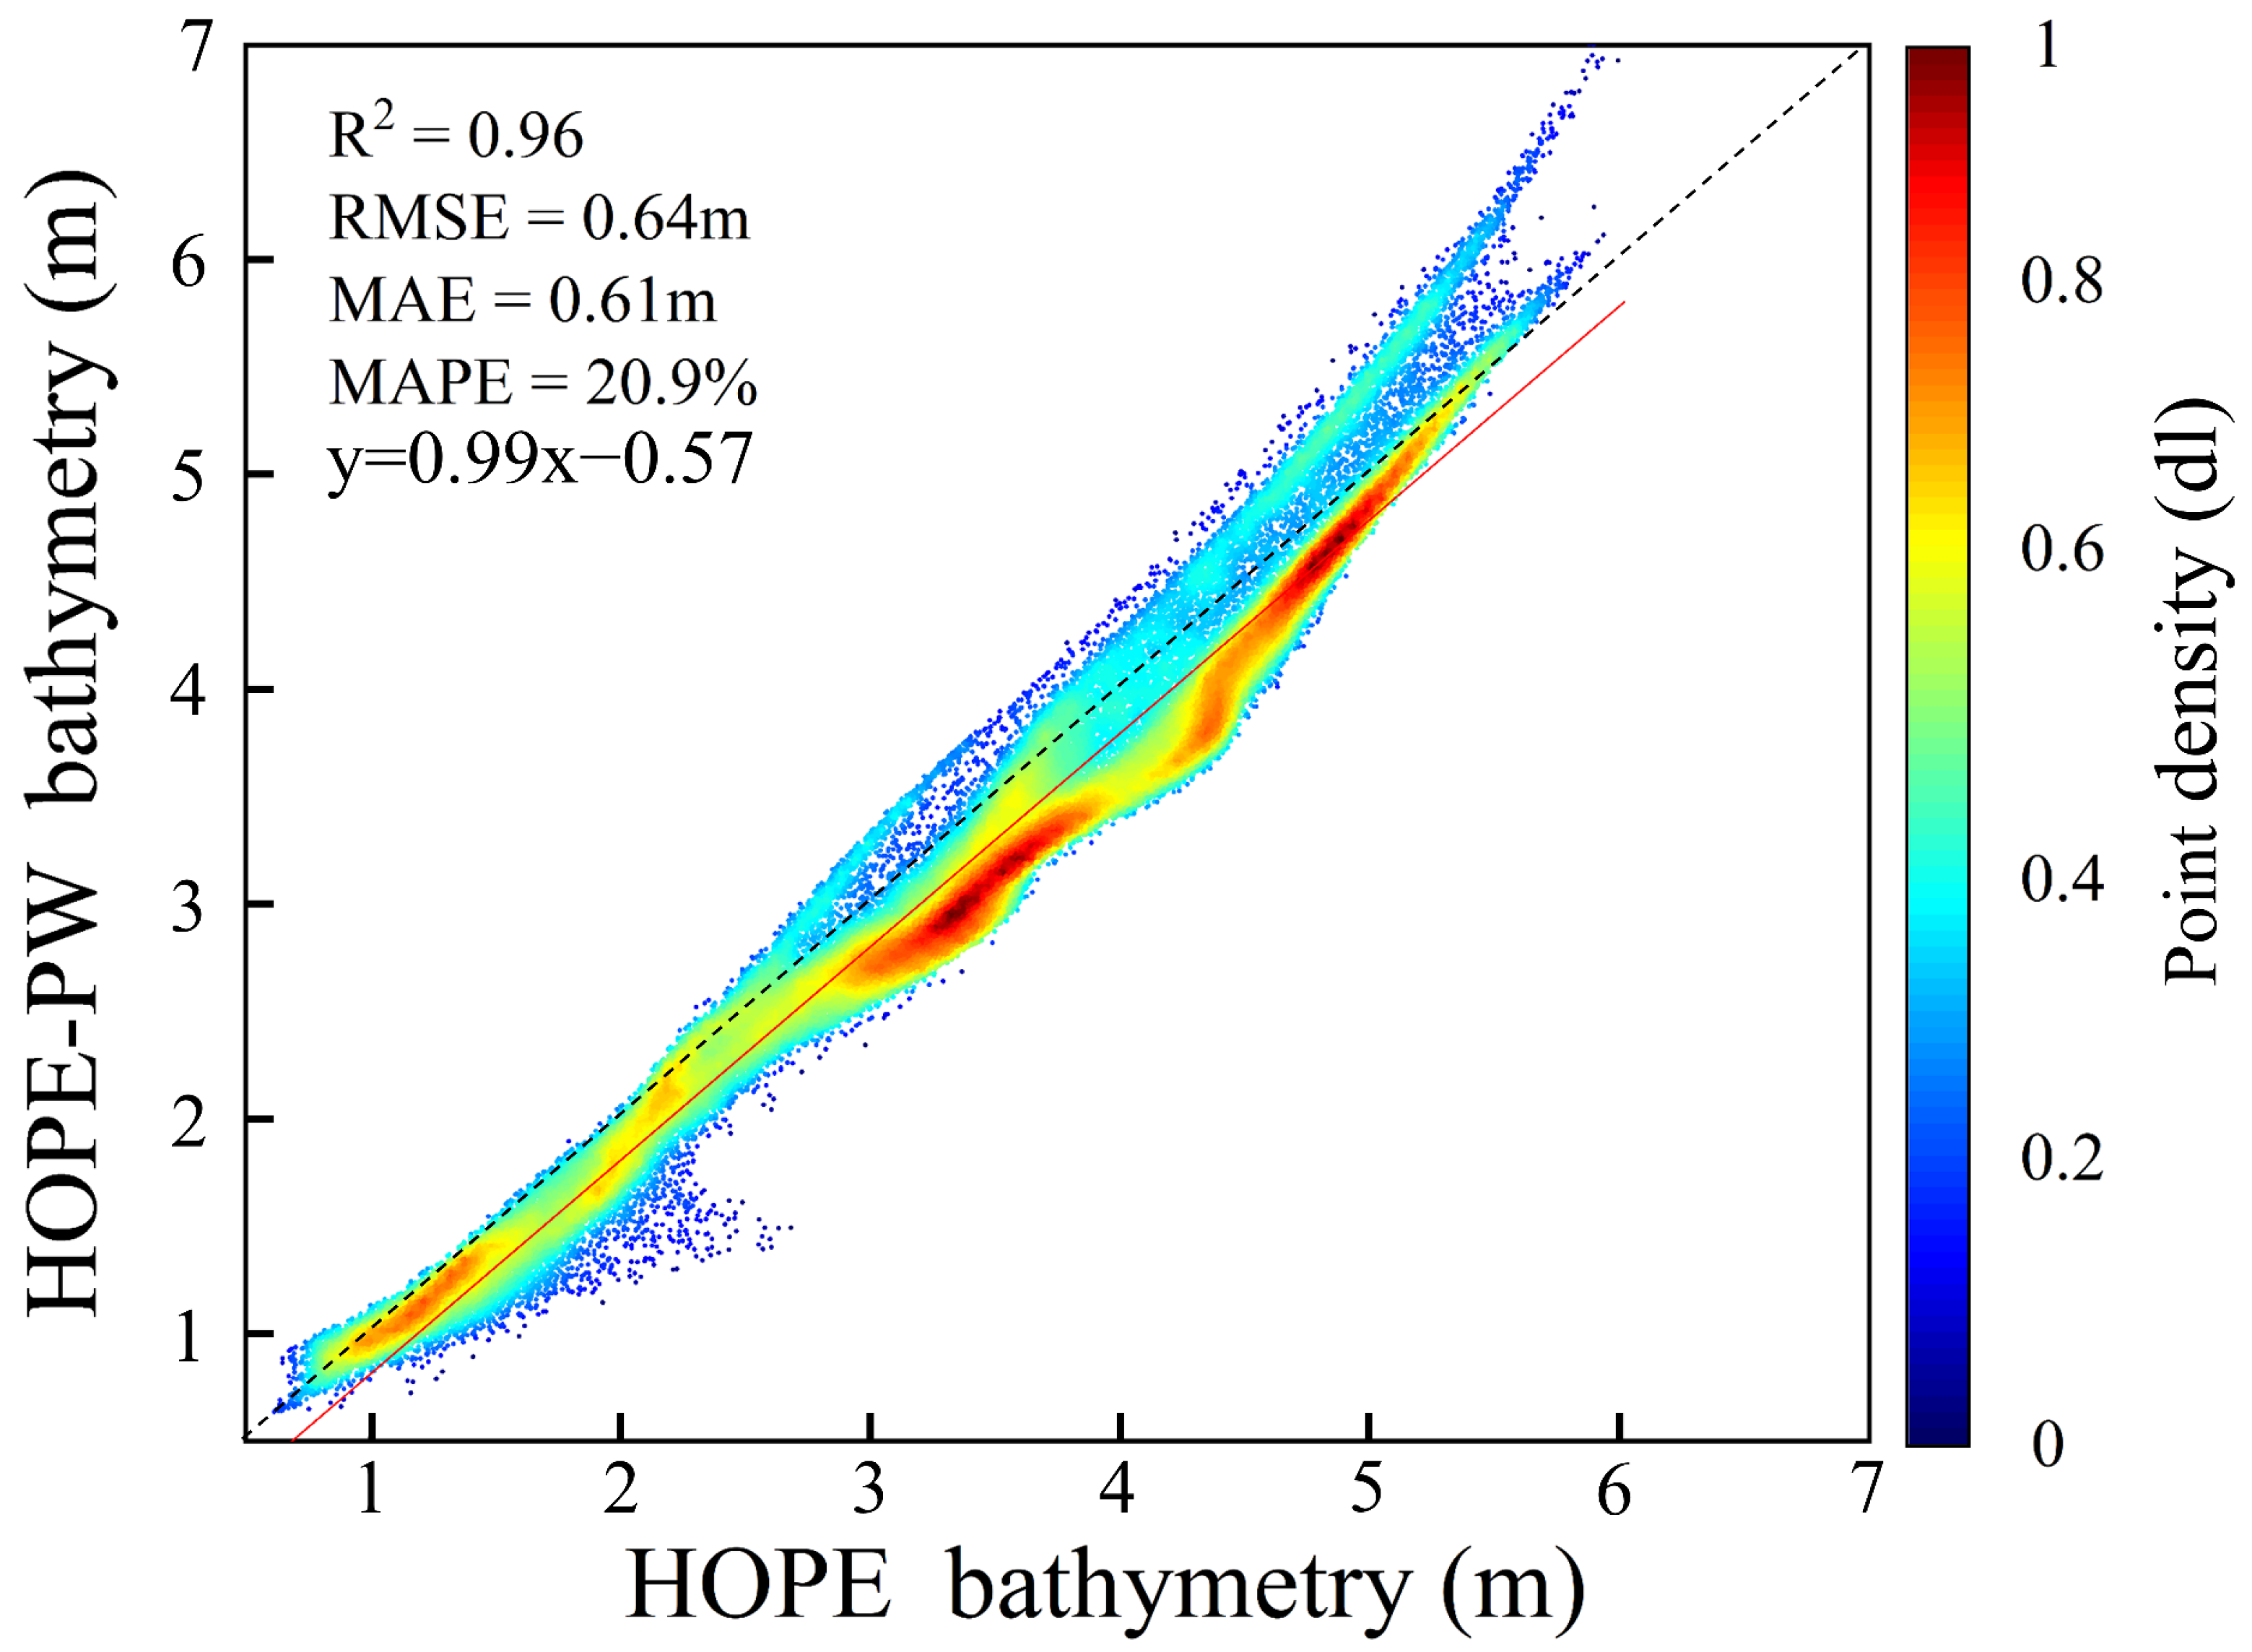
Due to the absence of validation data for deeper water areas, a pixel-by-pixel comparison of the bathymetric inversion results from HOPE and HOPE-PW was conducted in Figure 8. All data points are distributed around the 1:1 line, indicating a very strong linear relationship between the two methods (R2: 0.96). When combined with the analysis from Figure 7, this demonstrates that a simple linear water optical model (HOPE-PW) in specific spectral bands and the help of substrate classification maps constraining the bottom reflectance albedo estimation performs comparably to the more complex model (HOPE) with minimal errors introduced by the linear assumption. In shallow waters (0–3 m), two algorithms exhibit similar performance (R2 ~ 0.5, RMSE ~ 0.4 m, MAE ~ 0.3 m, MAPE ~ 20%). Yet, when compared in deeper waters (3–7 m), despite a high linear correlation, significant differences persist and data points become more dispersed, revealing a certain depth dependence of the bathymetric error. This discrepancy may stem from the limited contribution of bottom-reflected Rrs in this region. Specifically, HOPE-PW relies exclusively on spectral information from the 570–600 nm range, where electromagnetic waves are strongly absorbed by the water column, resulting in depth undervaluation. These findings suggest that the performance of water depth retrieval models based on strong water absorption in deeper waters requires further investigation.
The comprehensive comparison results are presented in Table 5. We can clearly see that the performance of the two models is similar for the accuracy metrics, but the differences in throughput and memory footprint are large, with HOPE-PW reducing the time to process each pixel by 56.35% and reducing the Resident set size by close to 68%, compared to HOPE.
In summary, HOPE-PW achieves performance comparable to HOPE while reducing parameter complexity and greatly improving operational efficiency, validating its capability to retrieve bathymetry in anthropogenically degraded waters. However, the relatively low accuracy values of the models and the observed underestimation by HOPE-PW in deeper waters may be attributed to multiple factors: (1) the influence of the particulate scattering phase function within the 570–600 nm band; (2) the absorption effects of colored dissolved organic matter (CDOM); and (3) wave-induced sediment resuspension, which can significantly affect optical properties, especially in dynamic coastal environments.

5. Conclusions

This study advances coastal bathymetric mapping through the integrated use of airborne hyperspectral data and ICESat-2 satellite LiDAR data for inversion and validation in the anthropogenically impacted coastal waters of Wenchang City, Hainan Province, China. We established the first validation of HOPE-PW’s applicability in mainland coastal waters with transitional Class I/II water quality, thereby extending the algorithm’s operational scope beyond the clear Case-1 waters for which it was originally designed [38]. Furthermore, by fusing machine learning classifiers (SVM, RF, ML) with semi-analytical models (HOPE, HOPE-PW), we overcame HOPE-PW’s fine-scale bottom reflectance estimation limitations (Figure 4) while drastically reducing computational time and memory demands (Table 5). And we extended ICESat-2 validation (typically confined to open-ocean or island-reef settings) to this complex mainland coastal environment. Critically, our integrated approach resolves core challenges in data-sparse coastal zones. The methodology eliminates dependency on extensive in situ bathymetric data for model construction, while concurrently leveraging globally accessible ICESat-2 data to establish robust validation where field surveys are infeasible. Collectively, this creates a convenient, robust, and highly data-efficient bathymetric mapping framework. The paradigm delivers substantial practical utility for coastal research and management, particularly in regions lacking in situ bathymetric data.
Results demonstrated that the RF classifier achieved the best substrate classification performance (OA: 96.76%, Kappa coefficient: 0.93) better than SVM and ML. With the constraint of bottom classification, bathymetric inversions revealed comparable performance between HOPE and HOPE-PW, successfully resolving fine-scale depth gradients aligned with the substrate map. Quantitative validation against ICESat-2 data showed in ultra shallow waters, HOPE achieved a little higher accuracy (R2: 0.53, RMSE: 0.38 m, MAE: 0.30, MAPE: 19.9%) compared to HOPE-PW (R2: 0.47, RMSE: 0.48 m, MAE: 0.32, MAPE: 21.1%). And over 80% residuals for HOPE-PW are negative were observed in Figure 7c, implying the existence of systematic underestimation. However, through Kolmogorov–Smirnov normality tests, it was confirmed that this error is not due to model construction issues but is likely influenced by random uncertainties. In this case, despite HOPE-PW’s accuracy being slightly lower, its linear model assumption does not introduce significant errors compared to the more complex HOPE power function model. On the contrary, it reduces computation time by 56% and memory footprint by nearly 68%, and its computational efficiency makes it particularly suitable for high-resolution, large-scale bathymetry in coastal waters.
Future investigations should address the impacts of scattering phase function variations and environmental noise on HOPE-PW to enhance its applicability, precision, and explore whether depth calibration can mitigate the underestimation behavior of HOPE-PW in deeper waters. Furthermore, integrating multi-source remote sensing data and expanded field measurements could further optimize model performance, strengthening technical support for coastal monitoring and ecosystem management.

Author Contributions

Conceptualization, Q.W. and X.Z.; methodology, Q.W.; software, Z.W. and Q.W.; validation, Q.W., C.H. and P.X.; formal analysis, Q.W.; investigation, Z.M.; resources, L.Z.; data curation, Y.W. and C.Z.; writing—original draft preparation, Q.W.; writing—review and editing, Q.W. and X.Z.; visualization, Q.W.; supervision, Z.M. and X.Z.; project administration, Z.M.; funding acquisition, Z.M. All authors have read and agreed to the published version of the manuscript.

Funding

This research was supported in part by the National Natural Science Foundation of China grant number 61991454, in part by the National Key Research and Development Program of China grant number 2023YFC3107605, in part by the Oceanic Interdisciplinary Program of Shanghai Jiao Tong University grant number SL2022ZD206 and in part by the Scientific Research Fund of Second Institute of Oceanography, MNR grant number SL2302.

Data Availability Statement

Data are contained within the article.

Acknowledgments

The authors would like to thank the NASA Earthdata Search website for providing the ICESat-2 products.

Conflicts of Interest

The authors declare no conflicts of interest.

References

  1. Muir, P.R.; Wallace, C.C.; Done, T.; Aguirre, J.D. Limited Scope for Latitudinal Extension of Reef Corals. Science 2015, 348, 1135–1138. [Google Scholar] [CrossRef] [PubMed]
  2. Ferrario, F.; Beck, M.W.; Storlazzi, C.D.; Micheli, F.; Shepard, C.C.; Airoldi, L. The Effectiveness of Coral Reefs for Coastal Hazard Risk Reduction and Adaptation. Nat. Commun. 2014, 5, 3794. [Google Scholar] [CrossRef]
  3. Sondak, C.F.A.; Ang, P.O.; Beardall, J.; Bellgrove, A.; Boo, S.M.; Gerung, G.S.; Hepburn, C.D.; Hong, D.D.; Hu, Z.; Kawai, H.; et al. Carbon Dioxide Mitigation Potential of Seaweed Aquaculture Beds (SABs). J. Appl. Phycol. 2017, 29, 2363–2373. [Google Scholar] [CrossRef]
  4. Roelfsema, C.; Kovacs, E.; Ortiz, J.C.; Wolff, N.H.; Callaghan, D.; Wettle, M.; Ronan, M.; Hamylton, S.M.; Mumby, P.J.; Phinn, S. Coral Reef Habitat Mapping: A Combination of Object-Based Image Analysis and Ecological Modelling. Remote Sens. Environ. 2018, 208, 27–41. [Google Scholar] [CrossRef]
  5. Lugendo, B.; Wegoro, J.; Shaghude, Y.; Pamba, S.; Makemie, M.; Hollander, J. Seagrass Mapping across the Coast of Tanzania. Ocean. Coast. Manag. 2024, 253, 107169. [Google Scholar] [CrossRef]
  6. Mederos-Barrera, A.; Marcello, J.; Eugenio, F.; Hernández, E. Seagrass Mapping Using High Resolution Multispectral Satellite Imagery: A Comparison of Water Column Correction Models. Int. J. Appl. Earth Obs. Geoinf. 2022, 113, 102990. [Google Scholar] [CrossRef]
  7. Qin, X.; Wu, Z.; Luo, X.; Shang, J.; Zhao, D.; Zhou, J.; Cui, J.; Wan, H.; Xu, G. MuSRFM: Multiple Scale Resolution Fusion Based Precise and Robust Satellite Derived Bathymetry Model for Island Nearshore Shallow Water Regions Using Sentinel-2 Multi-Spectral Imagery. ISPRS J. Photogramm. Remote Sens. 2024, 218, 150–169. [Google Scholar] [CrossRef]
  8. Tejaswi, A.; Sahoo, B.; Kale, R.V.; Murty, P.L.N.; Mohanty, A. A Method for Simulating Coastal Inundation and Inland Flooding by Integrating Inland Hydrology with Ocean Hydrodynamics. Nat. Hazards 2025, 121, 8827–8848. [Google Scholar] [CrossRef]
  9. Diruit, W.; Le Bris, A.; Bajjouk, T.; Richier, S.; Helias, M.; Burel, T.; Lennon, M.; Guyot, A.; Ar Gall, E. Seaweed Habitats on the Shore: Characterization through Hyperspectral UAV Imagery and Field Sampling. Remote Sens. 2022, 14, 3124. [Google Scholar] [CrossRef]
  10. Xu, N.; Wang, L.; Zhang, H.-S.; Tang, S.; Mo, F.; Ma, X. Machine Learning Based Estimation of Coastal Bathymetry From ICESat-2 and Sentinel-2 Data. IEEE J. Sel. Top. Appl. Earth Obs. Remote Sens. 2024, 17, 1748–1755. [Google Scholar] [CrossRef]
  11. Zuo, X.; Teng, J.; Su, F.; Duan, Z.; Yu, K. Multimodel Combination Bathymetry Inversion Approach Based on Geomorphic Segmentation in Coral Reef Habitats Using ICESat-2 and Multispectral Satellite Images. IEEE J. Sel. Top. Appl. Earth Obs. Remote Sens. 2025, 18, 3267–3280. [Google Scholar] [CrossRef]
  12. Rende, S.F.; Bosman, A.; Di Mento, R.; Bruno, F.; Lagudi, A.; Irving, A.D.; Dattola, L.; Giambattista, L.D.; Lanera, P.; Proietti, R.; et al. Ultra-High-Resolution Mapping of Posidonia oceanica (L.) Delile Meadows through Acoustic, Optical Data and Object-Based Image Classification. J. Mar. Sci. Eng. 2020, 8, 647. [Google Scholar] [CrossRef]
  13. Zhong, J.; Sun, J.; Lai, Z. ICESat-2 and Multispectral Images Based Coral Reefs Geomorphic Zone Mapping Using a Deep Learning Approach. IEEE J. Sel. Top. Appl. Earth Obs. Remote Sens. 2024, 17, 6085–6098. [Google Scholar] [CrossRef]
  14. Lee, Z.; Carder, K.L.; Chen, R.F.; Peacock, T.G. Properties of the Water Column and Bottom Derived from Airborne Visible Infrared Imaging Spectrometer (AVIRIS) Data. J. Geophys. Res. 2001, 106, 11639–11651. [Google Scholar] [CrossRef]
  15. Valdazo, J.; Ferrer, N.; Vega, C.; Martín, J.; Luque, Á.; Bergasa, O. Mapping Marine Habitats in a Shallow Beach-Reef Environment Combining Direct Methods and Hyperspectral Remote Sensing. Ocean. Coast. Manag. 2024, 255, 107231. [Google Scholar] [CrossRef]
  16. Wu, Z.; Tao, B.; Mao, Z.; Huang, H. Bathymetry Retrieval Algorithm Based on Hyperspectral Features of Pure Water Absorption From 570 to 600 Nm. IEEE Trans. Geosci. Remote Sens. 2023, 61, 5503219. [Google Scholar] [CrossRef]
  17. Lee, Z.; Carder, K.L.; Mobley, C.D.; Steward, R.G.; Patch, J.S. Hyperspectral Remote Sensing for Shallow Waters: 2 Deriving Bottom Depths and Water Properties by Optimization. Appl. Opt. 1999, 38, 3831. [Google Scholar] [CrossRef]
  18. Ashphaq, M.; Srivastava, P.K.; Mitra, D. Review of Near-Shore Satellite Derived Bathymetry: Classification and Account of Five Decades of Coastal Bathymetry Research. J. Ocean Eng. Sci. 2021, 6, 340–359. [Google Scholar] [CrossRef]
  19. Wu, Z.; Zhao, Y.; Wu, S.; Chen, H.; Song, C.; Mao, Z.; Shen, W. Satellite-Derived Bathymetry Using a Fast Feature Cascade Learning Model in Turbid Coastal Waters. J. Remote Sens. 2024, 4, 0272. [Google Scholar] [CrossRef]
  20. Lyzenga, D.R. Remote Sensing of Bottom Reflectance and Water Attenuation Parameters in Shallow Water Using Aircraft and Landsat Data. Int. J. Remote Sens. 1981, 2, 71–82. [Google Scholar] [CrossRef]
  21. Stumpf, R.P.; Holderied, K.; Sinclair, M. Determination of Water Depth with High-resolution Satellite Imagery over Variable Bottom Types. Limnol. Oceanogr. 2003, 48, 547–556. [Google Scholar] [CrossRef]
  22. Poursanidis, D.; Traganos, D.; Reinartz, P.; Chrysoulakis, N. On the Use of Sentinel-2 for Coastal Habitat Mapping and Satellite-Derived Bathymetry Estimation Using Downscaled Coastal Aerosol Band. Int. J. Appl. Earth Obs. Geoinf. 2019, 80, 58–70. [Google Scholar] [CrossRef]
  23. Lee, Z.; Carder, K.L.; Mobley, C.D.; Steward, R.G.; Patch, J.S. Hyperspectral Remote Sensing for Shallow Waters. I. A Semianalytical Model. Appl. Opt. 1998, 37, 6329. [Google Scholar] [CrossRef]
  24. Klonowski, W.M. Retrieving Key Benthic Cover Types and Bathymetry from Hyperspectral Imagery. J. Appl. Remote Sens. 2007, 1, 011505. [Google Scholar] [CrossRef]
  25. Brando, V.E.; Anstee, J.M.; Wettle, M.; Dekker, A.G.; Phinn, S.R.; Roelfsema, C. A Physics Based Retrieval and Quality Assessment of Bathymetry from Suboptimal Hyperspectral Data. Remote Sens. Environ. 2009, 113, 755–770. [Google Scholar] [CrossRef]
  26. Jay, S.; Guillaume, M.; Minghelli, A.; Deville, Y.; Chami, M.; Lafrance, B.; Serfaty, V. Hyperspectral Remote Sensing of Shallow Waters: Considering Environmental Noise and Bottom Intra-Class Variability for Modeling and Inversion of Water Reflectance. Remote Sens. Environ. 2017, 200, 352–367. [Google Scholar] [CrossRef]
  27. Petit, T.; Bajjouk, T.; Mouquet, P.; Rochette, S.; Vozel, B.; Delacourt, C. Hyperspectral Remote Sensing of Coral Reefs by Semi-Analytical Model Inversion—Comparison of Different Inversion Setups. Remote Sens. Environ. 2017, 190, 348–365. [Google Scholar] [CrossRef]
  28. Garcia, R.A.; Lee, Z.; Hochberg, E.J. Hyperspectral Shallow—Water Remote Sensing with an Enhanced Benthic Classifier. Remote Sens. 2018, 10, 147. [Google Scholar] [CrossRef]
  29. Lee, Z.; Weidemann, A.; Arnone, R. Combined Effect of Reduced Band Number and Increased Bandwidth on Shallow Water Remote Sensing: The Case of WorldView 2. IEEE Trans. Geosci. Remote Sens. 2013, 51, 2577–2586. [Google Scholar] [CrossRef]
  30. Liu, Y.; Deng, R.; Qin, Y.; Cao, B.; Liang, Y.; Liu, Y.; Tian, J.; Wang, S. Rapid Estimation of Bathymetry from Multispectral Imagery without in Situ Bathymetry Data. Appl. Opt. 2019, 58, 7538. [Google Scholar] [CrossRef]
  31. Xia, H.; Li, X.; Zhang, H.; Wang, J.; Lou, X.; Fan, K.; Shi, A.; Li, D. A Bathymetry Mapping Approach Combining Log-Ratio and Semianalytical Models Using Four-Band Multispectral Imagery Without Ground Data. IEEE Trans. Geosci. Remote Sens. 2020, 58, 2695–2709. [Google Scholar] [CrossRef]
  32. Vahtmäe, E.; Paavel, B.; Kutser, T. How Much Benthic Information Can Be Retrieved with Hyperspectral Sensor from the Optically Complex Coastal Waters? J. Appl. Rem. Sens. 2020, 14, 016504. [Google Scholar] [CrossRef]
  33. Dekker, A.G.; Phinn, S.R.; Anstee, J.; Bissett, P.; Brando, V.E.; Casey, B.; Fearns, P.; Hedley, J.; Klonowski, W.; Lee, Z.P.; et al. Intercomparison of Shallow Water Bathymetry, Hydro-optics, and Benthos Mapping Techniques in Australian and Caribbean Coastal Environments. Limnol. Ocean. Methods 2011, 9, 396–425. [Google Scholar] [CrossRef]
  34. Chen, Y.; Le, Y.; Zhang, D.; Wang, Y.; Qiu, Z.; Wang, L. A Photon-Counting LiDAR Bathymetric Method Based on Adaptive Variable Ellipse Filtering. Remote Sens. Environ. 2021, 256, 112326. [Google Scholar] [CrossRef]
  35. Sun, S.; Chen, Y.; Mu, L.; Le, Y.; Zhao, H. Improving Shallow Water Bathymetry Inversion through Nonlinear Transformation and Deep Convolutional Neural Networks. Remote Sens. 2023, 15, 4247. [Google Scholar] [CrossRef]
  36. Ma, Y.; Xu, N.; Liu, Z.; Yang, B.; Yang, F.; Wang, X.H.; Li, S. Satellite-Derived Bathymetry Using the ICESat-2 Lidar and Sentinel-2 Imagery Datasets. Remote Sens. Environ. 2020, 250, 112047. [Google Scholar] [CrossRef]
  37. Xie, C.; Chen, P.; Zhang, S.; Huang, H. Nearshore Bathymetry from ICESat-2 LiDAR and Sentinel-2 Imagery Datasets Using Physics-Informed CNN. Remote Sens. 2024, 16, 511. [Google Scholar] [CrossRef]
  38. Xu, B.; Zhang, J.; Lang, S.; Chen, S.; Wu, Z.; Wang, D. Ecological Status and Degradation Factors in Seagrass Meadows along the Coast of Wenchang, Hainan. J. Appl. Oceanogr. 2022, 4, 614–624. [Google Scholar] [CrossRef]
  39. Jia, J.; Wang, Y.; Zheng, X.; Yuan, L.; Li, C.; Cen, Y.; Si, F.; Lv, G.; Wang, C.; Wang, S.; et al. Design, Performance, and Applications of AMMIS: A Novel Airborne Multimodular Imaging Spectrometer for High-Resolution Earth Observations. Engineering 2025, 47, 38–56. [Google Scholar] [CrossRef]
  40. Xi, L.; Si, F.; Jiang, Y.; Zhou, H.; Zhan, K.; Chang, Z.; Qiu, X.; Yang, D. First High-Resolution Tropospheric NO2 Observations from the Ultraviolet Visible Hyperspectral Imaging Spectrometer (UVHIS). Atmos. Meas. Technol. 2021, 14, 435–454. [Google Scholar] [CrossRef]
  41. Liu, C.; Xu, R.; Xie, F.; Jin, J.; Yuan, L.; Lv, G.; Wang, Y.; Li, C.; Wang, J. New Airborne Thermal-Infrared Hyperspectral Imager System: Initial Validation. IEEE J. Sel. Top. Appl. Earth Obs. Remote Sens. 2020, 13, 4149–4165. [Google Scholar] [CrossRef]
  42. Niu, C.; Tan, K.; Wang, X.; Du, P.; Pan, C. A Semi-Analytical Approach for Estimating Inland Water Inherent Optical Properties and Chlorophyll a Using Airborne Hyperspectral Imagery. Int. J. Appl. Earth Obs. Geoinf. 2024, 128, 103774. [Google Scholar] [CrossRef]
  43. Markus, T.; Neumann, T.; Martino, A.; Abdalati, W.; Brunt, K.; Csatho, B.; Farrell, S.; Fricker, H.; Gardner, A.; Harding, D.; et al. The Ice, Cloud, and Land Elevation Satellite-2 (ICESat-2): Science Requirements, Concept, and Implementation. Remote Sens. Environ. 2017, 190, 260–273. [Google Scholar] [CrossRef]
  44. Parrish, C.; Magruder, L.; Neuenschwander, A.; Forfinski-Sarkozi, N.; Alonzo, M.; Jasinski, M. Validation of ICESat-2 ATLAS Bathymetry and Analysis of ATLAS’s Bathymetric Mapping Performance. Remote Sens. 2019, 11, 1634. [Google Scholar] [CrossRef]
  45. Vahtmäe, E.; Kotta, J.; Lõugas, L.; Kutser, T. Mapping Spatial Distribution, Percent Cover and Biomass of Benthic Vegetation in Optically Complex Coastal Waters Using Hyperspectral CASI and Multispectral Sentinel-2 Sensors. Int. J. Appl. Earth Obs. Geoinf. 2021, 102, 102444. [Google Scholar] [CrossRef]
  46. Le Quilleuc, A.; Collin, A.; Jasinski, M.F.; Devillers, R. Very High-Resolution Satellite-Derived Bathymetry and Habitat Mapping Using Pleiades-1 and ICESat-2. Remote Sens. 2021, 14, 133. [Google Scholar] [CrossRef]
  47. Widya, L.K.; Kim, C.-H.; Do, J.-D.; Park, S.-J.; Kim, B.-C.; Lee, C.-W. Comparison of Satellite Imagery for Identifying Seagrass Distribution Using a Machine Learning Algorithm on the Eastern Coast of South Korea. J. Mar. Sci. Eng. 2023, 11, 701. [Google Scholar] [CrossRef]
  48. Wilson, K.L.; Wong, M.C.; Devred, E. Comparing Sentinel-2 and WorldView-3 Imagery for Coastal Bottom Habitat Mapping in Atlantic Canada. Remote Sens. 2022, 14, 1254. [Google Scholar] [CrossRef]
  49. Kutser, T.; Vahtmäe, E.; Praks, J. A Sun Glint Correction Method for Hyperspectral Imagery Containing Areas with Non-Negligible Water Leaving NIR Signal. Remote Sens. Environ. 2009, 113, 2267–2274. [Google Scholar] [CrossRef]
  50. Wicaksono, P.; Aryaguna, P.A.; Lazuardi, W. Benthic Habitat Mapping Model and Cross Validation Using Machine-Learning Classification Algorithms. Remote Sens. 2019, 11, 1279. [Google Scholar] [CrossRef]
  51. Bakirman, T.; Gumusay, M.U. Assessment of Machine Learning Methods for Seagrass Classification in the Mediterranean. Balt. J. Mod. Comput. 2020, 8, 315–326. [Google Scholar] [CrossRef]
  52. Marcello, J.; Eugenio, F.; Gonzalo-Martin, C.; Rodriguez-Esparragon, D.; Marques, F. Advanced Processing of Multiplatform Remote Sensing Imagery for the Monitoring of Coastal and Mountain Ecosystems. IEEE Access 2021, 9, 6536–6549. [Google Scholar] [CrossRef]
  53. Hafizt, M.; Yuwono, D.M.; Janwar, Z.; Suyarso; Wouthuyzen, S. Benthic Habitat Mapping for Estimating Seagrass Carbon Stock across Takabonerate Islands, Indonesia. Reg. Stud. Mar. Sci. 2024, 77, 103703. [Google Scholar] [CrossRef]
  54. Smith, R.C.; Baker, K.S. Optical Properties of the Clearest Natural Waters (200–800 Nm). Appl. Opt. 1981, 20, 177. [Google Scholar] [CrossRef]
Figure 1. (a) Location of the study area (red boxes). (b) True color imagery of hyperspectral (R: 665 nm, G: 555 nm, B: 451 nm). (c) Image of the AMMIS (Image taken from Jia et al. [39]).
Remotesensing 17 03179 g001
Figure 2. Flowchart of this work.
Remotesensing 17 03179 g002
Figure 3. (a) True color image after preprocessing (R: 665 nm, G: 555 nm, B: 451 nm). (b) Spectral comparison after preprocessing.
Remotesensing 17 03179 g003
Figure 4. Comparison of bottom reflectance estimates. (a) True-color image of the subregion (R: 665 nm, G: 555 nm, B: 451 nm). (b) Corresponding substrate classification map, (c) HOPE-PW reflectance ( ρ ) estimation without classification constraints, and (d) HOPE-PW reflectance ( ρ ) estimation with substrate classification constraints.
Remotesensing 17 03179 g004
Figure 5. Substrate classification results of different classifiers (red circle and green square are the main difference areas): (a) SVM, (b) RF, and (c) ML.
Remotesensing 17 03179 g005
Figure 6. (a) HOPE model bathymetric inversion result, (b) HOPE-PW model bathymetric inversion result.
Remotesensing 17 03179 g006
Figure 7. Quantitative analysis. (a) Comparison between models invert bathymetry and ICESat-2 bathymetry; (b) Along track bathymetric profile; (c) Scatter plot of residual distribution; (d) Histogram of residual distribution.
Remotesensing 17 03179 g007
Figure 8. The inversion of water bathymetry between HOPE-PW and HOPE.
Remotesensing 17 03179 g008
Table 1. Classification of machine learning substrates in recent years.
AuthorsPlatformClassifierMax Depth
Poursanidis et al. (2019) [22]Sentinel-2SVM, RF30 m
Wicaksono et al. (2019) [50]WorldView-2RF, DT, SVM7 m
Vahtmäe et al. (2020) [32]CASI-2MD, ML, SAM7.6 m
Bakirman et al. (2020) [51]WorldView-2RF, SVM20 m
Rende et al. (2020) [12]Pleiades-1KNN, RT, DT10 m
Marcello et al. (2021) [52]Sentinel-2, Pika-L, WorldView-2ML, SVM, SAM20 m
Vahtmäe et al. (2021) [45]CASI-2, Sentinel-2MD3 m
Le Quilleuc et al. (2021) [46]Pleiades-1ANN, ML, SVM15 m
Diruit et al. (2022) [9]HySpexML, SAM9 m
Mederos-Barrera et al. (2022) [6]WorldView-2, WorldView-3GNB, SVM, KNN35 m
Wilson et al. (2022) [48]Sentinel-2, WorldView-3RF/
Widya et al. (2023) [47]Geoeye-1, Sentinel-2, Landsat-8SVM10 m
Valdazo et al. (2024) [15]Pika-LML1.5 m
Hafizt et al. (2024) [53]Sentinel-2ANN/
Lugendo et al. (2024) [5]Sentinel-2RF, SVM, ANN25 m
Bold indicates the optimal model in their research. ANN: artificial neural network; DT: decision tree; GNB: gaussian naive bayes; KNN: K-nearest neighbors; MD: minimum distance; ML: maximum likelihood; RF: random forest; SAM: spectral angle mapper; SVM: support vector machine.
Table 2. Comparison between HOPE and HOPE-PW water optical parameterization.
ParametersHOPEHOPE-PW
Wavelength400–675 and 750–800 nm570–600 nm
R r s f ( P , G , X , B , Y , S , H ) f ( P , X , B , H )
a p h y ( λ ) [ a 0 ( λ ) + a 1 ( λ ) ln P ] P P
a C D O M λ G e S ( λ 400 )
b b p ( λ ) X ( 400 / λ ) Y X
ρ B ρ + λ B
Optimization R r s m e a s R r s m o d 2 R r s m e a s
Table 3. Initial values for nonlinear optimization and limits of retrieved variables.
HOPEHOPE-PW
ParameterInitial Value(Min, Max)Initial Value(Min, Max)
P   ( m 1 ) 0.072 × R r s 440 R r s 550 1.7 (0, 1) 0.005 × R r s 585 R r s 570 1.7 (0, 0.01)
G   ( m 1 ) P (0, 1)
X   ( m 1 ) 30 × a w ( 640 ) × R r s ( 640 ) (0, 0.2)0(0, 0.05)
B 0.6(0, 1)0.6(0, 1)
H   ( m ) 3(0, 20)3(0, 20)
S 0.015 + 0.002 / ( 0.6 + R r s ( 440 ) / R r s ( 550 ) )(0, 1)
Y 3.44 × ( 1 3.17 × e x p ( 2.01 × R r s ( 440 ) / R r s ( 490 ) ) ) (0, 2)
Table 4. Comparison of classification results.
ClassifierOverall AccuracyKappa Coefficient
SVM91.49%0.89
RF96.76%0.93
ML86.47%0.83
Bold indicates best performance model in this research.
Table 5. Statistics on the results of different inversion bathymetry.
MetricsHOPEHOPE-PW
R20.530.47
RMSE (m)0.380.48
MAE (m)0.300.32
MAPE (%)19.821.1
Throughput (pixel·s−1)0.093590.04085
Resident Set Size (GB)16.245.20
Disclaimer/Publisher’s Note: The statements, opinions and data contained in all publications are solely those of the individual author(s) and contributor(s) and not of MDPI and/or the editor(s). MDPI and/or the editor(s) disclaim responsibility for any injury to people or property resulting from any ideas, methods, instructions or products referred to in the content.