Assessing the Aromatic-Driven Glyoxal Formation and Its Interannual Variability in Summer and Autumn over Eastern China
Abstract
1. Introduction
2. Materials and Methods
2.1. WRF-CMAQ Modeling System
2.2. Observation Data
2.2.1. In Situ Observation
2.2.2. Satellite Data
3. Results
3.1. Model Validation
3.2. Formaldehyde and Glyoxal Column Concentrations
3.3. Contribution of Aromatics to Glyoxal
4. Conclusions
- (1)
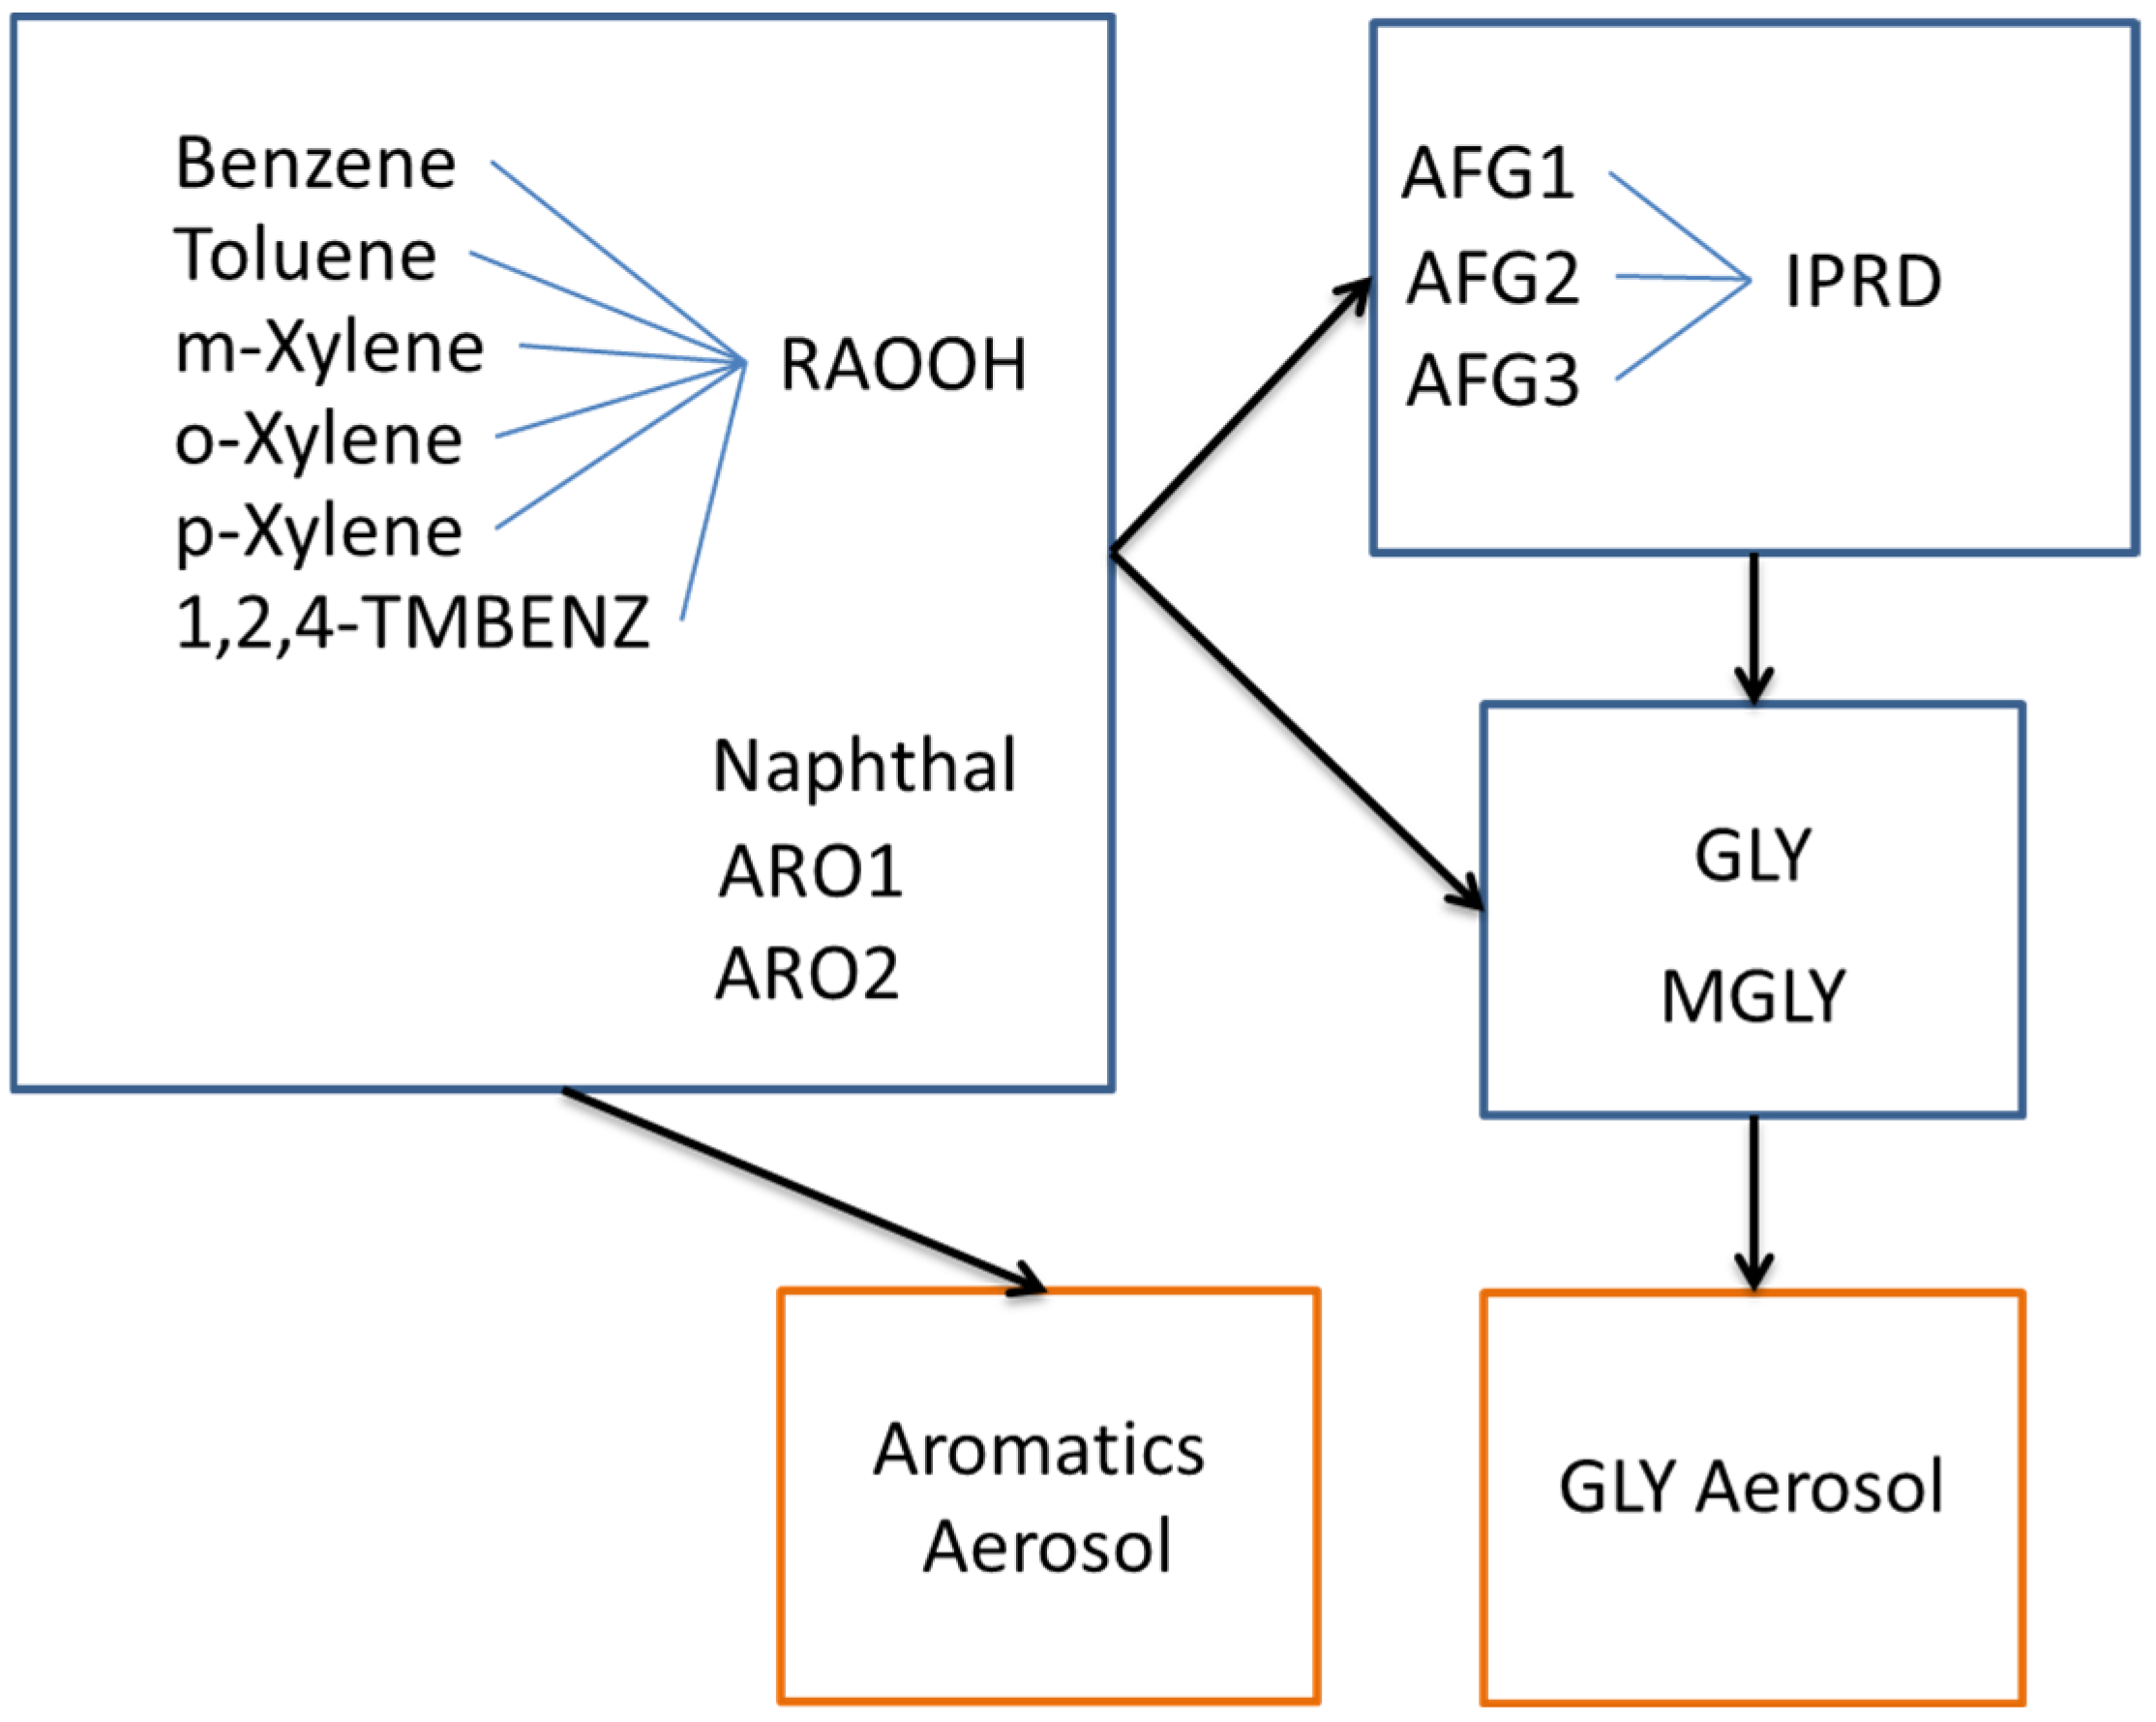
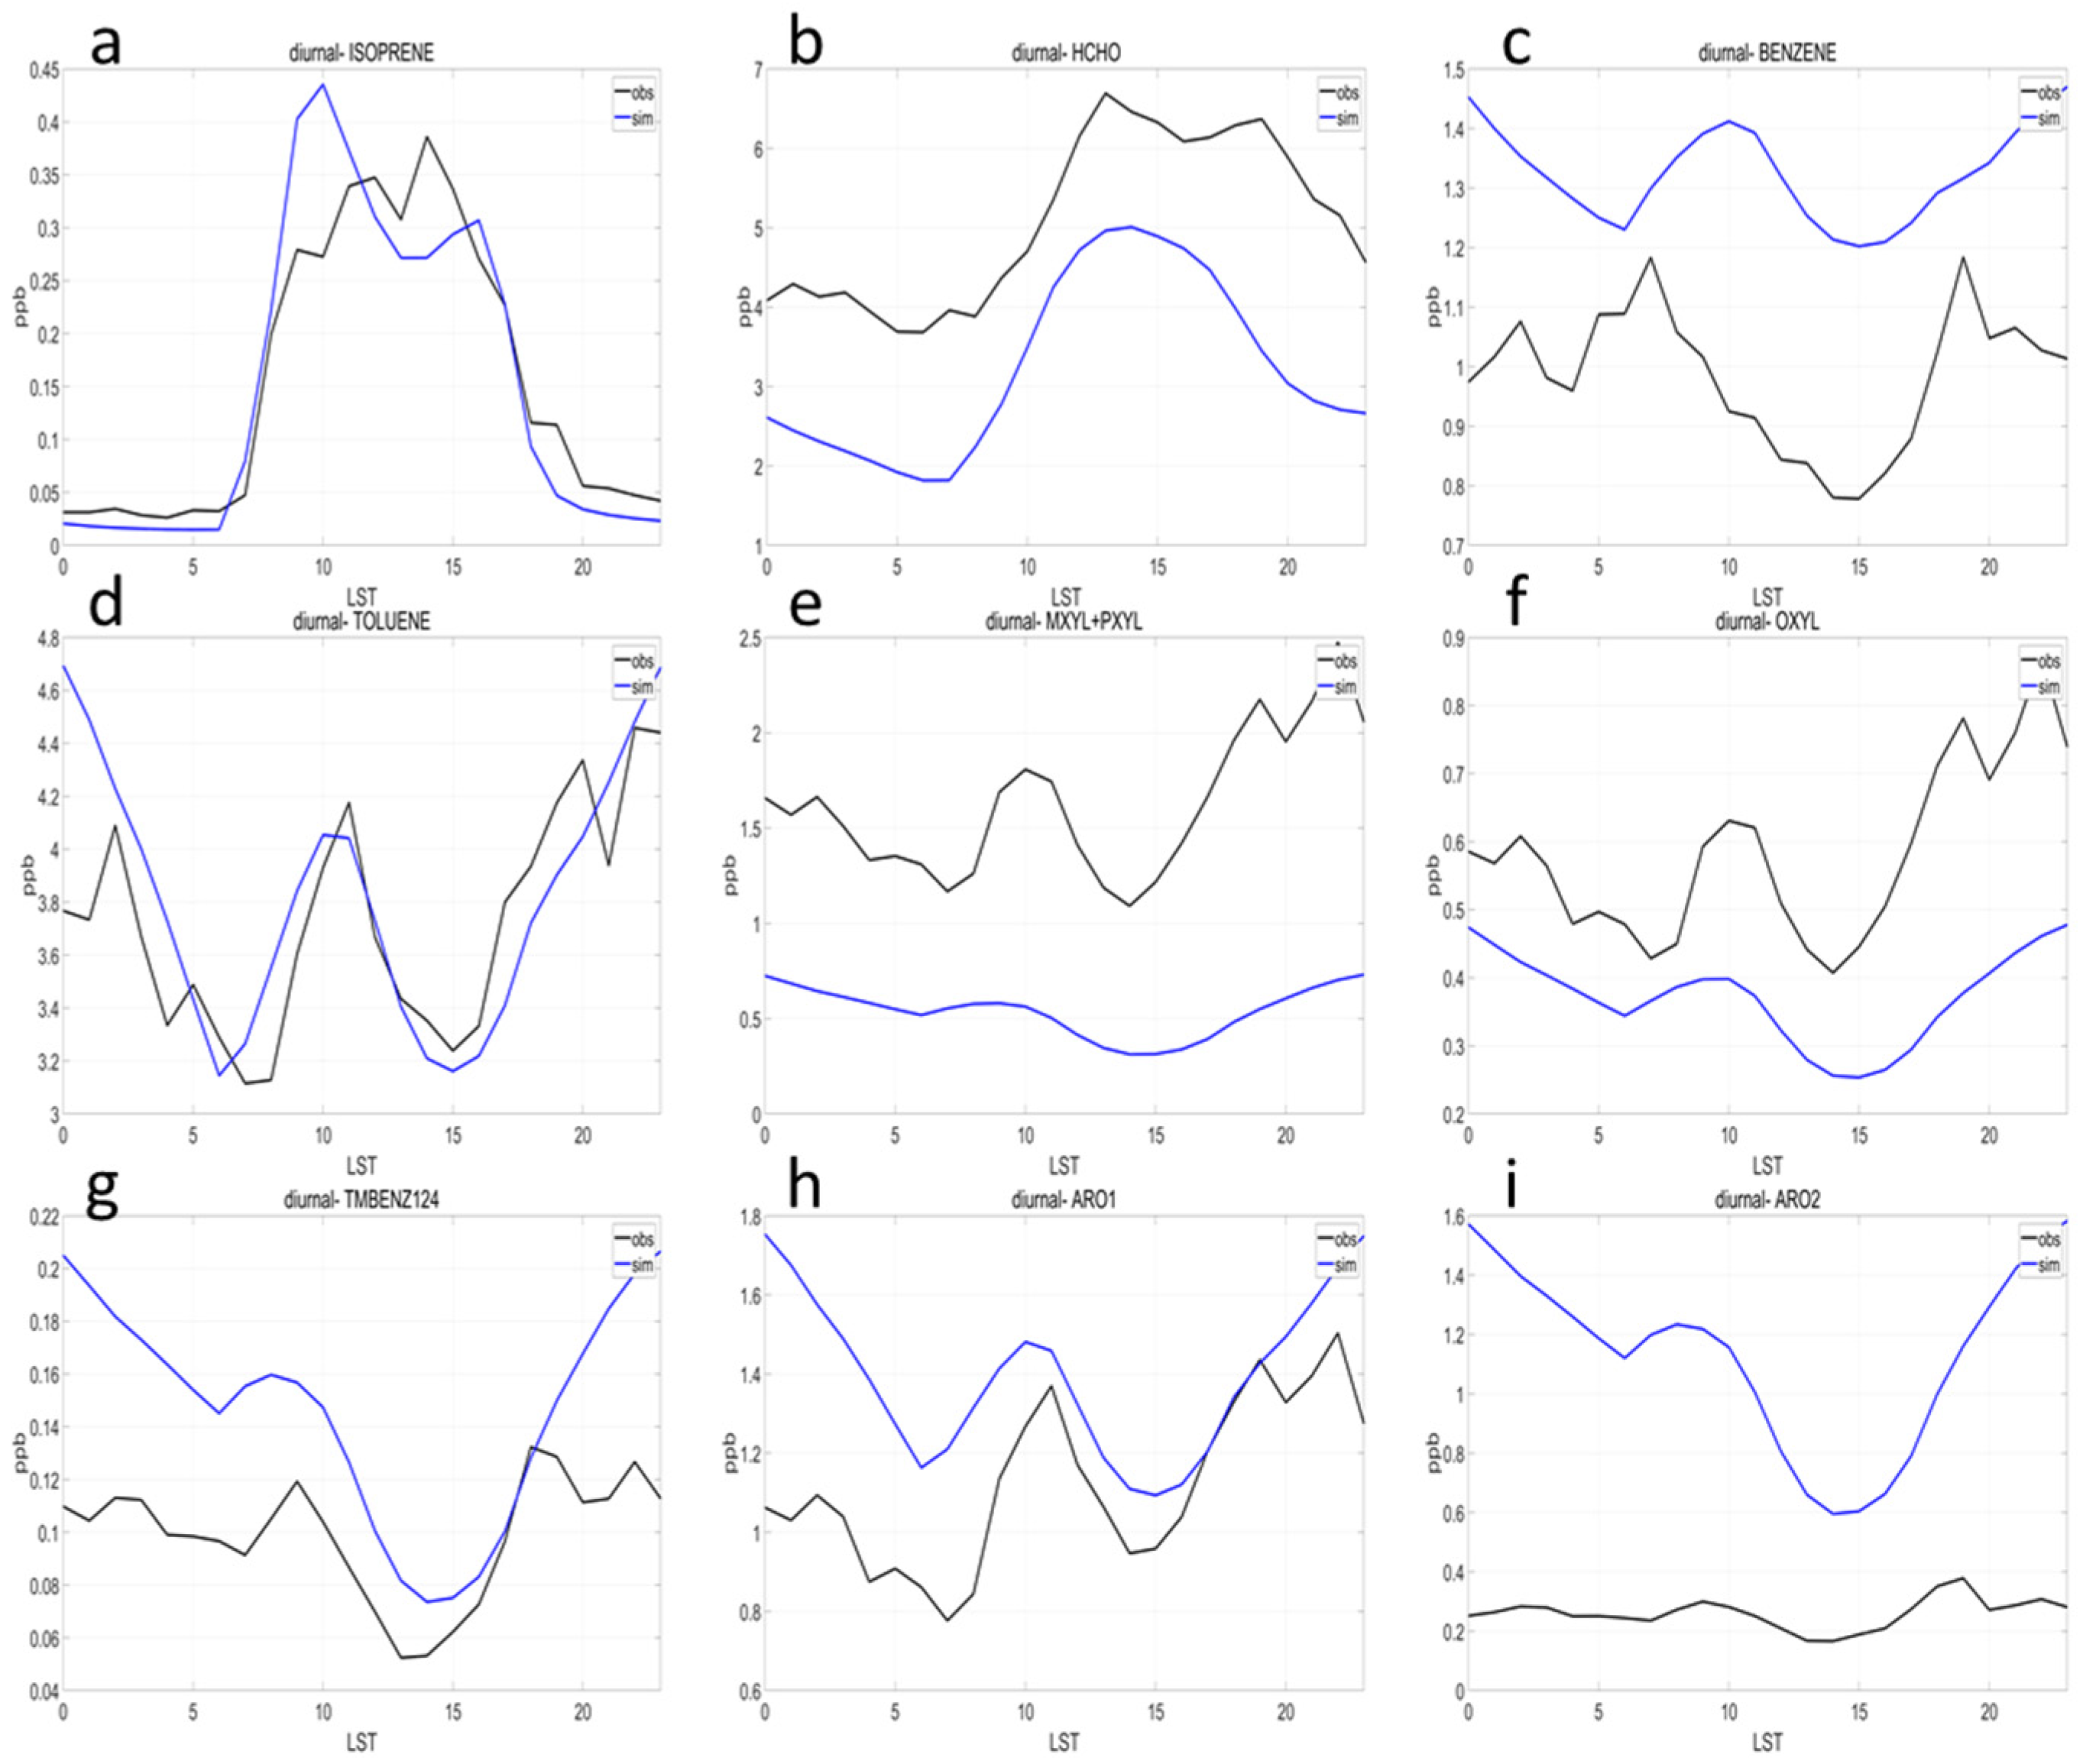
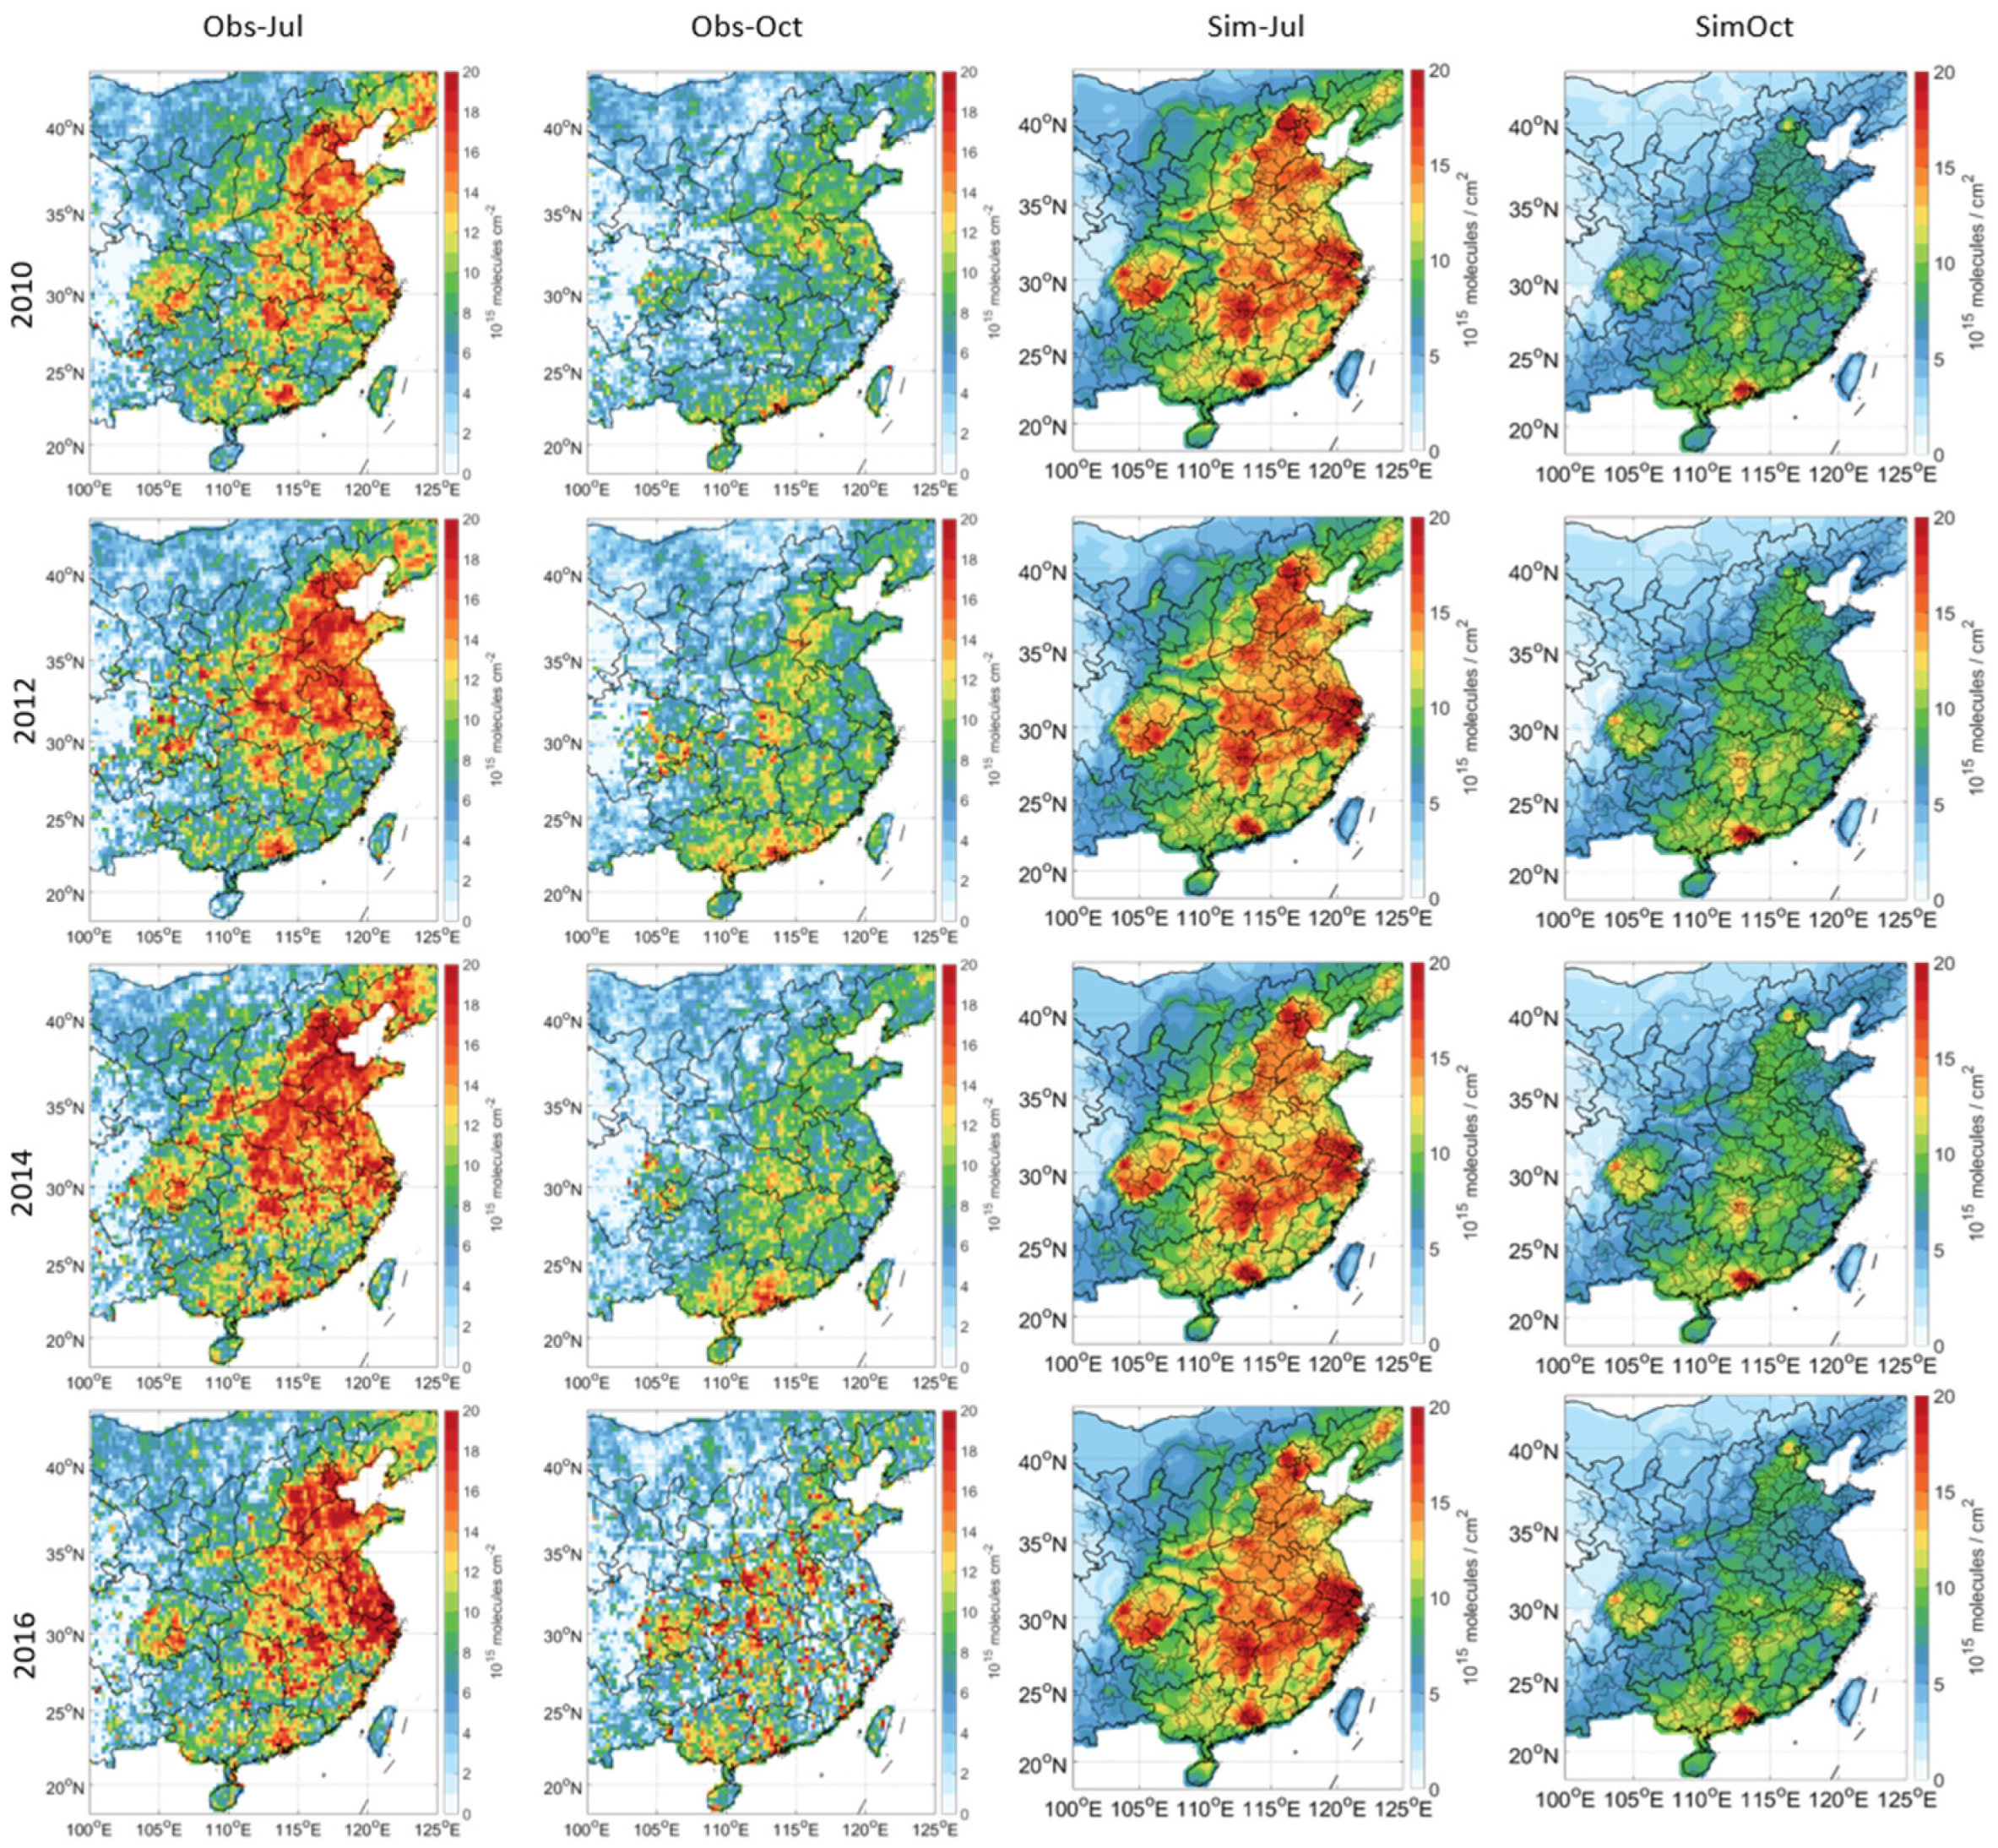
- The aromatic tagging method was implemented based on the SAPRC07tic chemical mechanism and AERO6i aerosol module in CMAQ, enabling quantitative diagnosis of aromatic contributions to dicarbonyl concentrations. Multi-year emission inventories from 2010 to 2016 were incorporated into the simulations. Model validation against ground-based VOC measurements in autumn 2014 demonstrated robust performance of the chemical mechanism, while simulated formaldehyde and glyoxal column concentrations showed good spatiotemporal consistency with satellite observations.
- (2)
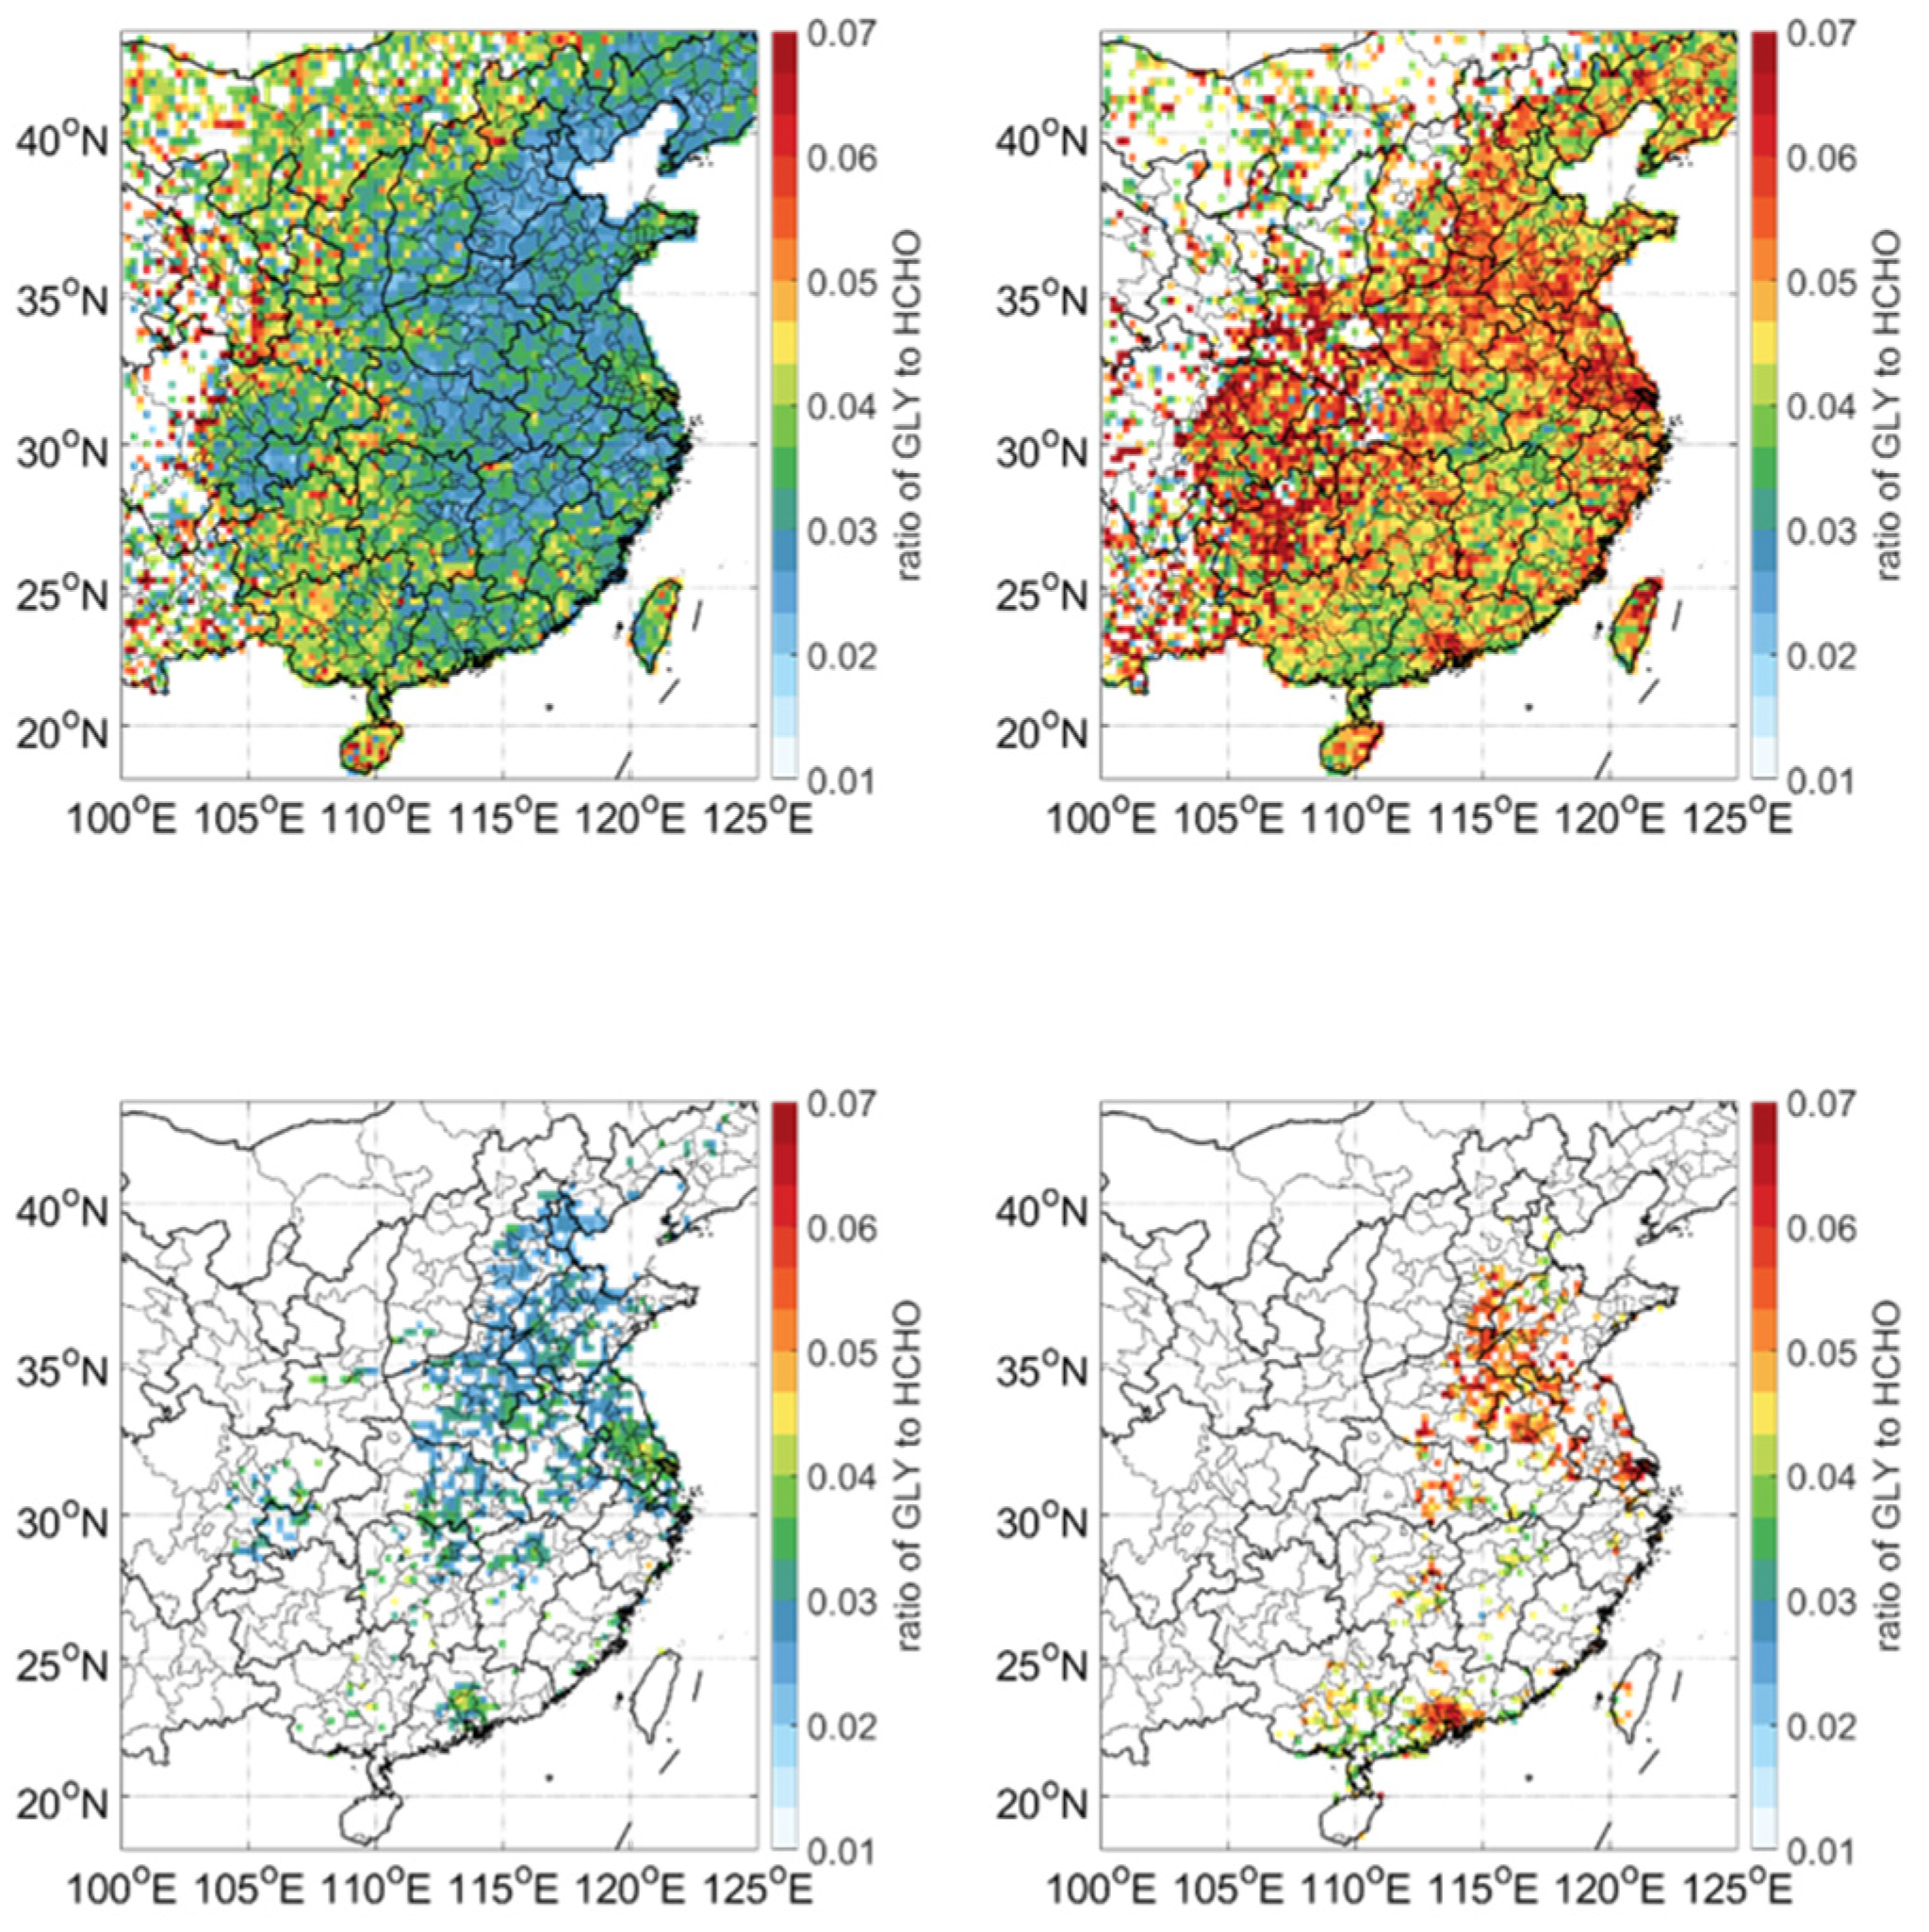
- The results revealed a significant increase in aromatic emissions and ambient concentrations since 2010, with aromatics playing a dominant role in shaping glyoxal column density hotspots across three key regions: the Beijing–Tianjin–Hebei (BTH) metropolitan area, Yangtze River Delta (YRD), and Pearl River Delta (PRD). Analysis of the satellite-derived RGF provided quantitative insights into regional and seasonal variations in aromatic influences. The study also evaluated the applicability of traditional RGF threshold methods for precursor classification in Eastern China. During summer, high-RGF areas outside urban cores aligned well with BVOC-dominated regions, while low-RGF zones (e.g., Southern BTH, Shandong, Northern YRD) reflected anthropogenic dominance. In contrast, autumn exhibited uniformly elevated RGF values across Eastern China, corresponding to anthropogenic source regions and areas with substantial aromatic contributions. By combining satellite retrievals and numerical modeling, this work refined the appropriate RGF threshold ranges for summer and autumn in Eastern China.
- (3)
- The WRF–CMAQ system effectively reproduced the observed spatiotemporal patterns of HCHO and GLY columns, particularly capturing interannual trends and regional HCHO levels with high fidelity. However, simulated GLY columns were systematically underestimated, with greater discrepancies in autumn compared to summer. While the model successfully replicated GLY spatial characteristics in PRD, significant differences emerged between simulated and observed RGF values due to the pervasive GLY underestimation. Adjusted threshold ranges ([0.015–0.03] for model simulations versus [0.04–0.06] for satellite observations) improved summer precursor classification, though autumn RGF thresholds remained unreliable for model applications.
- (4)
- Tracer-based analysis quantified the contributions of aromatics and primary emissions to both surface and column GLY concentrations. The results showed increasing aromatic contributions to GLY levels over time, highlighting their growing importance in atmospheric chemical processes and potential impacts on photochemical pollution and aerosol formation. In contrast, primary GLY emissions exhibited declining contributions due to sustained emission controls. Aromatics demonstrated stronger influences on GLY columns in urban areas than those in rural areas, spatially coincident with RGF hotspots. These findings establish aromatics as a key driver of RGF anomalies and a critical factor in secondary pollution formation.
Supplementary Materials
Author Contributions
Funding
Data Availability Statement
Acknowledgments
Conflicts of Interest
References
- Wang, T.; Xue, L.; Brimblecombe, P.; Lam, Y.F.; Li, L.; Zhang, L. Ozone pollution in China: A review of concentrations, meteorological influences, chemical precursors, and effects. Sci. Total Environ. 2016, 575, 1582–1596. [Google Scholar] [CrossRef]
- Liu, Y.; Wang, T. Worsening urban ozone pollution in China from 2013 to 2017—Part 1: The complex and varying roles of meteorology. Atmos. Chem. Phys. 2020, 20, 6305–6321. [Google Scholar] [CrossRef]
- Lu, X.; Zhang, L.; Wang, X.; Gao, M.; Li, K.; Zhang, Y.; Yue, X.; Zhang, Y. Rapid Increases in Warm-Season Surface Ozone and Resulting Health Impact in China since 2013. Environ. Sci. Technol. Lett. 2020, 7, 240–247. [Google Scholar] [CrossRef]
- Li, K.; Jacob, D.J.; Liao, H.; Shen, L.; Zhang, Q.; Bates, K.H. Anthropogenic drivers of 2013–2017 trends in summer surface ozone in China. Proc. Natl. Acad. Sci. USA 2019, 116, 422–427. [Google Scholar] [CrossRef] [PubMed]
- Liu, Y.; Wang, T. Worsening urban ozone pollution in China from 2013 to 2017—Part 2: The effects of emission changes and implications for multi-pollutant control. Atmos. Chem. Phys. 2020, 20, 6323–6337. [Google Scholar] [CrossRef]
- Wang, S.; Zhao, M.; Xing, J.; Wu, Y.; Zhou, Y.; Lei, Y.; He, K.; Fu, L.; Hao, J. Quantifying the air pollutants emission reduction during the 2008 olympic games in Beijing. Environ. Sci. Technol. 2010, 44, 2490–2496. [Google Scholar] [CrossRef]
- Jin, X.; Holloway, T. Spatial and temporal variability of ozone sensitivity over China observed from the Ozone Monitoring Instrument. J. Geophys. Res. Atmos. 2015, 120, 7229–7246. [Google Scholar] [CrossRef]
- Wang, Y.; Zhao, Y.; Liu, Y.; Jiang, Y.; Zheng, B.; Xing, J.; Liu, Y.; Wang, S.; Nielsen, C.P. Sustained emission reductions have restrained the ozone pollution over China. Nat. Geosci. 2023, 16, 967–974. [Google Scholar] [CrossRef]
- Liu, Y.; Geng, G.; Cheng, J.; Liu, Y.; Xiao, Q.; Liu, L.; Shi, Q.; Tong, D.; He, K.; Zhang, Q. Drivers of Increasing Ozone during the Two Phases of Clean Air Actions in China 2013–2020. Environ. Sci. Technol. 2023, 57, 8954–8964. [Google Scholar] [CrossRef]
- Wu, R.; Xie, S. Spatial Distribution of Secondary Organic Aerosol Formation Potential in China Derived from Speciated Anthropogenic Volatile Organic Compound Emissions. Environ. Sci. Technol. 2018, 52, 8146–8156. [Google Scholar] [CrossRef]
- Fu, T.-M.; Jacob, D.J.; Wittrock, F.; Burrows, J.P.; Vrekoussis, M.; Henze, D.K. Global budgets of atmospheric glyoxal and methylglyoxal, and implications for formation of secondary organic aerosols. J. Geophys. Res. Atmos. 2008, 113, D15303. [Google Scholar] [CrossRef]
- Chan Miller, C.; Jacob, D.J.; González Abad, G.; Chance, K. Hotspot of glyoxal over the Pearl River delta seen from the OMI satellite instrument: Implications for emissions of aromatic hydrocarbons. Atmos. Chem. Phys. 2016, 16, 4631–4639. [Google Scholar] [CrossRef]
- Vrekoussis, M.; Wittrock, F.; Richter, A.; Burrows, J.P. GOME-2 observations of oxygenated VOCs: What can we learn from the ratio glyoxal to formaldehyde on a global scale? Atmos. Chem. Phys. 2010, 10, 10145–10160. [Google Scholar] [CrossRef]
- Kaiser, J.; Wolfe, G.M.; Min, K.E.; Brown, S.S.; Miller, C.C.; Jacob, D.J.; deGouw, J.A.; Graus, M.; Hanisco, T.F.; Holloway, J.; et al. Reassessing the ratio of glyoxal to formaldehyde as an indicator of hydrocarbon precursor speciation. Atmos. Chem. Phys. 2015, 15, 7571–7583. [Google Scholar] [CrossRef]
- DiGangi, J.P.; Henry, S.B.; Kammrath, A.; Boyle, E.S.; Kaser, L.; Schnitzhofer, R.; Graus, M.; Turnipseed, A.; Park, J.H.; Weber, R.J.; et al. Observations of glyoxal and formaldehyde as metrics for the anthropogenic impact on rural photochemistry. Atmos. Chem. Phys. 2012, 12, 9529–9543. [Google Scholar] [CrossRef]
- Chen, X.; Zhang, Y.; Zhao, J.; Liu, Y.; Shen, C.; Wu, L.; Wang, X.; Fan, Q.; Zhou, S.; Hang, J. Regional modeling of secondary organic aerosol formation over eastern China: The impact of uptake coefficients of dicarbonyls and semivolatile process of primary organic aerosol. Sci. Total Environ. 2021, 793, 148176. [Google Scholar] [CrossRef] [PubMed]
- Byun, D.; Schere, K.L. Review of the governing equations, computational algorithms, and other components of the models-3 community multiscale air quality (CMAQ) modeling system. Appl. Mech. Rev. 2006, 59, 51–77. [Google Scholar] [CrossRef]
- Zheng, B.; Tong, D.; Li, M.; Liu, F.; Hong, C.; Geng, G.; Li, H.; Li, X.; Peng, L.; Qi, J.; et al. Trends in China’s anthropogenic emissions since 2010 as the consequence of clean air actions. Atmos. Chem. Phys. 2018, 18, 14095–14111. [Google Scholar] [CrossRef]
- Guenther, A.; Karl, T.; Harley, P.; Wiedinmyer, C.; Palmer, P.I.; Geron, C. Estimates of global terrestrial isoprene emissions using MEGAN (Model of Emissions of Gases and Aerosols from Nature). Atmos. Chem. Phys. 2006, 6, 3181–3210. [Google Scholar] [CrossRef]
- Guenther, A.B.; Jiang, X.; Heald, C.L.; Sakulyanontvittaya, T.; Duhl, T.; Emmons, L.K.; Wang, X. The Model of Emissions of Gases and Aerosols from Nature version 2.1 (MEGAN2.1): An extended and updated framework for modeling biogenic emissions. Geosci. Model. Dev. 2012, 5, 1471–1492. [Google Scholar] [CrossRef]
- Fahey, K.M.; Carlton, A.G.; Pye, H.O.T.; Baek, J.; Hutzell, W.T.; Stanier, C.O.; Baker, K.R.; Wyat Appel, K.; Jaoui, M.; Offenberg, J.H. A framework for expanding aqueous chemistry in the Community Multiscale Air Quality (CMAQ) model version 5.1. Geosci. Model. Dev. 2017, 10, 1587–1605. [Google Scholar] [CrossRef]
- Zheng, J.; Zhang, L.; Che, W.; Zheng, Z.; Yin, S. A highly resolved temporal and spatial air pollutant emission inventory for the Pearl River Delta region, China and its uncertainty assessment. Atmos. Environ. 2009, 43, 5112–5122. [Google Scholar] [CrossRef]
- Griffith, S.M.; Huang, X.H.H.; Louie, P.K.K.; Yu, J.Z. Characterizing the thermodynamic and chemical composition factors controlling PM2.5 nitrate: Insights gained from two years of online measurements in Hong Kong. Atmos. Environ. 2015, 122, 864–875. [Google Scholar] [CrossRef]
- Li, J.; Lu, K.; Lv, W.; Li, J.; Zhong, L.; Ou, Y.; Chen, D.; Huang, X.; Zhang, Y. Fast increasing of surface ozone concentrations in Pearl River Delta characterized by a regional air quality monitoring network during 2006–2011. J. Environ. Sci. 2014, 26, 23–26. [Google Scholar] [CrossRef] [PubMed]
- De Smedt, I.; Müller, J.F.; Stavrakou, T.; van der A, R.; Eskes, H.; Van Roozendael, M. Twelve years of global observations of formaldehyde in the troposphere using GOME and SCIAMACHY sensors. Atmos. Chem. Phys. 2008, 8, 4947–4963. [Google Scholar] [CrossRef]
- De Smedt, I.; Stavrakou, T.; Hendrick, F.; Danckaert, T.; Vlemmix, T.; Pinardi, G.; Theys, N.; Lerot, C.; Gielen, C.; Vigouroux, C.; et al. Diurnal, seasonal and long-term variations of global formaldehyde columns inferred from combined OMI and GOME-2 observations. Atmos. Chem. Phys. 2015, 15, 12519–12545. [Google Scholar] [CrossRef]
- Alvarado, L.M.A.; Richter, A.; Vrekoussis, M.; Wittrock, F.; Hilboll, A.; Schreier, S.F.; Burrows, J.P. An improved glyoxal retrieval from OMI measurements. Atmos. Meas. Tech. 2014, 7, 4133–4150. [Google Scholar] [CrossRef]
- Ge, B.Z.; Wang, Z.F.; Xu, X.B.; Wu, J.B.; Yu, X.L.; Li, J. Wet deposition of acidifying substances in different regions of China and the rest of East Asia: Modeling with updated NAQPMS. Environ. Pollut. 2014, 187, 10–21. [Google Scholar] [CrossRef]
- Luecken, D.J.; Hutzell, W.T.; Strum, M.L.; Pouliot, G.A. Regional sources of atmospheric formaldehyde and acetaldehyde, and implications for atmospheric modeling. Atmos. Environ. 2012, 47, 477–490. [Google Scholar] [CrossRef]
- Luecken, D.J.; Napelenok, S.L.; Strum, M.; Scheffe, R.; Phillips, S. Sensitivity of Ambient Atmospheric Formaldehyde and Ozone to Precursor Species and Source Types Across the United States. Environ. Sci. Technol. 2018, 52, 4668–4675. [Google Scholar] [CrossRef]
- Chen, W.H.; Guenther, A.B.; Wang, X.M.; Chen, Y.H.; Gu, D.S.; Chang, M.; Zhou, S.Z.; Wu, L.L.; Zhang, Y.Q. Regional to Global Biogenic Isoprene Emission Responses to Changes in Vegetation From 2000 to 2015. J. Geophys. Res. Atmos. 2018, 123, 3757–3771. [Google Scholar] [CrossRef]
- Liu, Z.; Wang, Y.; Vrekoussis, M.; Richter, A.; Wittrock, F.; Burrows, J.P.; Shao, M.; Chang, C.C.; Liu, S.C.; Wang, H. Exploring the missing source of glyoxal (CHOCHO) over China. Geophys. Res. Lett. 2012, 39, L10812. [Google Scholar] [CrossRef]
- Li, J.; Zhang, M.; Tang, G.; Wu, F.; Alvarado, L.M.A.; Vrekoussis, M.; Richter, A.; Burrows, J.P. Investigating missing sources of glyoxal over China using a regional air quality model (RAMS-CMAQ). J. Environ. Sci. 2018, 71, 108–118. [Google Scholar] [CrossRef]


| OMI-Obs HCHO VCD | Modeled HCHO VCD | Difference | OMI-Obs GLY VCD | Modeled GLY VCD | Difference | ||
| (1015 Molecules cm−2) | (1014 Molecules cm−2) | ||||||
| 2010-Jul | BTH | 14.49 | 13.74 | −0.75 | 4.03 | 2.75 | −1.28 |
| YRD | 12.72 | 14.76 | 2.04 | 4.24 | 2.49 | −1.75 | |
| PRD | 9.51 | 13.46 | 3.95 | 3.50 | 2.93 | −0.57 | |
| 2012-Jul | BTH | 11.73 | 12.46 | 0.73 | 3.20 | 2.48 | −0.72 |
| YRD | 12.93 | 15.13 | 2.20 | 3.89 | 3.04 | −0.85 | |
| PRD | 12.38 | 12.83 | 0.45 | 3.81 | 2.73 | −1.08 | |
| 2014-Jul | BTH | 13.14 | 12.65 | −0.49 | 3.84 | 2.82 | −1.02 |
| YRD | 14.45 | 14.79 | 0.34 | 4.03 | 3.19 | −0.84 | |
| PRD | 11.79 | 13.82 | 2.03 | 3.51 | 3.44 | −0.07 | |
| 2016-Jul | BTH | 12.31 | 12.36 | 0.05 | - | 2.62 | - |
| YRD | 16.03 | 16.28 | 0.25 | - | 3.58 | - | |
| PRD | 12.54 | 13.85 | 1.31 | - | 3.49 | - | |
| Avg-Juls | BTH | 12.92 | 12.80 | −0.12 | 3.69 | 2.68 | −1.01 |
| YRD | 14.03 | 15.24 | 1.21 | 4.05 | 2.91 | −1.15 | |
| PRD | 11.56 | 13.49 | 1.94 | 3.61 | 3.03 | −0.57 | |
| 2010-Oct | BTH | 7.16 | 5.94 | −1.22 | 3.61 | 1.12 | −2.49 |
| YRD | 8.54 | 8.20 | −0.34 | 4.11 | 1.85 | −2.26 | |
| PRD | 10.34 | 12.11 | 1.77 | 5.63 | 2.91 | −2.72 | |
| 2012-Oct | BTH | 7.56 | 6.08 | −1.48 | 3.56 | 1.25 | −2.31 |
| YRD | 8.16 | 9.33 | 1.17 | 3.91 | 2.33 | −1.58 | |
| PRD | 12.67 | 13.08 | 0.41 | 5.44 | 3.36 | −2.08 | |
| 2014-Oct | BTH | 7.28 | 7.27 | −0.01 | 3.42 | 1.62 | −1.80 |
| YRD | 8.64 | 8.88 | 0.24 | 3.71 | 2.49 | −1.22 | |
| PRD | 13.30 | 13.30 | 0.00 | 5.21 | 4.05 | −1.16 | |
| 2016-Oct | BTH | 7.85 | 6.97 | −0.88 | - | 1.74 | - |
| YRD | 8.70 | 8.44 | −0.26 | - | 1.75 | - | |
| PRD | 11.42 | 12.50 | 1.08 | - | 3.43 | - | |
| Avg-Octs | BTH | 7.46 | 6.57 | −0.90 | 3.53 | 1.33 | −2.20 |
| YRD | 8.51 | 8.71 | 0.20 | 3.91 | 2.22 | −1.69 | |
| PRD | 11.93 | 12.75 | 0.81 | 5.43 | 3.44 | −1.99 | |
| BTH | YRD | |||||||
| GLYaro | GLYpri | obsRGF | simRGF | GLYaro | GLYpri | obsRGF | simRGF | |
| 2010JUL | 0.413 | 0.025 | 0.027 | 0.019 | 0.513 | 0.031 | 0.034 | 0.015 |
| 2012JUL | 0.505 | 0.023 | 0.027 | 0.018 | 0.474 | 0.026 | 0.029 | 0.019 |
| 2014JUL | 0.461 | 0.020 | 0.026 | 0.021 | 0.526 | 0.019 | 0.028 | 0.020 |
| 2016JUL | 0.489 | 0.016 | - | 0.020 | 0.439 | 0.017 | - | 0.020 |
| 2010OCT | 0.725 | 0.065 | 0.047 | 0.018 | 0.706 | 0.043 | 0.049 | 0.021 |
| 2012OCT | 0.730 | 0.059 | 0.044 | 0.019 | 0.691 | 0.036 | 0.049 | 0.024 |
| 2014OCT | 0.767 | 0.035 | 0.042 | 0.021 | 0.719 | 0.029 | 0.044 | 0.026 |
| 2016OCT | 0.804 | 0.030 | - | 0.023 | 0.820 | 0.035 | - | 0.019 |
| PRD | Eastern China | |||||||
| GLYaro | GLYpri | obsRGF | simRGF | GLYaro | GLYpri | obsRGF | simRGF | |
| 2010JUL | 0.670 | 0.014 | 0.036 | 0.017 | 0.453 | 0.034 | 0.032 | 0.017 |
| 2012JUL | 0.715 | 0.013 | 0.032 | 0.017 | 0.495 | 0.029 | 0.030 | 0.017 |
| 2014JUL | 0.673 | 0.008 | 0.029 | 0.020 | 0.477 | 0.024 | 0.028 | 0.019 |
| 2016JUL | 0.545 | 0.008 | - | 0.021 | 0.430 | 0.021 | - | 0.019 |
| 2010OCT | 0.665 | 0.016 | 0.056 | 0.022 | 0.645 | 0.051 | 0.047 | 0.019 |
| 2012OCT | 0.673 | 0.011 | 0.042 | 0.022 | 0.636 | 0.044 | 0.045 | 0.021 |
| 2014OCT | 0.704 | 0.007 | 0.040 | 0.026 | 0.665 | 0.034 | 0.041 | 0.023 |
| 2016OCT | 0.703 | 0.007 | - | 0.023 | 0.730 | 0.033 | - | 0.020 |
Disclaimer/Publisher’s Note: The statements, opinions and data contained in all publications are solely those of the individual author(s) and contributor(s) and not of MDPI and/or the editor(s). MDPI and/or the editor(s) disclaim responsibility for any injury to people or property resulting from any ideas, methods, instructions or products referred to in the content. |
© 2025 by the authors. Licensee MDPI, Basel, Switzerland. This article is an open access article distributed under the terms and conditions of the Creative Commons Attribution (CC BY) license (https://creativecommons.org/licenses/by/4.0/).
Share and Cite
Chen, X.; Chen, X.; Liu, Y.; Shen, C.; Dong, S.; Fan, Q.; Fan, S.; Deng, T.; Deng, X.; Huang, H. Assessing the Aromatic-Driven Glyoxal Formation and Its Interannual Variability in Summer and Autumn over Eastern China. Remote Sens. 2025, 17, 3174. https://doi.org/10.3390/rs17183174
Chen X, Chen X, Liu Y, Shen C, Dong S, Fan Q, Fan S, Deng T, Deng X, Huang H. Assessing the Aromatic-Driven Glyoxal Formation and Its Interannual Variability in Summer and Autumn over Eastern China. Remote Sensing. 2025; 17(18):3174. https://doi.org/10.3390/rs17183174
Chicago/Turabian StyleChen, Xiaoyang, Xi Chen, Yiming Liu, Chong Shen, Shaorou Dong, Qi Fan, Shaojia Fan, Tao Deng, Xuejiao Deng, and Haibao Huang. 2025. "Assessing the Aromatic-Driven Glyoxal Formation and Its Interannual Variability in Summer and Autumn over Eastern China" Remote Sensing 17, no. 18: 3174. https://doi.org/10.3390/rs17183174
APA StyleChen, X., Chen, X., Liu, Y., Shen, C., Dong, S., Fan, Q., Fan, S., Deng, T., Deng, X., & Huang, H. (2025). Assessing the Aromatic-Driven Glyoxal Formation and Its Interannual Variability in Summer and Autumn over Eastern China. Remote Sensing, 17(18), 3174. https://doi.org/10.3390/rs17183174


