Article

Time-Series 3D Modeling of Tunnel Damage Through Fusion of Image and Point Cloud Data

1
Department of Geotechnical Engineering Research, Korea Institute of Civil Engineering and Building Technology (KICT), Goyang 10223, Republic of Korea
2
Department of Urban Engineering, Incheon National University, Incheon 22012, Republic of Korea
*
Author to whom correspondence should be addressed.
Remote Sens. 2025, 17(18), 3173; https://doi.org/10.3390/rs17183173
Submission received: 24 July 2025 / Revised: 25 August 2025 / Accepted: 11 September 2025 / Published: 12 September 2025
(This article belongs to the Section Remote Sensing Image Processing)

Abstract

Precise maintenance is vital for ensuring the safety of tunnel structures; however, traditional visual inspections are subjective and hazardous. Digital technologies such as LiDAR and imaging offer promising alternatives, but each has complementary limitations in geometric precision and visual representation. This study addresses these limitations by developing a three-dimensional modeling framework that integrates image and point cloud data and evaluates its effectiveness. Terrestrial LiDAR and UAV images were acquired three times over a freeze–thaw cycle at an aging, abandoned tunnel. Based on the data obtained, three types of 3D models were constructed: TLS-based, image-based, and fusion-based. A comparative evaluation results showed that the TLS-based model had excellent geometric accuracy but low resolution due to low point density. The image-based model had high density and excellent resolution but low geometric accuracy. In contrast, the fusion-based model achieved the lowest root mean squared error (RMSE), the highest geometric accuracy, and the highest resolution. Time-series analysis further demonstrated that only the fusion-based model could identify the complex damage progression mechanism in which leakage and icicle formation (visual changes) increased the damaged area by 55.8% (as measured by geometric changes). This also enabled quantitative distinction between active damage (leakage, structural damage) and stable-state damage (spalling, efflorescence, cracks). In conclusion, this study empirically demonstrates the necessity of data fusion for comprehensive tunnel condition diagnosis. It provides a benchmark for evaluating 3D modeling techniques in real-world environments and lays the foundation for digital twin development in data-driven preventive maintenance.

1. Introduction

Tunnels are essential components of major transportation infrastructure such as roads and railways, requiring long-term structural stability and reliability to maintain public safety and socio-economic functions [1]. However, most tunnels comprise semi-permanent structures, such as concrete linings, and are exposed to various deterioration phenomena over time [2,3,4]. Repeated vehicle vibrations, minor ground displacements, external loads, moisture penetration due to leakage, chemical erosion, and seasonal temperature changes can cause defects such as cracks, efflorescence, spalling, and rebar exposure on tunnel concrete lining. These issues directly affect the durability and lifespan of the structure and the safety of tunnel users [5,6].
The early detection and quantitative analysis of such structural damage are key elements of maintenance. Recently, there has been a growing shift from traditional manpower-based inspections toward automated, precise methods using digital measurement techniques [7]. Among these, image-based and point cloud data (PCD)-based methods are widely used, each offering distinct advantages and limitations [8].
Image-based methods primarily rely on high-resolution RGB or thermal images and perform well in identifying visual surface damage on tunnel linings [9]. Surface defects, such as cracks, efflorescence, spalling, and leakage marks, can be effectively detected using image-processing algorithms. In recent years, deep learning-based automatic defect detection has seen notable development [10,11,12,13,14,15]. Moreover, image-based 3D surface models generated using Structure-from-Motion (SfM) or Multi-view Stereo (MVS) techniques offer more advanced spatial representation than single-image approaches [16,17,18,19,20]. However, image-based methods have inherent weaknesses, including limited depth accuracy, vulnerability to failure in dark or geometrically complex tunnel environments, and difficulty in registering absolute spatial coordinates [21,22].
Conversely, PCD-based methods, accurately reconstruct the geometric structure of tunnels using high-density data acquired via light detection and ranging (LiDAR) [23]. LiDAR produces dense 3D coordinate data based on laser reflection times and intensities, enabling quantitative assessment of deformations such as sagging and cross-sectional shrinkage [24,25,26]. Intensity values can also reflect surface conditions and material properties to some extent [27,28,29]. However, LiDAR lacks visual detail—such as color, texture, and fine cracks—limiting its use in surface-level defect detection [30]. Detecting planar damage smaller than the LiDAR point spacing is also challenging [31], and the reliability of intensity values is inconsistent owing to influences from sensor type, range, and angle [32,33].
In summary, image-based methods are effective for visual identification of defects but lack geometric accuracy, whereas PCD-based methods offer high geometric precision but limited visual interpretability [34]. Given their complementary nature, relying on a single method cannot provide both precise quantitative data and intuitive visual understanding of tunnel damage. Accordingly, integrating image data with PCD is a technically promising approach [35,36]. By aligning visually recognized defect types and locations from images with LiDAR coordinates, a 3D model with both high-resolution visual and accurate spatial information can be constructed [37,38]. Based on this analysis, the present study aims to experimentally assess the limitations of image-based and PCD-based techniques and achieve high-precision 3D damage visualization through data fusion. To this end, three models—image-based, PCD-based, and fusion-based—were created and compared in terms of quantitative measurement accuracy, visualization quality, and time-series damage tracking, to verify the practical effectiveness and technical superiority of the fusion-based approach. Consequently, instead of an operational establishment, an abandoned tunnel was selected as the study site owing to its high humidity and persistent leakage conditions, which accelerate concrete damage. These characteristics render it ideal for observing a range of deterioration phenomena over a short period. To this end, image data captured by UAVs and terrestrial LiDAR (TLS) data were collected three times for the selected tunnel. Based on the data from each acquisition, three types of models were constructed: image-based, PCD-based, and image-PCD fusion-based. A series of comparative analyses were then conducted to validate the performance of these models. First, the accuracy and resolution of the models were compared by evaluating their point cloud density, level of detail, shape conformity, and registration error to quantify the accuracy improvements achieved through fusion. Second, the models’ damage representation and visualization quality were assessed by comparing their visualization performance, defect identification capability, spatial accuracy, and interpretability across actual damage types, including cracks, efflorescence, and spalling. Finally, a time-series analysis was performed by aligning the models along a temporal axis to track changes—such as damage progression, area expansion, and new damage—thereby evaluating each technique’s suitability for monitoring.

2. Related Work

2.1. Digital Transformation in Tunnel Inspection

Traditional tunnel safety inspections often depend on methods such as hammer tapping by skilled engineers or visually detection of structural defects [39]. This method has inherent limitations, such as a high degree of human subjectivity, difficulty in quantifying results and managing records, and safety risks to personnel during the inspection process [40]. Additionally, it incurs significant socio-economic costs due to the need for traffic control [41,42].
Tunnel maintenance is undergoing rapid digital transformation, leveraging sensors, robotics, and artificial intelligence (AI) to overcome these traditional limitations [43]. In particular, non-destructive and non-contact remote sensing technology has emerged as an effective alternative for quickly and accurately diagnosing tunnel conditions [44]. For data acquisition, mobile mapping systems (MMS) [45,46,47,48,49,50] or unmanned aerial vehicles (UAVs) [51], primarily equipped with high-resolution cameras and laser scanners, are utilized.
Based on these technological platforms, recent research has been advancing toward maximizing the autonomy, intelligence, and effectiveness of inspections. Ultimately, these technologies are leading to the implementation of a digital twin-based predictive maintenance system that reflects inspection data in real time, as proposed by Machado and Futai [52].
These data-driven approaches enhance the objectivity of inspections and the reliability of data, providing an essential foundation for tracking long-term condition changes [53]. The image-based and LiDAR point cloud-based methodologies, which are the main focus of this study, can be considered the two most representative pillars driving this digital transformation.

2.2. TLS-Based Approaches for Geometric Analysis

LiDAR is an active sensor technology that emits laser pulses and measures the time it takes for the reflected signals to return to the sensor, determining the distance to the target. Through LiDAR, PCDs composed of millions of high-density 3D coordinate points can be directly acquired with high precision. In the field of civil engineering structure monitoring, LiDAR plays a crucial role in assessing the macroscopic stability of structures by measuring tunnel cross-sectional deformation (convergence), internal displacement, ground subsidence, and other factors with millimeter-level accuracy [54].
Recent studies have focused on automating the entire LiDAR data processing workflow and improving precision. To improve modeling automation and registration precision, Duan et al. [55] proposed a technique that automatically reconstructs scan data to generate high-precision BIM, while Ma et al. [56] developed a point cloud registration algorithm effective even on tunnel excavation surfaces with sparse textures. Furthermore, to enhance data processing and analysis, Bao et al. [57] proposed a filtering technique that effectively removes noise to improve the precision of cross-sectional radius calculations, while Mizutani et al. [58] introduced a machine learning method that automatically detects delamination damage by utilizing the geometric feature of “straightness.” These technologies have been applied to periodic shape monitoring through Camara et al.’s [59] mobile system and Kang et al.’s [60] handheld SLAM-based system, demonstrating their practicality.
Nevertheless, the most obvious limitation of LiDAR technology is the lack of texture information. Although some studies have attempted to use laser reflection intensity values as a supplementary measure for leakage detection [61,62], the intensity values are highly variable depending on the sensor, distance, and angle of incidence, rendering them unreliable. As a result, defects with important visual characteristics, such as fine cracks without color changes, surface contamination, and early-stage efflorescence, are either smaller than the point spacing of LiDAR or do not cause significant changes in intensity values, rendering detection nearly impossible. This means that LiDAR alone is insufficient to perform a comprehensive assessment of the tunnel’s condition.

2.3. Image-Based Approaches for Defect Detection and 3D Modeling

Image data is the most widely used medium for intuitively recording and analyzing the condition of tunnel surfaces. SfM and MVS technologies, which reconstruct the 3D shape of structures from multiple overlapping images, are effective in creating realistic 3D texture models of tunnels. These technologies can produce visually rich 3D results with low-cost camera equipment. Under certain conditions, as shown in the study by Panella et al. [63], they have been proposed as cost-effective alternatives with cross-sectional shape accuracy comparable to LiDAR.
However, several studies have highlighted the inherent limitations of image-based 3D modeling and suggest the need for data fusion. Sjölander et al. [64] and Huang et al. [24] emphasized that while image-based techniques excel in detecting fine defects, they have limitations in obtaining precise three-dimensional coordinates. Xue et al. [16] and Lei et al. [65] found that the absence of depth and spatial information renders quantifying the scale of damage difficult. Additionally, Consequently, these image-based 3D models inherently rely on texture information. In environments with uniform color tunnel surfaces or low-light conditions, the accuracy of shape reconstruction rapidly decreases, presenting a fundamental limitation in securing the model’s absolute scale and global coordinates.

2.4. Data Fusion of Imagery and Point Clouds for SHM

As previously discussed, image-based and TLS-based methods are clearly complementary to each other. In this context, research aimed at fusing the two heterogeneous data types to combine the advantages of each technology is actively underway. Data fusion generally aims to create geometrically precise yet visually realistic 3D models by registering and projecting the RGB information of high-resolution images onto the accurate 3D coordinate system of LiDAR point clouds.
Recent studies have progressed toward enhancing the technical completeness and usability of data fusion. These studies can be broadly classified into three areas: (1) improving fusion precision, (2) analyzing defects using fused data, and (3) applying fusion techniques to digital twin models. To improve fusion precision, An et al. [66] proposed an optimization-based high-precision external calibration method, while Cai et al. [67] proposed a composite target board to improve the accuracy of field registration. In terms of defect analysis using fusion data, studies have been conducted to precisely map the detection results of 2D images onto 3D point clouds [68], detect delamination damage by combining LiDAR’s intensity and depth information [69], Cheng et al. [70] compared the characteristics of LiDAR intensity and RGB images in low-light environments, demonstrating the complementarity between information that is robust to changes in illumination and visually rich information, and comprehensively assess defects by integrating color and deformation information [71]. Ultimately, these technologies are leading to the construction of automated digital twin models that realize the three-dimensional visualization of defects [72].
Despite these remarkable advancements, existing studies contain several common limitations. First, most studies focus on demonstrating the feasibility of 3D model construction techniques in a single epoch, and relatively minimal attention is given to time-series analysis that quantitatively tracks the progression of damage over time. Second, direct and quantitative comparative studies that verify the actual performance improvement of the fusion-based model compared to individual source data (image, PCD)-based models are scarce. Therefore, the current study aims to fill this academic gap by directly comparing and evaluating three types of models based on data repeatedly acquired from actual aging tunnels and empirically verifying the time-series analysis capabilities of the fusion-based model.

3. Materials and Methods

3.1. Description of the Testbed

The testbed for this study was the Tunnel located in Jecheon City, Chungcheongbuk-do, South Korea. Constructed in 1958, 75 m long, 5 m high, cross-sectional area approximately 20 m2, horseshoe-shaped, concrete-lined railway tunnel was abandoned in 1980 and now serves as a representative case of aging infrastructure. As the original detailed engineering drawings for the tunnel are unavailable, digital-based condition assessment technologies are essential for accurately evaluating its current state.
In particular, the topographical feature of a valley located above the tunnel results in continuous leakage and high humidity at the tunnel’s exit (Figure 1). These severe hydraulic conditions accelerate the progression of various deterioration phenomena in concrete structures, including cracks, efflorescence, and spalling. As a result, the Wonbak Tunnel, where diverse types of damage coexist and actively progress, provides optimal conditions for comprehensively comparing and verifying the performance of the three-dimensional modeling techniques—damage detection, quantification, and visualization—targeted in this study. Furthermore, as it is a closed tunnel, repeated measurements can be conducted safely and without traffic control, rendering it highly suitable for research on time-series tracking of damage progression.

3.2. Data Acquisition

3.2.1. Terrestrial LiDAR Scanning

To obtain precise three-dimensional point cloud data, we established a reference coordinate system inside the tunnel through precise surveying using global navigation satellite system (GNSS) and a total station. As satellite signals cannot be received within the tunnel, three external reference points were obtained via GNSS RTK (Real-Time Kinematic) surveying outside the tunnel, based on the KGD2002/Central Belt 2010 (EPSG: 5186) coordinate system. Using these reference points, total station (TS) traverse surveying was performed to determine the coordinates of 12 internal reference points, both inside and outside the tunnel (Figure 2). The reference points were installed at intervals of approximately 10 m, taking into account the scan range based on the scanner’s scanning angle, and additional points were installed at locations where damage was noted. These internal points served as scanner installation positions (instrument stations) and backsights for conducting 12 scans in total.
To verify the registration accuracy of the final integrated point cloud, we separately installed and precisely measured 27 reflective targets on the tunnel’s inner wall to serve as independent check points.
For research, the Trimble’s SX10 scanning total station was used. This instrument employs the time-of-flight (ToF) method and is equipped with a 5 MP camera. It offers high precision, with an effective range of 600 m, an angular resolution of 1″, and a distance measurement accuracy of 1 mm + 1.5 ppm. Detailed equipment specifications are presented in Table 1.

3.2.2. High-Resolution Image Acquisition

High-resolution images of the tunnel concrete lining surface were acquired to construct a high-quality 3D image model. The tunnel is extremely dark due to the absence of internal lighting and a ceiling height of approximately 5 m, capturing consistent-quality data is difficult.
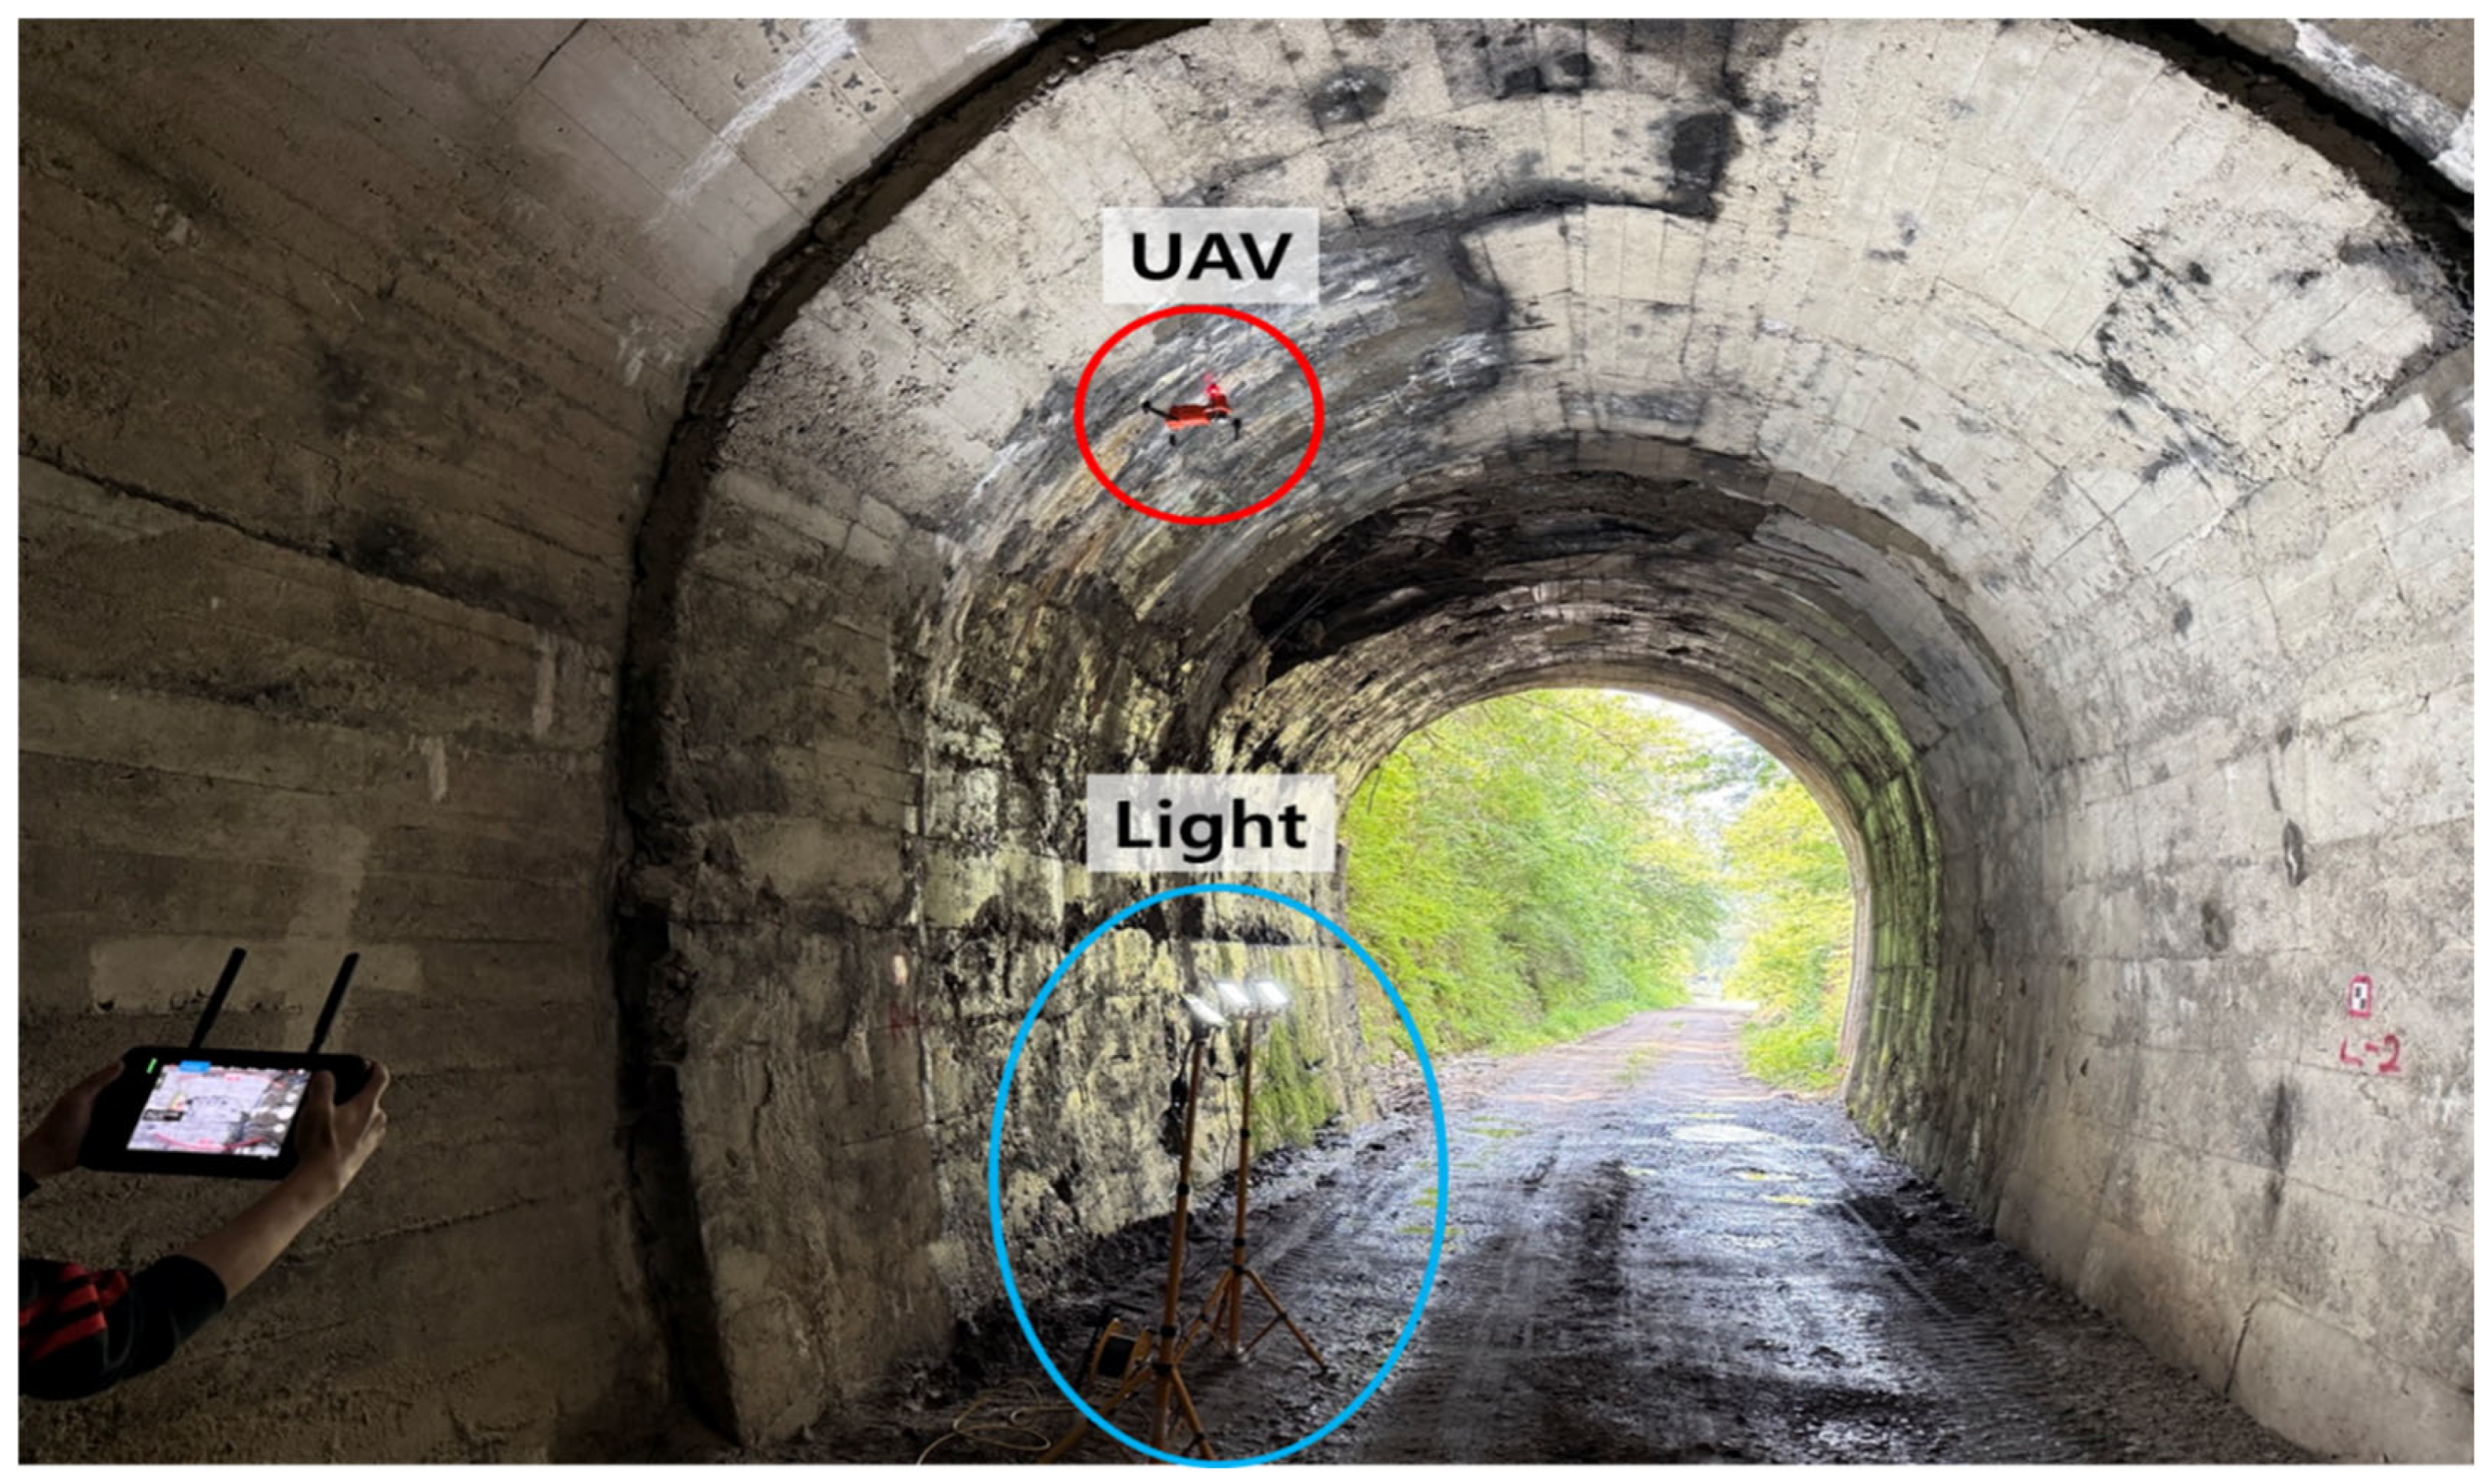
To overcome these limitations, we used UAV-based imaging combined with a mobile lighting device (Figure 3). Compared to ground-based methods, UAV-based imaging facilitates maintaining consistent shooting distances and angles for both the ceiling and walls, while also enabling rapid data collection. Simultaneously, a high-intensity LED lighting device was manually moved along the UAV’s flight path to minimize shadows and ensure consistent surface illumination.
For 3D modeling based on SfM, the required image overlap was set to 60–70% in both longitudinal and lateral directions, and systematic imaging was conducted throughout the tunnel. A camera equipped with a 1/2 inch CMOS image sensor and supporting a resolution of 5472 × 3648 pixels was mounted on an AUTEL EVO2 RTK UAV. This camera features an 82° FOV lens and a lossless 4× optical zoom (focal length 4.3–17.2 mm), enabling clear image acquisition at various distances. Detailed specifications of the UAV and lighting equipment used are provided in Table 2.

3.2.3. Time-Series Data Collection

The main purpose of collecting time-series data was to quantitatively track the initiation and progression of surface damage on the tunnel concrete lining. Considering that the tunnel is continuously exposed to water leakage, damage was hypothesized to progress rapidly during winter freeze–thaw cycles. To test this, we collected data three times across the freeze–thaw period (Figure 4).
The first measurement (November 2024) recorded pre-winter conditions and served as baseline data. The second measurement (March 2025) captured damage accumulated during the freeze–thaw period, during which icicles (ice columns) were observed at the tunnel exit (Figure 4b), indicating active freeze–thaw activity. The third measurement (May 2025) was taken to confirm the stability or further changes in the tunnel condition after thawing.
This data set, structured with clear temporal intervals, provides a solid foundation for evaluating the effectiveness of the three 3D modeling techniques developed in this study in detecting and quantifying subtle temporal changes.

3.3. Generation of 3D Models

3.3.1. TLS-Based PCD Generation

The TLS scan data was acquired from the reference point at each time point, and unnecessary elements such as vegetation and people were precisely deleted and adjusted to create the final 3D PCD model. In this study, the TLS equipment was installed using the precision surveying reference points described in Section 3.2.1. The coordinate system was then registered to the scanning equipment using angles and distances in the same manner as the surveying method. All scan data were accurately integrated into a single coordinate system without requiring separate post-processing registration.
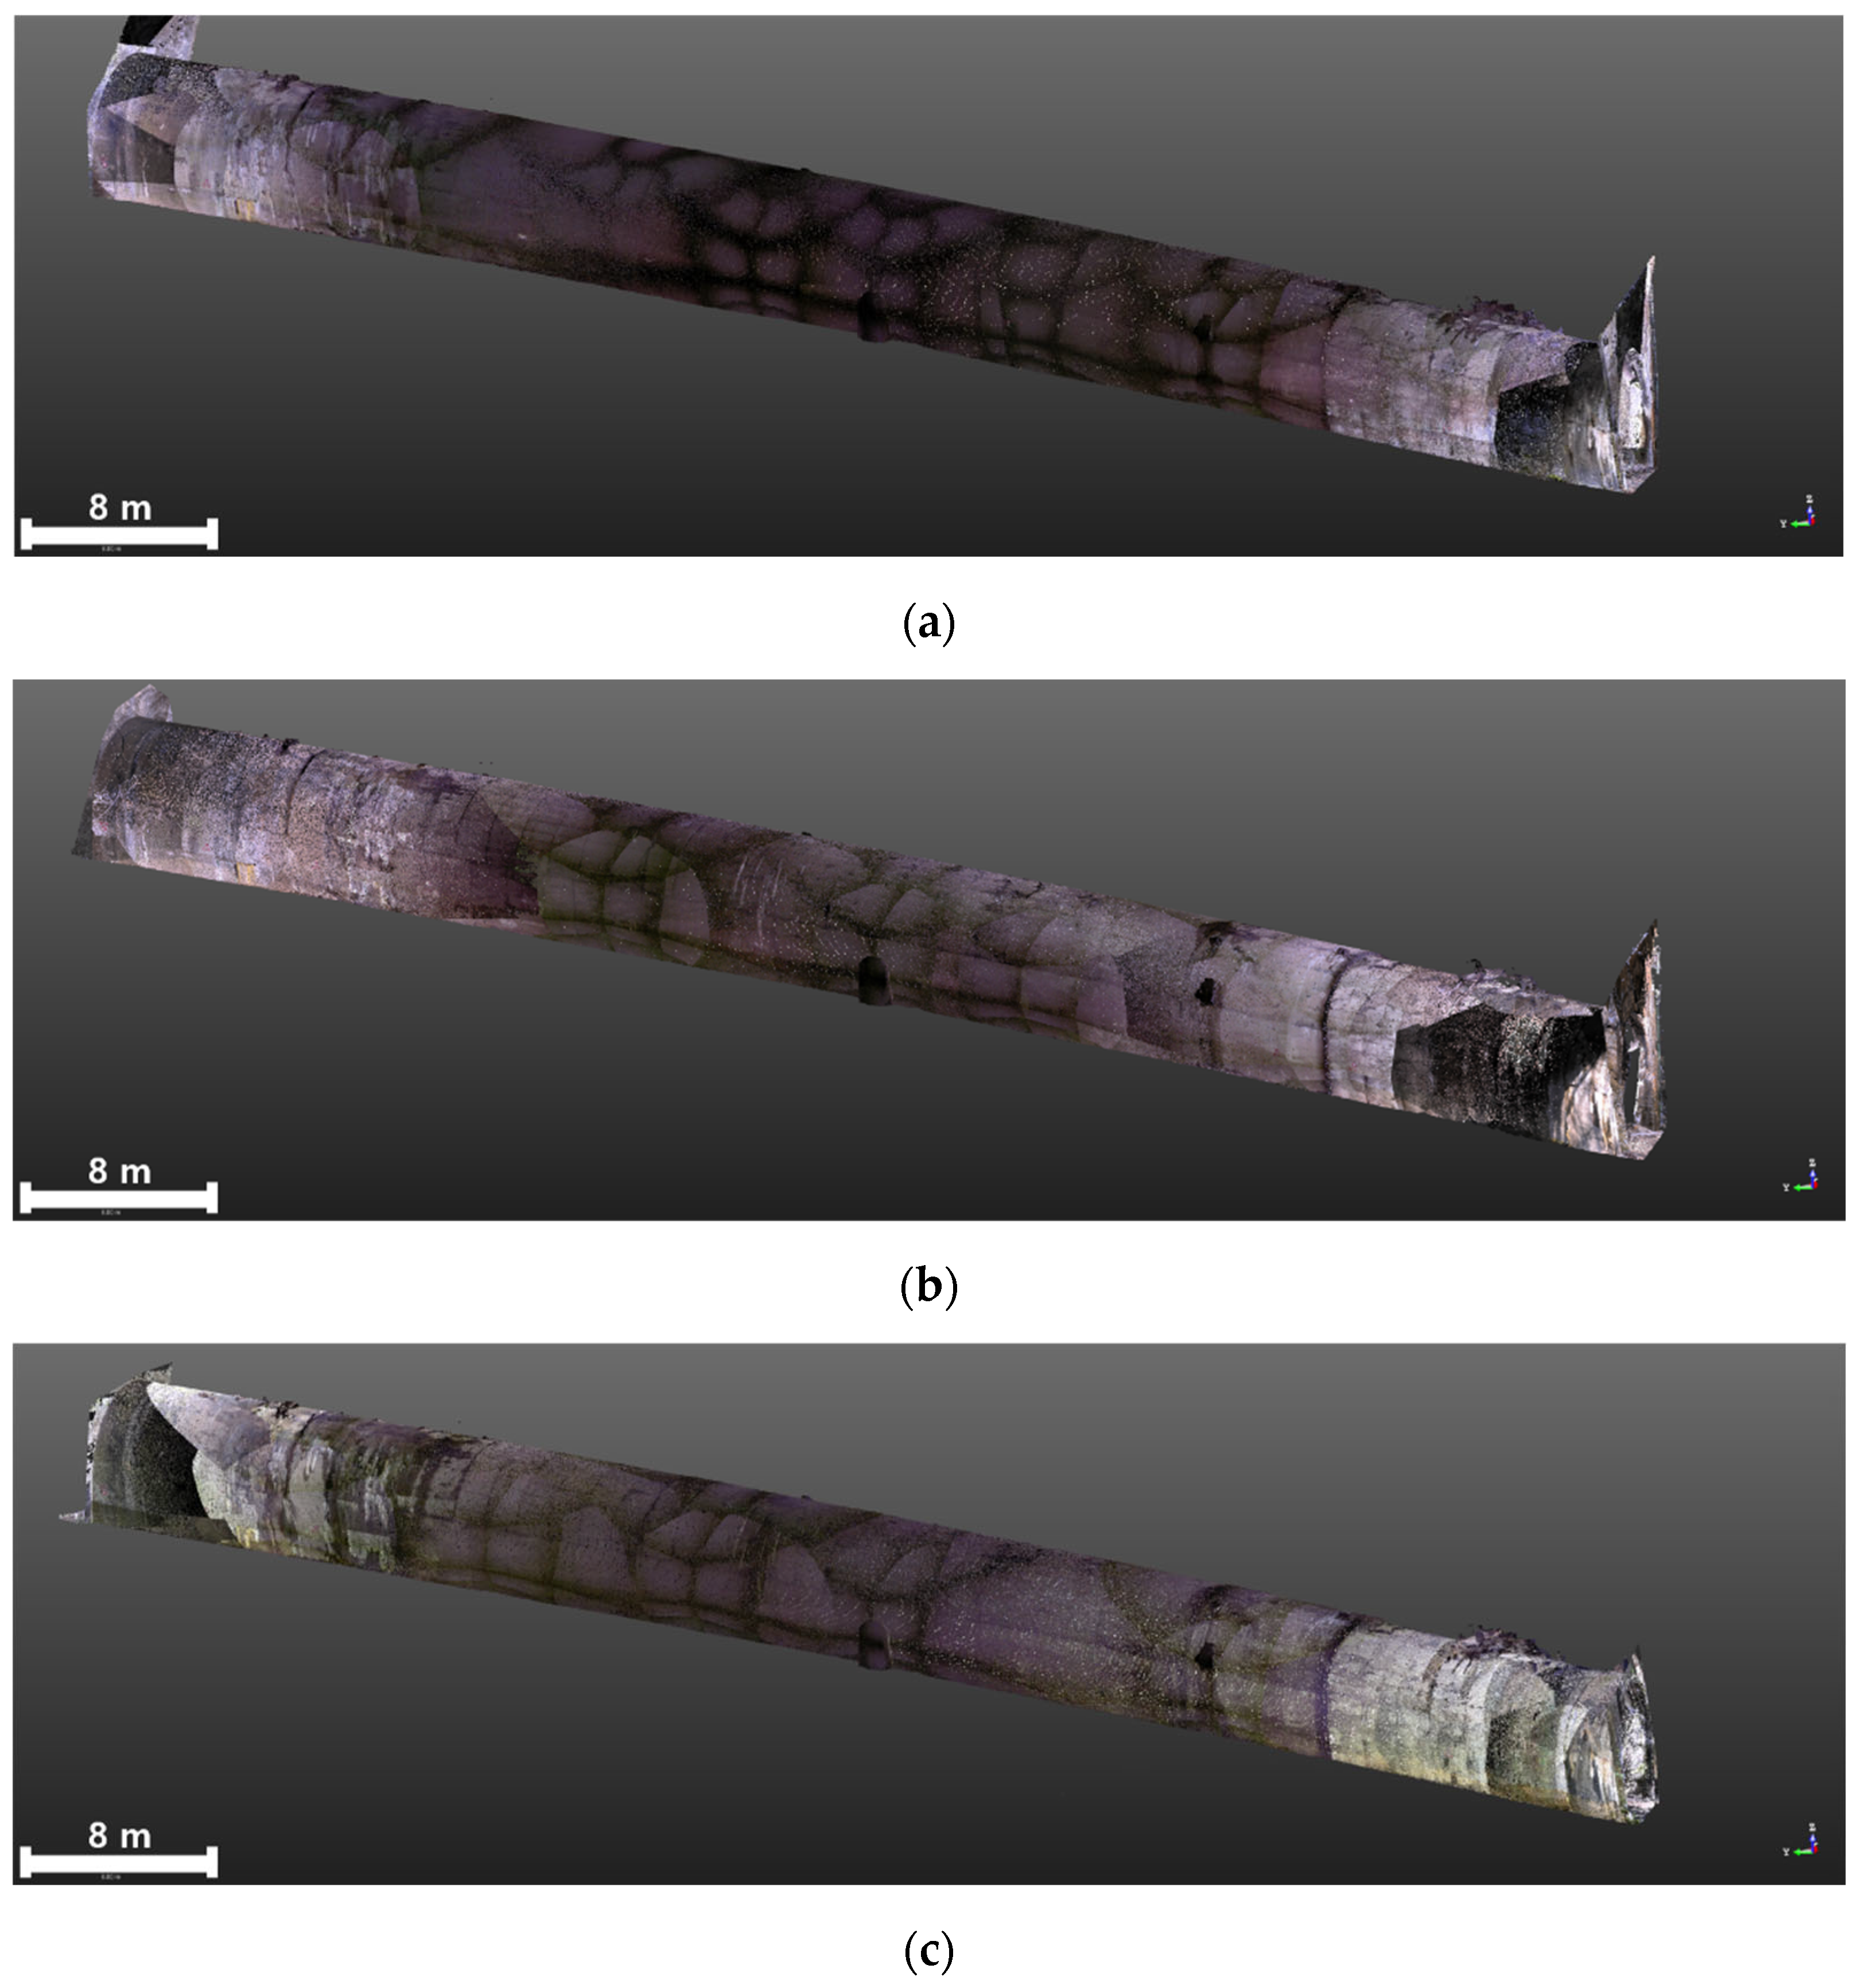
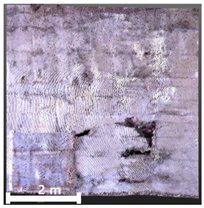
A filtering process was then applied to remove unnecessary objects (e.g., workers, equipment) and outliers caused by measurement noise from the integrated raw data. Through this process, three time-series point cloud models were constructed that accurately represent the tunnel concrete lining (Figure 5). The final models comprised 58,136,656 points in the first model, 68,359,395 points in the second, and 57,676,977 points in the third. The relatively higher number of points in the second model is attributed to the installation of additional scanners to resolve scan shadow areas caused by the icicles shown in Figure 4b.

3.3.2. Image-Based PCD Generation

The high-resolution images acquired during each time period were processed into 3D models using Bentley ContextCapture v 4.4.5, a commercial SfM-based software. As GNSS reception was unavailable inside the tunnel, data were collected by manual operation of the UAV (Figure 6).
To achieve precise georeferencing and accuracy assessment, we used 27 targets measured in Section 3.2.1. Of these, 4 targets located at both tunnel ends served as ground control points (GCPs) to determine model scale and transform it into the absolute coordinate system (EPSG: 5186). The remaining 23 targets were used as check points (CPs) to independently verify the geometric accuracy of the final model.
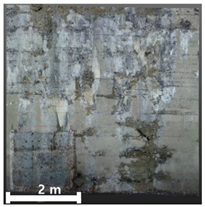
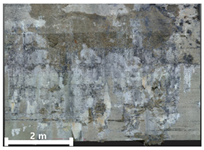
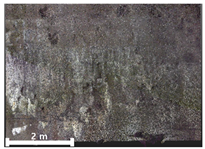
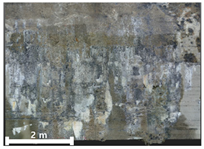
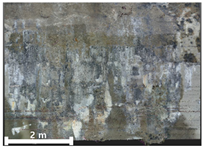
After undergoing aerotriangulation and georeferencing, a high-density 3D point cloud was generated. The final image-based 3D model (Figure 7) comprised approximately 1.86 billion points for the first model, 2.78 billion for the second, and 2.21 billion for the third.

3.3.3. Fusion-Based 3D Model Generation

The fusion-based model was developed to integrate the advantages of two datasets with complementary characteristics. The TLS-based PCD from Section 3.3.1 offers high geometric accuracy in the global coordinate system but has relatively low point density. In contrast, the image-based model from Section 3.3.2 provides a considerably higher point density and realistic texture, comprising billions of points, but has relatively lower global accuracy due to reliance on GCP-based indirect coordinate determination. Thus, the TLS-based PCD was used as the geometric reference, and the image-based model served as the texture reference for model fusion. The hardware that generated the data is an Intel i9-999k CPU, a GTX 1080Ti GPU, and the software that fused the data is Context Capture.
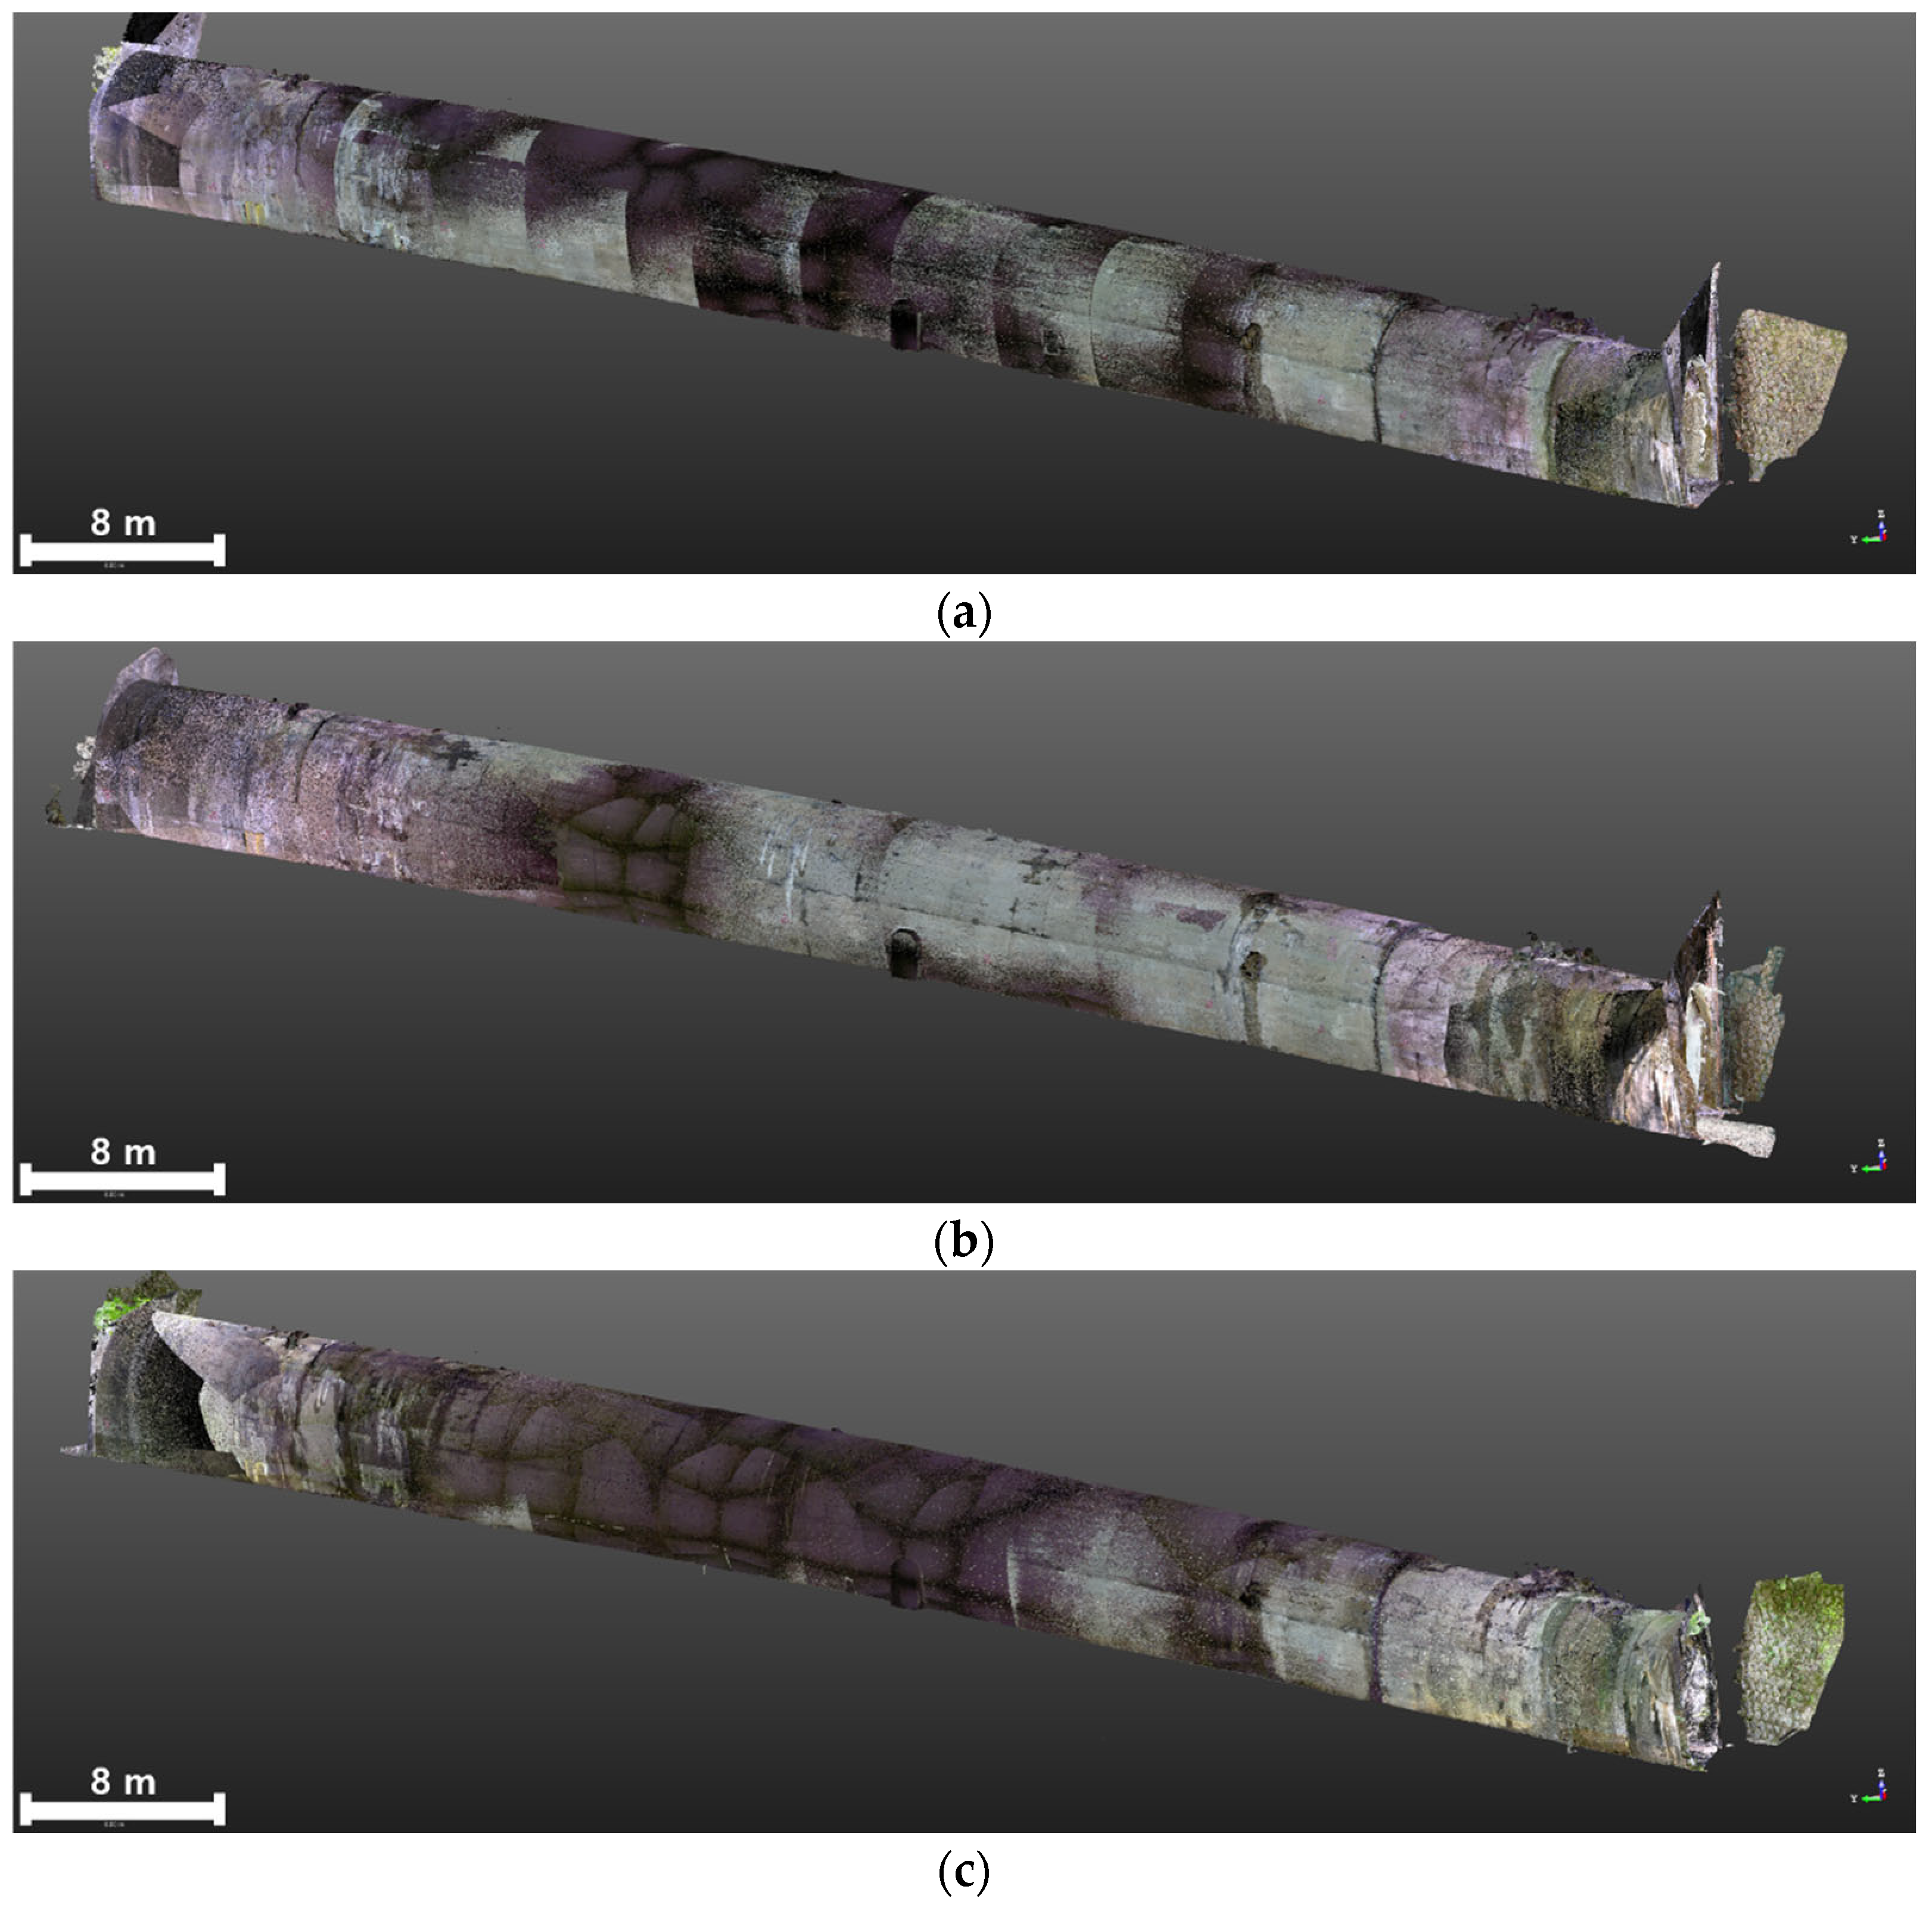
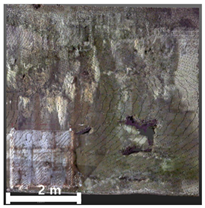
The fusion process involved two main steps of registration and texture mapping. since both models were already aligned within the same coordinate system through GCP registration, the initial registration was performed accordingly. However, it was difficult to secure mm-level precision with only GCP-based alignment, so ICP was essential. Subsequently, fine registration was conducted using the ICP (iterative closest point) algorithm, in which the TLS-based point cloud was adopted as the reference to identify corresponding points in the image-based point cloud. This process involved translation and rotation to minimize discrepancies between the two point clouds. The resulting integrated point cloud (Figure 8) comprised approximately 1.92 billion points for the first scan, 2.84 billion for the second, and 2.27 billion for the third.
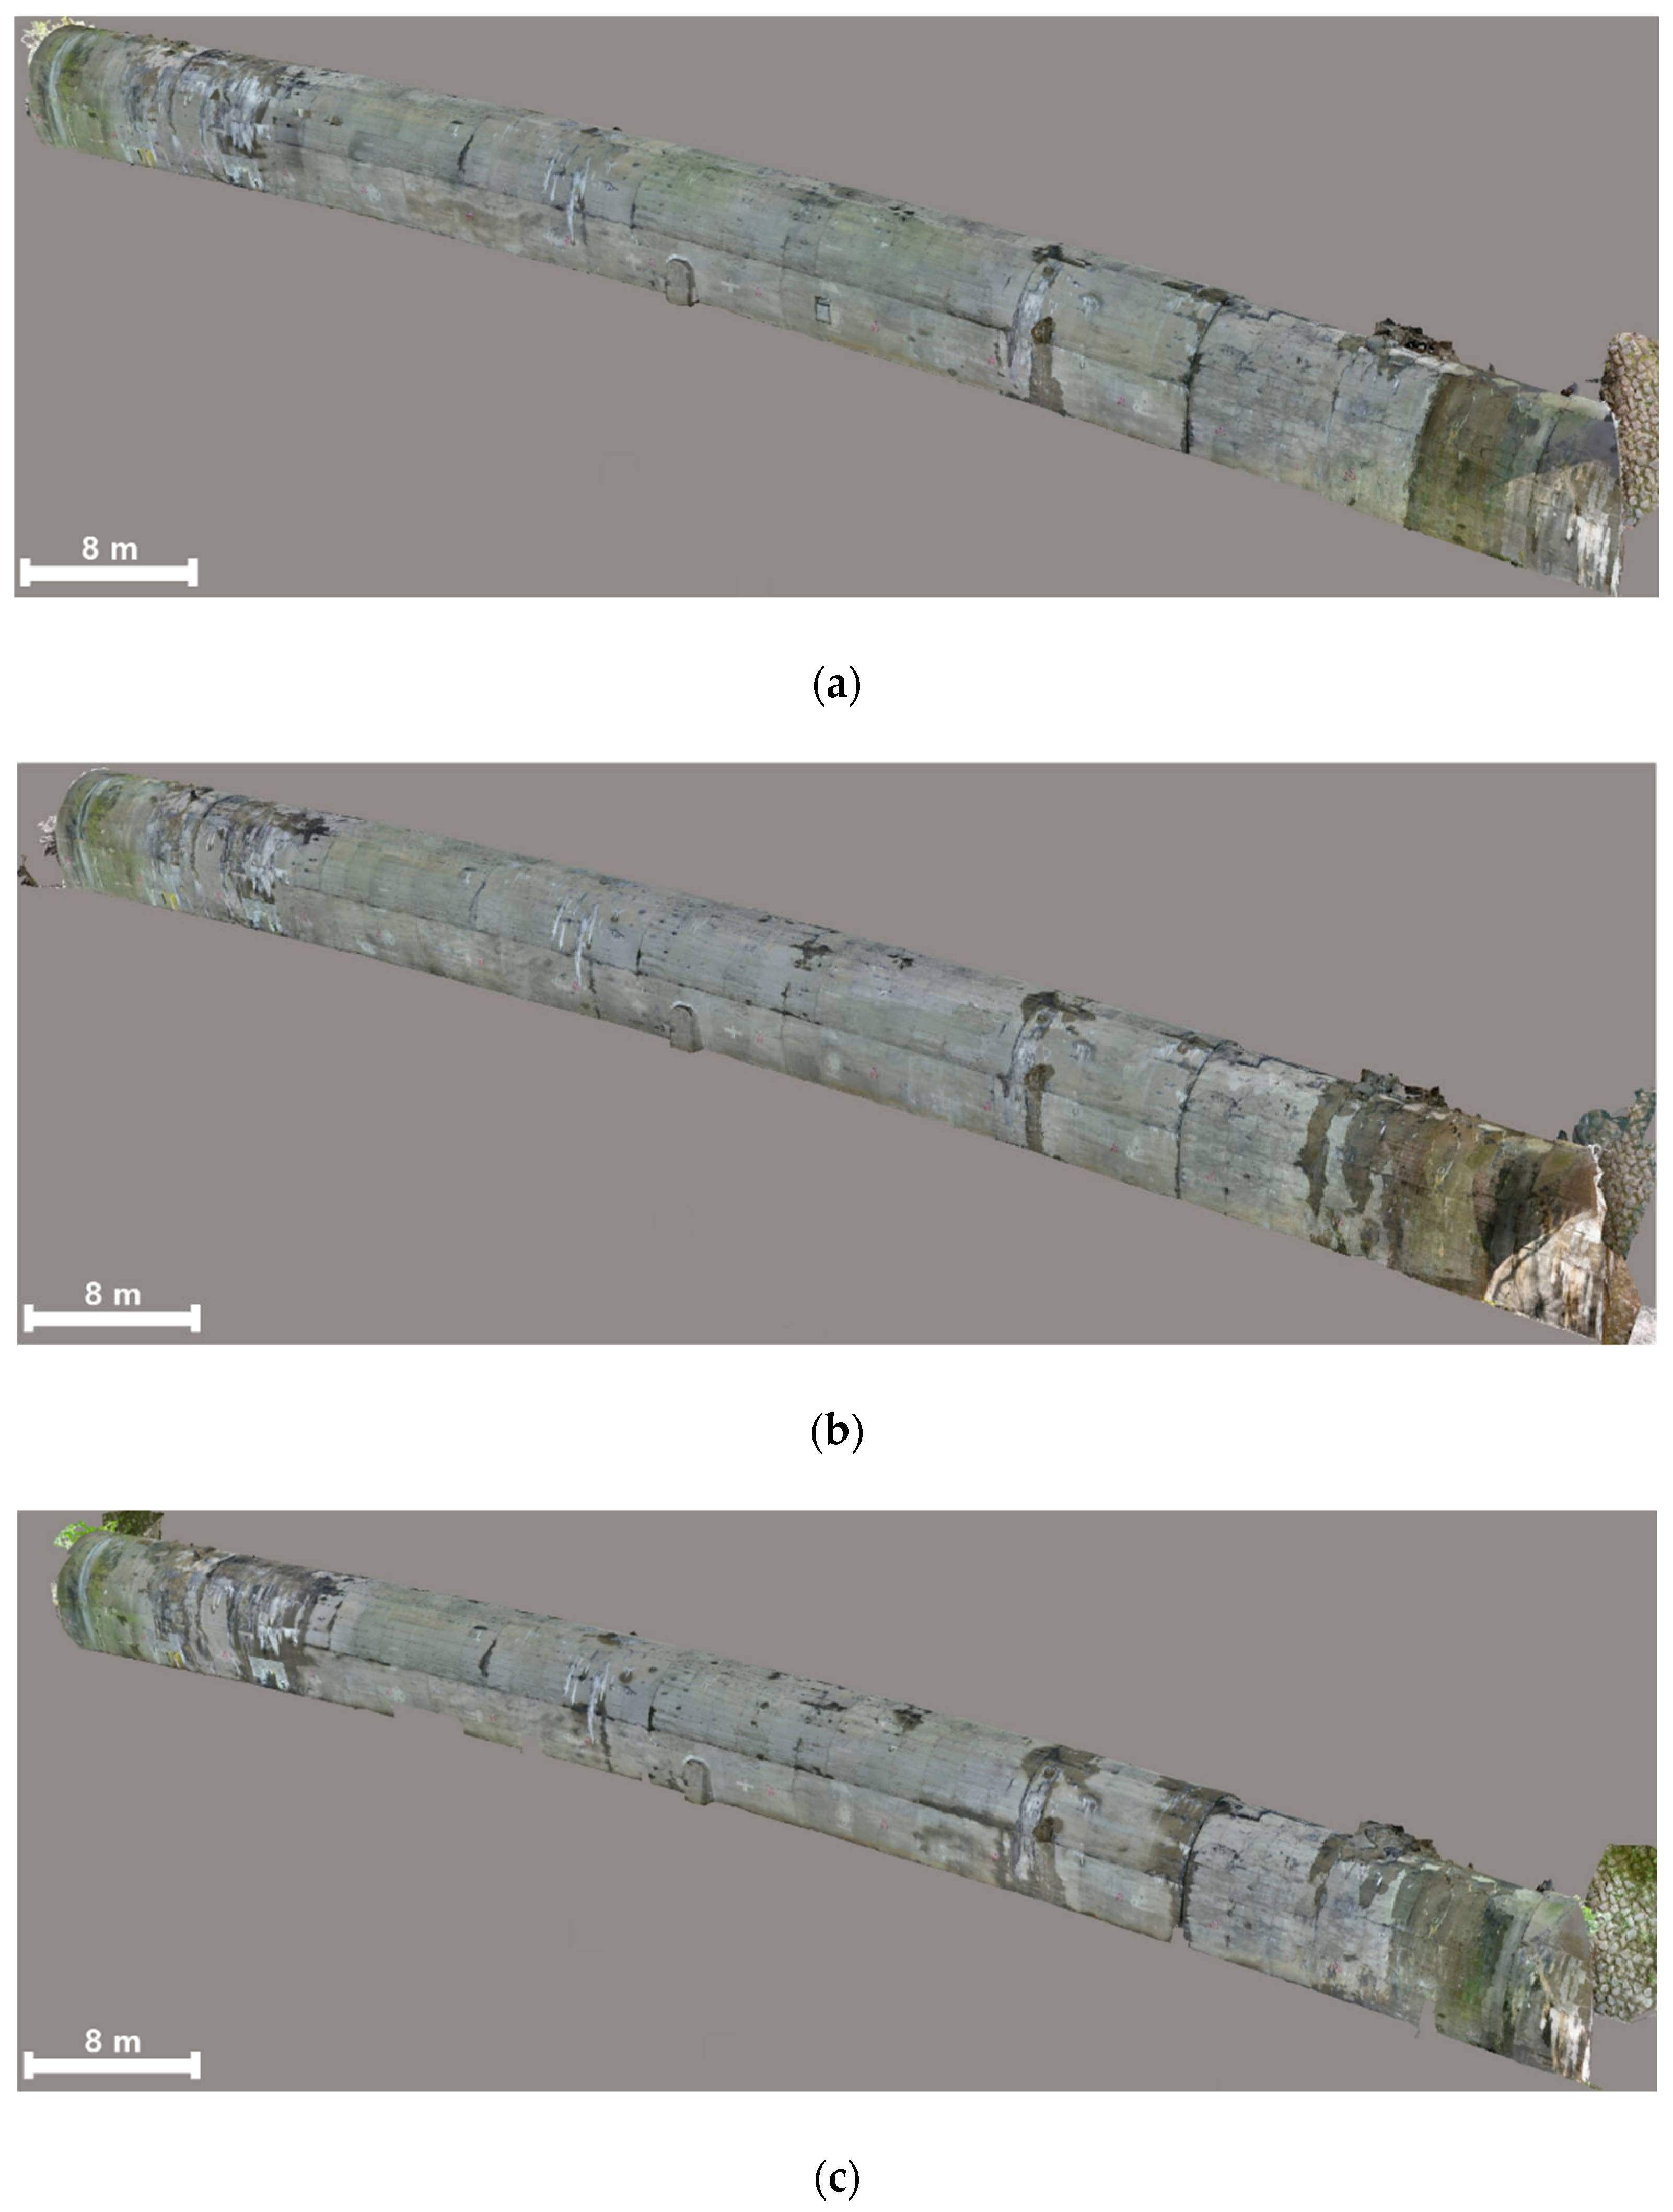
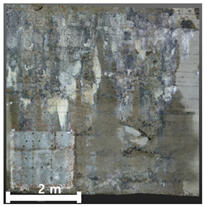
Subsequently, a 3D mesh was generated using the geometrically more accurate TLS-based PCD as the base structure. At this time, mesh texture mapping was performed based on points with RGB values of the high-resolution image, and the RGB values of the image-based PCD with relatively high point density were emphasized. resulting in the final fusion 3D model shown in Figure 9, which achieved both geometric precision and visual realism.

3.4. Framework for Comparative Analysis

3.4.1. Assessment of Geometric Precision and Location

We comprehensively analyze geometric accuracy, resolution, and level of detail to evaluate how accurately and finely the three types of models (TLS-based, image-based, and fusion-based) represent the tunnel geometry.
Geometric accuracy refers to the global positional precision of the model and was assessed using the 23 independent check points (CPs) described in Section 3.3.2. The 3D distance error between the ground-truth coordinates of each CP, measured by the total station, and the corresponding coordinates extracted from each 3D model was calculated. Based on these results, the root mean squared error (RMSE) for all CPs was computed for each model. This enabled a quantitative comparison of how accurately each model represents the true structure in the coordinate system.
Resolution and level of detail indicate how much fine-scale information the model contains. For quantitative evaluation, point density (number of points per square meter) was calculated and compared for each model using representative planar sections of the tunnel wall. For qualitative evaluation, specific areas with fine morphological features—such as spalling fracture surfaces or crack edges—were selected. The level of detail was then assessed by comparing how well each model visualized these features.

3.4.2. Assessment of Damage Representation and Visualization Quality

The practical usability of a 3D model in tunnel maintenance depends not only on geometric accuracy but also on how clearly and effectively it represents various types of damage. In this section, we compare and evaluate the performance of the three models in visualizing key tunnel damage indicators. Five major types of damage identified through field surveys were selected for analysis: spalling, damage/breakage, leakage, efflorescence, and cracks. These represent both geometrically deformative types (spalling, damage) and types characterized by surface appearance changes (leakage, efflorescence, cracks), enabling a comprehensive evaluation of model performance.
For the evaluation, regions of interest (ROIs) where the five damage types were clearly observed were selected. Each model was then analyzed in detail according to the following four criteria:
Detectability and Identifiability: This criterion assesses whether the presence or absence of damage is perceptible in each model. For example, it evaluates whether narrow cracks are missing in the TLS point cloud but clearly visible in the image-based model.
Geometric Characterization: This measures how accurately the three-dimensional shape and scale of the damage are captured. For spalling or damage, the focus is on evaluating the clarity of boundaries, depth, and area.
Visual/Textural Fidelity: This assesses how realistically the model reproduces the visual characteristics of damage, such as leakage patterns, the intensity of efflorescence, and crack morphology. These characteristics are key to assessing damage severity and progression.
Interpretability: This evaluates how easily and intuitively maintenance experts can identify the type, cause, and severity of the damage based on the model. It considers both the clarity of information and the effort required for interpretation.
The evaluation process involved presenting the ROI visualization results of the three models side by side for each damage type and analyzing them according to the aforementioned criteria. This qualitative analysis aimed to highlight the respective strengths and limitations of each modeling technique.

3.4.3. Assessment of Time-Series Change Detection Capability

Using the three time-series datasets, we evaluated how effectively each model detects and quantifies surface changes in the tunnel over time. This evaluation focused on identifying and tracking the progression of damage occurring before and after the winter season. All time-series models were created within the same absolute coordinate system established in Section 3.2.1, enabling direct comparisons without additional registration.
Change detection analysis was performed using two primary methods: geometric change analysis and visual change analysis.
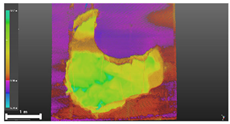
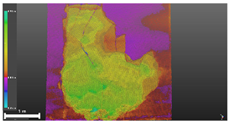
Geometric Change Analysis: This method quantitatively tracks changes in shape, such as the deepening or expansion of spalling or the emergence of new damage. Cloud-to-cloud (C2C) distance calculations were performed between the first (reference) model and the second and third models. The shortest 3D distances between models were computed, and the results were visualized using color maps to intuitively highlight change locations and magnitudes.
Visual Change Analysis: This method captures visually distinct changes—such as the spread of leakage, intensification of efflorescence, or the growth of fine cracks—even when geometric deformation is minimal. Texture models were overlaid or compared side by side to qualitatively analyze differences in color and surface patterns.
Based on these two analytical approaches, the time-series change detection capability of the three models was evaluated. The TLA-based model was mainly assessed for its ability to quantify geometric changes via precise C2C analysis. The image-based model was evaluated for its effectiveness in detecting visual changes through texture comparisons.

4. Results and Analysis

4.1. Geometric Performance Assessment

4.1.1. Geometric Accuracy Assessment

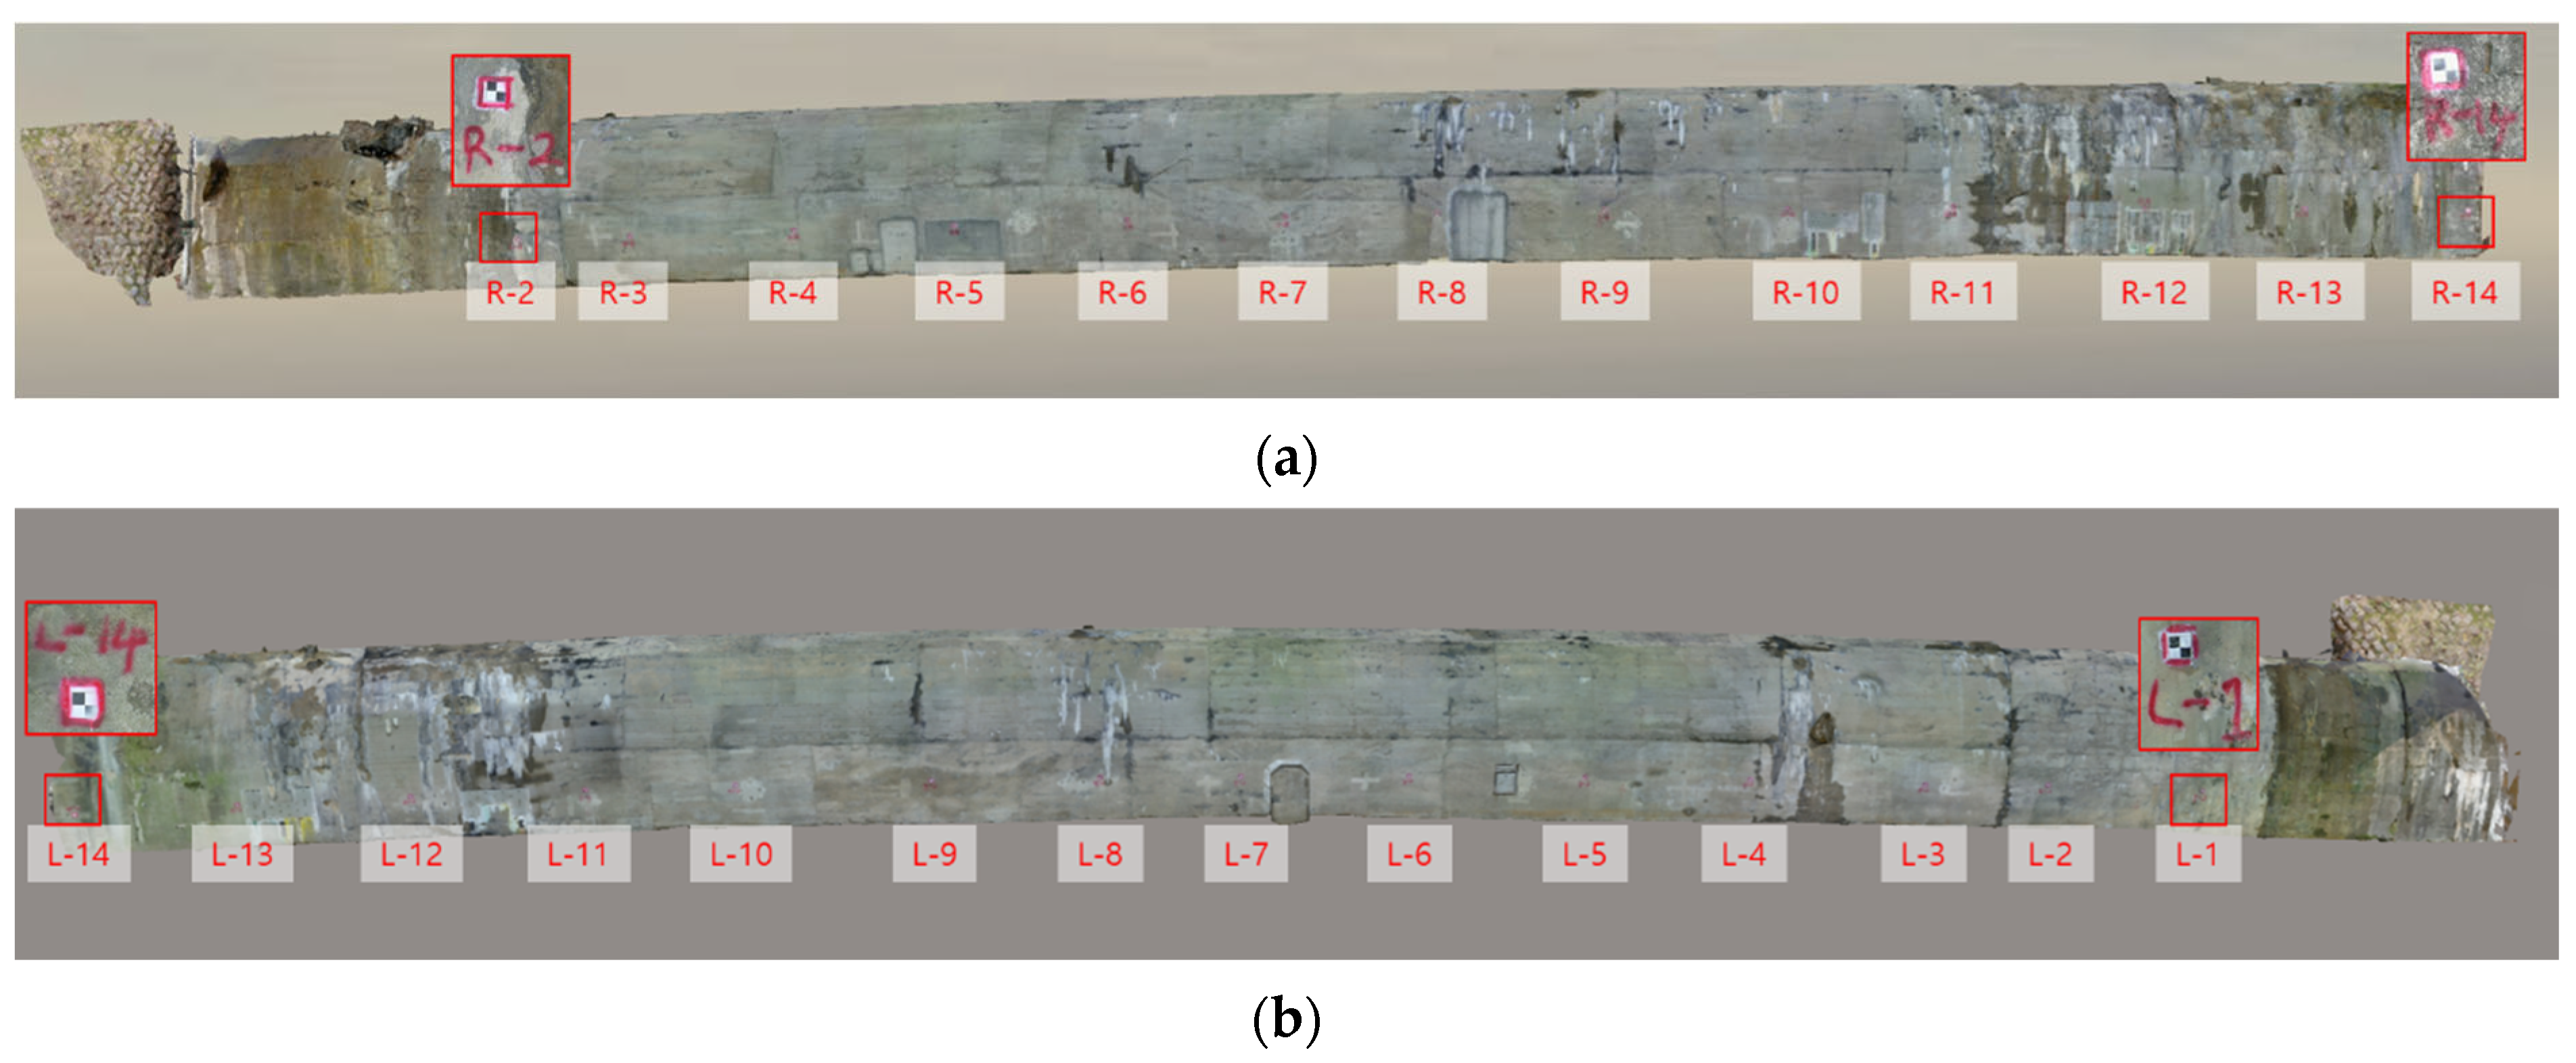
The geometric accuracy of the three models was evaluated based on 27 targets installed on the inner walls of the tunnel. Figure 10 shows the overall arrangement of the 13 targets installed on the right wall (Figure 10a) and the 14 targets installed on the left wall (Figure 10b). The targets were installed at intervals of approximately 5 m. Among these, accuracy was analyzed using 23 independent check points (CPs), excluding the 4 ground control points (GCPs) used for image modeling (R2, R14, L1, L14). Table 3 shows the coordinate errors and RMSEs for each model based on the time series data. The error characteristics of each model were analyzed in terms of the tunnel’s progress direction (X-axis), width direction (Y-axis), and height direction (Z-axis) as follows:
The TLS-based model demonstrated high precision across all axes, due to the active sensor technology of TLS that directly measures point coordinates using angles and distances. By axis, the error in the Y-axis direction (0.013 m to 0.017 m) was the lowest, showing stable results. The X-axis, corresponding to the tunnel’s progression direction, also showed high precision (0.012 m to 0.022 m). Z-axis (height) errors were slightly more variable (0.018 m to 0.037 m), but even the largest Z error was significantly smaller than the smallest error in the image-based model. The fact that errors across all axes remained within a few centimeters confirms that the model’s accuracy depends on equipment precision and a robust geodetic reference network, not on algorithmic estimations. This demonstrates that the TLS-based model reliably provides unbiased geometric data.
The image-based model exhibited the largest errors across all axes, with errors in the Z-axis (depth direction; 0.443 m to 0.497 m) being particularly pronounced. In long linear structures, such as tunnels, geometric constraints in the depth direction are weak, leading to significant amplification of errors. In particular, due to the nature of long linear structures such as tunnels, the amount of X and Y-axis image data is bound to be greater and the amount of Z-axis image data is bound to be relatively lower, which can be assumed to be one of the reasons for the large Z-axis error. The errors in the X-axis (0.186 m to 0.218 m) and Y-axis (0.176 m to 0.320 m) were also relatively large, which is attributed to global error accumulation during the determination of the model’s overall position and scale based on only a few GCPs.
The fusion-based model recorded the lowest errors across all axes and achieved the highest accuracy (X-axis: 0.007–0.015 m, Y-axis: 0.004–0.010 m, Z-axis: 0.007–0.019 m). This is interpreted as a synergistic effect from the ICP process, in which the ultra-dense, but geometrically inaccurate, image-based surface data are optimally aligned with the globally accurate TLS-based data. While image-based PCD forms high-resolution surfaces through high density, TLS-based PCD contributes to quantitative numerical output based on high geometric accuracy, so by matching the two data, each side compensates for its shortcomings and creates a model optimized for analysis. In particular, the local noise of the TLS-based PCD is averaged out during the matching process with the high-density image-based PCD, resulting in a lower RMSE. Ultimately, the fusion-based model combines the strengths of both techniques, achieving the highest geometric integrity. Ultimately, the fusion-based model combines the strengths of both techniques, achieving the highest geometric integrity.
These differences in geometric accuracy have a direct impact on the quantitative assessment of tunnel damage. The Z-axis error of up to 49.7 cm in the image-based model renders it unsuitable for measuring shallow damage volumes or analyzing fine displacements. In contrast, the TLS and fusion-based models—with errors below 1 cm and a lowest RMSE of 7 mm on the Z-axis for the fusion model—provide a robust basis for geometric measurements. Notably, the fusion-based model’s superior accuracy is essential for reliably detecting and tracking mm-scale damage progression in time-series analyses (Section 4.3), a key objective of this study.

4.1.2. Resolution and Level of Detail (LOD) Analysis

Alongside geometric precision, the resolution and level of detail (LOD)—which indicate how finely the tunnel surface is represented—are critical factors in evaluating damage. This section compares and evaluates the LOD of each model both quantitatively and qualitatively.
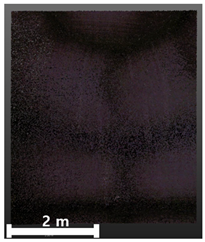
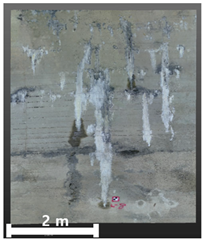
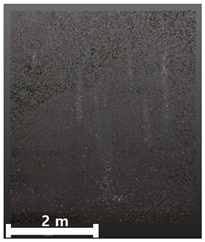
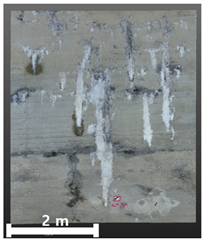
According to the point density results (Table 4), the image-based and fusion-based models exhibited densities over 20 times higher than the TLS-based model. This is due to the dense surface reconstruction capabilities of SfM. The fusion model, combining both datasets, showed the highest density. Minor differences were noted between time series datasets, with the first model showing slightly higher point density than the second and third. This variation is attributed to the presence of numerous icicles (Figure 4b) during the second scan after the winter season, which required altering the UAV’s flight path and distance for safety, thereby affecting image capture and point generation. This significant density disparity directly affects the LOD that each model can provide.
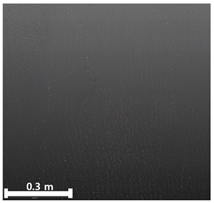
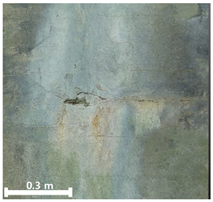
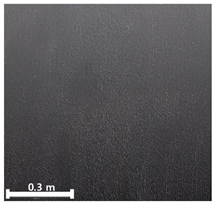
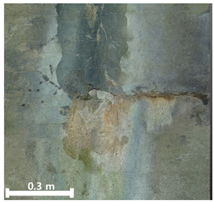
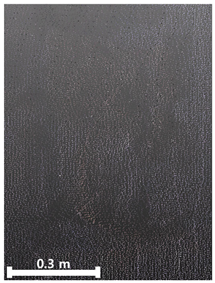
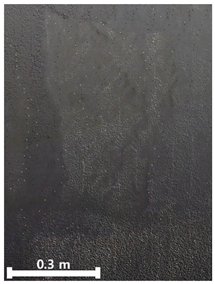
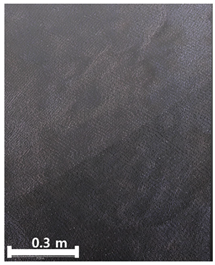
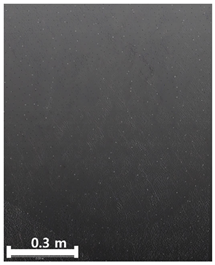
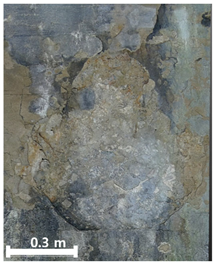
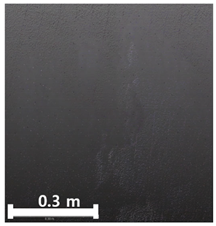
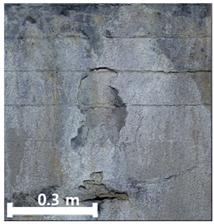
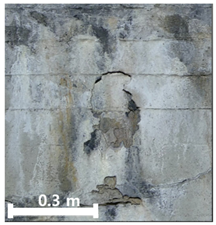
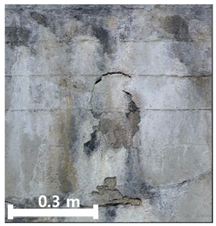
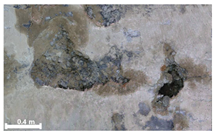
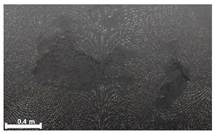
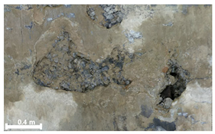
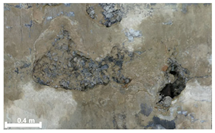
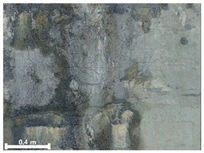
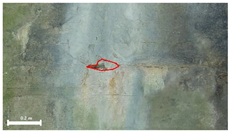
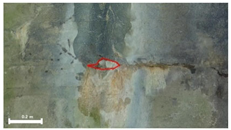
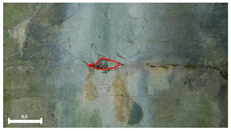
The effect of point density on LOD is clearly seen in visualization comparisons. When analyzing an artificial target in a controlled setting (Figure 11), the TLS-based model displayed an unclear representation of the crosshair due to its lower resolution. In contrast, the image-based and fusion-based models showed sharp, clear representations. This demonstrates that high-density models are essential for identifying fine surface features and accurately determining their locations. It also has a significant impact on determining the accuracy of the data.

4.2. Damage Representation and Visualization Assessment

4.2.1. Analysis of Spalling and Damage

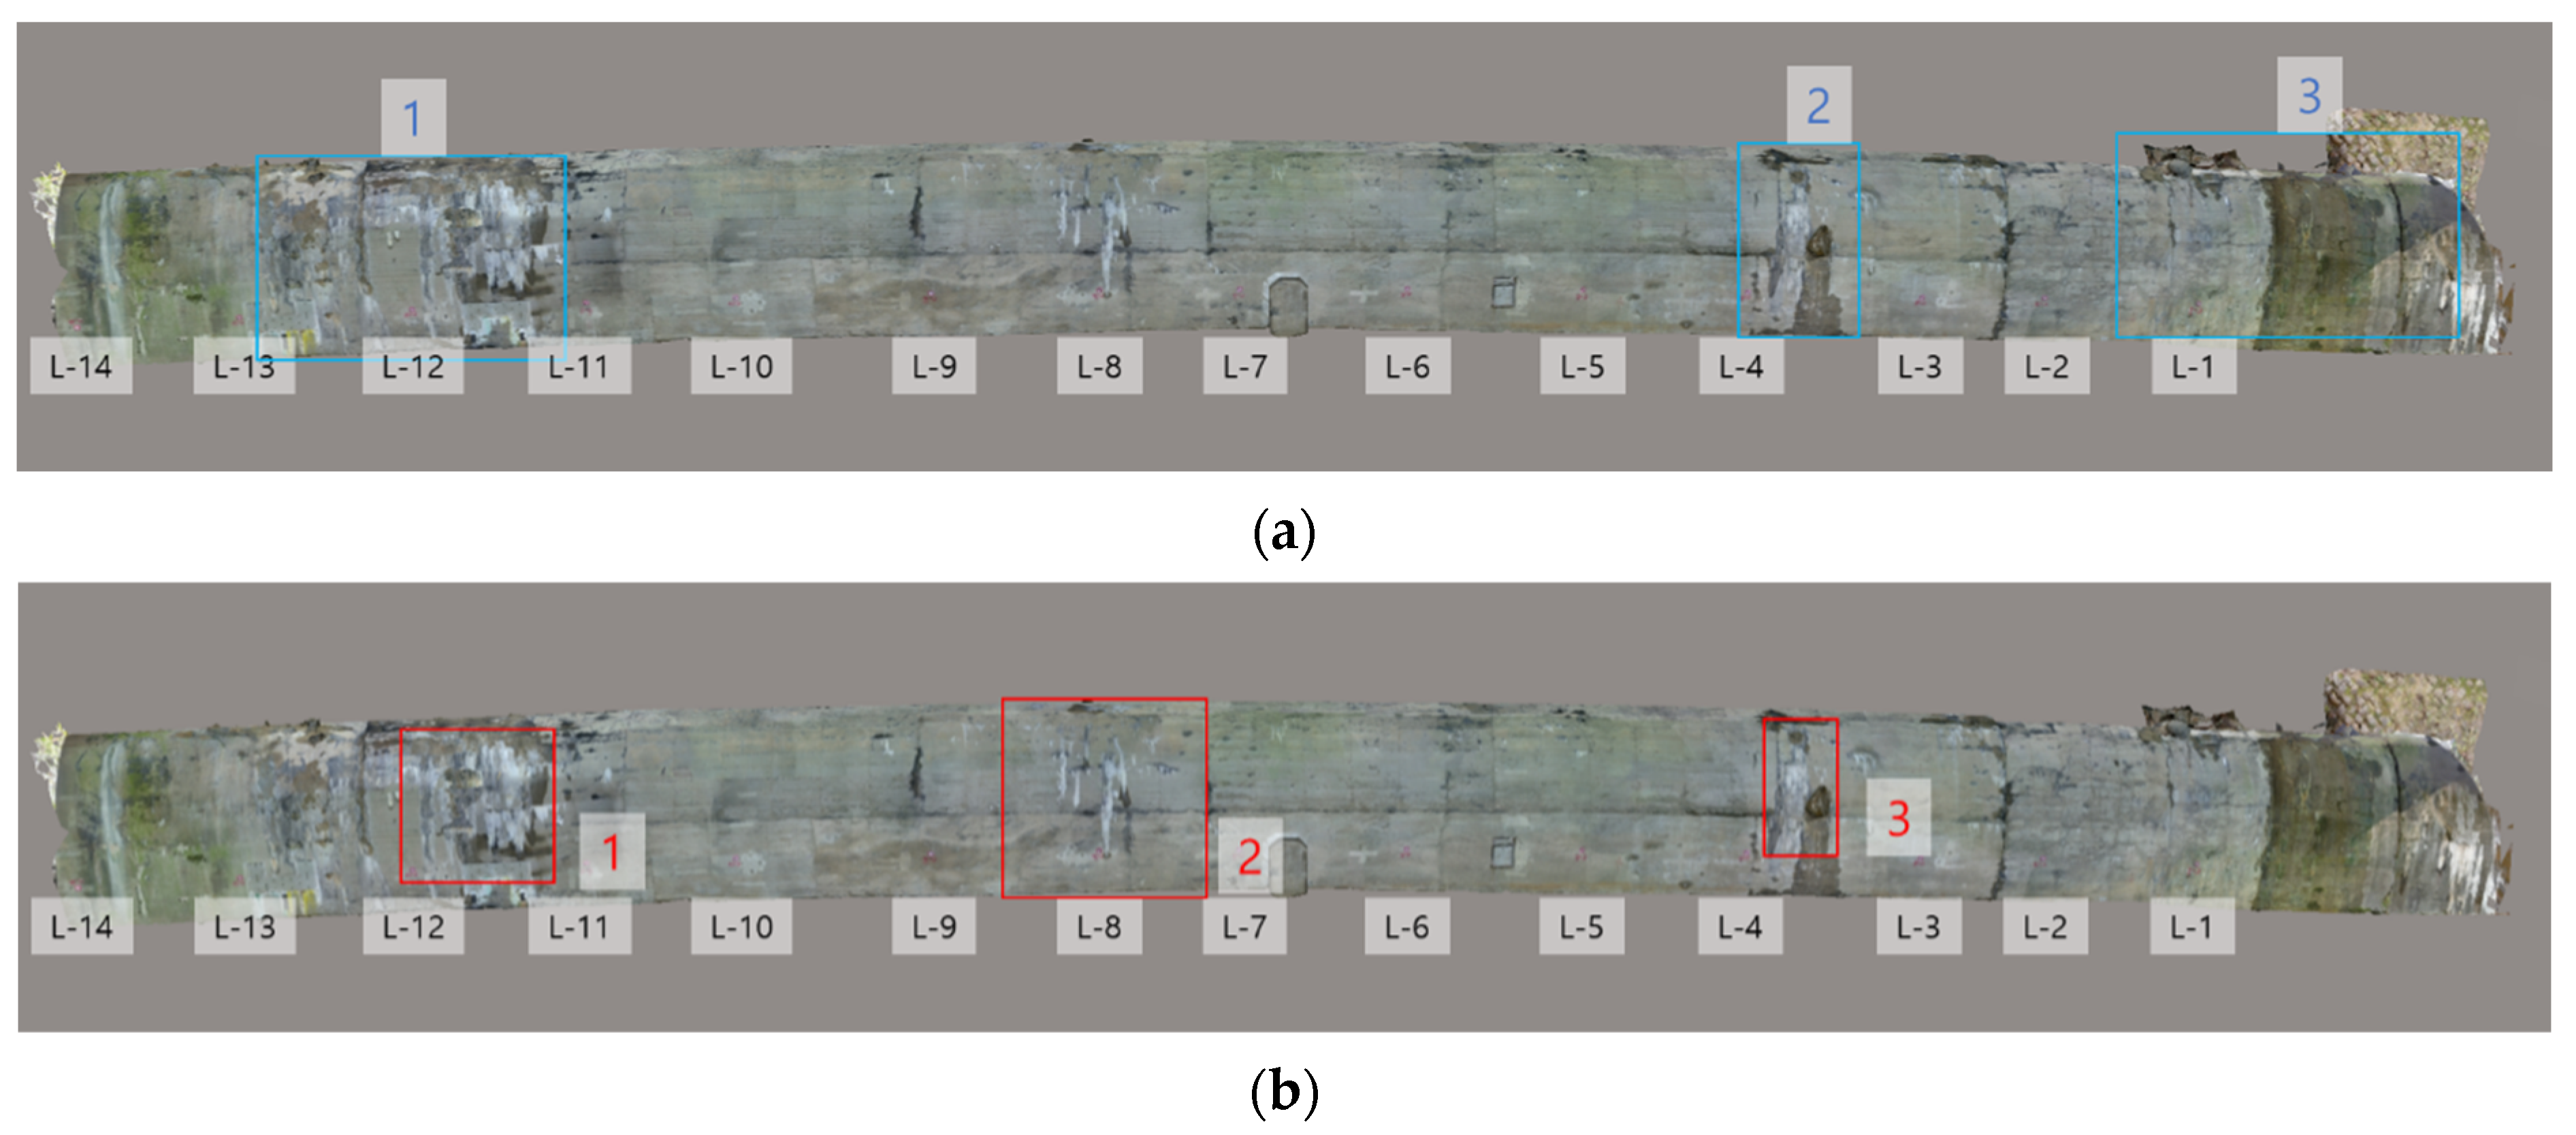
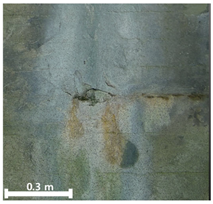
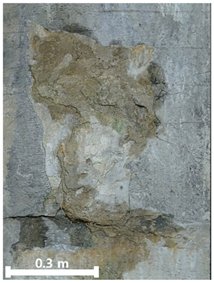
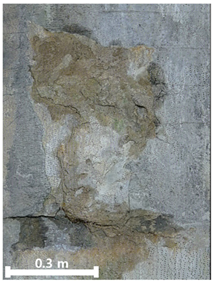
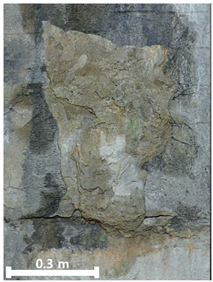
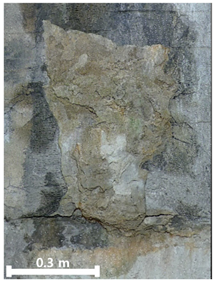
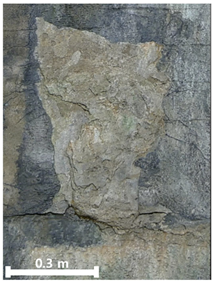
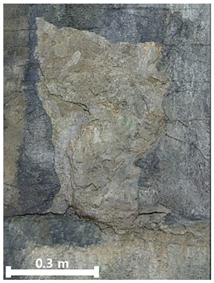
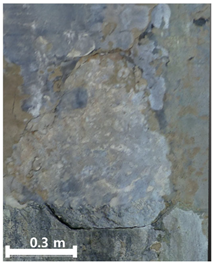
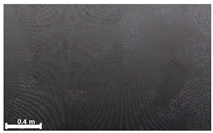
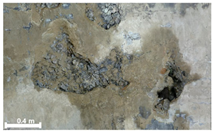
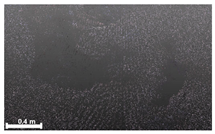
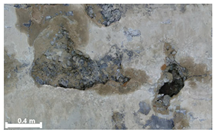
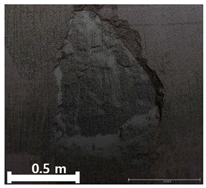
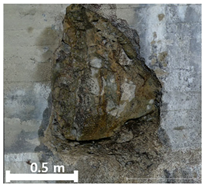
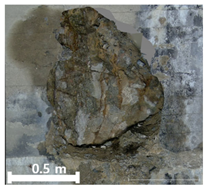
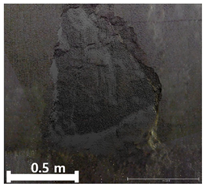
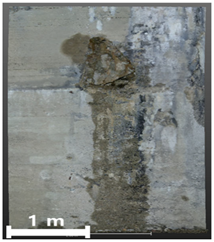
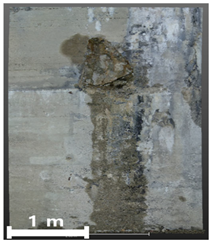
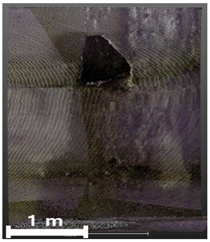
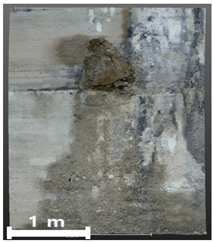
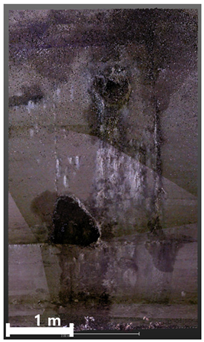
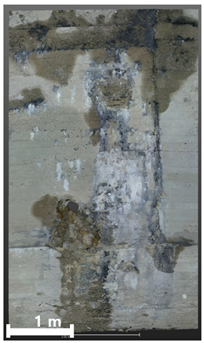
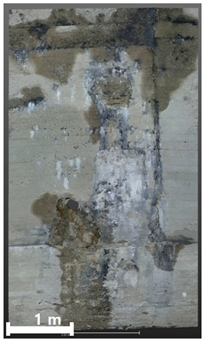
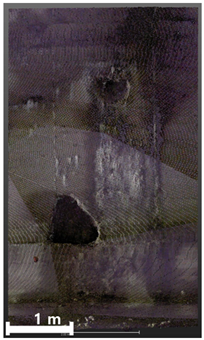
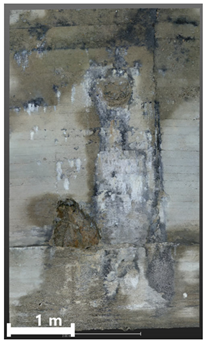
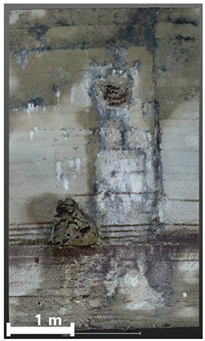
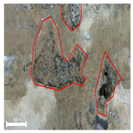
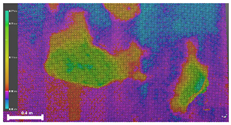
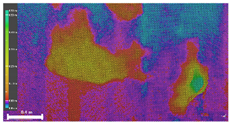
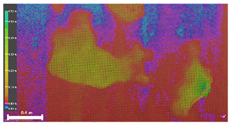
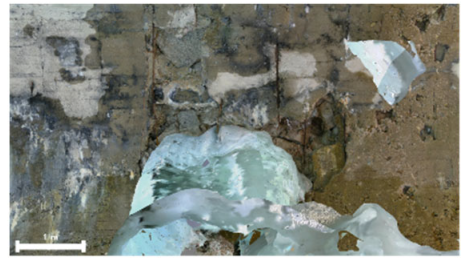
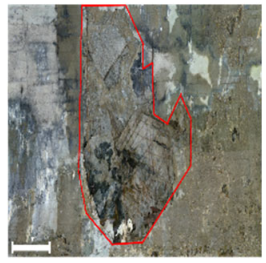
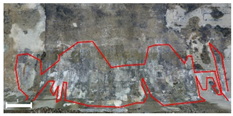
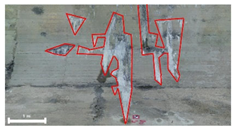
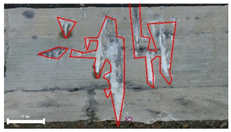
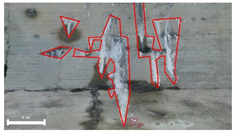
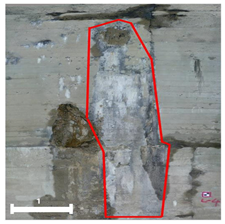
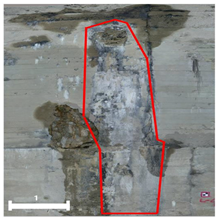
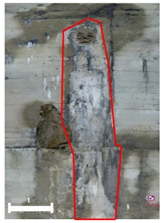
Spalling and damage are critical indicators of the deterioration of the structural integrity of tunnel linings. The damage representation performance of the three models was evaluated using time-series visualization results of the ROIs (Table 5 and Table 6) for four spalling areas and three damage areas indicated in Figure 12. These damages are primarily distributed along the left tunnel lining (L-12 to L-14) and on the ceilings and walls of L-13, L-1, and L-4. Notably, the ‘damage 3’ area, where icicles formed due to leakage during the second measurement, provides key insight into the complex causes and progression of the damage.
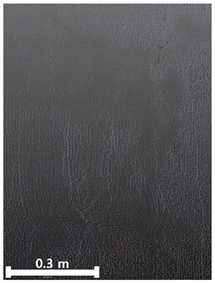
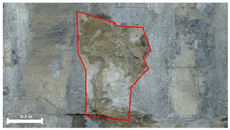
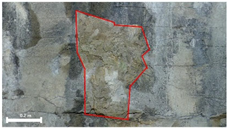
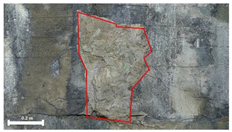
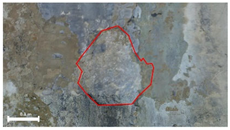
Table 7 presents the time-series changes in the four spalling areas. Shallow spalling, which involved minimal geometric change, could not be identified using the TLS-based model alone. However, it was clearly observable in the image-based and fusion-based models through surface texture changes. The time-series analysis revealed that the spalling did not significantly progress during the measurement period (from the 1st to the 3rd phase).
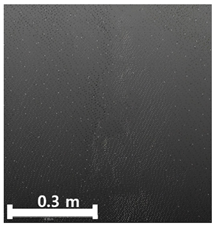
Table 8 compares the three damage areas. In contrast to spalling, more severe damage, such as ‘damage 2’ and ‘damage 3’, involved distinct geometric deformation, rendering it clearly detectable even in the TLS-based model.
It should be noted that the inability of TLS-based PCD to capture fine-scale defects is not due to inappropriate acquisition or simplification settings, but rather to the inherent limitation of point spacing (6.25–50 mm depending on distance) in TLS equipment. In contrast, the image-based model provides dense surface information but suffers from global geometric error. Although the visual appearance of image-based and fusion-based PCD seems similar, the fusion model shows significantly higher geometric accuracy (RMSE < 1 cm) compared to the image-based model (Z-axis error up to 49.7 cm). This improvement results from the ICP alignment process, where the ultra-dense image surface is constrained by the globally accurate TLS geometry, ensuring that visually observed defects correspond to their correct spatial coordinates.
The superior performance of the fusion-based model was particularly evident in these damage areas. For ‘damage 2’ and ‘damage 3’, the TLS-based point cloud data precisely complemented the curvature and shape of deeper damage, which could not be captured by image data alone. This resulted in the most complete and accurate geometric representation in the fusion-based model. The outcome exemplifies a key advantage of fusion technology, which compensates for photogrammetric limitations (e.g., shadowed areas) through direct measurement methods. Thus, the fusion-based model is essential for reliably analyzing not only the presence of damage but also its shape, extent, and subtle temporal changes.

4.2.2. Analysis of Leakage and Efflorescence

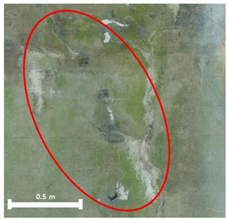
Leakage and efflorescence are key indicators of deteriorated waterproofness and material degradation, typically occurring near damaged or cracked areas. The damage representation performance of the three models was evaluated for three leakage areas and three efflorescence areas shown in Figure 13, based on time-series visualization results of the ROIs (Table 7 and Table 8). These areas are distributed along the ceilings and walls of L-11 to L-13, as well as L-8, L-4, and L-1. Particularly, the ‘leakage 3’ area, where icicles formed due to leakage during the second measurement, offers important clues for tracing the causes and progression of damage.
Table 9 shows the time-series changes in the three leakage areas. Again, the models displayed clear differences in detectability: the TLS-based model alone could not identify the leakage, whereas both the image-based and fusion-based models successfully captured it through changes in surface texture. Time-series analysis confirmed that the leakage areas exhibited visual changes during the measurement period (1st to 3rd phase), attributed to temporal effects.
Table 10 presents the comparison of the three efflorescence areas. Similarly to leakage, the TLS-based model, which only records geometric shape, failed to detect wet traces or white crystal deposits caused by efflorescence. In contrast, the image-based and fusion-based models, which incorporate RGB information, successfully detected surface visual changes and identified the spatial extent of efflorescence.

4.2.3. Analysis of Cracks

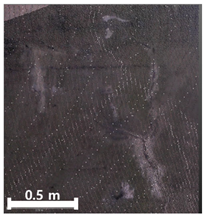
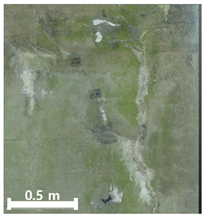
Cracks are key linear features indicating concrete lining strength or potential leakage pathways. The damage representation performance of the three models was evaluated for the three crack areas shown in Figure 14, based on the time-series visualization results in Table 9.
As the cracks are generally narrower than the TLS point spacing, detecting them using geometric shape data alone was nearly impossible. Consequently, the TLS-based model failed to represent the presence of fine cracks. In contrast, the image-based and fusion-based models, benefiting from high-resolution texture data, clearly identified even hairline cracks.

4.2.4. Overall Assessment of Damage Representation

The qualitative analysis of the five damage types is summarized in Table 10, highlighting the performance and limitations of each 3D model. As shown, models relying on a single sensor showed clear, complementary limitations depending on the damage type. The TLS-based model was effective in detecting damage involving substantial geometric deformation but completely failed to identify leakage, efflorescence, spalling, and fine cracks—features that rely on texture and color changes. Meanwhile, the image-based model performed well in visually identifying all damage types, it lacked geometric accuracy, limiting its reliability in representing the actual position and shape of the damage.
The fusion-based model provides the most robust and comprehensive qualitative representation across all damage types by integrating the advantages of both methods. It enables clear visual detection and precise geometric representation within a unified 3D environment.

4.3. Time-Series Change Detection Assessment

4.3.1. Geometric Change Detection

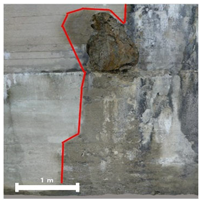
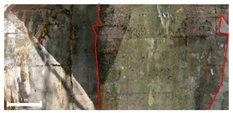
The geometric changes between the high-precision fusion-based models constructed at three time points were quantitatively analyzed. The analysis was conducted in two ways, depending on the characteristics of the damage type. For shallow spalling, the absolute area of the damage zone was individually measured in each time-series model, and the values were compared. For large-scale damage, the area and volume of the damage regions were directly measured in each model to track changes, and cloud-to-cloud (C2C) analysis was used to visually verify these changes. The boundaries of the tunnel damage areas were determined through a combined procedure of geometric and visual criteria. For spalling and large-scale damage, cloud-to-cloud (C2C) distance maps were generated, and regions exceeding a displacement threshold of 1 cm were delineated as damage boundaries. For leakage and efflorescence, regions of interest (ROIs) were manually defined based on distinct RGB texture differences (e.g., dark wet traces, white crystalline deposits) and validated against field survey photographs. For cracks, continuous linear features were visually identified in the textured models, and their lengths and widths were extracted through manual annotation.
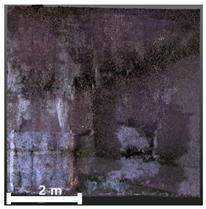
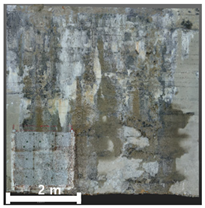
Table 11 shows the area values measured by each time-series model for the four spalling areas. The measured areas at the three times were nearly identical, indicating that the spalling remained stable during the measurement period.
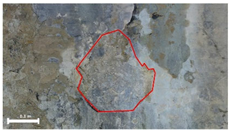
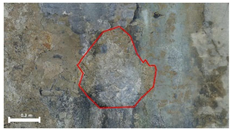
Significant changes were quantitatively observed in the damage areas (Table 12). For ‘damage 1’, the area increased slightly from 0.57 m2 in the first measurement to 0.60 m2 in the third, while the volume increased from 0.07 m3 to 0.09 m3. Similarly, for ‘damage 2’, the area increased from 0.57 m2 to 0.60 m2, and the volume from 0.16 m3 to 0.18 m3, indicating slight progression after the freeze–thaw period.
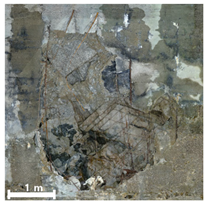
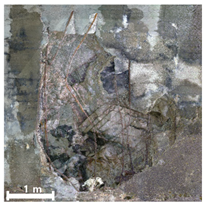
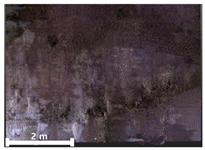
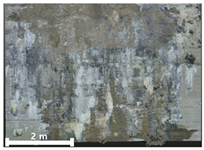
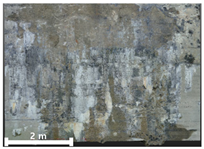
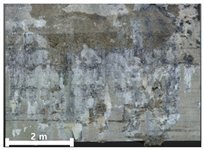
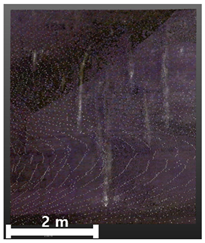
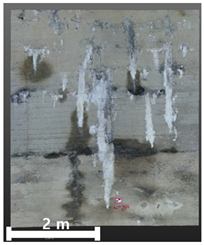
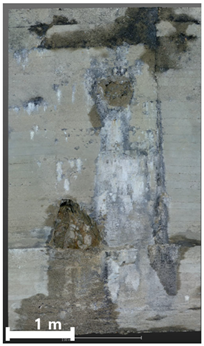
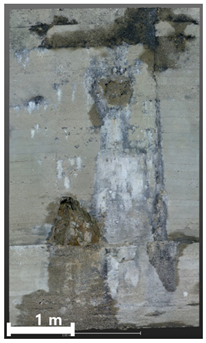
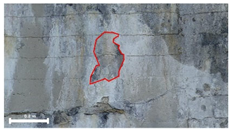
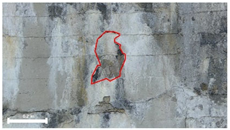
The most notable change was observed in the ‘damage 3’ area. The second model was excluded from analysis because a massive icicle formed at that location (Figure 4b), obscuring the tunnel’s original surface. Comparing the first and third models revealed a significant increase in the damage area by approximately 55.8%, from 5.77 m2 to 8.99 m2, and a volume increase of approximately 36.8%, from 2.47 m3 to 3.38 m3. These changes are clearly illustrated by the red-marked areas on the inspection map in Table 12. This suggests that the concrete, weakened by freeze–thaw action during winter, further deteriorated during the thawing period.

4.3.2. Visual Change Detection

Quantitative time-series analysis was conducted on leakage, efflorescence, and cracks—types of damage where visual characteristics are critical. Using a fusion-based model with high-resolution textures, changes in area and length were tracked for each damage type.
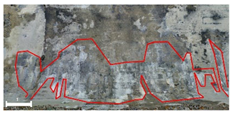
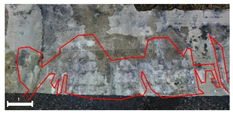
As shown in Table 13, the analysis of leakage areas revealed a dynamic pattern, with significant temporal fluctuations. For example, the ‘leakage 1’ and ‘leakage 2’ areas measured 25.41 m2 and 3.71 m2, respectively, in the first measurement (November), but significantly decreased to 6.36 m2 and 2.65 m2 in the second measurement (March). This is interpreted as a result of decreased moisture supply and drying due to freezing. In the third measurement, after thawing, the leakage areas expanded again to 38.82 m2 and 10.26 m2, respectively, indicating reactivation.
In contrast, the area of ‘leakage 3’ increased from 37.02 m2 in the first measurement to 50.65 m2 in the second, likely due to a large volume of leakage forming icicles that spread widely along the surface before freezing. In the third measurement, it slightly decreased to 43.32 m2. These dynamic changes highlight the limitations of single-epoch measurements in evaluating tunnel watertightness, demonstrating the importance of time-series monitoring.
The quantitative analysis of efflorescence and cracks revealed different patterns. As shown in Table 14, the three efflorescence areas showed no area change during the measurement period, remaining at 16.37 m2, 4.17 m2, and 2.59 m2. Similarly, the three cracks in Table 15 consistently measured 0.002 m in width and 0.371 m, 1.94 m, and 0.82 m in length across all three time points. This indicates that efflorescence and cracks remained stable, with no evidence of further development. Such quantitative differentiation between active and inactive damage provides crucial information for prioritizing maintenance within a limited budget.

4.3.3. Integrated Analysis of Damage Progression

By integrating the geometric and visual changes previously analyzed separately, a deeper understanding of the complex damage progression mechanism was achieved. A fusion-based time-series analysis was performed on the ‘damage 3’ area, where the most significant changes were observed.
In the first measurement, the area showed damage with an area of 5.77 m2 and a volume of 2.47 m3, along with extensive leakage traces over 37.02 m2. This indicates that structural degradation and reduced watertightness had already begun.
In the second measurement, during the winter season, a massive icicle obscured the tunnel surface, preventing accurate geometric analysis. However, visual data confirmed that the leakage area expanded to 50.65 m2, suggesting continued leakage until shortly before freezing and implying that freeze expansion pressure may have further stressed the structure.
In the third measurement, conducted after thawing, the extent of damage progression became evident. With the icicles gone, geometric analysis revealed a substantial increase in the damage area and volume to 8.99 m2 and 3.38 m3, respectively. Simultaneously, the leakage area decreased slightly to 43.32 m2.
This integrated analysis enables interpretations that are not possible with a single data type. Time-series visual data (e.g., leakage, icicles) provided clues about the cause of geometric damage, while geometric data quantitatively confirmed the resulting physical changes. This illustrates that the fusion-based model is a unique tool enabling high-dimensional analysis by correlating different time-series data types within a unified 3D spatiotemporal framework, enabling a comprehensive understanding and diagnosis of complex damage.

5. Discussion

5.1. Interpretation of Comparative Performance

The experimental results of this study consistently showed that the fusion-based 3D model outperformed the single sensor-based models across all damage types and analytical perspectives. This performance advantage stems from the inherent limitations of each data source and from how the fusion-based model effectively compensates for these limitations.
The TLS-based model demonstrated strong performance in accurately measuring the scale of damage involving clear geometric deformations, as it directly acquires high-precision 3D coordinates. However, this model had limitations such as being “geometrically precise but semantically blind.” That is, because it lacks information on surface color and texture, it failed to detect damage that relies on visual characteristics, such as leakage, efflorescence, spalling, and fine cracks.
In contrast, the image-based model showed excellent performance in visually identifying all types of damage using high-resolution RGB data. However, it exhibited the characteristic of being “semantically rich but geometrically unreliable.” As confirmed by the RMSE analysis in Section 4.1.1, the indirect 3D reconstruction method (SfM) caused significant geometric errors, particularly in linear structures like tunnels, rendering it unsuitable for reliably analyzing the exact location or scale of damage.
The strength of the fusion-based model lies in its ability to overcome the mutually exclusive limitations of these two approaches. In this study, the fusion-based model used precise TLS point clouds as a ‘geometric scaffold’ that defined the 3D space, and aligned high-resolution images as a ‘semantic layer’ mapped onto it. This approach effectively combined visual characteristics with precise 3D coordinates and shape information in a single model. As demonstrated in Section 4.3.3, the synergy of this data fusion enabled the inference of visual phenomena (leakage, icicles) as the causes of freeze-expansion pressure and quantitatively validated the resulting increase in damage volume.
In time-series analysis particularly, the stability of this geometric scaffold is critical. With the geometric instability of image-based models, distinguishing between actual damage displacement and model error is difficult. The fusion-based model, however, provides a reliable reference frame that enables accurate tracking of even minute change.

5.2. Practical Implications for Tunnel Asset Management

The fusion-based 3D modeling technology proposed in this study offers tangible practical benefits beyond academic validation, addressing limitations of the conventional labor-intensive maintenance system and transforming tunnel asset management. These benefits are categorized as improvements in efficiency, precision, and safety.
It significantly enhances maintenance efficiency and cost-effectiveness. Traditional visual and tactile inspections require considerable time and skilled personnel, while traffic control during inspections incurs major socio-economic costs. The remote data acquisition method using UAVs and LiDAR presented here reduces on-site inspection time to a few hours and enables off-site data analysis without disrupting traffic. This contributes to both direct labor cost savings and a reduction in social costs from minimized traffic control.
The approach enables precise, objective decision-making based on data. Subjective assessments such as “large spalling” or “long cracks” are replaced with quantifiable indicators, such as, “damage volume of 3.38 m3” or “crack length of 1.94 m.” As all damage data are accumulated over time with precise 3D coordinates, damage history management becomes more reliable. This lays the foundation for building a true digital twin that accurately reflects a structure’s evolving condition.
It supports a transition from reactive to preventive and predictive maintenance. A key contribution of this study lies in the time-series analysis capabilities demonstrated in Section 4.3. For example, during the same period, the area of “damage 3” increased sharply by approximately 55.8%, while other spalling or cracks remained stable. By quantitatively distinguishing the activity of damage in this way, decision-makers can prioritize repairs for high-risk areas and allocate resources more efficiently.
Safety is enhanced. Remote sensing minimizes the time inspectors are exposed to hazardous tunnel environments, protecting worker safety. Additionally, early detection and preemptive repairs for progressing damage help prevent sudden failures, ensuring the safety of tunnel users.

5.3. Limitations and Future Research

Although this study demonstrates the significant potential of the proposed fusion-based approach in tunnel damage assessment, several limitations point to promising directions for future research.
The findings are based on a single testbed—an old, abandoned tunnel under specific environmental conditions. Although the methodology proved robust, its general applicability to other tunnel types, such as modern shield TBM tunnels or those under different ground conditions, remains to be validated. Future research should aim to test and refine the framework across diverse tunnel environments.
Although data acquisition is efficient, the subsequent data processing and analysis involve substantial manual effort. In particular, manually defining damage boundaries for quantification limits the scalability of the approach. A key future direction is developing AI-based automation techniques. Using the high-quality fusion models generated in this study as training data, deep learning algorithms like 3D U-Net or PointNet++ could be developed to automatically detect, segment, and quantify damage. This would considerably enhance the efficiency and scalability of the entire workflow.
Current operations rely on manual UAV control in GPS-denied environments and require separate lighting, rendering the process complex and operator-dependent. Future work should explore integrating real-time LiDAR-SLAM algorithms to enable fully autonomous UAV navigation. Diagnostic capabilities could also be expanded by incorporating additional NDT sensors such as thermal cameras (for subsurface delamination) or GPR (for void detection behind linings). This would enable a more comprehensive assessment of both surface and subsurface tunnel conditions—advancing the creation of a truly multi-modal digital twin.

6. Conclusions

This study aimed to overcome the inherent limitations of single-source data (image or LiDAR) in the digital maintenance of tunnel structures. To this end, three types of 3D models—image-based, TLS-based, and a fusion of both—were constructed using data from an actual aging tunnel and comparatively evaluated in terms of geometric accuracy, damage representation, and time-series change detection capability. The goal was to verify the effectiveness and technical superiority of the fusion-based model.
The key findings of this study are as follows: The fusion-based model achieved the lowest RMSE among all models, indicating the highest geometric accuracy, while also inheriting the high point density of the image-based model to deliver the best level of detail. It proved to capable of accurately representing both geometric deformations (e.g., spalling, structural damage) and visually identified damage (e.g., leakage, efflorescence, fine cracks). Time-series analysis demonstrated that only the fusion-based model could spatially and temporally correlate visual indicators (leakage, icicles) with the resulting geometric changes (increased damage volume), thereby enabling a comprehensive understanding of complex damage mechanisms.
This study is to quantitatively compare the performance of three major 3D modeling techniques in real aging tunnel environments, providing valuable benchmark data for future research. It demonstrates the feasibility of implementing a digital twin capable of managing damage history quantitatively, moving beyond qualitative damage identification. This establishes a technological foundation for shifting from the current subjective and reactive maintenance paradigm to a data-driven, objective, and preventive system.
In conclusion, fusing image and point cloud data is essential for reliably diagnosing tunnel conditions, offering more than just improved performance. The fusion-based modeling framework proposed and validated in this study is expected to serve as a core technology for next-generation intelligent tunnel asset management systems, particularly when integrated with AI-based automation in the future.

Author Contributions

Conceptualization, C.L.; Methodology, C.L.; Software, J.K.; Validation, J.K.; Formal analysis, C.L.; Investigation, C.L.; Data curation, J.K.; Writing—original draft, C.L. and J.K.; Writing—review & editing, D.K. (Donggyou Kim) and D.K. (Dongku Kim); Project administration, D.K. (Donggyou Kim); Funding acquisition, D.K. (Donggyou Kim). All authors have read and agreed to the published version of the manuscript.

Funding

This work was supported in part by the Korea Agency for Infrastructure Technology Advancement under Grant RS-2022-00142566.

Acknowledgments

Research for this paper was conducted under the Development of Advanced Management Technology (Total Care) for infrastructure (project no. RS-2022-00142566) funded by the korea Agency for Infrastructure Technology Advancement.

Conflicts of Interest

The authors declare no conflicts of interest.

References

  1. Jiang, Y.; Wang, L.; Zhang, B.; Dai, X.; Ye, J.; Sun, B.; Liu, N.; Wang, Z.; Zhao, Y.; Wang, Z.; et al. Tunnel lining detection and retrofitting. Autom. Constr. 2023, 152, 104881. [Google Scholar] [CrossRef]
  2. Poncetti, B.L.; Ruiz, D.V.; Assis, L.S.; Machado, L.B.; Silva, T.B.; Akinlalu, A.A.; Futai, M.M. Tunnel inspection review: Normative practices and non-destructive method advancements for tunnels with concrete cover. Appl. Mech. 2025, 6, 41. [Google Scholar] [CrossRef]
  3. Liu, G.; Zhu, X.; Yang, J.; Zhang, Z.; Song, J.; Yang, Y. Study of structural deterioration behavior of mining method tunnels under steel reinforcement corrosion. Buildings 2025, 15, 1902. [Google Scholar] [CrossRef]
  4. Yuan, P.; Ma, C.; Liu, Y.; Qiu, J.; Liu, T.; Luo, Y.; Chen, Y. recent progress in the cracking mechanism and control measures of tunnel lining cracking under the freeze–thaw cycle. Sustainability 2023, 15, 12629. [Google Scholar] [CrossRef]
  5. Liu, X.; Zhuang, Y.; Zhou, X.; Liang, N.; Mao, J.; Chen, H. Study of the damage characteristics and corrosion mechanism of tunnel lining in a sulfate environment. Front. Mater. 2024, 10, 1323274. [Google Scholar] [CrossRef]
  6. Yang, L.; Du, X.; Zhou, F.; Jiang, G. Structural Damage Assessment of Shallow Buried Tunnel Subjected to Multiple Slip Surfaces and Blind Reverse Fault: A Numerical Study. Smart Constr. Sustain. Cities 2025, 3, 5. [Google Scholar] [CrossRef]
  7. Attard, L.; Debono, C.J.; Valentino, G.; Di Castro, M. Tunnel inspection using photogrammetric techniques and image processing: A review. ISPRS J. Photogramm. 2018, 144, 180–188. [Google Scholar] [CrossRef]
  8. Li, G.; Lu, H.; Li, J.; Li, Z.; Li, Q.; Ren, X.; Zheng, L. Alternating interaction fusion of image-point cloud for multi-modal 3D object detection. Adv. Eng. Inform. 2025, 65, 103370. [Google Scholar] [CrossRef]
  9. Koch, C.; Georgieva, K.; Kasireddy, V.; Akinci, B.; Fieguth, P. A review on computer vision based defect detection and condition assessment of concrete and asphalt civil infrastructure. Adv. Eng. Inform. 2015, 29, 196–210. [Google Scholar] [CrossRef]
  10. Zhou, Z.; Li, S.; Yan, L.; Zhang, J.; Zheng, Y.; Yang, H. Intelligent recognition of tunnel lining defects based on deep learning: Methods, challenges and prospects. Eng. Fail. Anal. 2025, 170, 109332. [Google Scholar] [CrossRef]
  11. Zhu, A.; Xie, J.; Wang, B.; Guo, H.; Guo, Z.; Wang, J.; Xu, L.; Zhu, S.; Yang, Z. Lightweight defect detection algorithm of tunnel lining based on knowledge distillation. Sci. Rep. 2024, 14, 27178. [Google Scholar] [CrossRef]
  12. Zheng, A.; Qi, S.; Cheng, Y.; Wu, D.; Zhu, J. Efficient detection of apparent defects in subway tunnel linings based on deep learning methods. Appl. Sci. 2024, 14, 7824. [Google Scholar] [CrossRef]
  13. Li, B.; Chu, X.; Lin, F.; Wu, F.; Jin, S.; Zhang, K. A highly efficient tunnel lining crack detection model based on Mini-Unet. Sci. Rep. 2024, 14, 28234. [Google Scholar] [CrossRef]
  14. Wu, J.; Zhang, X. Tunnel crack detection method and crack image processing algorithm based on improved Retinex and deep learning. Sensors 2023, 23, 9140. [Google Scholar] [CrossRef]
  15. Zhu, A.; Wang, B.; Xie, J.; Ma, C. MFF-YOLO: An accurate model for detecting tunnel defects based on multi-scale feature fusion. Sensors 2023, 23, 6490. [Google Scholar] [CrossRef]
  16. Xue, Y.; Shi, P.; Jia, F.; Huang, H. 3D reconstruction and automatic leakage defect quantification of metro tunnel based on sfm-deep learning method. Undergr. Space 2022, 7, 311–323. [Google Scholar] [CrossRef]
  17. Qian, J.; Xue, F.; Wang, T.; Lin, Z.; Cai, M.; Shou, F. Combining SfM and deep learning to construct 3D point cloud models of shield tunnels and realize spatial localization of water leakages. Measurement 2025, 250, 112857. [Google Scholar] [CrossRef]
  18. Janiszewski, M.; Torkan, M.; Uotinen, L.; Rinne, M. Rapid photogrammetry with a 360-degree camera for tunnel mapping. Remote Sens. 2022, 14, 5494. [Google Scholar] [CrossRef]
  19. Luo, H.; Zhang, J.; Liu, X.; Zhang, L.; Liu, J. Large-scale 3D reconstruction from multi-view imagery: A comprehensive review. Remote Sens. 2024, 16, 773. [Google Scholar] [CrossRef]
  20. Fang, W.; Zhang, L.; Li, J.; Xue, Y. 3D Tunnel reconstruction and visualization through multi-smartphone measurement. Autom. Constr. 2022, 136, 104177. [Google Scholar]
  21. Xue, Y.; Zhang, S.; Zhou, M.; Zhu, H. Novel SfM-DLT method for metro tunnel 3D reconstruction and visualization. Undergr. Space. 2021, 6, 134–141. [Google Scholar] [CrossRef]
  22. Xue, Y.; Cai, X.; Shadabfar, M.; Shao, H.; Zhang, S. Deep learning-based automatic recognition of water leakage area in shield tunnel lining. Tunn. Undergr. Space Technol. 2020, 104, 103524. [Google Scholar] [CrossRef]
  23. Huang, H.; Cheng, W.; Zhou, M.; Chen, J.; Zhao, S. Towards automated 3D inspection of water leakages in shield tunnel linings using mobile laser scanning data. Sensors 2020, 20, 6669. [Google Scholar] [CrossRef]
  24. Huang, H.; Liu, S.; Zhou, M.; Shao, H.; Li, Q.; Thansirichaisree, P. Automated 3D defect inspection in shield tunnel linings through integration of image and point cloud data. AI Civ. Eng. 2025, 4, 12. [Google Scholar] [CrossRef]
  25. Wang, Z.; Zhu, Z.; Wu, Y.; Hong, Q.; Jiang, D.; Fu, J.; Xu, S. Automated tunnel point cloud segmentation and extraction method. Appl. Sci. 2025, 15, 2926. [Google Scholar] [CrossRef]
  26. Liu, C.; Sun, Q.; Li, S. A state-of-the-practice review of three-dimensional laser scanning technology for tunnel distress monitoring. J. Perform. Constr. Facil. 2021, 35, e04021085. [Google Scholar] [CrossRef]
  27. Yi, C.; Lu, D.; Xie, Q.; Xu, J.; Wang, J. Tunnel deformation inspection via global spatial axis extraction from 3D raw point cloud. Sensors 2020, 20, 6815. [Google Scholar] [CrossRef]
  28. Lin, W.; Sheil, B.; Zhang, P.; Zhou, B.; Wang, C.; Xie, X. Seg2Tunnel: A hierarchical point cloud dataset and benchmarks for segmentation of segmental tunnel linings. Tunnelling Undergr. Space Technol. 2024, 147, 105735. [Google Scholar] [CrossRef]
  29. Liu, W.; Gao, F.; Dong, S.; Wang, X.; Cao, S.; Wang, W.; Liu, X. An enhanced segmentation method for 3D point cloud of tunnel support system using PointNet++ and coverage-voted strategy algorithms. J. Rock Mech. Geotech. Eng. 2025, in press. [Google Scholar] [CrossRef]
  30. Cui, H.; Ren, X.; Mao, Q.; Hu, Q.; Wang, W. Shield subway tunnel deformation detection based on mobile laser scanning. Autom. Constr. 2019, 106, 102889. [Google Scholar] [CrossRef]
  31. Stałowska, P.; Suchocki, C.; Rutkowska, M. Crack detection in building walls based on geometric and radiometric point cloud information. Autom. Constr. 2022, 134, 104065. [Google Scholar] [CrossRef]
  32. Sánchez-Aparicio, L.J.; del Blanco-García, F.L.; Mencías-Carrizosa, D.; Villanueva-Llauradó, P.; Aira-Zunzunegui, J.R.; Sanz-Arauz, D.; Pierdicca, R.; Pinilla-Melo, J.; Garcia-Gago, J.; Pinilla-Melo, J.; et al. Detection of damage in heritage constructions based on 3D point clouds. A systematic review. J. Build. Eng. 2023, 77, 107440. [Google Scholar] [CrossRef]
  33. Flores-Fuentes, W.; Trujillo-Hernández, G.; Alba-Corpus, I.Y.; Rodríguez-Quiñonez, J.C.; Mirada-Vega, J.E.; Hernández-Balbuena, D.; Murrieta-Rico, F.N.; Sergiyenko, O.; Sergiyenko, O. 3D spatial measurement for model reconstruction: A review. Measurement 2023, 207, 112321. [Google Scholar] [CrossRef]
  34. Kaur, H.; Koundal, D.; Kadyan, V. Image fusion techniques: A survey. Arch. Comput. Methods Eng. 2021, 28, 4425–4447. [Google Scholar] [CrossRef]
  35. Wu, B.; Qiu, W.; Huang, W.; Meng, G.; Huang, J.; Xu, S. A multi-source information fusion approach in tunnel collapse risk analysis based on improved d–s evidence theory. Sci. Rep. 2022, 12, 3626. [Google Scholar] [CrossRef]
  36. Yang, Y.; Liu, Z.; He, C.; Li, L. Structural damage identification of shield tunnels using distributed fiberoptic sensors and information fusion. Tunn. Undergr. Space Technol. 2023, 131, 104761. [Google Scholar]
  37. Zhao, Y.; Liu, Y.; Mu, E. A review of intelligent subway tunnels based on digital twin technology. Buildings 2024, 14, 2452. [Google Scholar] [CrossRef]
  38. Bai, C.; Yu, J.; Zhang, Y. Digital twin-based rapid risk assessment for urban utility tunnels. Autom. Constr. 2023, 140, 104451. [Google Scholar]
  39. Huang, H.; Sun, Y.; Xue, Y.; Wang, F. Inspection equipment study for subway tunnel defects by grey-scale image processing. Adv. Eng. Inform. 2017, 32, 188–201. [Google Scholar] [CrossRef]
  40. Asakura, T.; Kojima, Y. Tunnel maintenance in Japan. Tunn. Undergr. Space Technol. 2003, 18, 161–169. [Google Scholar] [CrossRef]
  41. Ai, Q.; Yuan, Y.; Bi, X. Acquiring sectional profile of metro tunnels using charge-coupled device cameras. Struct. Infrastruct. Eng. 2016, 12, 1065–1075. [Google Scholar] [CrossRef]
  42. Huang, H.W.; Li, Q.T.; Zhang, D.M. Deep learning based image recognition for crack and leakage defects of metro shield tunnel. Tunn. Undergr. Space Technol. 2018, 77, 166–176. [Google Scholar] [CrossRef]
  43. Fujino, Y.; Siringoringo, D.M. Recent research and development programs for infrastructures maintenance, renovation and management in Japan. Struct. Infrastruct. Eng. 2020, 16, 3–25. [Google Scholar] [CrossRef]
  44. Balaguer, C.; Montero, R.; Victores, J.G.; Martínez, S.; Jardón, A. Towards fully automated tunnel inspection: A survey and future trends. In Proceedings of the 31st International Symposium on Automation and Robotics in Construction and Mining, Sydney, Australia, 9–11 July 2014; Volume 31. [Google Scholar] [CrossRef]
  45. Ukai, M. Advanced inspection system of tunnel wall deformation using image processing. Q. Rep. RTRI 2007, 48, 94–98. [Google Scholar] [CrossRef]
  46. Zhang, W.; Zhang, Z.; Qi, D.; Liu, Y. Automatic crack detection and classification method for subway tunnel safety monitoring. Sensors 2014, 14, 19307–19328. [Google Scholar] [CrossRef] [PubMed]
  47. Yasuda, T.; Yamamoto, H.; Enomoto, M.; Nitta, Y. Smart tunnel inspection and assessment using mobile inspection vehicle, non-contact radar and AI. In Proceedings of the 37th International Symposium on Automation and Robotics in Construction (ISARC 2020): From Demonstration to Practical Use to New Stage of Construction Robot, Kitakyushu, Japan, 21–28 October 2020; pp. 1373–1379. [Google Scholar] [CrossRef]
  48. Gong, Q.; Zhu, L.; Wang, Y.; Yu, Z. Automatic subway tunnel crack detection system based on a line scan camera. Struct. Control Health Monit. 2021, 28, e2776. [Google Scholar] [CrossRef]
  49. Wang, H.; Wang, Q.; Zhai, J.; Yuan, D.; Zhang, W.; Xie, X.; Zhou, B.; Cai, J.; Lei, Y. Design of fast acquisition system and analysis of geometric feature for highway tunnel lining cracks based on machine vision. Appl. Sci. 2022, 12, 2516. [Google Scholar] [CrossRef]
  50. Qin, S.; Qi, T.; Lei, B.; Li, Z. Rapid and automatic image acquisition system for structural surface defects of high-speed rail tunnels. KSCE J. Civ. Eng. 2024, 28, 967–989. [Google Scholar] [CrossRef]
  51. Zhang, R.; Hao, G.; Zhang, K.; Xu, G.; Gao, M.; Liu, F.; Liu, Y. Reactive UAV-based automatic tunnel surface defect inspection with a field test. Autom. Constr. 2024, 163, 105424. [Google Scholar] [CrossRef]
  52. Machado, L.B.; Futai, M.M. Tunnel performance prediction through degradation inspection and digital twin construction. Tunn. Undergr. Space Technol. 2024, 144, 105544. [Google Scholar] [CrossRef]
  53. Xu, Y.; Li, S.; Zhang, D.; Jin, Y.; Zhang, F.; Li, N.; Li, H. Identification framework for cracks on a steel structure surface by a restricted Boltzmann machines algorithm based on consumer-grade camera images. Struct. Control Health Monit. 2018, 25, e2075. [Google Scholar] [CrossRef]
  54. Wang, W.; Zhao, W.; Huang, L.; Vimarlund, V.; Wang, Z. Applications of terrestrial laser scanning for tunnels: A review. J. Traffic Transp. Eng. 2014, 1, 325–337. [Google Scholar] [CrossRef]
  55. Duan, D.Y.; Qiu, W.G.; Cheng, Y.J.; Zheng, Y.C.; Lu, F. Reconstruction of shield tunnel lining using point cloud. Autom. Constr. 2021, 130, 103860. [Google Scholar] [CrossRef]
  56. Ma, Q.; Chen, H.; Chen, Y.; Zhou, Y.; Hu, Y. Point cloud registration for excavation tunnels based on concave–convex extraction and encoding. Tunn. Undergr. Space Technol. 2025, 157, 106283. [Google Scholar] [CrossRef]
  57. Bao, Y.; Li, S.; Tang, C.; Sun, Z.; Yang, K.; Wang, Y. Research on fitting and denoising subway shield-tunnel cross-section point-cloud data based on the huber loss function. Appl. Sci. 2025, 15, 2249. [Google Scholar] [CrossRef]
  58. Mizutani, T.; Yamaguchi, T.; Yamamoto, K.; Ishida, T.; Nagata, Y.; Kawamura, H.; Tokuno, T.; Suzuki, K.; Yamaguchi, Y.; Suzuki, K.; et al. Automatic detection of delamination on tunnel lining surfaces from laser 3D point cloud data by 3D features and a support vector machine. J. Civ. Struct. Health Monit. 2024, 14, 209–221. [Google Scholar] [CrossRef]
  59. Camara, M.; Wang, L.; You, Z. Tunnel cross-section deformation monitoring based on mobile laser scanning point cloud. Sensors 2024, 24, 7192. [Google Scholar] [CrossRef] [PubMed]
  60. Kang, J.; Li, M.; Mao, S.; Fan, Y.; Wu, Z.; Li, B. A Coal mine tunnel deformation detection method using point cloud data. Sensors 2024, 24, 2299. [Google Scholar] [CrossRef] [PubMed]
  61. Hawley, C.J.; Gräbe, P.J. Water leakage mapping in concrete railway tunnels using LiDAR generated point clouds. Constr. Build. Mater. 2022, 361, 129644. [Google Scholar] [CrossRef]
  62. Li, P.; Wang, Q.; Li, J.; Pei, Y.; He, P. Automated extraction of tunnel leakage location and area from 3D laser scanning point clouds. Opt. Lasers Eng. 2024, 178, 108217. [Google Scholar] [CrossRef]
  63. Panella, F.; Roecklinger, N.; Vojnovic, L.; Loo, Y.; Boehm, J. Cost–benefit analysis of rail tunnel inspection for photogrammetry and laser scanning. Int. Arch. Photogramm. Remote Sens. Spatial Inf. Sci. 2020, XLIII–B2, 1137–1144. [Google Scholar] [CrossRef]
  64. Sjölander, A.; Belloni, V.; Ansell, A.; Nordström, E. Towards automated inspections of tunnels: A review of optical inspections and autonomous assessment of concrete tunnel linings. Sensors 2023, 23, 3189. [Google Scholar] [CrossRef]
  65. Lei, M.; Liu, L.; Shi, C.; Tan, Y.; Lin, Y.; Wang, W. A novel tunnel-lining crack recognition system based on digital image technology. Tunn. Undergr. Space Technol. 2021, 108, 103724. [Google Scholar] [CrossRef]
  66. An, Y.; Li, B.; Wang, L.; Zhang, C.; Zhou, X. Calibration of a 3D laser rangefinder and a camera based on optimization solution. J. Ind. Manag. Optim. 2021, 17, 427–445. [Google Scholar] [CrossRef]
  67. Cai, H.; Pang, W.; Chen, X.; Wang, Y.; Liang, H. A Novel calibration board and experiments for 3D LiDAR and camera calibration. Sensors 2020, 20, 1130. [Google Scholar] [CrossRef]
  68. Tian, L.; Li, Q.; He, L.; Zhang, D. Image-range stitching and semantic-based crack detection methods for tunnel inspection vehicles. Remote Sens. 2023, 15, 5158. [Google Scholar] [CrossRef]
  69. Zhou, M.; Cheng, W.; Huang, H.; Chen, J. A novel approach to automated 3D spalling defects inspection in railway tunnel linings using laser intensity and depth information. Sensors 2021, 21, 5725. [Google Scholar] [CrossRef] [PubMed]
  70. Cheng, X.; Hu, X.; Tan, K.; Wang, L.; Yang, L. Automatic detection of shield tunnel leakages based on terrestrial mobile lidar intensity images using deep learning. IEEE Access 2021, 9, 55300–55310. [Google Scholar] [CrossRef]
  71. Chu, X.; Tang, L.; Sun, F.; Chen, X.; Niu, L.; Ren, C.; Li, Q. Defect detection for a vertical shaft surface based on multimodal sensors. IEEE J. Sel. Top. Appl. Earth Obs. Remote Sens. 2022, 15, 8109–8117. [Google Scholar] [CrossRef]
  72. Li, Y.; Xiao, Z.; Li, J.; Shen, T. Integrating vision and laser point cloud data for shield tunnel digital twin modeling. Autom. Constr. 2024, 157, 105180. [Google Scholar] [CrossRef]
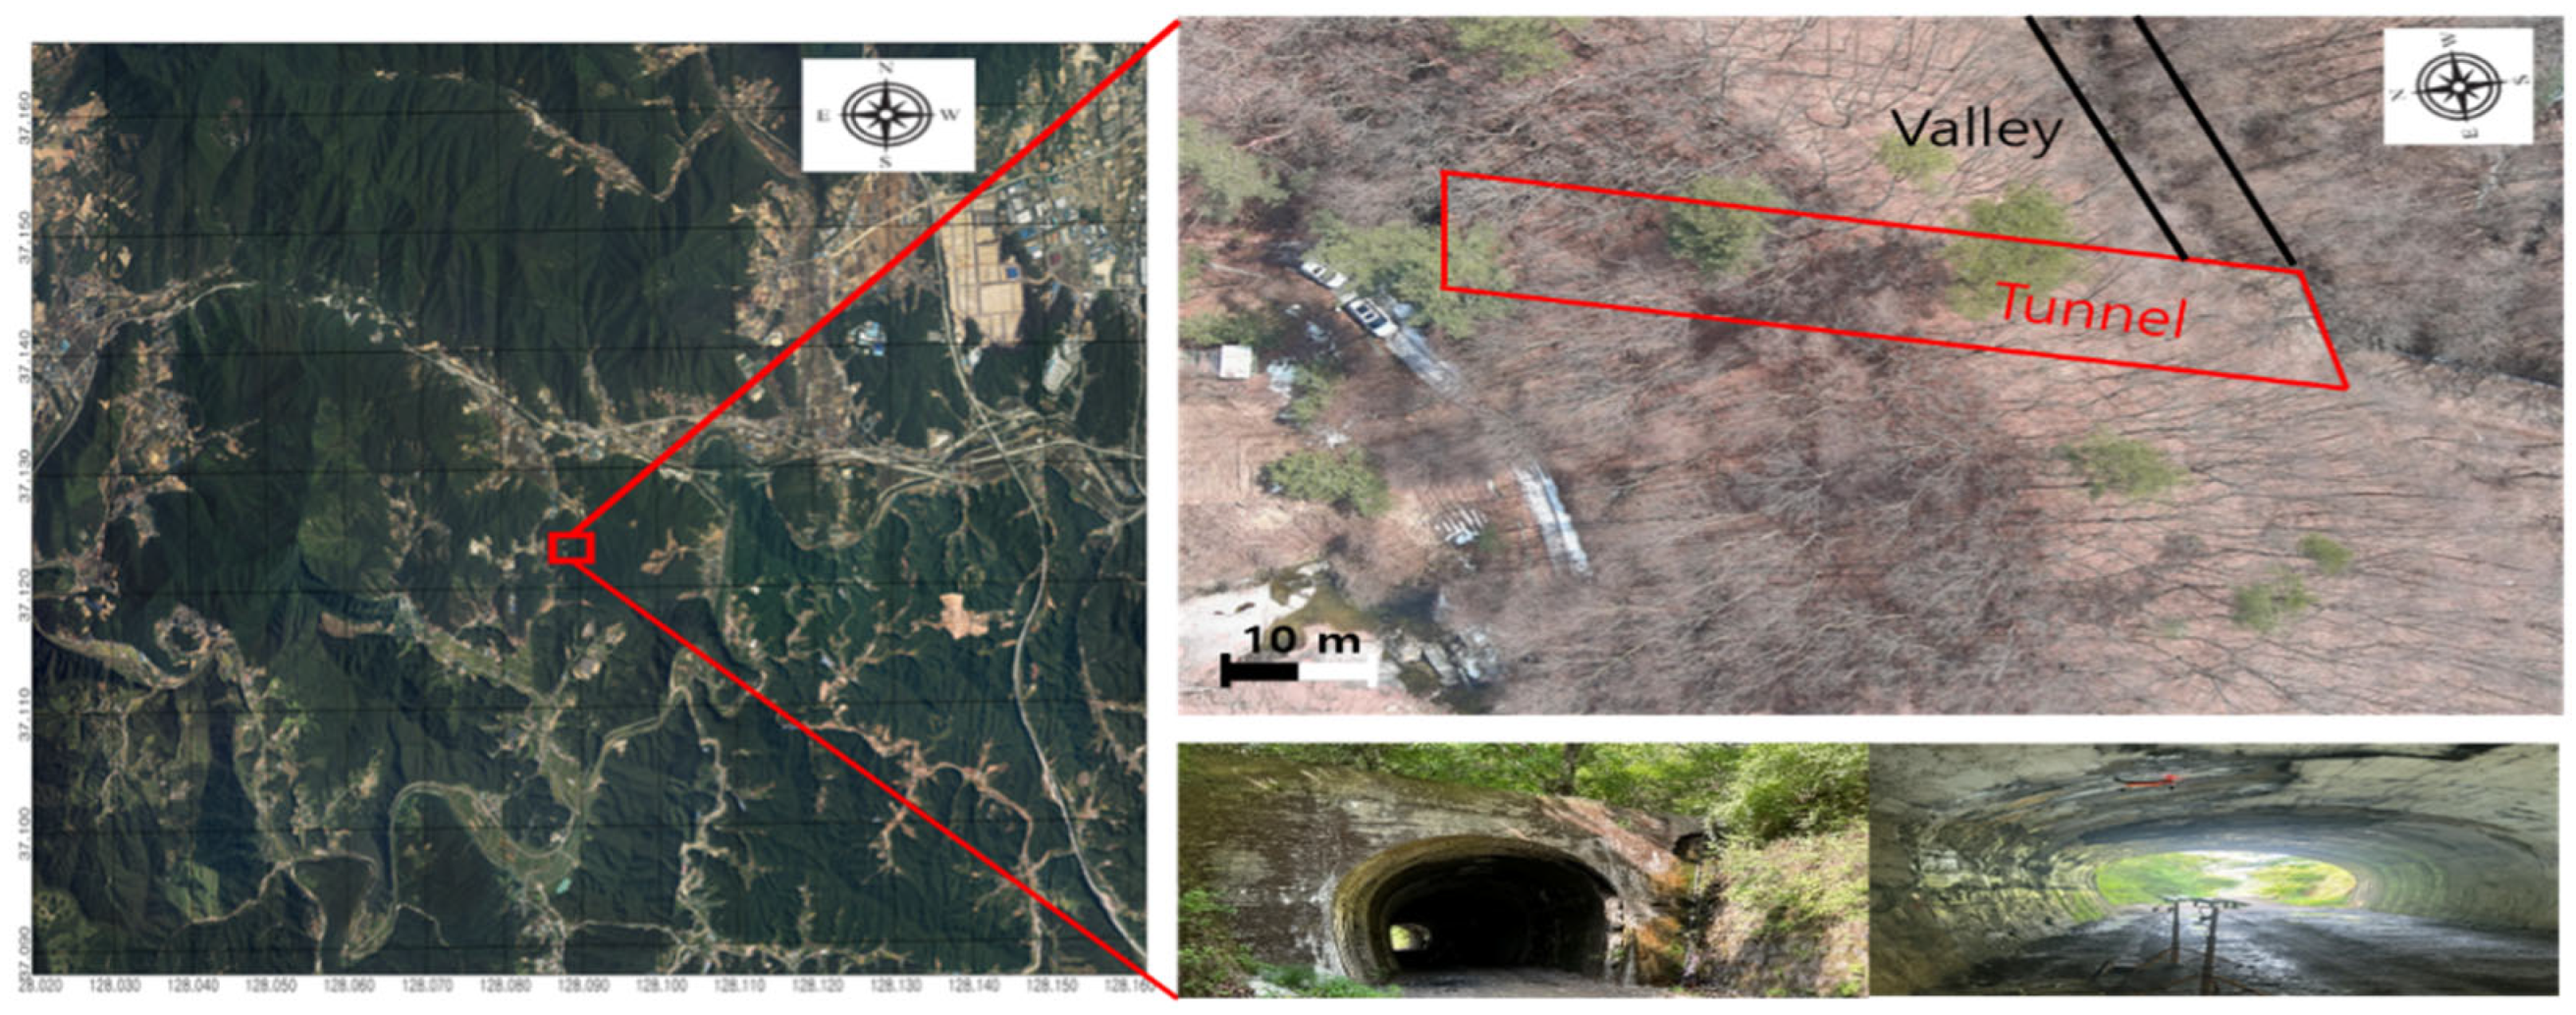
Figure 1. View of tunnel.
Remotesensing 17 03173 g001
Figure 2. Location of reference points.
Remotesensing 17 03173 g002
Figure 3. Image acquisition system inside the tunnel using UAV and a mobile lighting unit. To ensure data quality in the dark, unlit environment, an operator (left) manually moves a separate high-lumen lighting unit to illuminate the target area while the UAV (right) flies and captures images.
Remotesensing 17 03173 g003
Figure 4. Photographs of the testbed (Wonbak Tunnel exit) at each time-series data acquisition point. (a) Baseline condition before the winter season (November 2024). (b) Condition just after the winter season. Numerous ice columns are clearly observed due to continuous leakage and low temperatures (March 2025). (c) Condition after the thawing period (May 2025).
Remotesensing 17 03173 g004
Figure 5. Time-series 3D point cloud models generated after TLS data processing. (a) 1st model (November 2024), (b) 2nd model (March 2025), and (c) 3rd model (May 2025).
Remotesensing 17 03173 g005
Figure 6. Manual flight path of UAV for image acquisition inside the tunnel. A diagram of the flight path established for systematic data acquisition in the GPS-denied tunnel. The circles indicate the UAV’s camera stations; the rectangles represent the corresponding image coverage from each station.
Remotesensing 17 03173 g006
Figure 7. High-density 3D textured models generated using the SfM/MVS technique. Each model includes the true color and texture information of the tunnel surface and is utilized for the analysis of visual defects such as cracks, leakage, and efflorescence. (a) 1st model, (b) 2nd model, and (c) 3rd model.
Remotesensing 17 03173 g007
Figure 8. Result of the registration between TLS and image-based point clouds. The high-density fused point cloud was generated by registering the two datasets using the ICP algorithm. This model is an intermediate product for the final textured model generation. (a) 1st model, (b) 2nd model, and (c) 3rd model.
Remotesensing 17 03173 g008
Figure 9. Final fusion-based 3D textured model: The final product possessing both the geometric accuracy of LiDAR and the visual realism of the images. This model simultaneously enables precise coordinate-based quantitative analysis and intuitive visual damage assessment. (a) 1st model, (b) 2nd model, and (c) 3rd model.
Remotesensing 17 03173 g009
Figure 10. Overall layout of the targets installed inside the tunnel: (a) Right wall, (b) Left wall.
Remotesensing 17 03173 g010
Figure 11. Comparison of target resolutions: (a) actual target, (b) target of TLS-based PCD, (c) target of image-based PCD, (d) target of fusion-based PCD.
Remotesensing 17 03173 g011
Figure 12. Distribution of major spalling and damages in the tunnel.
Remotesensing 17 03173 g012
Figure 13. Distribution of major leakage and efflorescence damage in the tunnel. (a) Leakage. (b) Efflorescence.
Remotesensing 17 03173 g013
Figure 14. Distribution of major crack damage in the tunnel.
Remotesensing 17 03173 g014
Table 1. Specifications of the primary equipment used for data acquisition.
Trimble’s GNSS R8Parameters
Remotesensing 17 03173 i001Weight1.52 kgChannels440 Channel
Stop Positioning
Vertical
3.5 mm + 0.4 ppm
RMS
InputCMR+, CMRx, RTCM2.1~3.1
Stop Positioning
Horizontal
3 mm + 0.1 ppm
RMS
Output24 NVEA
VRS Vertical15 mm + 0.5 ppm
RMS
Radio Modem403 MHz
VRS Horizontal8 mm + 0.5 ppm
RMS
Signal Update Cycle1 Hz~20 Hz
HITARGET’s HTS 420RParameters
Remotesensing 17 03173 i002Angle Accuracy2″Compensator
Range
Dual axis ±3′
AccuracyPrism: 2 mm + 2 ppm
Reflectorless, mode: 3 mm + 2 ppm
Setting Accuracy 1″
RangePrism: 3000 m
Reflectorless Mode: 600 m
Graphics LCD 240 × 320
Trimble’s SX10Parameters
Remotesensing 17 03173 i003Angle Accuracy1″Range Noise1.5 mm
AccuracyPrism: 1 mm + 1.5 ppm
DR mode: 2 mm + 1.5
EDMLaser: 1550 mm
Laser spot size at 100 m: 14 mm
ScanningBand ScanningPoint Spacing6.25~50 mm
Measurement Rate26.6 kHzCamera5 MP (84×)
RangePrism: 5500 m
DR Mode: 800 m
CommunicationWi-fi, USB, Cable, Long range radio
Table 2. Lighting equipment and UAV specification.
SMATO SWTE50-2Parameters
Remotesensing 17 03173 i004Power consumption50 W
Correlated color temperature6500 K (daylight white)
Luminous flux~4000 lx
AUTEL EVO2 RTKParametersCamera
Remotesensing 17 03173 i005Weight1237 gResolution5472 × 3648
Satellite systemGPS/GLONASS/GalileoImage Sensor1/2″CMOS
Max flight time42 minISO100–12,800 (auto)
Angular vibration range±0.005°F-StopF/2.8
IMU sensorGyroscope Acceleration Compass DistanceFOV82°
Table 3. Coordinate errors and RMSEs of TLS-, image-, and fusion-based PCD (unit: m).
RMSEXYZ
Time-series1st2nd3rd1st2nd3rd1st2nd3rd
TLS-based model0.0220.0150.0370.0120.0130.0180.0190.0170.019
Image-based model0.2000.2850.4970.1860.1760.4430.2180.200.481
Fusion-based model0.0150.0100.0190.0070.0040.0070.0100.0100.014
Table 4. Comparison of point density (points/m2) by model.
Point Density
(Points/m2)
TLSImageFusion
1st81,5951,784,4771,866,072
2nd81,8901,390,2541,472,144
3rd81,6251,385,6821,467,307
Table 5. Comparison of representation resolution for spalling damage by model and time-series.
ClassificationTLS-Based PCDImage-Based PCDFusion-Based PCD
11stRemotesensing 17 03173 i006Remotesensing 17 03173 i007Remotesensing 17 03173 i008
2ndRemotesensing 17 03173 i009Remotesensing 17 03173 i010Remotesensing 17 03173 i011
3rdRemotesensing 17 03173 i012Remotesensing 17 03173 i013Remotesensing 17 03173 i014
21stRemotesensing 17 03173 i015Remotesensing 17 03173 i016Remotesensing 17 03173 i017
2ndRemotesensing 17 03173 i018Remotesensing 17 03173 i019Remotesensing 17 03173 i020
3rdRemotesensing 17 03173 i021Remotesensing 17 03173 i022Remotesensing 17 03173 i023
31stRemotesensing 17 03173 i024Remotesensing 17 03173 i025Remotesensing 17 03173 i026
2ndRemotesensing 17 03173 i027Remotesensing 17 03173 i028Remotesensing 17 03173 i029
3rdRemotesensing 17 03173 i030Remotesensing 17 03173 i031Remotesensing 17 03173 i032
41stRemotesensing 17 03173 i033Remotesensing 17 03173 i034Remotesensing 17 03173 i035
2ndRemotesensing 17 03173 i036Remotesensing 17 03173 i037Remotesensing 17 03173 i038
3rdRemotesensing 17 03173 i039Remotesensing 17 03173 i040Remotesensing 17 03173 i041
Table 6. Comparison of representation resolution for damage/breakage by model and time-series.
ClassificationTLS-Based PCDImage-Based PCDFusion-Based PCD
11stRemotesensing 17 03173 i042Remotesensing 17 03173 i043Remotesensing 17 03173 i044
2ndRemotesensing 17 03173 i045Remotesensing 17 03173 i046Remotesensing 17 03173 i047
3rdRemotesensing 17 03173 i048Remotesensing 17 03173 i049Remotesensing 17 03173 i050
21stRemotesensing 17 03173 i051Remotesensing 17 03173 i052Remotesensing 17 03173 i053
2ndRemotesensing 17 03173 i054Remotesensing 17 03173 i055Remotesensing 17 03173 i056
3rdRemotesensing 17 03173 i057Remotesensing 17 03173 i058Remotesensing 17 03173 i059
31stRemotesensing 17 03173 i060Remotesensing 17 03173 i061Remotesensing 17 03173 i062
2ndRemotesensing 17 03173 i063Remotesensing 17 03173 i064Remotesensing 17 03173 i065
3rdRemotesensing 17 03173 i066Remotesensing 17 03173 i067Remotesensing 17 03173 i068
Table 7. Comparison of representation resolution for leakage damage by model and time-series.
ClassificationTLS-Based PCDImage-Based PCDFusion-Based PCD
11stRemotesensing 17 03173 i069Remotesensing 17 03173 i070Remotesensing 17 03173 i071
2ndRemotesensing 17 03173 i072Remotesensing 17 03173 i073Remotesensing 17 03173 i074
3rdRemotesensing 17 03173 i075Remotesensing 17 03173 i076Remotesensing 17 03173 i077
21stRemotesensing 17 03173 i078Remotesensing 17 03173 i079Remotesensing 17 03173 i080
2ndRemotesensing 17 03173 i081Remotesensing 17 03173 i082Remotesensing 17 03173 i083
3rdRemotesensing 17 03173 i084Remotesensing 17 03173 i085Remotesensing 17 03173 i086
31stRemotesensing 17 03173 i087Remotesensing 17 03173 i088Remotesensing 17 03173 i089
2ndRemotesensing 17 03173 i090Remotesensing 17 03173 i091Remotesensing 17 03173 i092
3rdRemotesensing 17 03173 i093Remotesensing 17 03173 i094Remotesensing 17 03173 i095
Table 8. Comparison of representation resolution for efflorescence damage by model and time-series.
ClassificationTLS-Based PCDImage-Based PCDFusion-Based PCD
11stRemotesensing 17 03173 i096Remotesensing 17 03173 i097Remotesensing 17 03173 i098
2ndRemotesensing 17 03173 i099Remotesensing 17 03173 i100Remotesensing 17 03173 i101
3rdRemotesensing 17 03173 i102Remotesensing 17 03173 i103Remotesensing 17 03173 i104
21stRemotesensing 17 03173 i105Remotesensing 17 03173 i106Remotesensing 17 03173 i107
2ndRemotesensing 17 03173 i108Remotesensing 17 03173 i109Remotesensing 17 03173 i110
3rdRemotesensing 17 03173 i111Remotesensing 17 03173 i112Remotesensing 17 03173 i113
31stRemotesensing 17 03173 i114Remotesensing 17 03173 i115Remotesensing 17 03173 i116
2ndRemotesensing 17 03173 i117Remotesensing 17 03173 i118Remotesensing 17 03173 i119
3rdRemotesensing 17 03173 i120Remotesensing 17 03173 i121Remotesensing 17 03173 i122
Table 9. Comparison of representation resolution for crack damage by model and time-series.
ClassificationTLS-Based PCDImage-Based PCDFusion-Based PCD
11stRemotesensing 17 03173 i123Remotesensing 17 03173 i124Remotesensing 17 03173 i125
2ndRemotesensing 17 03173 i126Remotesensing 17 03173 i127Remotesensing 17 03173 i128
3rdRemotesensing 17 03173 i129Remotesensing 17 03173 i130Remotesensing 17 03173 i131
21stRemotesensing 17 03173 i132Remotesensing 17 03173 i133Remotesensing 17 03173 i134
2ndRemotesensing 17 03173 i135Remotesensing 17 03173 i136Remotesensing 17 03173 i137
3rdRemotesensing 17 03173 i138Remotesensing 17 03173 i139Remotesensing 17 03173 i140
31stRemotesensing 17 03173 i141Remotesensing 17 03173 i142Remotesensing 17 03173 i143
2ndRemotesensing 17 03173 i144Remotesensing 17 03173 i145Remotesensing 17 03173 i146
3rdRemotesensing 17 03173 i147Remotesensing 17 03173 i148Remotesensing 17 03173 i149
Table 10. Summary of qualitative representation performance by 3D model for the five major damage types.
Damage TypeTLS-Based ModelImage-Based ModelFusion-Based Model
SpallingGeometric shape representation (O)
Visual identification impossible (X)
Visual identification (O)
Geometric shape distortion (Δ)
Integrated representation of shape and visual information (O)
DamageGeometric shape representation (O)
Limitation in visual expression (Δ)
Visual identification (O)
Limitation in expressing the depths (Δ)
Integrated representation of shape and visual information (O)
LeakageIdentification impossible (X)Visual identification and pattern representation (O)Identification and specification of the exact location (O)
EfflorescenceIdentification impossible (X)Visual identification and pattern representation (O)Identification and specification of the exact location (O)
CrackImpossible to identify fine cracks (X)Visual identification (O)
Limitation in the accuracy of 3D position (Δ)
Identification and specification of the exact 3D location (O)
(Legend: O—excellent, Δ—average/limited, X—impossible).
Table 11. Time-series analysis of spalling areas.
1st2nd3rd
1Remotesensing 17 03173 i150Remotesensing 17 03173 i151Remotesensing 17 03173 i152
0.0061 m20.0061 m20.0061 m2
2Remotesensing 17 03173 i153Remotesensing 17 03173 i154Remotesensing 17 03173 i155
0.18 m20.18 m20.18 m2
3Remotesensing 17 03173 i156Remotesensing 17 03173 i157Remotesensing 17 03173 i158
0.39 m20.39 m20.39 m2
4Remotesensing 17 03173 i159Remotesensing 17 03173 i160Remotesensing 17 03173 i161
0.0741 m20.0741 m20.0741 m2
Table 12. Time-series analysis of damage/breakage area and volume.
1st2nd3rd
13D modelRemotesensing 17 03173 i162Remotesensing 17 03173 i163Remotesensing 17 03173 i164
Inspection mapRemotesensing 17 03173 i165Remotesensing 17 03173 i166Remotesensing 17 03173 i167
Area0.57 m20.57 m20.60 m2
Volume0.07 m30.07 m30.09 m3
23D modelRemotesensing 17 03173 i168Remotesensing 17 03173 i169Remotesensing 17 03173 i170
Inspection mapRemotesensing 17 03173 i171Remotesensing 17 03173 i172Remotesensing 17 03173 i173
Area0.57 m20.57 m20.60 m2
Volume0.16 m30.16 m30.18 m3
33D modelRemotesensing 17 03173 i174Remotesensing 17 03173 i175Remotesensing 17 03173 i176
Inspection mapRemotesensing 17 03173 i177 Remotesensing 17 03173 i178
Area5.77 m2Impossible to analyze8.99 m2
Volume2.47 m3Impossible to analyze3.38 m3
Table 13. Quantitative change in the area of leakage damage over the time series.
1Remotesensing 17 03173 i179Remotesensing 17 03173 i180Remotesensing 17 03173 i181
25.41 m26.36 m238.82 m2
2Remotesensing 17 03173 i182Remotesensing 17 03173 i183Remotesensing 17 03173 i184
3.71 m22.65 m210.26 m2
3Remotesensing 17 03173 i185Remotesensing 17 03173 i186Remotesensing 17 03173 i187
37.02 m250.65 m243.32 m2
Table 14. Quantitative change in the area of efflorescence damage over the time series.
1Remotesensing 17 03173 i188Remotesensing 17 03173 i189Remotesensing 17 03173 i190
16.37 m216.37 m216.37 m2
2Remotesensing 17 03173 i191Remotesensing 17 03173 i192Remotesensing 17 03173 i193
4.17 m24.17 m24.17 m2
3Remotesensing 17 03173 i194Remotesensing 17 03173 i195Remotesensing 17 03173 i196
2.59 m22.59 m22.59 m2
Table 15. Quantitative change in crack dimensions over the time series.
1Remotesensing 17 03173 i197Remotesensing 17 03173 i198Remotesensing 17 03173 i199
Width 0.002 m
Length 0.371 m
Width 0.002 m
Length 0.371 m
Width 0.002 m
Length 0.371 m
2Remotesensing 17 03173 i200Remotesensing 17 03173 i201Remotesensing 17 03173 i202
Width 0.002 m
Length 1.94 m
Width 0.002 m
Length 1.94 m
Width 0.002 m
Length 1.94 m
3Remotesensing 17 03173 i203Remotesensing 17 03173 i204Remotesensing 17 03173 i205
Width 0.002 m
Length 0.82 m
Width 0.002 m
Length 0.82 m
Width 0.002 m
Length 0.82 m
Disclaimer/Publisher’s Note: The statements, opinions and data contained in all publications are solely those of the individual author(s) and contributor(s) and not of MDPI and/or the editor(s). MDPI and/or the editor(s) disclaim responsibility for any injury to people or property resulting from any ideas, methods, instructions or products referred to in the content.