1. Introduction
Time-sensitive and accurate data collection and analysis after a major flood event is critical to reducing the impact on lives and livelihoods. The initial response to a flood event is directed at saving lives and assessing overall damage, usually through a combination of ground-based and aerial search-and-rescue activities. If this initial response occurs within the first two days, then the next phase lasts several weeks and is directed at a more detailed assessment of damage to help plan for a longer-term recovery effort.
National responding agencies such as the U.S. Army Corps of Engineers (USACE), Federal Emergency Management Agency (FEMA), and the Natural Resources Conservation Service (NRCS) are heavily engaged in damage assessment and planning to restore natural and built environments that have been altered by a flood [
1]. State agencies and local governments are also engaged in this work, usually in coordination with the national agencies to share data and recovery plans and commit to recovery activities. The planning for large-scale recovery must happen efficiently and accurately since response delays have been shown to amplify public skepticism and concerns about what is actually happening on the ground [
2,
3]. Delayed response also leads to a lower QALY, which is the quality-adjusted life years [
4,
5]. A lower QALY is the result of psychological trauma and depression that is faced by the victims in a disaster. Therefore, the rapid acquisition of ground truth and subsequent accurate estimates of damage and recovery effort are needed now more than ever.
Efforts have been made by several researchers in the direction of obtaining accurate estimates of damage. Damage estimation starts with the process of collecting the data from the regions impacted by disasters. Uncrewed Aerial Vehicles (UAVs) have become an accepted means of data collection and monitoring by public safety and first responders who are on-site and need actionable data fast. Authors have also explored the use of UAVs in post-disaster assessment. Sakurada et al. [
6] demonstrated this by merging street view and aerial view data to estimate the debris in the city after the Tsunami in the city of Kamaishi, Japan. Ghaffarian et al. [
7] combined satellite and UAV images to identify debris, leveraging their complementary perspectives and resolutions. Satellite data is useful in large area surveys; however, there can be delays due to weather and scheduling. UAVs are instrumental when the observed area is geometrically small. A single operator can fly the aircraft over a scene and maintain visual line-of-sight while maneuvering over areas that cannot be viewed on the ground, thus providing a bird’s-eye perspective of the area under consideration. Relevant research is discussed below, with a summary of comparison of different platforms and techniques presented in
Table 1.
UAVs are generally classified into Fixed-Wing and VTOL (Vertical Take-Off and Landing) based on aerodynamic design and flight characteristics. Fixed-wing aircraft have range advantages over VTOL aircraft and are suitable for large-area surveys; however, in the case of drones, FAA authorization is currently required for any remotely piloted aircraft flying beyond visual line-of-sight [
12]. Crewed aircraft then become a feasible imaging solution for large-scale data collection campaigns, and we demonstrate that a fuel-efficient motorglider using a consumer-grade camera can collect tens of square miles of good-quality imagery in a single flight, at low cost.
Debris in lakes present a health and safety risk since lakes are frequently a source of potable water for communities and also provide recreational opportunities through watersports. This debris can consist of natural products such as trees and vegetative matter and man-made items that were damaged or deposited due to high water levels or high flow velocity. Removing debris in lakes is a high priority, and obtaining an estimate of debris coverage is the first step required to allocate funds for contract work. These estimates have historically been completed visually, either from a boat or plane, and relatively simple rules are applied to estimate debris volume [
1]. These estimates can be significantly wrong using visual methods. With advances in remote sensing, debris can be further classified into density grades, which enables more accurate debris analysis and estimation, supporting more effective disaster management.
A key aspect of this process is segmentation, which involves partitioning images into meaningful regions, such as separating water, debris, and land from each other. Segmentation is essential for quantifying debris coverage and understanding its distribution. Two approaches exist for segmentation: machine learning- and non-machine learning-based methods. Machine learning methods involve training a model on a dataset of images labeled with the object of interest to perform required operations on images. Datasets like RescueNet [
13] and FloodNet [
14] offer high-resolution UAV imagery tailored for segmenting water, flooded infrastructure, and vegetation. Nugraha et al. [
15] utilized FloodNet to train deep convolutional neural networks (CNN) like U-Net and PSPNet on aerial imagery from UAV. These CNNs perform semantic segmentation on the images by categorizing image parts that belong to the same class, achieving good accuracy. However, these datasets do not involve debris in water. Therefore, Madkour et al. [
8] trained the DeepLabV3 model on their own dataset and performed segmentation. They achieved a validation accuracy of 97.8% with the training time of nearly 97 min on a machine with significant computational resources for the implementation. Machine learning methods, while effective, are resource intensive and take a considerable amount of time to set up, train, and fine-tune a model.
As an alternative, researchers have also explored non-machine learning-based methods. Celik [
9] developed an unsupervised change detection method by image differencing and using PCA analysis and k-means clustering on multitemporal satellite images. Change detection provides good results if the images of the required region are available before and after the disaster. Before a disaster, the main source of imagery can be only satellites. Acquiring such satellite images in high quality takes a lot of time and might not be feasible for all regions. Simantiris et al. [
10] proposed the detection of non-flooded areas from UAV images utilizing masks over the LAB colorspace, and RGB vegetation index and edge detection on the original RGB image. The model performed considerably well on several datasets; however, it did not outperform deep learning-based methods. Additionally, this method may not perform well if water has a thick debris layer floating on it, as it will be difficult to segment debris from the non-flooded areas. Madkour et al. [
8] performed the segmentation of land and water using machine learning and utilized color thresholding in water to further segment the debris layer. They provided an estimation of the area of debris in water, but they did not classify the debris based on thickness and density that can give a volume estimation of the debris and compare with the ground measurements. Accurate ground measurements are available typically after the clean-up activity when the debris is measured at the landfill gate based on the capacity of the truck beds [
16]. The literature lacks methods that correlate these measurements with the area of the affected region covered with the debris.
On land, there is still a requirement to find debris, but the problem becomes three-dimensional. Cleanup activities in communities require an analysis of displaced debris. Initiatives by the NRCS like the Emergency Watershed Program facilitate communities in removing debris from stream channels, road culverts, and bridges [
17]. Past work by such programs to quantify the volume of material washed into waterways that subsequently create chokepoints has been accomplished using ground-based measurements only. Typically, trained personnel assess the volume and distribution of debris through visual inspections and measurements [
18]. This information is then used to plan and prioritize debris-removal efforts to mitigate threats to life and property effectively. The actual removal of debris from waterways can take several years, as logistically it is a very challenging task to reach remote areas surrounded by developed land while minimizing the impact on the environment [
19].
These efforts can be significantly reduced by using three-dimensional (3D) reconstruction techniques to generate point cloud and digital elevation models (DEMs) for estimating stockpile volume, which is a common application of photogrammetry. Researchers like Tamin et al. [
11] and Mantey et al. [
20] generated 3D point cloud data using UAV imagery and estimated the stockpile volume for the earthwork and achieved an error of 0.002% and 0.08%, respectively. To the author’s knowledge, this philosophy has been widely discussed in surveying and mining and has not been implemented in debris estimation after a disaster.
Floodwater height modeling in communities has been performed in the past to assess flood risk, which includes water height estimate (for water inundation analysis) and hydrological flow analysis. Whitehurst et al. [
21] employed HEC-RAS with post-flood DEM data to model a flood event. Their analysis predicted future floodwater height in the affected area under the scenario of a recurring flood event with the new debris deposit. Similarly, Sattar et al. [
22] studied the 2016 Gongbatongsha Glacier Lake Outburst Flood by employing HEC-RAS to model the hydrodynamic flood behavior and RAMMS to simulate the debris flow dynamics. They reconstructed the event, estimating flow discharge and debris entrainment. Elkhrachy [
23] further trained different machine learning models for water depth prediction. The models use the input features from Synthetic Aperture Radar (SAR), DSM, and optimal imagery data after the flash flood in New Cairo City, Egypt, and correlate them with the water depth obtained from the HEC-RAS model. Flood water height can be used by agencies to estimate the damage caused in buildings.
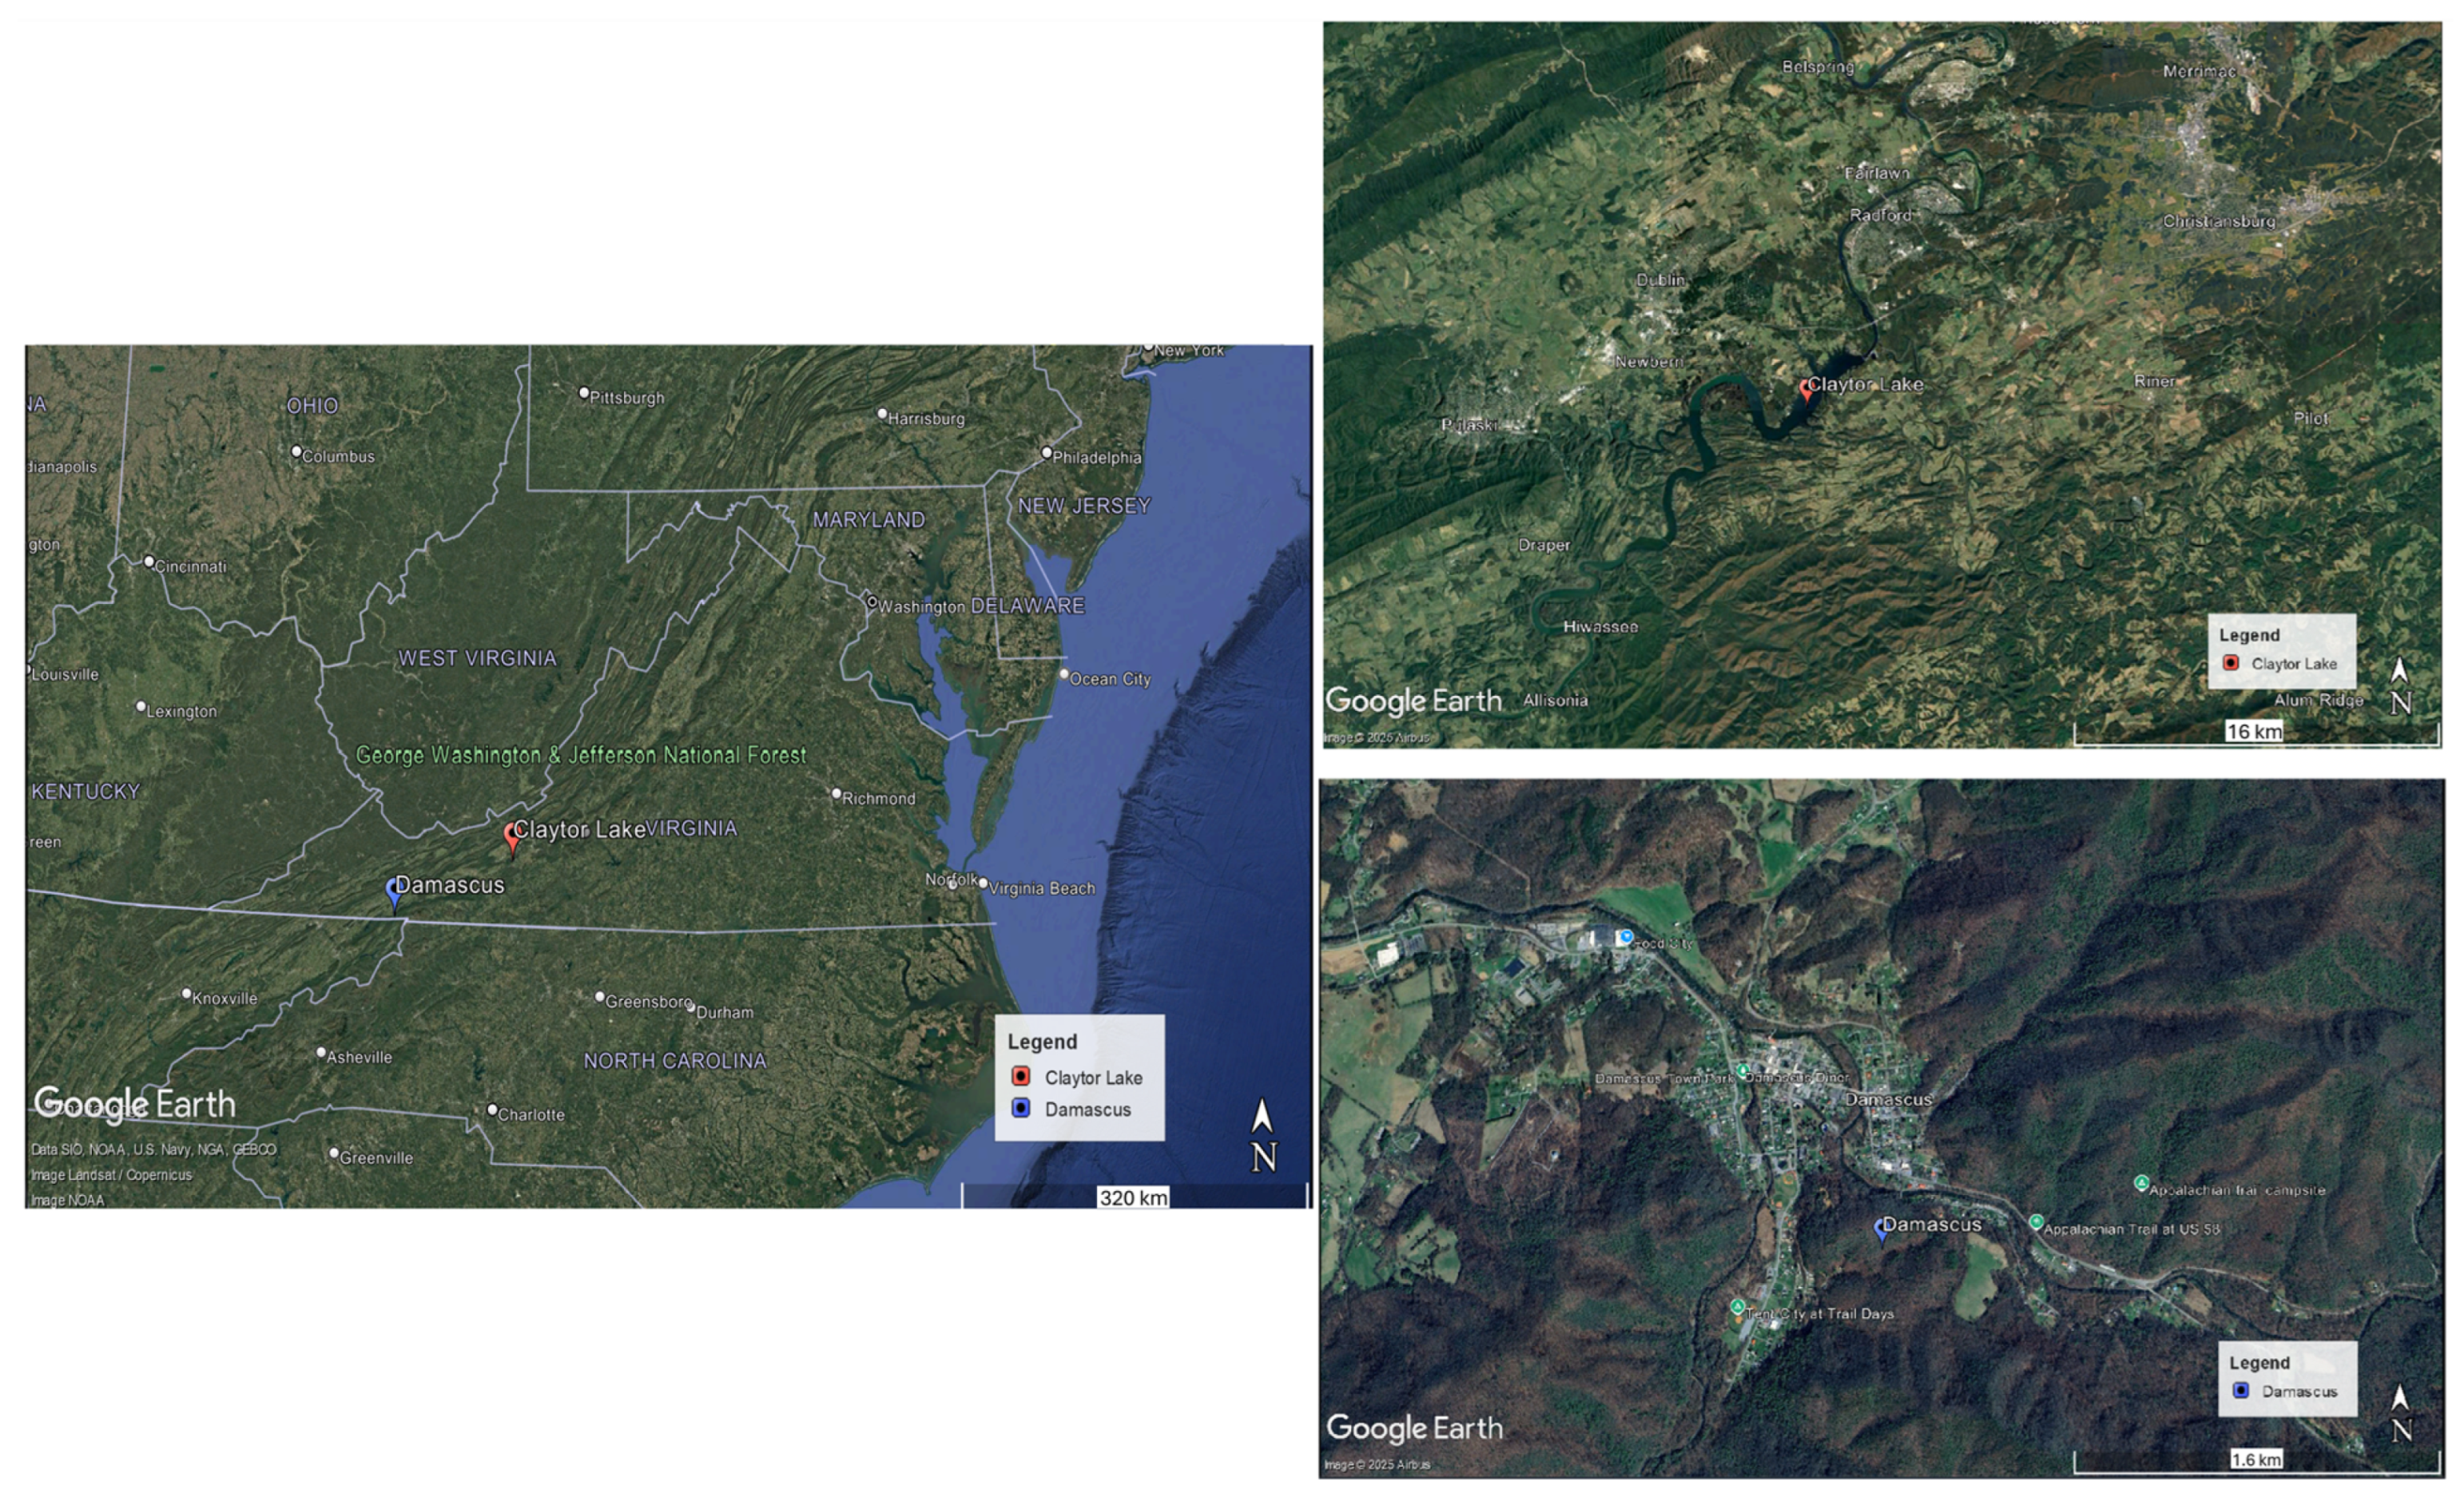
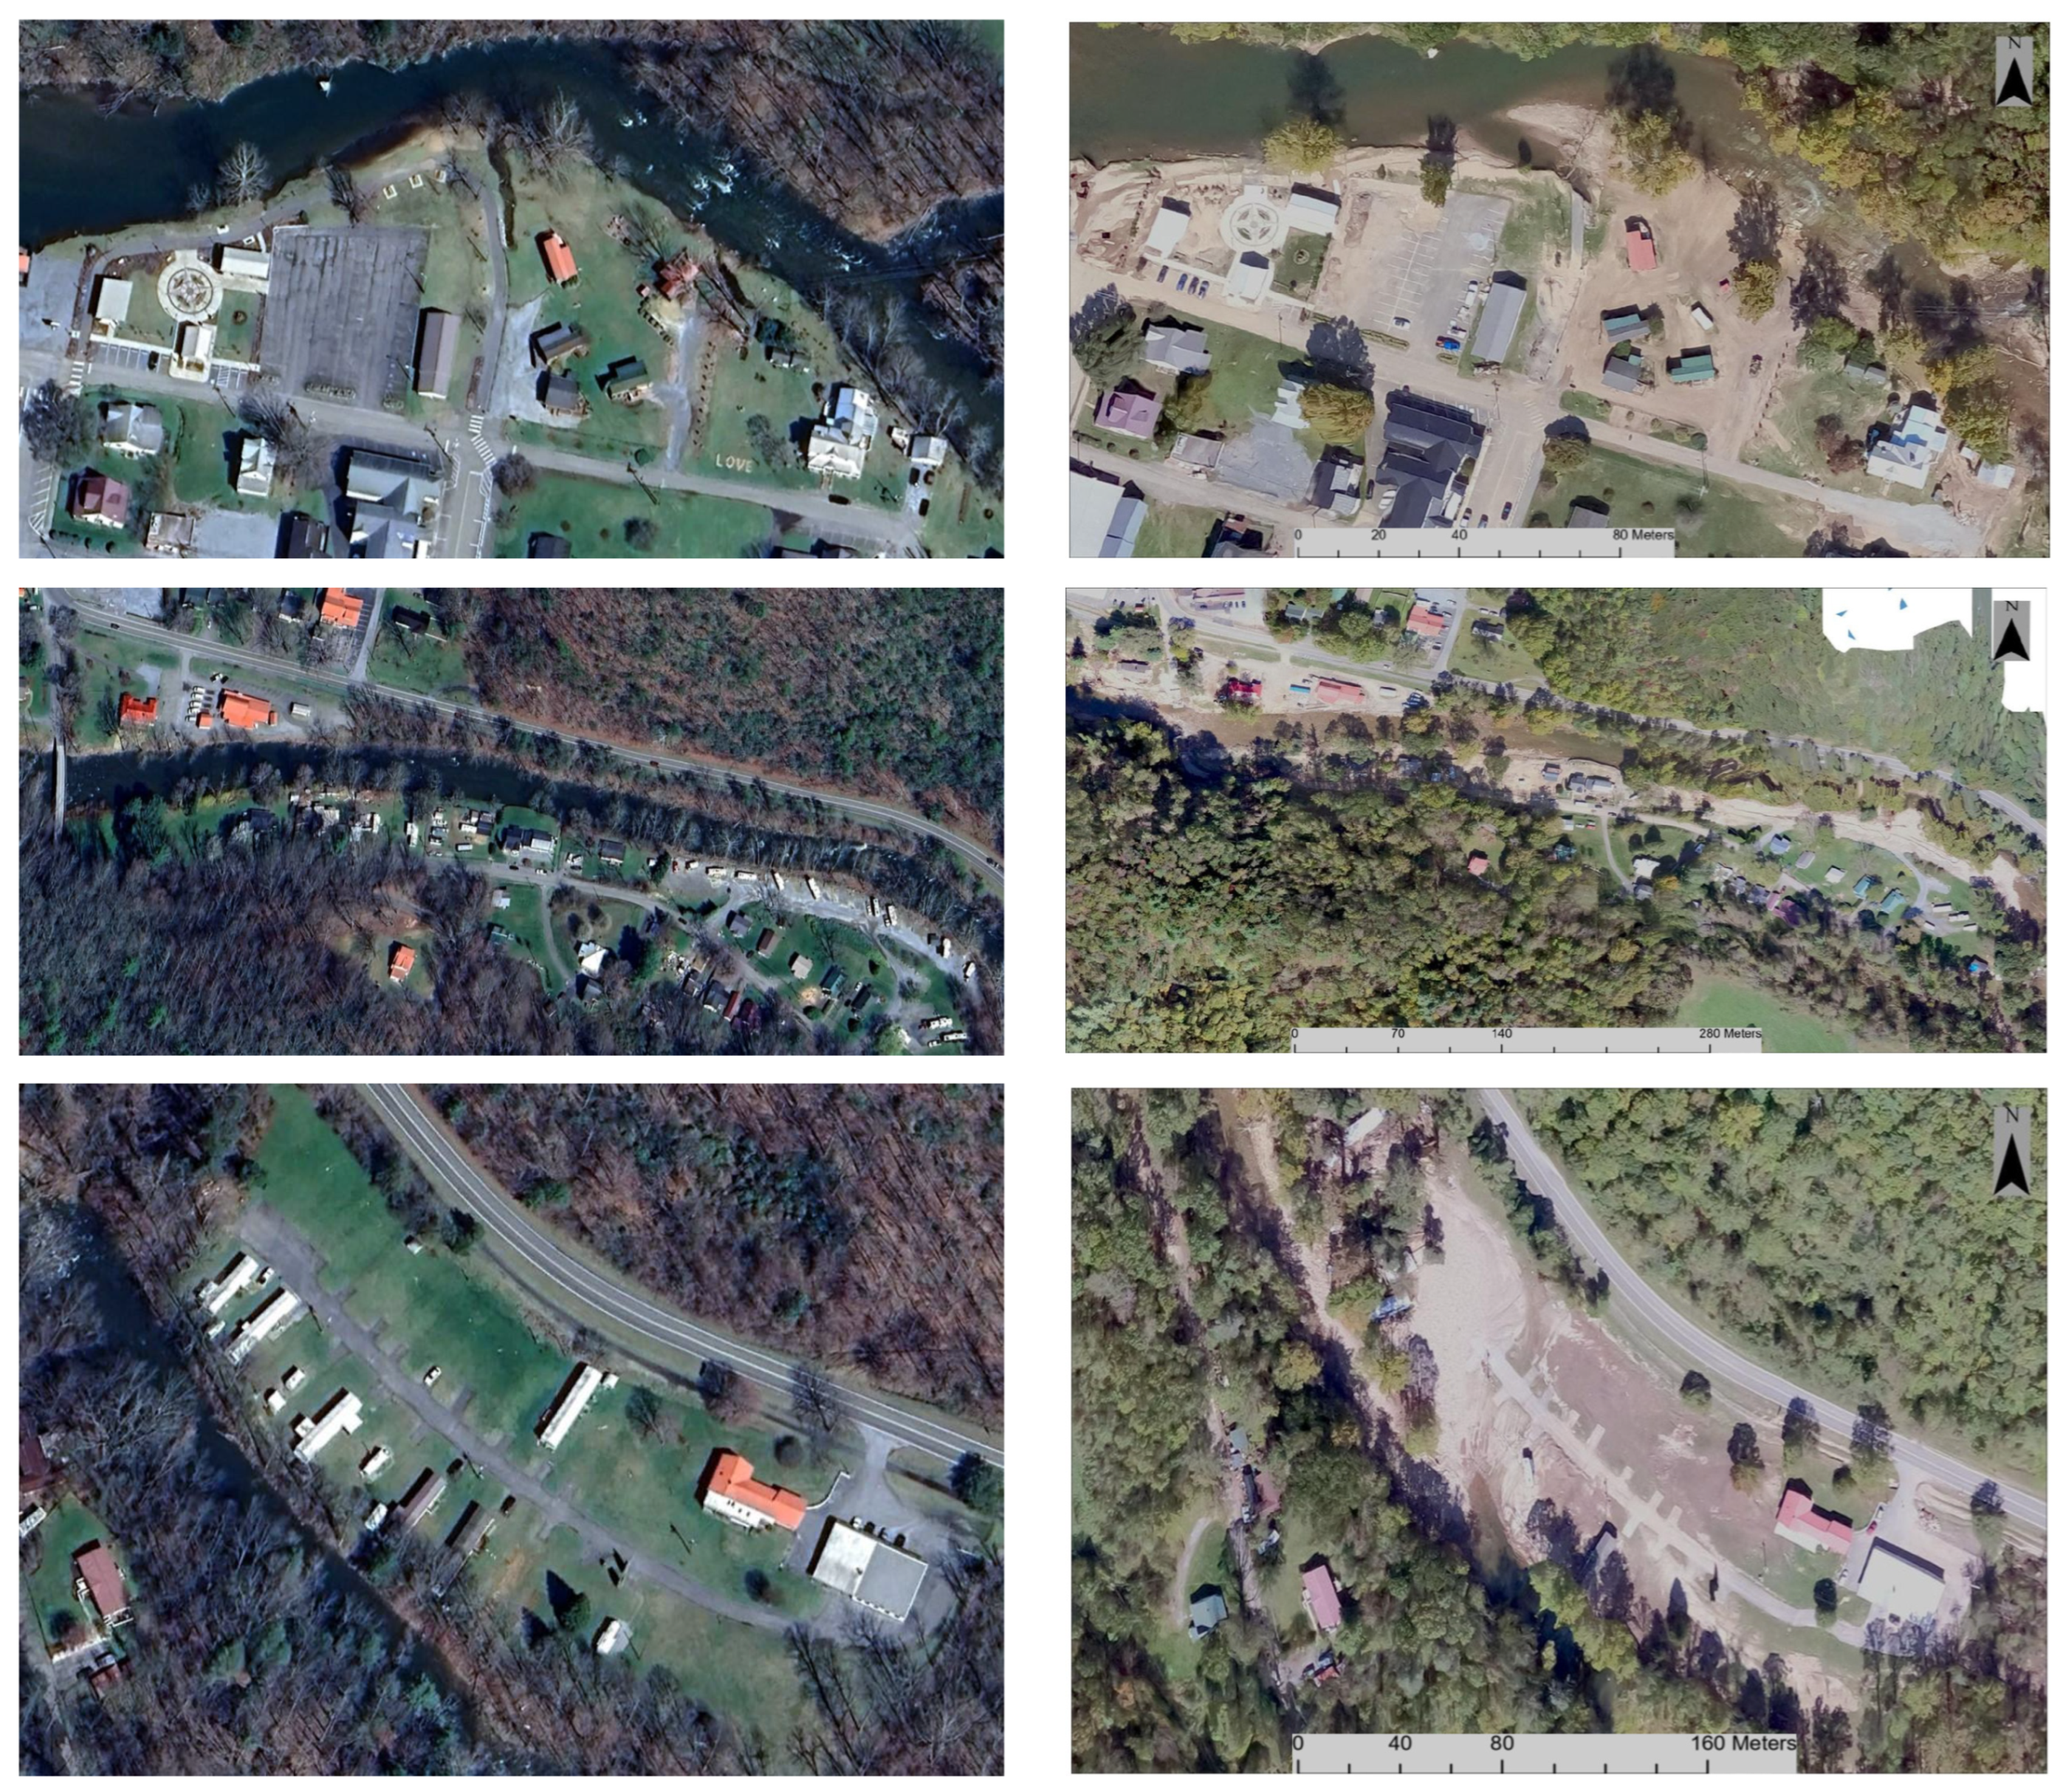
In our work, two areas affected by Hurricane Helene in Southwest Virginia were studied to develop the means of obtaining higher accuracy estimates of damage than what has previously been possible to achieve. These areas and flood conditions included debris washed into Claytor Lake, and water inundation height in the town of Damascus, Virginia. Regarding Claytor Lake, a rule has been historically applied that debris detected in the water can be assumed to be one foot thick, and by knowing the acreage of floating debris, the cubic yards of debris removal can be estimated [
1]. In our work, we show that these estimates are not accurate. Likewise, obtaining water inundation heights in structures requires ground-based measurements at every building, which is a prohibitively time-consuming activity and can only be completed once a crew is available for the work. Our work presents a water height analysis based solely on aerial imagery, which is easy to obtain if the area is unreachable by a trained crew.
For household debris, FEMA uses the debris estimation guide [
18] and multiplicative factors to estimate the debris from residential and/or commercial structures. In the case of single-family residential houses, FEMA developed a formula for debris estimation based on the empirical study:
Here, CY is the cubic yards of debris, SF is the building square footage, 0.2 is a constant based on the study, and VCM is a vegetative cover multiplier (ranging from 1.1 to 1.5 depending on neighborhood canopy maturity). To find the CY for the whole town, an average SF is taken and then multiplied by the number of houses.
According to the Robert T. Stafford Disaster Relief and Emergency Assistance Act [
24], a preliminary damage assessment (PDA) is performed by FEMA to evaluate the extent of damage caused by a disaster [
18]. FEMA conducts windshield surveys as (PDA) in which the personnel go door to door, interview residents, and take photographs to classify the damage to structures as Affected, Minor, Major, or Destroyed [
25]. According to FEMA and associated documentation, this classification is based on observed damage levels, including factors like water depth, contamination, and foundation integrity. Damage-percentage thresholds are commonly used: Affected for cosmetic or non-structural damage, Minor for less than 25% structural damage, Major for 25–50%, and Destroyed for greater than 50% [
26]. These percentages are multiplied by the CY calculated in Equation (
1) to estimate the total debris from each house. This method is inherently time-consuming, labor intensive, and often delayed due to access issues, safety concerns, or large-scale damage. The subjective nature of field assessments can also introduce inconsistency. These delays ultimately affect how quickly communities receive funding for cleanup and repairs. With the integration of flood modeling and geospatial tools, the flood impact on the buildings and classification of damage can be performed prior to field visits. Using analysis products developed by the NOAA National Water Prediction Service that include Flood Inundation Mapping (FIM) [
27], and the NOAA National Severe Storms Laboratory (NSSL) Flooded Locations and Simulated Hydrographs (FLASH) [
28], a future nationwide project predicting property loss is realizable. This would serve communities in the early-warning phase as well as FEMA, insurance companies, USACE, and local governments during the post-disaster response and recovery phase.
Further, this debris estimation is multiplied by the cost of cleanup per CY to estimate the debris cleanup cost. These general methods are useful for debris management planning, but they do not factor in property value. That analysis is available using a Hazus analysis [
29] which was developed by FEMA. Because the Hazus code is not well supported, it does not find popular use in disasters today, so the property value aspect does not factor into a recovery analysis. Combining a hydrology model with property information can give a much more accurate picture of damage and help in determining if a structure qualifies for the federal disaster declaration.
We have provided those tools in this paper and demonstrated how it works in the Damascus community, showing significant time savings to determine whether or not the damage qualifies a community for a federal disaster declaration. We have studied a few houses in Damascus and based on the water height estimated using HEC-RAS and the property information on GIS—such as property type and value, and number of stories—evaluated the loss of the property. Having an accurate estimate of the damage caused will help FEMA in planning the fund relief for the community.
Higher definition debris estimation in streams is also demonstrated using the same low-cost, single-camera aerial imaging payload mounted to the motorglider. The presented work shows the ability to rapidly estimate debris deposits in waterways using aerial imagery which reduces the time and cost of recovery by potentially several months. The use of photogrammetry to obtain these estimates is limited to cases where there is an unobstructed view of the ground terrain, i.e., tree canopies do not obscure the view. The solution in these cases would be to use a scanning LiDAR system which does not have the same limitations as visual imagery-derived 3D reconstructions; however, the payload would be considerably more expensive.
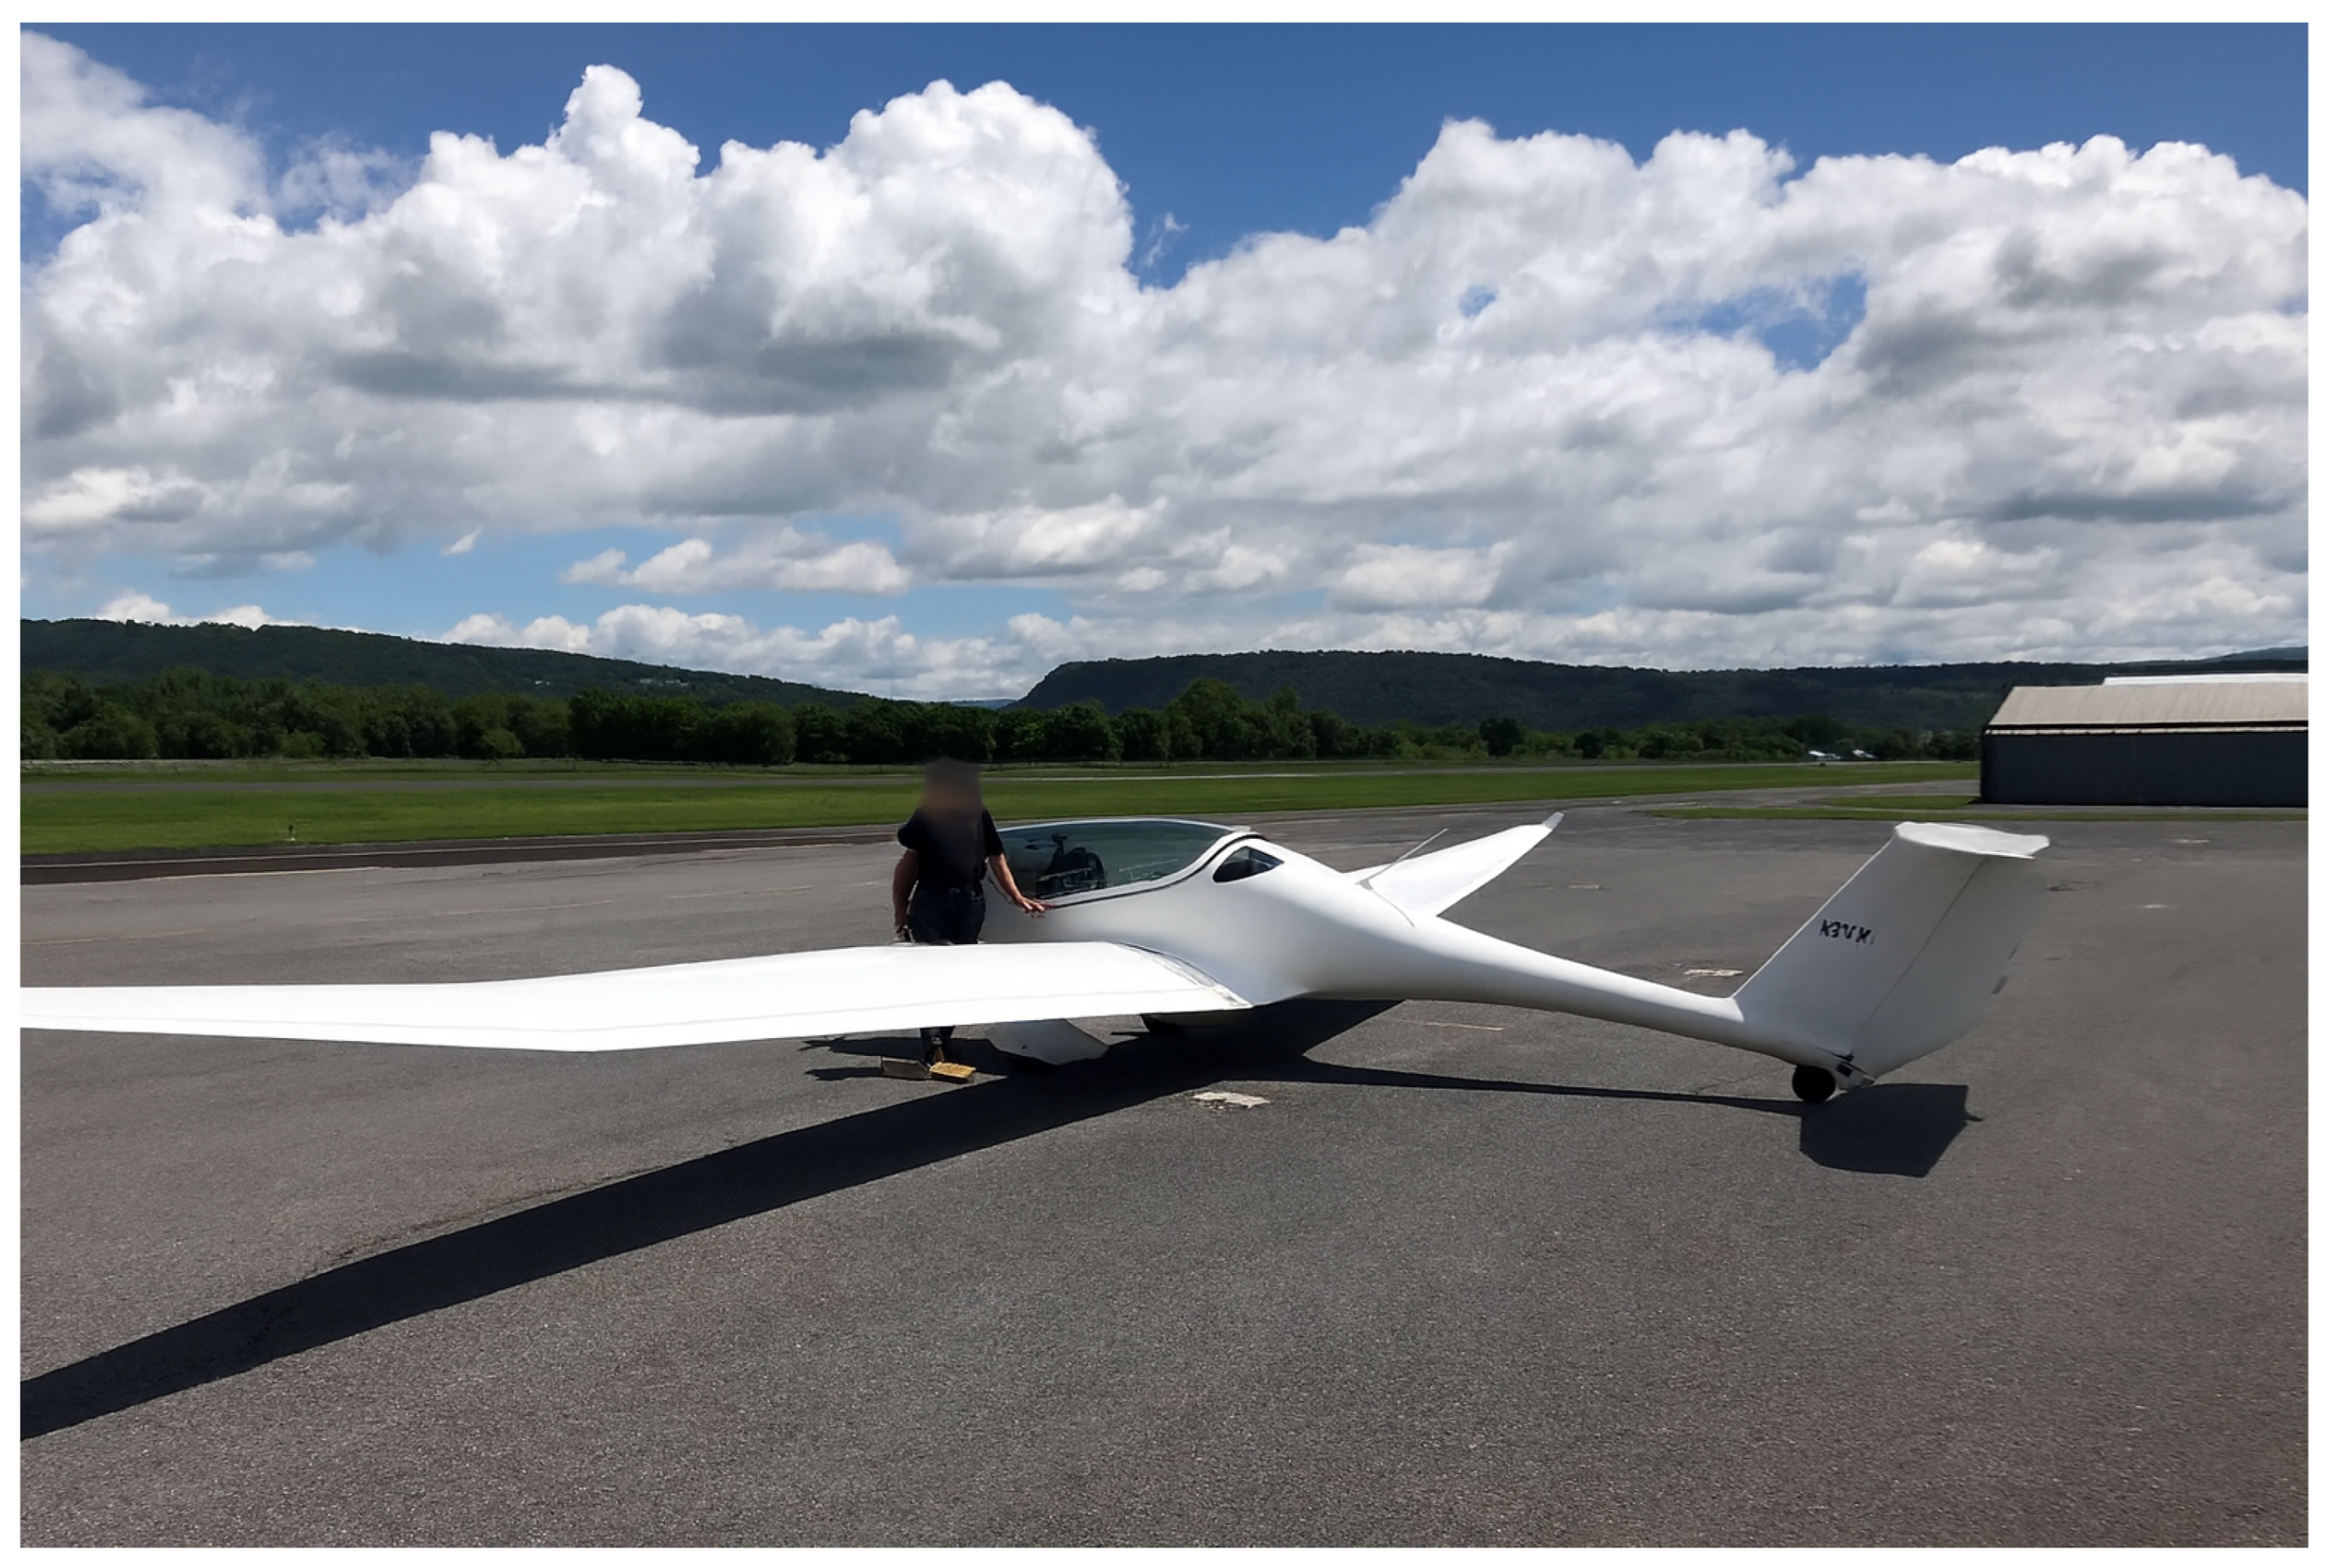
Aerial imagery was captured using a GoPro Hero 9, 20 MP camera (GoPro, Inc., Guadalajara, Mexico) mounted on the wing of a Phoenix U-15 Motorglider, overcoming the challenges of using UAVs to cover vast areas. The GoPro is a very simple and cheap solution to collect imagery to build 3D reconstructions and orthomosaics of the environment and a notable contribution for the disaster response community which is more likely to use aircraft equipped with expensive payloads. Advances in structure from motion (SfM) based softwares allow usable reconstructions with these DIY systems.
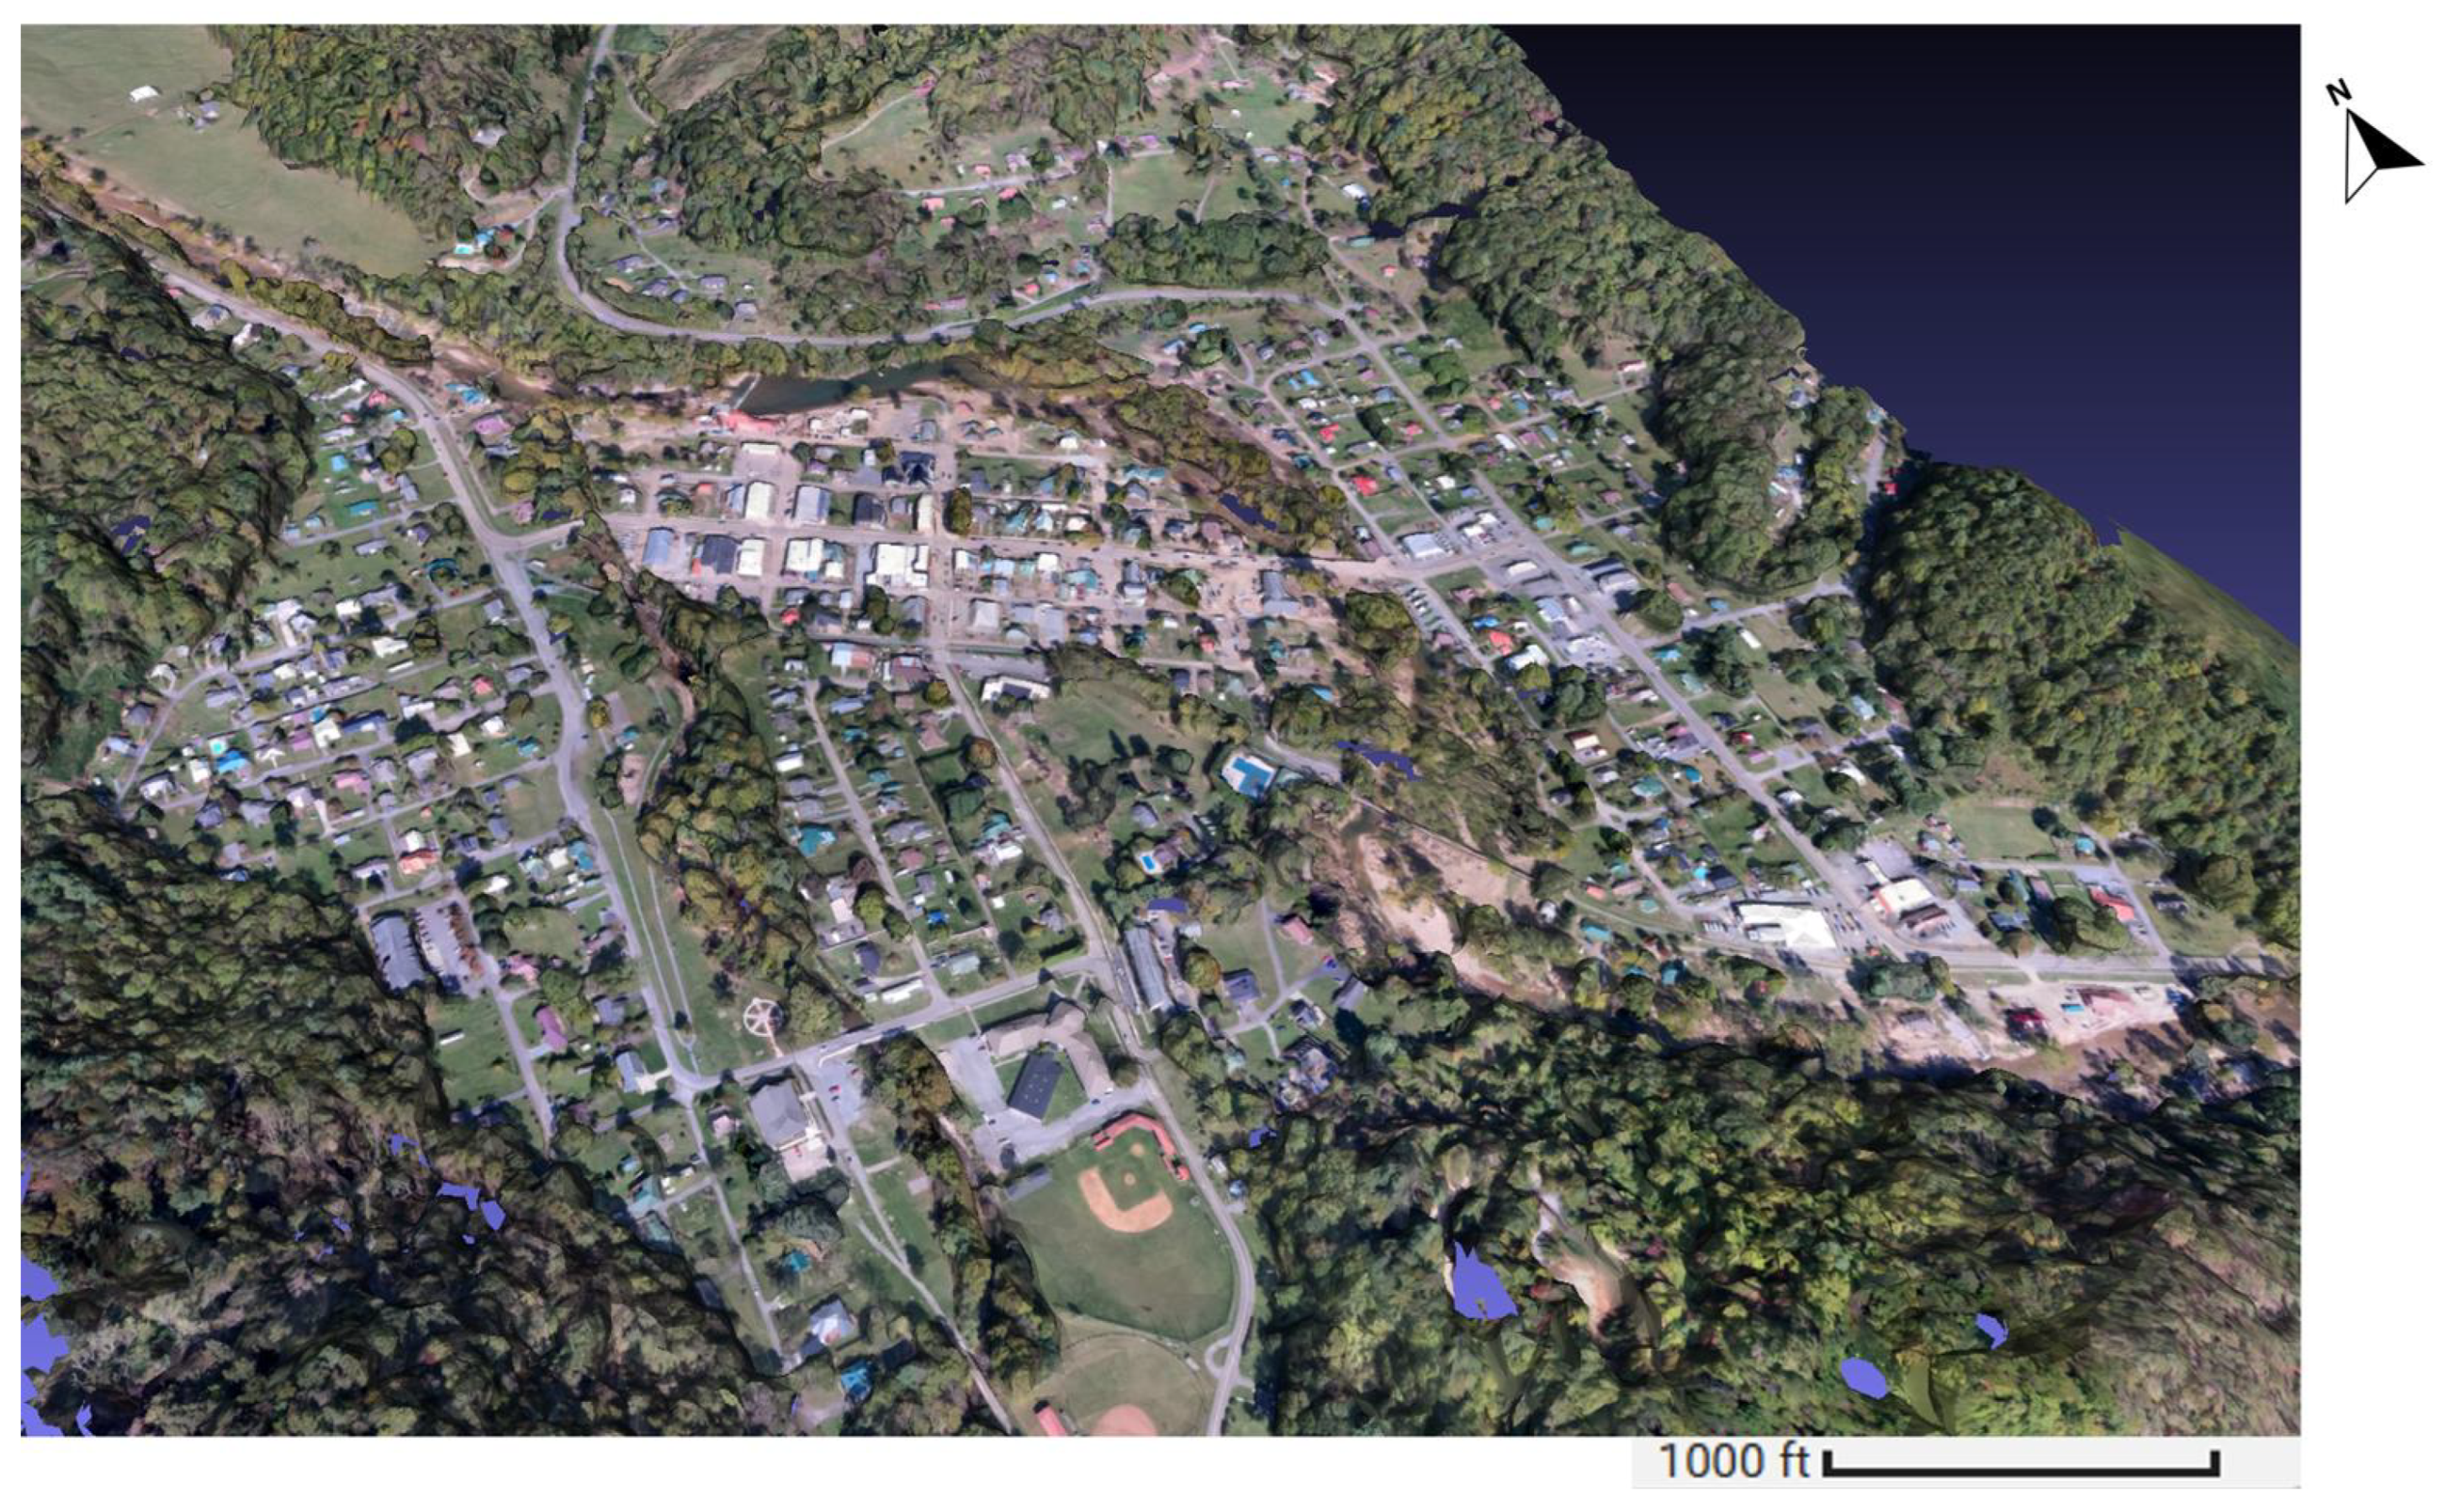
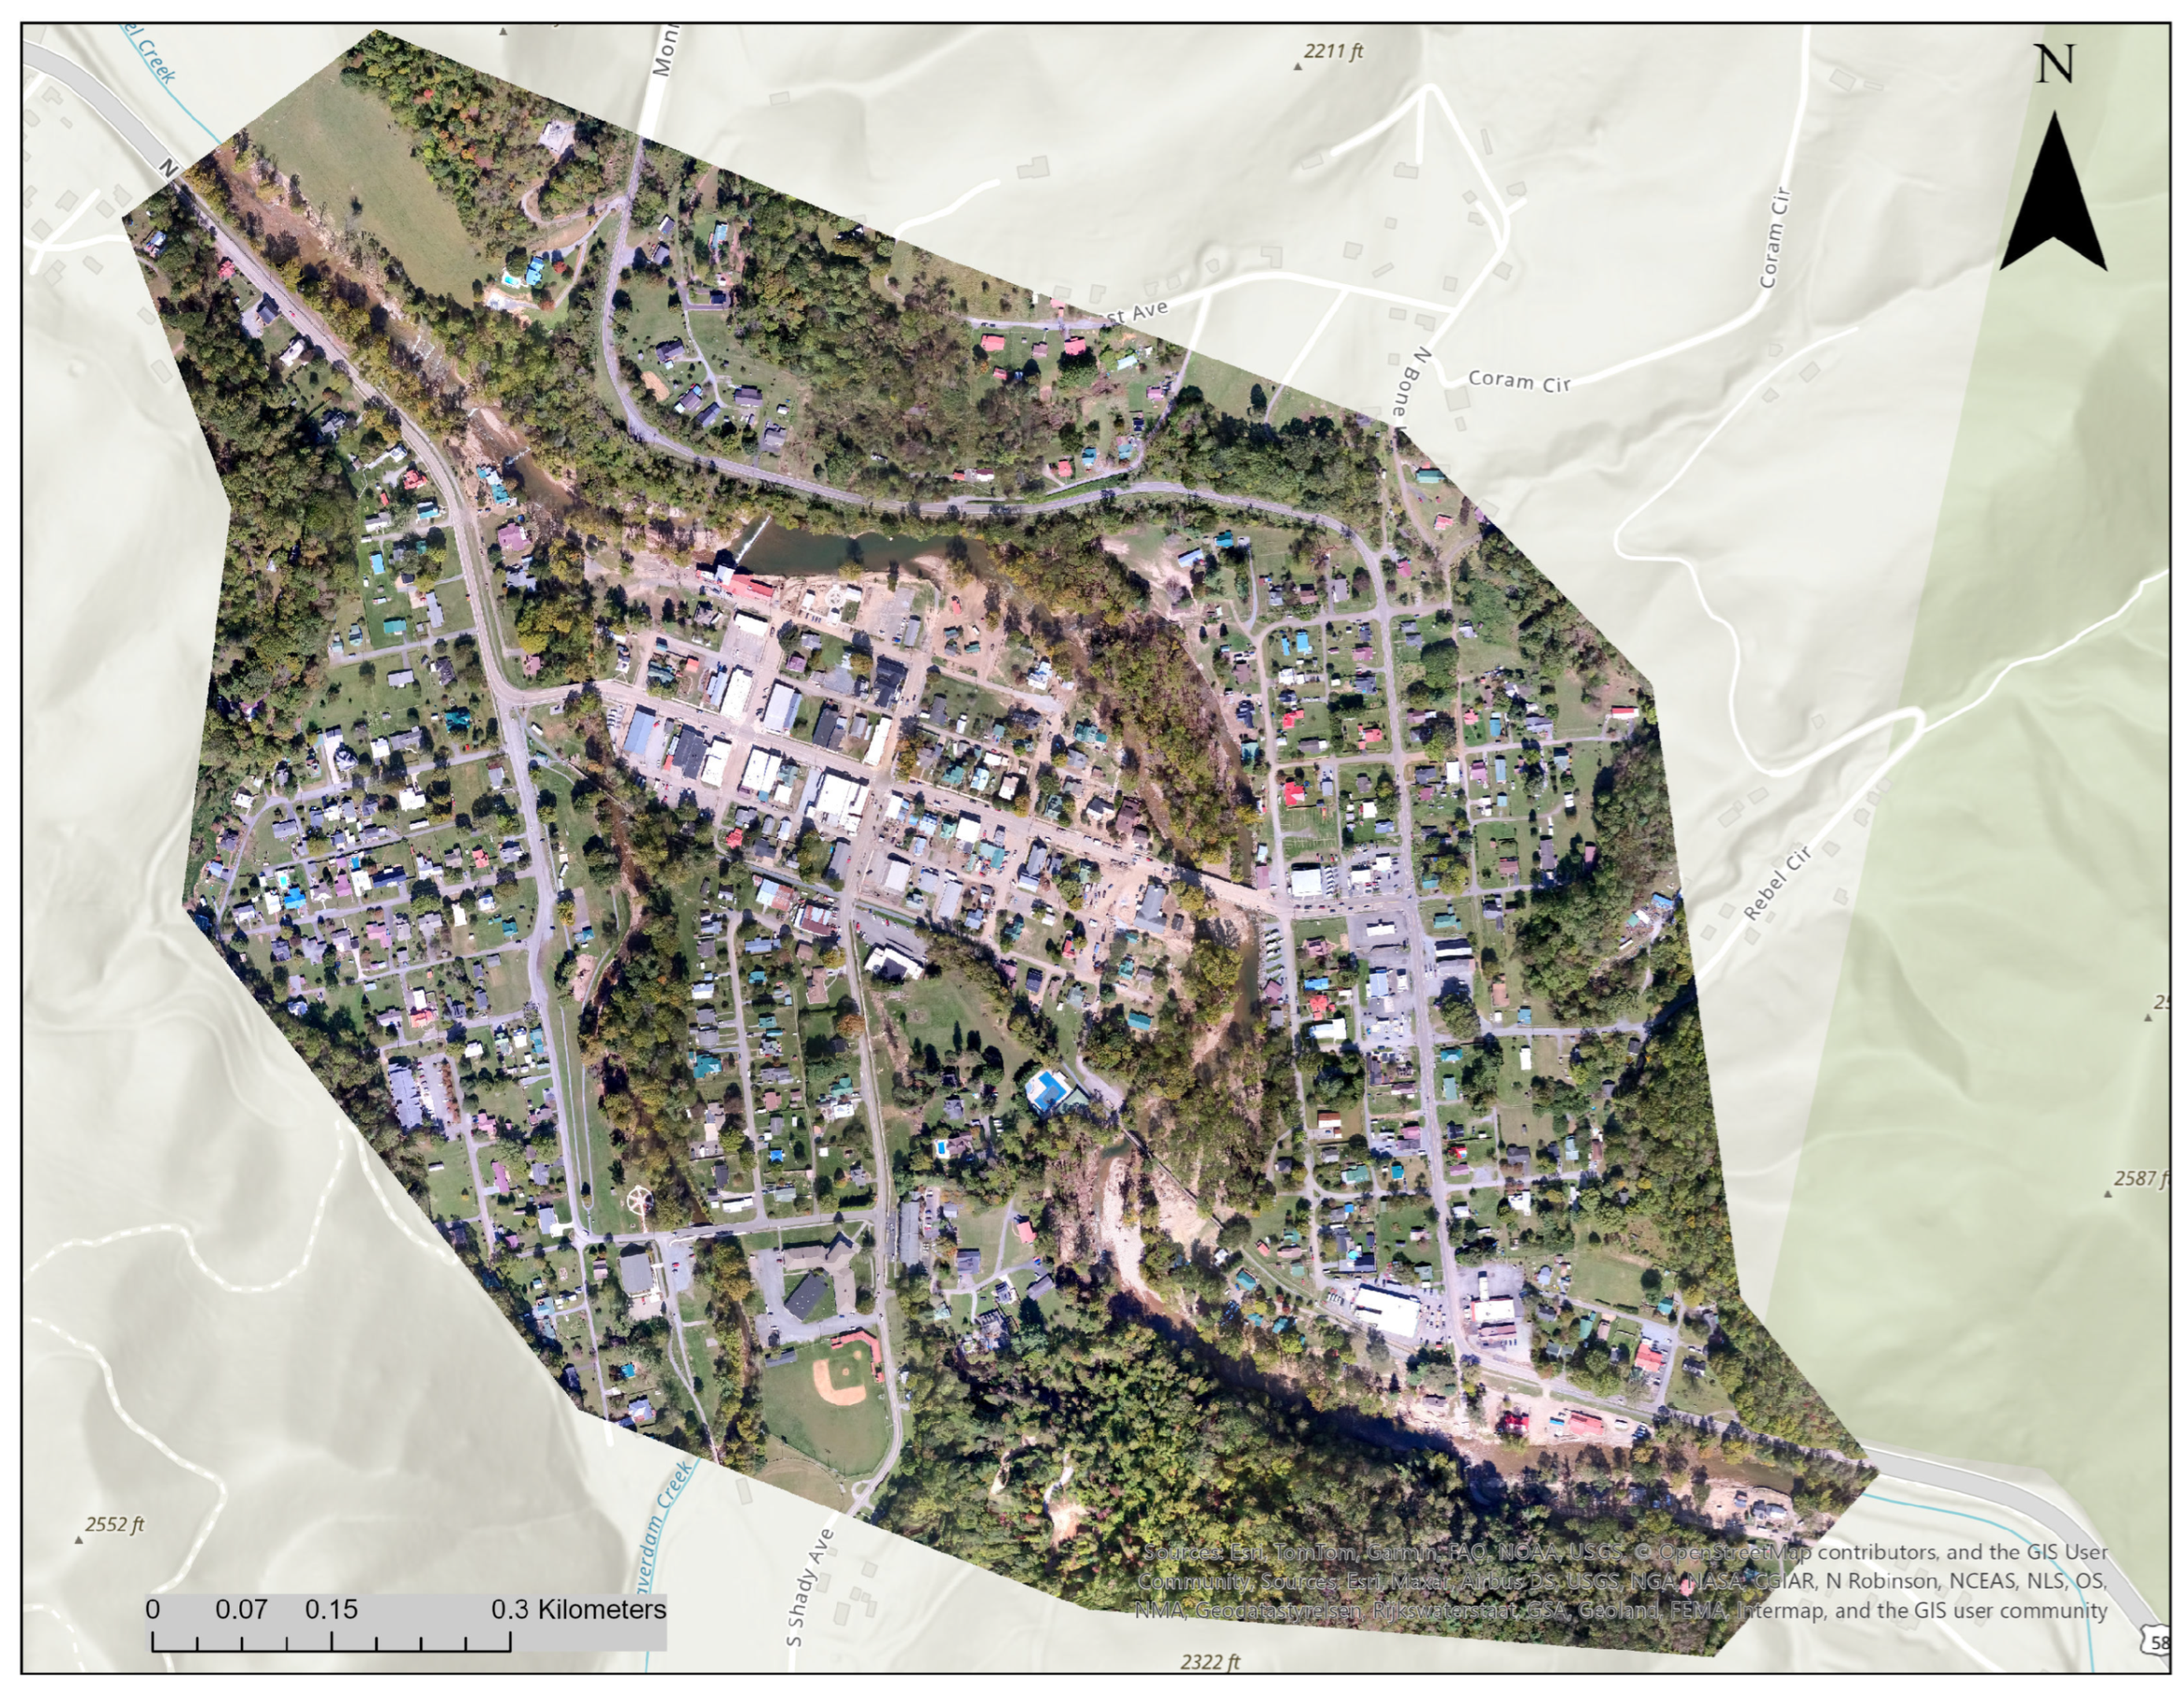
The SfM-based OpenDroneMap [
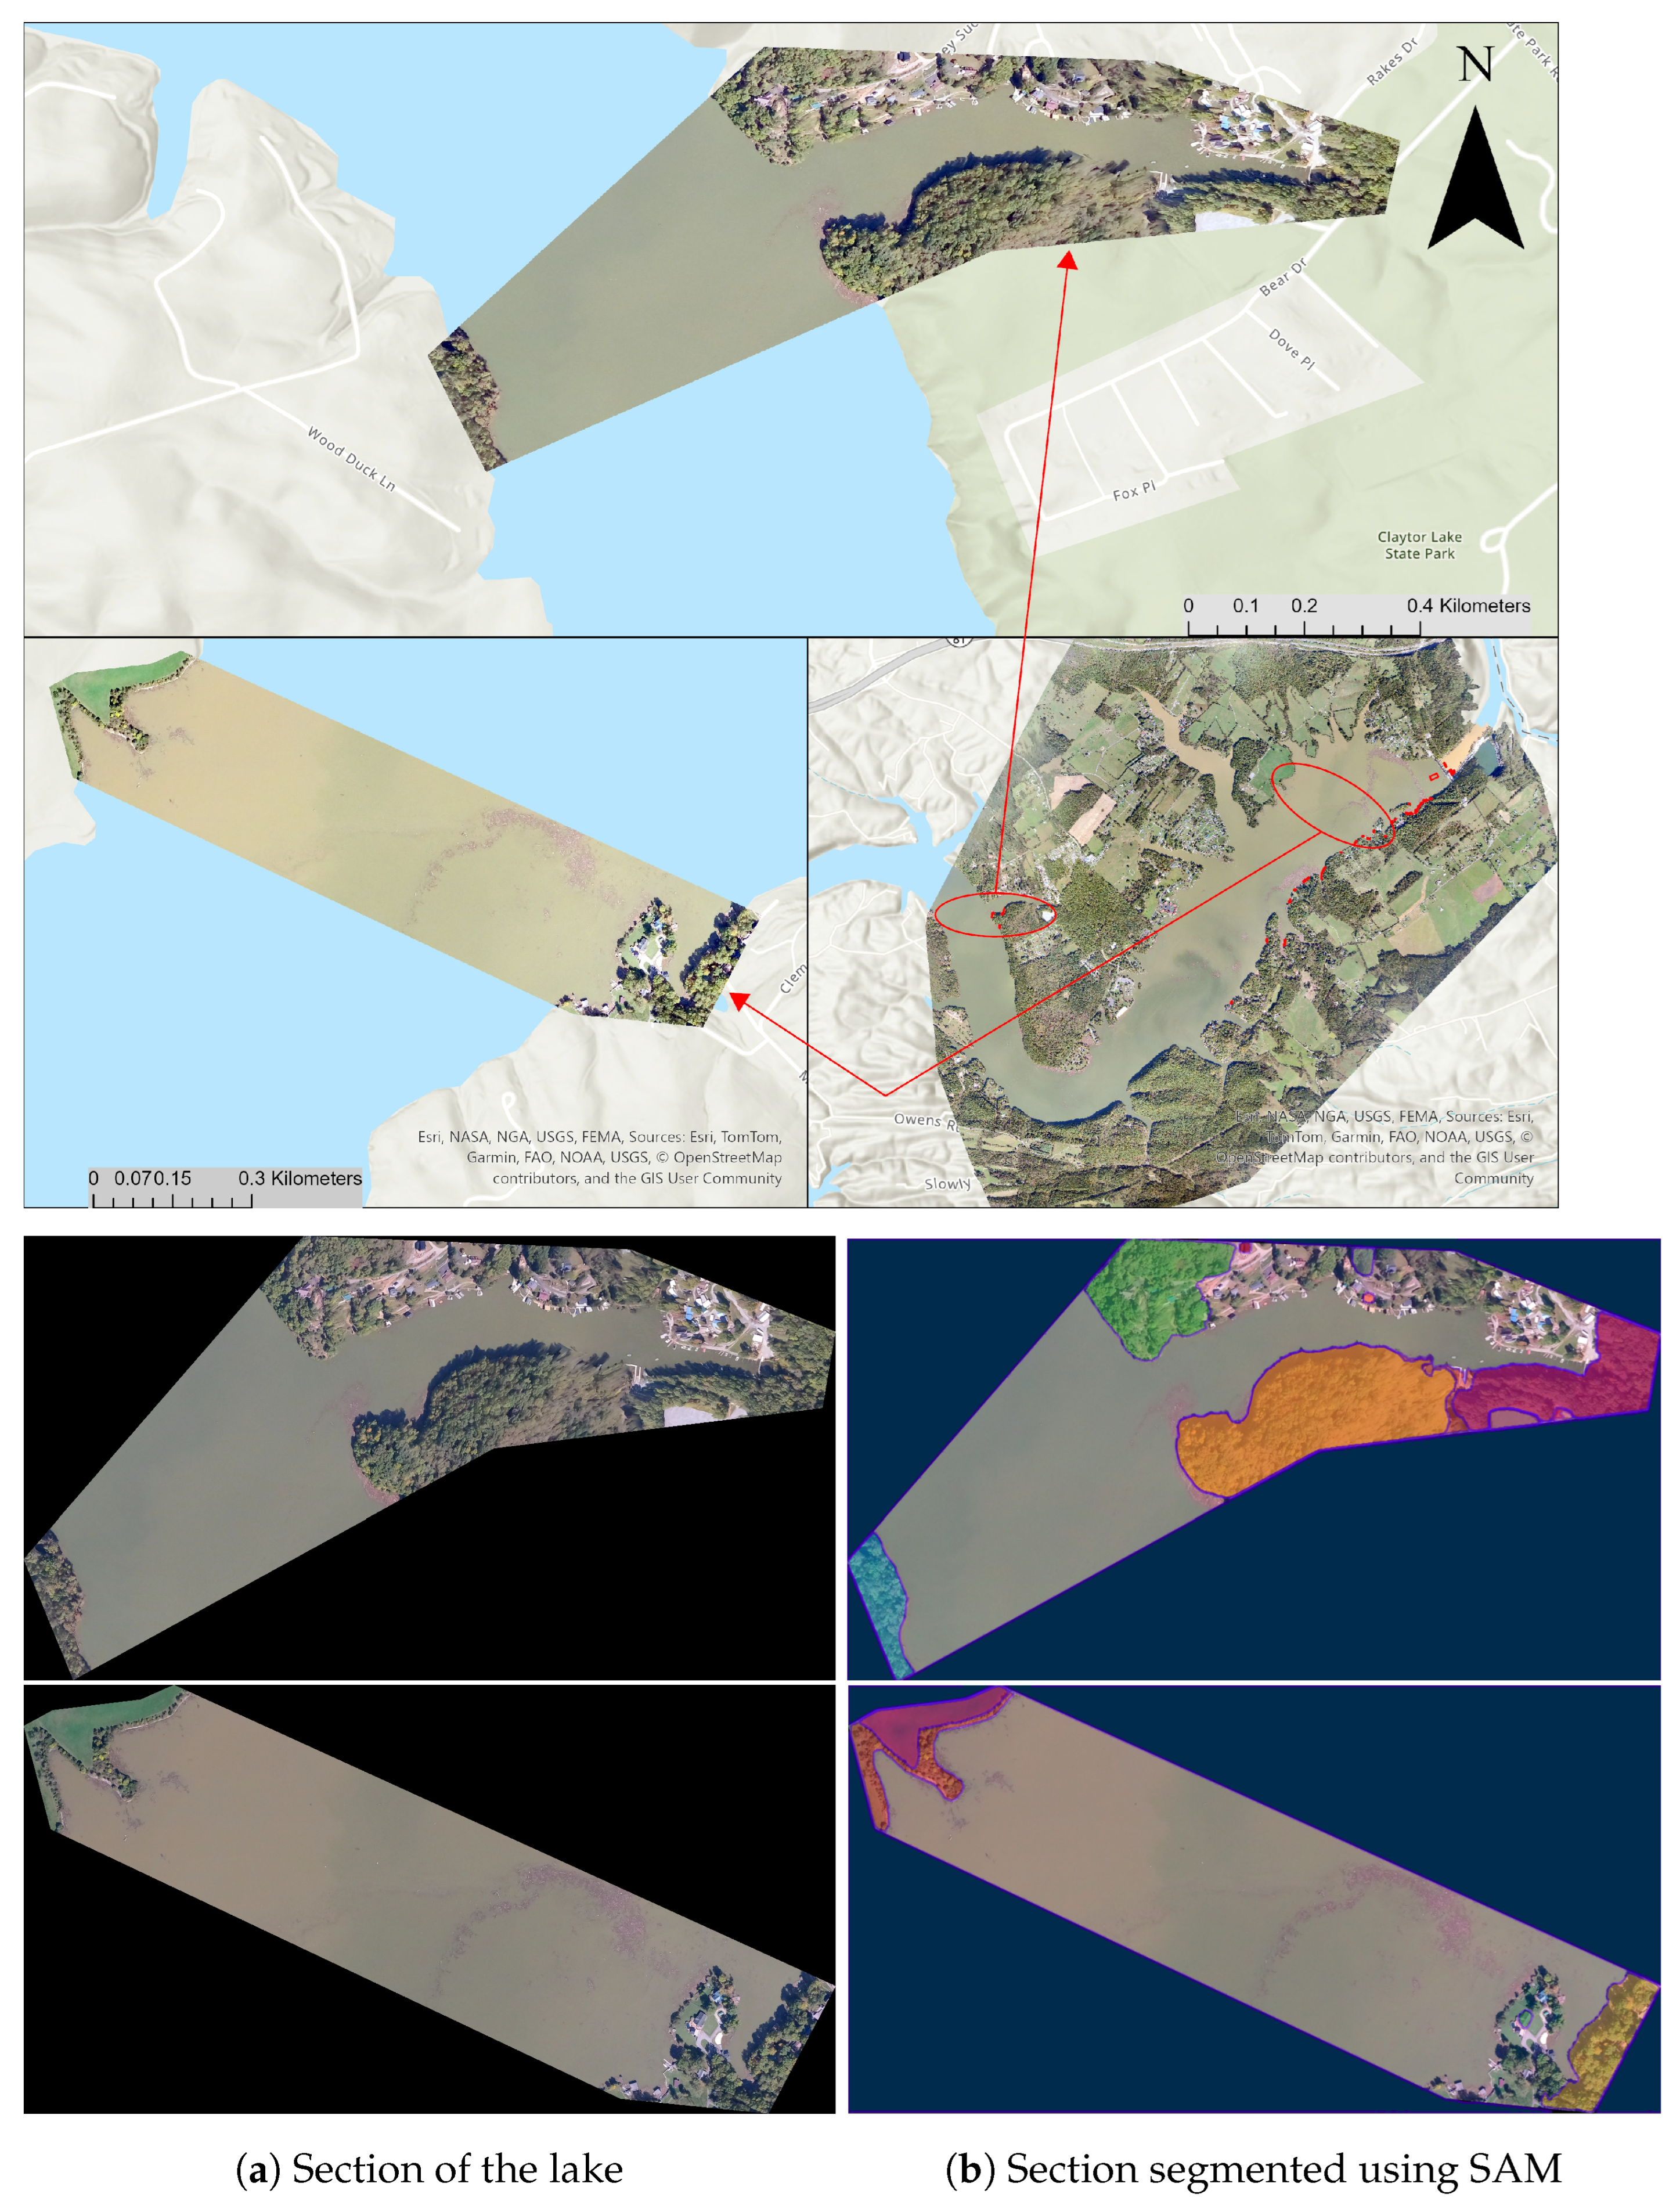
30] was used for reconstruction and orthomosaic creation from the imagery. For lake debris estimation, we used Roboflow [
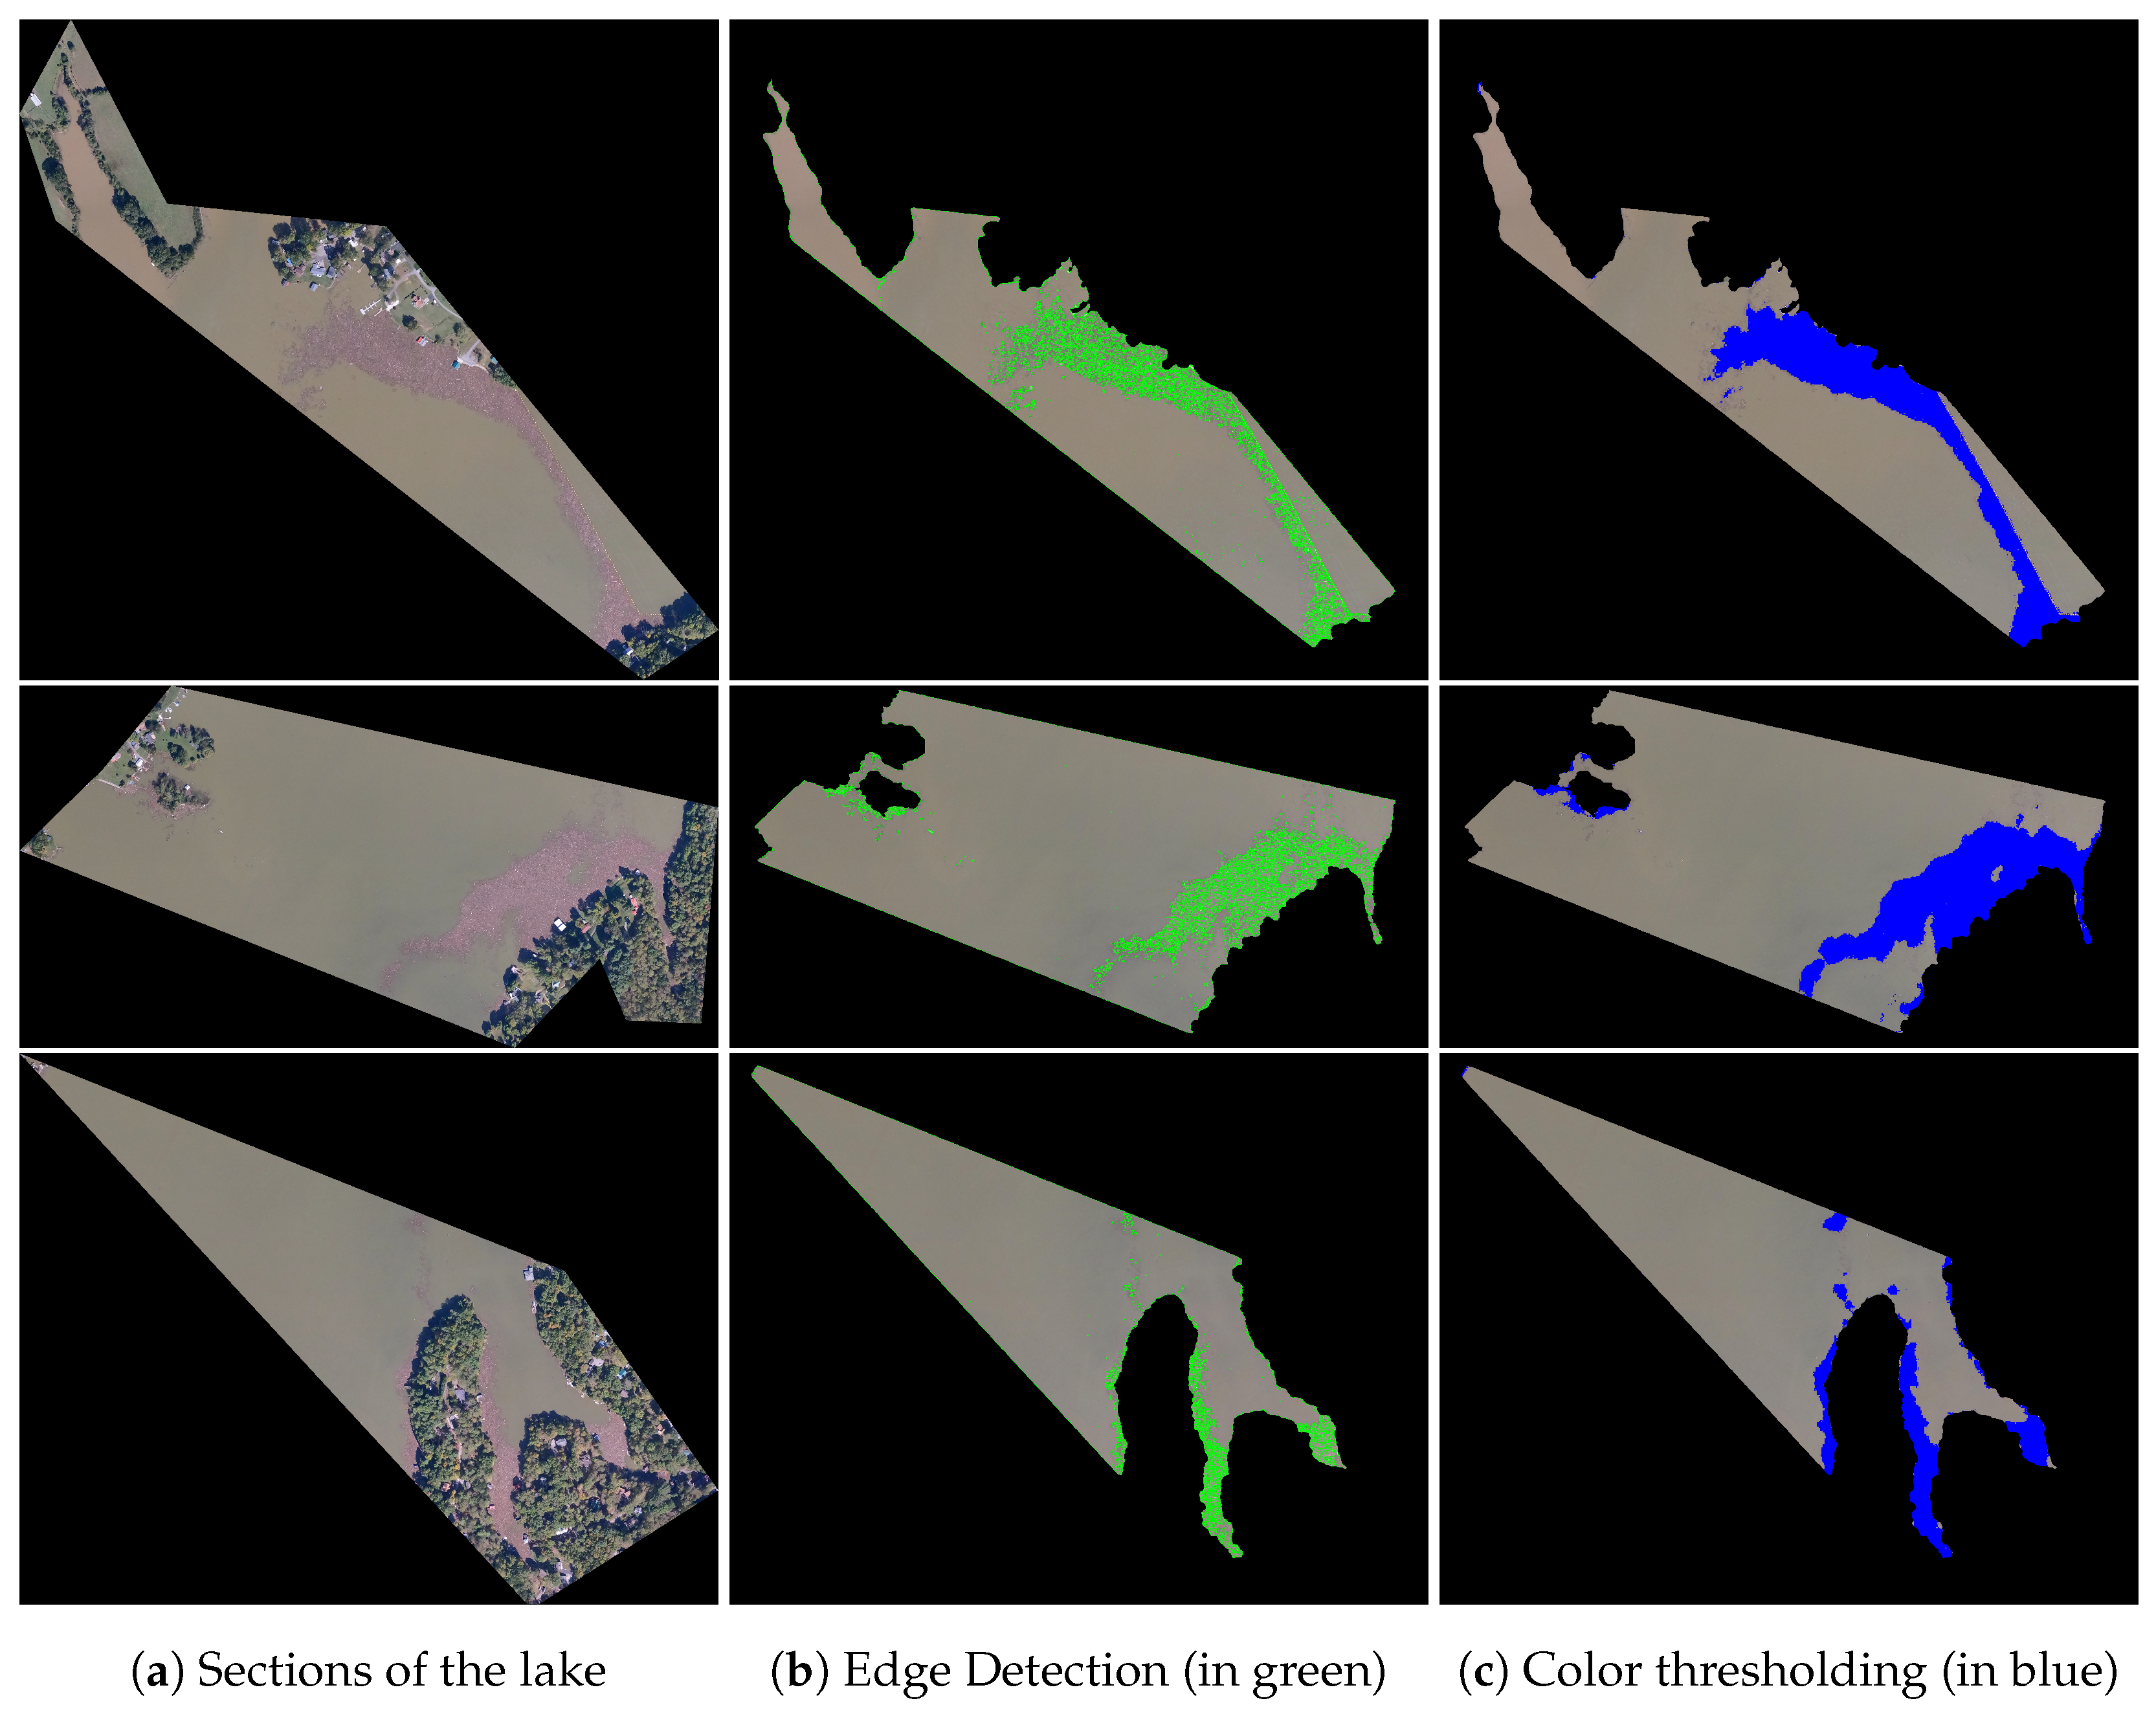
31] to manually segment the images using the smart polygon tool. After segmentation, we applied the Canny edge detection method on the original image of the extracted lake and color thresholding in HSV colorspace, giving the final segmentation of debris. The debris was then quantified in acres by analyzing pixels corresponding to edges and thresholded regions. For land and stream debris estimation, we used the pre-disaster 2016 state LiDAR DEM data and compared it with the DEM data from 3D reconstruction to estimate the height of debris in different regions of Damascus. We further performed the flood modeling in HEC-RAS to estimate the flood water depth in the town which can be used by FEMA to estimate the damage using a Hazus based tool.
The rest of the paper is organized as follows:
Section 2 includes the workflow of various tasks and the corresponding time required to perform debris estimation. It also explains in detail the various methods and software employed in the process.
Section 3 shows the results of the analysis of lakes and towns and their comparison with the debris collected in the field. Finally, conclusions and future work are provided in
Section 4.
3. Results and Discussion
This section discusses the results for Claytor Lake and Damascus debris estimation, flood modeling, and property valuation.
3.1. Debris Estimation in Claytor Lake
In
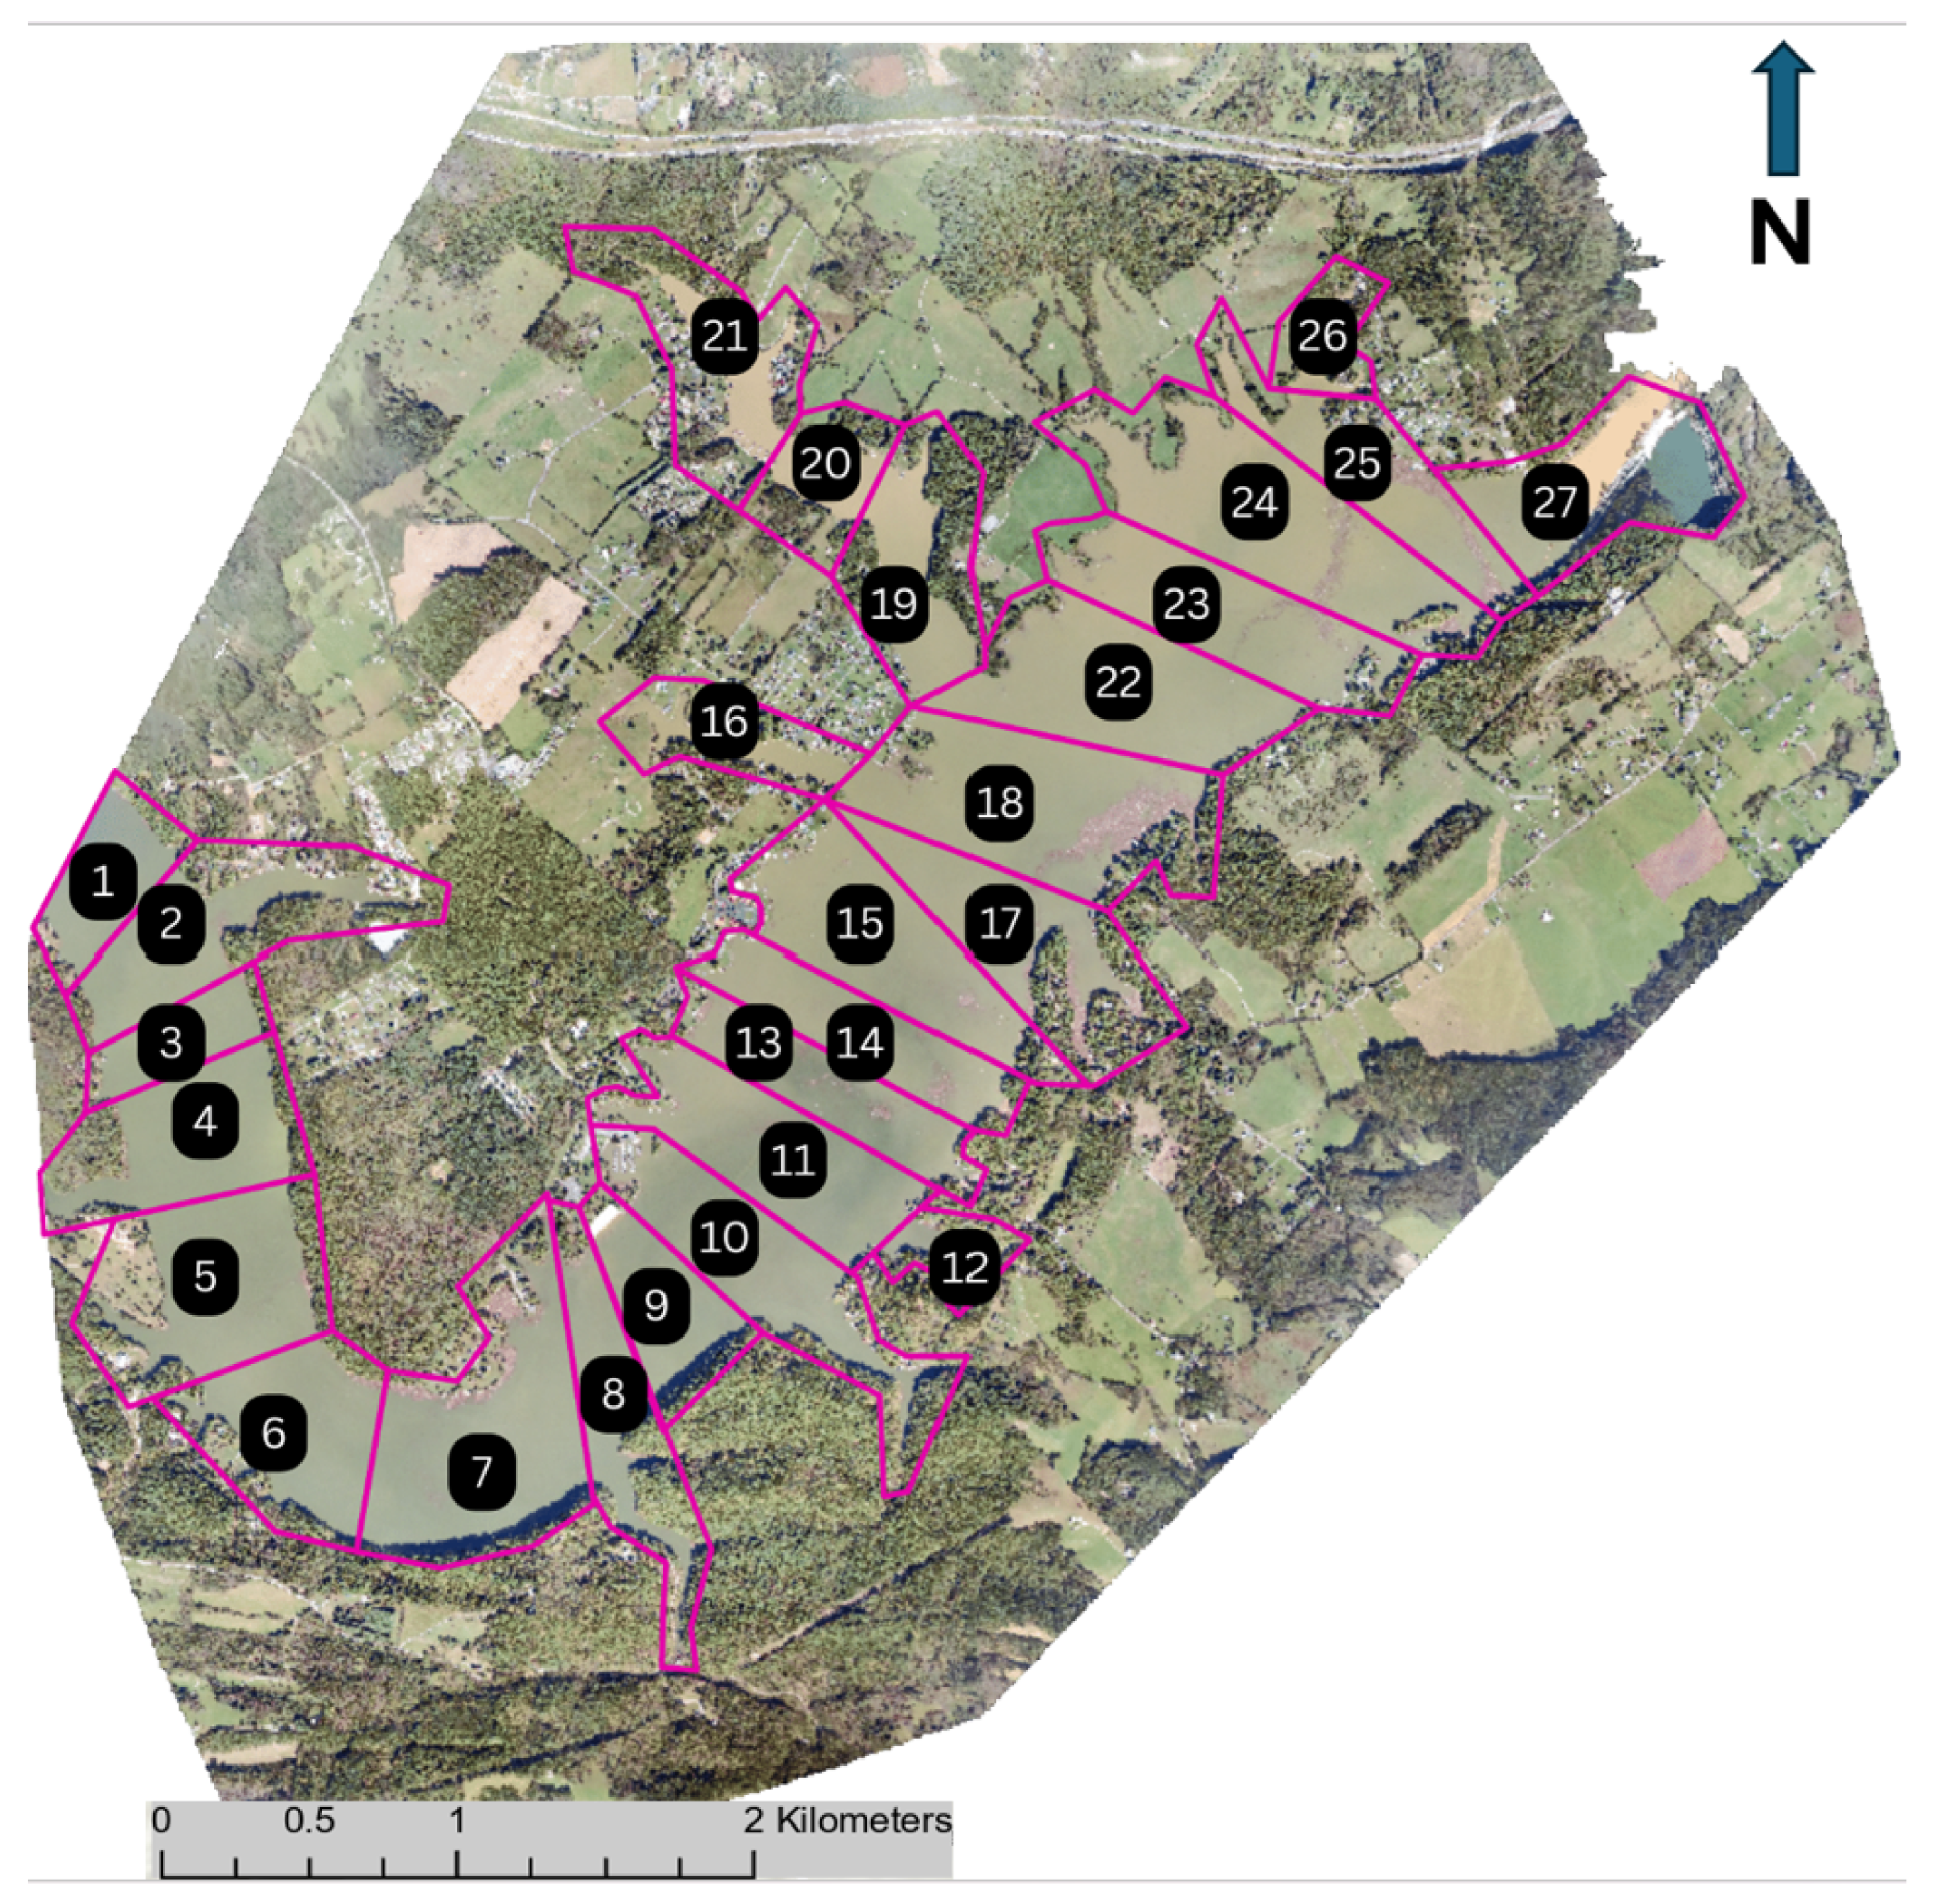
Section 2.4, we present the implementation of a pipeline of two segmentation approaches that proved effective, allowing for accurate lake isolation and subsequent debris detection. To estimate the total debris in the lake, we calculate the percentage of debris pixels relative to water pixels for each section of Claytor Lake. The area of the lake is determined to be around 1552 acres based on pixel analysis. Our model estimates approximately 90 acres of debris.
We compare our findings to data provided by DEQ, which reported 28,249 cubic yards of debris, which is 17.5 acre-feet. USACE assumes 12 inches of debris, and based on that assumption, the debris is spread over an area of 17.5 acres. However, there is no basis for the one-foot assumption, as it cannot represent the debris of varying depth.
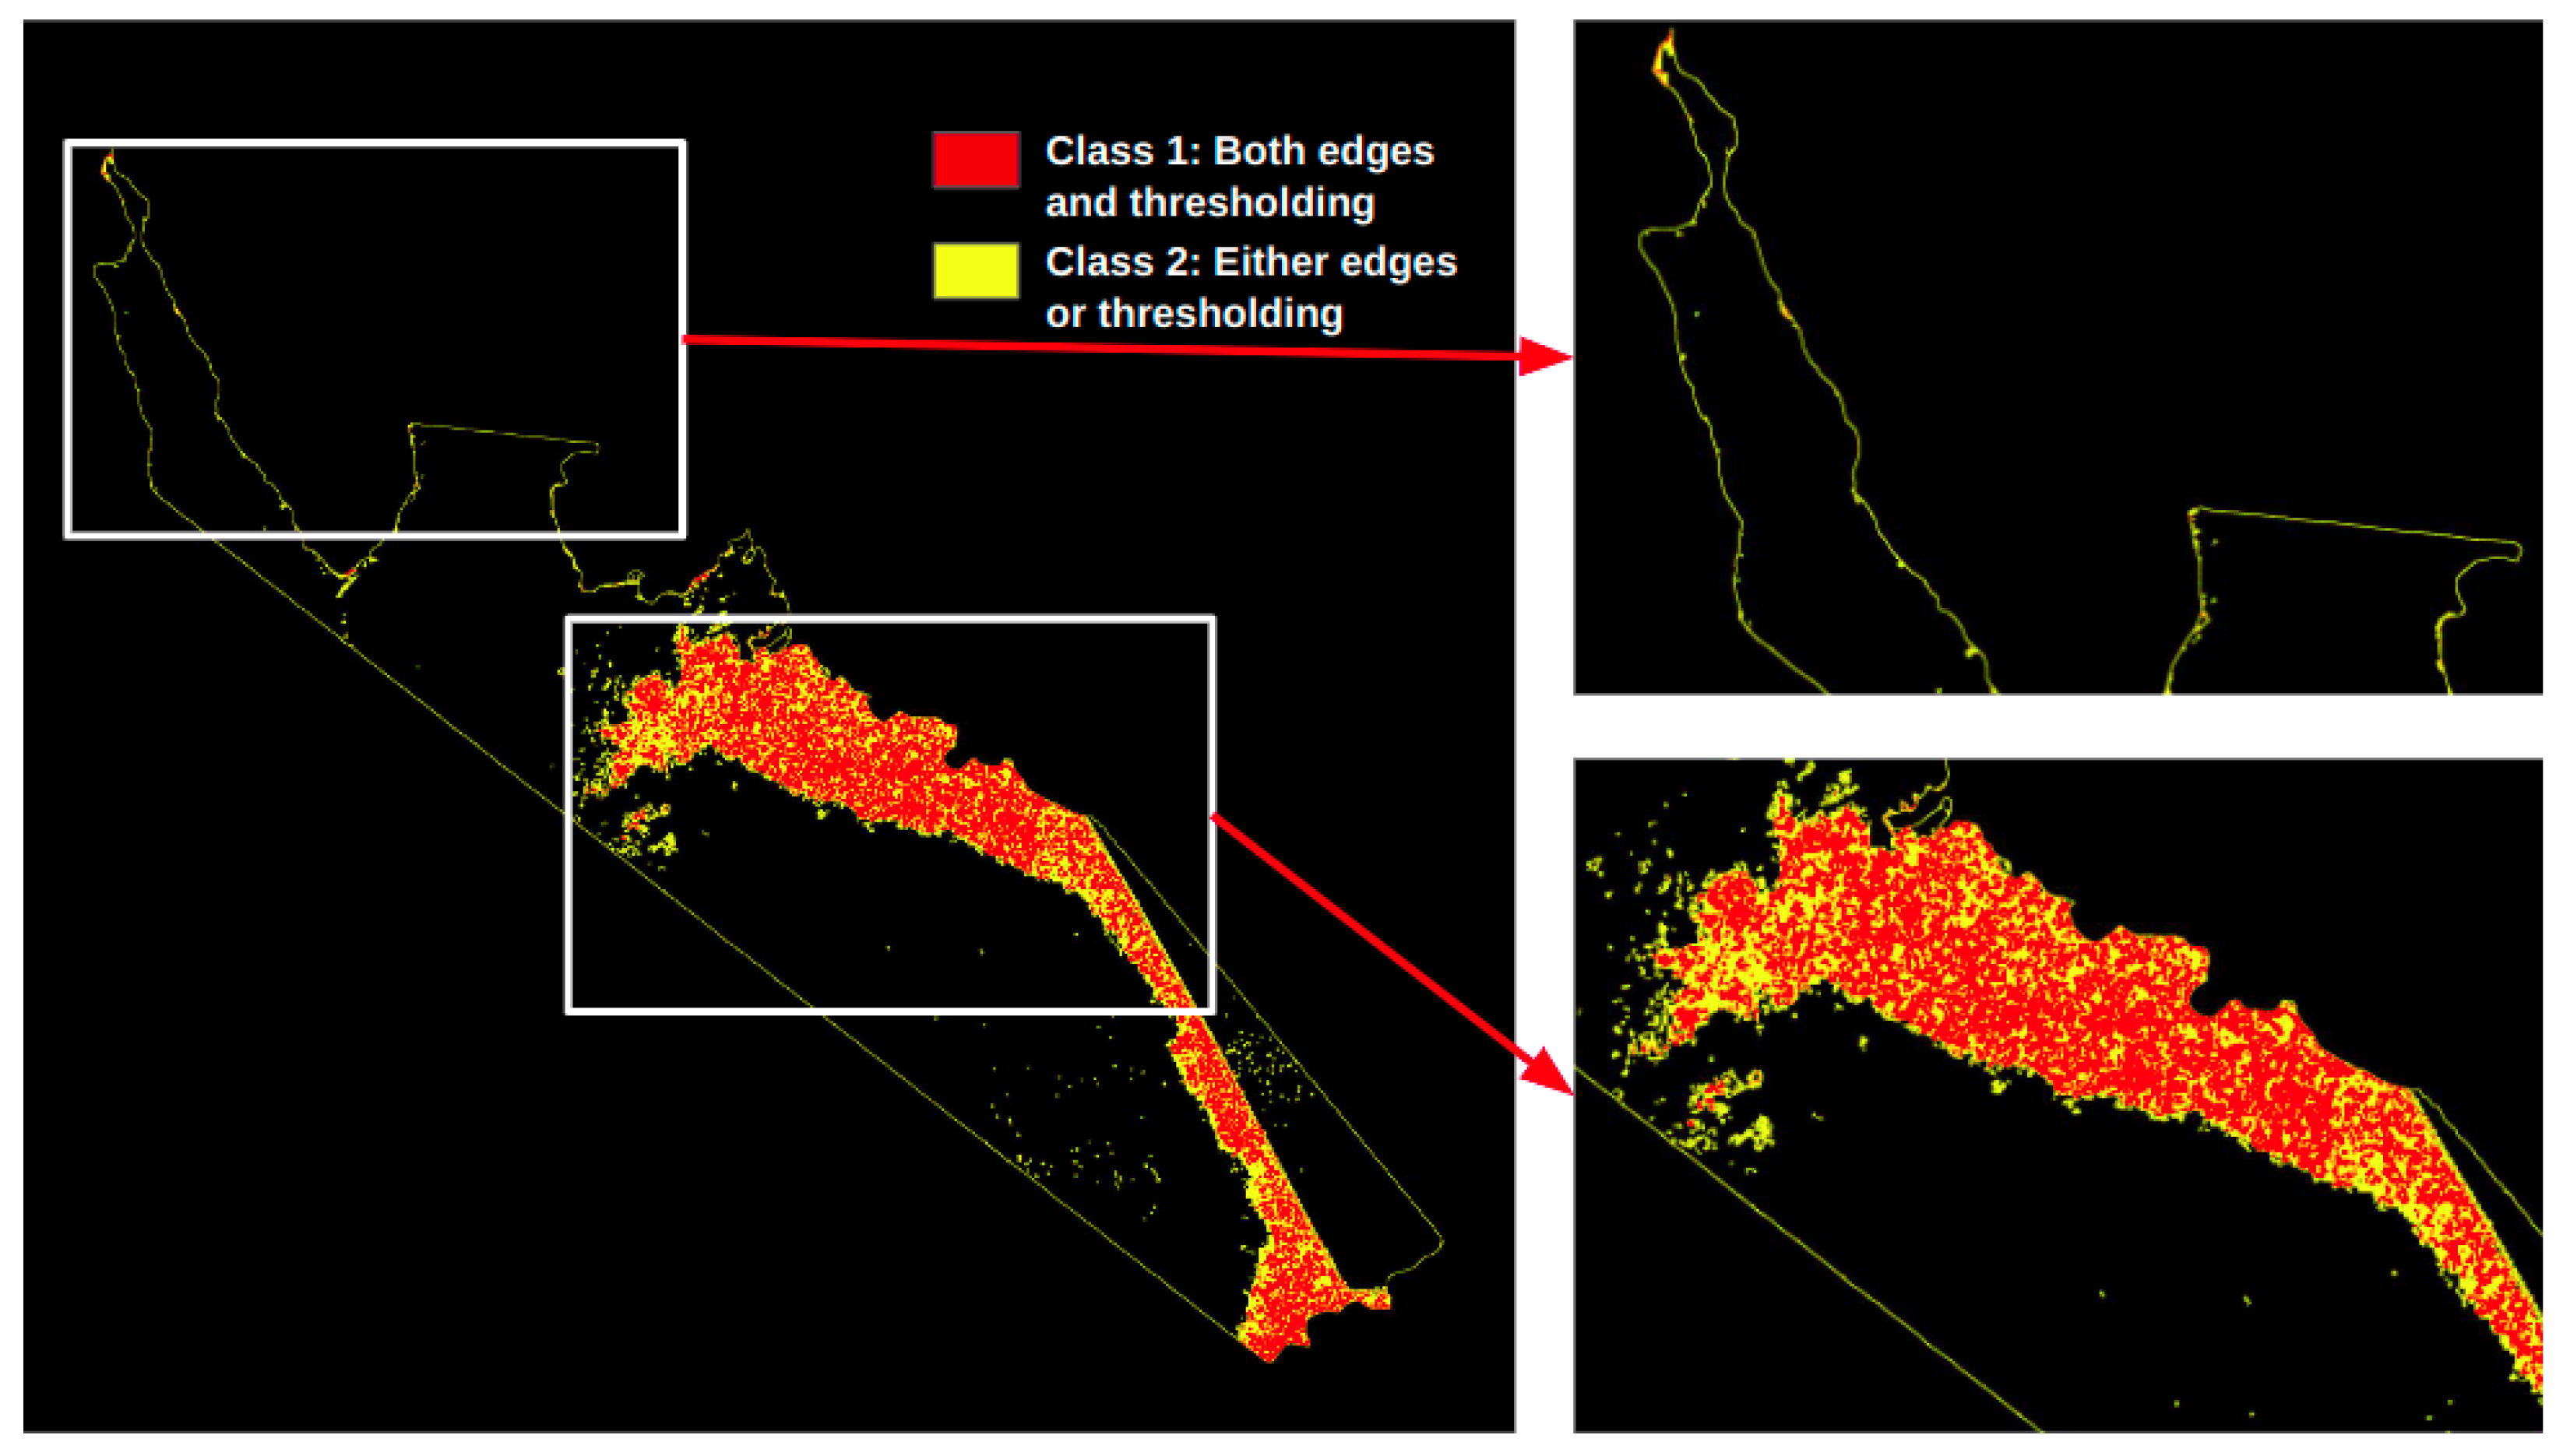
As explained in
Section 2, we classify the lake debris into two classes, with Class 1 representing mainly the logs and plastic, and Class 2, the mulch. This classification can be used to find the volume of the debris. For conservative estimates, we can assume that class 1 contains only logs that have the highest thickness of all debris detected. Based on this assumption, the volume of debris is estimated as shown in
Table 3.
This table shows that class 1 debris can have a volume from 16.5 to 33 acre–ft, and class 2 debris can be 9.4 to 14 acre–ft, reflecting a possible variation in debris spread and thickness. Another possible scenario is that the debris collected by USACE is mostly represented by class 1, which is 33 acres. With a depth of 6.5 inches, the debris of 33 acres is estimated to be around 17.5 acre–ft, which is the same as the collected debris.
There are several factors contributing to the potential errors in our method. Edge detection, being a sensitive process, sometimes misclassifies ripples and sunlight reflections on the lake surface as debris, contributing to the false positives as shown in
Figure 20a,b. In our case, this accounts for 3.4% of the total debris and is found in 3 out of 27 sections. Throughout the process, we approximate the edge thickness to half the average log width, but the actual log sizes can vary. By changing the edge width from 4 pixels to 2 pixels, the debris is reduced by around 14%. Additionally, during segmentation in Roboflow, small debris patches near the lake boundary are occasionally excluded. Moreover, certain areas, such as boats or floating platforms, are difficult to distinguish from debris and thus are not excluded from the debris estimation. Further, some areas are obscured by shadows where the algorithm fails to detect visible debris, resulting in false negatives as shown in
Figure 20c. It is also important to note that the DEQ data is collected nearly two months post-flood. By that time, some debris, particularly wood, may have sunk to the lake bottom, reducing visible debris quantities.
To evaluate the applicability and validity of our segmentation method, we implement the methodology on aerial imagery collected from the mapped South Holston Lake area, which is processed similarly to Claytor Lake. The orthomosaic is divided into 50 sections and analyzed for debris assessment. Based on our analysis, we estimate approximately 12 acres of debris present within the lake. All parameters for edge detection and color thresholding are kept consistent across the sections, except for one instance, where the hue threshold range is expanded from 120–149 to 110–149 to accommodate color variation. The false positives, primarily due to the misclassification of sunlight reflection as debris, are 0.19% of the total lake area, occurring in 4 out of 50 sections. False negatives, where debris is obscured by shadow and is not detected, represent approximately 0.44% of the total water area.
Table 4 represents the confusion matrix and evaluation metrics of the edge detection and color thresholding-based segmentation method for Claytor Lake and South Holston Lake. The false positives, false negatives, true positives, and true negatives are calculated as percentages of the total water, including debris.
Despite these challenges, our method provides better initial estimates as compared to the USACE estimates and can be obtained within 72 h after the disaster. The sectional division of the whole mapped Claytor lake area of nearly 2400 acres on ArcGIS Pro takes approximately 1–2 h on a machine with 12 GB RAM and i5, 10th-gen processor, while segmentation in Roboflow takes nearly half an hour for 27 sections. This step highly depends on the number of sections created. Since Roboflow is an online platform, it does not depend on the hardware in use. These segmented images can then be fed to the algorithm of color thresholding and edge detection to detect the logs and discoloration in the lake. This algorithm is run on an i7 12th-gen machine with 24 GB RAM and can produce the result in less than a minute for nearly 27 sections of the lake.
Our current study focuses on lakes devoid of large objects like tires or propane tanks. For lakes with such objects, object detection algorithms can be incorporated to exclude docks, boats, or other non-debris objects from analysis. Adjusting the thresholding range and edge thickness can further refine debris detection in complex scenarios.
3.2. Debris Estimation in Damascus
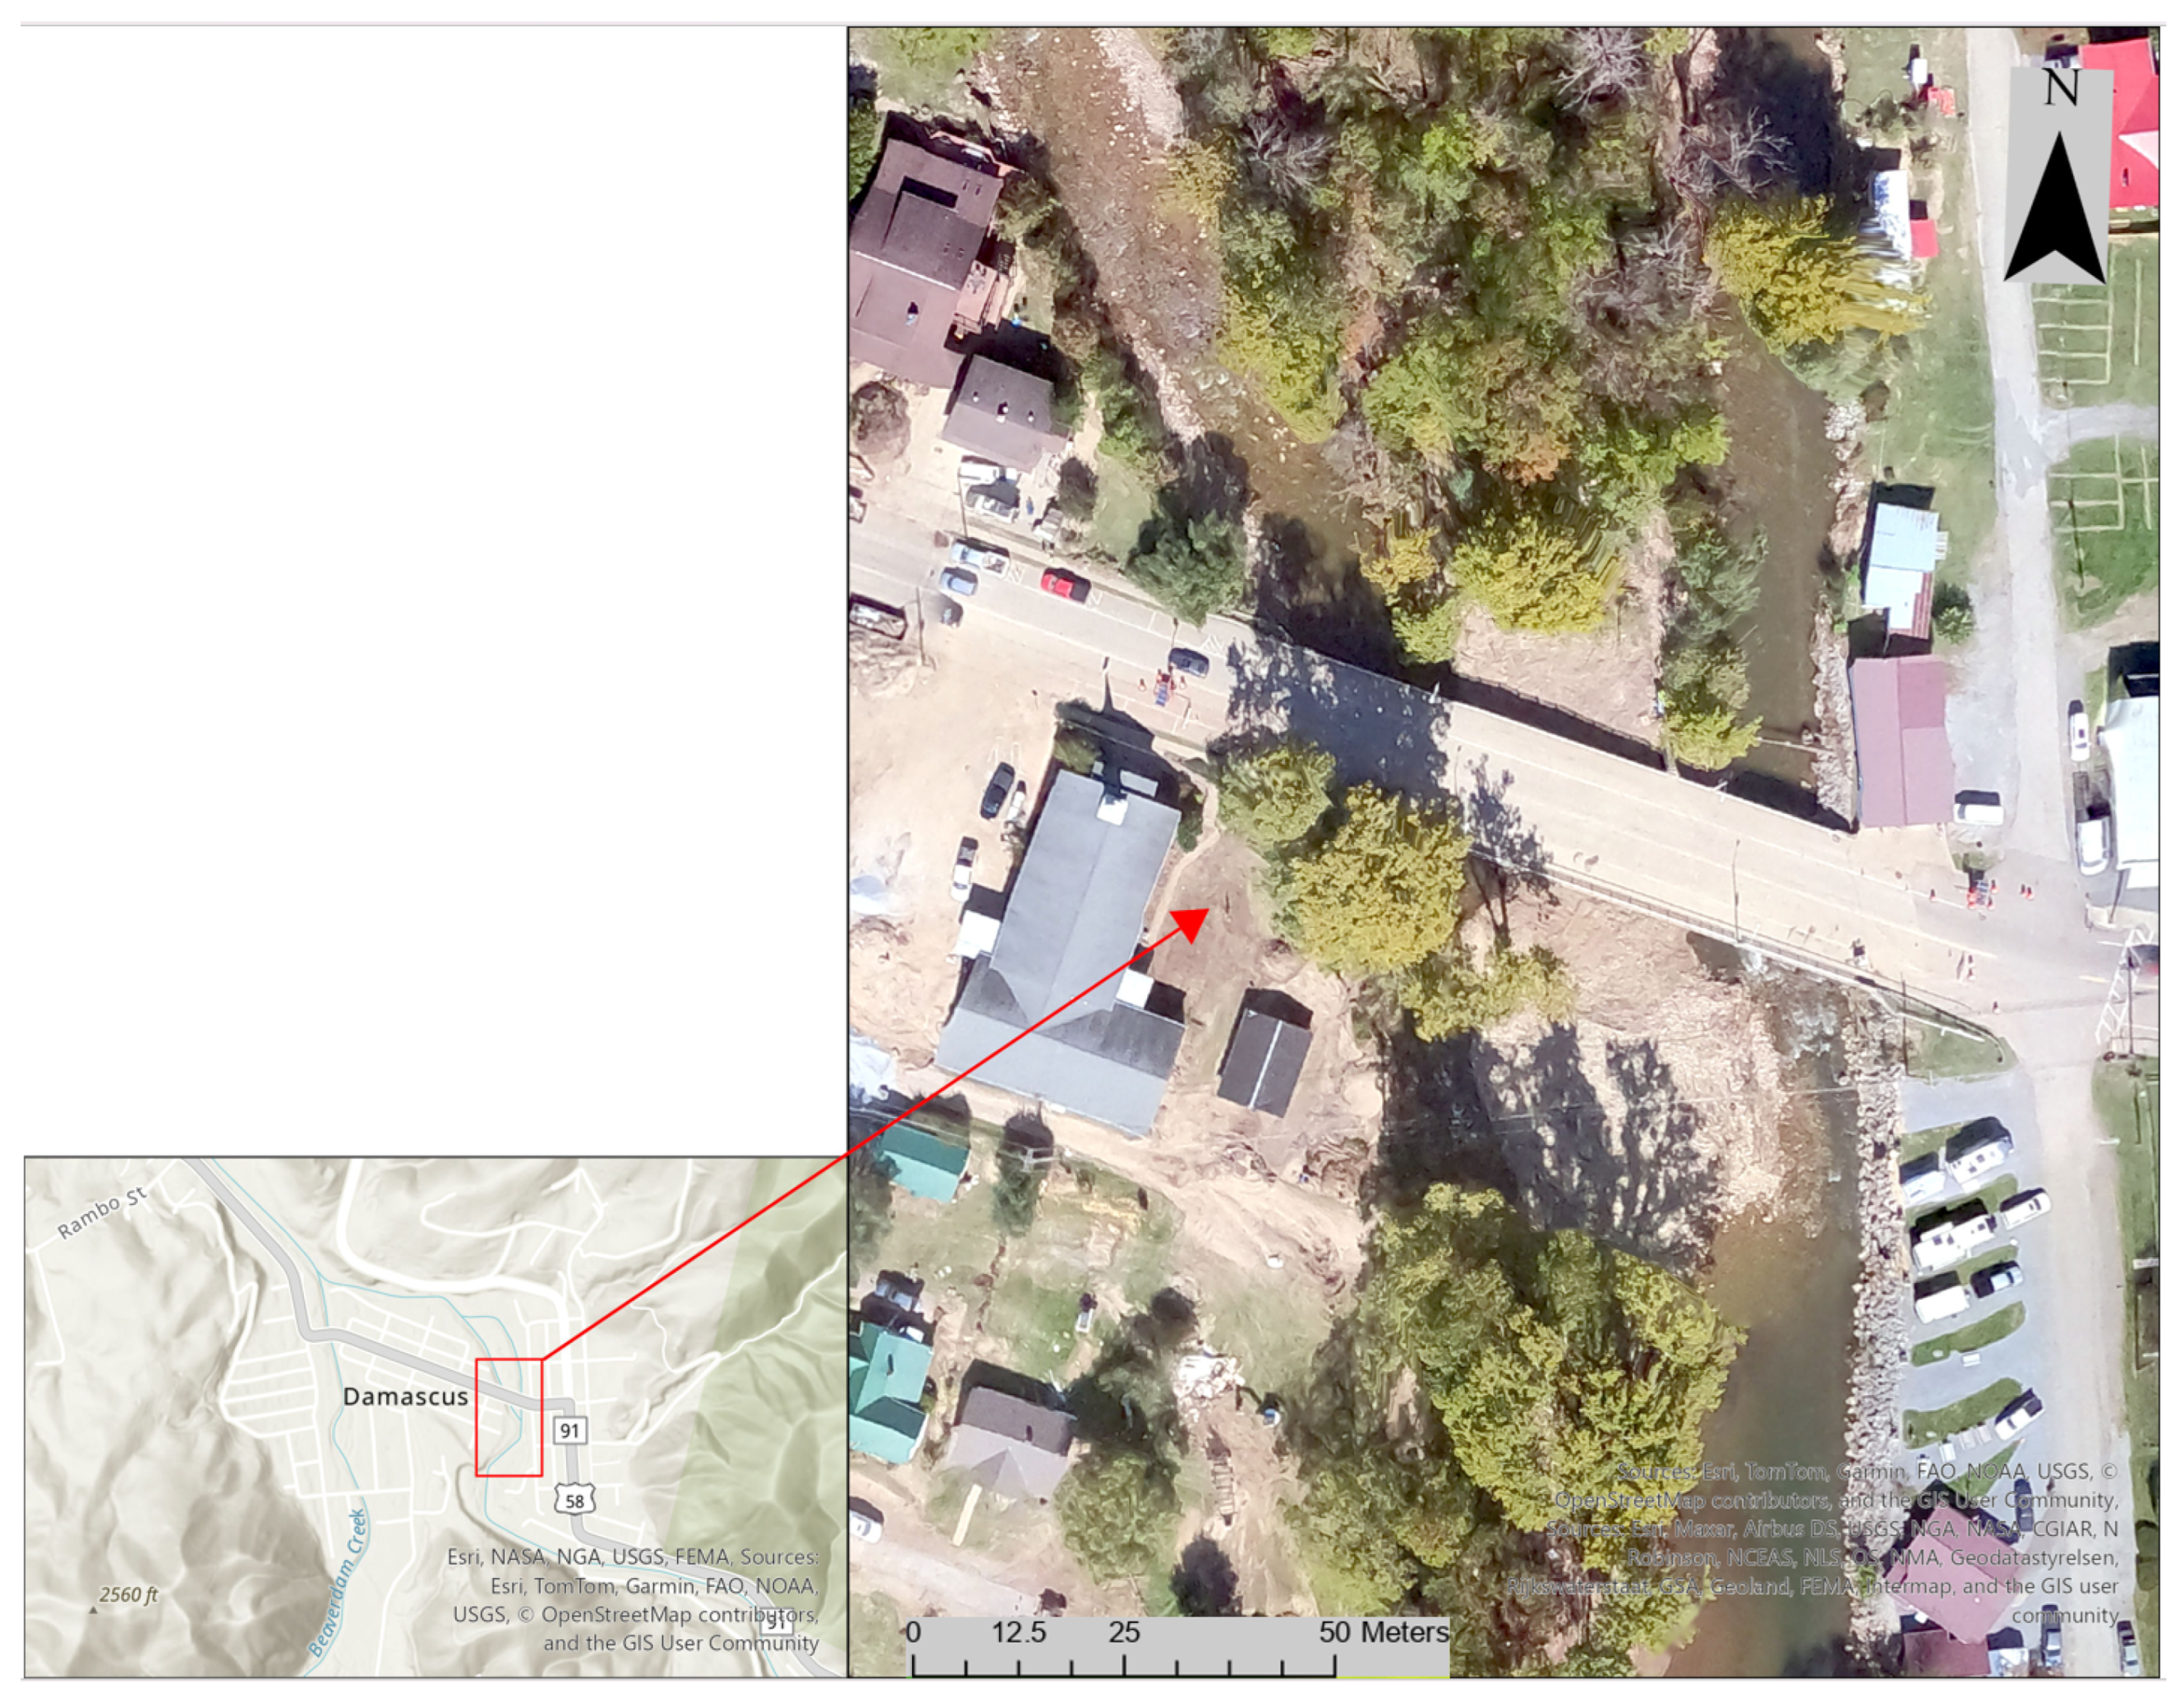
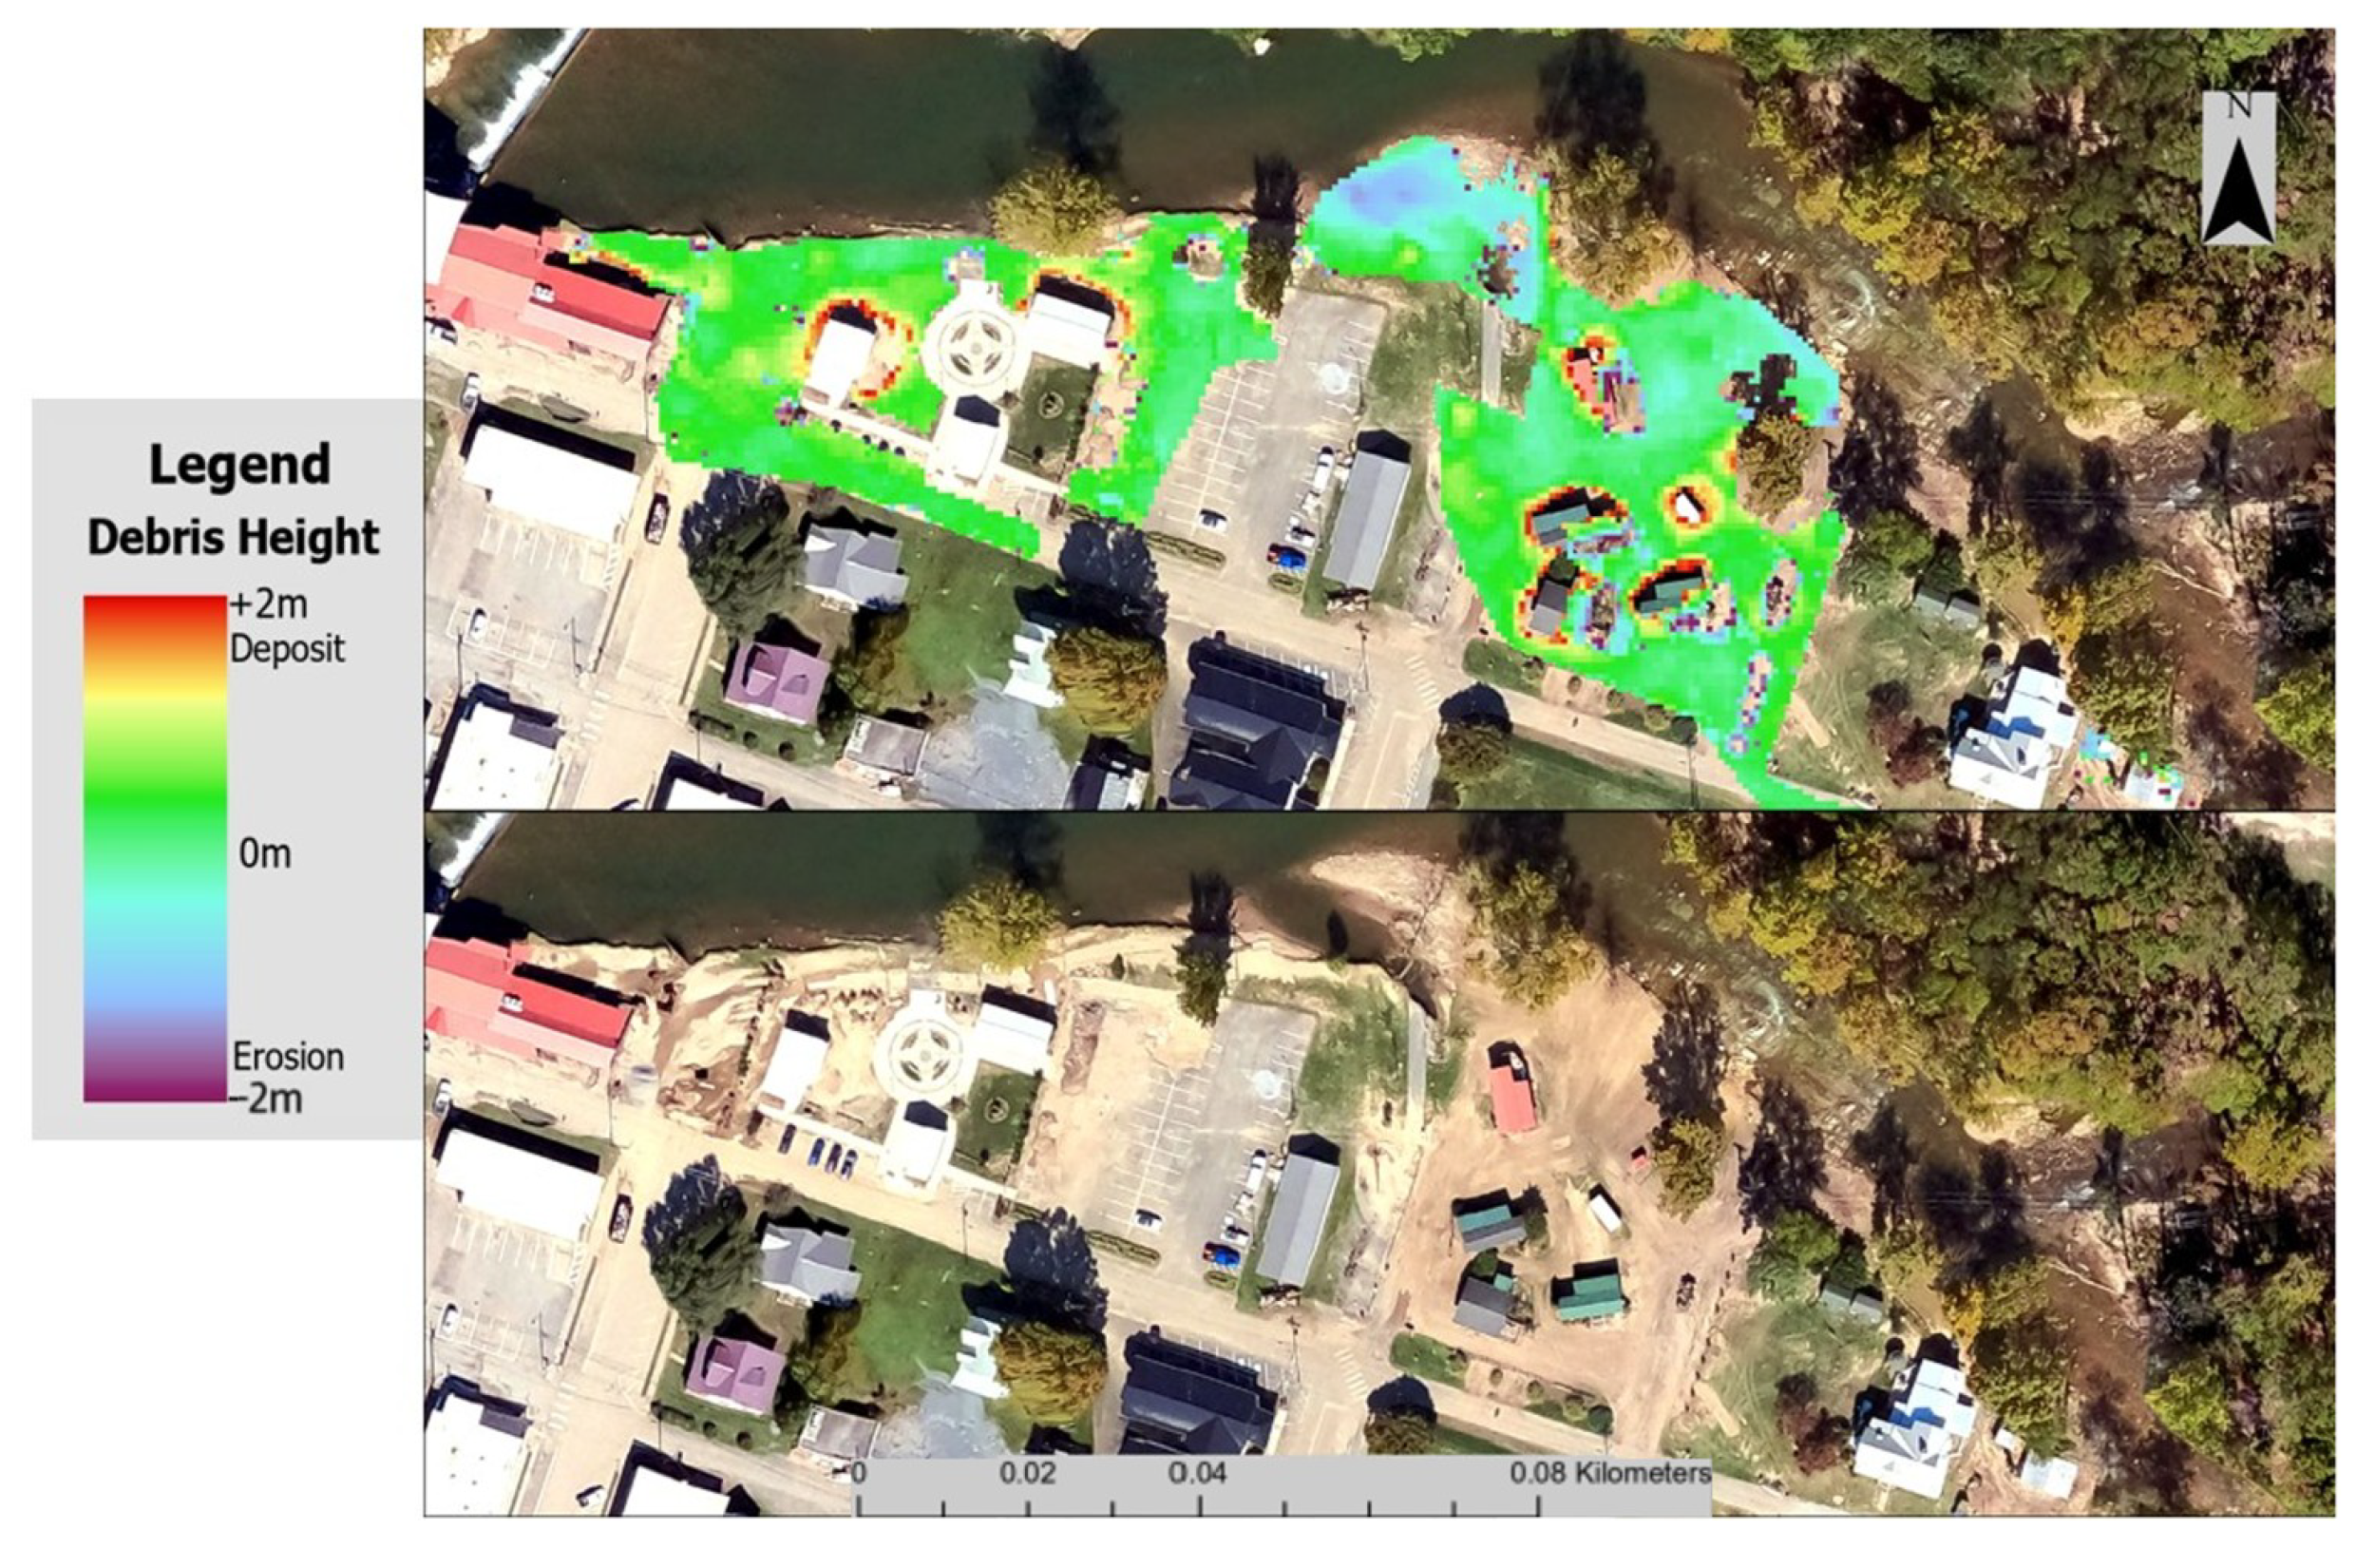
The proposed method of comparing pre-flood LiDAR and post-flood ODM DEMs allows the estimation of debris deposition and erosion on land and around streams. This process takes nearly 5–6 h on a machine with 12 GB RAM and i5, 10th-gen processor for a 2 square km area.
Figure 21 shows the debris map of a section in Damascus. The calculations estimate the debris of 10,950 cubic meters in the town. The height of debris observed is in the range of 0.16–0.61 m, with high standard deviation values. It suggests that our data is not ideal for such fine-scale calculation. Moreover, we do not have any ground truth to validate our data.
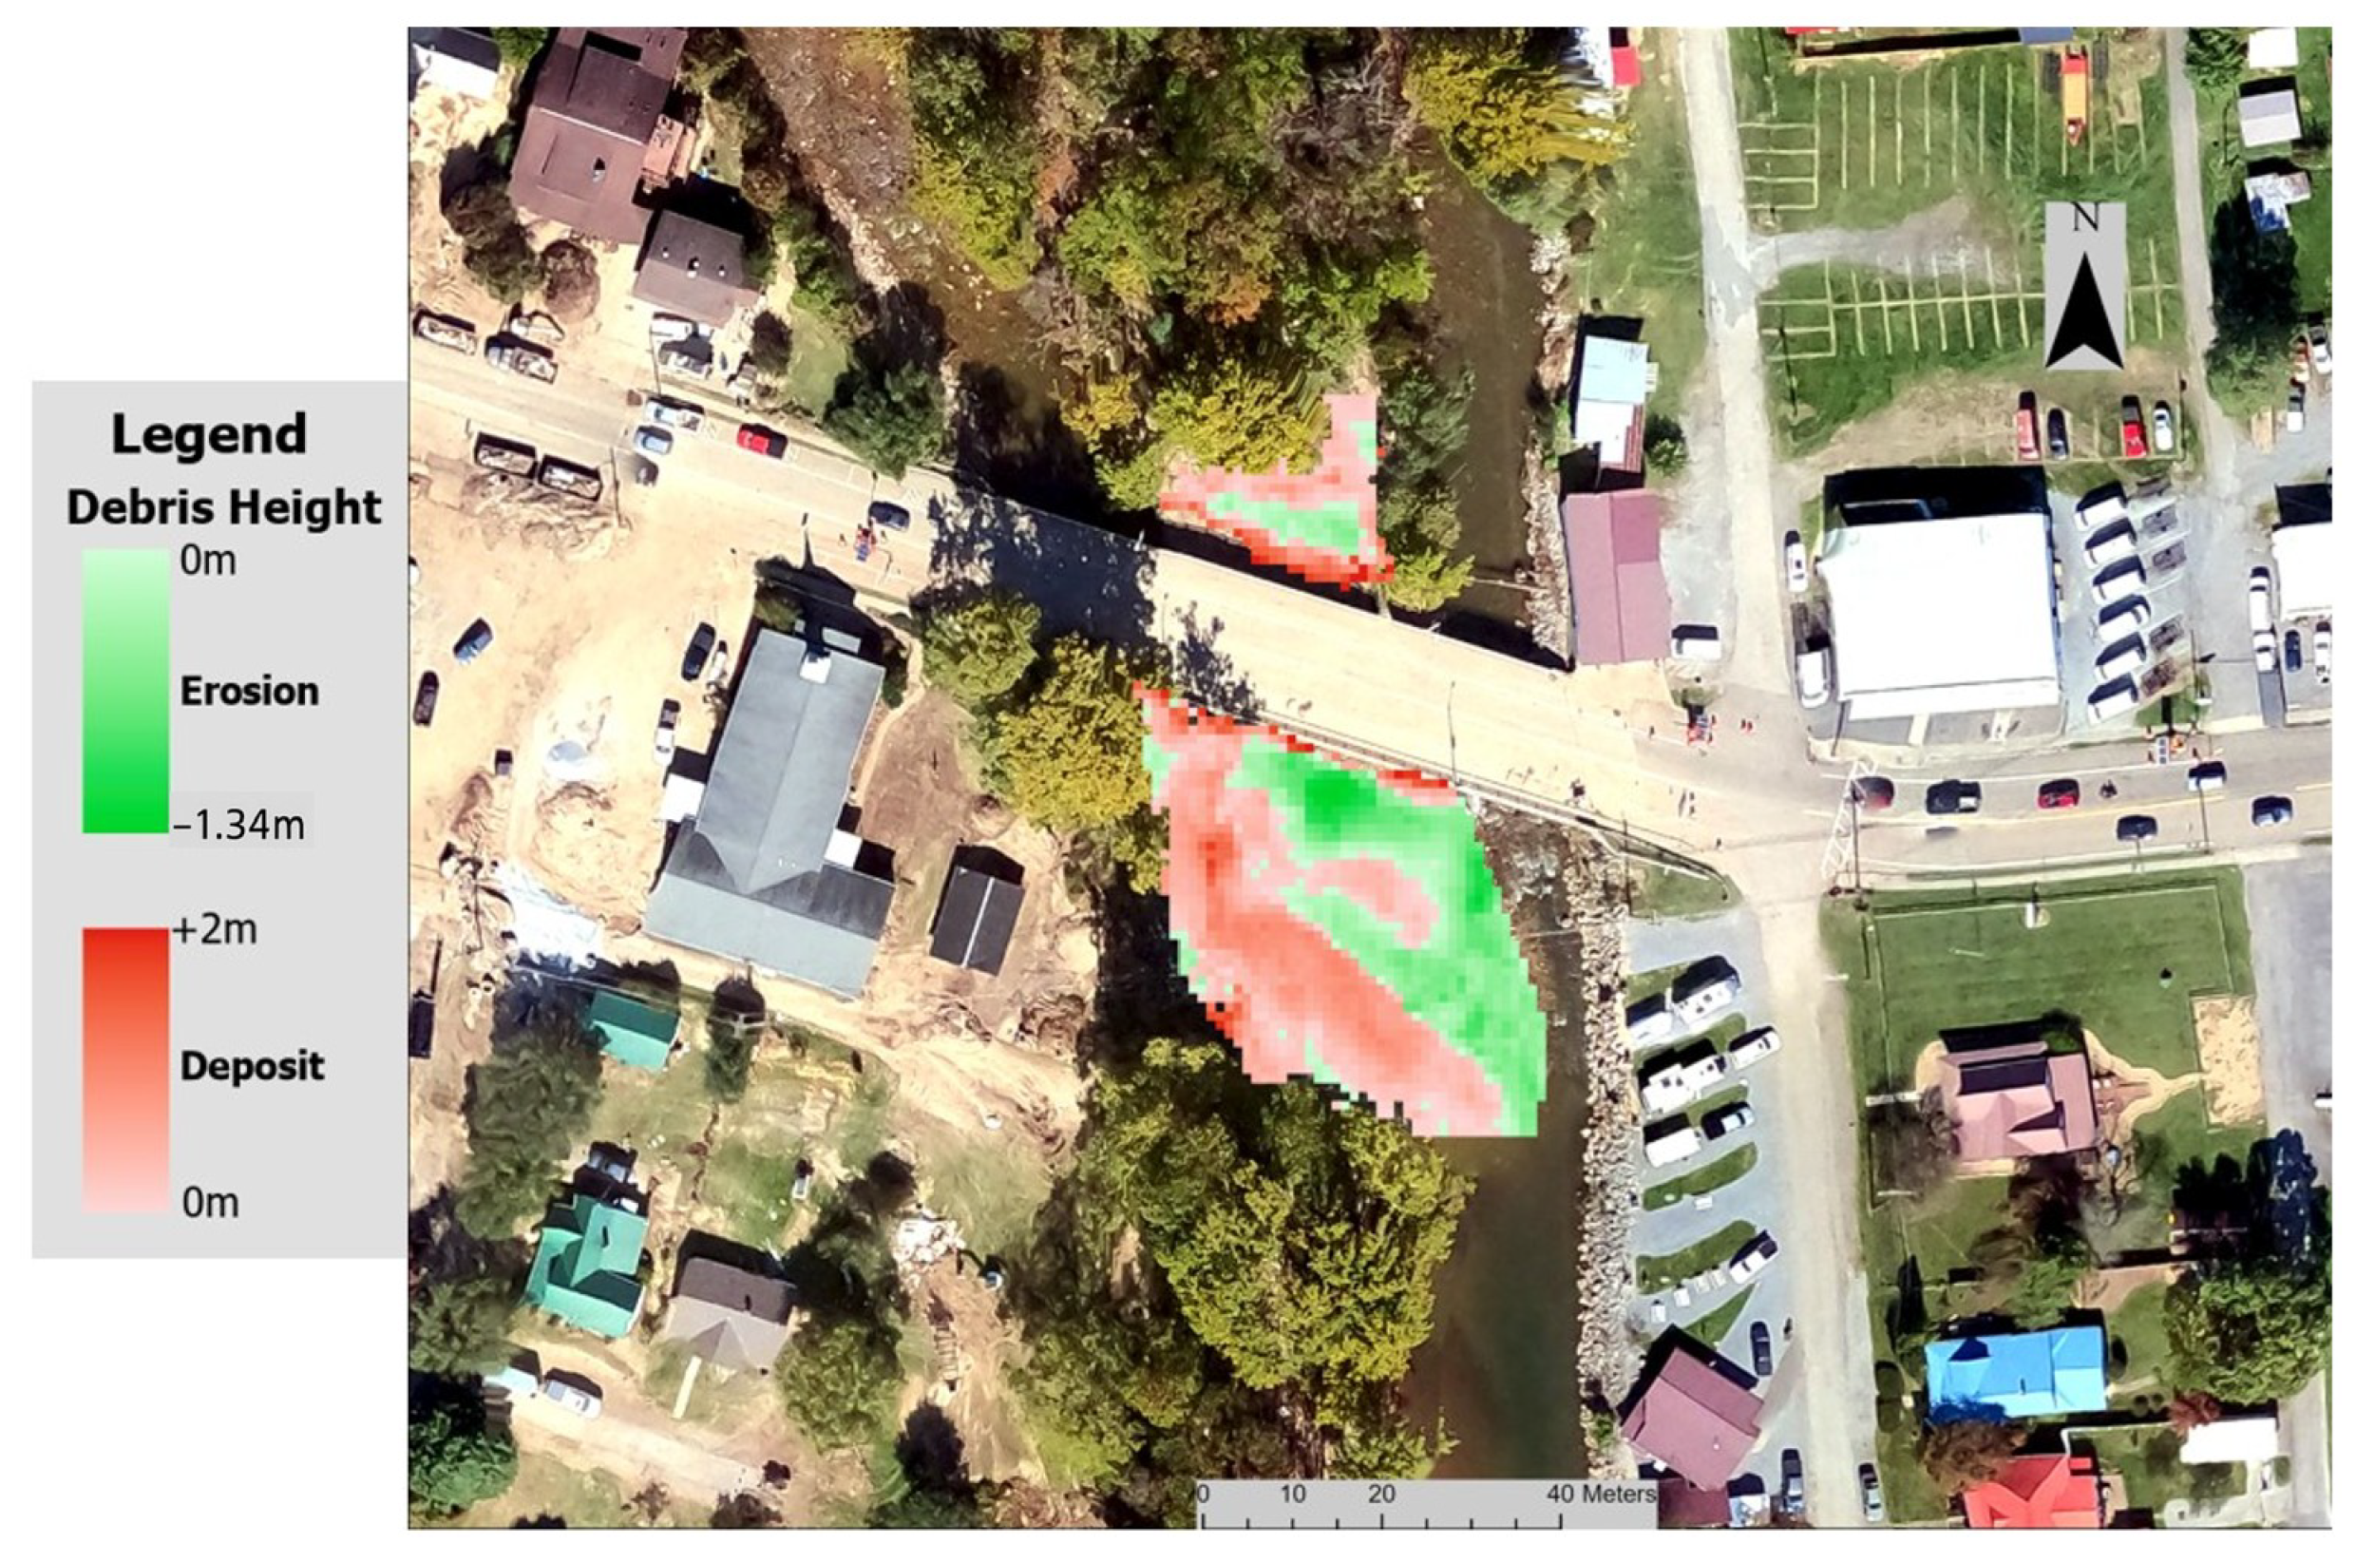
For debris estimation around streams, we separate the difference raster into two distinct rasters for better visualization and perform volume calculations for erosion and deposition areas separately. The raster is classified as “eroded” if the height difference is negative, and as “deposits” if the height difference is positive.
In
Figure 22, we can observe the section around the stream with erosion, represented by a green color scale, and deposits represented by a red color scale. The calculated erosion volume is 327 cubic meters, and the volume of debris deposited is 533 cubic meters.
This highlights two different methods for estimating the volume of debris after a flooding event, depending on our data type and its quality. The median approach, as mentioned in
Section 2.5.1, can be used when data has a large number of outliers, while the direct volume calculation approach, mentioned in
Section 2.5.2, can be used in data without significant errors and outliers.
This method has certain sources of error, as in the median approach, it is assumed that all the pixels within a debris area share a constant height, which is the median height of a specific section. While this approach effectively removes extreme outliers, it may also generalize the actual data, potentially oversimplifying the variations. Additionally, this method is unable to account for the hidden debris located beneath the tree canopies.
Achieving high-precision volume estimates requires precisely georeferenced pre- and post-disaster images. In our case, accurately georeferenced LiDAR data would be the ideal choice for debris estimation. However, in the absence of such data, calculating differences at this fine scale remains a significant challenge.
3.3. Flood Modeling in Damascus
Flood water depth in Damascus is estimated by performing simulations in HEC-RAS. The simulation takes approximately one hour on 32 GB of RAM and an i7 12th-gen processor for an area of six square km; however, configuring the simulation and collecting the data takes nearly one to two days.
Figure 23 shows the maximum water depth results for the flood event in Damascus. The color scale for the water depth is shown on the right of the image, with the maximum depth set to five meters.
The water depth values determined by the calibrated HEC-RAS simulation are compared to the water depth values measured by the VDEQ.
Table 5 shows a comparison of the results at the ten measurement locations highlighted in
Figure 23.
Overall, the simulated water depth values are very accurate for this test area in Damascus. The major outlier is in the middle of the town at location five. The simulation result at this location is almost double the measured value that is provided to us. All but two of the measurement locations have an error of less than six percent, with multiple locations having errors of less than one percent. While a few locations result in a noticeable error, the water depth simulation appears to provide a very accurate representation of the flood event for the town of Damascus. The end-to-end flood height process error that includes the ground-truth measurements and modeling errors is 8%.
This level of accuracy of water depths further solidifies the use of the aforementioned Manning’s coefficients from Whitehurst’s dissertation for analyzing the flooding events in the Appalachian region. The simulated water depth can then be used to assess the flood impact on the buildings and further classify the damage as discussed in
Section 1.
The validated water depth outputs are then used in the damage analysis using the methodology discussed in
Section 2.5.4. For our sample data, the analyzed building types include RES1 (1 floor), RES1 (2 floors), and COM1, where RES and COM represent residential and commercial buildings, respectively. These categories are represented in
Figure 19 by the colors red, orange, and blue, respectively. The specific positions in the legend correspond to their assigned classifications.
Table 6 summarizes all the information used for these estimations and calculations of the final valuation loss.
In
Table 6, we show the range of valuation loss by applying the mean and standard deviation in % error to the flood depth. Using the range of flood water depth, the corresponding damage ratio can be identified from the graph in
Figure 19. The damage ratio values beyond the least count of the graph are calculated from the slope of a small segment of the curve on which the required depth is present. It can be observed that the minimum and maximum values of the percent damage ratio and valuation loss do not differ by more than 31%.
4. Conclusions
This study developed a rapid, effective, and replicable methodology combining computer vision techniques, flood modeling, and GIS tools to estimate debris in lakes, land, and streams following a hurricane. By leveraging aerial imagery and advanced techniques, our approach provides actionable insights within the critical 72 h window after a disaster, facilitating informed decision-making by authorities.
For debris estimation in lakes, the integration of hybrid segmentation methods yielded results that can be converted to volume estimates closely aligned with the debris volumes reported by the DEQ. This method also provided more precise initial estimates compared to those provided by the USACE, demonstrating the utility of the hybrid approach in enhancing accuracy.
On land and near streams, utilizing DEMs generated from ODM provided critical insights into debris height and distribution. In particular, the integration of HEC-RAS flood modeling allowed us to refine the estimation process for building debris in Damascus. By incorporating FEMA’s Hazus analysis-based tool and floodwater depth, our analysis provided a quick way to analyze building valuation loss. This refinement ensures that resource allocation is efficient.
Our approach can be easily replicated by anyone with training in GIS tools and HEC-RAS. For edge detection and color thresholding, users can use our code directly and change the edge thickness and color threshold range based on their debris characteristics. Additionally, segmentation in Roboflow requires no expertise, as the smart polygon tool segments the area with a single click.
The proposed methodologies represent a significant advancement in post-disaster debris assessment. They offer a quick and reliable way to quantify debris across multiple environments, significantly reducing the time and resources required for manual assessments. Furthermore, these techniques can be seamlessly integrated into disaster management workflows, enabling authorities to prioritize cleanup efforts, minimize environmental and economic impacts, and streamline recovery operations.

