Article

Effects of Atmospheric Tide Loading on GPS Coordinate Time Series

1
GNSS Research Center, Wuhan University, 129 Luoyu Road, Wuhan 430079, China
2
Hubei Luojia Laboratory, Wuhan University, 129 Luoyu Road, Wuhan 430079, China
*
Author to whom correspondence should be addressed.
Remote Sens. 2025, 17(18), 3147; https://doi.org/10.3390/rs17183147
Submission received: 14 August 2025 / Revised: 8 September 2025 / Accepted: 9 September 2025 / Published: 10 September 2025

Abstract

Loading of the Earth’s crust due to variations in global atmospheric pressure can displace the position of geodetic stations. However, the station displacements induced by the diurnal and semidiurnal atmospheric tides (S1-S2) are often neglected during Global Positioning System (GPS) processing. We first studied the magnitudes of S1-S2 deformation in the Earth’s center of mass (CM) frame and compared the global S1-S2 grid models provided by the Global Geophysical Fluid Center (GGFC) and the Vienna Mapping Function (VMF) data server. The magnitude of S1-S2 tidal displacement can reach 1.5 mm in the Up component at low latitudes, approximately three times that of the horizontal components. The most significant difference between the GGFC and VMF grid models lies in the phase of S2 in the horizontal components, with phase discrepancies of up to 180° observed at some stations. To investigate the effects of S1-S2 corrections on GPS coordinates, we then processed GPS data from 108 International GNSS Service (IGS) stations using the precise point positioning (PPP) method in two processing strategies, with and without the S1-S2 correction. We observed that the effects of S1-S2 on daily GPS coordinates are generally at the sub-millimeter level, with maximum root mean square (RMS) coordinate differences of 0.18, 0.08, and 0.51 mm in the East, North, and Up components, respectively. We confirmed that part of the GPS draconitic periodic signals was induced by unmodeled S1-S2 loading deformation, with the amplitudes of the first two draconitic harmonics induced by atmospheric tide loading reaching 0.2 mm in the Up component. Moreover, we recommend using the GGFC grid model for S1-S2 corrections in GPS data processing, as it reduced the weighted RMS of coordinate residuals for 45.37%, 46.30%, and 53.70% of stations in the East, North, and Up components, respectively, compared with 39.81%, 44.44%, and 50.00% for the VMF grid model. The effects of S1-S2 on linear velocities are very limited and remain within the Global Geodetic Observing System (GGOS) requirements for the future terrestrial reference frame at millimeter level.

1. Introduction

As a globally available and continuously operating technique, the Global Positioning System (GPS) has been widely applied in studies of crustal deformation, earthquake monitoring, coastal sea-level change, and atmospheric science [1]. More importantly, it is essential to the establishment of the terrestrial reference frame [2], which is the fundamental geodetic infrastructure for Earth science. The reliability of these applications critically depends on the stability and precision of GPS station coordinates, which must be carefully monitored and corrected for both instrumental and environmental effects. Despite improvements in hardware and data processing strategies, GPS station coordinates still exhibit complex nonlinear variations [3,4].
These nonlinear variations arise from unmodeled or mismodeled technique-related errors and from geophysical processes within the Earth system [5]. Among the latter, surface loading effects are recognized as a dominant source [6]. As the Earth is not perfectly rigid, temporal and spatial variations in environmental loads redistribute mass and induce elastic crustal deformations, causing station displacements of several millimeters to centimeters [7]. If inadequately modeled, such loading effects introduce noise into GPS time series and degrade the accuracy of derived geodetic products.
A prominent example is the loading induced by atmospheric tides. Atmospheric solar heating generates regular surface pressure oscillations with periods corresponding to integer divisions of a solar day, particularly at the diurnal and semidiurnal frequencies. These atmospheric tides can induce periodic loading deformation on the surface of the Earth [8]. Such deformation has been detected in GPS time series and Very Long Baseline Interferometry (VLBI) analyses [9,10,11]. Petrov and Boy [12] suggest that diurnal and semidiurnal atmospheric tide loading (hereafter, S1-S2) can cause surface displacements of VLBI stations up to around 1.3 and 1.6 mm, respectively. For the equatorial GPS stations, the weighted Root Mean Square (WRMS) in the Up component is decreased after applying the S1-S2 correction, while the WRMS exhibits an increase for the stations at higher latitudes [13].
The unmodeled S1-S2 signals can propagate into longer periodic signals due to the standard 24 h processing sessions, which could be misinterpreted as real geophysical signals [14,15,16]. Tregoning and Watson [17] found that the anomalous aliased signal derived by S1-S2 also falls at harmonics of draconitic periods. Additionally, being close to the GPS satellites orbit period, the unmodeled S2 tidal effect could also alias into GPS orbit parameters. Therefore, correction for S1-S2 is essential to mitigate the aliasing effects. The loading effects induced by S1-S2 tides have been modeled in the International Earth Rotation and Reference Systems Service (IERS) Conventions 2010. However, the International GNSS Service (IGS) repro3 campaign did not suggest S1-S2 correction [18]. Only two IGS analysis centers (GFZ and GRG) applied S1-S2 correction to station coordinates [19]. Previous studies analyzing the impact of S1-S2 corrections on GPS data processing relied on outdated data from 1999 to 2003, which had limitations due to the lower accuracy of IGS orbital and modeling products at that time. This limitation motivates us to revisit the effect of S1-S2 corrections in the context of GPS positioning accuracy and updated IGS products. In addition, to our knowledge, no prior study has systematically investigated the impact of S1-S2 models from different institutions on GPS data processing.
In this study, Section 2 reviews the magnitude of surface deformation induced by S1-S2, followed by a comparison of two global grid models: one from the Global Geophysical Fluid Center (GGFC) and the other from the Vienna Mapping Function (VMF) data server. Subsequently, the GPS data from 108 IGS stations are processed with and without tidal loading corrections in the Earth’s center of mass (CM) frame. The CM refers to the geocenter of the mass of the entire Earth system (solid Earth, oceans, and atmosphere), whereas the center of mass of the solid Earth (CE) represents the geocenter of the solid Earth only, excluding surface and fluid loads. Section 3 evaluates the effect of S1-S2 on daily GPS coordinates and long-term station velocities and periodic variations, as well as the WRMS reduction of GPS time series. Through this analysis, we aim to quantify the significance of S1-S2 loading corrections, provide insights for improving precise GPS data processing, and offer recommendations for future IGS reprocessing campaigns.

2. Data Sets

2.1. S1-S2 Atmospheric Tide Loading

The global gridded model of S1-S2 atmospheric tides, which is RP03, is adopted to calculate the station displacement due to S1-S2 atmospheric pressure loading [20]. The RP03 model for S1-S2 originates from the operational reanalysis products of the European Centre for Medium-Range Weather Forecasts (ECMWFs), which deliver surface pressure fields on a global grid with a spatial resolution of 1.125° × 1.125°. Subsequently, by applying Green’s Functions to the surface pressure coefficients [21,22], the S1-S2 tidal loading displacements in the named reference frame were derived [23]. Additionally, global surface pressure can be derived from data provided by the National Centers for Environmental Prediction (NCEP). Notably, the Inverted Barometer (IB) assumption [24], the static response of the sea level to the forcing of atmospheric pressure, was not considered in the RP03 model [17].
The sine and cosine amplitudes of S1-S2 tidal deformation for both the CM and the CE frame are provided by the GGFC [25]. The three-dimensional tidal deformation at any location and any time can be described as follows:
d S i ( e , n , u ) = A S i ( e , n , u ) × cos ( ω i t ) + B S i ( e , n , u ) × sin ( ω i t )
where i = 1, 2, d S i ( e , n , u ) is the displacement induced by S i tides in the East, North, and Up components. A S i , B S i   are the cosine and sine amplitudes of the S i tidal deformation, respectively. ω i is the frequency of the S i atmospheric tides, ω 1 = 2 π radians/day and ω 2 = 4 π radians/day, and t is the universal time (UT1).
Figure 1 shows the magnitude of surface deformation due to S1-S2 in the CM frame for the 108 stations as a function of latitude. Overall, the amplitude of tidal loading in the Up component significantly exceeds that of the horizontal components, by approximately a factor of three. In the Up component, both the S1-S2 displacements are latitude-dependent. The displacement magnitude for both S1 and S2 can reach 1.5 mm in low equatorial regions, while diminishing to almost zero toward the polar areas, which is consistent with the findings of Wijaya et al. [26]. This pattern is reasonable, given that diurnal and semidiurnal atmospheric pressure variations are most pronounced near the equator. For the horizontal components, the S2 tidal loading displacements are very small and show no latitude dependence. The magnitude of S2 loading deformation is below 0.2 mm in the horizontal component. However, the situation for the S1 tide is different. For the North component, the amplitude of S1 increases with latitude, which may be due to the North–South temperature gradient in the daily heating system [27]. In the East direction, S1 loading deformation reaches approximately 0.6 mm, much larger than the S2 tide. These results highlight the dominant role of Up component displacement in S1-S2 tidal effects and reveal the distinct spatial patterns of S1 and S2 contributions in the horizontal components.
Alongside the GGFC, the VMF also provided the sine and cosine amplitudes of the S1-S2 deformation in both the CM and CE frame [28]. These amplitudes have been adopted by the Center for Orbit Determination in Europe (CODE) for GNSS data analysis [29]. The amplitudes of the S1-S2 tidal deformation were derived using surface pressure, calculated from the ECMWF pressure-level data at a horizontal resolution of 1°. The VMF solution also did not assume the IB approximation but considered that the oceanic response to sub-daily atmospheric pressure variations for tides at timescales can be ignored.
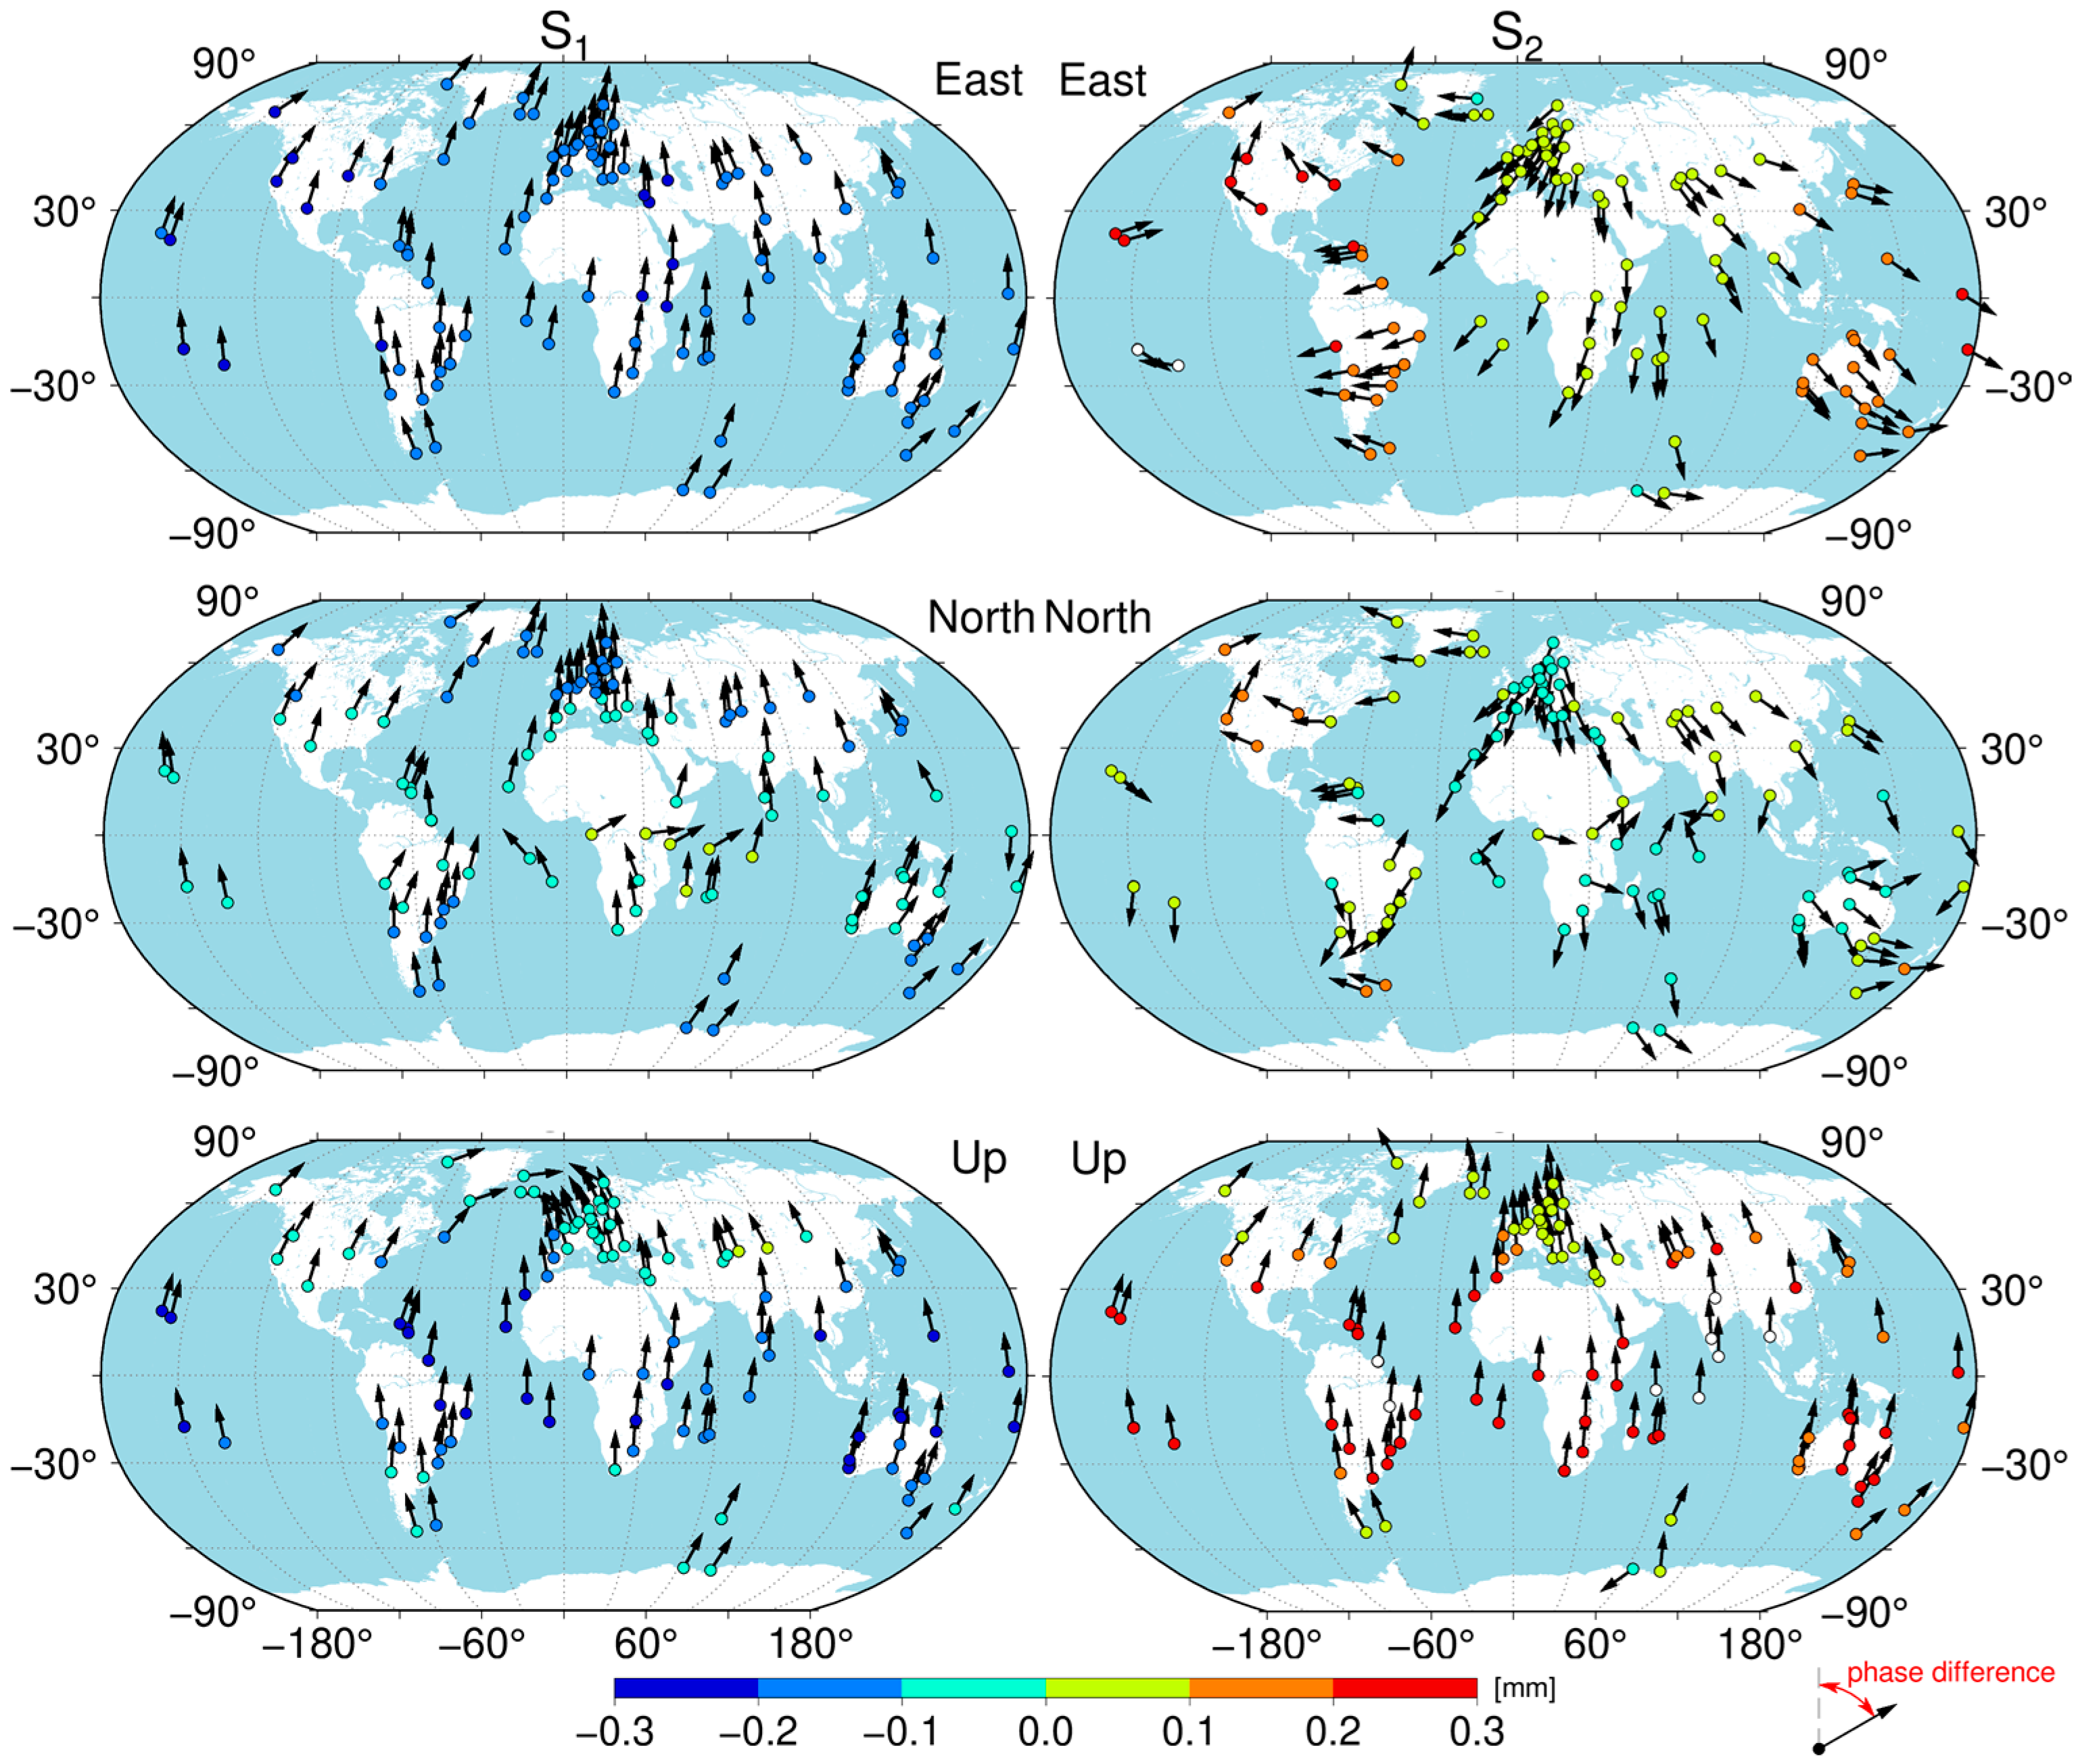
Figure 2 shows the magnitude and phase differences of station displacements in the CM frame for 108 IGS stations, as computed from the GGFC and VMF S1-S2 grid models. In general, there are no significant differences in displacement magnitudes. On average, S1 magnitudes derived from the GGFC grid model are 0.12 mm smaller than those from the VMF grid model, whereas S2 magnitudes derived from the GGFC grid model are 0.07 mm larger. Regarding phase, notable differences are observed in the horizontal components of S2. Phase differences are generally very small (less than 12.7° on average) for S1 in both the horizontal and Up components, as well as the Up component of S2. However, the horizontal components of S2 exhibit substantial phase differences of up to 180° at some stations.
Differences in the surface pressure data and land–sea masks used by the GGFC and VMF to generate the S1-S2 grid models are likely the primary cause of the phase differences observed in the horizontal components of the S2 tide. On the one hand, the GGFC computes surface pressure from NCEP data sampled every six hours and applies the interpolation method introduced by van den Dool et al. [30] to propagate S2 standing waves. This interpolation procedure filters out non-migrating tidal components, which can excessively smooth the spatial variations in both the magnitude and phase of atmospheric tides, particularly for S2 [26]. In contrast, the VMF uses pressure-level data at three-hour intervals provided by the ECMWF’s ‘Delayed Cut-off Data Analysis’ (DCDA) stream to compute surface pressure. According to Wijaya et al. [26], the use of these data can introduce potential benefits by capturing the westward-propagating waves directly, avoiding the requirement to propagate the S2 standing wave through interpolation. On the other hand, differences in the land–sea masks used to separate the elastic responses of land and ocean to atmospheric pressure forcing may also result in the observed phase differences in the S2 tide.
Note that the magnitude and phase obtained from the S1-S2 global gridded model have some uncertainty, as the RP03 model has inherent uncertainty. However, this uncertainty cannot be quantified, as the ECMWF dataset provides only surface pressure values without accuracy information [27]. Likewise, the RP03 model, derived from the operational ECMWF analysis, does not provide error information. Therefore, we cannot assess the precision of the computed S1-S2 magnitude and phase. Nevertheless, validation studies of atmospheric pressure loading models provide useful insights. For example, Petrov and Boy [12] compared their modeled time series with more than 3.5 million VLBI observations and reported that the overall error budget was within 15%. To determine which of the S1-S2 grid models provided by the GGFC or VMF is more suitable for GPS station coordinate corrections, we computed S1-S2 corrections using each model separately and evaluated their performance by comparing the repeatability of the station coordinate time series.

2.2. GPS Data Processing

The International GNSS Service (IGS) operates a global network of stations and analysis centers, delivering consistent GNSS observations and products that are fundamental for geodesy, space geophysics, and high-precision applications such as reference frame realization and climate studies. In this study, to assess the impact of S1-S2 tidal corrections on daily GPS coordinate solutions, we perform processing of the GPS raw data with the corrections incorporated at the observation level and contrast the outcomes with those derived without such corrections. Here the S1-S2 correction employed at the observation level means the displacements in the CM frame modeled in Equation (1) are removed from the carrier phase measurements. Petit and Luzum [31] state that the S1-S2 corrections for the Up component surface displacement are sufficient, whereas we considered the horizontal corrections for completeness.
Table 1 summarizes the strategy of the GPS data processing. Daily GPS observations from 108 IGS stations, spanning from 1 January 2024 to 1 December 2024, were processed using the precise point positioning (PPP) method [32]. The GPS precise point positioning ambiguity resolution (PPP-AR version 3.1.4) software developed by Geng et al. [33] is used. An ionosphere-free combination of observations was used, while the rapid orbit, clock, and bias products provided by Wuhan University (http://www.igs.gnsswhu.cn/index.php, accessed on 3 August 2025) were fixed for daily PPP processing. The Vienna Mapping Function 3 (VMF3) troposphere mapping functions were used to calculate the tropospheric delay [34]. The correction of ocean tides [35], solid Earth tides, and pole tides [31] have been implemented. The daily rapid Earth Orientation Parameters (EOPs) data are adopted in the PPP processing process. The parameters estimated in the PPP processing include station coordinates, receiver clock offsets, tropospheric delays, and ambiguity parameters. An elevation cutoff of 7° was applied, with elevation-dependent weighting used for observations below 30°. It should be noted that the terrestrial reference frame of the WHU orbit and clock products was updated from IGS14 to IGS20 on 26 November 2022. Therefore, igs14.atx was used to correct antenna phase center offsets and variations for the data before 26 November 2022, while igs20.atx [18] was applied to subsequent data.
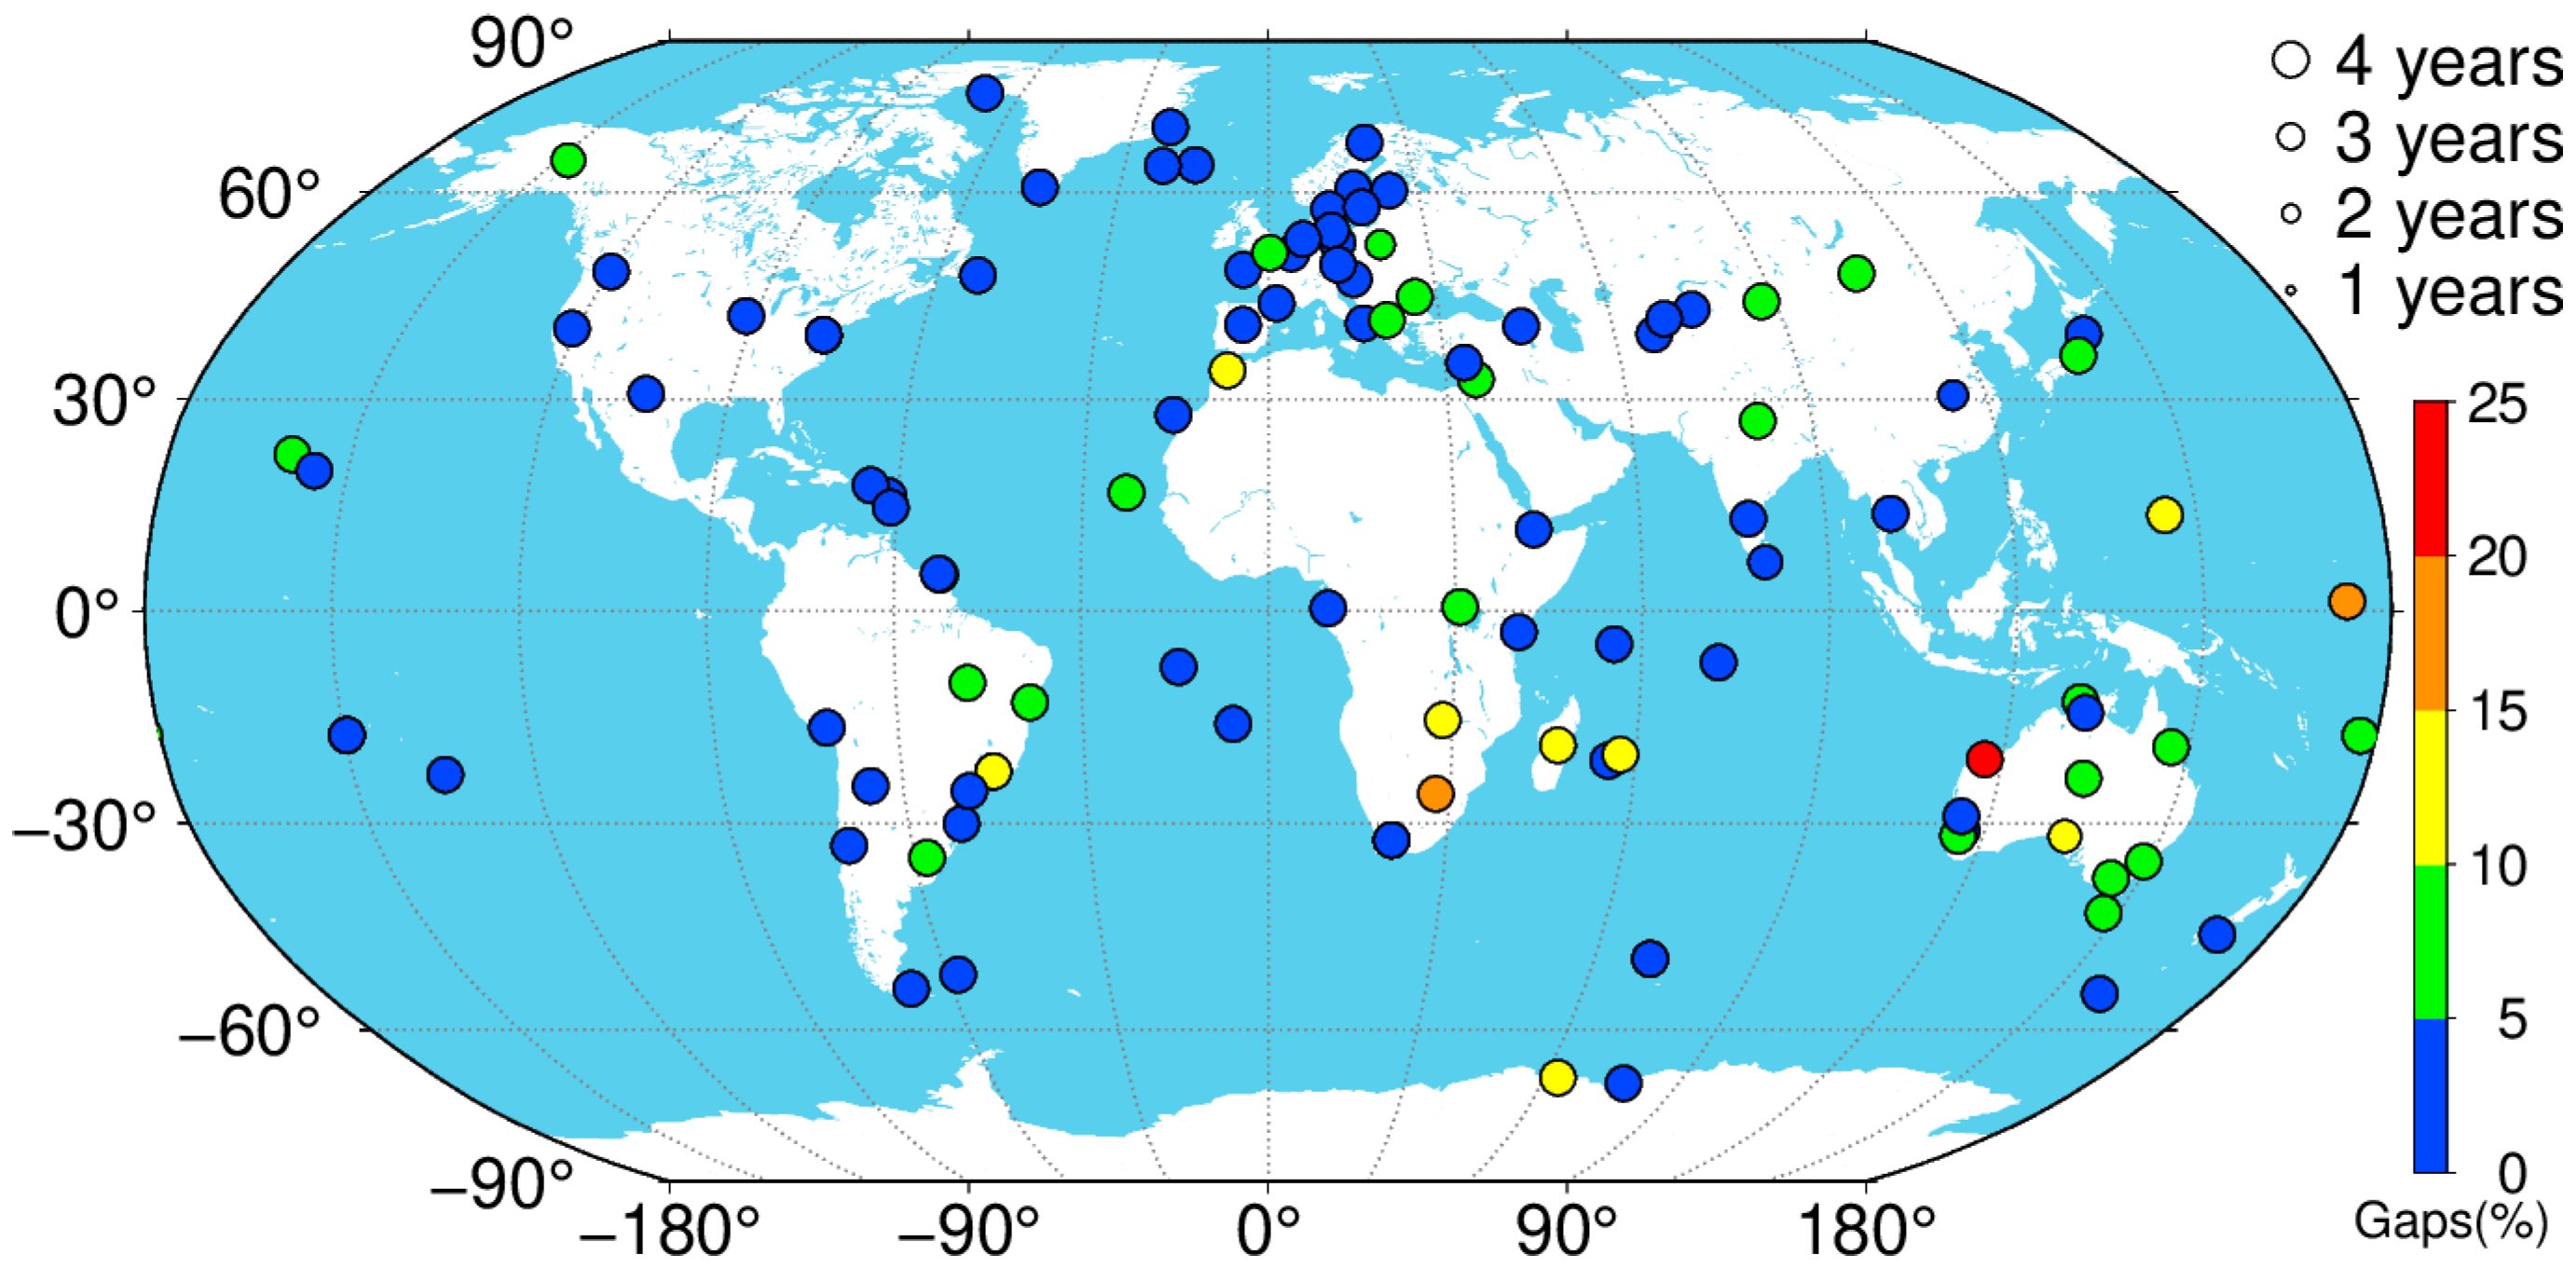
Figure 3 shows the length of the coordinate time series and the percentage of data gaps for 108 IGS stations. Almost all stations cover the whole period from 1 January 2021 to 1 December 2024, with an average series length of 3.9 years. Since S1-S2 primarily exhibit annual and semi-annual patterns [27], this span is sufficiently long to capture the seasonal characteristics they induce. Quality control during data processing ensured that the RMS of the horizontal and Up components of the daily station coordinates are 1.5 and 5.1 mm, which is consistent with the results reported by Geng et al. [33]. Potential outliers in each coordinate time series were excluded using a three-sigma criterion. Overall, the percentage of data gaps is very small, averaging only 4.1%.

3. Results and Discussion

In this section, we examine the impact of S1-S2 on daily GPS coordinates, long-term station velocities, periodical signals, and the WRMS reduction in GPS time series. For accurate estimation of linear velocity and periodical signals, the GPS coordinate time series should first be aligned with a self-consistent secular terrestrial reference frame [36].

3.1. Station Coordinates Differences

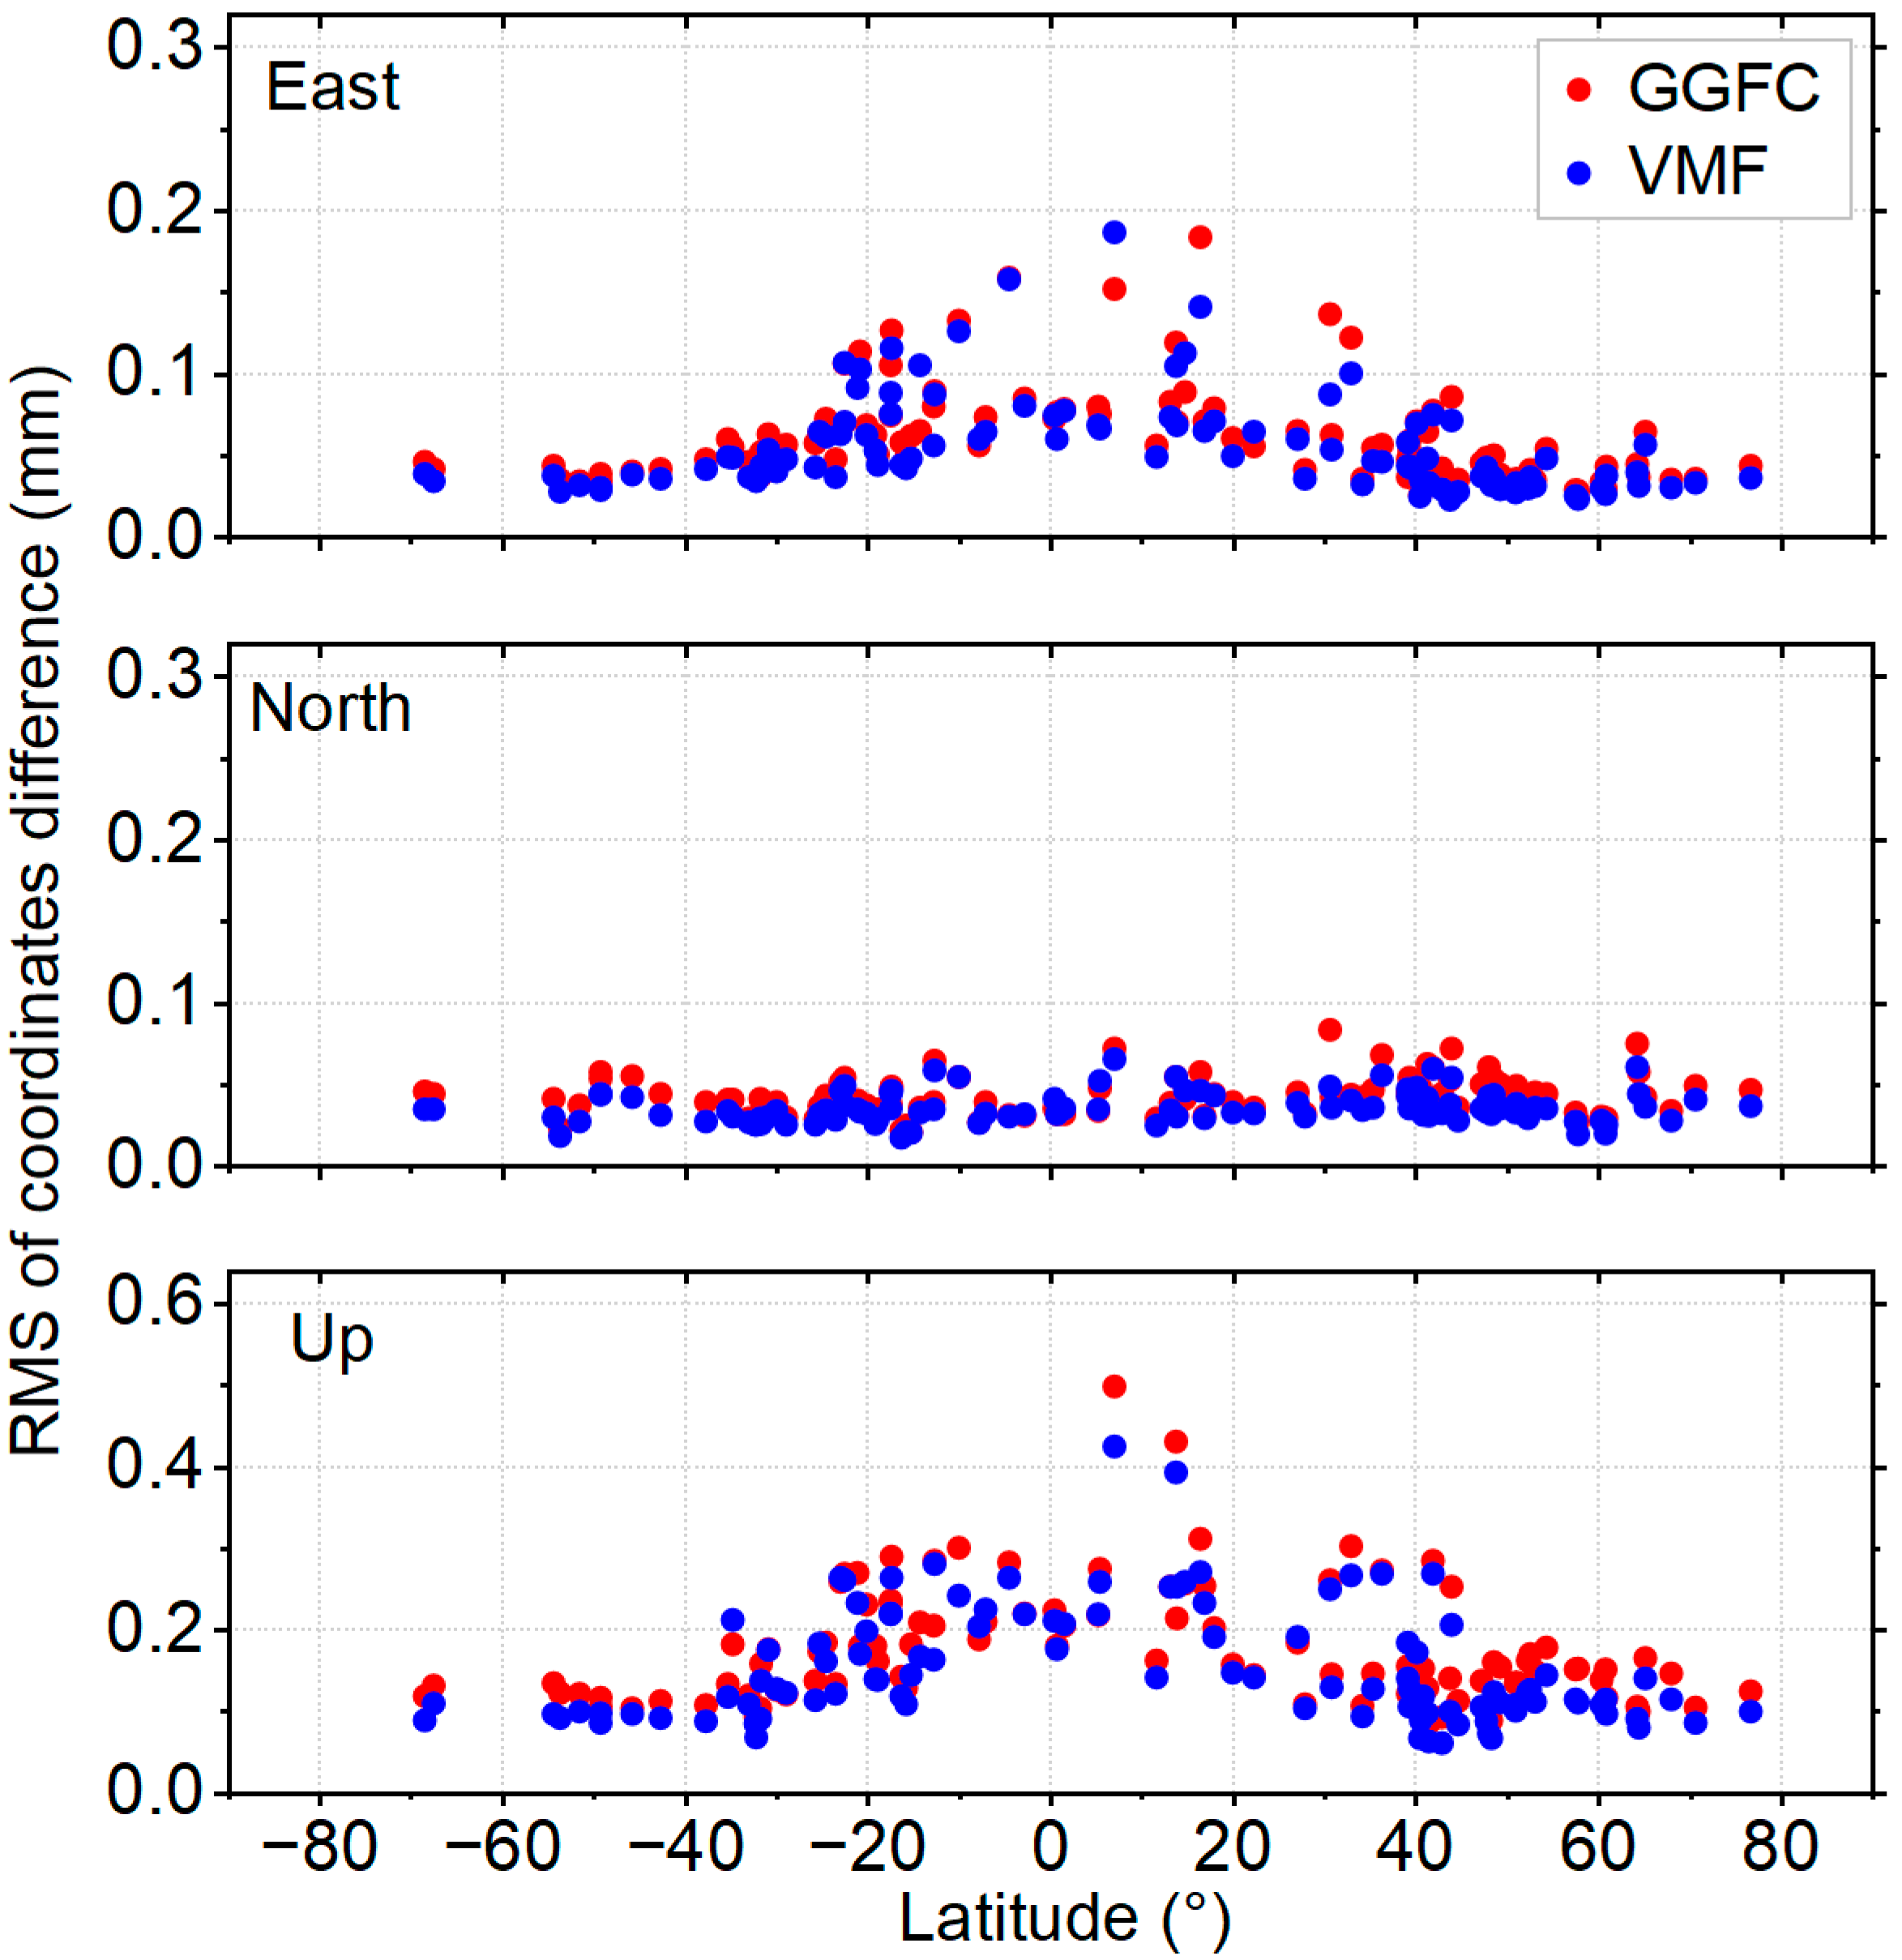
Figure 4 illustrates the RMS of GPS coordinate displacements induced by S1-S2 loading for each station as a function of latitude. The analysis reveals that S1-S2 loading can cause sub-millimeter variations in daily GPS coordinates, and the variations provided by the GGFC and the VMF grid models are nearly identical. For all stations, the average RMS of coordinate displacements caused by S1-S2 reach 0.06, 0.04, and 0.18 mm, with maximum values of 0.18, 0.08, and 0.51 mm in the East, North, and Up directions, respectively. Consistent with expectations, the Up component is the most strongly affected by S1-S2 loading, and the magnitude of the induced displacements generally decreases with increasing absolute latitude. In the horizontal components, the effect of S1-S2 correction is smaller, and the RMS of S1-S2-induced displacements is less than 0.2 mm for all stations. Moreover, the RMS in the East component demonstrates a latitude-dependent pattern similar to that observed in the Up component. Moreover, the pattern in the North component is quite different, and the GPS daily displacement due to S1-S2 does not vary with station latitude.
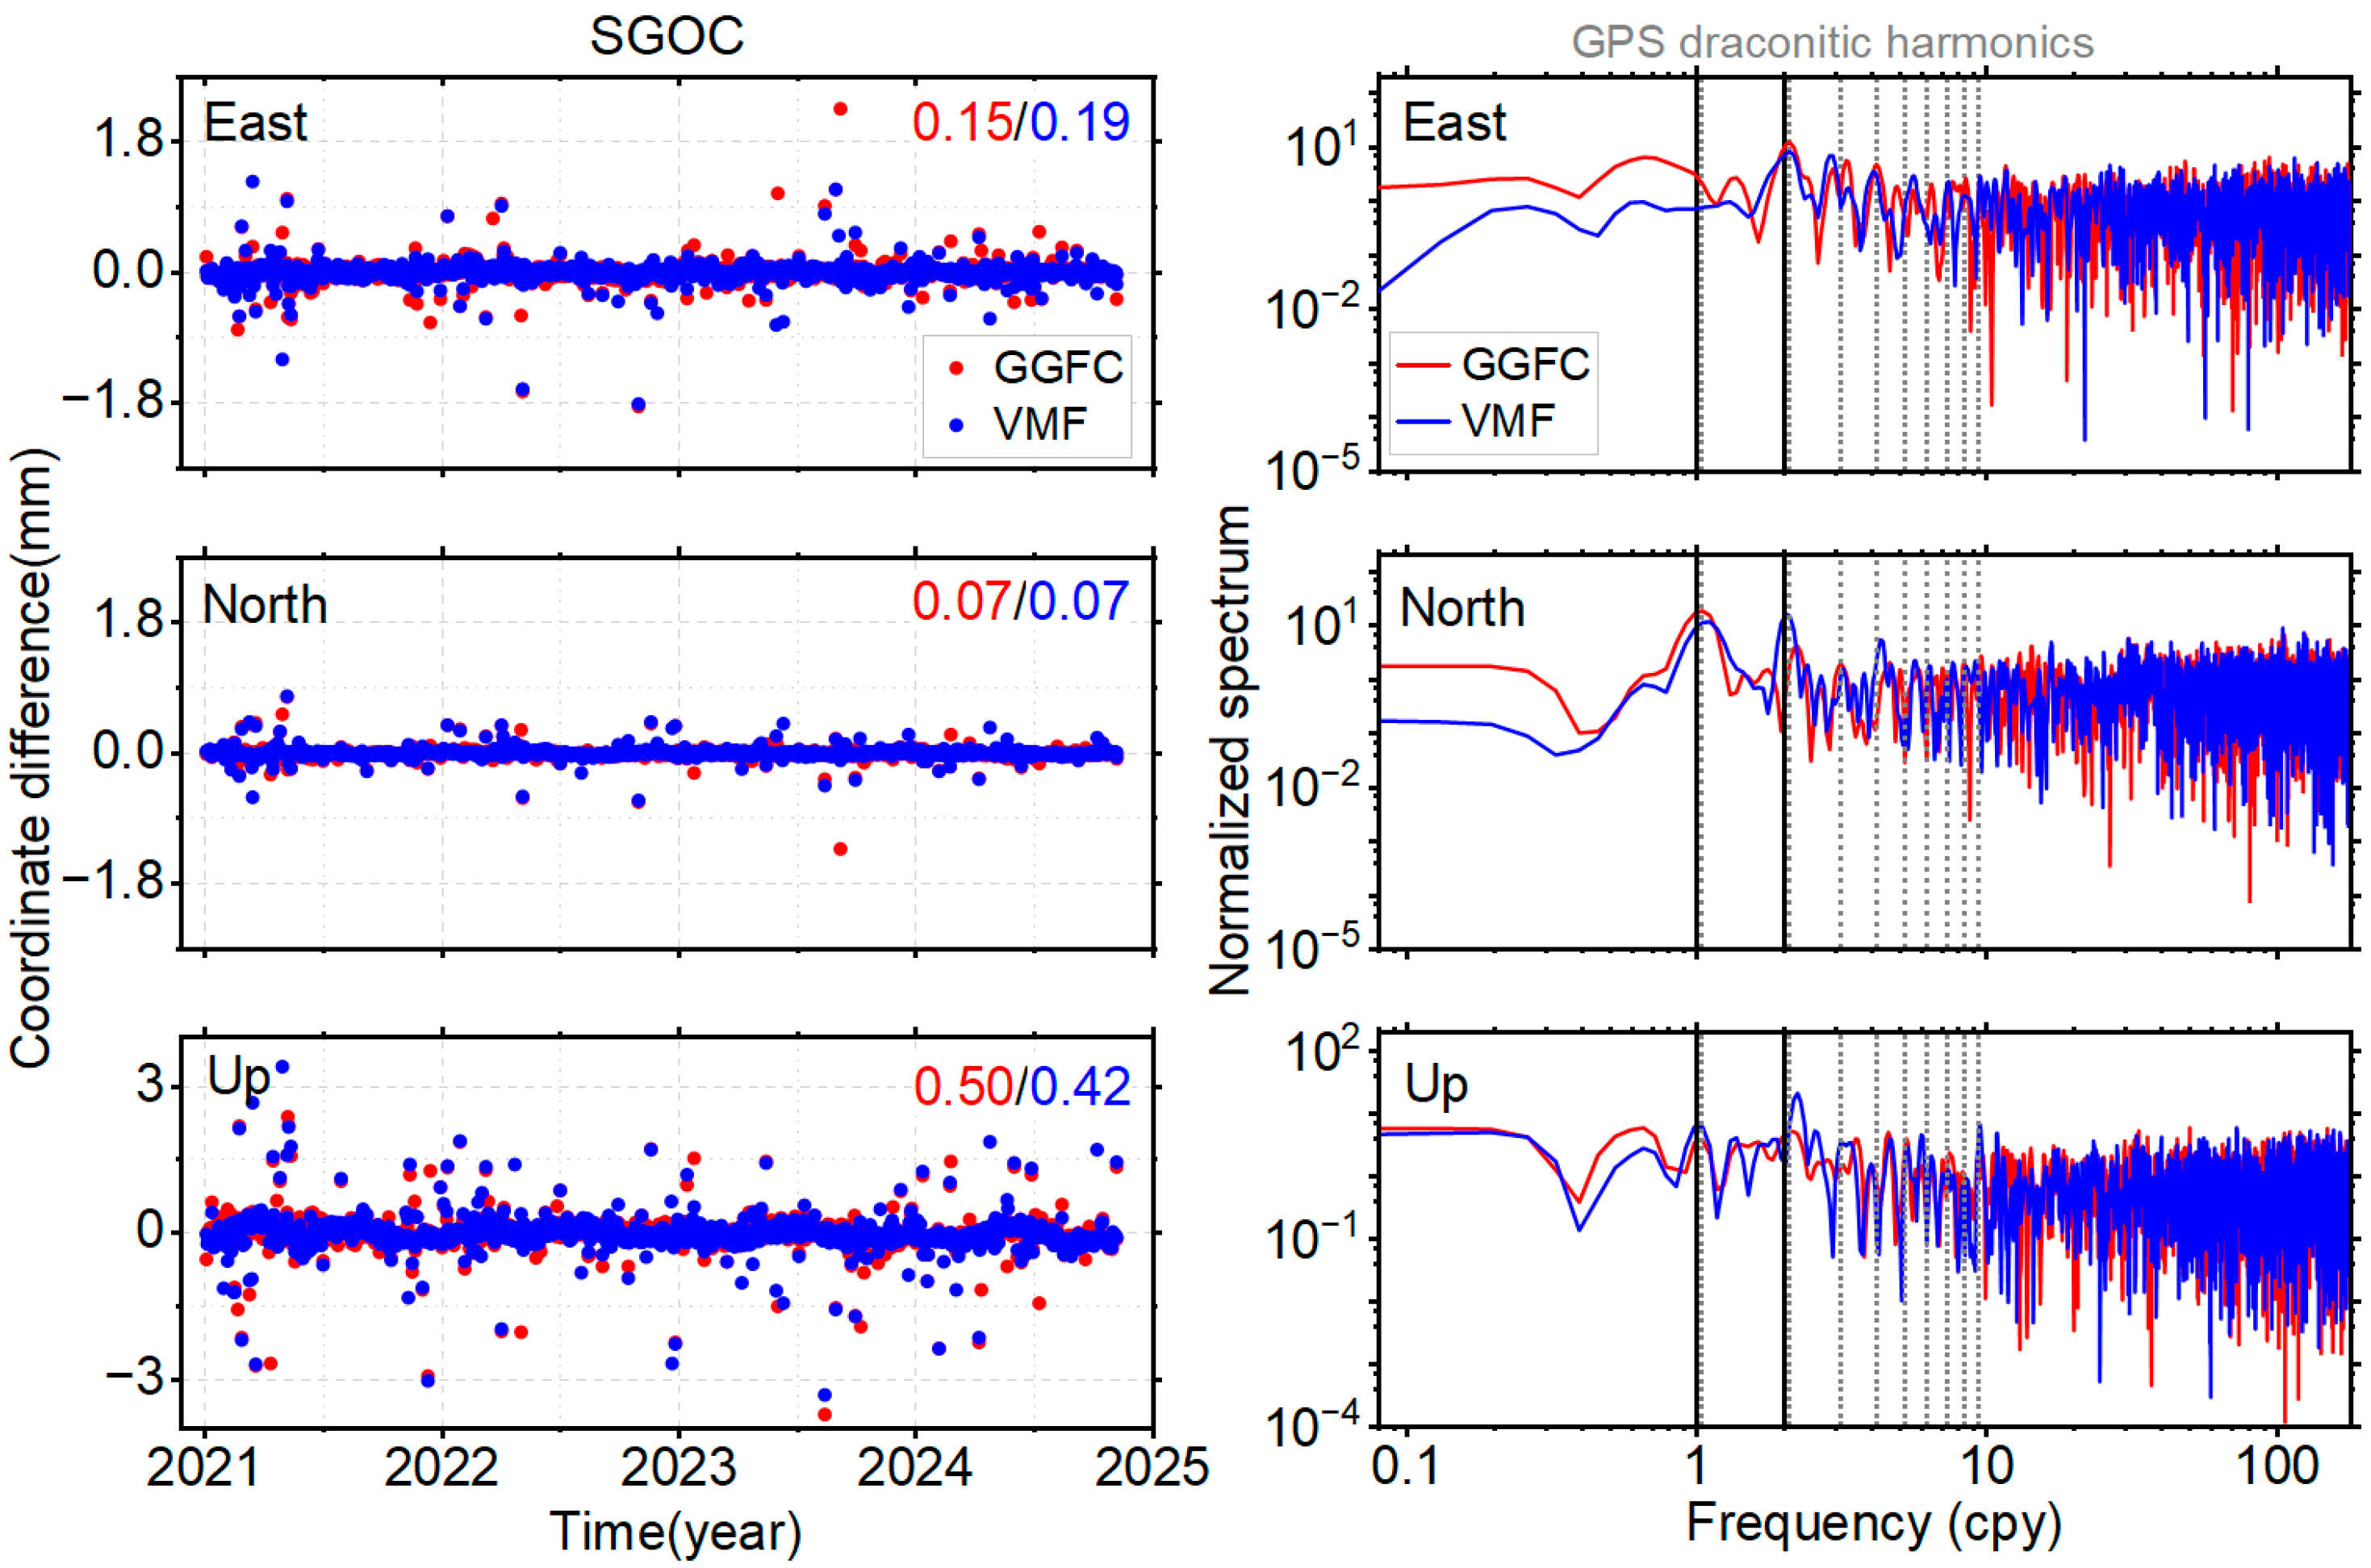
Figure 5 presents the time series and normalized spectra of GPS coordinate differences induced by the S1-S2 corrections for the low-latitude station SGOC (Colombo, Sri Lanka). As expected, the Up component shows the largest impact. The maximum coordinate differences reach 1.12 mm in the horizontal components and exceed 2.74 mm in the Up component. Although these values are larger than the typical annual amplitude of S1-S2 loading, this behavior is reasonable because S1-S2 signals can interact with other periodic variations, such as ocean and solid Earth tides. When multiple components coincide in phase or exhibit resonance, the resulting displacements can be significantly amplified [27]. The right panel of Figure 5 shows the normalized Lomb–Scargle periodogram of the coordinate differences induced by the S1-S2 corrections at station SGOC, where clear periodic variations are evident, with distinct draconitic annual and semi-annual peaks. These results demonstrate the substantial influence of S1-S2 loading on GPS station coordinates, particularly in the Up component.
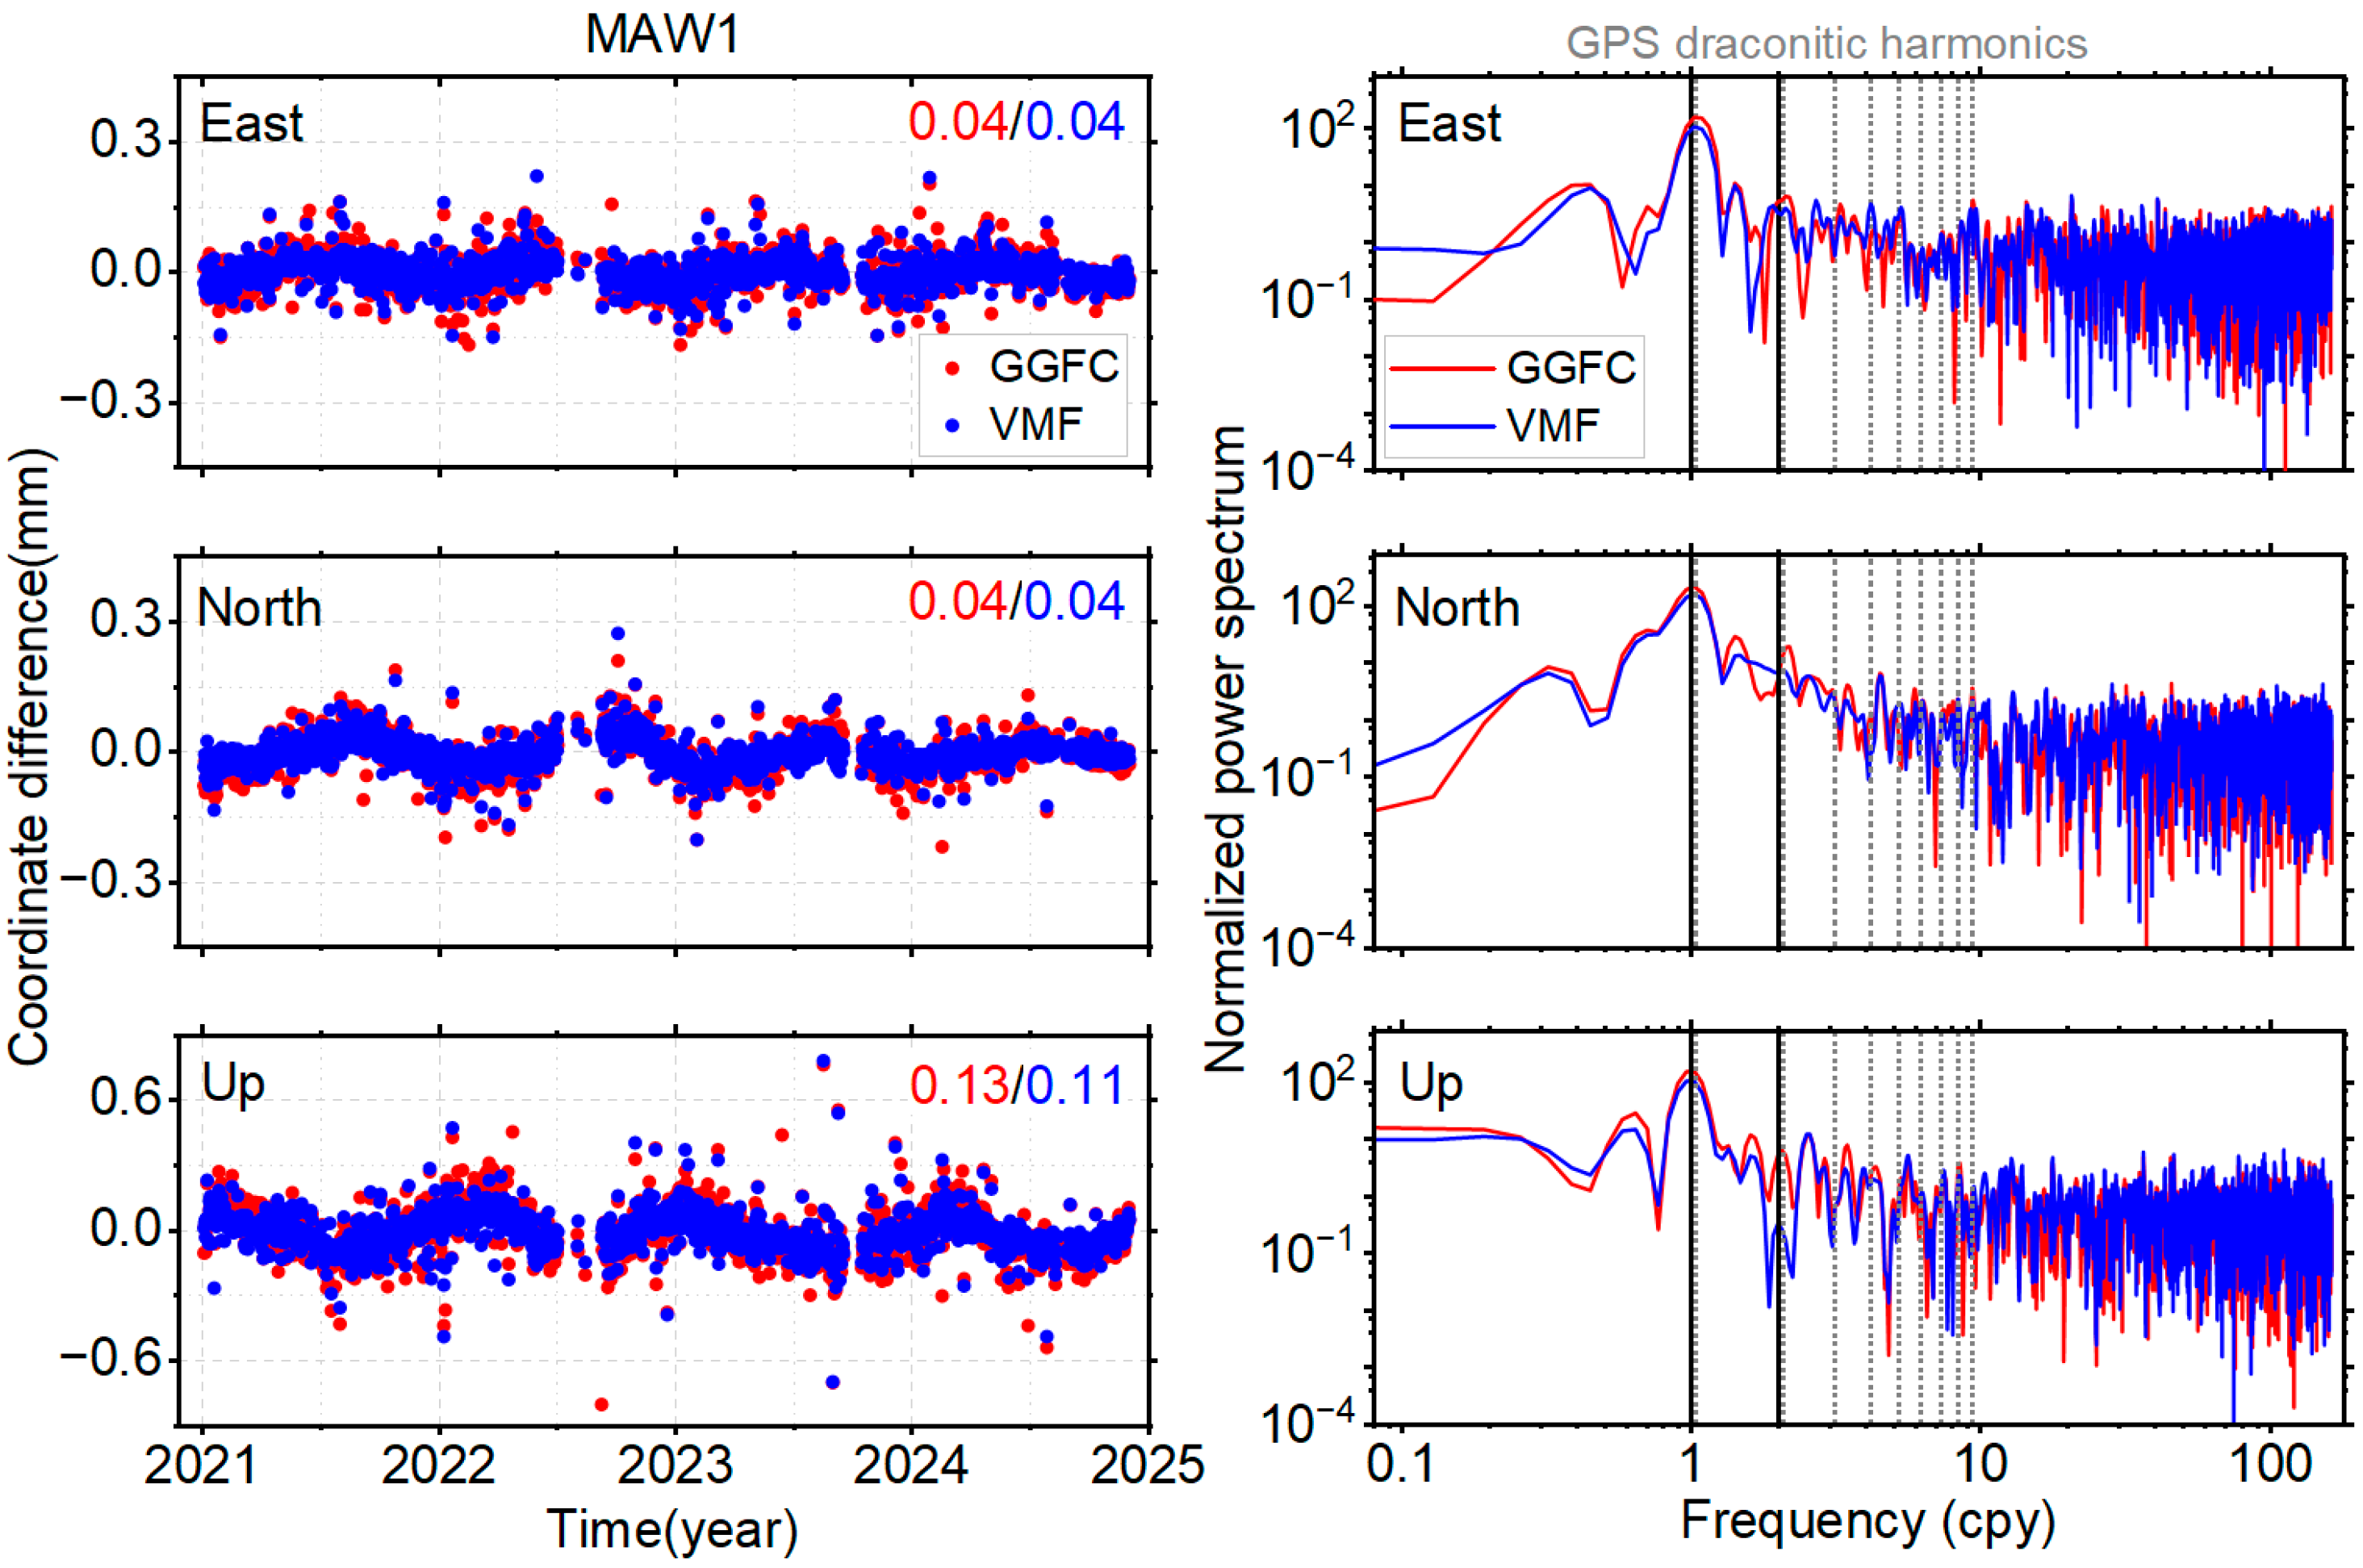
Figure 6 shows an example of daily coordinate differences induced by S1-S2 of the high-latitude station MAW1 (Mawson Station, Antarctica). Compared with low-latitude stations, the magnitude of the S1-S2-induced station coordinate variations is much smaller, with maximum amplitudes of up to 0.79 mm in the Up component and 0.28 mm in the horizontal components. Nevertheless, even relatively small atmospheric tidal effects can give rise to clear signals in GPS coordinate time series, which are manifested as prominent draconitic annual and semi-annual peaks.

3.2. Linear Velocity

In the previous section, the impact of S1-S2 on the GPS daily coordinates was confirmed. Here, we examine the effect of S1-S2 on linear velocities derived from GPS time series. This is particularly relevant because the average displacement induced by S1-S2 is generally non-zero, which may introduce small linear trends in station positions.
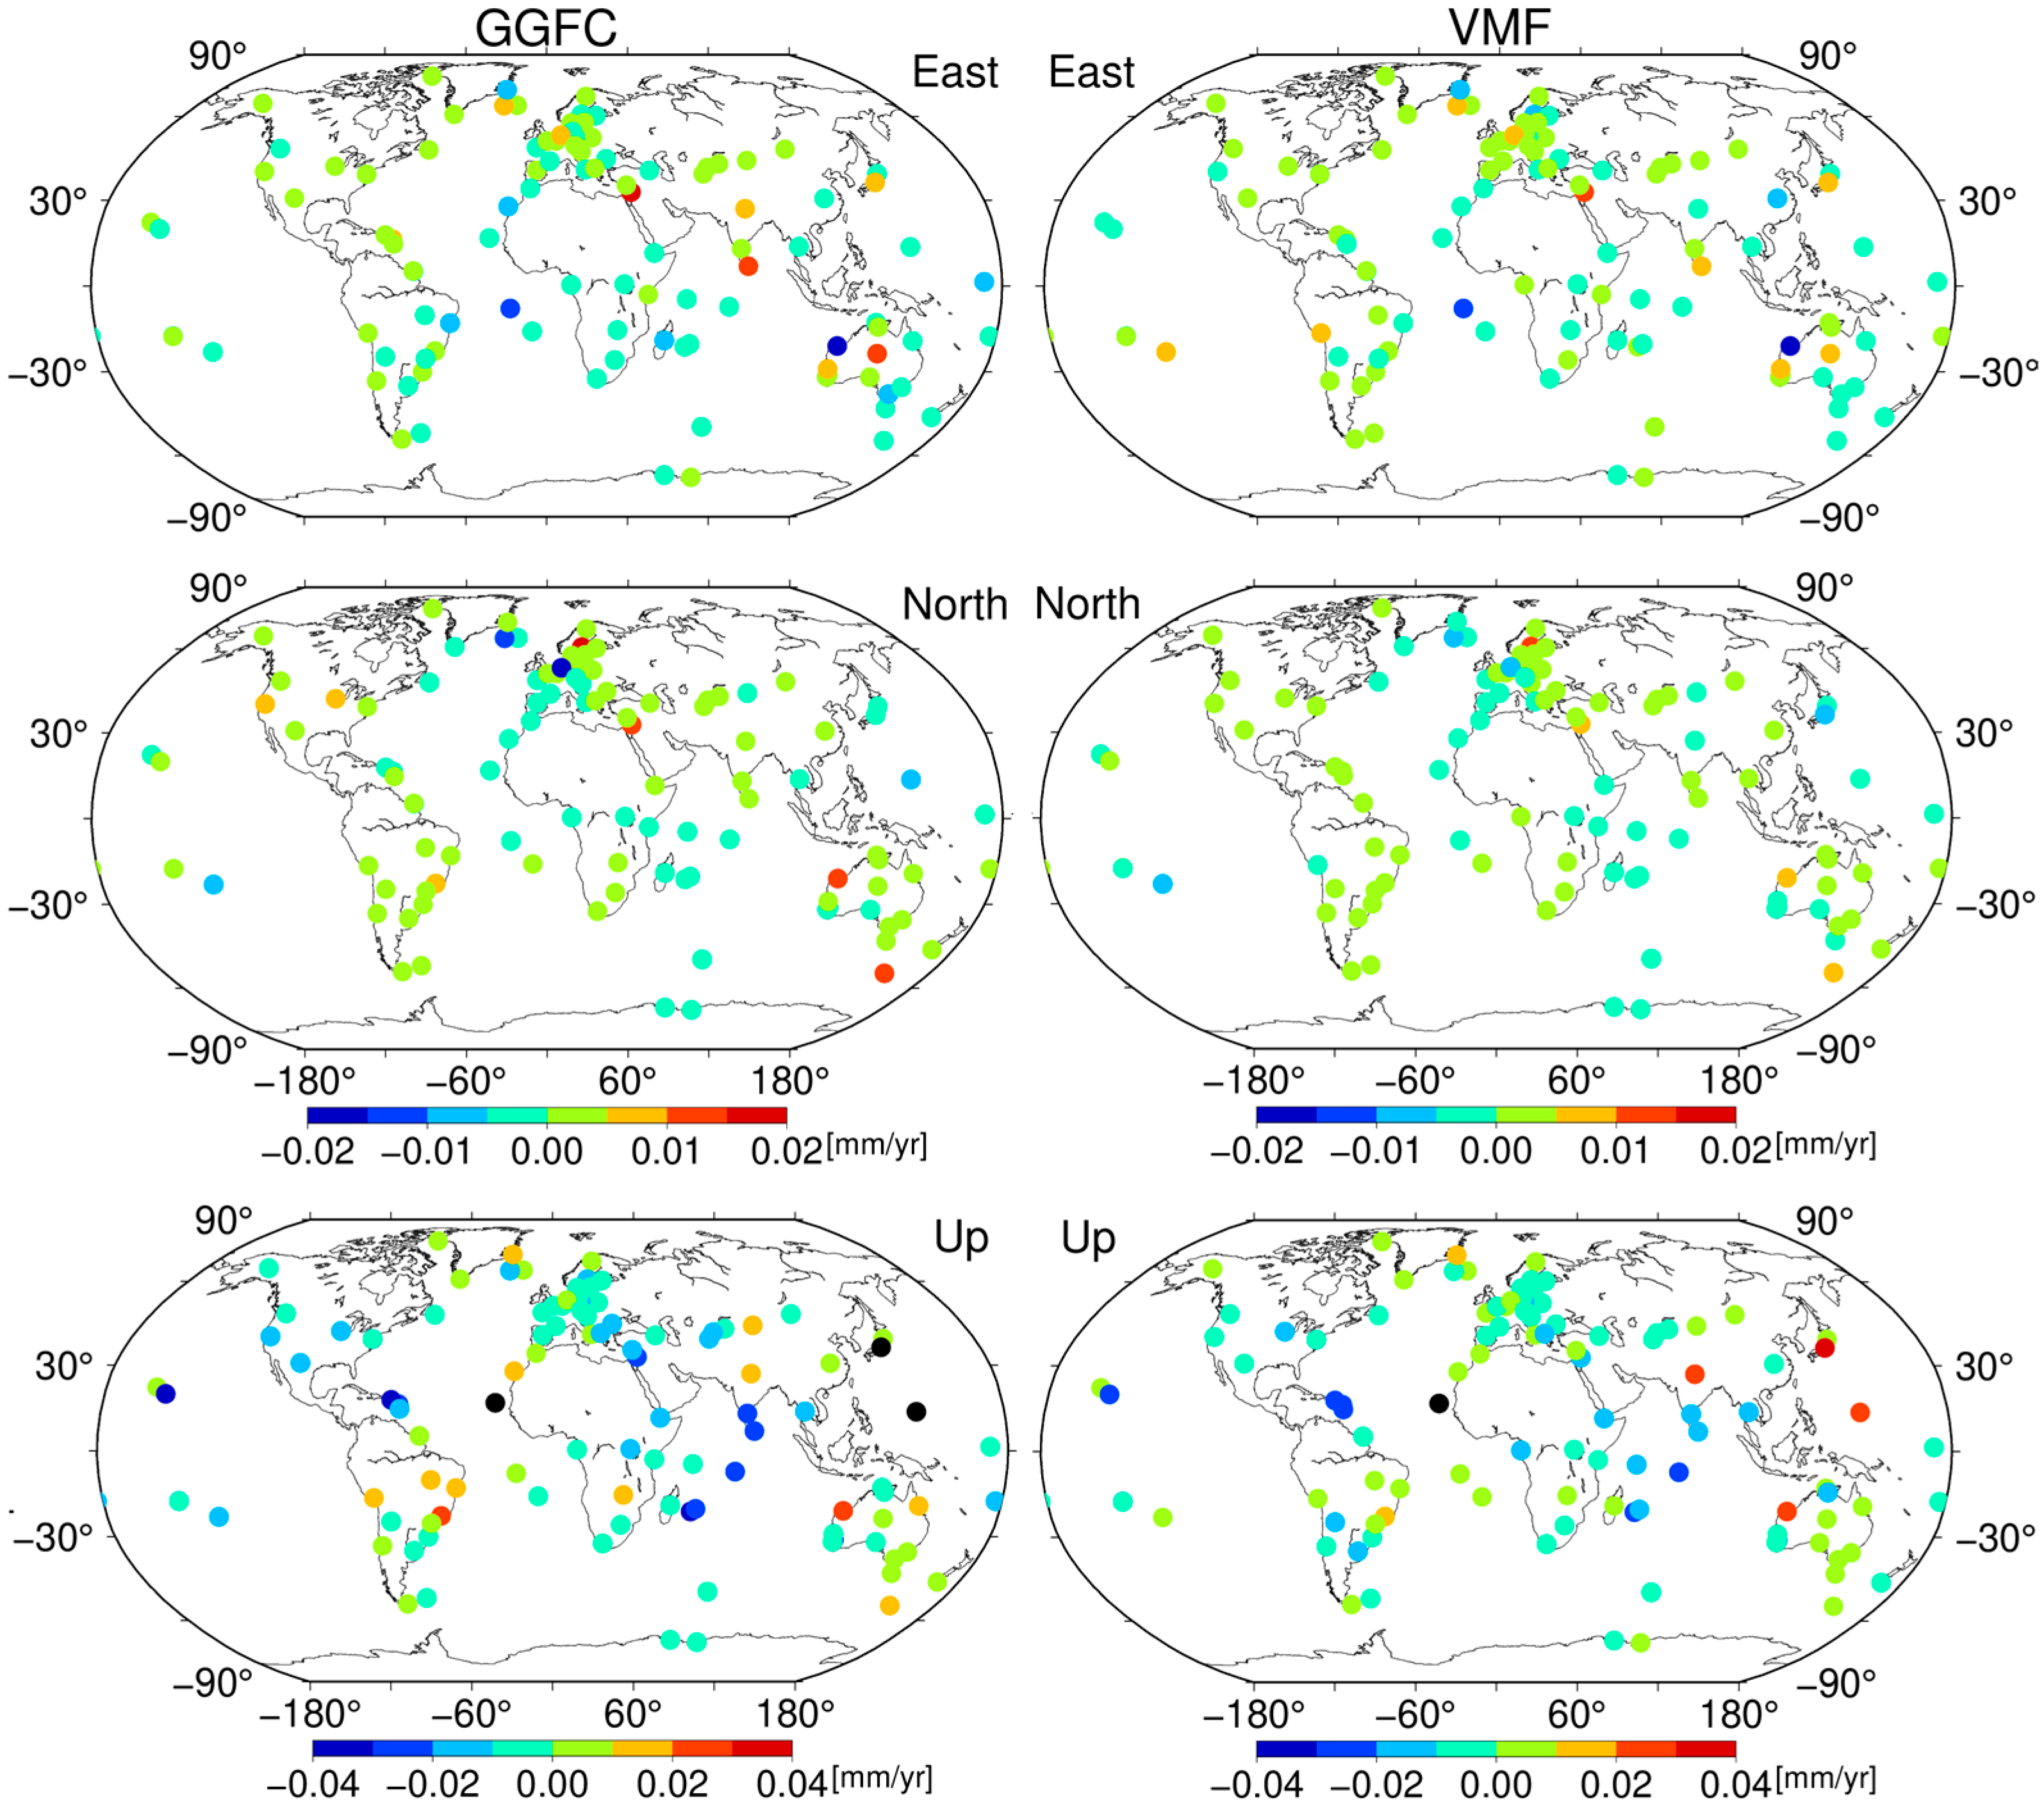
The distribution of the velocity variations induced by S1-S2 is presented in Figure 7. Overall, S1-S2 loading induces very small changes in station velocities. About 3.70% and 4.63% of the stations show velocity variations larger than 0.01 mm/yr in the East and North components, with maximum values of 0.019 and 0.016 mm/yr, respectively. In comparison, the Up component is more sensitive to S1-S2 effects, exhibiting larger induced velocity variations. About 27.78% of the stations have velocity variations greater than 0.01 mm/yr in the Up component, and most are located in coastal regions at latitudes below 30°. Notably, the USUD (Saku, Japan) station exhibits the largest absolute velocity variation in the Up component, with a value of 0.05 mm/yr. These results are consistent with the expected spatial distribution of S1-S2, which tends to have stronger Up component effects in low-latitude coastal and insular areas. Moreover, the velocity variations induced by S1-S2 loading derived from the two grid models (GGFC and VMF) show no statistically significant differences.
The Global Geodetic Observing System (GGOS) sets a target of 1 mm accuracy and long-term stability of 0.1 mm/yr for the future terrestrial reference frame. Given that the velocity variations caused by S1-S2 are under 0.05 mm/yr, it can be inferred that S1-S2 has a negligible effect on reference frame stability at the 0.1 mm/yr scale, and thus does not pose a significant limitation for high-precision geodetic applications.

3.3. Periodical Variations

If the S1-S2 atmospheric tide loading is not considered in GPS data processing, the unmodeled S1-S2 loading errors would propagate into the aliased signals with longer periods [15,37]. When S1-S2 corrections are applied at the observation level, what happens to the periodical signals of GPS time series? This section will focus on this question.
We calculate the coordinate differences induced by S1-S2 loading corrections, and obtain the stacked spectra of the coordinate differences for each component (Figure 8). Obvious peaks at around 1 cycle per year (cpy) and 2 cpy are observed in both the horizontal and the Up components of the stacked spectra, which confirms that the unmodeled S1-S2 effects can propagate into lower frequency signals. However, the main peaks do not align exactly with the harmonics of an annual (365.25 days) or semi-annual (182.63 days) period, but are slightly less (~348 days and ~178 days). These periods correspond closely to the aliasing caused by unmodeled S1-S2 tides, which are related to the GPS satellite repeat period of about 23.93 h [37,38]. This aliasing arises because GPS observations are typically processed on a daily basis, and the sub-daily S1-S2 signals fold into longer periods due to the daily sampling interval. In addition to these low-frequency peaks, the stacked spectra also exhibit peaks at the GPS draconitic period and its harmonics, extending up to the 9th harmonic. GPS draconitic periodic signals in station coordinates were first found by Ray et al. [39], with the period equal to the duration it takes for the GPS satellites to return to the same relative position with respect to the sun in inertial space (1.04 cpy). They propose two possible coupling mechanisms for the GPS draconitic periodic signals, but the real cause is not yet clear. The 1st, 2nd, and 6th draconitic harmonics induced by unmodeled S1-S2 have been identified using real GPS data [17], but more obvious peaks of the anomalous harmonics up to the 9th harmonic are found in our results. So, our results further confirm that S1-S2 is likely one of the contributing sources for inducing the GPS draconitic period. Moreover, compared with the VMF grid model, the application of S1-S2 corrections using the GGFC grid model consistently results in higher stacked spectra at 1.04 and 2.08 cpy. This indicates that the draconitic periodic signals remaining in the GPS station coordinate residuals are reduced. Consequently, the GGFC grid model can be considered the more appropriate choice for implementing S1-S2 corrections.
We then fitted the GPS draconitic period up to 9th harmonics for the difference series for each station, and the amplitude of the first nine harmonics with respect to the latitude in the Up component is illustrated in Figure 9. It can be observed that the draconitic amplitude exhibits a latitude-dependent pattern, decreasing from the equator toward the poles as station latitude increases. The amplitude of the first two draconitic harmonics can reach 0.2 mm, which is consistent with the corrected results reported by Tregoning and Watson [17]. They calculated the amplitude of the semi-annual draconitic periodic signal of the GPS coordinate series difference between solutions with and without the S1-S2 included, finding a latitude dependence with values reaching about 0.8 mm in the midlatitudes. Some of their original results contained errors, which were subsequently corrected. For the 3rd~9th harmonics, the magnitudes of the draconitic period amplitudes are generally below 0.05 mm, indicating that the higher-order harmonics contribute only minor variations compared to the first two harmonics.
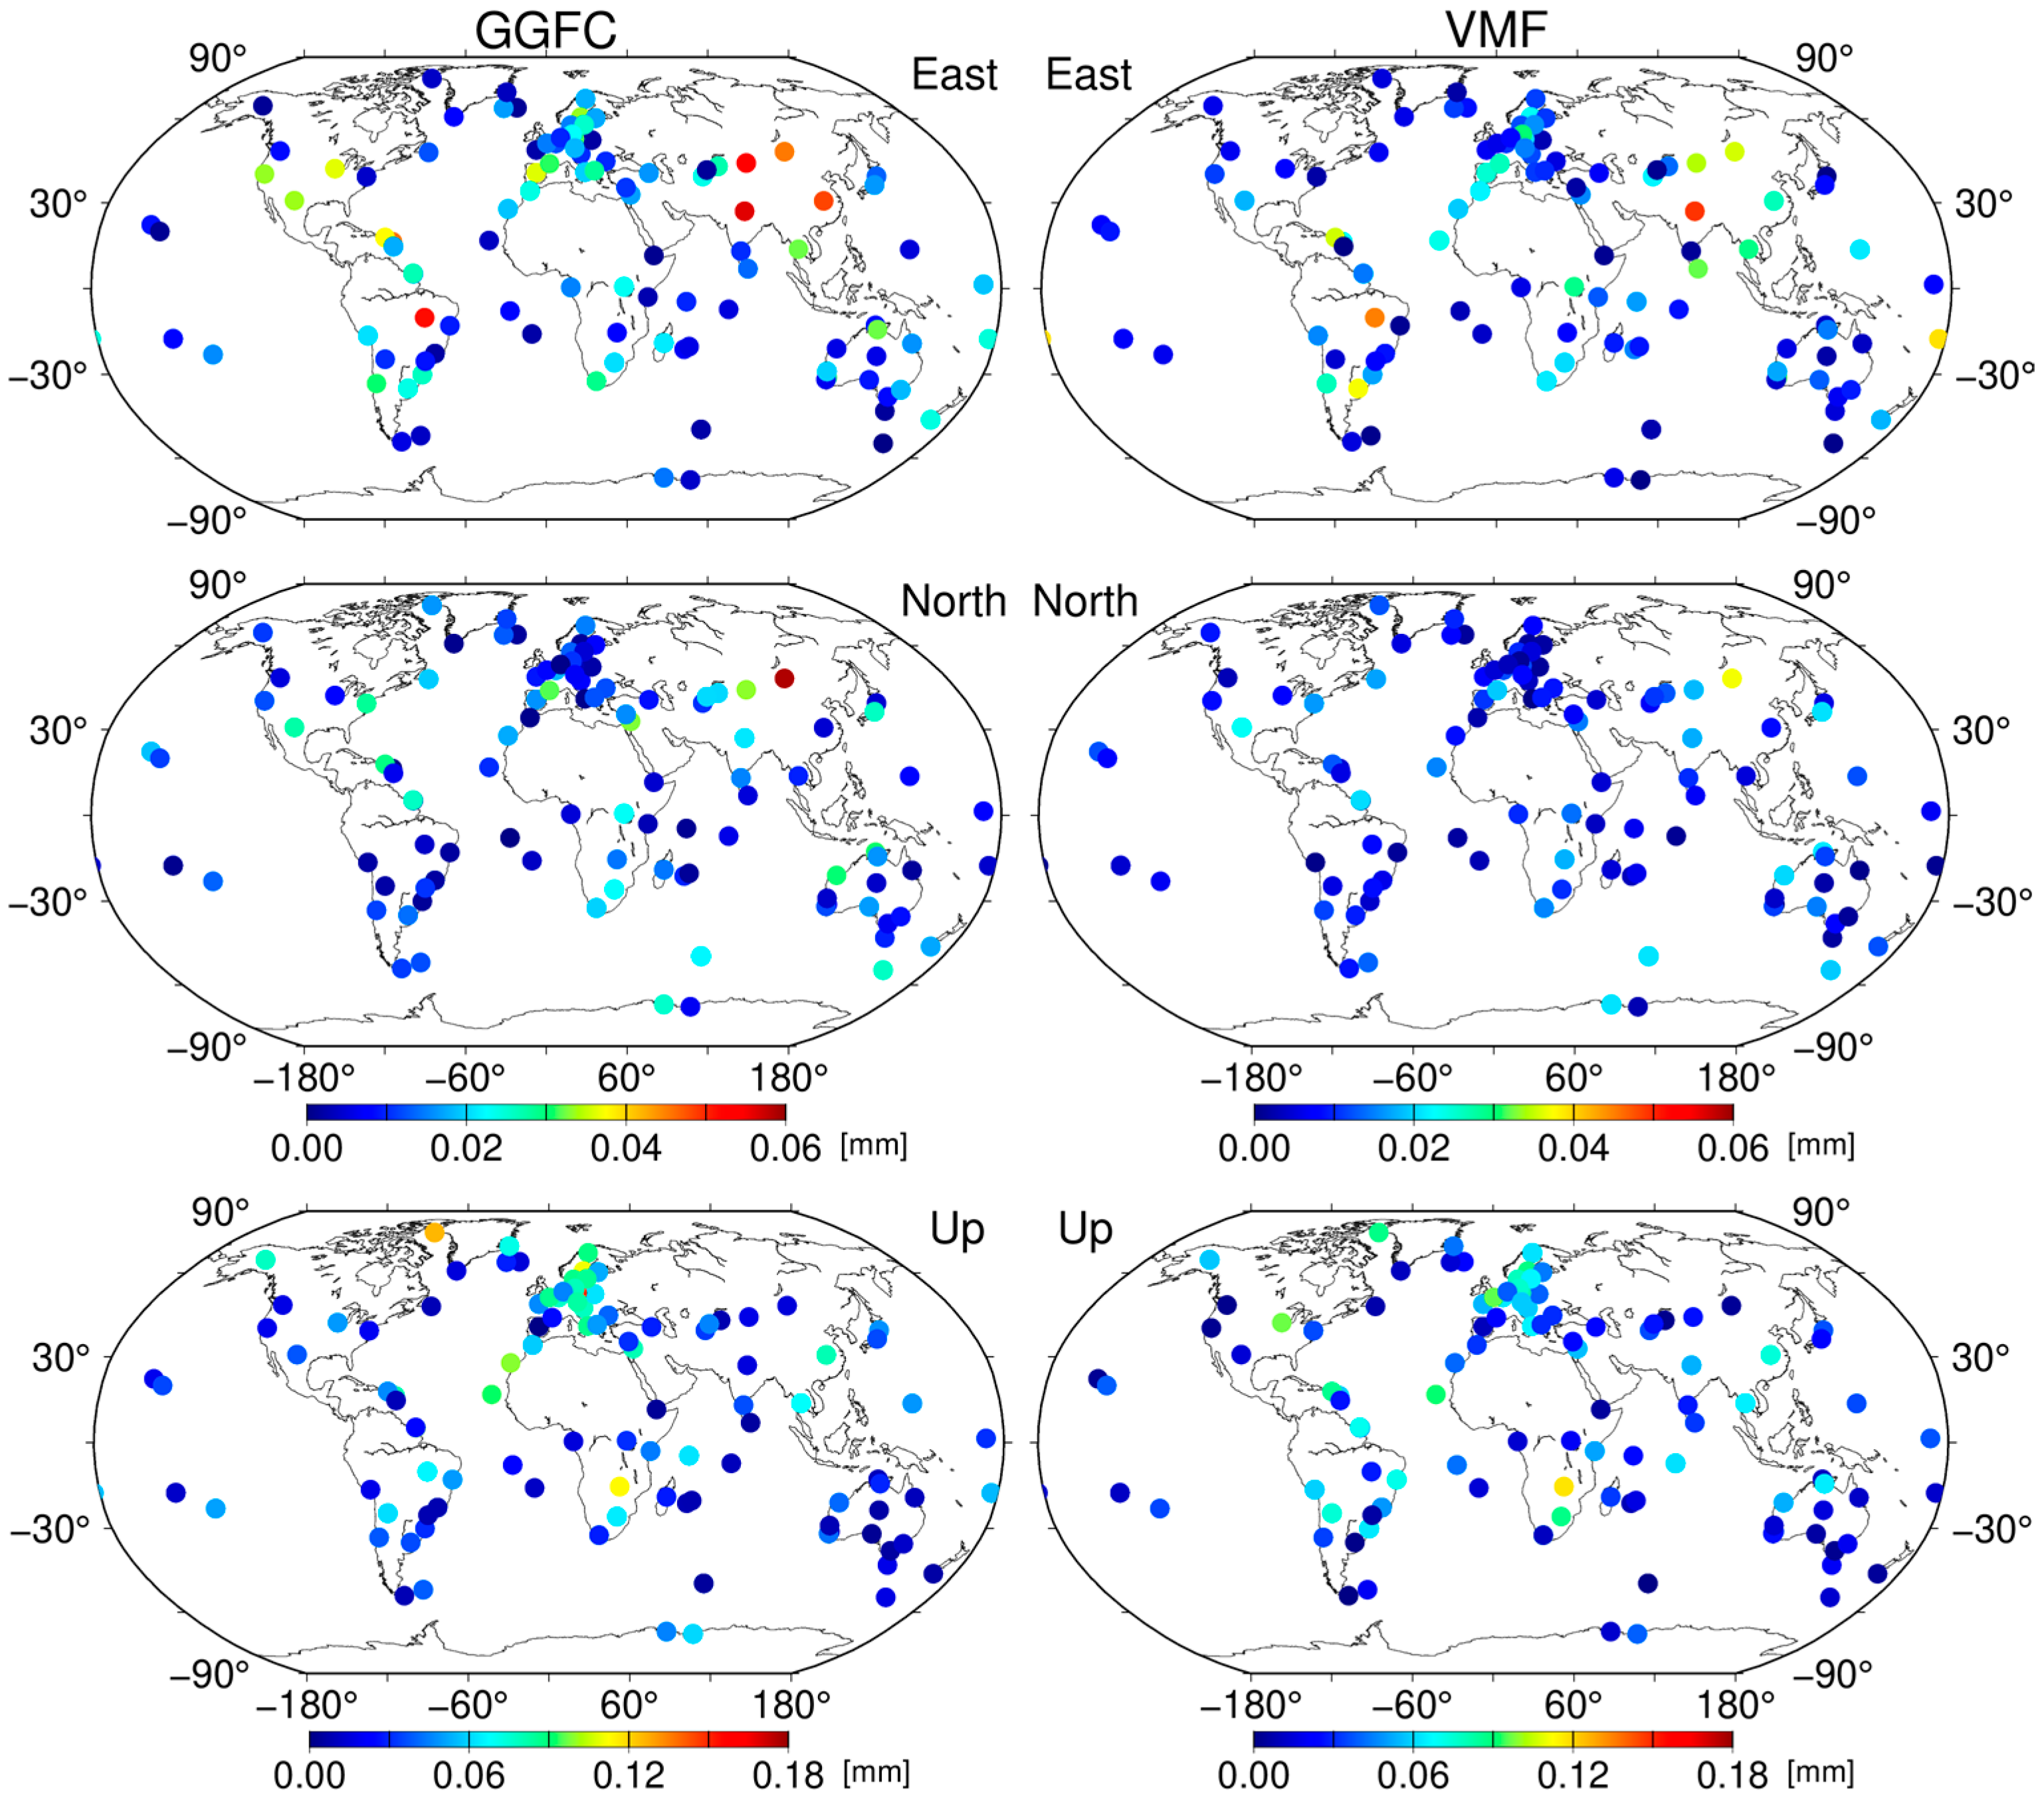
To investigate how S1-S2 influences periodic variations in GPS time series, we fitted the annual, semi-annual solar, and draconitic harmonics for each station, and then calculated the absolute amplitude differences of the annual term. Figure 10 shows the amplitude variation of annual draconitic periodic signal induced by S1-S2. The Up component exhibits an amplitude of the annual draconitic periodic signal that is approximately three times greater than that of the horizontal components. The average amplitude variations across all stations are 0.02, 0.01, and 0.05 mm in the East, North, and Up components, respectively, with maximum values of 0.06 mm in the horizontal components and 0.18 mm in the Up component.
Figure 11 shows the amplitude variation of annual signal induced by S1-S2. Across all stations, the average amplitude variations are 0.02, 0.01, and 0.04 mm for the East, North, and Up components, respectively, which account for 1.11%, 0.60%, and 6.17% of the mean annual amplitude without S1-S2 correction. The average annual amplitudes are 1.84, 1.67, and 6.64 mm, with maximum amplitude variations reaching 0.06, 0.05, and 0.18 mm in the East, North, and Up components, respectively. We can also find the larger amplitude change often observed at the coastal stations. Additionally, stations exhibiting larger annual amplitude variations in the East and Up components are mainly concentrated in Europe.

3.4. WRMS Reduction

In this section, the WRMS of daily station coordinates is analyzed for 108 stations. The GPS coordinate time series was first processed to remove outliers, long-term trends, offsets, and annual signals, resulting in the residual series. Then the WRMS of these residuals was computed for two cases: with and without the S1-S2 correction. Finally, the reduction in WRMS due to the inclusion of the S1-S2 correction was quantified using the following equation [40]:
WRMS diff ( % )   = W R M S S 1 S 2 W R M S r a w W R M S r a w   × 100 %
where W R M S S 1 S 2 and W R M S r a w represent the WRMS of the coordinate residual with and without applied S1-S2 correction, respectively; W R M S d i f f represents the reduction ratio of WRMS caused by S1-S2, and a negative value indicates a decrease in the WRMS.
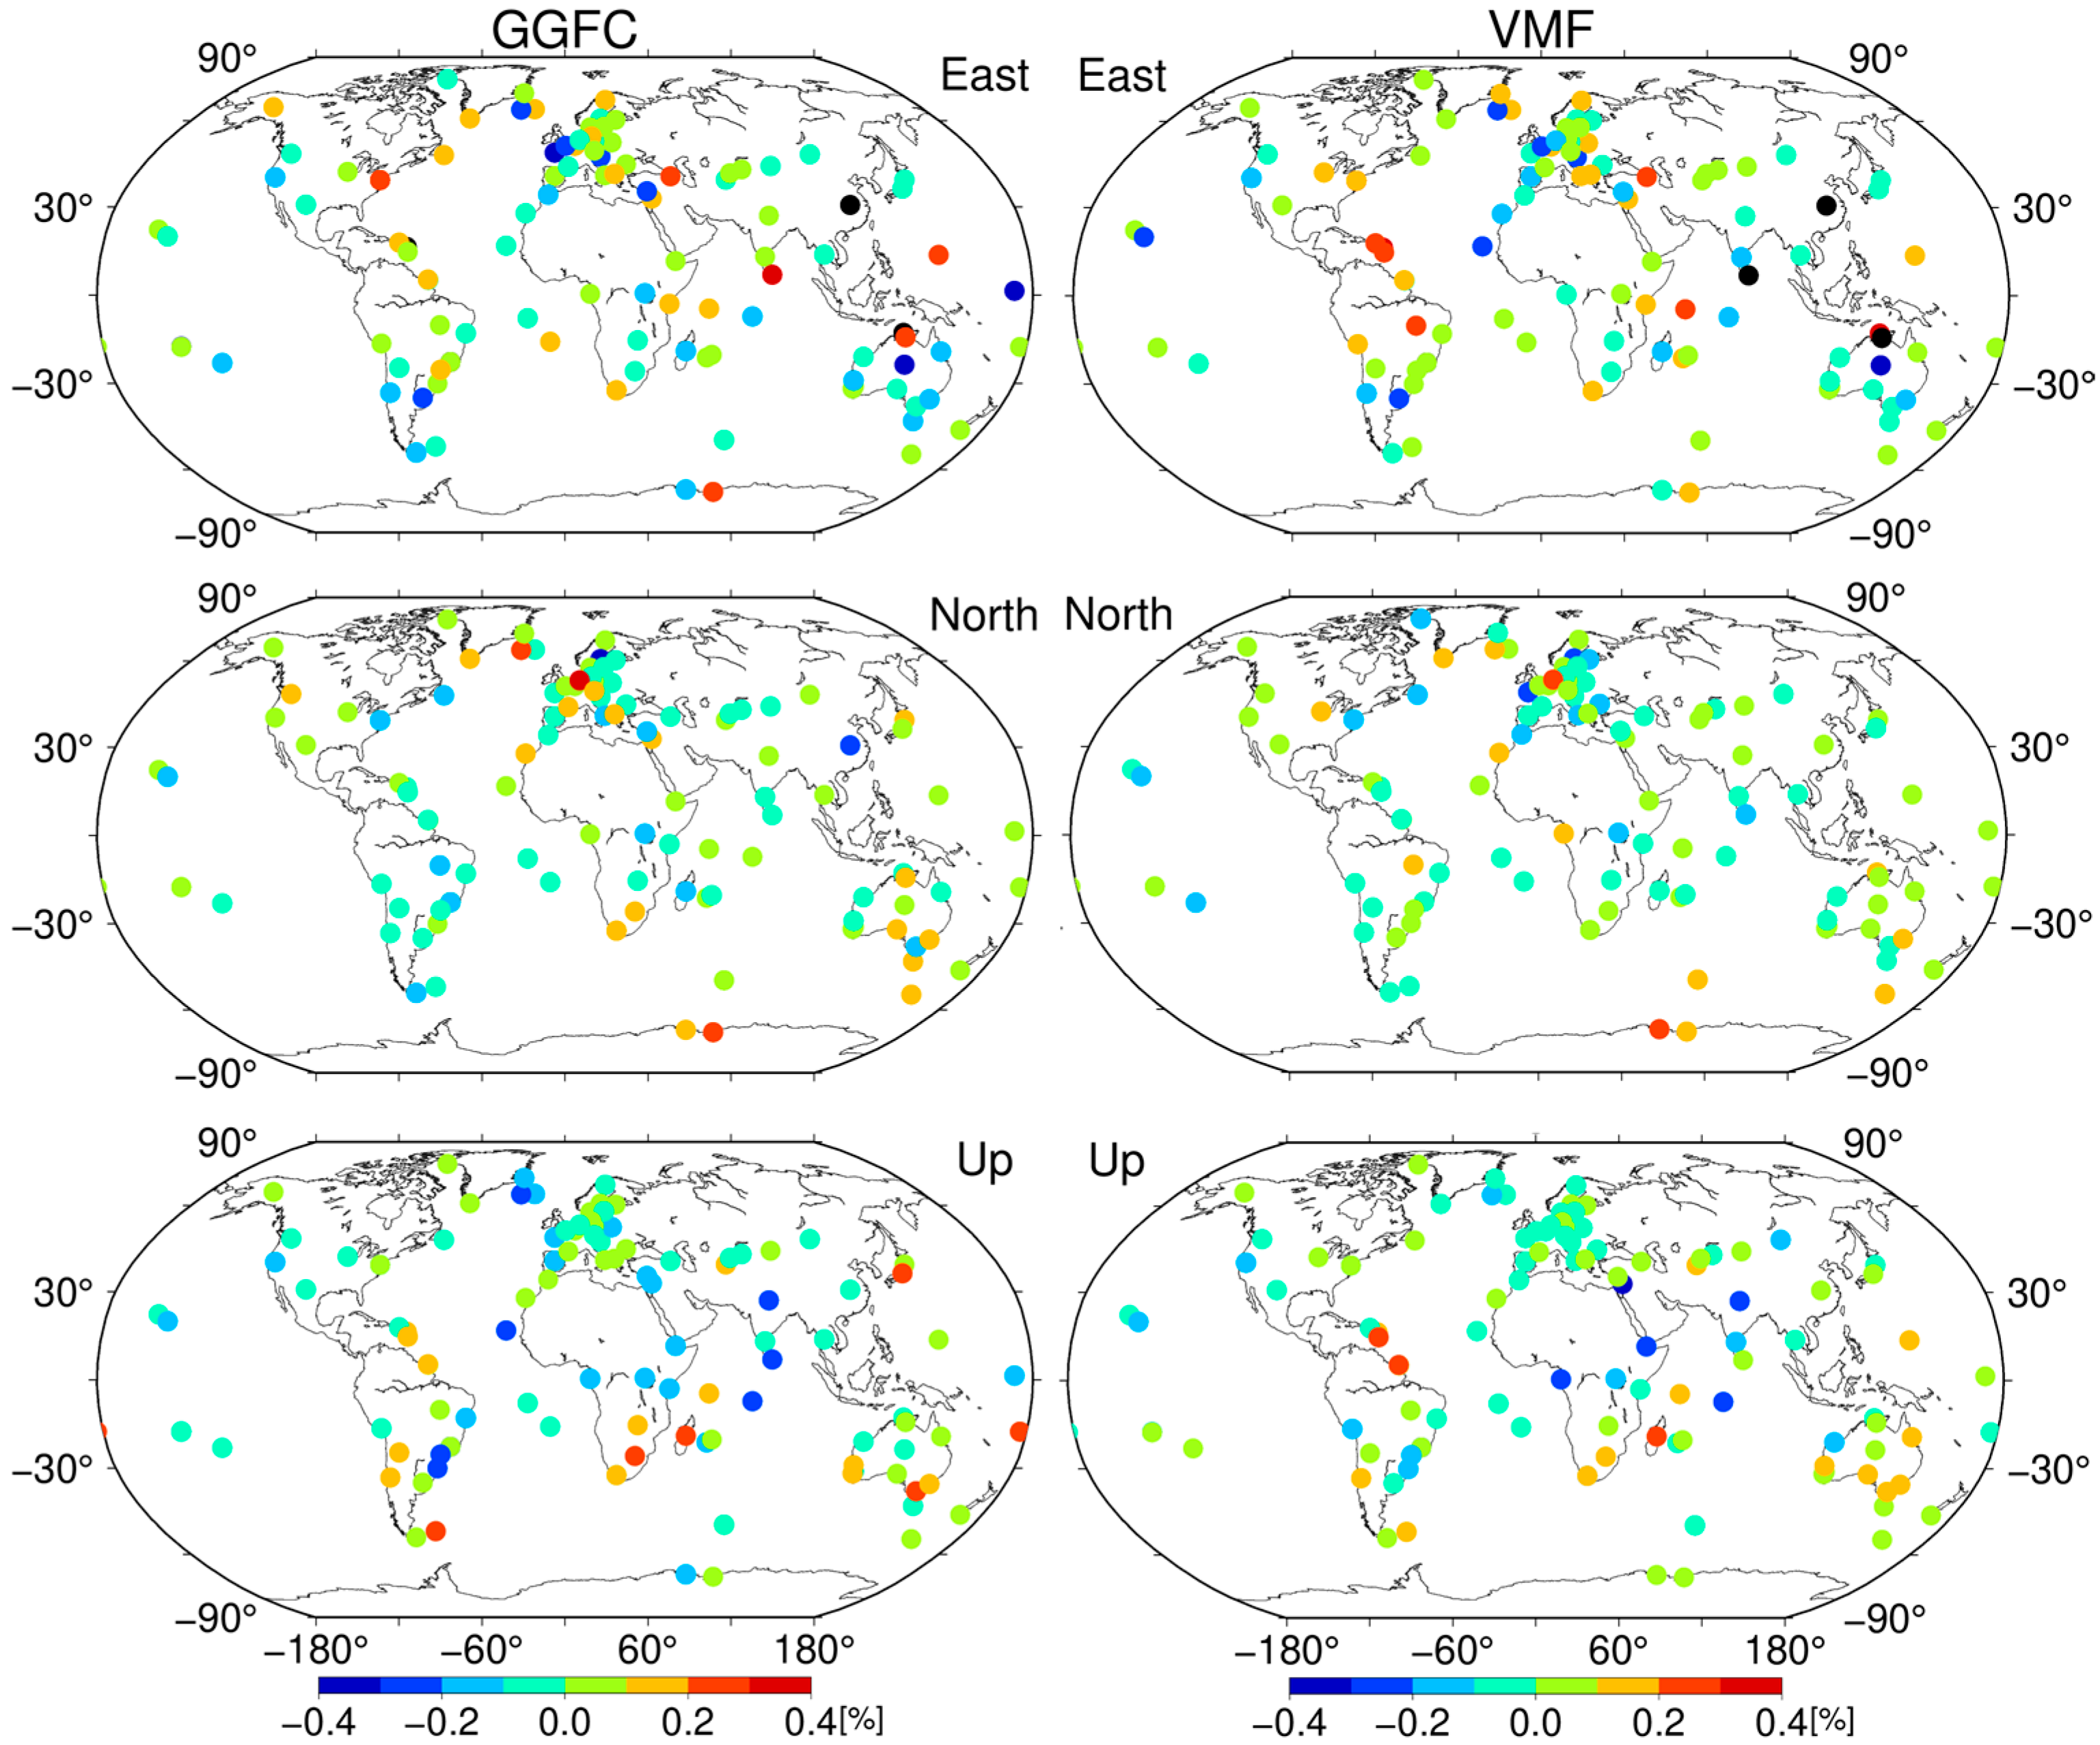
Figure 12 depicts the WRMS reduction ratio of the GPS residual time series caused by applying S1-S2 corrections. When corrections derived from the GGFC grid model are applied, WRMS reductions are observed at 45.37%, 46.30%, and 53.70% of stations in the East, North, and Up components, respectively. In comparison, using the VMF grid model yields reductions at 39.81%, 44.44%, and 50.00% of stations in the corresponding components. Therefore, we recommend using the GGFC grid model for S1-S2 corrections, as it yields larger improvements in GPS station coordinate repeatability.
Although the proportion of stations exhibiting WRMS reductions differs between the GGFC and VMF models, the average WRMS reduction ratio for stations whose repeatability improved is relatively similar. Specifically, the mean WRMS reductions are 0.17%, 0.12%, and 0.19% in the East, North, and Up components, respectively, with maximum reductions reaching 0.40%, 0.48%, and 0.81%. Notably, stations with WRMS reductions exceeding 0.29% account for 8.33% of the total, most of which are located at coastal or island sites. For example, station CPVG (Palmeira, Cape Verde) shows the largest improvement, with a WRMS reduction of 0.81% in the Up component.
Overall, these findings confirm that applying S1-S2 corrections can improve GPS coordinate repeatability, particularly for stations located in coastal or island regions. Moreover, the choice of grid model influences the repeatability of station coordinates. Since the GGFC grid model generally yields greater improvements, it is recommended as the preferred option for implementing S1-S2 corrections.

4. Conclusions

The S1-S2 atmospheric tide periodic signals are usually not considered in standard GPS data processing. This study aims to evaluate the effects of S1-S2 on both daily GPS solutions and long-term coordinate time series to provide some suggestions for GPS data processing. For this purpose, GPS data from 108 IGS stations were processed via PPP using two different strategies, with and without the S1-S2 correction. Our results indicate that the magnitude of GPS daily displacements induced by S1-S2 correction reaches the sub-millimeter level. The maximum RMSs of GPS displacements induced by S1-S2 are 0.18, 0.08, and 0.51 mm for the East, North, and Up components, respectively. Moreover, the S1-S2-induced station GPS displacements increase with decreasing absolute latitude in the East and Up components.
The effects of S1-S2 on the GPS coordinate time series are summarized as follows. Periodical variations: S1-S2 may be an error source of draconitic periodic signals in the station coordinate, especially for the Up component (draconitic periodic signals are obvious up to 9th harmonics). Velocity: The maximum station velocity variations induced by S1-S2 are 0.03 (East), 0.02 (North), and 0.05 (Up) mm/yr. WRMS reduction: Applying S1-S2 corrections from the GGFC grid model reduces residuals for 45.37%, 46.30%, and 53.70% of stations in the East, North, and Up components, respectively. In comparison, the VMF grid model yields reductions of 39.81%, 44.44%, and 50.00%.
When comparing the S1-S2 global grid models from the GGFC and VMF, the magnitude of differences are quite small, with an average discrepancy of less than 0.12 mm. However, substantial phase differences are observed in the horizontal components of S2, reaching up to 180° at some stations. These phase discrepancies likely result from differences in the surface pressure data and land–sea masks used to generate the two grid models. Moreover, we recommend using the GGFC grid model for applying S1-S2 corrections, as it generally yields larger improvements in GPS station coordinate repeatability.
In conclusion, we demonstrate that S1-S2 can cause sub-millimeter variations in GPS daily displacements at the observation level. We confirm that part of the draconitic periodic signals is induced by unmodeled S1-S2 loading deformation. In other words, the S1-S2 tide is one of the sources of GPS draconitic periodic signals. What is more, because the station velocity variations induced by S1-S2 are smaller than 0.05 mm/yr, they have limited influence on the establishment of the reference frame at the 0.1 mm/yr level. The S1-S2 tide has a larger effect on coastal stations and should be considered more carefully. Based on the results of this study, we recommend that S1-S2 be modeled carefully in data processing to improve GPS positioning accuracy.

Author Contributions

Conceptualization, N.W.; methodology, Y.L. and N.W.; software, Y.L. and Q.Z.; validation, Y.L. and K.X.; formal analysis, Y.L. and Q.Z.; investigation, Y.L., K.X., and Q.Z.; resources, N.W.; data curation, K.X.; writing—original draft preparation, Y.L.; writing—review and editing, Y.L. and N.W.; visualization, Y.L.; supervision, N.W.; project administration, N.W.; funding acquisition, N.W. All authors have read and agreed to the published version of the manuscript.

Funding

This research was funded by the National Natural Science Foundation of China, grant number 42174028, 42474030; the Natural Science Foundation of Hubei Province, China, grant number 2025AFA088, 2025AFA038; and the Major Science and Technology Program of Hubei Province, grant number JSCX202501188.

Data Availability Statement

Data are contained within the article.

Acknowledgments

The GPS data are available at http://www.igs.gnsswhu.cn/index.php (accessed on 13 August 2025). The PRIDE PPP-AR software is available at https://github.com/PrideLab/PRIDE-PPPAR (accessed on 13 August 2025). The GGFC S1-S2 grid model is available at https://geophy.uni.lu/displacementgrids/ (accessed on 13 August 2025). The VMF S1-S2 grid model is available at https://vmf.geo.tuwien.ac.at/ (accessed on 13 August 2025).

Conflicts of Interest

The authors declare no conflicts of interest.

References

  1. Wang, H.; Wei, N.; Li, M.; Han, S.; Xiang, Y.; Zhao, Q. Benefits of Tidal Admittance Functions for Refining GNSS-Observed Solar and Lunisolar Tidal Constituents. GPS Solut. 2025, 29, 13. [Google Scholar] [CrossRef]
  2. Altamimi, Z.; Rebischung, P.; Collilieux, X.; Métivier, L.; Chanard, K. ITRF2020: An Augmented Reference Frame Refining the Modeling of Nonlinear Station Motions. J. Geod. 2023, 97, 47. [Google Scholar] [CrossRef]
  3. Wu, X.; Haines, B.J.; Heflin, M.B.; Landerer, F.W. Improved Global Nonlinear Surface Mass Variation Estimates from Geodetic Displacements and Reconciliation with GRACE Data. J. Geophys. Res. Solid Earth 2020, 125, e2019JB018355. [Google Scholar] [CrossRef]
  4. Zhu, W.; Song, S.; He, L. Recommendations for Construction of a Nonlinear International Terrestrial Reference Frame. Sci. China-Phys. Mech. Astron. 2011, 54, 164–171. [Google Scholar] [CrossRef]
  5. Tehranchi, R.; Moghtased-Azar, K.; Safari, A. Fast Approximation Algorithm to Noise Components Estimation in Long-Term GPS Coordinate Time Series. J. Geod. 2021, 95, 18. [Google Scholar] [CrossRef]
  6. Santamaría Gómez, A.; Ray, J.R. Chameleonic Noise in GPS Position Time Series. J. Geophys. Res. Solid Earth 2021, 126, e2020JB019541. [Google Scholar] [CrossRef]
  7. Bogusz, J.; Klos, A. On the Significance of Periodic Signals in Noise Analysis of GPS Station Coordinates Time Series. GPS Solut. 2016, 20, 655–664. [Google Scholar] [CrossRef]
  8. Dai, A.; Deser, C. Diurnal and Semidiurnal Variations in Global Surface Wind and Divergence Fields. J. Geophys. Res.-Atmos. 1999, 104, 31109–31125. [Google Scholar] [CrossRef]
  9. Penna, N.T.; King, M.A.; Stewart, M.P. GPS Height Time Series: Short-Period Origins of Spurious Long-Period Signals. J. Geophys. Res. Solid Earth 2007, 112, 2005JB004047. [Google Scholar] [CrossRef]
  10. Savchuk, S.; Doskich, S.; Gołda, P.; Rurak, A. The Seasonal Variations Analysis of Permanent GNSS Station Time Series in the Central-East of Europe. Remote Sens. 2023, 15, 3858. [Google Scholar] [CrossRef]
  11. Khelifa, S. Correlation Study of the Annual Signal in GPS and DORIS Station Positions with Atmospheric and Hydrology Loading Effects. Arab. J. Geosci. 2021, 14, 370. [Google Scholar] [CrossRef]
  12. Petrov, L.; Boy, J.P. Study of the Atmospheric Pressure Loading Signal in Very Long Baseline Interferometry Observations. J. Geophys. Res. Solid Earth 2004, 109, 2003JB002500. [Google Scholar] [CrossRef]
  13. Tregoning, P.; van Dam, T. Atmospheric Pressure Loading Corrections Applied to GPS Data at the Observation Level. Geophys. Res. Lett. 2005, 32, 2005GL024104. [Google Scholar] [CrossRef]
  14. Heki, K.; Jin, S. Geodetic Study On Earth Surface Loading with GNSS and GRACE. Satell. Navig. 2023, 4, 24. [Google Scholar] [CrossRef]
  15. Penna, N.T.; Stewart, M.P. Aliased Tidal Signatures in Continuous GPS Height Time Series. Geophys. Res. Lett. 2003, 30, 2003GL018828. [Google Scholar] [CrossRef]
  16. Li, C.; Zhang, T.; Yang, P.; He, L.; Xia, Y.; Luan, W. Research On the Refinement Algorithm of Surface Loading Deformation Based On Green’S Function. J. Geod. Geodyn. 2025, 16, 230–239. [Google Scholar] [CrossRef]
  17. Tregoning, P.; Watson, C. Atmospheric Effects and Spurious Signals in GPS Analyses. J. Geophys. Res. Solid Earth 2009, 114, 2009JB006344. [Google Scholar] [CrossRef]
  18. Rebischung, P.; Altamimi, Z.; Métivier, L.; Collilieux, X.; Gobron, K.; Chanard, K. Analysis of the IGS Contribution to ITRF2020. J. Geod. 2024, 98, 49. [Google Scholar] [CrossRef]
  19. Griffiths, J. Combined Orbits and Clocks From IGS Second Reprocessing. J. Geod. 2019, 93, 177–195. [Google Scholar] [CrossRef] [PubMed]
  20. Ray, R.D.; Ponte, R.M. Barometric Tides From ECMWF Operational Analyses. Ann. Geophys. 2003, 21, 1897–1910. [Google Scholar] [CrossRef]
  21. Farrell, W.E. Deformation of the Earth by Surface Loads. Rev. Geophys. 1972, 10, 761–797. [Google Scholar] [CrossRef]
  22. Fan, W.; Jiang, W.; Li, Z.; Tao, J.; Wang, Z.; He, L. Impacts of Local Green’s Functions On Modeling Atmospheric Loading Effects for GNSS Reference Stations. Earth Space Sci. 2024, 11, e2023EA003113. [Google Scholar] [CrossRef]
  23. Blewitt, G. Self-Consistency in Reference Frames, Geocenter Definition, and Surface Loading of the Solid Earth. J. Geophys. Res. Solid Earth 2003, 108, 2002JB002082. [Google Scholar] [CrossRef]
  24. Wunsch, C.; Stammer, D. Atmospheric Loading and the Oceanic “Inverted Barometer” Effect. Rev. Geophys. 1997, 35, 79–107. [Google Scholar] [CrossRef]
  25. van Dam, T.; Ray, R. Updated October 2010. S1 and S2 Atmospheric Tide Loading Effects for Geodetic Applications. 2010. Available online: https://geophy.uni.lu/atmosphere/tide-loading-calculator/ (accessed on 13 August 2025).
  26. Wijaya, D.D.; Böhm, J.; Karbon, M.; Kràsnà, H.; Schuh, H. Atmospheric Pressure Loading. In Atmospheric Effects in Space Geodesy; Springer: Berlin/Heidelberg, Germany, 2013; pp. 137–157. [Google Scholar] [CrossRef]
  27. Li, Z.; Chen, W.; Jiang, W.; Deng, L.; Yang, R. The Magnitude of Diurnal/Semidiurnal Atmospheric Tides (S1/S2) and their Impacts On the Continuous GPS Coordinate Time Series. Remote Sens. 2018, 10, 1125. [Google Scholar] [CrossRef]
  28. Re3Data.Org: VMF Data Server; Editing Status 2020-12-14; Re3Data.Org-Registry of Research Data Repositories. Available online: https://www.re3data.org/repository/r3d100012025 (accessed on 13 August 2025).
  29. Dach, R.; Böhm, J.; Lutz, S.; Steigenberger, P.; Beutler, G. Evaluation of the Impact of Atmospheric Pressure Loading Modeling On GNSS Data Analysis. J. Geod. 2011, 85, 75–91. [Google Scholar] [CrossRef]
  30. van den Dool, H.M.; Saha, S.; Schemm, J.; Huang, J. A Temporal Interpolation Method to Obtain Hourly Atmospheric Surface Pressure Tides in Reanalysis 1979-1995. J. Geophys. Res. 1997, 102, 22013–22024. [Google Scholar] [CrossRef]
  31. Petit, G.; Luzum, B. IERS Conventions. 2010. Available online: https://iers-conventions.obspm.fr/ (accessed on 13 August 2025).
  32. Zumberge, J.F.; Heflin, M.B.; Jefferson, D.C.; Watkins, M.M.; Webb, F.H. Precise Point Positioning for the Efficient and Robust Analysis of GPS Data From Large Networks. J. Geophys. Res. Solid Earth 1997, 102, 5005–5017. [Google Scholar] [CrossRef]
  33. Geng, J.; Chen, X.; Pan, Y.; Mao, S.; Li, C.; Zhou, J.; Zhang, K. PRIDE PPP-AR: An Open-Source Software for GPS PPP Ambiguity Resolution. GPS Solut. 2019, 23, 91. [Google Scholar] [CrossRef]
  34. Landskron, D.; Böhm, J. VMF3/GPT3: Refined Discrete and Empirical Troposphere Mapping Functions. J. Geod. 2018, 92, 349–360. [Google Scholar] [CrossRef]
  35. Lyard, F.H.; Allain, D.J.; Cancet, M.; Carrère, L.; Picot, N. FES2014 Global Ocean Tide Atlas: Design and Performance. Ocean Sci. 2021, 17, 615–649. [Google Scholar] [CrossRef]
  36. Guo, S.; Shi, C.; Wei, N.; Li, M.; Fan, L.; Wang, C.; Zheng, F. Helmert Transformation Strategies in Analysis of GPS Position Time-Series. Geophys. J. Int. 2020, 223, 973–992. [Google Scholar] [CrossRef]
  37. Stewart, M.P.; Penna, N.T.; Lichti, D.D. Investigating the Propagation Mechanism of Unmodelled Systematic Errors On Coordinate Time Series Estimated Using Least Squares. J. Geod. 2005, 79, 479–489. [Google Scholar] [CrossRef]
  38. Guo, S.; Shi, C.; Wei, N.; Li, M.; Fan, L.; Zhang, D. Effect of Ambiguity Resolution On the Draconitic Errors in Sub-Daily GPS Position Estimates. GPS Solut. 2021, 25, 101. [Google Scholar] [CrossRef]
  39. Ray, J.; Altamimi, Z.; Collilieux, X.; van Dam, T. Anomalous Harmonics in the Spectra of GPS Position Estimates. GPS Solut. 2008, 12, 55–64. [Google Scholar] [CrossRef]
  40. Jiang, W.; Li, Z.; van Dam, T.; Ding, W. Comparative Analysis of Different Environmental Loading Methods and their Impacts On the GPS Height Time Series. J. Geod. 2013, 87, 687–703. [Google Scholar] [CrossRef]
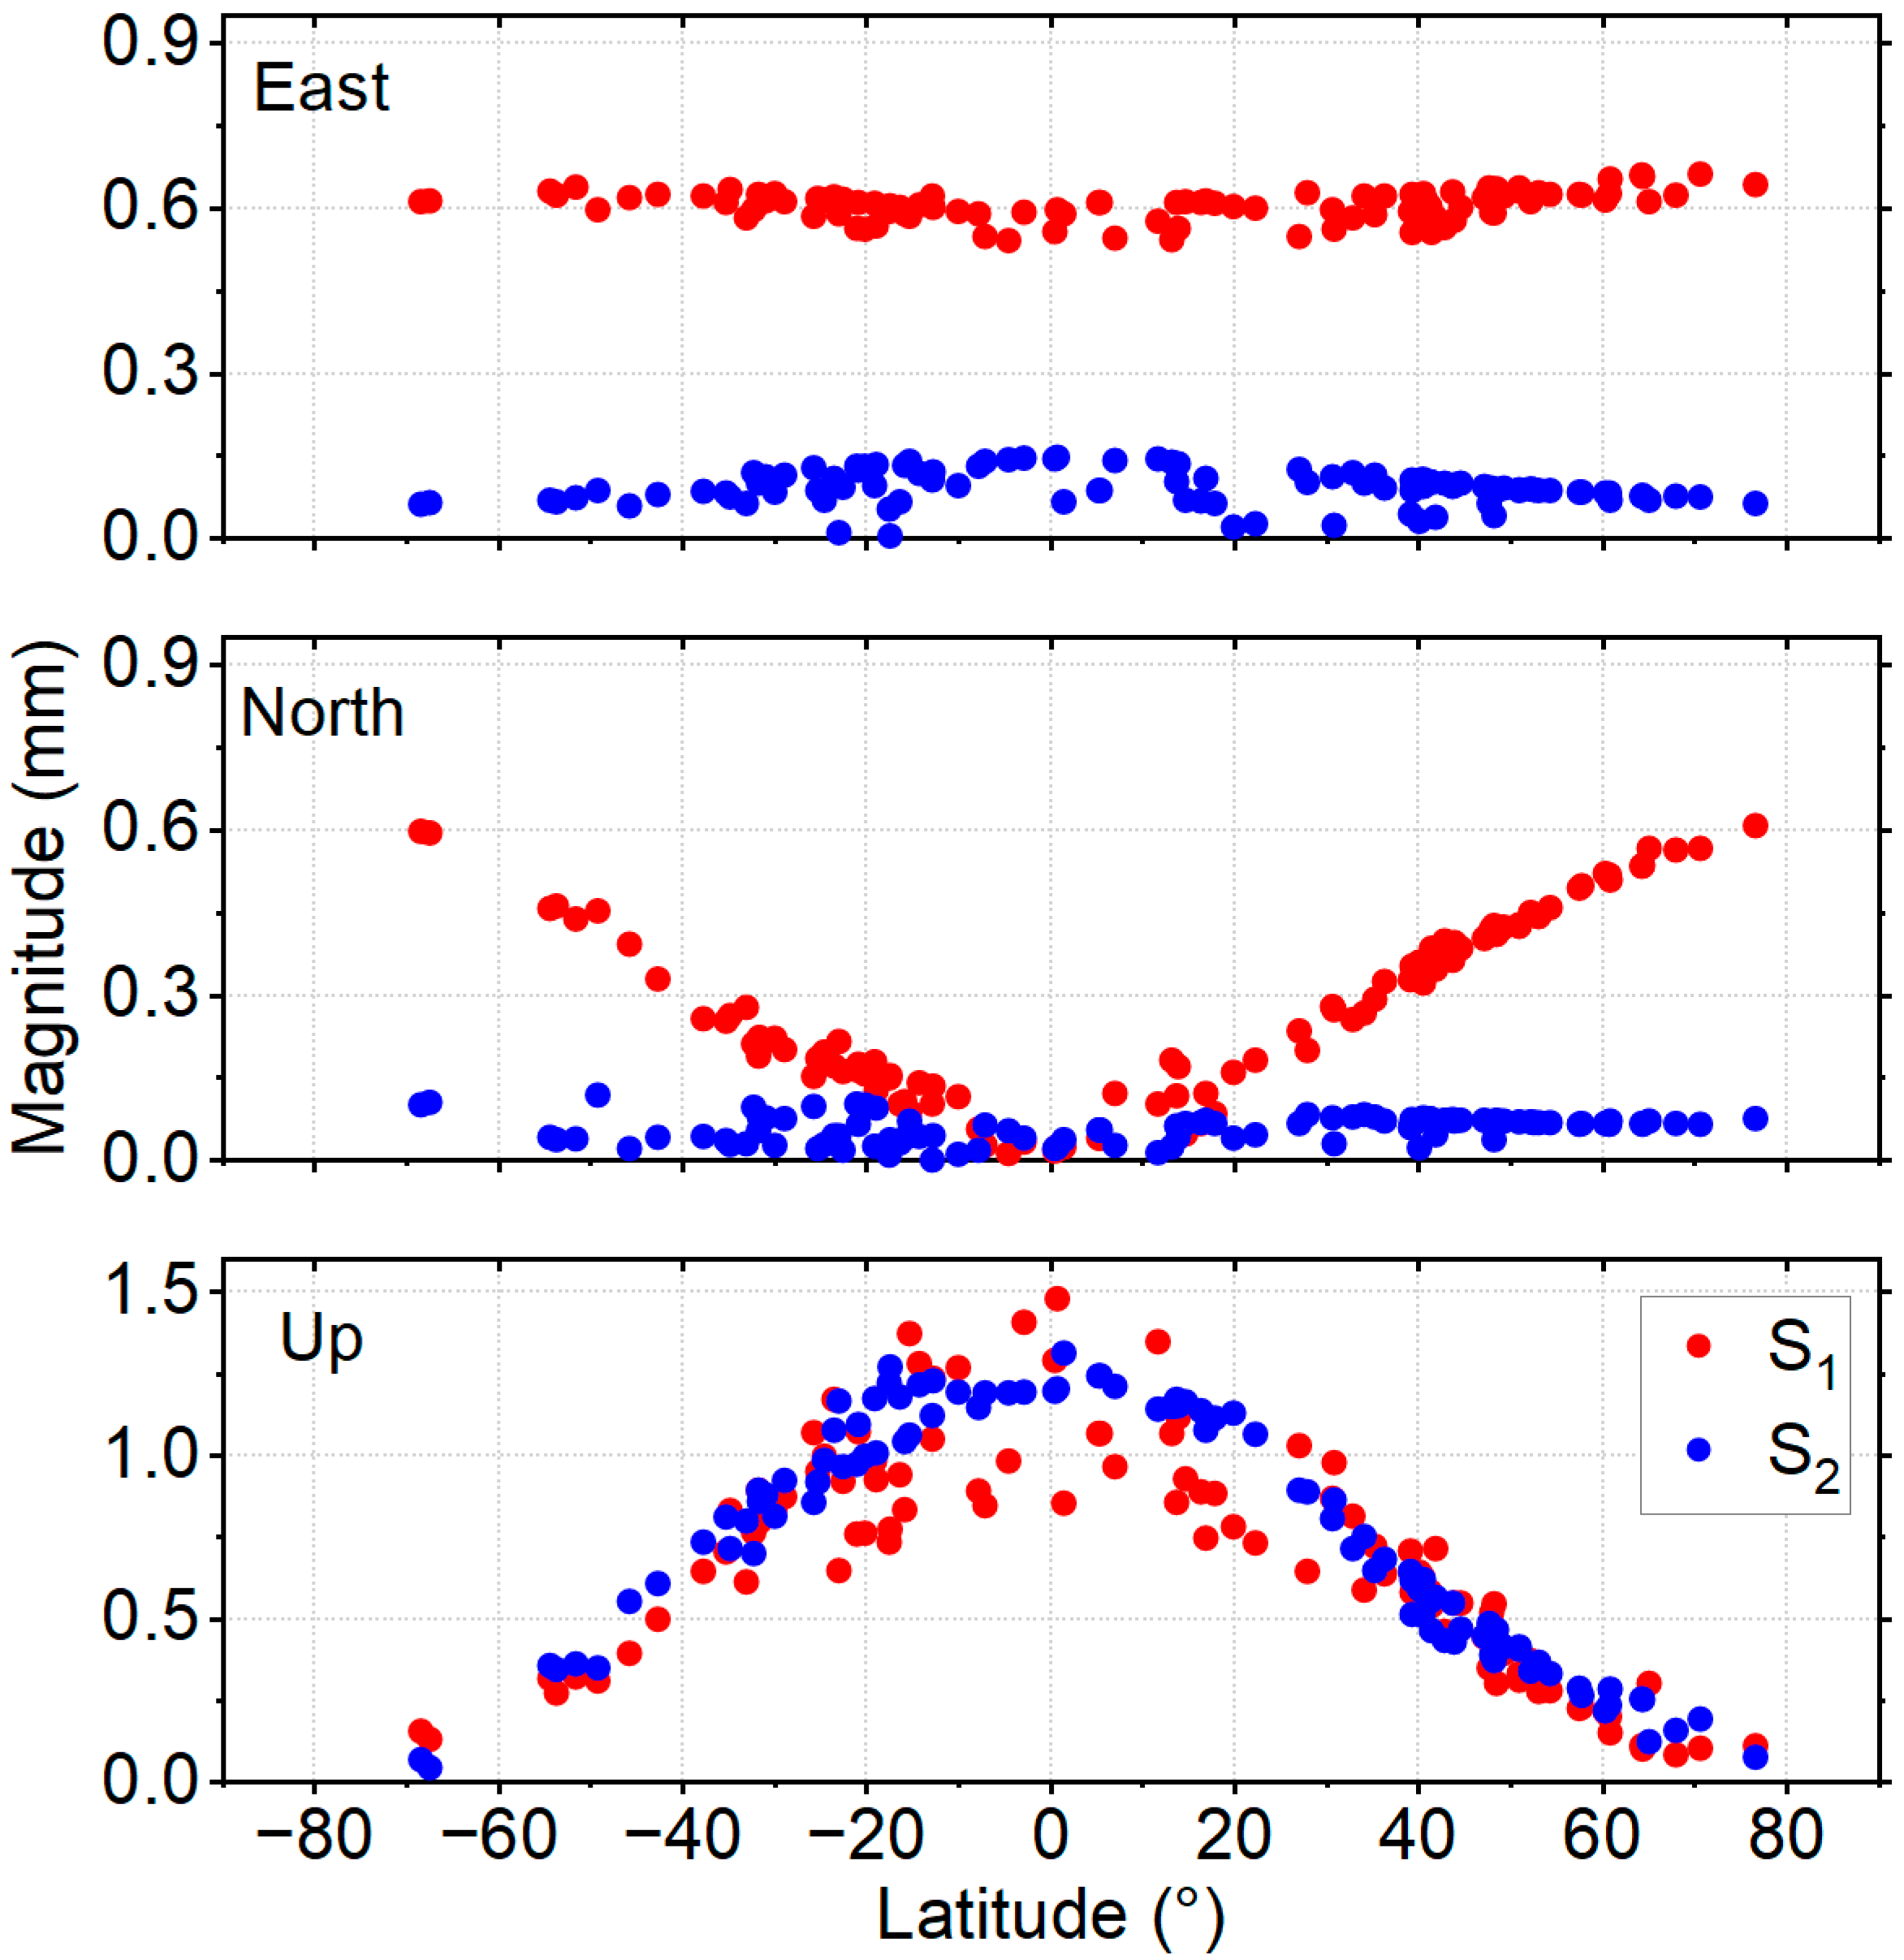
Figure 1. The magnitude of surface deformation of 108 IGS stations induced by S1 (red) and S2 (blue) loading.
Remotesensing 17 03147 g001
Figure 2. Magnitude and phase differences of station displacements were calculated from the S1-S2 global grids provided by GGFC and VMF for 108 GPS stations in the East (top), North (middle), and Up (bottom) components, respectively. Colors of the dots indicate the magnitude differences in millimeters, while the direction of the black arrows indicates the phase difference (degrees), measured clockwise from North. White dots indicate magnitude variations exceeding the maximum scale.
Remotesensing 17 03147 g002
Figure 3. Time-series length and data gaps percentage for 108 IGS stations. Dot size corresponds to the length of each station’s coordinate time series, and dot color indicates the percentage of data gaps in the coordinate time series.
Remotesensing 17 03147 g003
Figure 4. RMS of the GPS daily coordinates differences induced by S1-S2 loading with respect to latitude.
Remotesensing 17 03147 g004
Figure 5. Time series of coordinate differences and their normalized spectra induced by S1–S2 for the low-latitude station SGOC. The number in the corner of the left panel represents the RMS of the coordinate differences. Black vertical lines in the right panel indicate the annual and semi-annual harmonics, whereas the gray dashed lines denote the first nine harmonics of the GPS draconitic periodic signals.
Remotesensing 17 03147 g005
Figure 6. Time series of coordinate differences and their normalized spectra induced by S1-S2 for the high latitude station MAW1. The number in the left panel, the black vertical lines, and the gray dashed lines have the same meaning as in Figure 5.
Remotesensing 17 03147 g006
Figure 7. The spatial distribution of linear velocity variation induced by S1-S2. The black dots indicate that the velocity variation exceeds the maximum scale. Note that the East (top) and North (middle) have the same scale. The left and right panels show the velocity variation calculated using the S1-S2 grid models provided by the GGFC and the VMF, respectively.
Remotesensing 17 03147 g007
Figure 8. The stacked spectra of coordinate difference series induced by S1-S2. The meaning of the grey dash lines is the same as Figure 5.
Remotesensing 17 03147 g008
Figure 9. Amplitude of first nine draconitic harmonics of difference series induced by S1-S2 as a function of latitude in Up component.
Remotesensing 17 03147 g009
Figure 10. Amplitude variation of annual draconitic periodic signal induced by S1-S2. The left and right panel are the amplitude variation using the S1-S2 grid models provided by the GGFC and the VMF, respectively.
Remotesensing 17 03147 g010
Figure 11. Amplitude variation of annual signal induced by S1-S2. The left and right panel are the amplitude variation using the S1-S2 grid models provided by the GGFC and the VMF, respectively.
Remotesensing 17 03147 g011
Figure 12. Spatial distribution of the WRMS reduction ratio induced by S1-S2. Black dots indicate the WRMS reduction rate exceeding the minimum scale. The left and right panel are the WRMS reduction rate using the S1-S2 grid models provided by the GGFC and the VMF, respectively.
Remotesensing 17 03147 g012
Table 1. Description of the GPS data processing strategy.
ItemsDescription
SoftwarePRIDE PPP-AR (version 3.1.4)
ModelIonosphere-free combination model
FrequenciesGPS: L1/L2
Elevation cut-off angle
Sampling rate30 s
Tropospheric delay modelVMF3
Orbits/clocks/bias productsRapid products of Wuhan University
Receiver antenna calibrationigs14.atx: 3 January 2021 to 26 November 2022
igs20.atx: 27 November 2022 to 1 December 2024
Tidal correctionsAtmospheric tides: RP03 (GGFC or VMF grid model)
Ocean tidal loading: FES2014b
Solid earth tides and pole tides: IERS 2010 conventions
Disclaimer/Publisher’s Note: The statements, opinions and data contained in all publications are solely those of the individual author(s) and contributor(s) and not of MDPI and/or the editor(s). MDPI and/or the editor(s) disclaim responsibility for any injury to people or property resulting from any ideas, methods, instructions or products referred to in the content.