Article

A Cloud-Based Framework for the Quantification of the Uncertainty of a Machine Learning Produced Satellite-Derived Bathymetry

by
Spyridon Christofilakos
1,*,
Avi Putri Pertiwi
1,
Andrea Cárdenas Reyes
1,2,
Stephen Carpenter
3,4,
Nathan Thomas
5,
Dimosthenis Traganos
1 and
Peter Reinartz
6
1
German Aerospace Center (DLR), Remote Sensing Technology Institute (IMF), Imaging Spectroscopy Department, Rutherfordstraße 2, 12489 Berlin, Germany
2
Institute of Geography and Geology, University of Würzburg, 97074 Würzburg, Germany
3
Emirates Nature—World Wide Fund for Nature, Abu Dhabi 73323, United Arab Emirates
4
National Oceanography Centre, European Way, Southampton SO14 3ZH, UK
5
Department of History, Geography and Social Sciences, Edge Hill University, St Helens Road, Ormskirk L39 4QP, UK
6
German Aerospace Center (DLR), Earth Observation Center (EOC), Remote Sensing Technology Institute (IMF), 82234 Weßling, Germany
*
Author to whom correspondence should be addressed.
Remote Sens. 2025, 17(17), 3060; https://doi.org/10.3390/rs17173060
Submission received: 11 July 2025 / Revised: 22 August 2025 / Accepted: 25 August 2025 / Published: 3 September 2025

Abstract

The estimation of accurate and precise Satellite-Derived Bathymetries (SDBs) is important in marine and coastal applications for a better understanding of the ecosystems and science-based decision-making. Despite the advancements in related Machine Learning (ML) studies, quantifying the anticipated bias per pixel in the SDBs remains a significant challenge. This study aims to address this knowledge gap by developing a spatially explicit uncertainty index of a ML-derived SDB, capable of providing a quantifiable anticipation for biases of 0.5, 1, and 2 m. In addition, we explore the usage of this index for model optimization via the exclusion of training points of high or moderate uncertainty via a six-fold iteration loop. The developed methodology is applied across the national coastal extent of Belize in Central America (~7017 km2) and utilizes remote sensing data from the European Space Agency’s twin satellite system Sentinel-2 and Planet’s NICFI PlanetScope. In total, 876 Sentinel-2 images, nine NICFI six-month basemaps and 28 monthly PlanetScope mosaics are processed in this study. The training dataset is based on NASA’s system Ice, Cloud and Elevation Satellite (ICESat-2), while the validation data are in situ measurements collected with scientific equipment (e.g., multibeam sonar) and were provided by the National Oceanography Centre, UK. According to our results, the presented approach is able to provide a pixel-based (i.e., spatially explicit) uncertainty index for a specific prediction bias and integrate it to refine the SDB. It should be noted that the efficiency of the optimization of the SDBs as well as the correlations of the proposed uncertainty index with the absolute prediction error and the true depth are low. Nevertheless, spatially explicit uncertainty information produced by a ML-related SDB provides substantial insight to advance coastal ecosystem monitoring thanks to its capability to showcase the difficulty of the model to provide a prediction. Such spatially explicit uncertainty products can also aid the communication of coastal aquatic products with decision makers and provide potential improvements in SDB modeling.

1. Introduction

Earth Observation (EO) constitutes a crucial and promising tool for the Paris Agreement’s agenda towards climate change mitigation and adaptation [1] due to its capabilities of understanding, monitoring, and predicting a plethora of ocean system physical indexes and climate change impacts. Examples of those capabilities are applications on benthic habitat mapping [2,3,4]) and Satellite-Derived Bathymetry (SDB) [5,6], as well as time-sensitive prognoses on climate change threats related to water bodies and coastal systems. In particular, EO can showcase potentially serious socio-economic fallouts, such as the rise in sea level [7] and coastal flood risk [8]. Within this context, the contribution of the combination of Machine Learning (ML) and cloud-computing developments is considered to aid significantly in the performance of EO analysis, as it can be applied across large geographic scales and historical temporal periods, which was not possible a few decades ago [9]. Furthermore, these cutting-edge techniques and technologies are crucial in providing robust blue carbon accounting [10,11,12,13,14]. One promising nature-based solution to climate change is to identify and conserve coastal ecosystems such as mangrove forests, tidal marshes, and seagrasses because of their abilities to sequester and store carbon out of the atmosphere and water column [15,16].
In recent years, Google Earth Engine (GEE), a cloud-based platform for scientific analysis and visualization of big geospatial datasets (https://earthengine.google.com/), has become a key contributor to the global remote sensing community [17]. Thanks to GEE’s infrastructure, users can utilize Google’s cloud computational power and petabyte-scale catalogs of remote sensing, raster, and vector data in order to perform local- to planetary-scale geospatial analysis [18]. Since GEE’s launch, the number of submitted articles related to Random Forest (RF) classifiers and water resources has been on the rise [19]. From time-series analysis of China’s annual coastal tidal flat changes [20] and Indonesia’s shoreline dynamics [21], to blue carbon accounting in The Bahamas [11] and flood impact assessments following maritime storms in the western Mediterranean [22,23], GEE has repeatedly demonstrated its utility and value for an extensive range of applications (e.g., image processing, land and habitat classification, algorithm development and execution, etc.) [9] and for the processing of big data analytics [24].
Up to today, the EO community has made a laborious effort for a better comprehension of uncertainty in ML-produced continuous distributions. Most studies quantify uncertainty using spatially bound approaches, often employing frequentist statistical methods such as r-squared and root mean square error (RMSE), which rely on the validation data [25,26]. Due to the relationship with the validation data, these accuracy indices beget diagnostic uncertainty information. A literature review by Sayer et al. [25] on aerosol optical depth, a continuous distribution variable, highlighted that predictive uncertainty estimation at the pixel level offers insights for informed decision-making. Similarly, Tran et al. [26] reviewed 676 papers on another continuous distribution variable, the EO-based evapotranspiration, and identified the need for evaluating and disclosing uncertainties in reference data. Additionally, their findings underscored the importance of considering both the complexity of methodologies and the characteristics of data when evaluating the validity of uncertainty estimations. However, diagnostic uncertainty estimation is spatially constrained, presenting challenges for evaluations of large-scale applications [8]. Moreover, as this per-pixel diagnostic is tied to classifier accuracy and precision—both of which depend on spatially limited in situ data—uncertainty values may also be affected by the amount of validation data.
As for the spatially explicit uncertainty information in SDBs, a few existing studies primarily focus on the following:
  • Error residuals [27] and standard deviation [25,28] between different SDB models;
  • Rough depth-dependent uncertainty estimation [29];
  • Confidence approximations based on multiple SDB predictions [30].
The literature reveals a significant gap in spatially explicit uncertainty quantification, hindering thorough understanding and decision-making processes. Capturing uncertainty at the pixel level is crucial for implementing effective protection and monitoring policies [26,27,30]. Moreover, the potential of refining uncertainty assessments per pixel can enhance ML model performance by mitigating noise introduced by reference data [31]. However, a comprehensive prognostic method for quantifying the spatially explicit uncertainty of cloud-based, ML-generated SDB using fused EO and reference data has yet to be developed.
In coastal remote sensing, uncertainty estimates for ML-generated continuous distributions typically follow two approaches: diagnostic, which involves extrapolating based on reference data, and prognostic, which relies on extrapolating directly from the ML predictions. However, there is a critical gap in spatially explicit uncertainty estimation that affects both diagnostic and prognostic approaches. This gap refers to the inability of current methods to provide a quantifiable anticipation of error/bias, given the input data and the difficulty of the model to perform. The difficulty here refers to the high spectral resemblance of the sea surface, which is greater than that of the land surface due to interactions between the water surface, water column, and seabed. For these reasons, the aim of this study is to create a cloud-based semi-automatic framework to quantitatively assess the spatially explicit uncertainty of a ML-generated SDB. The goal is to identify high-uncertainty regions, support better decision-making, optimize in-situ sampling strategies, and potentially improve the model’s performance. The optimization is data-driven, as it is based on the removal of reference data with high uncertainty in an attempt to reduce the introduction of noise into the model. This approach represents a fundamental shift in uncertainty assessment, offering a more granular and spatially explicit perspective that is not constrained by model comparisons or validation-based diagnostics.

2. Methodology

2.1. Study Site

The coastal national extent of Belize (Central America) is the study case of this research (Figure 1). This coastal area holds a vital ecological and socio-economic significance for the country as the foundation of the coastal Marine Protected Areas by the local government in the early 1980s [32]. Furthermore, the largest part of the Mesoamerican Reef system runs through Belize, and along with its considerable seagrass meadows and all Caribbean native mangrove species, it contributes to the country’s Gross Domestic Product (GDP) [33]. In addition, a variety of endangered marine fauna inhabits the coastal habitats of Belize, such as loggerhead, green, and hawksbill sea turtles, along with the West Indian manatee [33]. The GDP contribution is approximately 30% and benefits commercial fishing, ecological and cruise tourism, and coastal developments from private sector investments, as well as aquaculture [33]. With 45% of the national population living close to the coastline, the identification of pressure drivers in the coastal environment is essential, as there is a constant transmogrification of the Belizean coastlines due to dynamic oceanic processes in the region and the rise in the sea level [34].

2.2. Remote Sensing and Reference Data

In this study, we utilized images from the European Space Agency’s (ESA) Sentinel-2 system (S2) through the Copernicus program Planet’s monthly basemaps (https://www.planet.com/products/basemap/, accessed on 30 June 2023) and six-month mosaics (PS), provided by the Planet-NICFI agreement (https://www.nicfi.no/). These two satellite data providers and archives were selected for their global and pan-tropical (in the case of the NICFI data) availability, high spatial resolution, and contribution to marine remote sensing research as described in the Introduction. Therefore, we consider them ideal for applying the presented method and examining its adaptability, not only in data with different scales and image footprints, but also in different satellite sources that operate on the optical spectrum. Additionally, the spatial and temporal coincidence of both satellite archives now allows a pan-tropical data and method comparison.
Using the GEE platform, a collection of 876 atmospherically corrected (i.e., surface reflectance) S2 Level-2A images undergoes a multi-temporal and semi-analytical process to produce one cloud-masked, sunglint-corrected [35], and land-and-optically-deep-water-masked image composite [36]. As introduced by Traganos et al. [37], the composite was generated by selecting the first percentile of reflectance values across the image collection. This low percentile helps minimize the influence of clouds, atmospheric noise, and sunglint—ensuring that the clearest water pixels are prioritized in the final composite. Subsequently, the image composite is the one that undergoes the presented uncertainty workflow and is named ‘Sen18’ due to the three-years acquisition period of the S2 data, which ranges from December 2018 to December 2021. The spatial and temporal resolution of S2 data are 10 m and five days, respectively. Concerning the spatial resolution of the S2 aerosol band (B1), which is 60 m, a resampling of 10 m takes place in GEE prior to the production of Sen18. The decision to include this band, despite the bias due to its creation, is because of the water penetration and worthiness for SDB’s methods and applications [38]. In the case of PS, we process and analyze two PS atmospheric corrected image collections, resulting in two different image composites. The composites were created like the Sen18 composite, and their given names are PS16 and PS20 according to their acquisition time periods, which date/are counted from 2016 to 2019 and 2020 to 2022, respectively. PS data’s spatial resolution is 5 m while the temporal resolution is one day. The image collection accounted for PS16 consists of eight NICFI six-month basemaps and correspondingly for PS20, from one NICFI semester basemap and 28 monthly PlanetScope mosaics, in total.
The bathymetric data for the training of the SDB model originated from NASA’s Ice, Cloud and Elevation Satellite-2 (ICESat-2) space-based laser altimeter [39]. In this study we used ICESat-2’s geolocated photon data version 3, which is processed following signal extraction and correction algorithms described in Neumann et al. [40]. Therefore, the resulting bathymetry is inherently influenced by these algorithms and their parameterization, a potential source of bias that this study seeks to minimize. The temporal coverage of the ICESat-2 data is two years (October 2018–November 2020), while the temporal and spatial resolution are 91 days and 70 cm × 70 cm, respectively (https://nsidc.org/data/atl03/versions/3, accessed on 30 April 2023 ). The number of bathymetric points that were extracted from ICESat-2 data is 641,562, while the depth range is 0 to ten meters [28]. Regarding the validation source of the SDB model, it is composed of almost 9500 high-resolution points provided by the National Oceanography Centre (NOC). These points are high-resolution and high-quality in situ measurements and were collected with airborne lidar and acoustic side-scan sonars and CAMEL (Containerized Autonomous Marine Environmental Laboratory). CAMEL is a portable marine science laboratory, conceived and developed by the NOC in partnership with L3 Harris. It uses a high-grade multibeam echo sounder to map the depth of the seafloor (https://projects.noc.ac.uk/cme-programme/news/portable-marine-science-lab-returns-belize, accessed on 30 April 2023) In order to produce the bathymetry, however, certain preprocessing on the training and validation datasets is required. Due to the origin, the spatial resolution, and the different grid system of ICESat-2 data, their point proximity in many cases is less than the spatial resolution of both satellite data of this study (5 and 10 m). Therefore, a special function called ‘Vector2Raster’ was established to estimate the mean depth value of all the points enclosed in each pixel and then, set that value as the new one. The result of this preprocessing treatment and aggregation is the minimization of the spatial error during the training and validation of the SDB models [38]. Such spatial error can be generated by the overlay of different depth values in one pixel and introduce vertical bias in the final product. Accordingly, the SDB model training and accuracy assessment were conducted separately for each remote sensing dataset, which is preferable for minimizing spatial autocorrelation and reducing potential errors associated with using training and validation data derived from the same source and data pool. To be exact, 2753 training and 777 validation points are used for producing and validating the SDB coming from the Sen18 image composite, while the number of points for processing PS data are 2852 and 742, respectively. It is important to note that these datasets were not harmonized to a common vertical datum. While this may introduce some vertical offsets, the primary objective of this study is to assess pixel-level uncertainty in the predicted bathymetry. Therefore, although vertical harmonization would improve absolute depth accuracy, its absence is acknowledged as a limitation that does not undermine the core findings but may be related to them.
According to literature [41,42,43], Object-Based Image Analysis (OBIA) is applicable to benthic habitat mapping, so here we also examine its application and contribution in satellite-derived bathymetry and primarily in the uncertainty workflow. Object creation is based on all the optical bands of the satellite systems that we use here (i.e., blue, green, and red), including Hue, Value, and DIV bands as they were estimated based on the research of Lee et al. [36] and Poursanidis et al. [44]. The saturation band of HSV was not used. According to our experiments, the accuracy of the SDBs was reduced significantly when the saturation band was involved, and therefore it was excluded from the analysis.
In Table 1 we provide all the information of the satellite and reference data that was produced as described in this section.

2.3. The Workflow, the Pixel UNCertainty (PUNC), and the Model Retraining

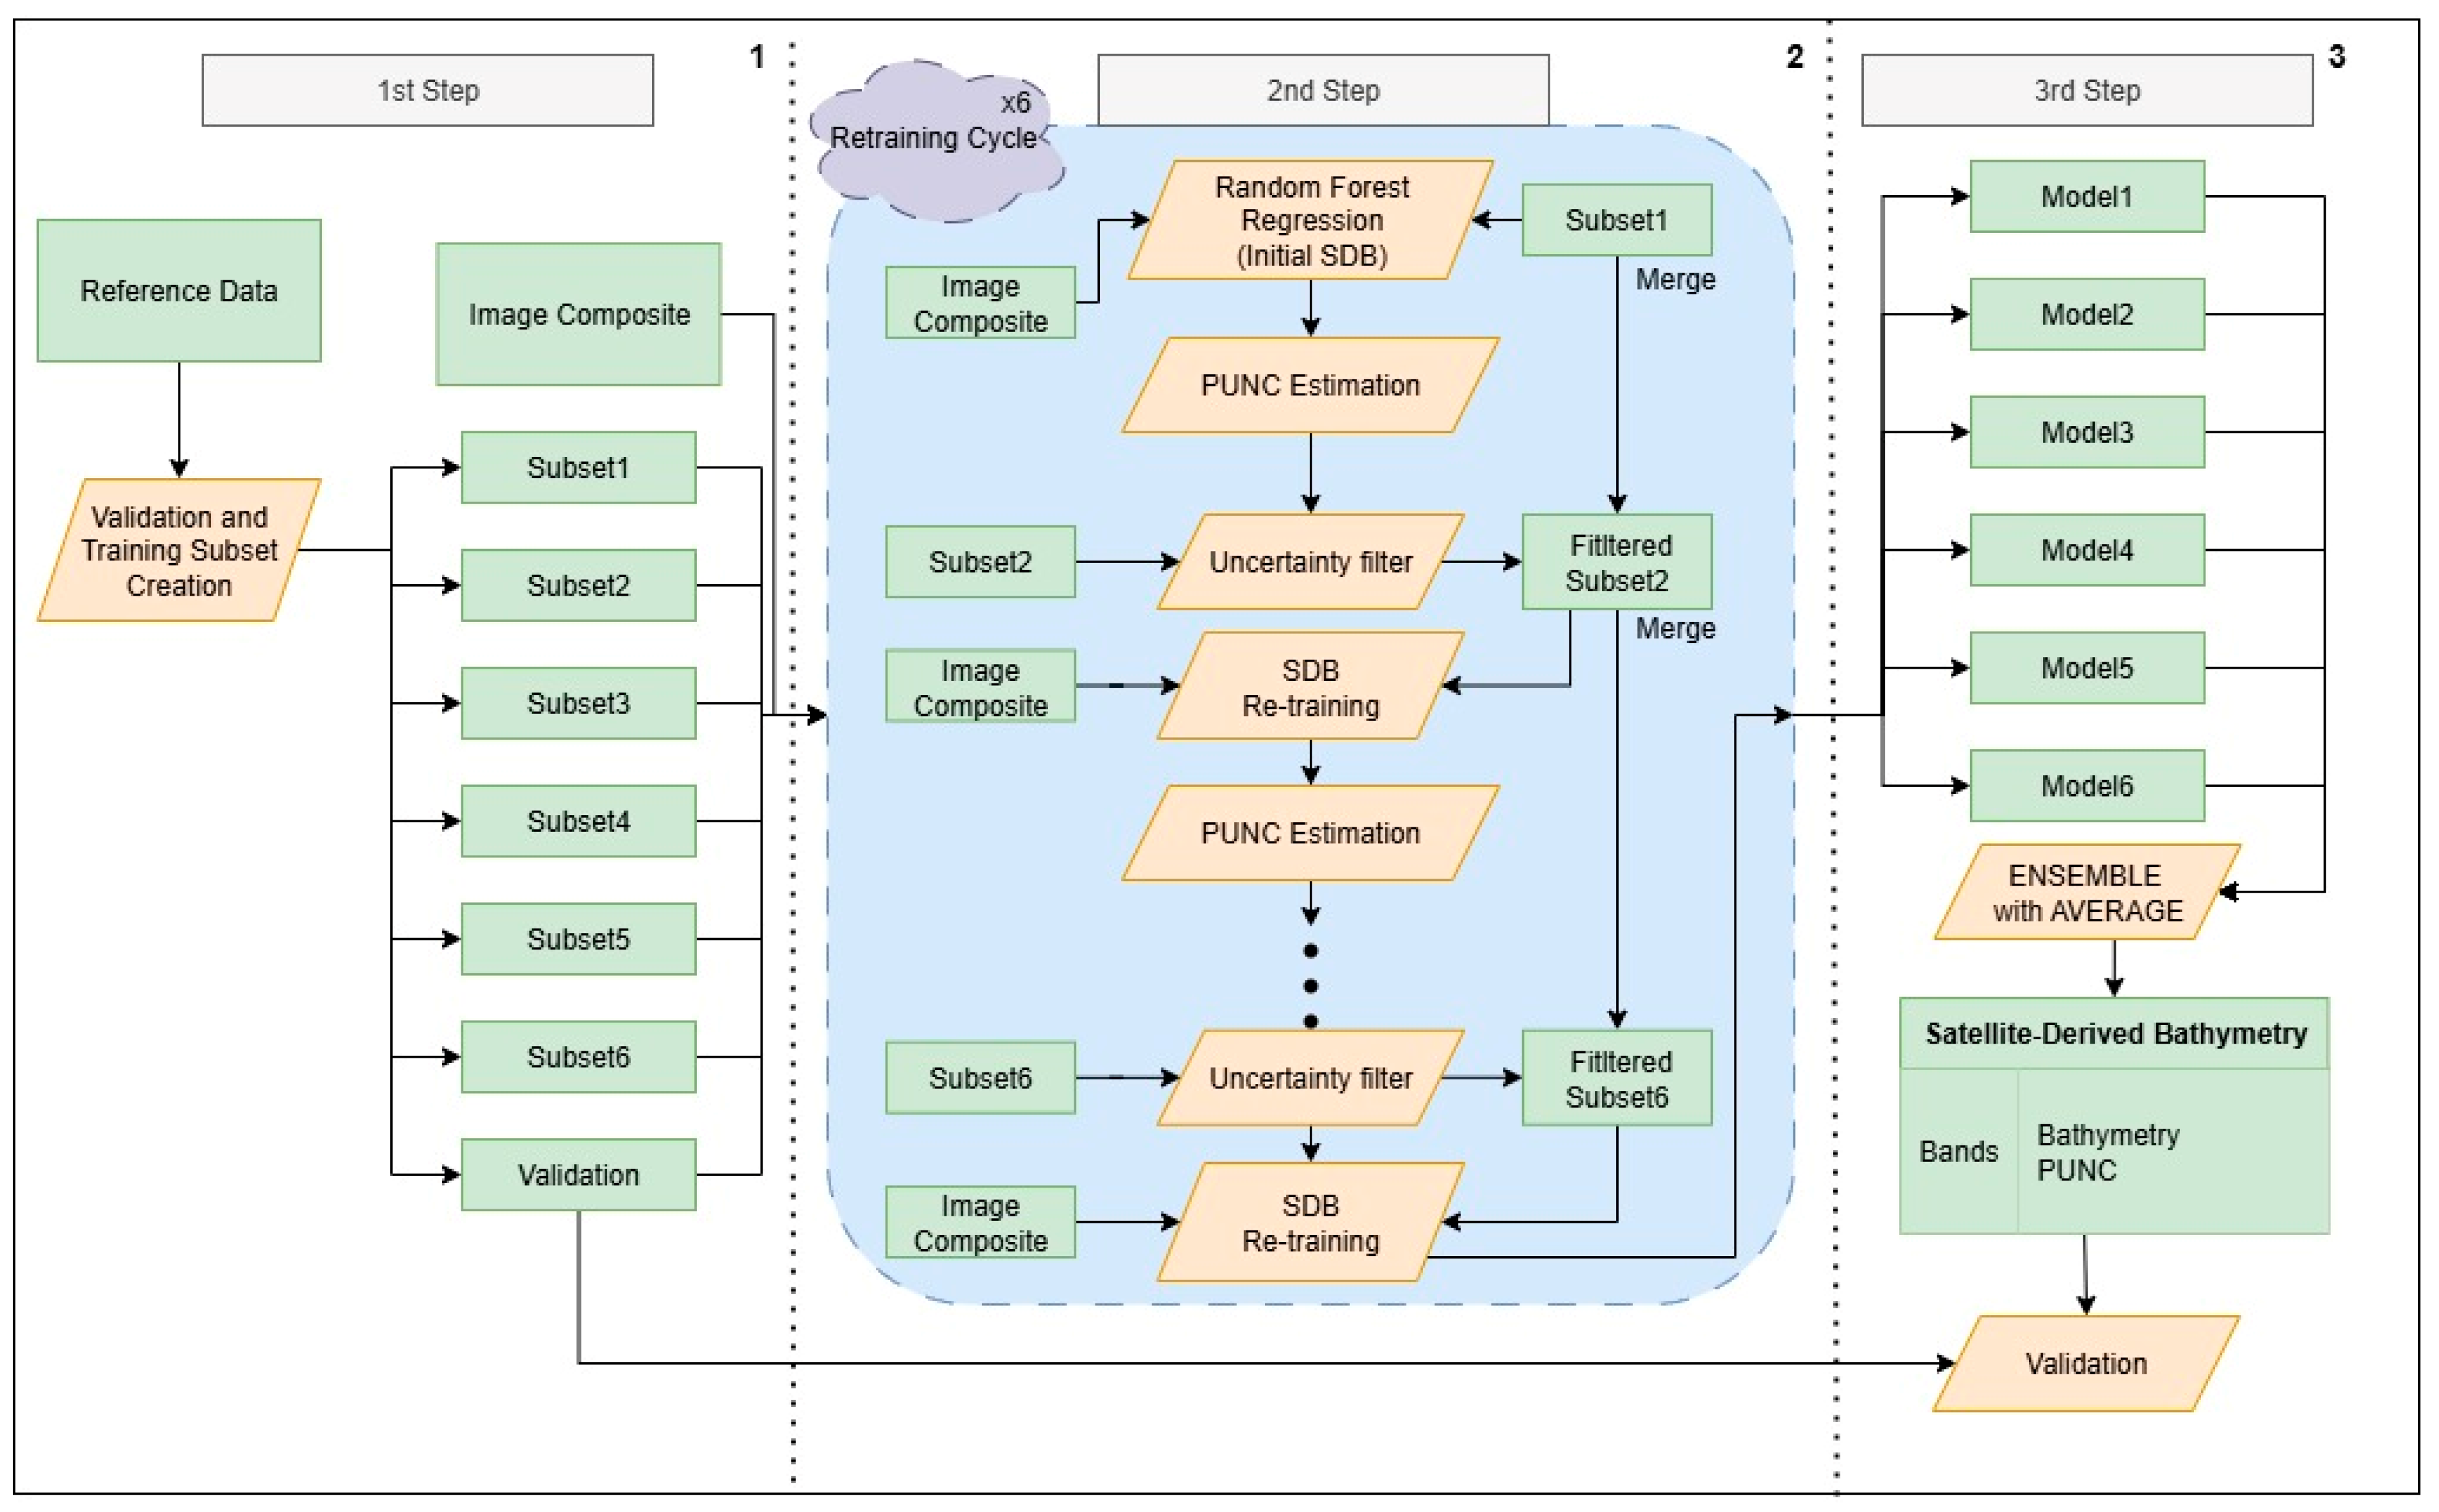
The workflow (Figure 2) of the presented study is divided into three steps. Initially, a separation of the training data occurs, and six balanced subsets are produced. With the ratio of training and validation data being 80:20, each subset possesses 15% of the original training size. In the second step, these subsets undergo an iterative loop where SDB and PUNC estimation, as well as SDB retraining processes, take place, resulting in the third step, which is the production of an ENSEMBLE-SDB product and its spatially explicit uncertainty for a bias in a given range. The estimation of bathymetry in this study occurs with the RF classifier [45], which is set through GEE to provide continuous values instead of distinct ones, which is suited mainly for classification procedures. Additionally, for replication purposes, the parameters of trees and seed for the RF function, which determine the number of RF predictions, are set to 15 and 42, respectively.

2.3.1. PUNC Estimation in ML Products with Continuous Distribution

Following Christofilakos et al. [31], the estimation of uncertainty takes place under the Bayesian perspective, in a prognostic approach by utilizing the probabilities of the ML prediction. In this study, we create an empirical probability distribution per pixel. The probability estimation for the SDB product’s prediction depth range is possible by creating and using a histogram that shows the frequency of RF prediction falling within a specific depth range. The probability is estimated by individually dividing the number of predictions in a specific depth range by their overall size. GEE’s built-in function “ee.Reducer.autoHistogram()” oversees the creation of the histogram, with the number of clusters and their widths being the only parameters provided by the user. The number of bins is set at eight or fewer in order to minimize the computation time. As shown in Figure 3, three different cluster widths are set: 0.5, 1, and 2. As the calculation of the probabilities is based on these widths, the produced probabilities show the potential of the prediction to fall in a specific depth range. The selection of these widths is due to the dynamics and the expected prediction precision of the parameter of interest. For example, if a model’s aim was to estimate the concentration of an algae bloom, the widths could be 5, 10, and 20, respectively. Thus, instead of estimating the probability of an accurate prediction like in discrete distributions, we estimate the likelihood of the prediction per depth cluster/range. The main assumption in this paper is that given the way uncertainty is calculated, it is possible to provide a quantifiable assessment of uncertainty in the SDB products in terms of probability for expected biases of 0.5, 1, and 2 m.

2.3.2. Retraining the SDB Model with Bootstrapping

The SDB and its retraining take place in the second step of the workflow through a six-fold bootstrap loop, which is fed with the six subsets as mentioned in Section 2.3 and Christofilakos et al. [31]. At the start of every new circle of the loop, a different initial subset of TD is fed to the RF function to estimate bathymetry. Then, and according to Section 2.3.1, PUNC estimation takes place and creates three PUNC composites. These composites are named PUNC05, PUNC1 and PUNC2 in compliance with their expected biases (i.e., 0.5, 1 and 2 m) and their quantifiable anticipation, PUNC. In turn, the retraining starts, where the filtering of TD is based on the values of PUNC05, PUNC1, and PUNC2 takes place. During retraining, the next subset in line is imported to the loop and is filtered in order to remove training points that have uncertainty less than 50% and 90%, thereby minimizing the noise introduced to the model [31]. These thresholds were selected based on the findings of Lang et al. [46], who showed that excluding training data with model uncertainty less than 90% can effectively reduce the overall error of the model. However, since a certain level of noise contributes to the model’s adaptability, the lower threshold of 50% was also included. Post the application of the uncertainty filter, the filtered subset merges with the subset that was used initially (or before), and retraining of RF occurs. This is repeated until all subsets are passed to the loop and a new retraining cycle starts with a different initial subset. As the number of subsets is six, the retraining cycle is also six, but the retraining process inside of these circles occurs five times because the first SDB in each of them takes place with the initial subset. At the end of all the retraining circles, the average value of their six different SDBs and PUNC estimations are calculated and passed on to the final SDB product, the ENSEMBLE-SDB. Given the number of the uncertainty thresholds, the three PUNC estimations per expected bias, and the three image composites to work on, the total produced SDBs are 21. In addition to categorization by satellite source (SEN18, PS16 and PS20), the produced ENSEMBLE-SDBs are also differentiated based on the anticipated bias for each PUNC (PUNC05, PUNC1, PUNC2) and the uncertainty threshold (unc50 and unc90) that removed TD with excess PUNC. At the end, the name for each ENSEMBLE-SDB is chosen based on its satellite source, uncertainty threshold, and PUNC for a specific bias (i.e., SEN18_unc90_PUNC2).

2.4. Accuracy Assessment

At the end of the analysis, the SDB products go through the accuracy assessment process. There, accuracy indexes of the SDB trained with the original set of training data are compared with the ones from the SDBs produced via the presented uncertainty retraining framework. In other words, this study examines the validity and the spatial error of the aforementioned SDBs according to the validation datasets, through R2 and RMSE. For a better understanding of the produced products and their spatially explicit uncertainty, further investigation takes place in the form of comparing the correlation of True Depth—PUNC, Absolute Error (AE)—PUNC, and Standard Deviation (StdDev)—PUNC distributions. A positive correlation between PUNC and StdDev of predictions is expected, as both metrics reflect the uncertainty arising from within the RF trees. High StdDev values indicate greater disagreement among individual tree predictions, which should correspond to higher PUNC values, reinforcing the interpretation of PUNC as an uncertainty indicator. The StdDev is extracted from the retraining models that were passed to the ENSEMBLE-SDB and based on their depth value prediction. Finally, by taking into consideration any changes that might occur in the PUNC distributions upon the application of the uncertainty-based retraining, Student’s t-test is performed on each ENSEMBLE-SDB to seek for significant changes in the means of the PUNC distributions [47]. The t-test was calculated by exporting the PUNC distributions from GEE and using the Statistics Kingdom web application (https://www.statskingdom.com/paired-t-test-calculator.html, accessed on 30 June 2023). The export, as well as the correlation detection, takes place by sampling the PUNC values based on the validation data (VD). The reason for that is the independent nature of the VD in relation to the TD under the context of different spatial distribution and depth value acquisition between the two datasets.

3. Results

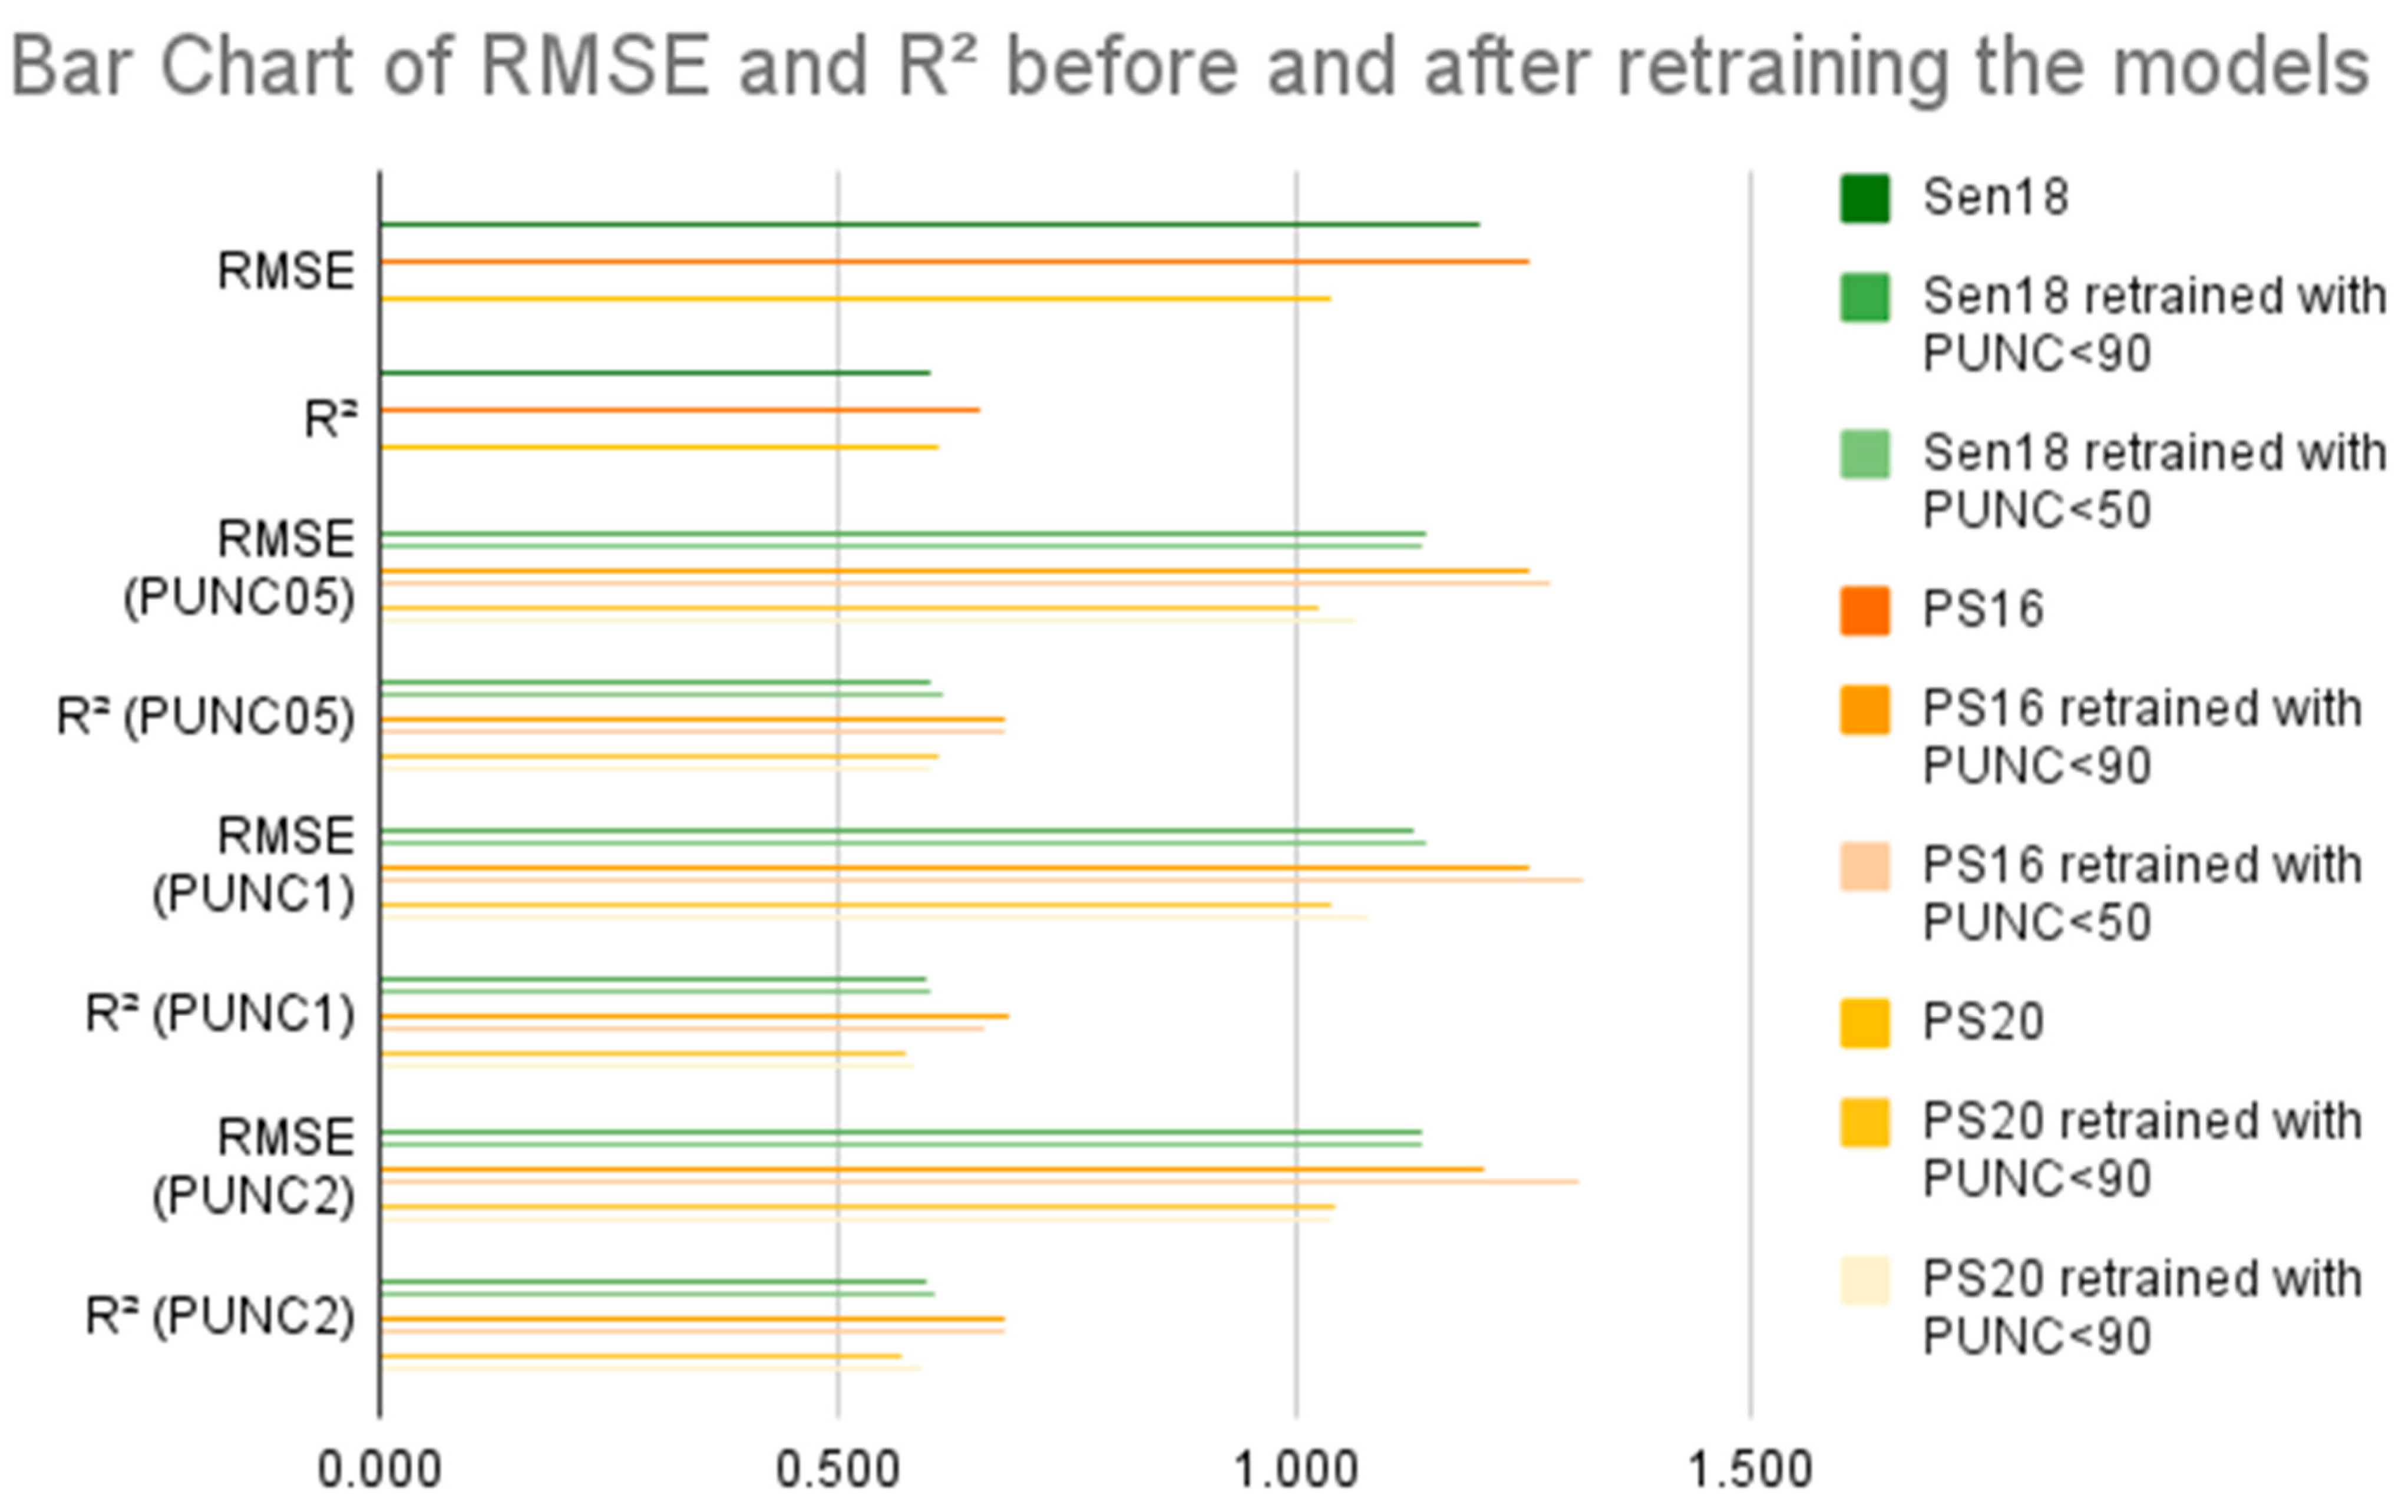
Overall, S2 and PS data have better results in 50% of the total 18 SDBs produced via the presented method and compared with a standard satellite-derived bathymetry method (Figure 4). This is based on the comparison of the regressions performed on the three initial composites (Sen18, PS16, PS20), created with different uncertainty thresholds and PUNC of different expected bias, by taking into perspective both of the accuracy indexes. On top of that, S2 data present better RMSE values with an uncertainty threshold less than 50%. Figure 5 shows the percentage of training points that were used to retrain the SDB model post the application of the presented uncertainty workflow. As indicated by the findings, when the uncertainty threshold is 90%, the amount of TD that was used for training and retraining the models ranges from 77.52% to 90.04%. On the other hand, when the uncertainty threshold is 50%, these numbers are reduced to 17.64% and 56.08%, respectively. Interestingly, the maximum differences between these two ranges are observed in retrainings with PUNC05, while the minimum differences are observed with PUNC2. It is important to emphasize here that while the proposed framework demonstrates improved performance within the study areas, its application to other regions requires retraining with site-specific reference data. This is necessary because variations in water quality (e.g., water composition, hydrodynamic system, weather conditions, etc.) across coastal environments directly affect the spectral reflectance that underpins the SDB predictions. Accordingly, the framework is designed to be transferable, but only through retraining adapted to the specific conditions of each new site.
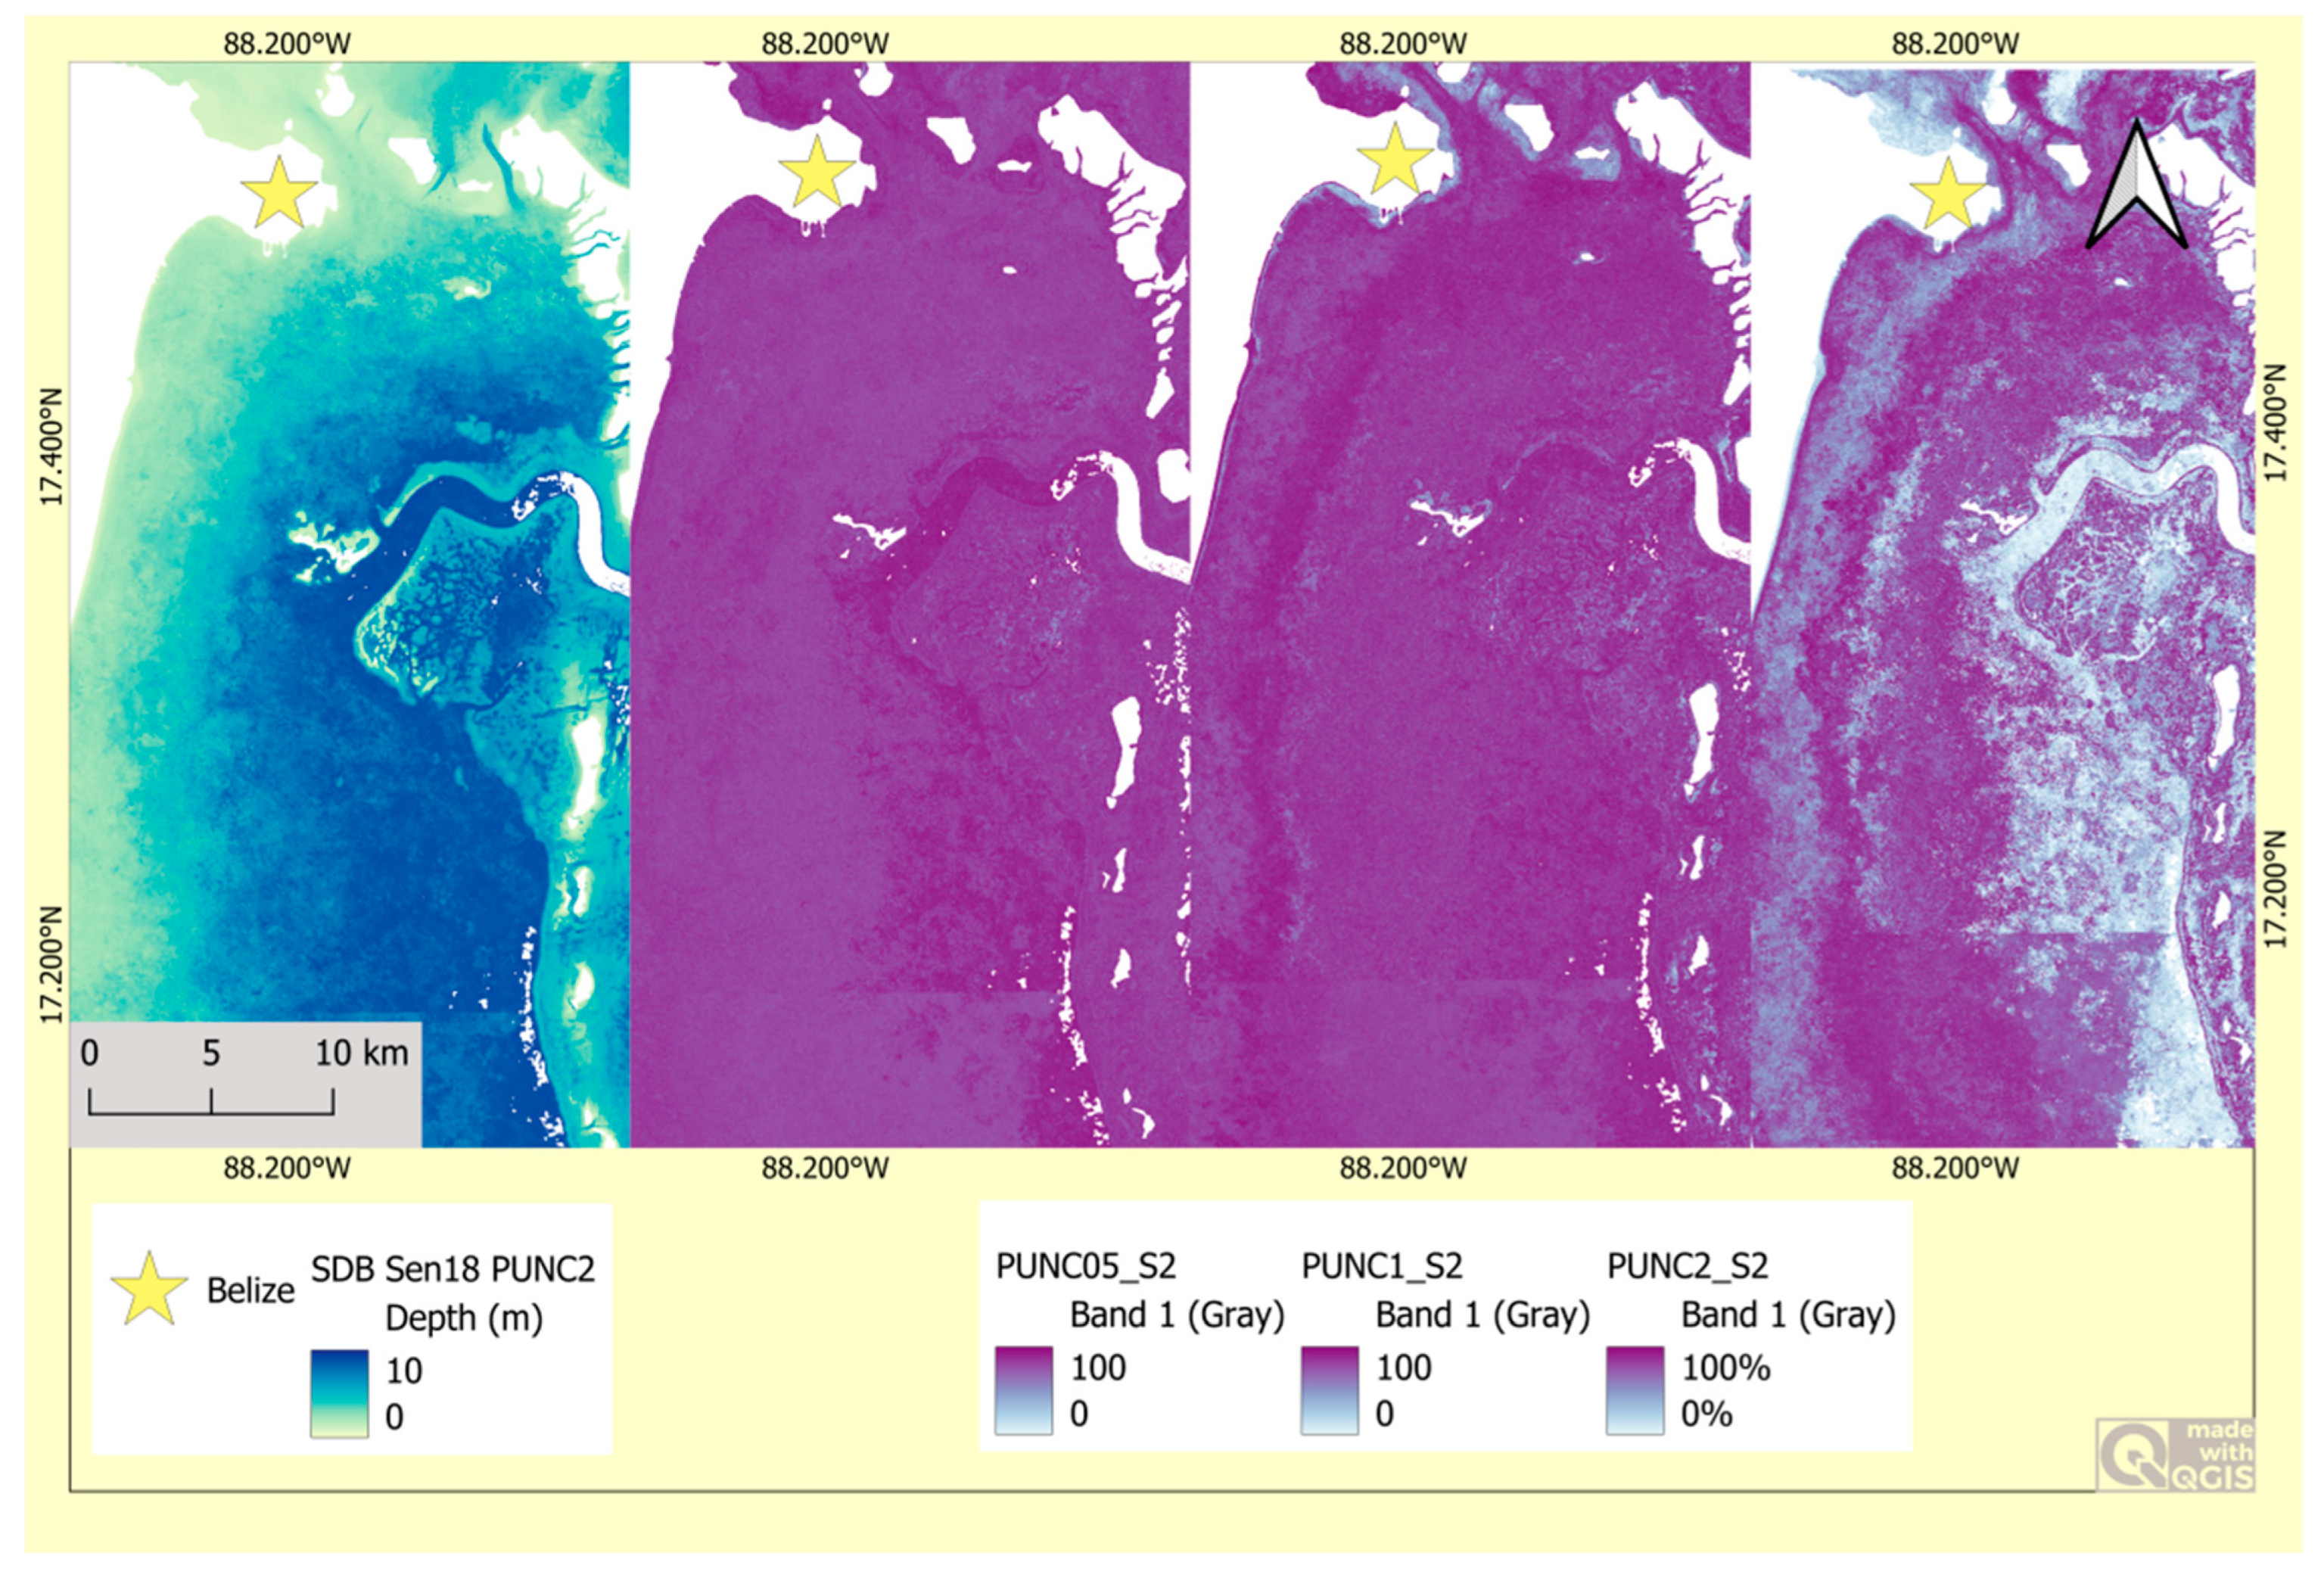
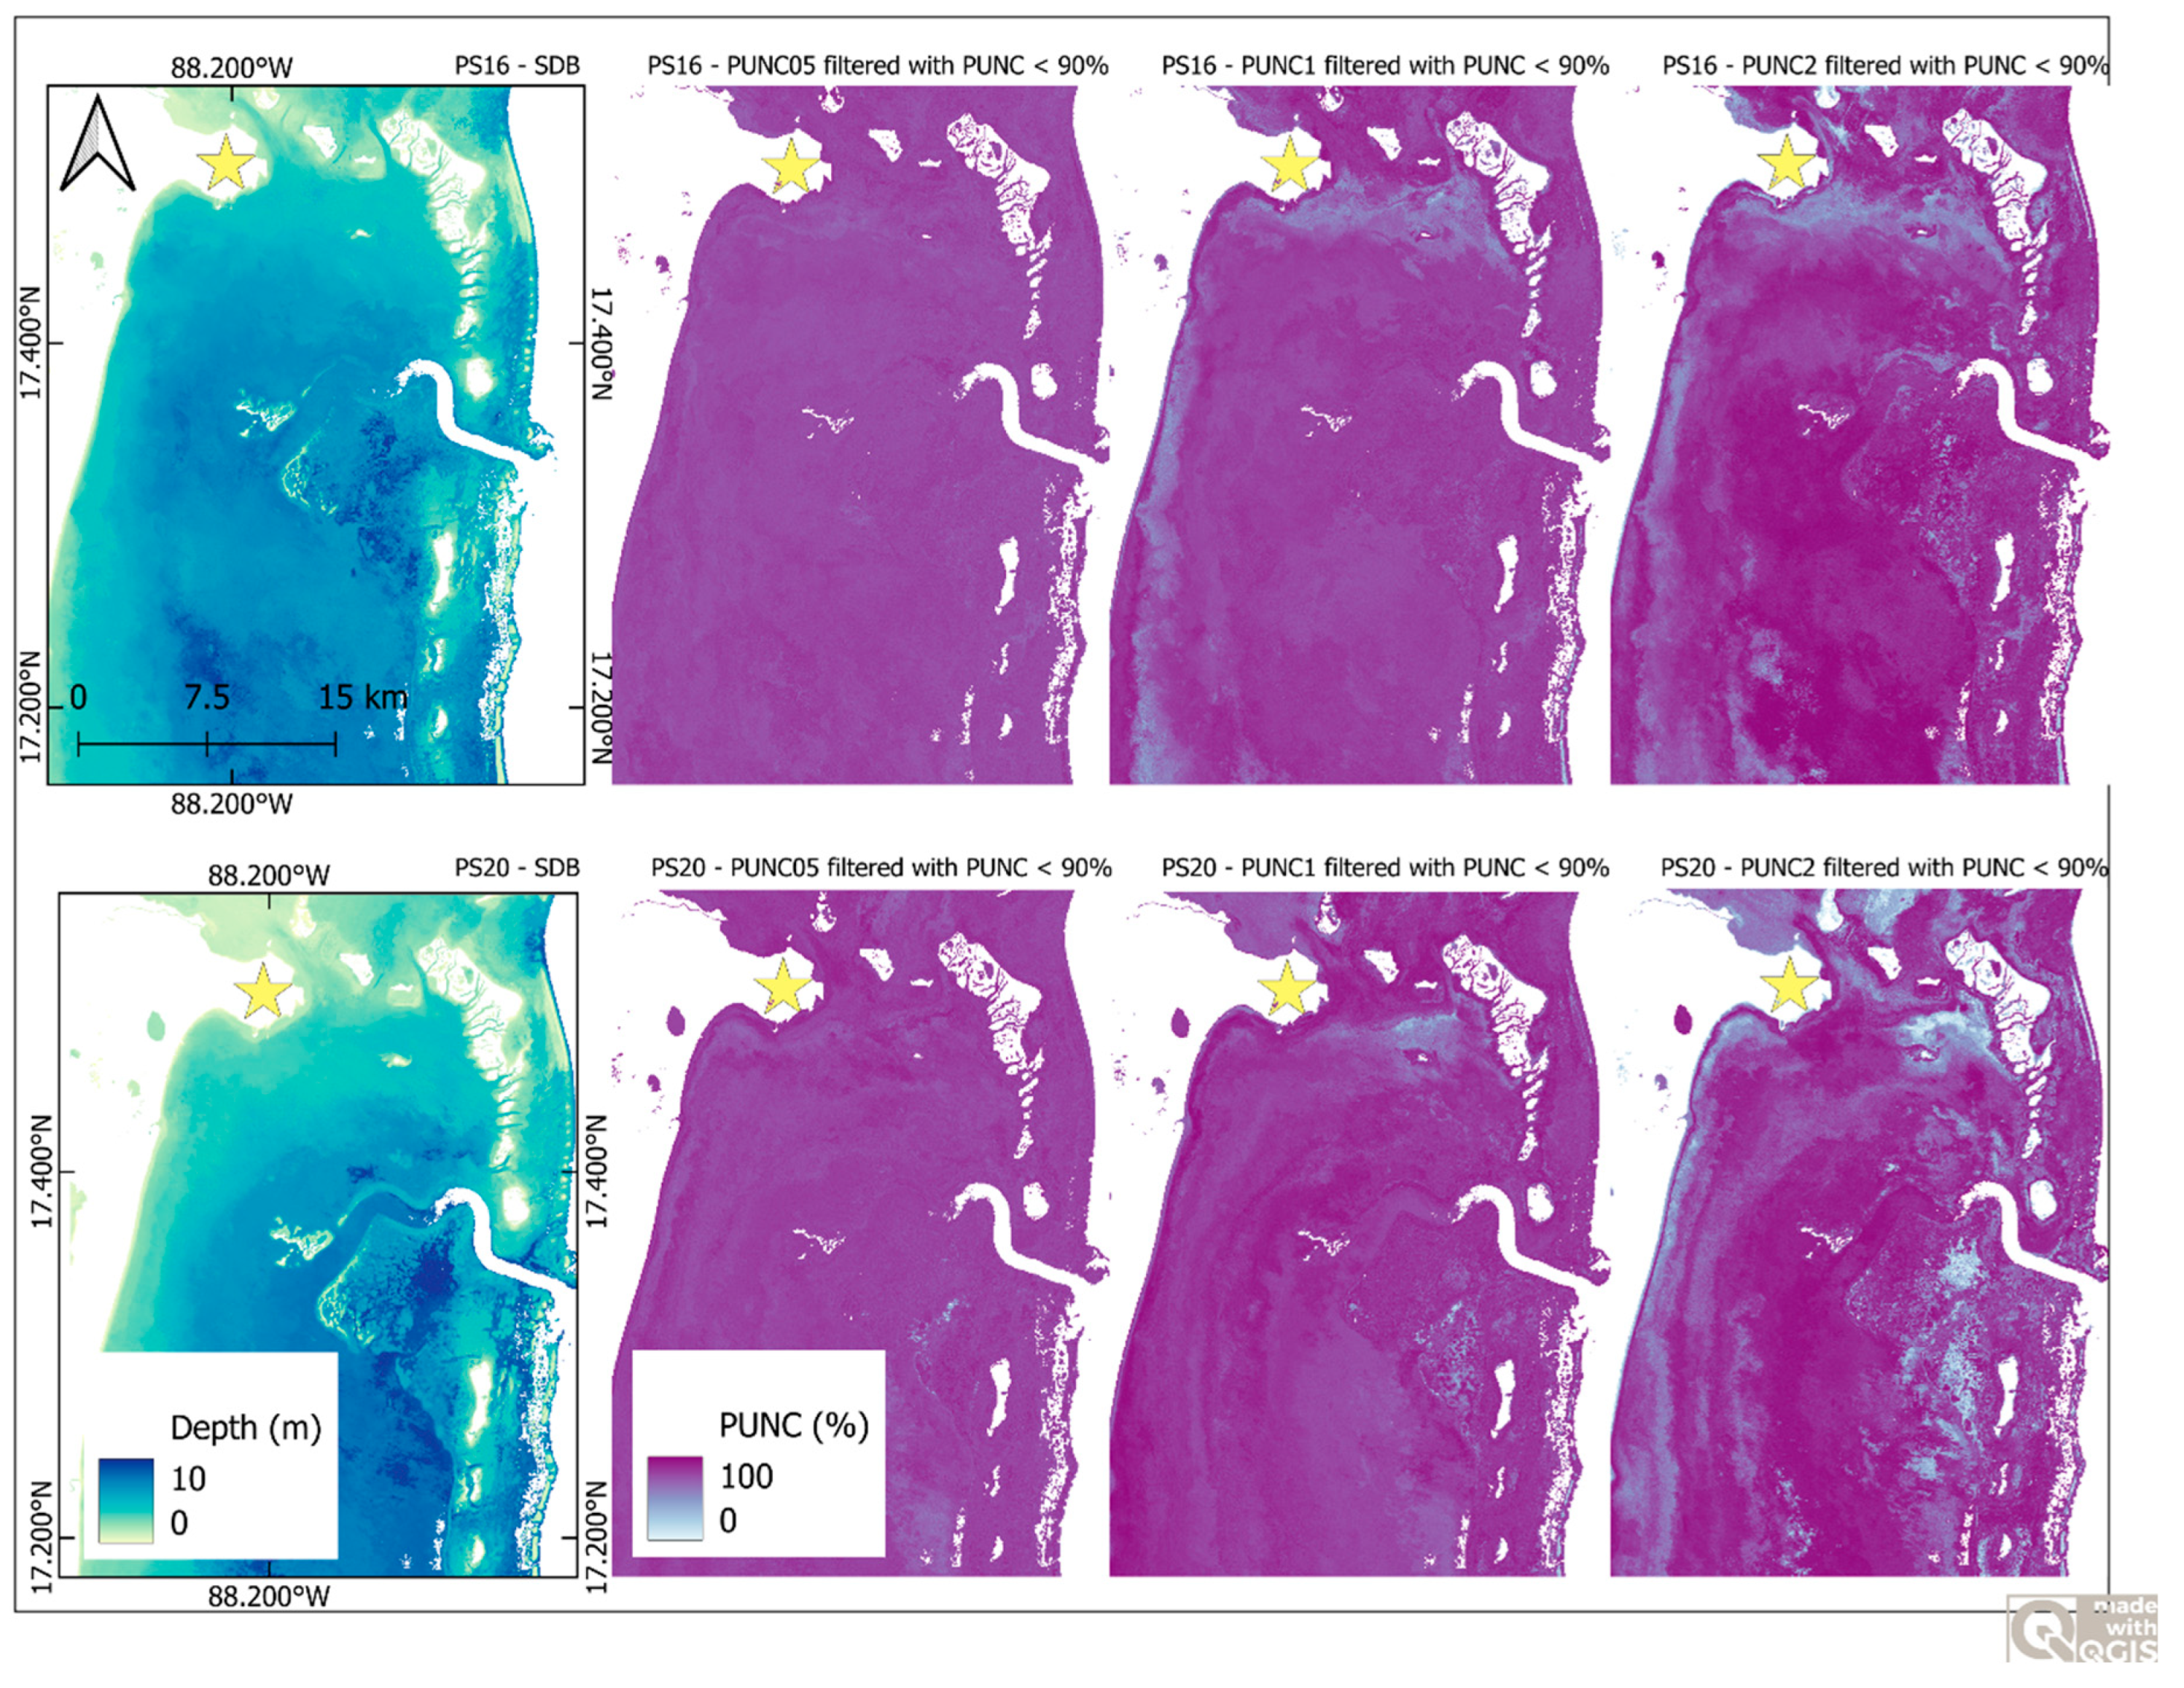
The following figures show the PUNC2 and SDB maps before and after the application of the presented method (Figure 6) and the SDB and PUNC05, PUNC1, and PUNC2 of the SEN18 (Figure 7) and the PS16 and PS20 (Figure 8) composites according to a standard RF procedure with the whole training dataset.

3.1. PUNC Values on S2 Data

Upon application of the presented method, the range of the interquartile uncertainty interval of the S2-related products, where 50% of the validation data are found, seems to be slightly shorter. Specifically, the percentage change of the PUNC2 intervals for uncertainty thresholds 90% and 50% are −4.78% and −8.67, respectively. The changes on those intervals for PUNC05 and PUNC1, on both uncertainty thresholds, vary from −31.12% to −42.1%. This less dispersed value allocation could justify the reduction in the salt and pepper noise in the PUNC layers of the products. Opposed to the maximum PUNC values that occur when the regression takes place with the whole training dataset, our products’ maximum uncertainty outliers are less than one. Regarding mean and median PUNC values (For further details, please refer to the Supplementary Material), the ones with an expected bias of two meters appear to achieve the least uncertainty scores. In particular, the difference of mean and median PUNC for the three expected biases ranges from ~20–24% to ~8–12%, respectively. The reason for that is the produced SDBs, who filtered their TD based on PUNC2 and retrained, seem to foresee better precision in terms of expected bias than the filtering and retraining with PUNC05 and PUNC1. The bigger PUNC values found in retrainings with PUNC05 and PUNC1 can be justified from a disagreement in RF’s 15 prediction trees.

3.2. PUNC Values on PS Data

Contrary to S2 data, there is no meaningful improvement of the mean and median PUNC values of the retrainings performed on PS-related products nor a pattern of lower uncertainty in specific expected bias. In both cases, the mean PUNC values seem to be slightly better for the expected bias of two meters. Upon applying the presented method, the difference of the mean value of PUNC2 from the mean values from PUNC05 and PUNC1 ranges from 0.013 to 0.091. Meanwhile, the median PUNC2 values are slightly bigger than the corresponding PUNC05 and PUNC1 values, as their differences range from 0.01 to 0.824. However, in PS data the range of improvement for mean and median upon applying the presented workflow is smaller than the range in SDBs produced by S2 data. Maximum uncertainty with a value less than one is achieved for all the products but one. Moreover, as in S2 data, there is also a reduction in the uncertainty range. Interestingly, compared with the S2 results, the reduction in the uncertainty range is more profound in PS data, especially at the smaller values of the distributions. In addition, the skewness of PUNC values in PS data is smaller than the S2 one. The biggest difference in PUNC skewness between PS and S2 data is observed with PUNC2.

3.3. T-Test and Observed Correlation Between Absolute Error, True Depth, and Standard Deviation with PUNC

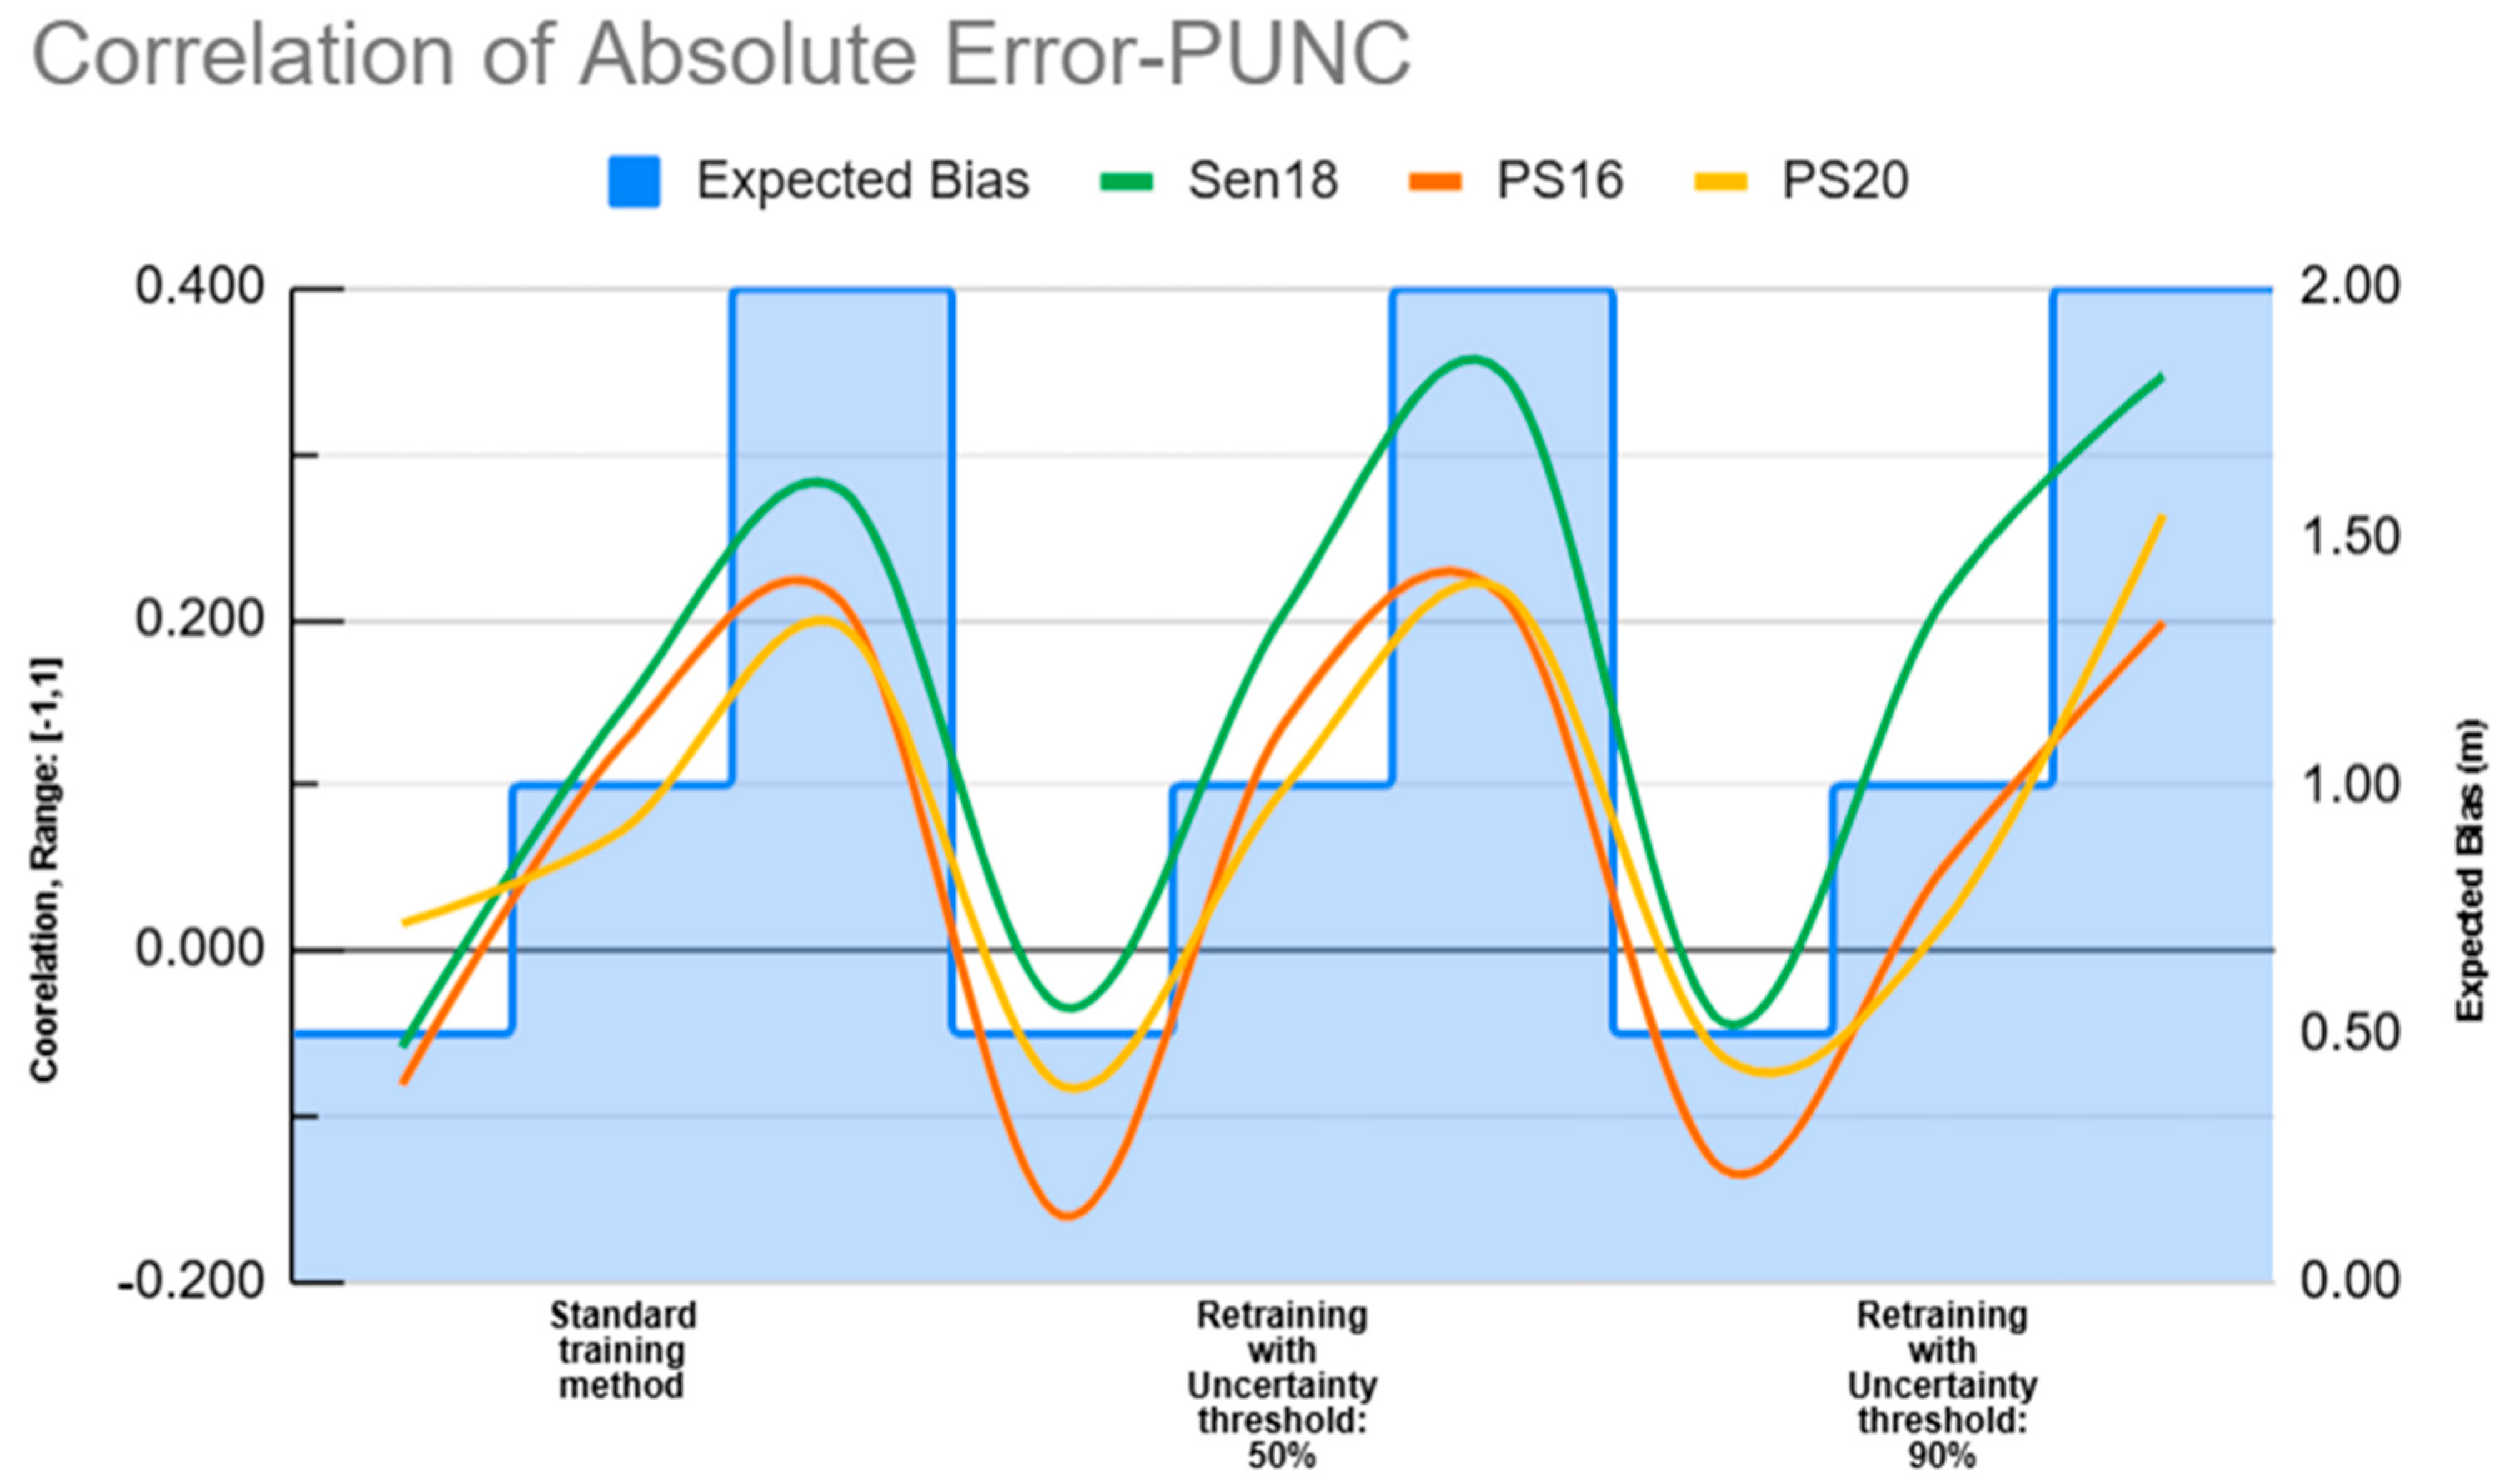
Interestingly, and as shown in Figure 9, SEN18-SDB products retrained with PUNC2 and under both uncertainty thresholds (i.e., SDBs: “Sen18_unc50_PUNC2” and “Sen18_unc90_PUNC2”) are the only products that showcase a low correlation (i.e., 0.3 < 0.349 < 0.5 and 0.3 < 0.347 < 0.5) between Absolute Error (AE) and PUNC. Detailed comparisons of PUNC and AE based on the validation data are provided in the Supplementary Material. The standard RF SDB performed with SEN18 and all the TD (i.e., SDB: Sen18_allData_PUNC2) shows negligible correlation, as it has a coefficient value of 0.278. As far as the t-test is concerned, there were two cases of PS-related products and one from S2, whose PUNC values were reduced significantly. These cases are “PS16_unc50_PUNC2” (p-value: 0.001 < 0.006 < 0.01), “PS20_unc50_PUNC1” (p-value: 0.001 < 0.003 < 0.01), and “Sen18_unc90_PUNC2” (p-value: 0.01 < 0.04 < 0.05). Regardless of EO data or uncertainty thresholds, such statistically significant reductions in PUNC values do not occur when the retraining is based on PUNC05. Furthermore, among S2 and PS data, the latter prevail during retraining with an uncertainty threshold of 90% as they achieved a bigger percentage of TD that passed the uncertainty filter. On the contrary, with an uncertainty threshold of 50%, the S2 data utilize the TD in the higher percentage of 56.08%. Suggesting thus that, given the bigger portion of TD with uncertainty threshold 50%, the SEN18 composite produced ENSEMBLE-SDBs with higher precision compared to PS16 and PS20, whose maximum percentages of utilized TD are below 50%.
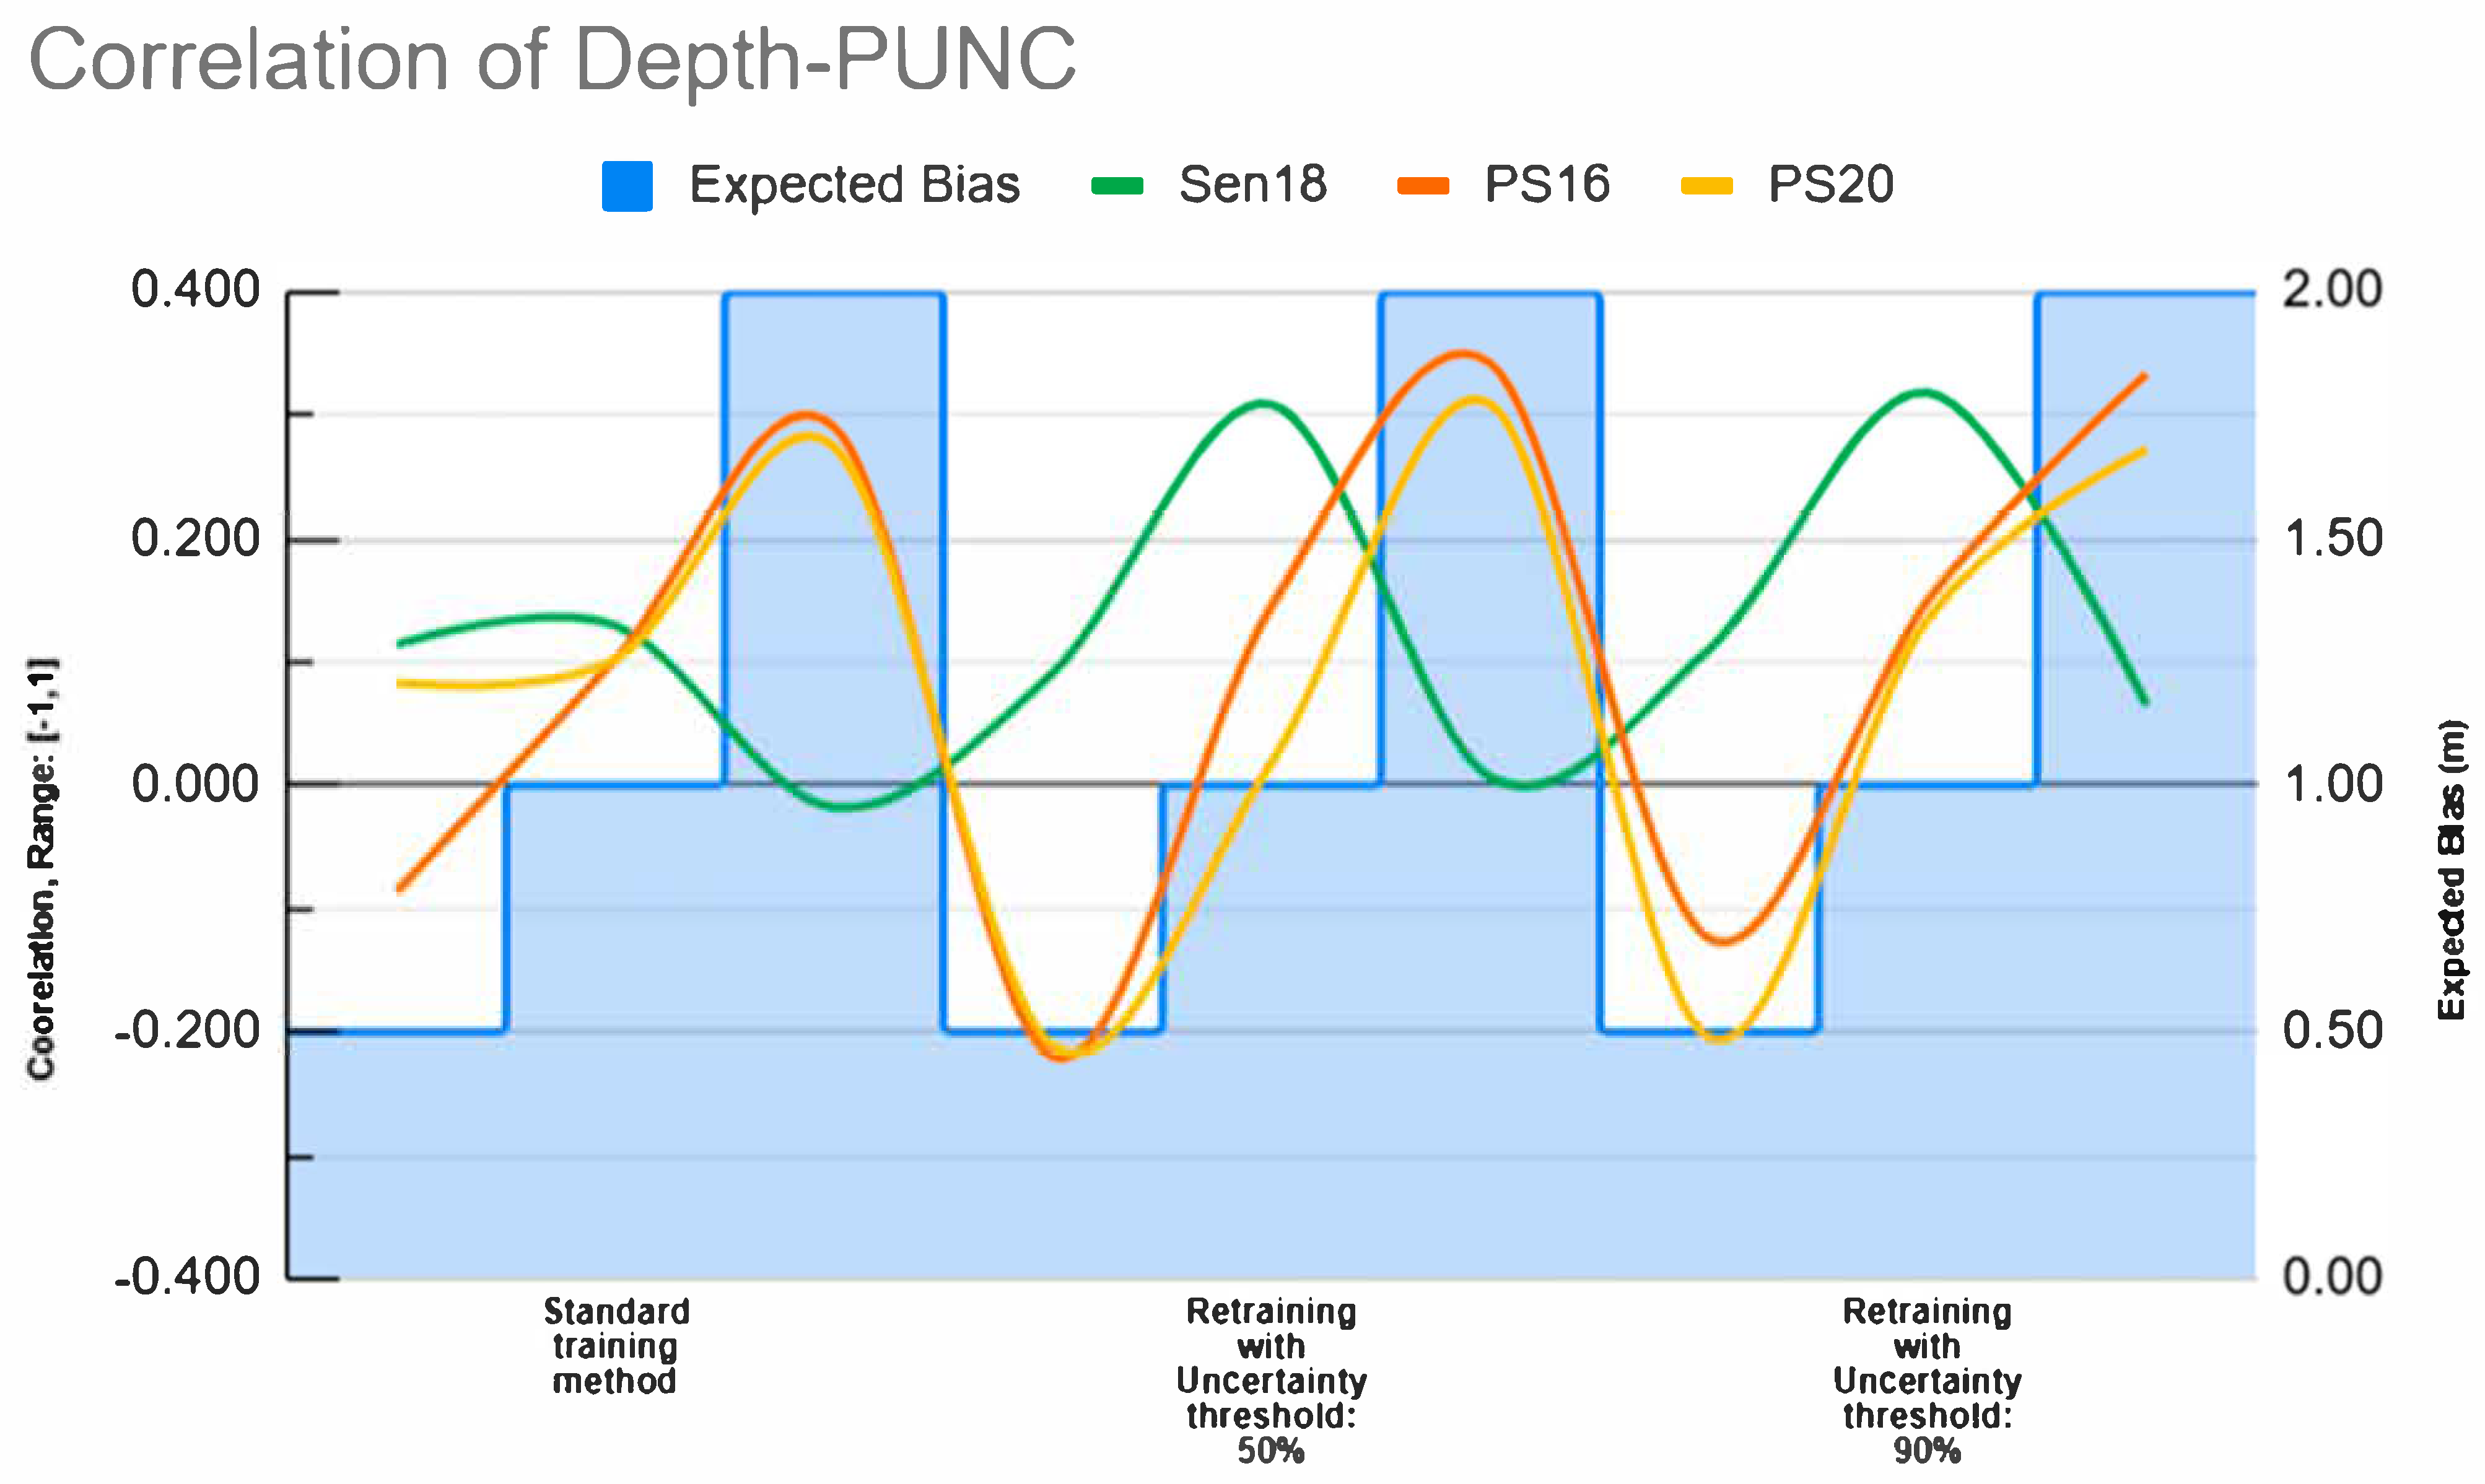
Turning to the correlation between true depth and PUNC (Figure 10), our findings indicate a low correlation for the PS-related SDBs with retraining performed with PUNC2. The only exceptions to that are the ENSEMBLE-SDBs “PS20_unc90_PUNC2” and “PS20_allData_PUNC2”, which manifest negligible correlation. Conversely, PUNC2 values of SEN18-SDBs are very close to zero, indicating no linear relationship for depth and PUNC2 in all SEN18-related SDBs. Additionally, only “SEN18_unc50_PUNC1” and “SEN18_unc90_PUNC1” exhibit a weak correlation between depth and PUNC1.
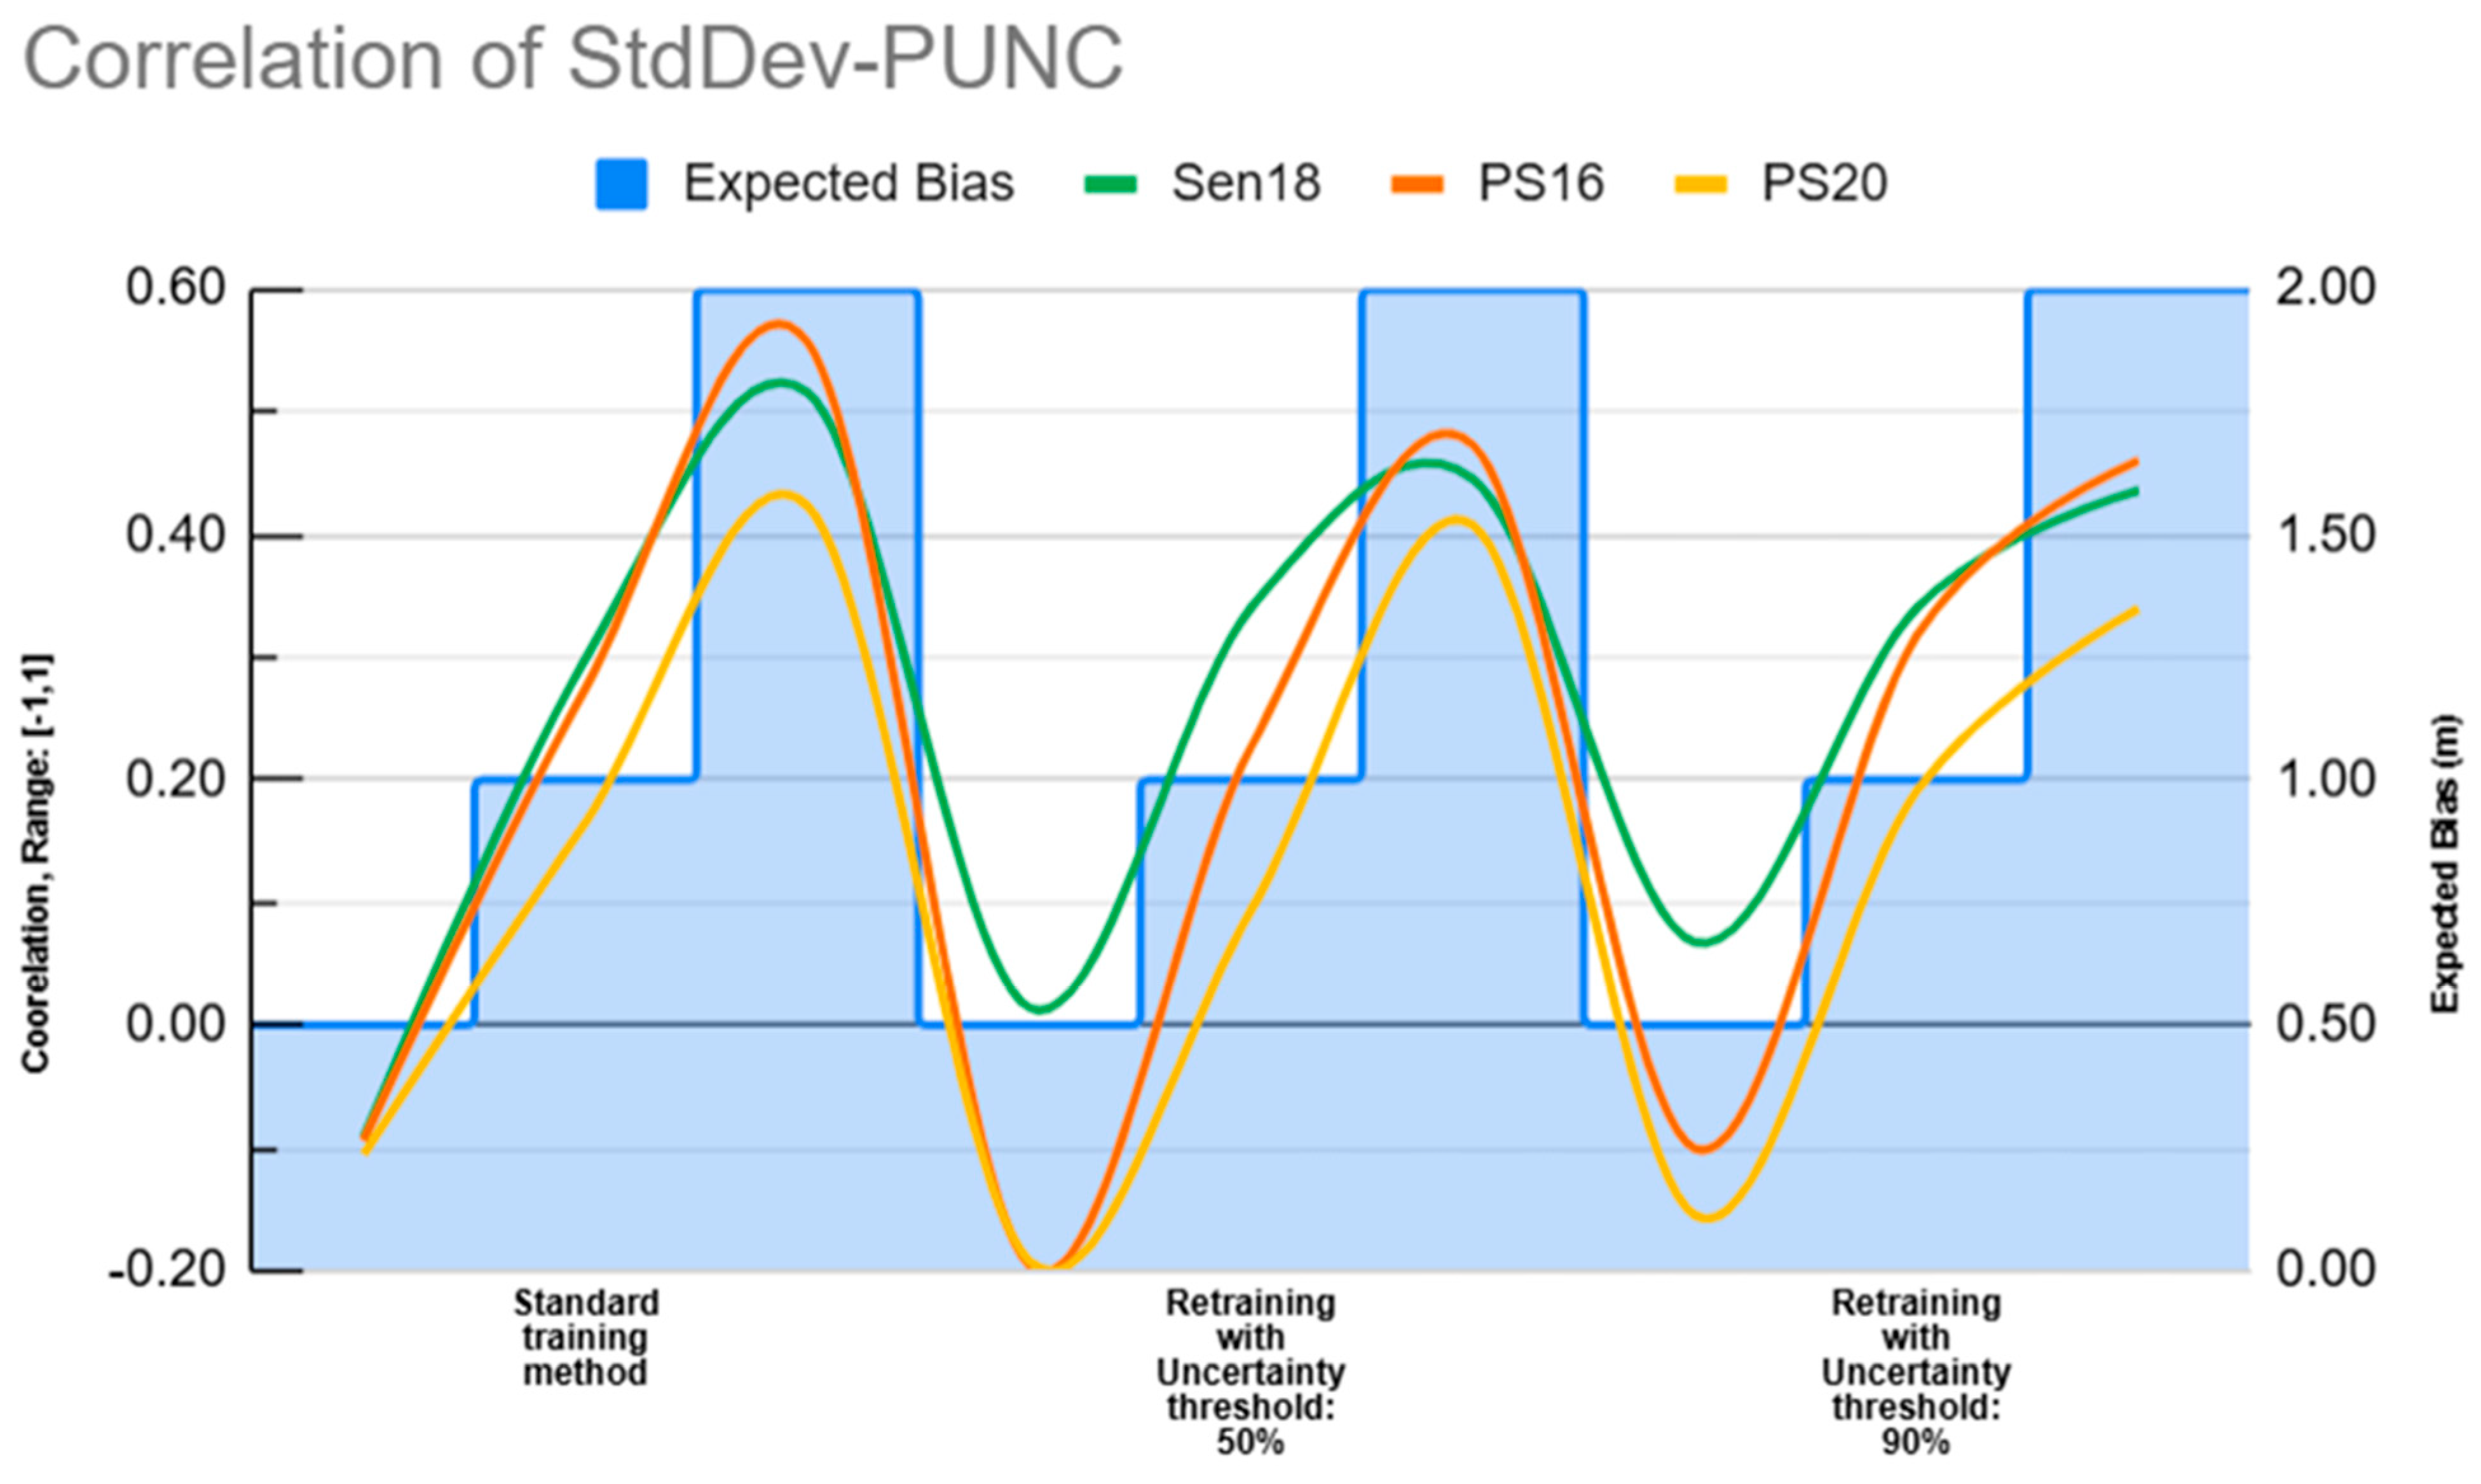
This analysis also found evidence on the correlation of PUNC and the StdDev of the depth prediction coming from the ENSEMBLE SDB models. Particularly, PUNC2 demonstrated the strongest correlation, as the coefficient values are in the range of 0.340 and 0.557. The lowest correlation among PUNC2-related products (0.3 < 0.340 < 0.5) is found at the ENSEMBLE-SDB “PS20_unc90_PUNC2”, and the strongest (0.5 < 0.557 < 0.7) at the “Sen18_PUNC2”, where the standard training method was applied. In general, the correlations of PUNC2 with StdDev are the highest with the standard training method with all three image composites (i.e., Sen18, PS16, and PS20), rather than the presented retraining framework via uncertainty analysis. Nevertheless, moderate correlations are also observed upon applying the presented method (Figure 11), with the lowest (0.3 < 0.340 < 0.5) belonging to “PS20_unc90_PUNC2” and the highest (0.3 < 0.473 < 0.5) to “PS16_unc50_PUNC2”. In addition, the presented method achieved a better correlation of PUNC1 with StdDev in three out of the six cases, with two of them coming from the uncertainty threshold of 90%. These cases are “Sen18_unc90_PUNC1”, “PS16_unc90_PUNC1”, and “Sen18_unc50_PUNC1”, while their respective coefficients are 0.340, 0.317, and 0.340.

4. Discussion

The findings of this study support the notion of a transferable, cloud-based, and data-agnostic approach for the production of a spatially explicit uncertainty layer of information, which is not only able to visualize the PUNC of an ML-produced SDB but also to enable the retraining of the model and improve its accuracy and precision. The transferability of the method refers to the two satellite sources of the input data (SEN18, PS16, and PS20), while the cloud-based part refers to the GEE platform, where this analysis of a total area of ~7000 km2 and size of ~95 GB has been performed. That size number refers only to the 21 SDB and three ENSEMBLE-SDB models produced during Section 2.3.2, the calculation of DIV, HUE, VALUE, and object bands for the input data (SEN18, PS16, PS20) during Section 2.2, but not to the creation of the initial composites with S2 and PS data. Regarding the best achieved accuracy, it belongs to S2 data and, more specifically, to the product of retraining based on PUNC2 and an uncertainty threshold during the filtering of TD of 90%. According to the validation analysis, even if the R2 of that ENSEMBLE-SDB is reduced by 0.009, its RMSE, mean and median PUNC indexes perform better by 0.064 m, 0.034, and 0.063, respectively. Finally, the R2, RMSE, and average PUNC values for that product are 0.596, 1.140 m, and 0.565, respectively.

4.1. Usage and Challenges of PUNC

4.1.1. Usage of PUNC

On the whole, the presented method seems to be able to cast a new light, firstly on the understanding of the spatially explicit accuracy in a SDB, and secondly on its optimization and downstream applications. This thus fulfills the need for reliable uncertainty information for critical evaluation of the effectiveness of an analysis [29] and, more importantly, introduces a scale-independent metric for comparing the uncertainty of the model on the pixel level [29]. That is happening due to (i) the slightly (change in the second decimal place) superior RMSE and R2 scores achieved with the presented approach and (ii) the produced PUNC metrics resulting in (iii) a better comprehension of the noise introduced to the SDB model by the training data, providing thus (iv) a criterion for optimum training data selection according to SDBs’ PUNC values. Following Chenier et al. [30], this approach offers a robust form of validation for assessing the accuracy of SDB estimates across a wider geographic area. In addition to providing quantifiable uncertainty measures, this approach allows for the evaluation of the expected bias magnitude. Our findings on the correlation of PUNC with StdDev, Depth, and AE support that claim. With the inclusion of two different satellite data sources and the manageable data size (~95 GB) relative to the national extent of Belize, the scalability and transferability of the PUNC estimation method appear promising. However, further research and repeatable proof of concept across different spatial and temporal scales, as well as different satellite and reference data input, are necessary to confirm its applicability in diverse contexts. Furthermore, with reference to the t-test findings and the downgrade (even if it is with small significance) of PUNC values for expected biases of one and two meters, it seems that retraining based on PUNC of expected bias with big magnitude can potentially optimize the precision of the ML product. That suggestion requires further investigation due to the fact that here, we only investigate the changes on SDB products, and depending on the variable of interest, the applied method, and the scale of the data, the definition of big and small bias might differ.

4.1.2. Uncertainties of PUNC

As PUNC aims to be a measure of the validity of an ML prediction, it is important to be aware of the uncertainties of the methodology in order to highlight them and name solutions and/or possible drawbacks for future researchers. The PUNC of the SDB, and therefore the noise of the model, is influenced by a number of drivers like technological (e.g., sensor noises) and environmental (e.g., back-scattering of water column, air–water interactions and seabed influence) interferences [29], but also from the ML parameterizing (e.g., complexity of model, size of reference dataset, etc.). Starting with the low correlation of the AE and PUNC distributions, a possible justification might be the noise level of the image composites that were used to model the ENSEMBLE-SDBs. This is based on the fact that the retraining process and removal of TD with high PUNC values (according to the decided thresholds, 50% and 90%) revolve exclusively around the spectral distribution of the TD and not of the image. The reasoning behind that is the volume of preprocessing (Section 2.2) that the image endured during the feature engineering (i.e., multi-temporal composite creation, estimation of Hue, Value, DIV, and object bands production) is related to high uncertainty values due to the complexity level of the image [48]. Based on our findings and thanks to its prognostic capabilities (as explained in Section 2.3.1), elevated PUNC values can be explained in a percentage by the inherent data noise [49] and utilized by the presented workflow to optimize the accuracy and precision, yet applied research and solid arguments are needed to fortify that. Without a targeted experiment to search for the changes on the PUNC distribution with different combinations of feature engineering, like a comparison between multi-temporal and single-day composites or pixel-based and object-based bands, that assumption remains a hypothesis. On top of that, the spectral resolution of the satellite data shall also be taken under consideration, as according to our findings, PS-related PUNC distributions were unable to achieve a correlation between them and the AE for all cases of PUNC (i.e., PUNC05, PUNC1, PUNC2, and with both uncertainty thresholds).
Turning to the results of the correlation between depth and PUNC distributions (Section 3.3), there is a clear distinction between them, with that being related to the expected bias (i.e., 0.5, 1, and 2 m) that PUNC is estimated for and the sources of EO data that were used. Once the SEN18 composite was retrained with the presented uncertainty workflow, it showed a correlation of small significance when the PUNC was estimated based on a one-meter bias (i.e., PUNC1), while on the contrary, only the PS16 out of the PS composites achieved a correlation (of small significance) with the PUNC estimated for the anticipation of a two-meter bias (i.e., PUNC2). The reasons for that distinction on the PS-related distributions might be the different temporal data and approaches that were used to create the image composites PS16 and PS20 (Section 2.2). In addition, the different acquisition periods and therefore different spectral distributions due to pertinent atmospheric and environmental conditions are another crucial dissimilarity between PS16 and PS20; the type of data that these composites consist of is also different. The dissimilarity is the origin of the composites because PS16 is developed from eight NICFI basemaps, while PS20 is developed from 29 PSs. A total of 28 out of these 29 mosaics are monthly PlanetScope mosaics, with the remaining being a six-month NICFI basemap. Thus, there is a limitation of PS20 compared to PS16, and that is to achieve a correlation, even of small significance, between the Depth—PUNC distributions. A limitation that can be attributed to the differences and dissimilarities of PS16 and PS20. Turning again to Sen18’s observed small correlation between the Depth and PUNC values, it might be related to S2’s greater water column penetration properties compared to PS’s [50], resulting in an SDB with better precision and thus explaining the minimization of PUNC2 and the inflation of PUNC1. After all, the mean PUNC2 value is constantly smaller than the PUNC1 in all the ENSEMBLE-SDB, an anticipated event at a certain point due to the known precision of RF in coastal remote sensing studies.
As far as Student’s test is concerned, PS data are more prone to the presented workflow, as they present the most cases of proving the hypothesis that a reduction to the mean PUNC is occurring upon applying the workflow. This case concerns exclusively the PUNC categories of PUNC1 and PUNC2. On the other hand, upon applying retraining with TD filtered based on PUNC05, the resulting ENSEMBLE-PUNC05 values get elevated in all ENSEMBLE-SDBs from both satellite sensors (i.e., S2 and PS), but one. PUNC05 refers to a quantifiable and prognostic measurement for the possible bias of half a meter. A bias of half a meter, though, is not considered a crucial bias within the context of EO-produced SDBs and can be explained by, but is not limited to, the atmospheric conditions (haze, clouds, etc.) and the texture and variability of the sea surface under which the SDB is modeled. Another reason for PUNC05’s increase is the inability of the workframe to properly remove TD with excessive PUNC05, thus mitigating the noise down to the training of RF and resulting in such high values. In addition, a bias so small can be attributed to ML and model limitations and inadequate training samples, but also and more importantly, to the underprediction due to the backscattering effect of the water column [51]. Rationally, this phenomenon will be more dominant in larger depths where the benthic reflection is influenced by a bigger water column and thus larger light attenuation.

4.2. Future Prospects

Starting from the last point of Section 4.1.2, the coarseness of the histograms that PUNC estimation is based on (Section 2.3.1) plays the role of the fundamental parameter for the magnitude of anticipated bias for which PUNC aims to provide a quantifiable and spatially explicit prognostic estimation/anticipation measurement. Scientists and researchers who may apply the presented workflow in their respective studies should consider the dynamics of their variable of interest and parameterize the histogram’s cluster widths accordingly. For example, in the case of using RF and EO data for Sea-Surface Temperature (SST) quantification and monitoring [52], the corresponding parameterization of the histogram’s cluster widths should change due to water’s thermophysical properties, resulting in a non-dynamic nature of SST distribution and therefore a need for broader biases such as PUNC for an expected bias of five and 10 degrees Celsius. Another aspect that needs to be assessed is the spatial and spectral resolution of the EO data and, in general, the feature engineering chain of the input data due to their inherent noise, as it was explained in the beginning of Section 4.1.2. Therefore, and given the slightly observed reductions in RMSE, in future work, we will polish the findings of this study and attempt to identify how, and to what extent, different features (e.g., pixel-based vs. object-based bands), data creation and aggregation (single-day vs. multi-temporal composite), and atmospheric noise (atmospheric correction method) can influence the PUNC estimation, as they certainly influence the electromagnetic spectrum of the EO readings. Last but not least, given that the presented method is able to highlight regions where the ML struggles to derive results (high uncertainty means a serious disagreement within the trees of RF), we are looking forward to studies that would use that information for better planning and sampling of in situ reference data. While the current study focuses on Random Forest, future research could investigate whether similar uncertainty estimation approaches are applicable to other ML models, such as Support Vector Machines or K-Nearest Neighbors, provided they are adapted to output prediction probabilities, which are necessary for uncertainty assessment.

5. Conclusions

In conclusion, this study demonstrates the potential of spatially explicit uncertainty estimation using a data-driven approach in improving the accuracy and precision of SDB outputs. We show that the estimation of a prognostic PUNC is possible by producing an empirical probability function created by assessing GEE’s RF inner predictions. By utilizing PUNC, this study demonstrates the usage of PUNC for proper training data selection in the context of removing the ones prone to bias, resulting in the reduction in the noise introduced to the model. A noise that is considered to have both environmental and technological origin as explained in Section 4.1.2, and is speculated to be related, within an undefined percentage, to the feature engineering process that was followed.
In addition, the improvements in accuracy, the usage of PUNC information is also indicative due to the observed low correlation between the absolute errors of the SDB prediction and the PUNC values for an expected bias of two, but unfortunately only for Sen18. Furthermore, PS data are more sensitive to our approach due to the shorter PUNC boxplots (For further details, please refer to the Supplementary Material) after the retraining. In contrast to PS data, PUNC values coming from S2 data show a bigger variation in values among the PUNC distribution and also an extension of the first quarter values towards lower ones.
Looking into the future, we are preparing the next step of exploring PUNC’s usage with different EO data, feature engineering, and study sites in order to solidify and better document its proof of concept. This upgraded proof of concept and prototype can enable improved and transparent monitoring of coastal ecosystems, their underlying bathymetry and geomorphology, and in turn, thus, their better protection, conservation and restoration.

Supplementary Materials

The following supporting information can be downloaded at: https://www.mdpi.com/article/10.3390/rs17173060/s1.

Author Contributions

Conceptualization, S.C. (Spyridon Christofilakos); data curation, S.C. (Spyridon Christofilakos), A.P.P., A.C.R., S.C. (Stephen Carpenter) and N.T.; funding acquisition, D.T. and P.R.; investigation, S.C. (Spyridon Christofilakos); methodology, S.C. (Spyridon Christofilakos), A.P.P., A.C.R. and D.T.; project administration, D.T. and P.R.; resources, A.P.P., A.C.R., S.C. (Stephen Carpenter), N.T., D.T. and P.R.; software—source code, S.C. (Spyridon Christofilakos); supervision, D.T. and P.R.; validation, S.C. (Spyridon Christofilakos); visualization, S.C. (Spyridon Christofilakos); writing—original draft, S.C. (Spyridon Christofilakos); writing—review and editing, A.P.P., A.C.R., S.C. (Stephen Carpenter), N.T., D.T. and P.R. All authors have read and agreed to the published version of the manuscript.

Funding

Spyridon Christofilakos is supported by the DLR-DAAD Research Fellowship (No. 57575487).

Acknowledgments

We thank the EU for the Sentinel-2 program and Planet for their NICFI datasets, as they both provide publicly available data for better monitoring and understanding of our planet. We also thank the anonymous reviewers for their critical comments to improve the manuscript.

Conflicts of Interest

The authors declare no conflict of interest.

References

  1. IPCC. Climate Change 2023: Synthesis Report Contribution of Working Groups, I, II and III to the Sixth Assessment Report of the Intergovernmental Panel on Climate Change; Core Writing Team, Lee, H., Romero, J., Eds.; IPCC: Geneva, Switzerland, 2023; pp. 35–115. [Google Scholar] [CrossRef]
  2. Eugenio, F.; Marcello, J.; Martin, J. High-Resolution Maps of Bathymetry and Benthic Habitats in Shallow-Water Environments Using Multispectral Remote Sensing Imagery. IEEE Trans. Geosci. Remote Sens. 2015, 53, 3539–3549. [Google Scholar] [CrossRef]
  3. Garcia, R.A.; Hedley, J.D.; Tin, H.C.; Fearns, P.R.C.S. A method to analyze the potential of optical remote sensing for benthic habitat mapping. Remote Sens. 2015, 7, 13157–13189. [Google Scholar] [CrossRef]
  4. Misiuk, B.; Brown, C.J. Benthic habitat mapping: A review of three decades of mapping biological patterns on the seafloor. Estuar. Coast. Shelf Sci. 2024, 296, 108599. [Google Scholar] [CrossRef]
  5. Ashphaq, M.; Srivastava, P.K.; Mitra, D. Review of near-shore satellite derived bathymetry: Classification and account of five decades of coastal bathymetry research. J. Ocean. Eng. Sci. 2021, 6, 340–359. [Google Scholar] [CrossRef]
  6. Sagawa, T.; Yamashita, Y.; Okumura, T.; Yamanokuchi, T. Satellite derived bathymetry using machine learning and multi-temporal satellite images. Remote Sens. 2019, 11, 1155. [Google Scholar] [CrossRef]
  7. Adebisi, N.; Balogun, A.L.; Mahdianpari, M.; Min, T.H. Assessing the impacts of rising sea level on coastal morpho-dynamics with automated high-frequency shoreline mapping using multi-sensor optical satellites. Remote Sens. 2021, 13, 3587. [Google Scholar] [CrossRef]
  8. Velegrakis, A.F.; Chatzistratis, D.; Chalazas, T.; Armaroli, C.; Schiavon, E.; Alves, B.; Grigoriadis, D.; Hasiotis, T.; Ieronymidi, E. Earth observation technologies, policies and legislation for the coastal flood risk assessment and management: A European perspective. Anthr. Coasts 2024, 7, 3. [Google Scholar] [CrossRef]
  9. Naboureh, A.; Ebrahimy, H.; Azadbakht, M.; Bian, J.; Amani, M. Ruesvms: An ensemble method to handle the class imbalance problem in land cover mapping using google earth engine. Remote Sens. 2020, 12, 3484. [Google Scholar] [CrossRef]
  10. Araya-Lopez, R.; de Paula Costa, M.D.; Wartman, M.; Macreadie, P.I. Trends in the application of remote sensing in blue carbon science. Ecol. Evol. 2023, 13, e10559. [Google Scholar] [CrossRef] [PubMed]
  11. Blume, A.; Pertiwi, A.P.; Lee, C.B.; Traganos, D. Bahamian seagrass extent and blue carbon accounting using Earth Observation. Front. Mar. Sci. 2023, 10, 1058460. [Google Scholar] [CrossRef]
  12. Christianson, A.B.; Cabré, A.; Bernal, B.; Baez, S.K.; Leung, S.; Pérez-Porro, A.; Poloczanska, E. The Promise of Blue Carbon Climate Solutions: Where the Science Supports Ocean-Climate Policy. Front. Mar. Sci. 2022, 9, 851448. [Google Scholar] [CrossRef]
  13. Liu, J.; Failler, P.; Ramrattan, D. Blue carbon accounting to monitor coastal blue carbon ecosystems. J. Environ. Manag. 2024, 352, 120008. [Google Scholar] [CrossRef]
  14. Malerba, M.E.; Duarte de Paula Costa, M.; Friess, D.A.; Schuster, L.; Young, M.A.; Lagomasino, D.; Serrano, O.; Hickey, S.M.; York, P.H.; Rasheed, M.; et al. Remote sensing for cost-effective blue carbon accounting. Earth-Sci. Rev. 2023, 238, 104337. [Google Scholar] [CrossRef]
  15. Macreadie, P.I.; Anton, A.; Raven, J.A.; Beaumont, N.; Connolly, R.M.; Friess, D.A.; Kelleway, J.J.; Kennedy, H.; Kuwae, T.; Lavery, P.S.; et al. The future of Blue Carbon science. Nat. Commun. 2019, 10, 3998. [Google Scholar] [CrossRef] [PubMed]
  16. Macreadie, P.I.; Costa, M.D.P.; Atwood, T.B.; Friess, D.A.; Kelleway, J.J.; Kennedy, H.; Lovelock, C.E.; Serrano, O.; Duarte, C.M. Blue carbon as a natural climate solution. Nat. Rev. Earth Environ. 2021, 2, 826–839. [Google Scholar] [CrossRef]
  17. Pham-Duc, B.; Nguyen, H.; Phan, H.; Tran-Anh, Q. Trends and applications of google earth engine in remote sensing and earth science research: A bibliometric analysis using scopus database. Earth Sci. Inform. 2023, 16, 2355–2371. [Google Scholar] [CrossRef]
  18. Gorelick, N.; Hancher, M.; Dixon, M.; Ilyushchenko, S.; Thau, D.; Moore, R. Google Earth Engine: Planetary-scale geospatial analysis for everyone. Remote Sens. Environ. 2017, 202, 18–27. [Google Scholar] [CrossRef]
  19. Pérez-Cutillas, P.; Pérez-Navarro, A.; Conesa-García, C.; Zema, D.A.; Amado-Álvarez, J.P. What is going on within google earth engine? A systematic review and meta-analysis. Remote Sens. Appl. Soc. Environ. 2023, 29, 100907. [Google Scholar] [CrossRef]
  20. Wang, X.; Xiao, X.; Zou, Z.; Chen, B.; Ma, J.; Dong, J.; Doughty, R.B.; Zhong, Q.; Qin, Y.; Dai, S.; et al. Tracking annual changes of coastal tidal flats in China during 1986–2016 through analyses of Landsat images with Google Earth Engine. Remote Sens. Environ. 2020, 238, 110987. [Google Scholar] [CrossRef]
  21. Arjasakusuma, S.; Kusuma, S.S.; Saringatin, S.; Wicaksono, P.; Mutaqin, B.W.; Rafif, R. Shoreline dynamics in East Java Province, Indonesia, from 2000 to 2019 using multi-sensor remote sensing data. Land 2021, 10, 100. [Google Scholar] [CrossRef]
  22. Caballero, I.; Roca, M.; Dunbar, M.B.; Navarro, G. Water Quality and Flooding Impact of the Record-Breaking Storm Gloria in the Ebro Delta (Western Mediterranean). Remote Sens. 2024, 16, 41. [Google Scholar] [CrossRef]
  23. Roca, M.; Navarro, G.; García-Sanabria, J.; Caballero, I. Monitoring Sand Spit Variability Using Sentinel-2 and Google Earth Engine in a Mediterranean Estuary. Remote Sens. 2022, 14, 2345. [Google Scholar] [CrossRef]
  24. Tamiminia, H.; Salehi, B.; Mahdianpari, M.; Quackenbush, L.; Adeli, S.; Brisco, B. Google Earth Engine for geo-big data applications: A meta-analysis and systematic review. ISPRS J. Photogramm. Remote Sens. 2020, 164, 152–170. [Google Scholar] [CrossRef]
  25. Sayer, A.M.; Govaerts, Y.; Kolmonen, P.; Lipponen, A.; Luffarelli, M.; Mielonen, T.; Patadia, F.; Popp, T.; Povey, A.C.; Stebel, K.; et al. A review and framework for the evaluation of pixel-level uncertainty estimates in satellite aerosol remote sensing. Atmos. Meas. Tech. 2020, 13, 373–404. [Google Scholar] [CrossRef]
  26. Tran, B.N.; Van Der Kwast, J.; Seyoum, S.; Uijlenhoet, R.; Jewitt, G.; Mul, M. Uncertainty assessment of satellite remote-sensing-based evapotranspiration estimates: A systematic review of methods and gaps. Hydrol. Earth Syst. Sci. 2023, 27, 4505–4528. [Google Scholar] [CrossRef]
  27. Lubac, B.; Burvingt, O.; Nicolae Lerma, A.; Sénéchal, N. Performance and Uncertainty of Satellite-Derived Bathymetry Empirical Approaches in an Energetic Coastal Environment. Remote Sens. 2022, 14, 2350. [Google Scholar] [CrossRef]
  28. Thomas, N.; Lee, B.; Coutts, O.; Bunting, P.; Lagomasino, D.; Fatoyinbo, L. A Purely Spaceborne Open Source Approach for Regional Bathymetry Mapping. IEEE Trans. Geosci. Remote Sens. 2022, 60, 4708109. [Google Scholar] [CrossRef]
  29. Zhang, K.; Wang, X.; Wu, Z.; Yang, F.; Zhu, H.; Zhao, D.; Zhu, J. Improving Statistical Uncertainty Estimate of Satellite-Derived Bathymetry by Accounting for Depth-Dependent Uncertainty. IEEE Trans. Geosci. Remote Sens. 2022, 60, 5401309. [Google Scholar] [CrossRef]
  30. Chénier, R.; Ahola, R.; Sagram, M.; Faucher, M.-A.; Shelat, Y. Consideration of Level of Confidence within Multi-Approach Satellite-Derived Bathymetry. ISPRS Int. J. Geo-Inf. 2019, 8, 48. [Google Scholar] [CrossRef]
  31. Christofilakos, S.; Blume, A.; Pertiwi, A.P.; Lee, C.B.; Traganos, D.; Reinartz, P. A cloud-based framework for the quantification of the spatially-explicit uncertainty of remotely sensed benthic habitats. Int. J. Appl. Earth Obs. Geoinf. 2025, 141, 104670. [Google Scholar] [CrossRef]
  32. Cho, L. Marine protected areas: A tool for integrated coastal management in Belize. Ocean Coast. Manag. 2005, 48, 932–947. [Google Scholar] [CrossRef]
  33. Verutes, G.M.; Arkema, K.K.; Clarke-Samuels, C.; Wood, S.A.; Rosenthal, A.; Rosado, S.; Canto, M.; Bood, N.; Ruckelshaus, M. Integrated planning that safeguards ecosystems and balances multiple objectives in coastal Belize. Int. J. Biodivers. Sci. Ecosyst. Serv. Manag. 2017, 13, 1–17. [Google Scholar] [CrossRef]
  34. Karlsson, M.; van Oort, B.; Romstad, B. What we have lost and cannot become: Societal outcomes of coastal erosion in southern Belize. Ecol. Soc. 2015, 20, 4. [Google Scholar] [CrossRef]
  35. Hedley, J.D.; Harborne, A.R.; Mumby, P.J. Technical note: Simple and robust removal of sun glint for mapping shallow-water benthos. Int. J. Remote Sens. 2005, 26, 2107–2112. [Google Scholar] [CrossRef]
  36. Lee, C.B.; Traganos, D.; Reinartz, P. A Simple Cloud-Native Spectral Transformation Method to Disentangle Optically Shallow and DeepWaters in Sentinel-2 Images. Remote Sens. 2022, 14, 590. [Google Scholar] [CrossRef]
  37. Traganos, D.; Aggarwal, B.; Poursanidis, D.; Topouzelis, K.; Chrysoulakis, N.; Reinartz, P. Towards Global-Scale Seagrass Mapping and Monitoring Using Sentinel-2 on Google Earth Engine: The Case Study of the Aegean and Ionian Seas. Remote Sens. 2018, 10, 1227. [Google Scholar] [CrossRef]
  38. Poursanidis, D.; Traganos, D.; Chrysoulakis, N.; Reinartz, P. Cubesats allow high spatiotemporal estimates of satellite-derived bathymetry. Remote Sens. 2019, 11, 1299. [Google Scholar] [CrossRef]
  39. Thomas, N.; Pertiwi, A.P.; Traganos, D.; Lagomasino, D.; Poursanidis, D.; Moreno, S.; Fatoyinbo, L. Space-Borne Cloud-Native Satellite-Derived Bathymetry (SDB) Models Using ICESat-2 And Sentinel-2. Geophys. Res. Lett. 2021, 48, e2020GL092170. [Google Scholar] [CrossRef]
  40. Neumann, T.A.; Brenner, A.; Hancock, D.; Robbins, J.; Saba, J.; Harbeck, K.; Gibbons, A.; Lee, J.; Luthcke, S.B.; Rebold, T.; et al. ATLAS/ICESat-2 L2A Global Geolocated Photon Data, Version 5; NASA National Snow and Ice Data Center Distributed Active Archive Center: Boulder, CO, USA, 2021. [Google Scholar] [CrossRef]
  41. Han, R.; Liu, P.; Wang, G.; Zhang, H.; Wu, X. Advantage of combining ObiA and classifier ensemble method for very high-resolution satellite imagery classification. J. Sens. 2020, 2020, 8855509. [Google Scholar] [CrossRef]
  42. Poursanidis, D.; Topouzelis, K.; Chrysoulakis, N. Mapping coastal marine habitats and delineating the deep limits of the Neptune’s seagrass meadows using very high resolution Earth observation data. Int. J. Remote Sens. 2018, 39, 8670–8687. [Google Scholar] [CrossRef]
  43. Topouzelis, K.; Papakonstantinou, A.; Doukari, M.; Stamatis, P.; Makri, D.; Katsanevakis, S. Coastal habitat mapping in the Aegean Sea using high resolution orthophoto maps. Proc. SPIE 2017, 10444, 389–394. [Google Scholar] [CrossRef]
  44. Poursanidis, D.; Traganos, D.; Reinartz, P.; Chrysoulakis, N. On the use of Sentinel-2 for coastal habitat mapping and satellite-derived bathymetry estimation using downscaled coastal aerosol band. Int. J. Appl. Earth Obs. Geoinf. 2019, 80, 58–70. [Google Scholar] [CrossRef]
  45. Breiman, L. Random forests. Mach. Learn. 2001, 45, 5–32. [Google Scholar] [CrossRef]
  46. Lang, N.; Kalischek, N.; Armston, J.; Schindler, K.; Dubayah, R.; Wegner, J.D. Global canopy height regression and uncertainty estimation from GEDI LIDAR waveforms with deep ensembles. Remote Sens. Environ. 2022, 268, 112760. [Google Scholar] [CrossRef]
  47. Student. The Probable Error of a Mean. Biometrika 1908, 6, 1–25. [Google Scholar] [CrossRef]
  48. Abdar, M.; Pourpanah, F.; Hussain, S.; Rezazadegan, D.; Liu, L.; Ghavamzadeh, M.; Fieguth, P.; Cao, X.; Khosravi, A.; Acharya, U.R.; et al. A review of uncertainty quantification in deep learning: Techniques, applications and challenges. Inf. Fusion 2021, 76, 243–297. [Google Scholar] [CrossRef]
  49. Gruber, C.; Schenk, P.O.; Schierholz, M.; Kreuter, F.; Kauermann, G. Sources of Uncertainty in Machine Learning—A Statisticians’ View. arXiv 2023, arXiv:2305.16703. [Google Scholar]
  50. Khakhim, N.; Kurniawan, A.; Wicaksono, P.; Hasrul, A. Assessment of Empirical Near-Shore Bathymetry Model Using New Emerged PlanetScope Instrument and Sentinel-2 Data in Coastal Shallow Waters. Int. J. Geoinform. 2024, 20, 95–105. [Google Scholar] [CrossRef]
  51. Casal, G.; Harris, P.; Monteys, X.; Hedley, J.; Cahalane, C.; McCarthy, T. Understanding satellite-derived bathymetry using Sentinel 2 imagery and spatial prediction models. GISci. Remote Sens. 2020, 57, 271–286. [Google Scholar] [CrossRef]
  52. Phillips, O.M. Remote Sensing of the Sea Surface. Ann. Rev. Fluid Mech. 1988, 20, 89–109. [Google Scholar] [CrossRef]
Figure 1. Coastal extent of Belize over which the entire analysis was conducted. The displayed aggregated and mosaicked Earth Observation data are based on Sentinel-2, while the Training Data originate from ICESat-2 and the Validation Data from the National Oceanographic Center. Coordinate reference system: EPSG:4326.
Remotesensing 17 03060 g001
Figure 2. Analysis Workflow. The Training Data originate from ICESat-2 and the Validation Data from the National Oceanographic Center.
Remotesensing 17 03060 g002
Figure 3. A visual aid for a better understanding of the estimation of PUNC at a random point X, or more precisely, a random pixel. In this example, the predicted value is the mean prediction across the RF trees, ranging from 2.5 to 5.5 m.
Remotesensing 17 03060 g003
Figure 4. RMSE and R2 values per image composite upon applying the presented method. “Unc50” and “unc90” stand for the threshold on the spatially explicit uncertainty of the training data that are filtered. “PUNC [05-2]” stands for quantifiable estimation.
Remotesensing 17 03060 g004
Figure 5. Percentages of the Training Data ultimately used per model according to the parameterization of each case.
Remotesensing 17 03060 g005
Figure 6. SDBs and PUNC2 maps produced from the image composites Sen18, PS16, and PS20 before and after the application of the proposed method. The results shown here are from a small area of the study region, which is highlighted with red boundaries. Coordinate reference system: EPSG:4326.
Remotesensing 17 03060 g006
Figure 7. From left to right, ENSEMBLE-SDB, which is optimized based on the PUNC information, PUNC05, PUNC1, and PUNC2. Here, the reader can see the expected precision of the model at the pixel level. Coordinate reference system: EPSG:4326.
Remotesensing 17 03060 g007
Figure 8. As in Figure 7, the PUNC maps show the expected precision of the model for the biases of 0.5, 1, and 2 m. The top row provides the results of PS16, while the bottom row provides the results of PS20. The five-point star represents the location of Belize City, capital of Belize. Coordinate reference system: EPSG:4326.
Remotesensing 17 03060 g008
Figure 9. Correlation between Absolute Error and PUNC.
Remotesensing 17 03060 g009
Figure 10. Correlation between depth and PUNC.
Remotesensing 17 03060 g010
Figure 11. Correlation between StdDev and PUNC.
Remotesensing 17 03060 g011
Table 1. Overview of satellite data used for creation of the image composites, spectral bands used for training the model, and number of training (TD) and validation (VD) points.
Composite# of Image/Tiles Used for CompositesBandsNumber of TDNumber of VD
SEN1887624 in total, 6 pixel-based and 18 object-based.
Pixel-based: Three optical channels, DIV, Hue, and Value.
Object-based: Mean, Median, and StdDev of all the pixel-based bands.
2753777
PS168 (NICFI basemaps every semester)2852742
PS2029 (besides the first composite that is a NICFI six-month basemap, all the others are monthly mosaics)
Disclaimer/Publisher’s Note: The statements, opinions and data contained in all publications are solely those of the individual author(s) and contributor(s) and not of MDPI and/or the editor(s). MDPI and/or the editor(s) disclaim responsibility for any injury to people or property resulting from any ideas, methods, instructions or products referred to in the content.