Article

Multiscale Evaluation and Error Characterization of HY-2B Fused Sea Surface Temperature Data

1
Key Laboratory of Cleaner Intelligent Control on Coal & Electricity, Ministry of Education and College of Electrical and Power Engineering, Taiyuan University of Technology, Taiyuan 030024, China
2
College of Water Conservancy Science and Engineering, Taiyuan University of Technology, Taiyuan 030024, China
3
College of Electrical and Power Engineering, Taiyuan University of Technology, Taiyuan 030024, China
4
Key Laboratory of Polar Ecosystem and Climate Change, Shanghai Key Laboratory of Polar Life and Environment Sciences, School of Oceanography, Ministry of Education, Shanghai Jiao Tong University, Shanghai 200030, China
*
Author to whom correspondence should be addressed.
Remote Sens. 2025, 17(17), 3043; https://doi.org/10.3390/rs17173043
Submission received: 25 July 2025 / Revised: 28 August 2025 / Accepted: 29 August 2025 / Published: 1 September 2025
(This article belongs to the Special Issue Satellite Remote Sensing for Ocean and Coastal Environment Monitoring)

Abstract

The Haiyang-2B (HY-2B) satellite, launched on 25 October 2018, carries both active and passive microwave sensors, including a scanning microwave Radiometer (SMR), to deliver high-precision, all-weather global observations. Sea surface temperature (SST) is among its key products. We evaluated the HY-2B SMR Level-4A (L4A) SST (25 km resolution) over the North Pacific (0–60°N, 120°E–100°W) for the period 1 October 2023 to 31 March 2025 using the extended triple collocation (ETC) and dual-pairing methods. These comparisons were made against the Remote Sensing System (RSS) microwave and infrared (MWIR) fused SST product and the National Oceanic and Atmospheric Administration (NOAA) in situ SST Quality Monitor (iQuam) observations. Relative to iQuam, HY-2B SST has a mean bias of –0.002 °C and a root mean square error (RMSE) of 0.279 °C. Compared to the MWIR product, the mean bias is 0.009 °C with an RMSE of 0.270 °C, indicating high accuracy. ETC yields an equivalent standard deviation (ESD) of 0.163 °C for HY-2B, compared to 0.157 °C for iQuam and 0.196 °C for MWIR. Platform-specific ESDs are lowest for drifters (0.124 °C) and tropical moored buoys (0.088 °C) and highest for ship and coastal moored buoys (both 0.238 °C). Both the HY-2B and MWIR products exhibit increasing ESD and RMSE toward higher latitudes, primarily driven by stronger winds, higher columnar water vapor, and elevated cloud liquid water. Overall, HY-2B SST performs reliably under most conditions, but incurs larger errors under extreme environments. This analysis provides a robust basis for its application and future refinement.

1. Introduction

Sea surface temperature (SST) is a critical parameter for monitoring, understanding, and forecasting heat, momentum, and gas fluxes across various spatial and temporal scales [1,2,3,4,5]. These fluxes govern the intricate coupling between the atmosphere and the ocean. SST not only influences air–sea moisture and heat exchange but also serves as a fundamental indicator of ocean circulation patterns, frontal zones, water mass distributions, and other dynamic processes [6,7,8]. SST data are primarily obtained from in situ measurements (ships and buoys) and satellite remote sensing. In situ measurements offer high accuracy but have limited spatial coverage and resolution, and such datasets often exhibit quality and completeness issues due to occasional outliers [9]. In contrast, satellite-derived SST products provide high spatiotemporal resolution and near-synoptic global coverage, making them increasingly important in oceanographic research.
Spaceborne scanning microwave radiometers provide continuous, all-weather observations and have been used to generate a global SST record for over 40 years [10,11]. However, differences in instrument design and calibration among microwave radiometers can introduce biases in brightness temperature measurements, affecting the accuracy of SST retrievals [12,13]. In addition, sensor performance can degrade over time, leading to time-dependent errors in long-term SST observations [14]. Therefore, obtaining more comprehensive and accurate SST products requires fusing observations from multiple satellite sensors, which improves spatial coverage and consistency.
The Haiyang-2B (HY-2B) satellite, launched in October 2018, carries the Scanning Microwave Radiometer (SMR), which continuously measures SST, wind speed, atmospheric water vapor, cloud liquid water, and rainfall intensity [15,16]. The addition of SMR significantly expands the spatiotemporal coverage and timeliness of SST observations. Previous studies have validated the accuracy of HY-2B Level-2B (L2B) SST products. Zhou et al. [17] used NOAA iQuam in situ data to assess HY-2B SST, reporting a bias of –0.02 °C and an RMSE of 0.80 °C. Similarly, Zhang et al. [18] reported a bias of 0.09 °C and an RMSE of 0.72 °C for these products.
Since its launch, HY-2B has been operational for over six years, far exceeding its design life. However, no validation study has yet focused on the HY-2B L4A SST fusion product. Compared to traditional single-sensor products, fused SST products offer substantially improved spatial coverage, enabling near-global observations. In generating fused SST products, different institutions may combine varied data sources (e.g., infrared SST, microwave SST, and in situ data) and processing methods to meet specific objectives. These sources differ in format, spatial/temporal resolution, cloud detection algorithms, and quality control procedures. Additionally, differences in fusion algorithms, initial field generation, land–sea boundary handling, and ice-masking techniques can lead to discrepancies in the final product performance [19].
In this study, we apply extended triple collocation (ETC) and direct pairwise comparison methods to evaluate the operational HY-2B L4A fused SST product for the period from 1 October 2023 to 31 March 2025. Section 2 describes the data and methods. Section 3 and Section 4 present the results and discussion, respectively. Section 5 concludes the study. The flowchart of the step-by-step research is shown in Figure 1.

2. Materials and Methods

This study employs multiple remote sensing SST datasets along with comparative analyses and multi-scale validation to assess the observational performance of the HY-2B SMR over the North Pacific. The datasets include the HY-2B L4A fused SST product, the RSS MWIR fused SST product, NOAA iQuam in situ observations for accuracy assessment, and ERA5 reanalysis data for environmental context analysis.

2.1. Study Area

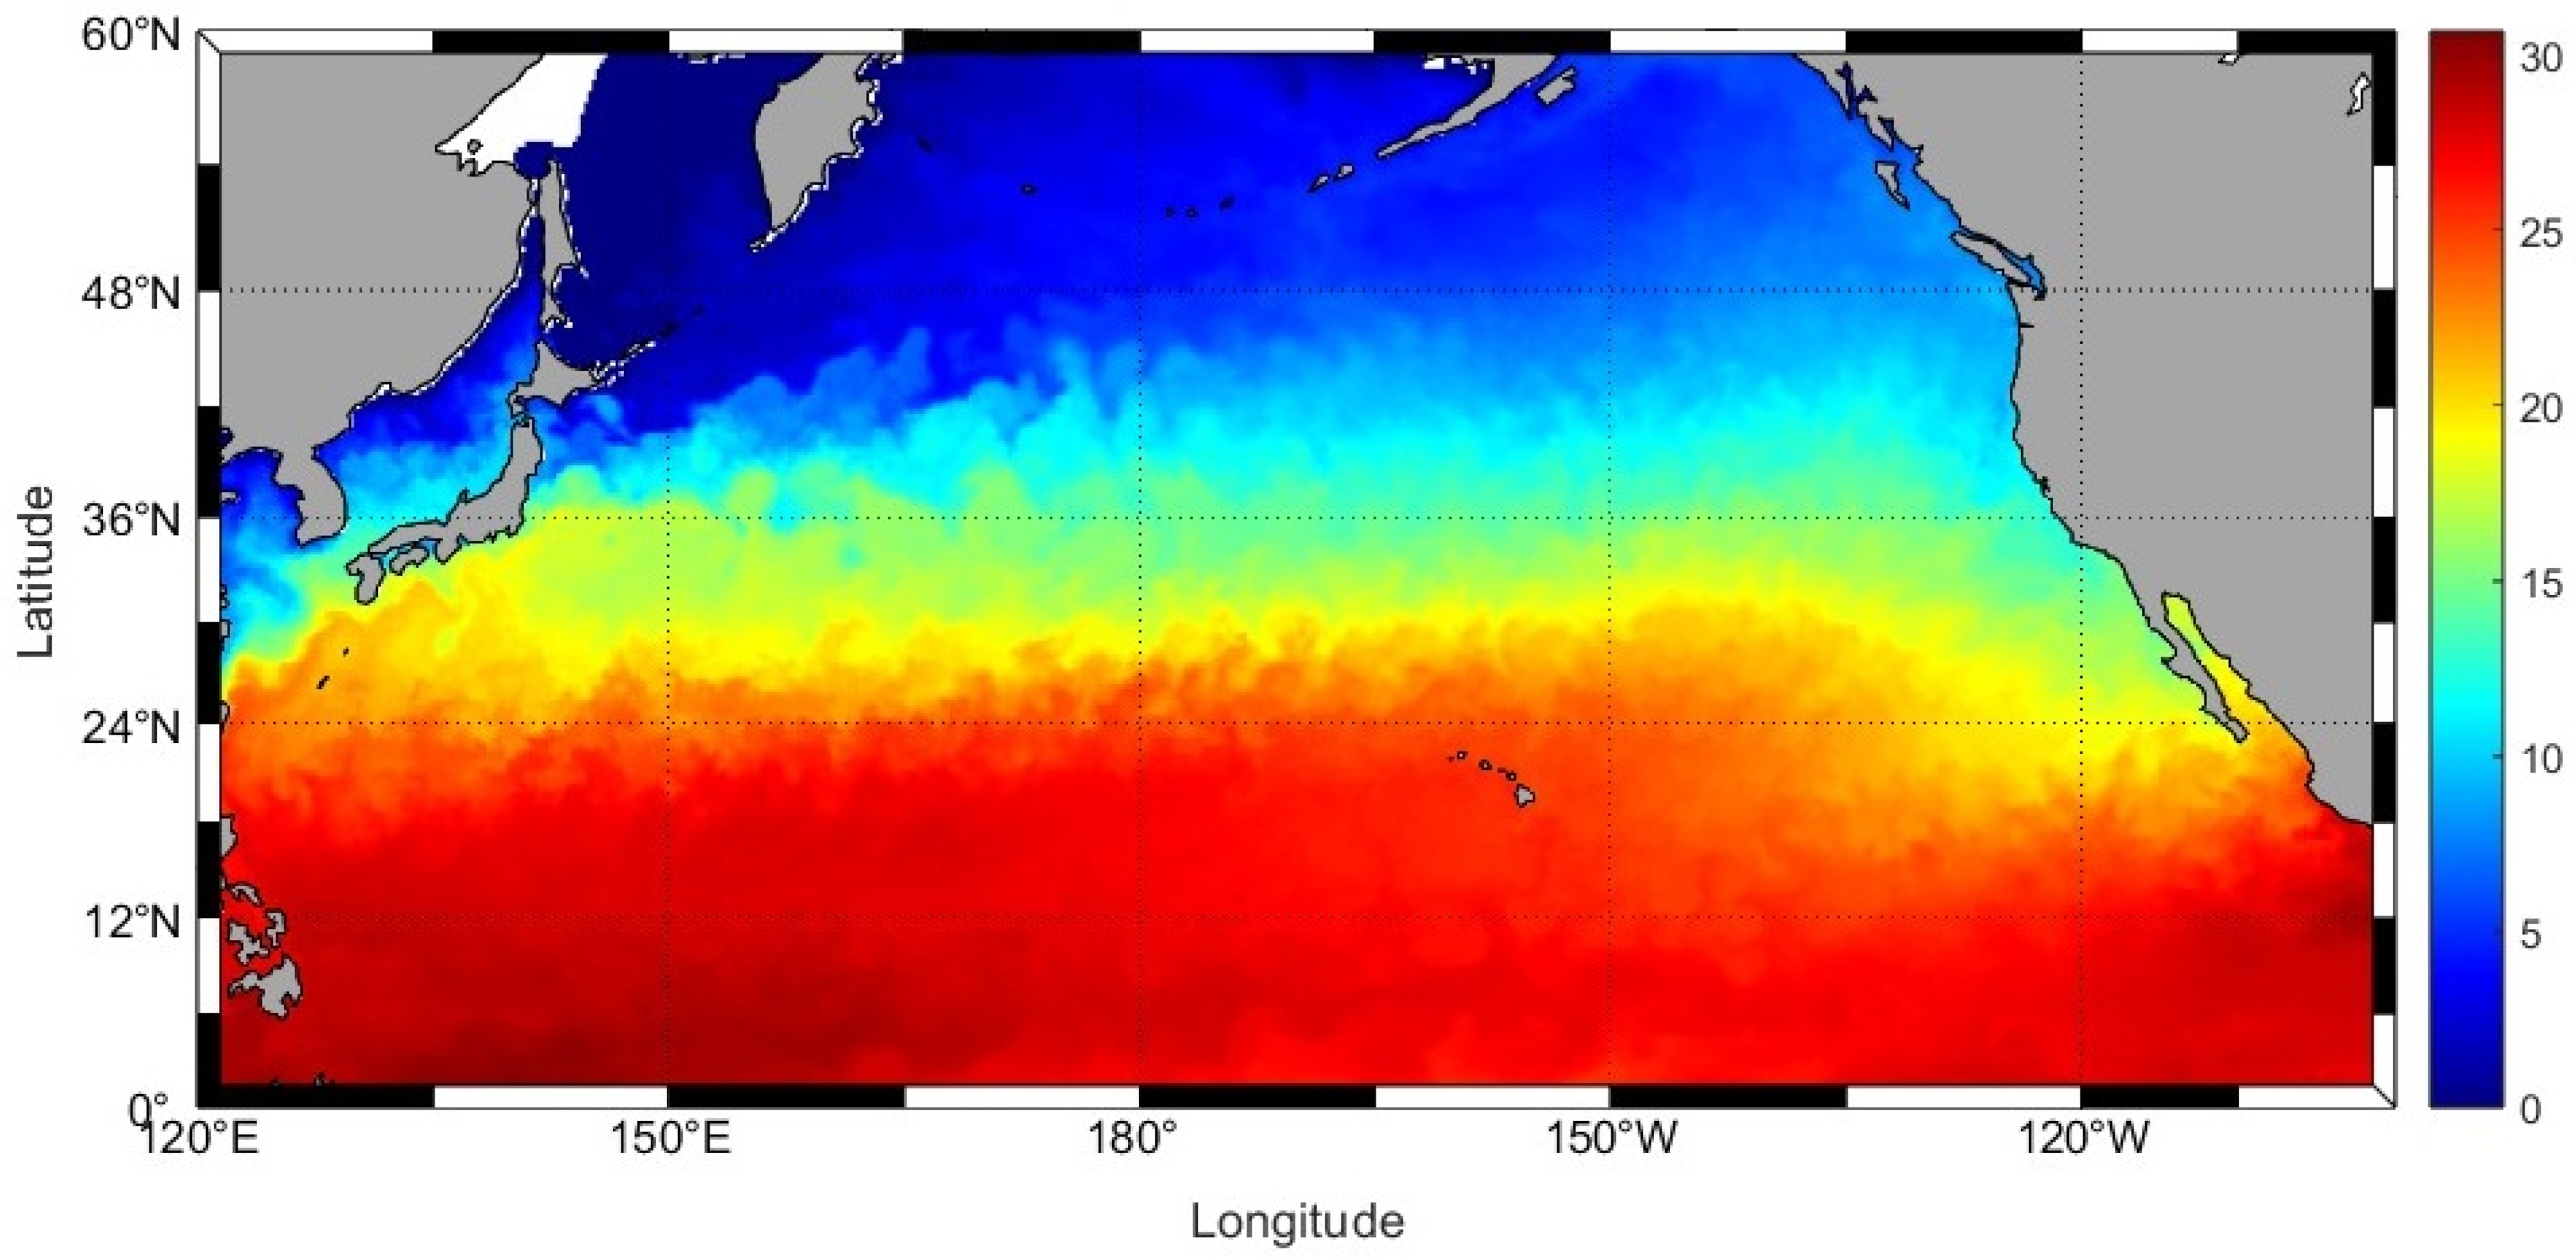
The study area covers the North Pacific (0–60°N, 120°E–100°W) (Figure 2). This region spans from the tropics to mid and high latitudes and includes dynamic features such as the Equatorial Warm Pool, the Kuroshio and California Currents, and the North Pacific Subtropical High. Sea surface temperature in the North Pacific exhibits pronounced spatio-temporal variability and strong seasonality, making it an ideal region for evaluating satellite SST accuracy and stability across diverse climate regimes [20,21]. Moreover, a dense network of buoys in this area provides ample collocated observations for validation.

2.2. Datasets

2.2.1. HY-2B SST

The HY-2B L4A fused sea surface temperature (SST) product used in this study is an operational daily (24 h) fusion field produced by the National Satellite Ocean Application Service (NSOAS) and distributed via the NSOAS Ocean Dynamics portal. The exact product employed here is “MUL_OPER_SST_L4A_FU_01D_20250101_dps_250_10_sst” (product level L4A). Files are provided in NetCDF-4 format with a nominal spatial resolution of ~25 km; the file name convention indicates a daily aggregation (“01D”), which we used for all collocations and analyses. The L4A fusion combines multiple satellite retrievals (microwave and infrared) through NSOAS’s operational fusion procedures (spatiotemporal interpolation, quality control, bias correction and weighting) to produce continuous, gap-filled SST fields suitable for large-scale validation and applications. We regridded/processed the daily HY-2B L4A fields as described in Section 2.3. to match the temporal and spatial collocation scheme used for MWIR and iQuam. The HY-2B SST dataset spans October 2023–March 2025.

2.2.2. MWIR SST

The MWIR product (version 5.1) is a daily fused SST dataset provided by Remote Sensing Systems (RSSs). It employs an optimized interpolation scheme to map daily SST estimates onto a 0.09° global grid, with records covering 2002 to the present. MWIR integrates data from multiple sensors: microwave radiometers, including the GPM Microwave Imager (GMI), TRMM Microwave Imager (TMI), Advanced Microwave Scanning Radiometer for EOS (AMSR-E), Advanced Microwave Scanning Radiometer 2 (AMSR2), and WindSat, and infrared (IR) radiometers, including Moderate Resolution Imaging Spectroradiometer (MODIS), on the Aqua and Terra satellites and Visible Infrared Imaging Radiometer Suite (VIIRS) on Suomi NPP and NOAA-20. IR sensors provide high spatial resolution but require clear-sky conditions, whereas microwave sensors can retrieve SST through clouds. In that the MWIR dataset does not make use of HY-2B, it serves as an independent reference. A diurnal cycle correction is applied using modeled base temperature adjustments to mitigate daily thermal expansion/contraction effects. Although MWIR does not directly ingest in situ data, its constituent microwave sensors are buoy-calibrated. The MWIR dataset serves as an independent reference for cross-comparing the HY-2B fusion SST product. MWIR data are available from the RSS data repository.

2.2.3. In Situ Observation Data

High-precision in situ SST observations are essential for satellite SST validation. The NOAA in situ SST Quality Monitor (iQuam) dataset, developed by NOAA’s Satellite Applications and Research Center, is widely used for this purpose. The current iQuam version (2.10) provides quality control (QC) of in situ SST measurements, online monitoring of QC-processed data, and reformatted SST output with quality flags [22]. iQuam incorporates SST data from commercial vessels, drifting buoys, tropical moored buoys (T-M), coastal moored buoys (C-M), and Argo floats, and is extensively used for satellite validation [23,24,25].
The iQuam QC procedures include pre-screening, plausibility checks, internal consistency checks, and cross-consistency checks. Each observation is assigned a quality level from 1 (poorest) to 5 (highest); this study uses only level 5 (highest quality) observations from ships, drifting buoys, and moored buoys. All iQuam data are provided in NetCDF format. Xu et al. used triple collocation to estimate platform-specific observation errors in iQuam [26]: their results (standard deviations of 0.75 K for ships, 0.21–0.22 K for drifting buoys/Argo, 0.17 K for tropical moorings, and 0.40 K for coastal moorings) indicate relatively low random errors across all platforms. This underscores the reliability of high-quality iQuam data for validation.

2.2.4. ERA5 Reanalysis Data

ERA5 is the fifth-generation global climate reanalysis produced by the European Centre for Medium-Range Weather Forecasts (ECMWF) under the Copernicus Climate Change Service (C3S), superseding ERA-Interim [27,28]. ERA5 provides hourly global fields on a ~31 km horizontal grid with 137 vertical levels, encompassing over 30 atmospheric, land, and oceanic variables. In this study, we employ daily-mean ERA5 single-layer data for auxiliary environmental parameters: total column water vapor, total column cloud liquid water, and the 10 m eastward (U) and northward (V) wind components. Notably, ERA5 assimilates a wide range of observations (over 200 data types, including satellite and conventional upper-air measurements) but excludes HY-2B sensor data. It also directly assimilates in situ ship and buoy observations (e.g., 10 m wind, 2 m humidity, sea surface pressure) [28]. These ERA5 variables are used to analyze HY-2B SST error characteristics under varying environmental conditions.

2.3. Methods

2.3.1. Data Matching and Quality Control

To ensure comparability between the HY-2B, MWIR, and iQuam datasets, we employ a unified spatiotemporal collocation and quality control framework. First, the MWIR SST dataset was re-gridded to a 0.25° latitude–longitude grid using two-dimensional spatial interpolation. For spatial collocation, each satellite grid point must lie within 25 km of an in situ observation. Hourly in situ observations are averaged to daily means to match the temporal resolution of the satellite products. Within each 0.25° grid cell and day, all available observations from ships, drifting buoys, tropical moored (T-M) buoys, and coastal moored (C-M) buoys are collocated.
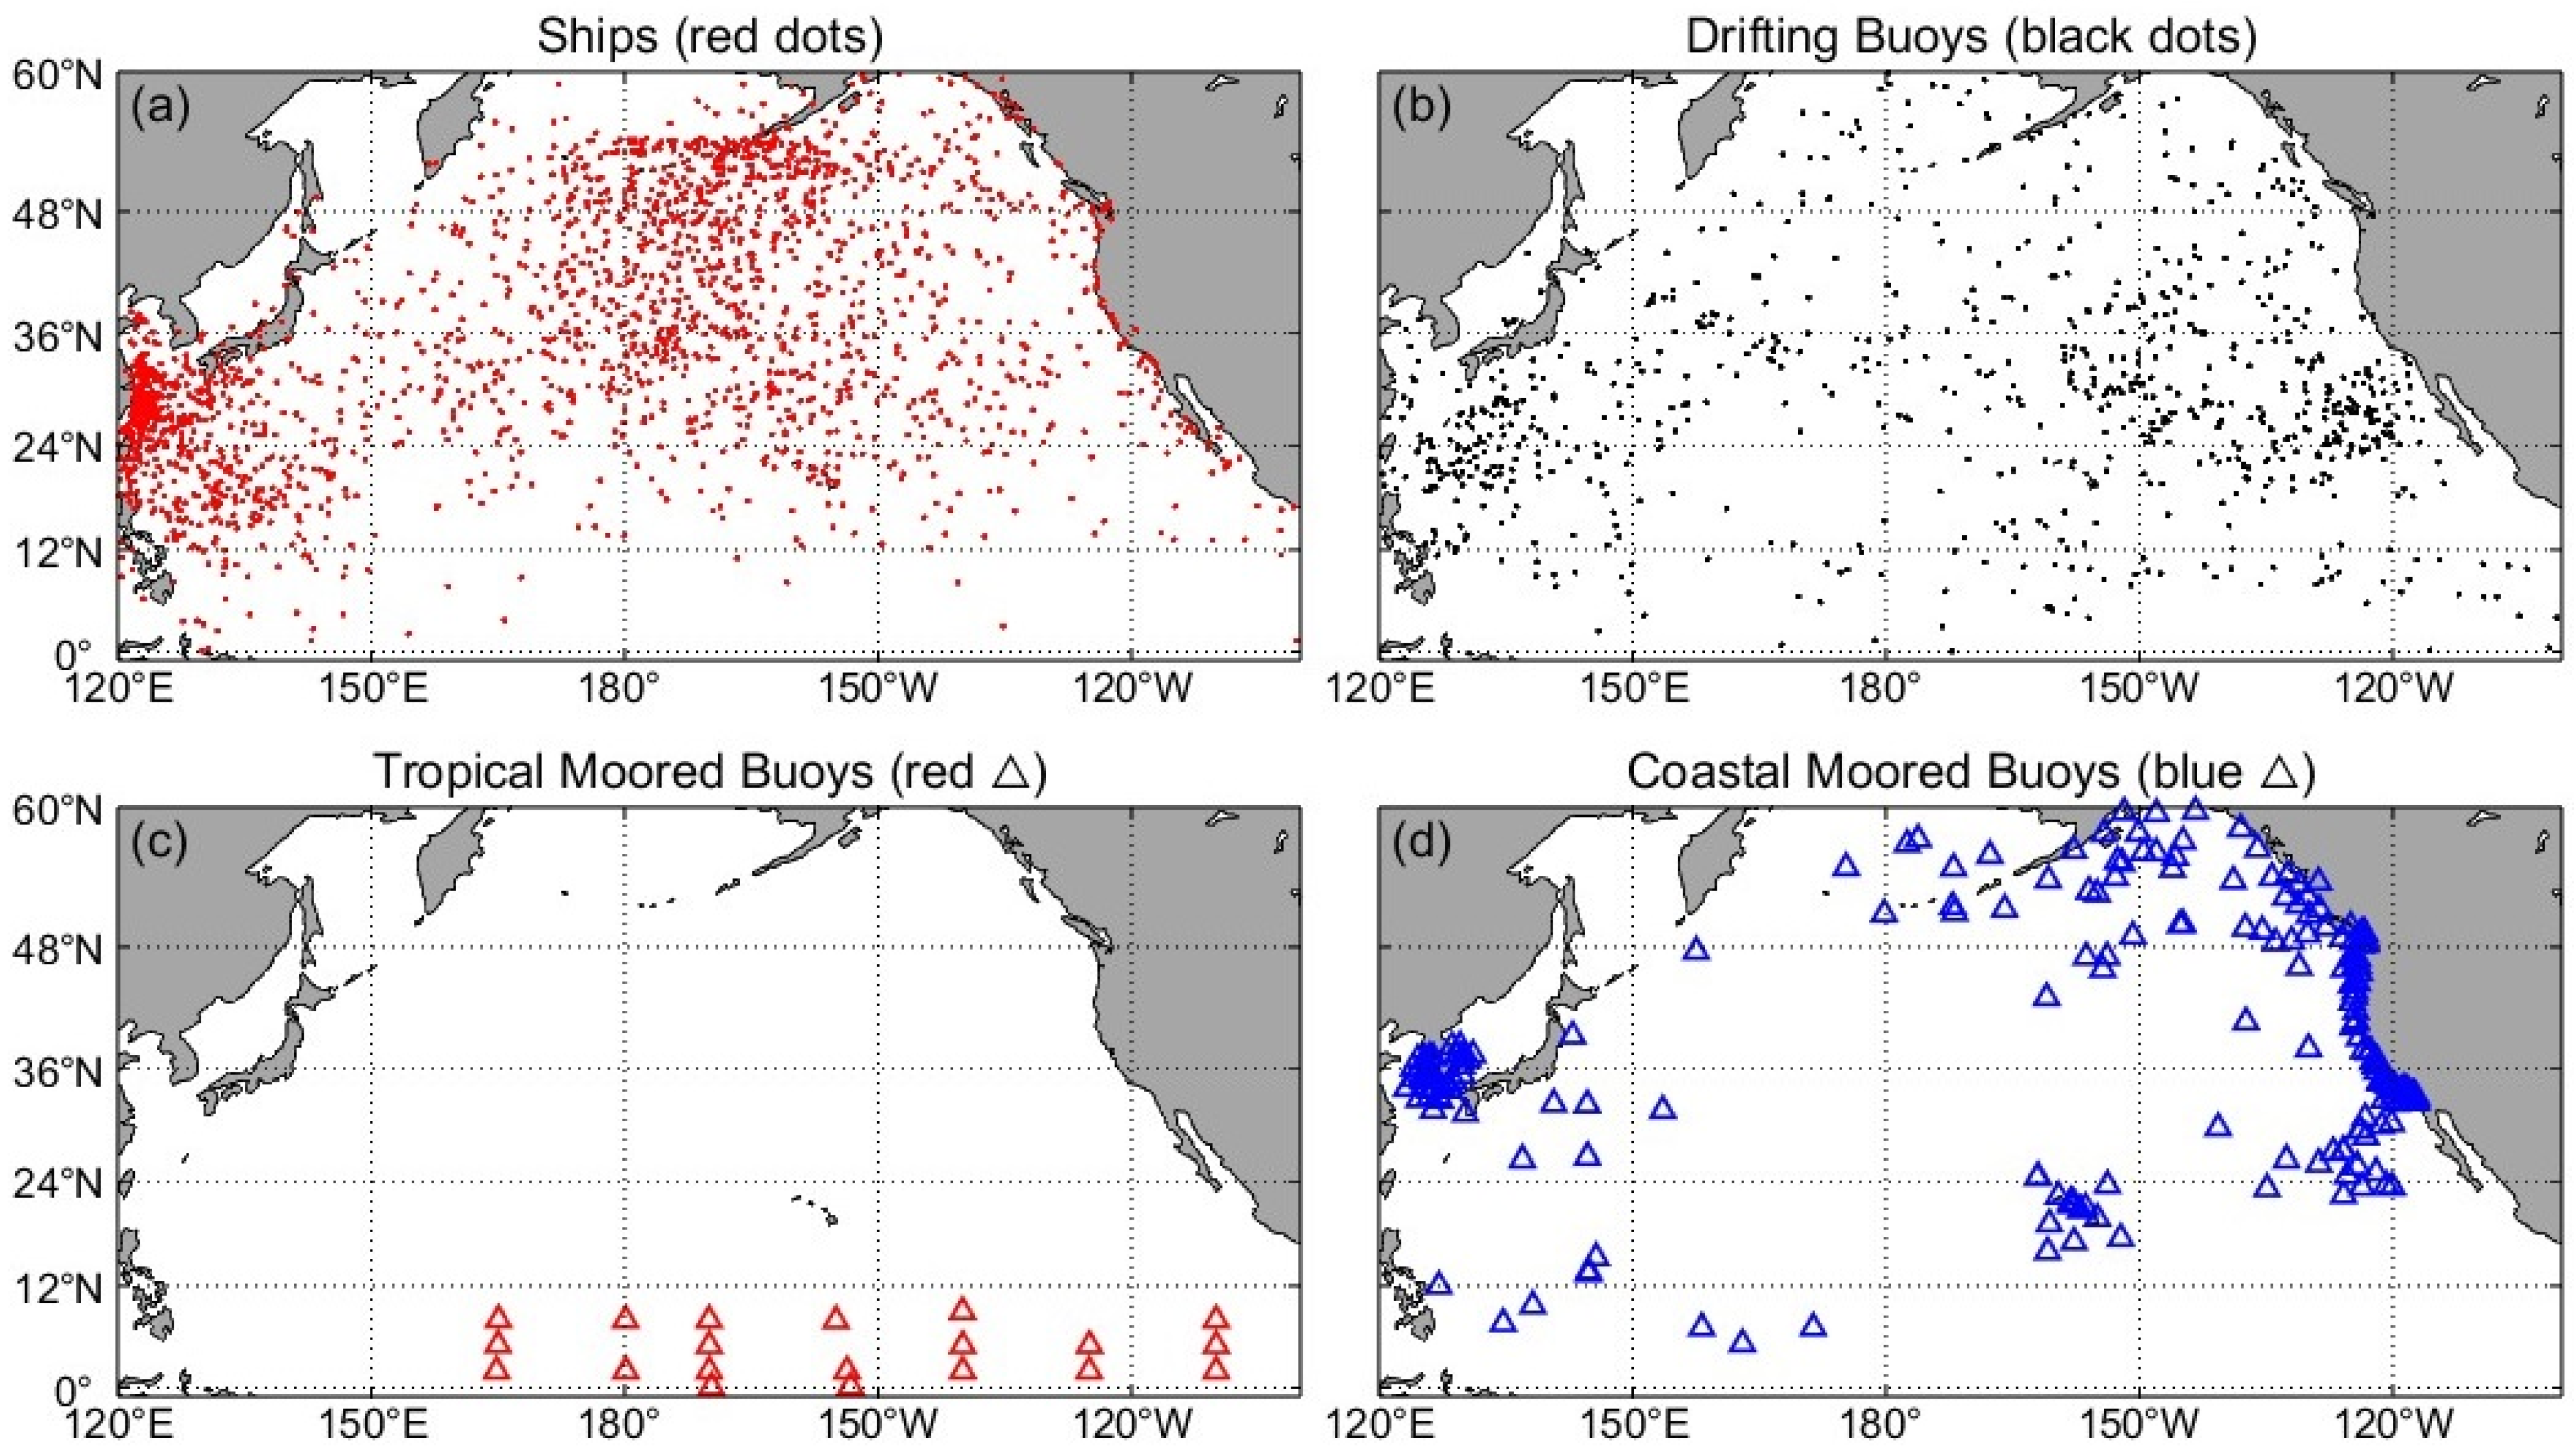
All initial matchups undergo strict quality control: any records with missing values or SST outside the 0–34 °C range are discarded, and only iQuam observations with quality level 5 (highest quality) are retained. Figure 3 illustrates the spatial distribution of the resulting collocated points. Finally, we tally the number of samples by platform type to form platform-specific datasets for subsequent analysis. These collocation and QC procedures ensure consistency and reliability across all SST data sources.

2.3.2. Comparison Methods

Comparing satellite-retrieved SST with in situ SST from ships and buoys is a standard approach for evaluating retrieval accuracy [29,30,31,32]. Such comparisons assume that in situ observations represent the true sea surface temperature; however, in situ measurements contain both random and systematic errors [33,34]. Moreover, satellite sensors observe different layers of the surface: infrared radiometers sense the near-surface “skin” temperature (top few micrometers), while microwave radiometers retrieve the sub-skin SST (roughly 1 mm depth) [35,36,37]. Cold-skin and diurnal warming effects can create significant temperature differences between the skin, sub-skin, and bulk layers [38,39]. These factors introduce inherent biases and uncertainties in direct comparisons.
To address these limitations, triple collocation (TC) methods have been developed to estimate the error variances of three mutually independent datasets without assuming any single dataset as truth [40,41]. TC has been widely applied to validate soil moisture, precipitation, sea surface salinity, sea surface temperature, and sea surface wind and waves [42,43,44,45,46,47,48]. Building on the TC method, the extended triple collocation (ETC) method was proposed. ETC adopts the same basic assumptions as TC but derives additional performance metrics, including the correlation coefficient between each product and the unknown target, as well as the scaled unbiased signal-to-noise ratio ( SNR sub ). Compared to standard deviation, ETC provides a complementary perspective on product performance [49].

2.3.3. Statistical Indicators and Analysis

To quantify SST accuracy, we compute the mean bias, root mean square error (RMSE), and Pearson correlation coefficient (R) between each satellite product and the reference (in situ) SST. Bias is defined as the average difference between the satellite SST and the reference SST. RMSE represents the standard deviation of these differences and is sensitive to outliers, serving as a robust measure of overall precision. The Pearson correlation coefficient R indicates the strength of the linear relationship between the satellite and reference SST values. The mathematical formulas for these metrics are given by
Bias = 1 N i = 1 N ( S i O i )
RMSE = 1 N i = 1 N ( S i O i ) 2
R = i = 1 N ( S i S ¯ ) ( O i O ¯ ) i = 1 N ( S i S ¯ ) 2   ×   i = 1 N ( O i O ¯ ) 2
In the formula, N denotes the total number of matching data points between remote sensing observations of SST and iQuam in situ SST, while S and O denote the satellite data set and reference data set being verified, respectively.

2.3.4. Extended Triple Collocation (ETC)

ETC is a technique for estimating the noise error variance (errVar) and correlation coefficient (rho) of three measurement systems (e.g., satellite, in situ, and model-based products) relative to the unknown true values of the measured variables (e.g., sea surface temperature, soil moisture, wind speed) [49]. ETC applies to both absolute and anomaly values without requiring rescaling to a reference system.
Traditional approaches (e.g., linear regression) assume in situ data as truth, yet these observations contain both random and systematic errors. Therefore, using extended triple collocation (ETC) allows for independent estimation of the error variance for each measurement system. ETC enables independent estimation of each system’s error variance, avoiding reliance on a single reference dataset. Unlike traditional methods, ETC does not assume any dataset as truth, thus providing independent error variance estimates for all systems [50]. ETC uses the same assumptions as TC but provides an additional validation parameter, namely the coefficient of determination ( ρ t ,   X i 2 ) relative to the unknown “true” value of the measured variable.
Assume that three independent measurement values are linearly related to the unknown true value T. The affine error model between the measurement values and T can be expressed as follows:
X i = X i + ε i = α i + β i t + ε i
where X i ( i { 1 , 2 , 3 } ) is a set of three spatially and temporally co-located datasets ( X 1 : system-based products; X 2 : model-based products; X 3 : in situ products), each with additive random error ε i ; t is the unknown true value (or true state) and α i and β i are the multiplicative bias and proportionality factor of dataset X i relative to the true value.
In this study, we adopted the covariance combination principle among the three products without rescaling [40,49]. The covariance between different products is
Cov ( X i ,   X j ) = E ( X i X j ) E ( X i ) E ( X j ) = β i β j σ t 2 + β i Cov ( t , ε j ) + β j Cov ( t , ε i ) + Cov ( ε i , ε j )
σ t 2 = Var ( t )
The basic assumptions of ETC are that (i) the expected value of errors from independent data sources is zero ( E ( ε i ) = 0 ) , (ii) they are mutually independent ( Cov ( ε i , ε j ) = 0 ,   for   i j ) , and (iii) the errors of the three products are independent of each other and unrelated to the true value t     ( Cov ( t , ε i ) = 0 ) .
The covariance of these three products can be simplified as follows:
Q i j Cov ( X i ,   X j ) = β i   β j   σ t 2 , for   i j β i 2   σ t 2 + σ ε i 2 , for   i = j
The error variance σ ε i 2 = Var ( ε i ) . The error standard deviation (ESD) of the three products can be determined from the square root of the error variance
σ ε 1 =   Q 11 Q 12   Q 13 Q 23     Q 22 Q 12   Q 23 Q 13     Q 33 Q 13   Q 23 Q 12  
The correlation coefficient between t and X expressed in terms of covariance values is
ρ t , X = ± Q 12   Q 13   Q 11   Q 23   sign ( Q 13   Q 23 ) Q 12   Q 23   Q 22   Q 13   sign ( Q 12   Q 23 ) Q 13   Q 23   Q 33   Q 12      
It is worth noting that the ρ t , X provided by ETC has signed ambiguity; however, in practical applications, ρ t , X is always positive. To describe the combined effects of product sensitivity ( β i ) , true signal variability ( σ t ) , and measurement error variability ( σ ε ) , the formula for calculating the correlation coefficient squared (the scaled unbiased signal-to-noise ratio SNR sub ) is as follows:
SNR sub = ± Q 12   Q 13   Q 11   Q 23   sign ( Q 13   Q 23 ) Q 12   Q 23   Q 22   Q 13   sign ( Q 12   Q 23 ) Q 13   Q 23   Q 33   Q 12   2
where SNR sub represents the proportional unbiased signal-to-noise ratio. It contains information about product sensitivity and can be used to evaluate whether the noise level of the system is suitable for detecting changes in target variables. We apply ETC to three datasets—HY-2B, MWIR, and iQuam—across four platforms (Ship, Drifter, T-M, and C-M) to derive their random errors (ESD) and SNR sub values. To elucidate error sources, we examine the interplay between sensor characteristics and environmental conditions: infrared (IR) sensors offer high spatial resolution but are hindered by cloud cover and atmospheric water vapor, whereas microwave sensors provide all-weather SST retrievals at the cost of coarser resolution and greater susceptibility to surface roughness and wind waves. The MWIR product integrates data from two thermal-infrared sensors (MODIS, AVHRR) and three passive microwave sensors (AMSR-E, AMSR2, WindSat) to optimize the trade-off between observational accuracy and spatial coverage [51].

3. Results

3.1. Comparison with In Situ SST

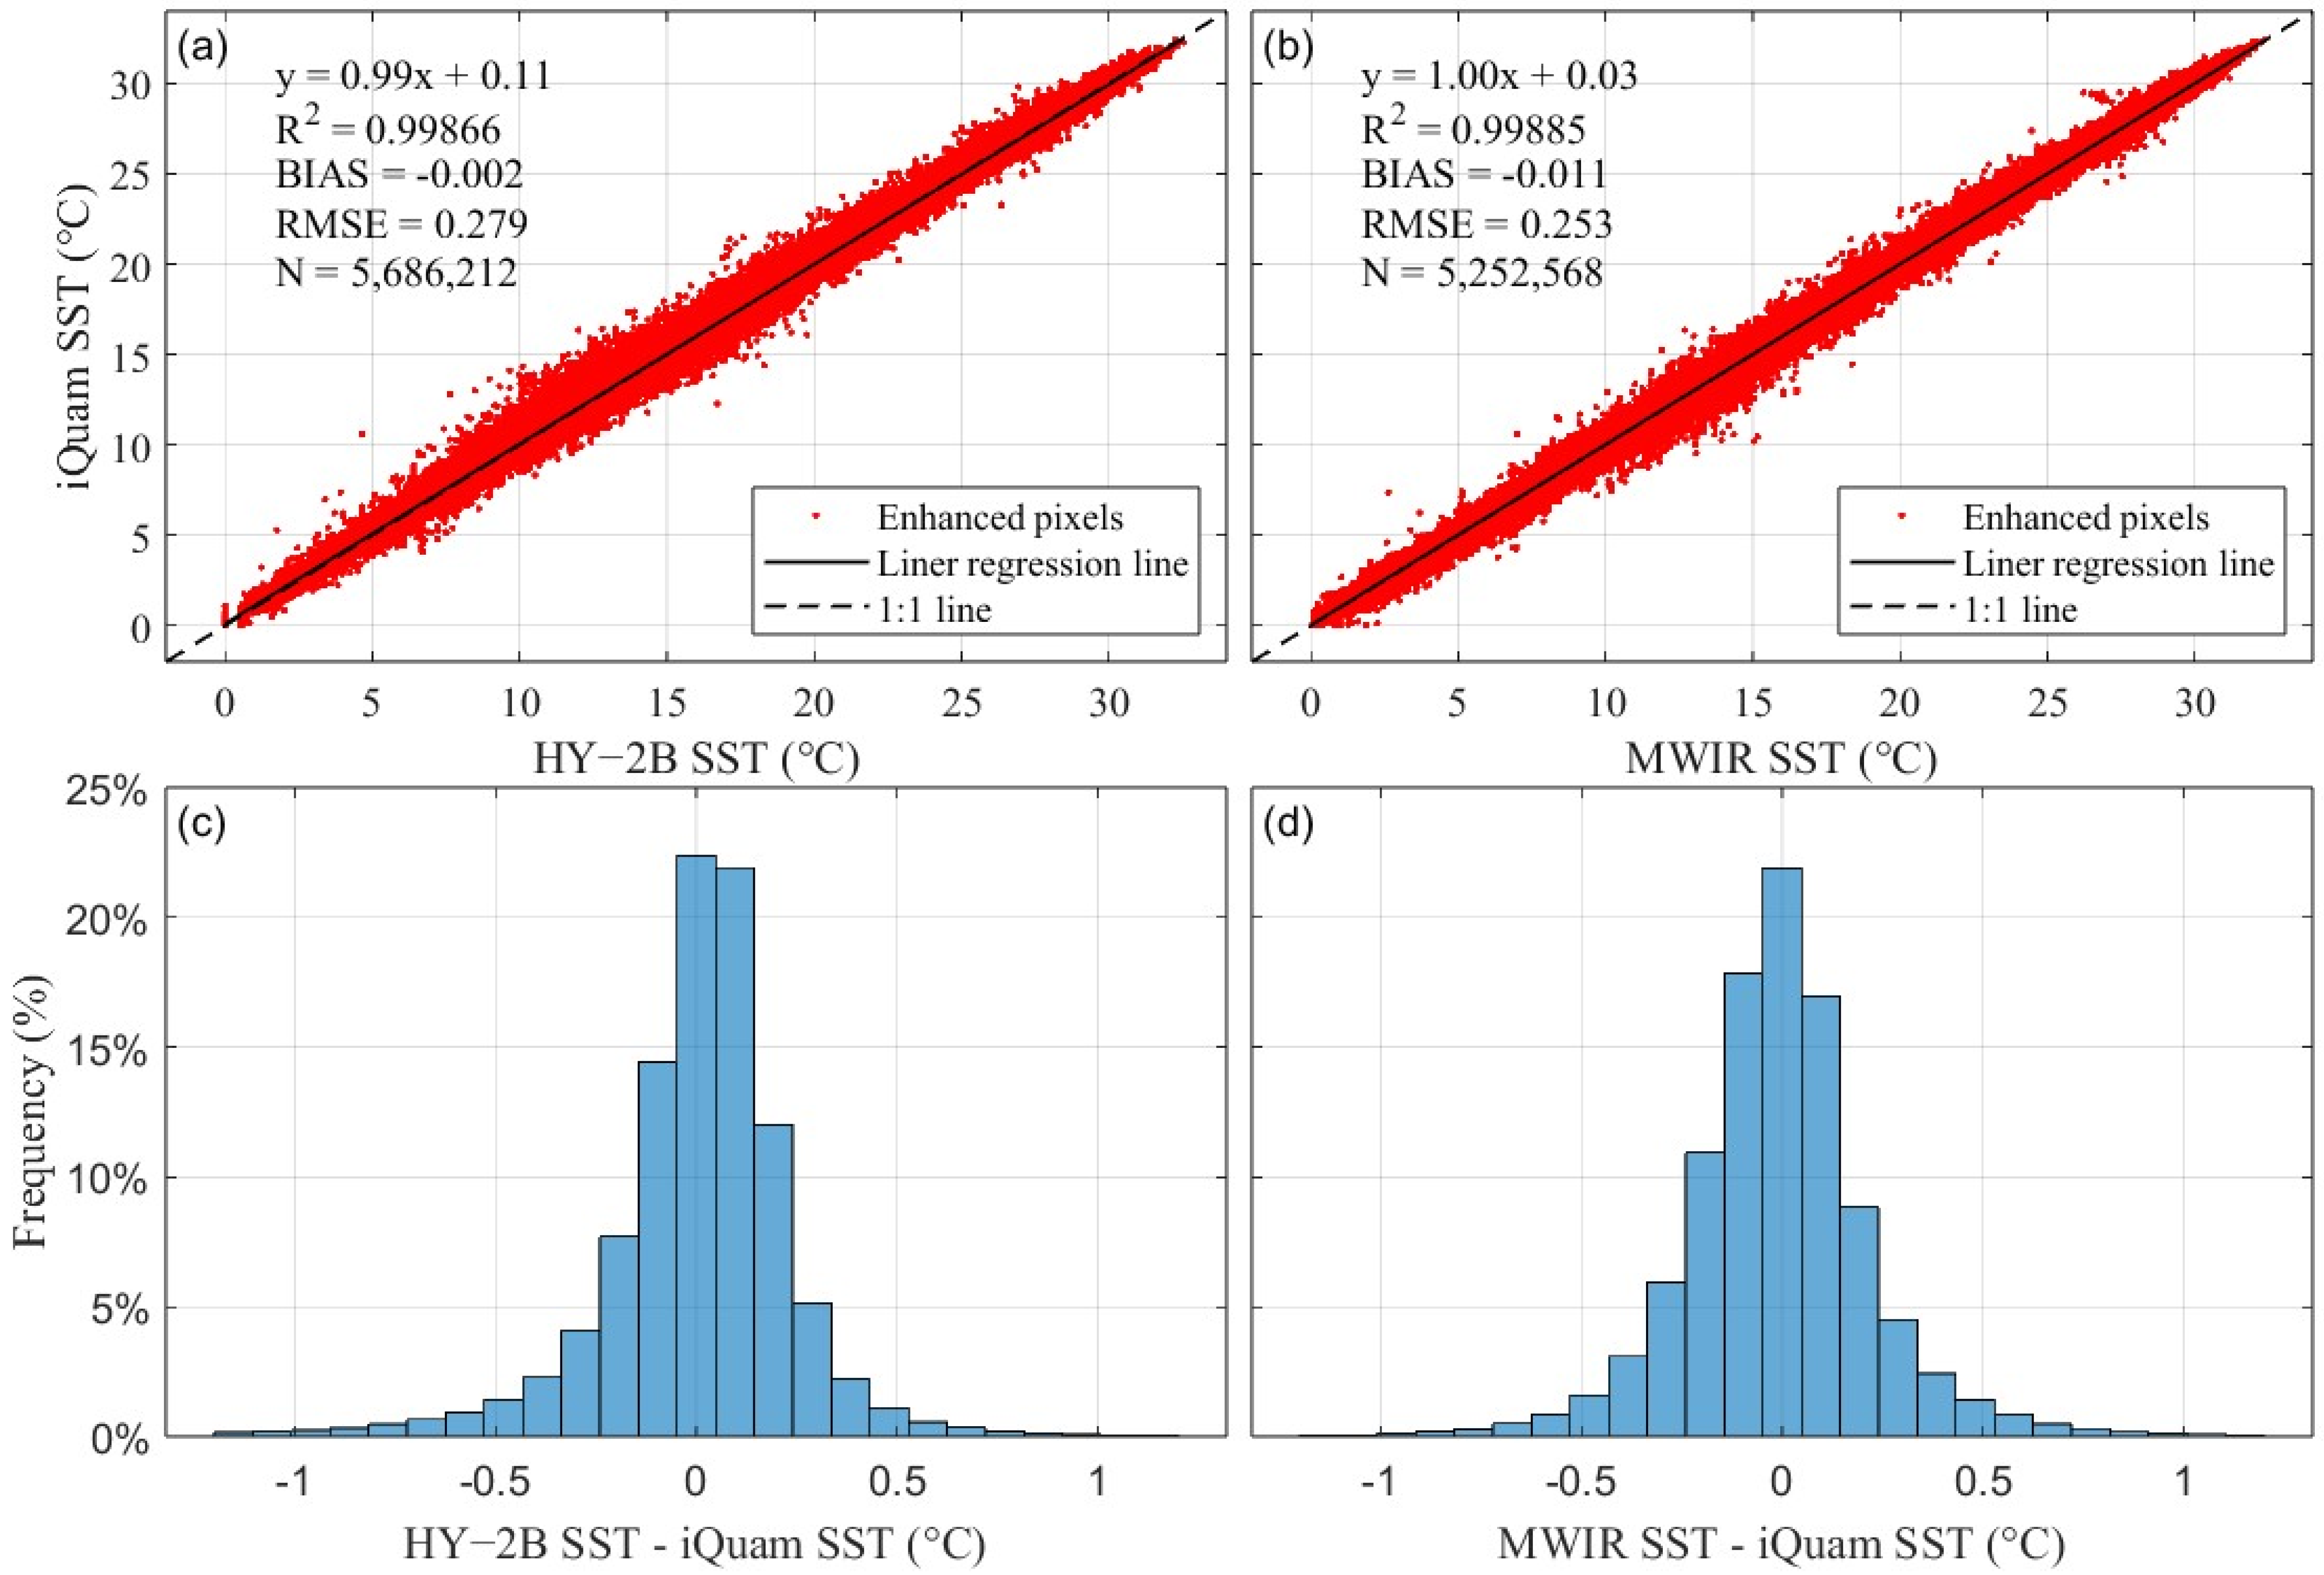
Figure 4 shows scatter plots and bias histograms comparing the HY-2B and MWIR SST products with the iQuam in situ observations over the period of October 2023–March 2025. In each scatter plot, the data cluster tightly around the 1:1 line, with regression slopes very close to unity and coefficients of determination (R2) exceeding 0.99. The bias histograms for both products are approximately normal and centered near zero, with most differences within ±0.5 °C. These results demonstrate strong consistency between the satellite SST products and the in situ measurements.
Table 1 summarizes the comparison statistics (bias, RMSE, R2) for HY-2B and MWIR versus iQuam, broken down by platform (All, Ship, Drifter, T-M, C-M). For HY-2B versus iQuam (all platforms), the mean bias is –0.002 °C, RMSE is 0.279 °C, and R2 is 0.9987. The lowest RMSE values are found for drifters (0.177 °C) and tropical moored buoys (0.145 °C), with corresponding R2 values of 0.9994 and 0.9903. In contrast, ship and coastal moored observations yield higher RMSEs (0.427 °C and 0.376 °C, respectively). For MWIR versus iQuam, the overall bias is –0.011 °C and RMSE is 0.253 °C. MWIR also performs best on drifters (RMSE 0.205 °C) and tropical moored buoys (0.175 °C), while ships and coastal moorings have RMSEs of 0.337 °C and 0.350 °C, respectively. Both satellite products achieve similar overall accuracy (R2 > 0.99), performing particularly well on drifter and tropical buoy platforms.
These results suggest that drifter and tropical moored buoys, which sample relatively uniform open-ocean waters, yield the highest agreement with satellite SST (lowest representativeness error). By contrast, ships and coastal moorings often operate in regions with strong SST gradients or local disturbances, leading to larger point errors. In those heterogeneous environments, representativeness errors increase. Notably, on drifter and T m platforms, HY-2B exhibits the smallest random errors, whereas its errors are larger for ship-based data. Overall, the HY-2B and MWIR products demonstrate comparable accuracy (R2 > 0.99), but platform-specific differences highlight distinct observational characteristics.
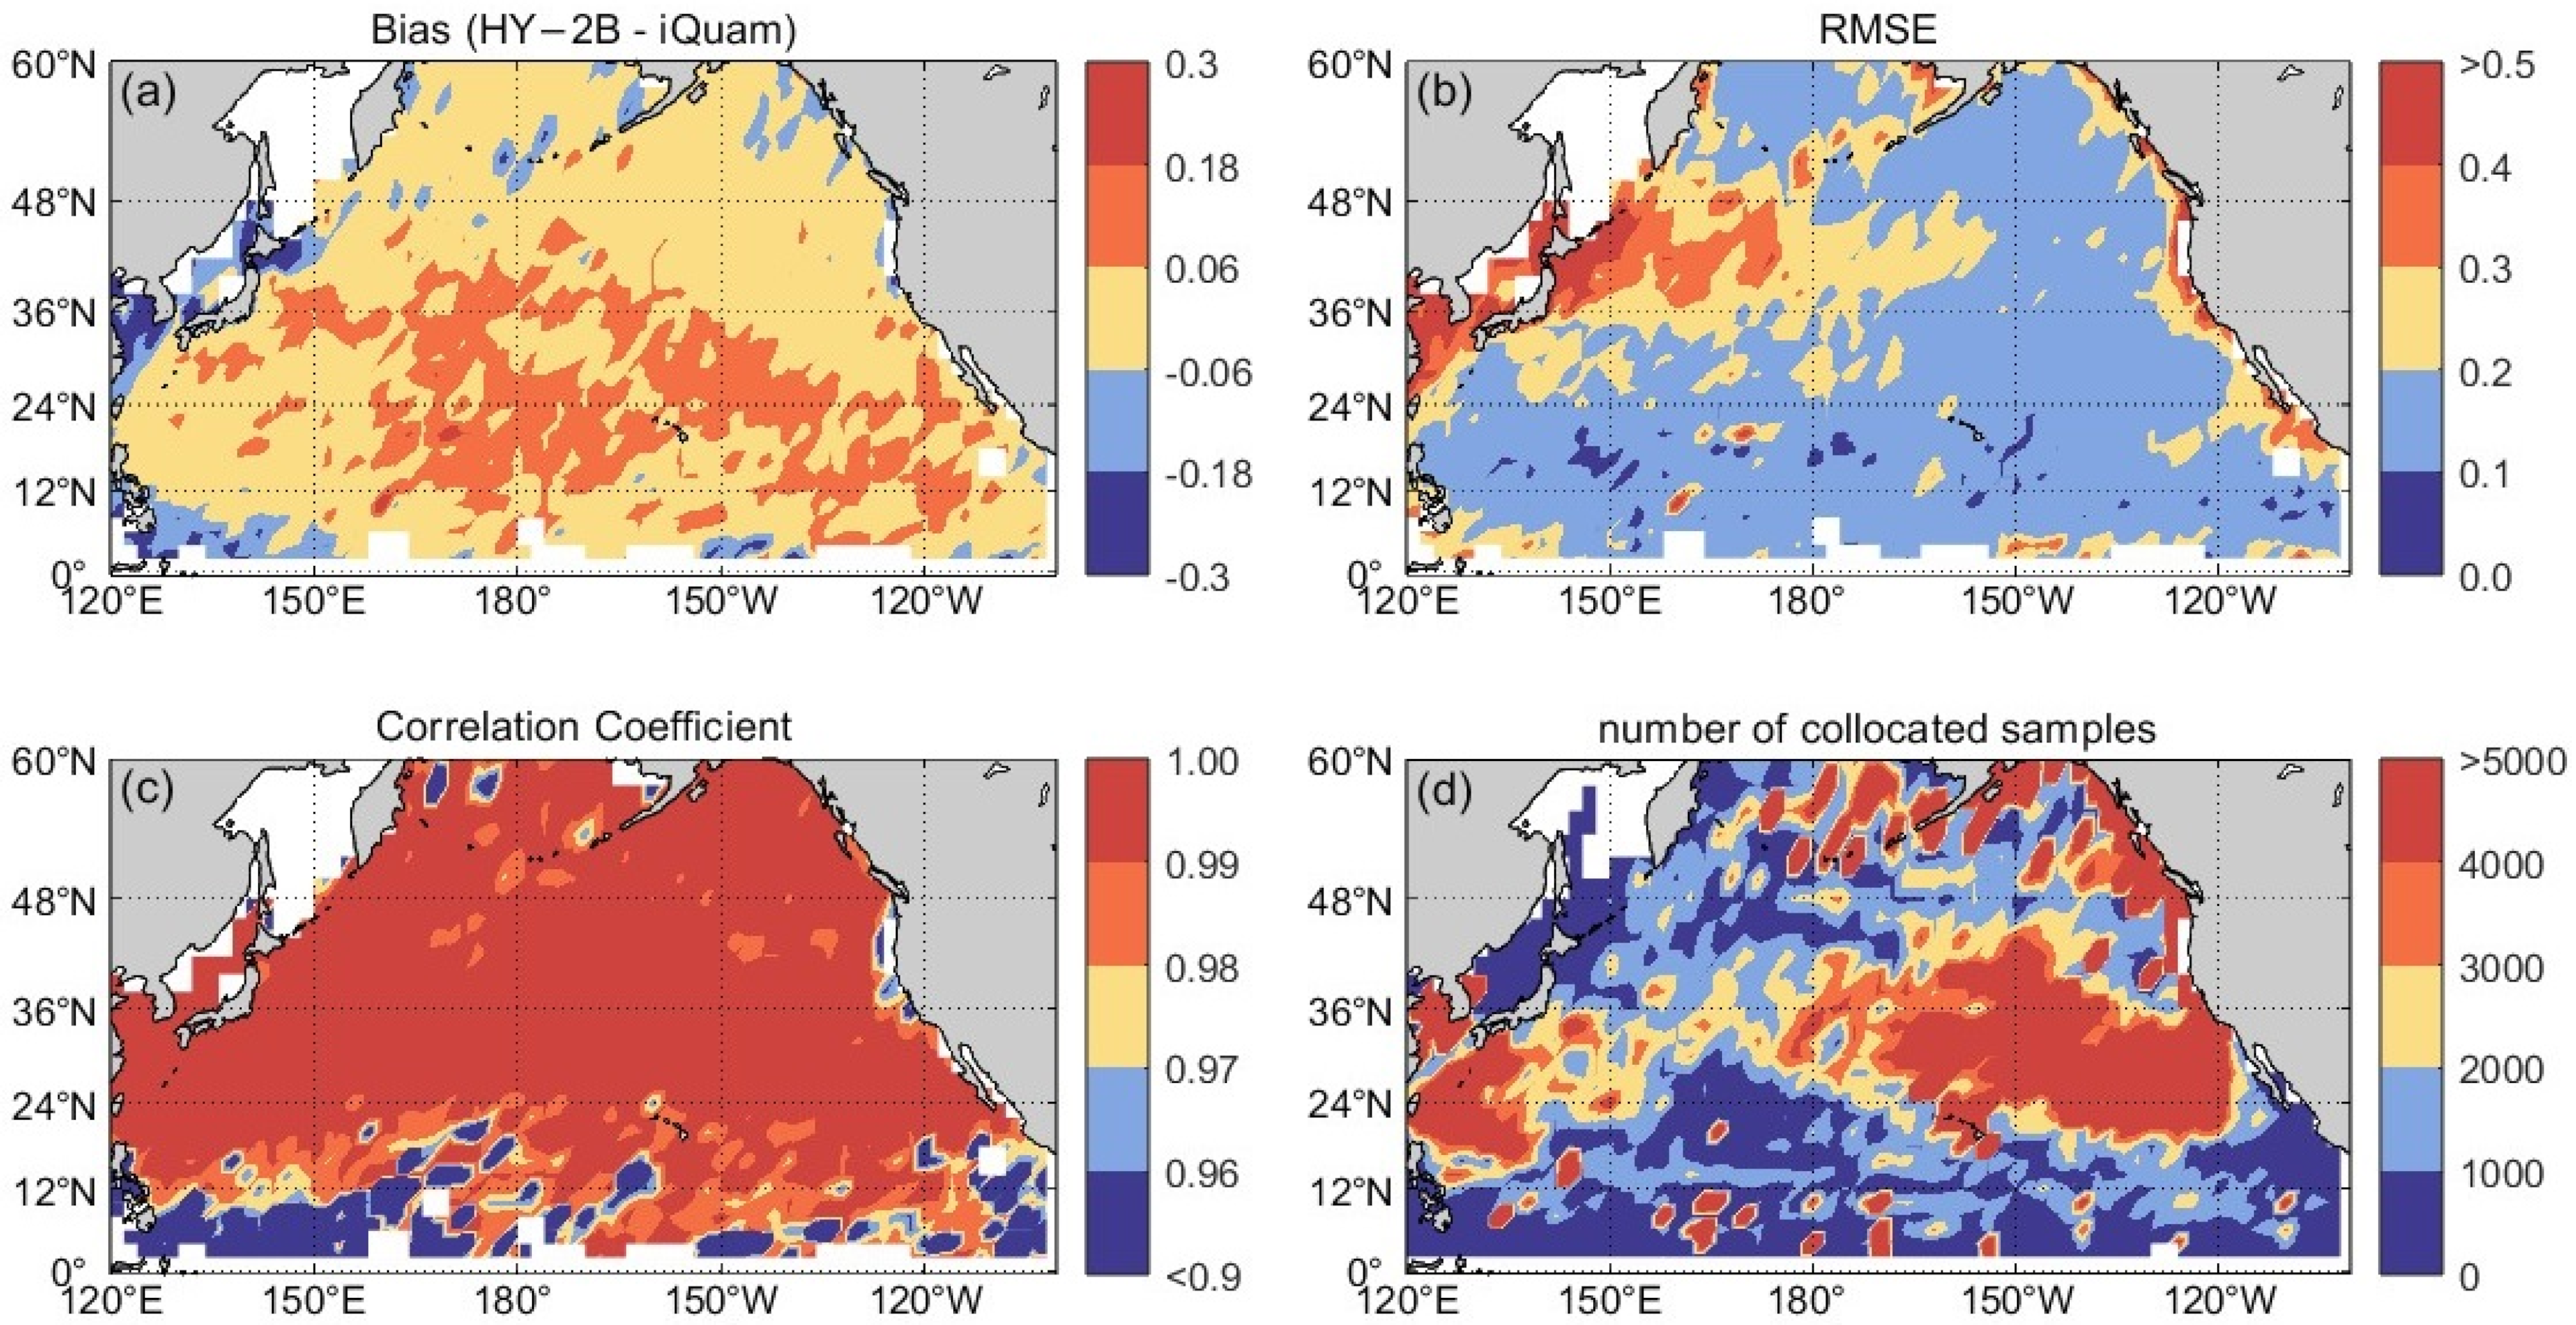
Figure 5 displays the spatial distribution of HY-2B SST error metrics (bias, RMSE, and Pearson’s R) on a 2° × 2° grid (HY-2B vs. iQuam). In mid- to high-latitude open-ocean regions, biases cluster near zero and RMSE remains below 0.25 °C, with R exceeding 0.99, indicating excellent agreement where sea conditions are homogeneous and sampling is dense. In contrast, coastal zones and data-sparse equatorial areas exhibit pronounced negative biases (down to –0.1 °C), elevated RMSE (up to 0.4 °C), and slightly reduced R (around 0.95), reflecting increased representativeness error and local disturbances. Notably, these spatial patterns show no clear seasonal drift: overall, bias and RMSE stay low and uniform in well-sampled open waters, whereas accuracy degrades in heterogeneous or sparsely observed regions.

3.2. Comparison of Fusion SST Products

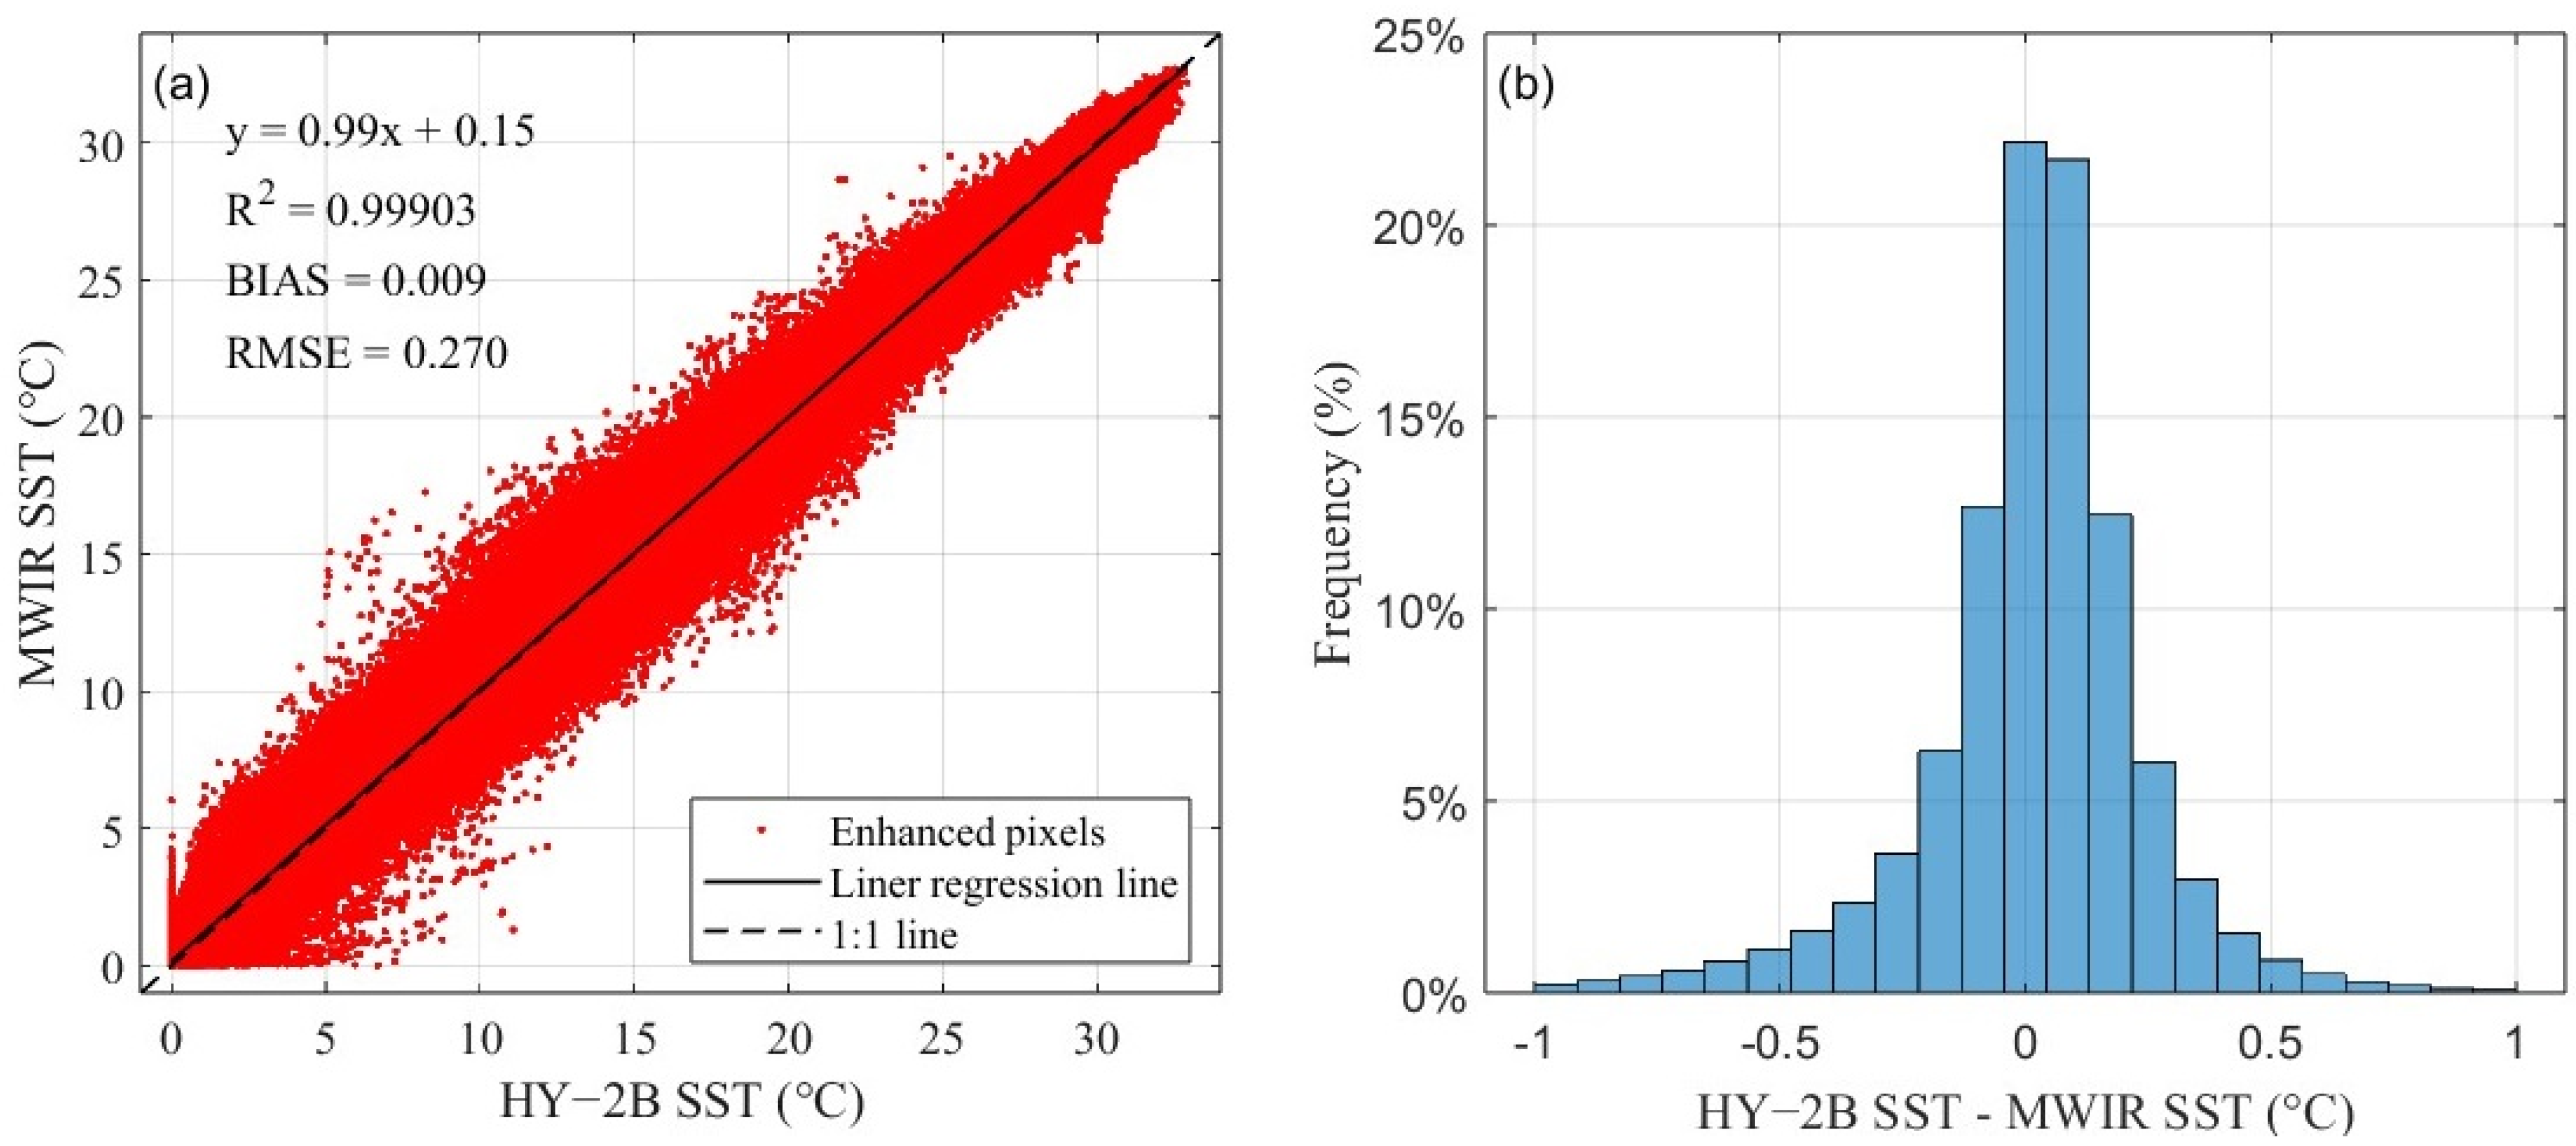
Figure 6 compares the HY-2B and RSS MWIR SST fusion products directly. The scatter density plot shows the HY-2B SST on the x-axis versus the MWIR SST on the y-axis. The data points cluster tightly around the 1:1 reference line. A linear fit yields y = 0.99x + 0.15 °C with R2 = 0.999, indicating extremely strong agreement. The overall mean bias (HY-2B minus MWIR) is only 0.009 °C, with an RMSE of 0.287 °C. The bias distribution is approximately normal and centered near zero, with the majority of errors within ±0.5 °C. In summary, HY-2B and MWIR fusion products show negligible systematic and random differences under large-sample conditions, confirming their exceptional consistency and reliability.
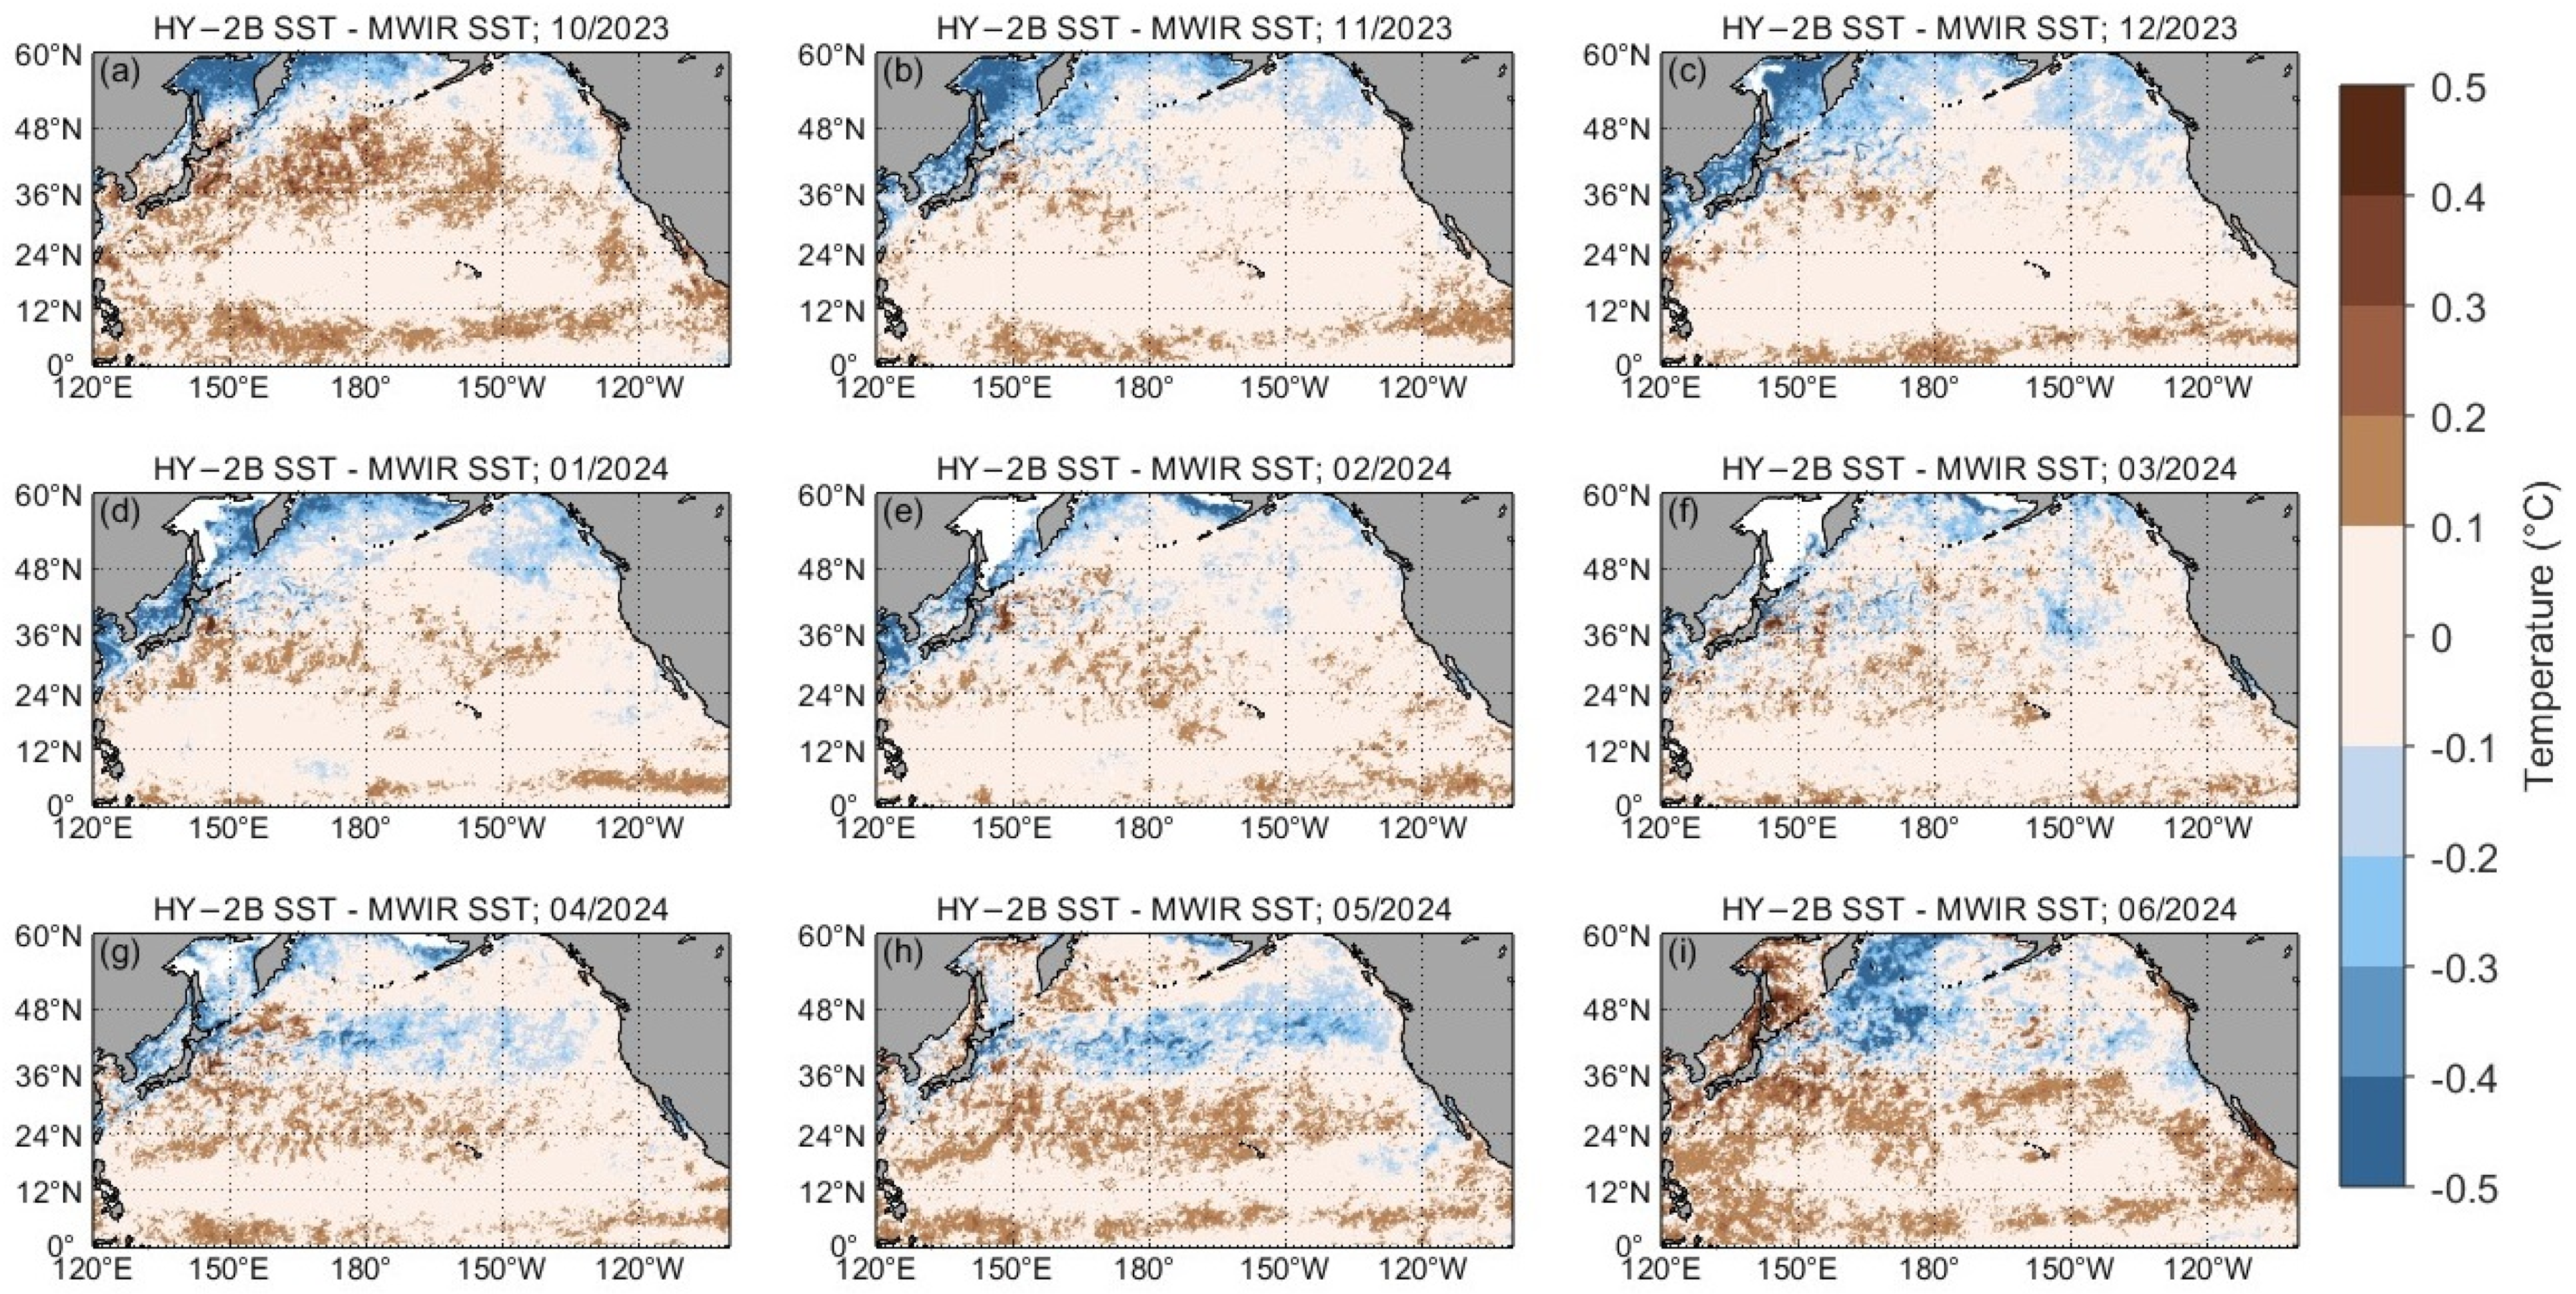
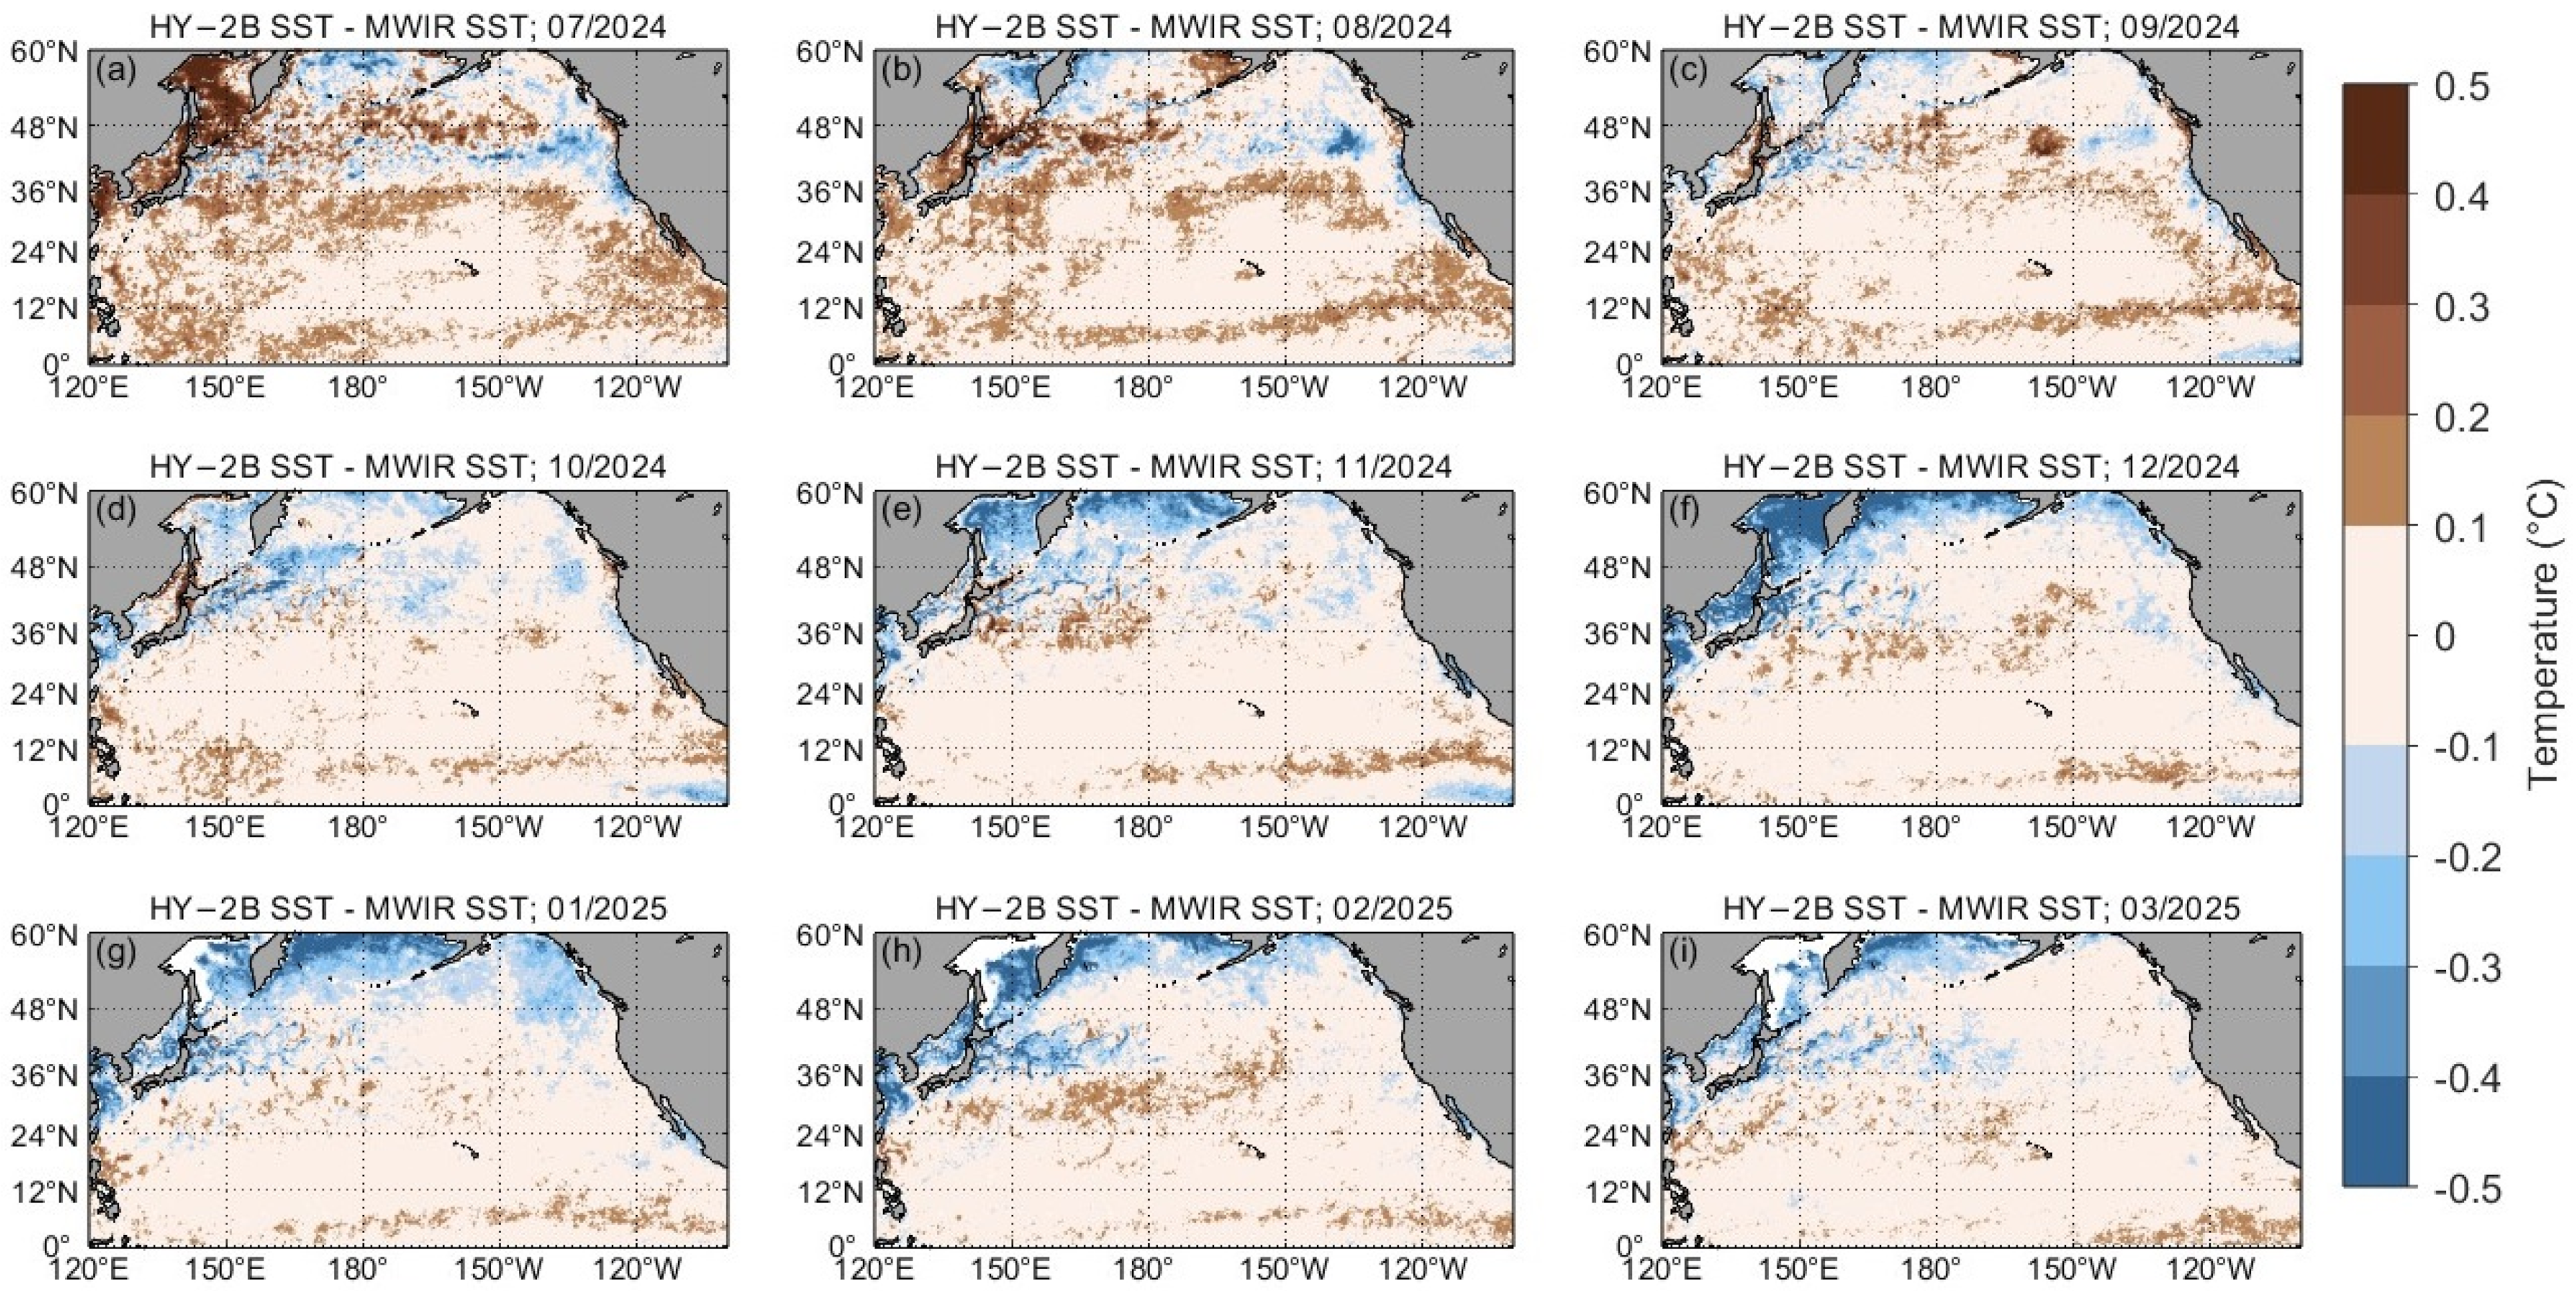
Figure 7 and Figure 8 present monthly maps of the HY-2B minus MWIR bias from October 2023 to March 2025. In general, these maps reveal no systematic seasonal drift. Equatorial regions remain near zero bias year-round, with no obvious zonal trends. Small alternating positive/negative bias patterns appear in mid- and high-latitude seas. For example, the Sea of Okhotsk exhibits a positive bias from January to July and a negative bias from August to December. During boreal summer (June–August), bias hotspots emerge in the northwestern Pacific, the Sea of Okhotsk, and the Sea of Japan—likely associated with the Kuroshio Extension and other regional dynamics [52]. In boreal winter (December–February), these regions show negative biases (HY-2B cooler than MWIR). Overall, biases are concentrated in high-latitude and coastal areas, while open-ocean biases remain minimal and uniform. These monthly maps confirm the absence of any significant seasonal drift: errors appear randomly distributed, and the relatively short time span of this study precludes definitive identification of longer-term seasonal or regional biases.

3.3. ETC Analysis Results

Extended triple collocation (ETC) was used to evaluate the performance of the three independent SST datasets (HY-2B, MWIR, and iQuam) on each platform. ETC separates the random error variance of each system from representativeness error. The resulting error standard deviation (ESD) quantifies the unbiased random error, and the sub-sampled signal-to-noise ratio ( SNR sub ) indicates the relative strength of the true signal. Table 2 lists the ETC analysis results for HY-2B, MWIR, and iQuam data across various platforms. From this, we observe a significant difference between ETC-based ESD and conventional RMSE, as ESD excludes the influence of representativeness errors [53,54]. At the aggregate level (all platforms), iQuam has the smallest ESD (0.157 °C), followed by HY-2B (0.163 °C), and MWIR has the largest (0.196 °C). The corresponding SNR sub values are very close to 1 (0.9996 for iQuam and HY-2B, 0.9993 for MWIR), indicating that all three systems have strong detection capability for true SST variations.
Platform-specific results reveal that the lowest errors occur on drifter and tropical moored buoy platforms. For drifters and tropical moorings (T-M), the ESDs are as follows: iQuam = 0.123 °C and 0.111 °C (T-M); HY-2B = 0.120 °C and 0.088 °C; MWIR = 0.164 °C and 0.115 °C, respectively. In contrast, ships and coastal moorings show higher ESD values for all datasets. This pattern likely arises because drifters and T-M buoys are generally located in the open ocean, where conditions are more stable and representativeness errors are low. Notably, on the drifter and T-M platforms, HY-2B’s ESD is slightly lower than iQuam’s, indicating that HY-2B SST achieves exceptionally high precision under those conditions. Overall, iQuam exhibits the highest accuracy (smallest ESD) as expected, while HY-2B provides better accuracy than MWIR across all platforms.

4. Discussion

Our results indicate that the HY-2B L4A fusion SST product performs exceptionally well. The scatter plots (Figure 4 and Figure 6) show that both HY-2B and MWIR products are highly consistent with each other and with in situ observations, with most errors randomly distributed within ±0.5 °C. In situ validation reveals that HY-2B has essentially zero mean bias over the study period and a low RMSE (~0.2–0.3 °C). This represents a substantial improvement over earlier HY-2B Level-2B products: for example, previous work reported a bias of 0.1 °C and an RMSE of 0.87 °C for the HY-2B L2 SST [17]. Thus, the L4 fusion processing appears to significantly reduce systematic errors and improve accuracy. Overall, the HY-2B L4A product exhibits very small systematic errors and high correlation with in situ SST.
Previous studies have shown that environmental parameters such as sea surface wind speed, atmospheric water vapor, and cloud liquid water can introduce errors in SST retrieval. As sea surface wind speed increases, sea surface roughness and foam increase, altering microwave emission characteristics and thereby increasing SST retrieval uncertainty. Additionally, water vapor and cloud liquid water in the atmosphere both absorb and scatter microwave signals, increasing the complexity of atmospheric correction. These factors can induce inter-channel crosstalk effects, significantly impacting SST retrieval accuracy [55].
We analyzed the variation patterns of HY-2B SST error metrics (ESD, SNR sub , bias, and RMSE) with respect to environmental variables (time, latitude, sea surface temperature, wind speed, columnar water vapor, and columnar cloud liquid water) to comprehensively evaluate its performance.

4.1. Time-Dependent Characteristics of SST Errors

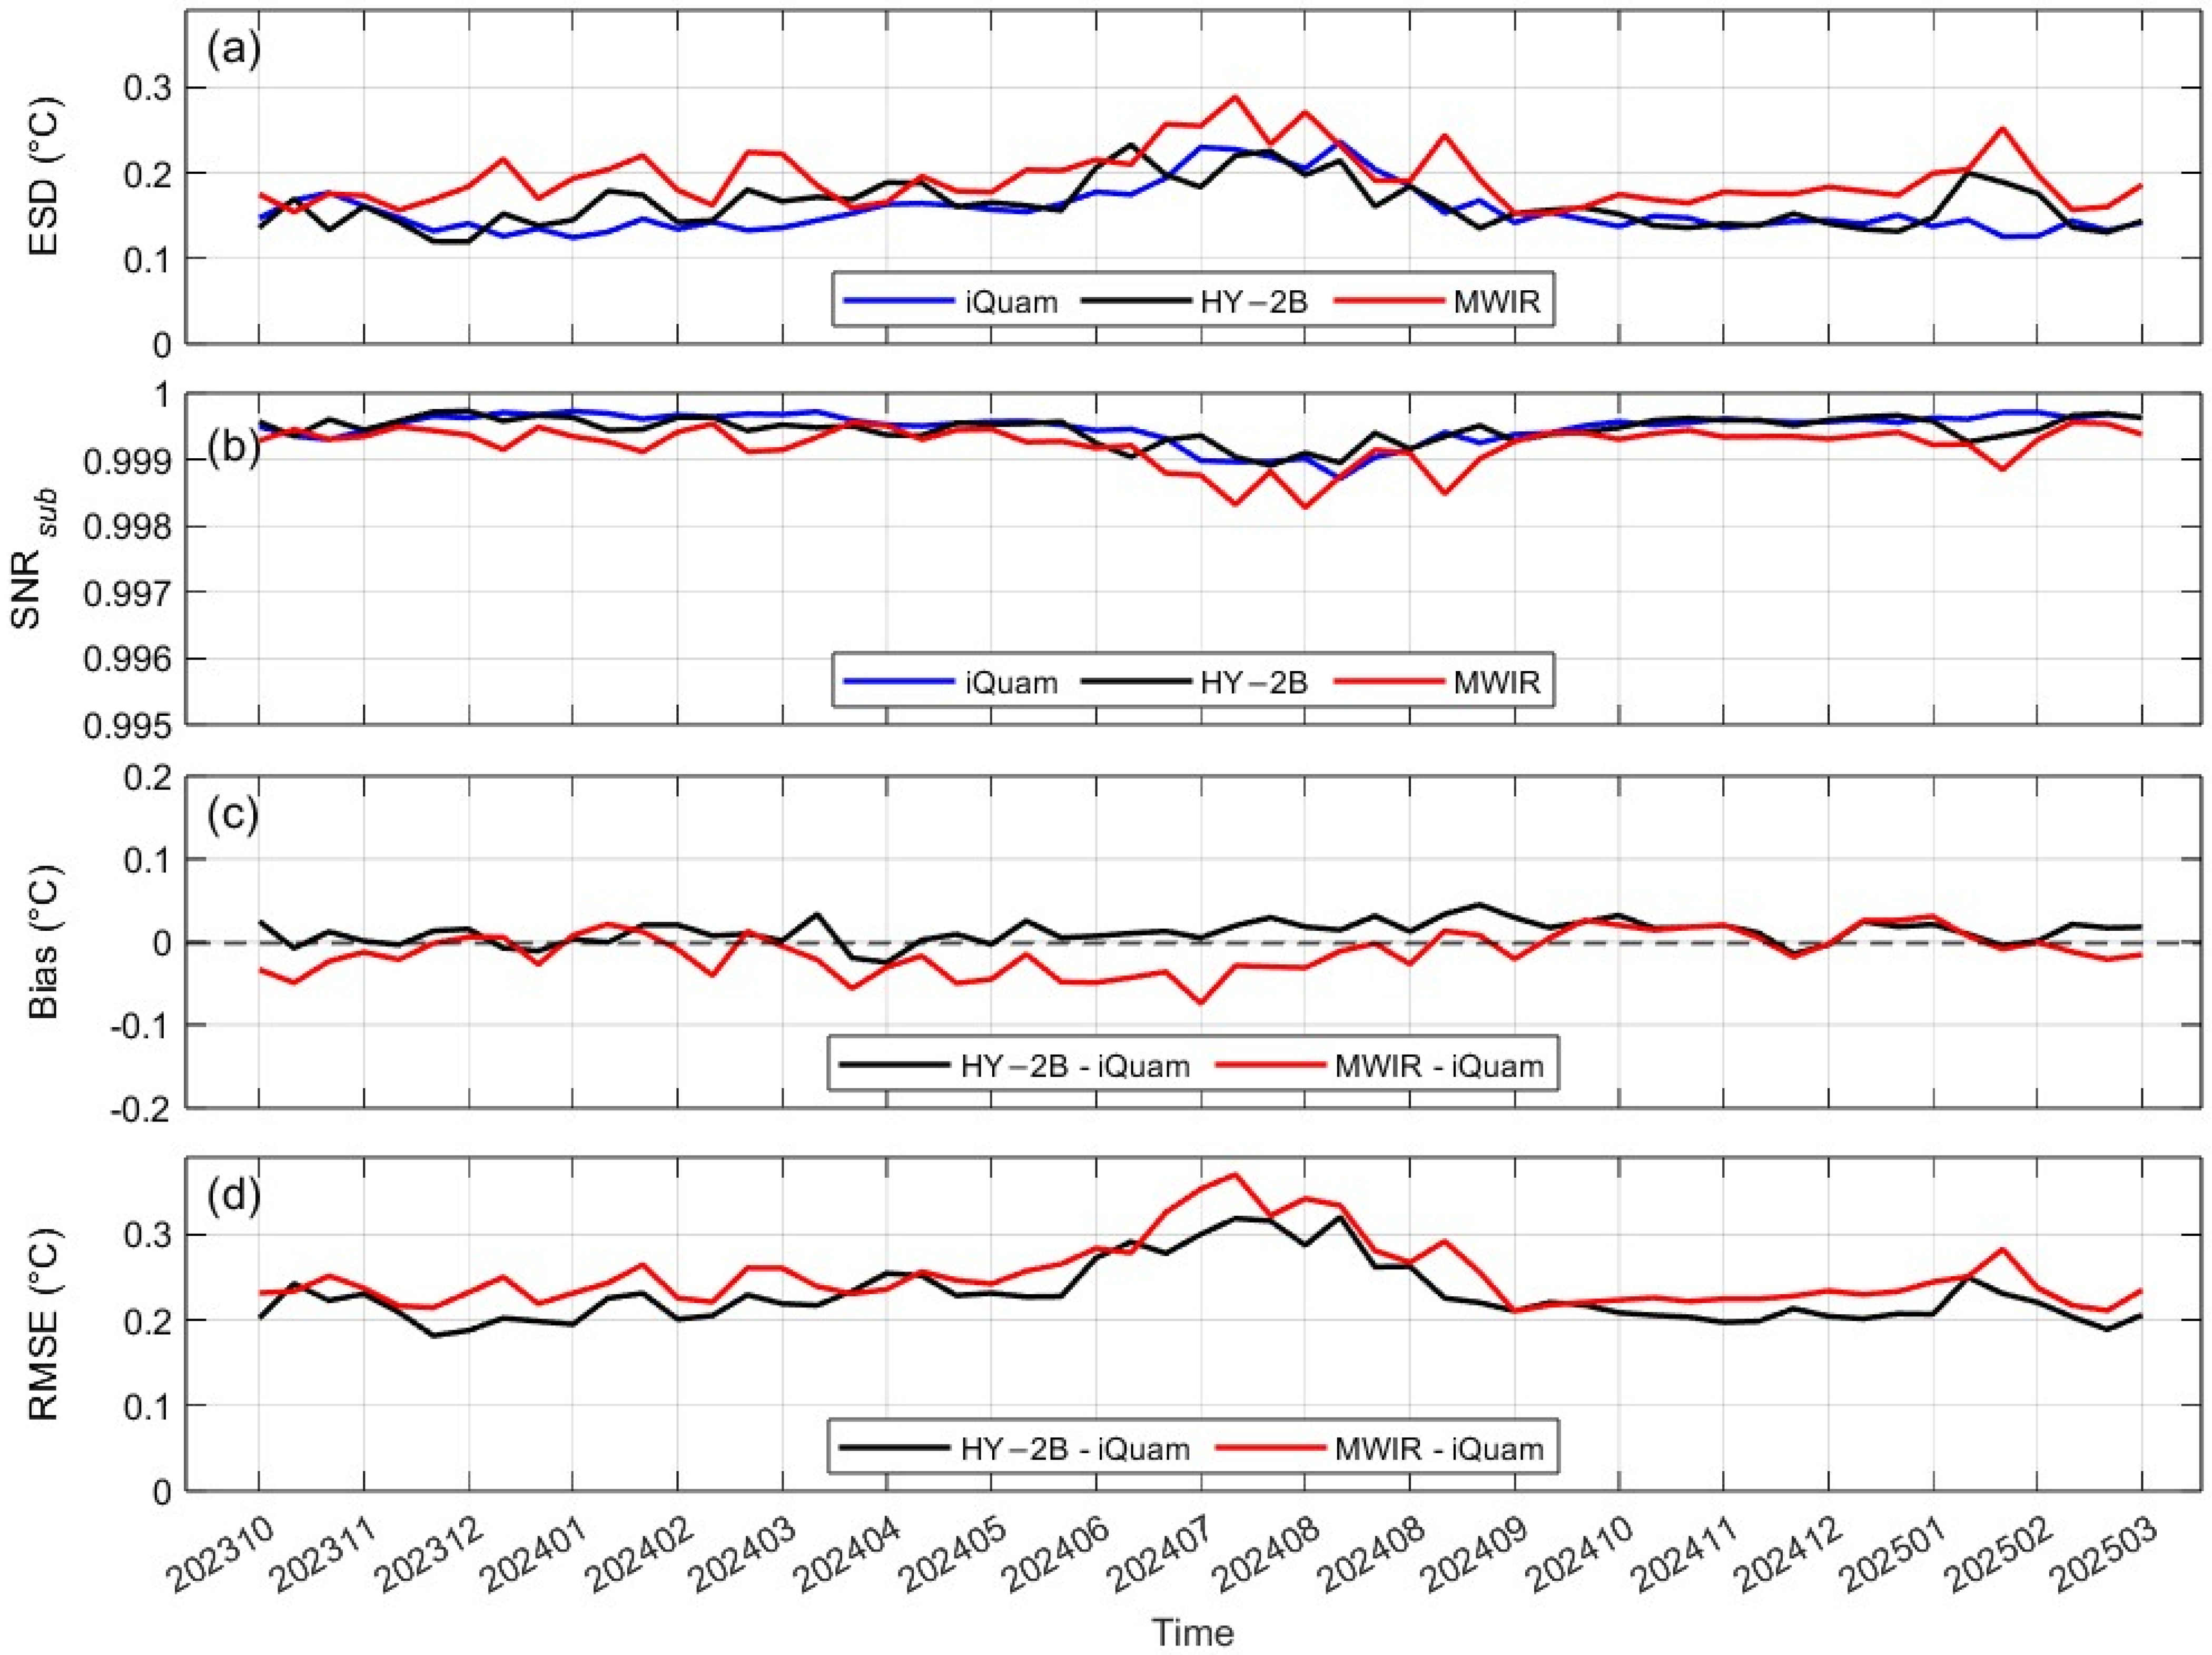
Figure 9 shows the evolution of error metrics from October 2023 to March 2025 (10-day averages). All products remain generally stable over time. In Figure 9a, HY-2B and iQuam maintain low ESD (<0.2 °C) and high SNR sub (>0.999) throughout the period, with their curves nearly overlapping. MWIR has a slightly higher ESD and marginally lower SNR sub , but its temporal trend closely follows HY-2B. Figure 9b shows that SNR sub stays above 0.998 for all products, indicating a consistently high degree of agreement.
Figure 9c,d indicate that the HY-2B bias relative to iQuam fluctuates around 0 °C with no obvious trend, and RMSE fluctuates around 0.2 °C. The bias and RMSE time series for MWIR are similarly flat. Notably, both satellite products exhibit somewhat higher ESD and RMSE during boreal summer (June–August); MWIR in particular shows a noticeable bias increase in that period, possibly due to stronger solar heating affecting the sensors. Over the entire period, however, the consistency among HY-2B, MWIR, and iQuam remains high. This suggests that both satellite products have stable time-series quality, with no significant drift or degradation over the six-month span.

4.2. SST Error Characteristics at Different Latitudes

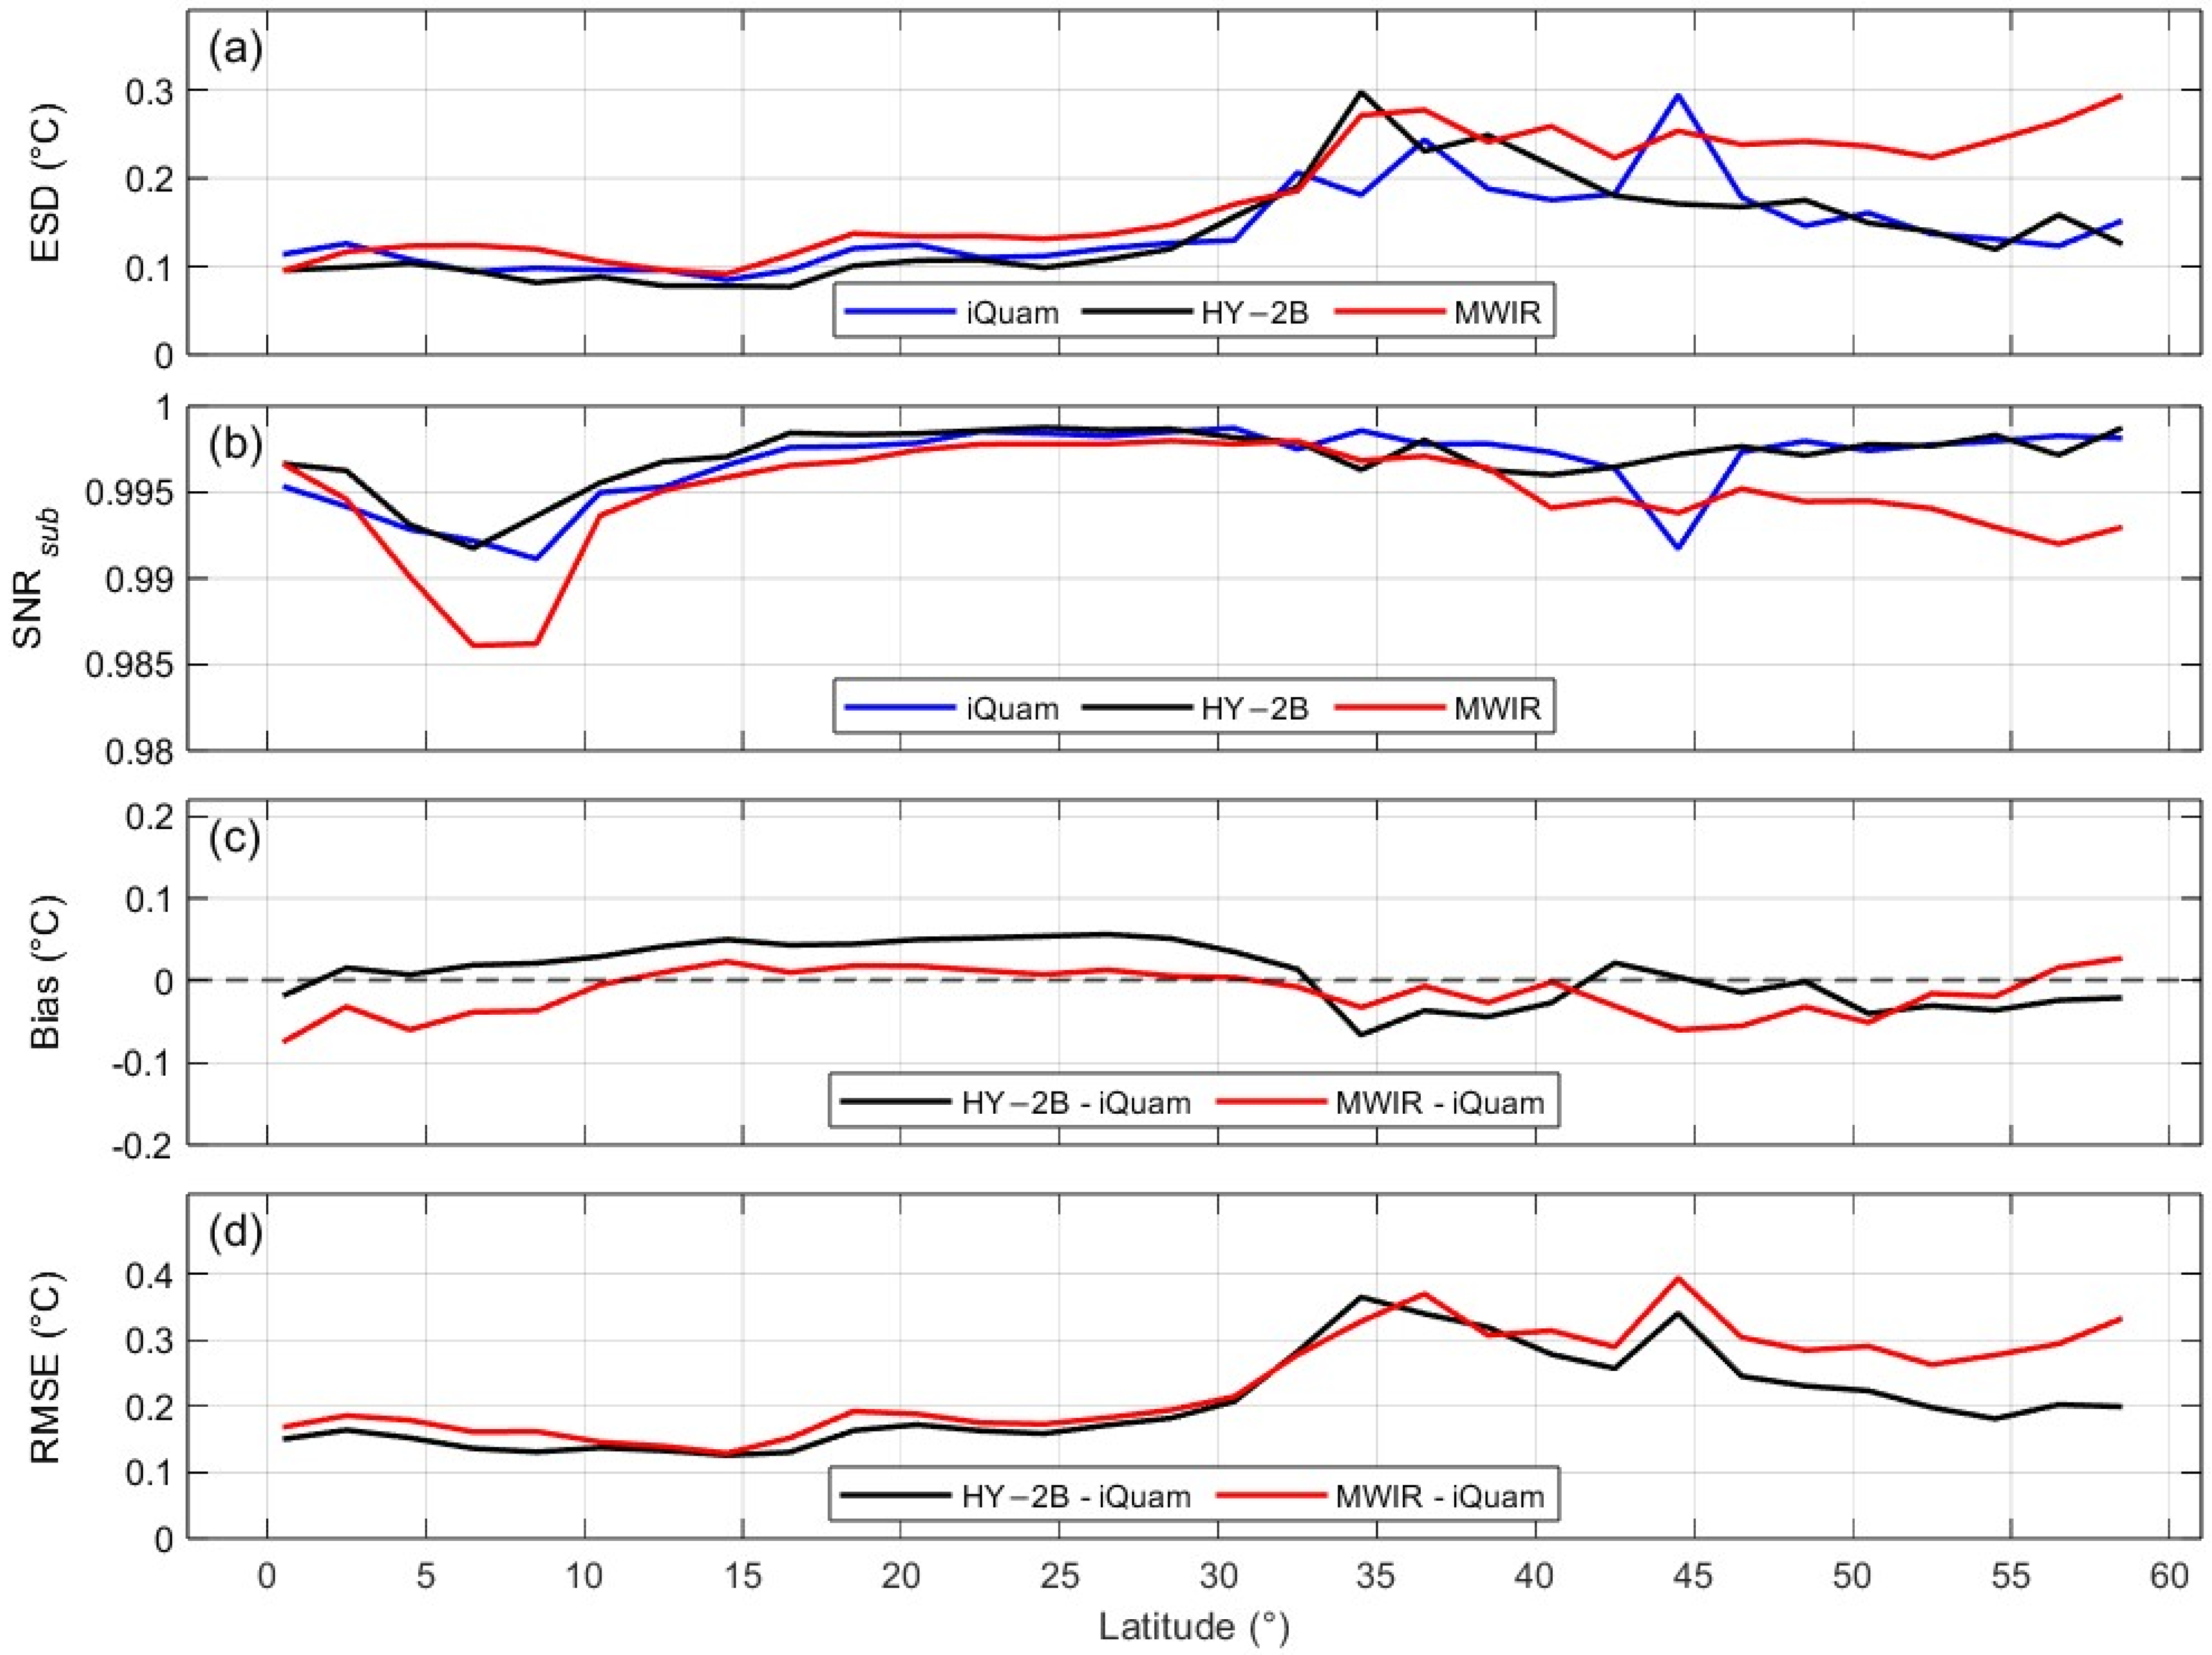
Figure 10 shows error metrics as a function of latitude (0–58°N). In Figure 10a, the ESD for all three products increases with latitude from 0° up to about 35°N. Beyond 35°N, the MWIR ESD remains roughly between 0.2 and 0.3 °C, while iQuam and HY-2B ESD gently decline with further latitude. Figure 10b shows that SNR sub stays above 0.99 at all latitudes, with only small dips around 8°N and 44°N. Above 50°N, SNR sub fluctuates more significantly for all products, reflecting increased random error. These high-latitude fluctuations are likely due to stronger winds and more variable conditions, which degrade SST accuracy.
Figure 10c indicates that HY-2B bias (relative to iQuam) closely mirrors MWIR bias across latitudes: slight positive biases occur in low latitudes and slight negative biases in mid-to-high latitudes. Over 0–55°N, the difference in bias between HY-2B and MWIR remains within ±0.1 °C. Figure 10d shows that both satellite products have increasing RMSE (and ESD) with latitude up to 35°N, then a gradual decrease. The similarity in latitudinal error trends suggests that both products respond similarly to environmental changes with latitude. In summary, SST errors generally grow with latitude into mid-latitudes due to harsher conditions (higher winds, etc.) but then stabilize, and both HY-2B and MWIR exhibit comparable error behavior as a function of latitude.

4.3. Changes in SST Error Characteristics at Different Temperatures

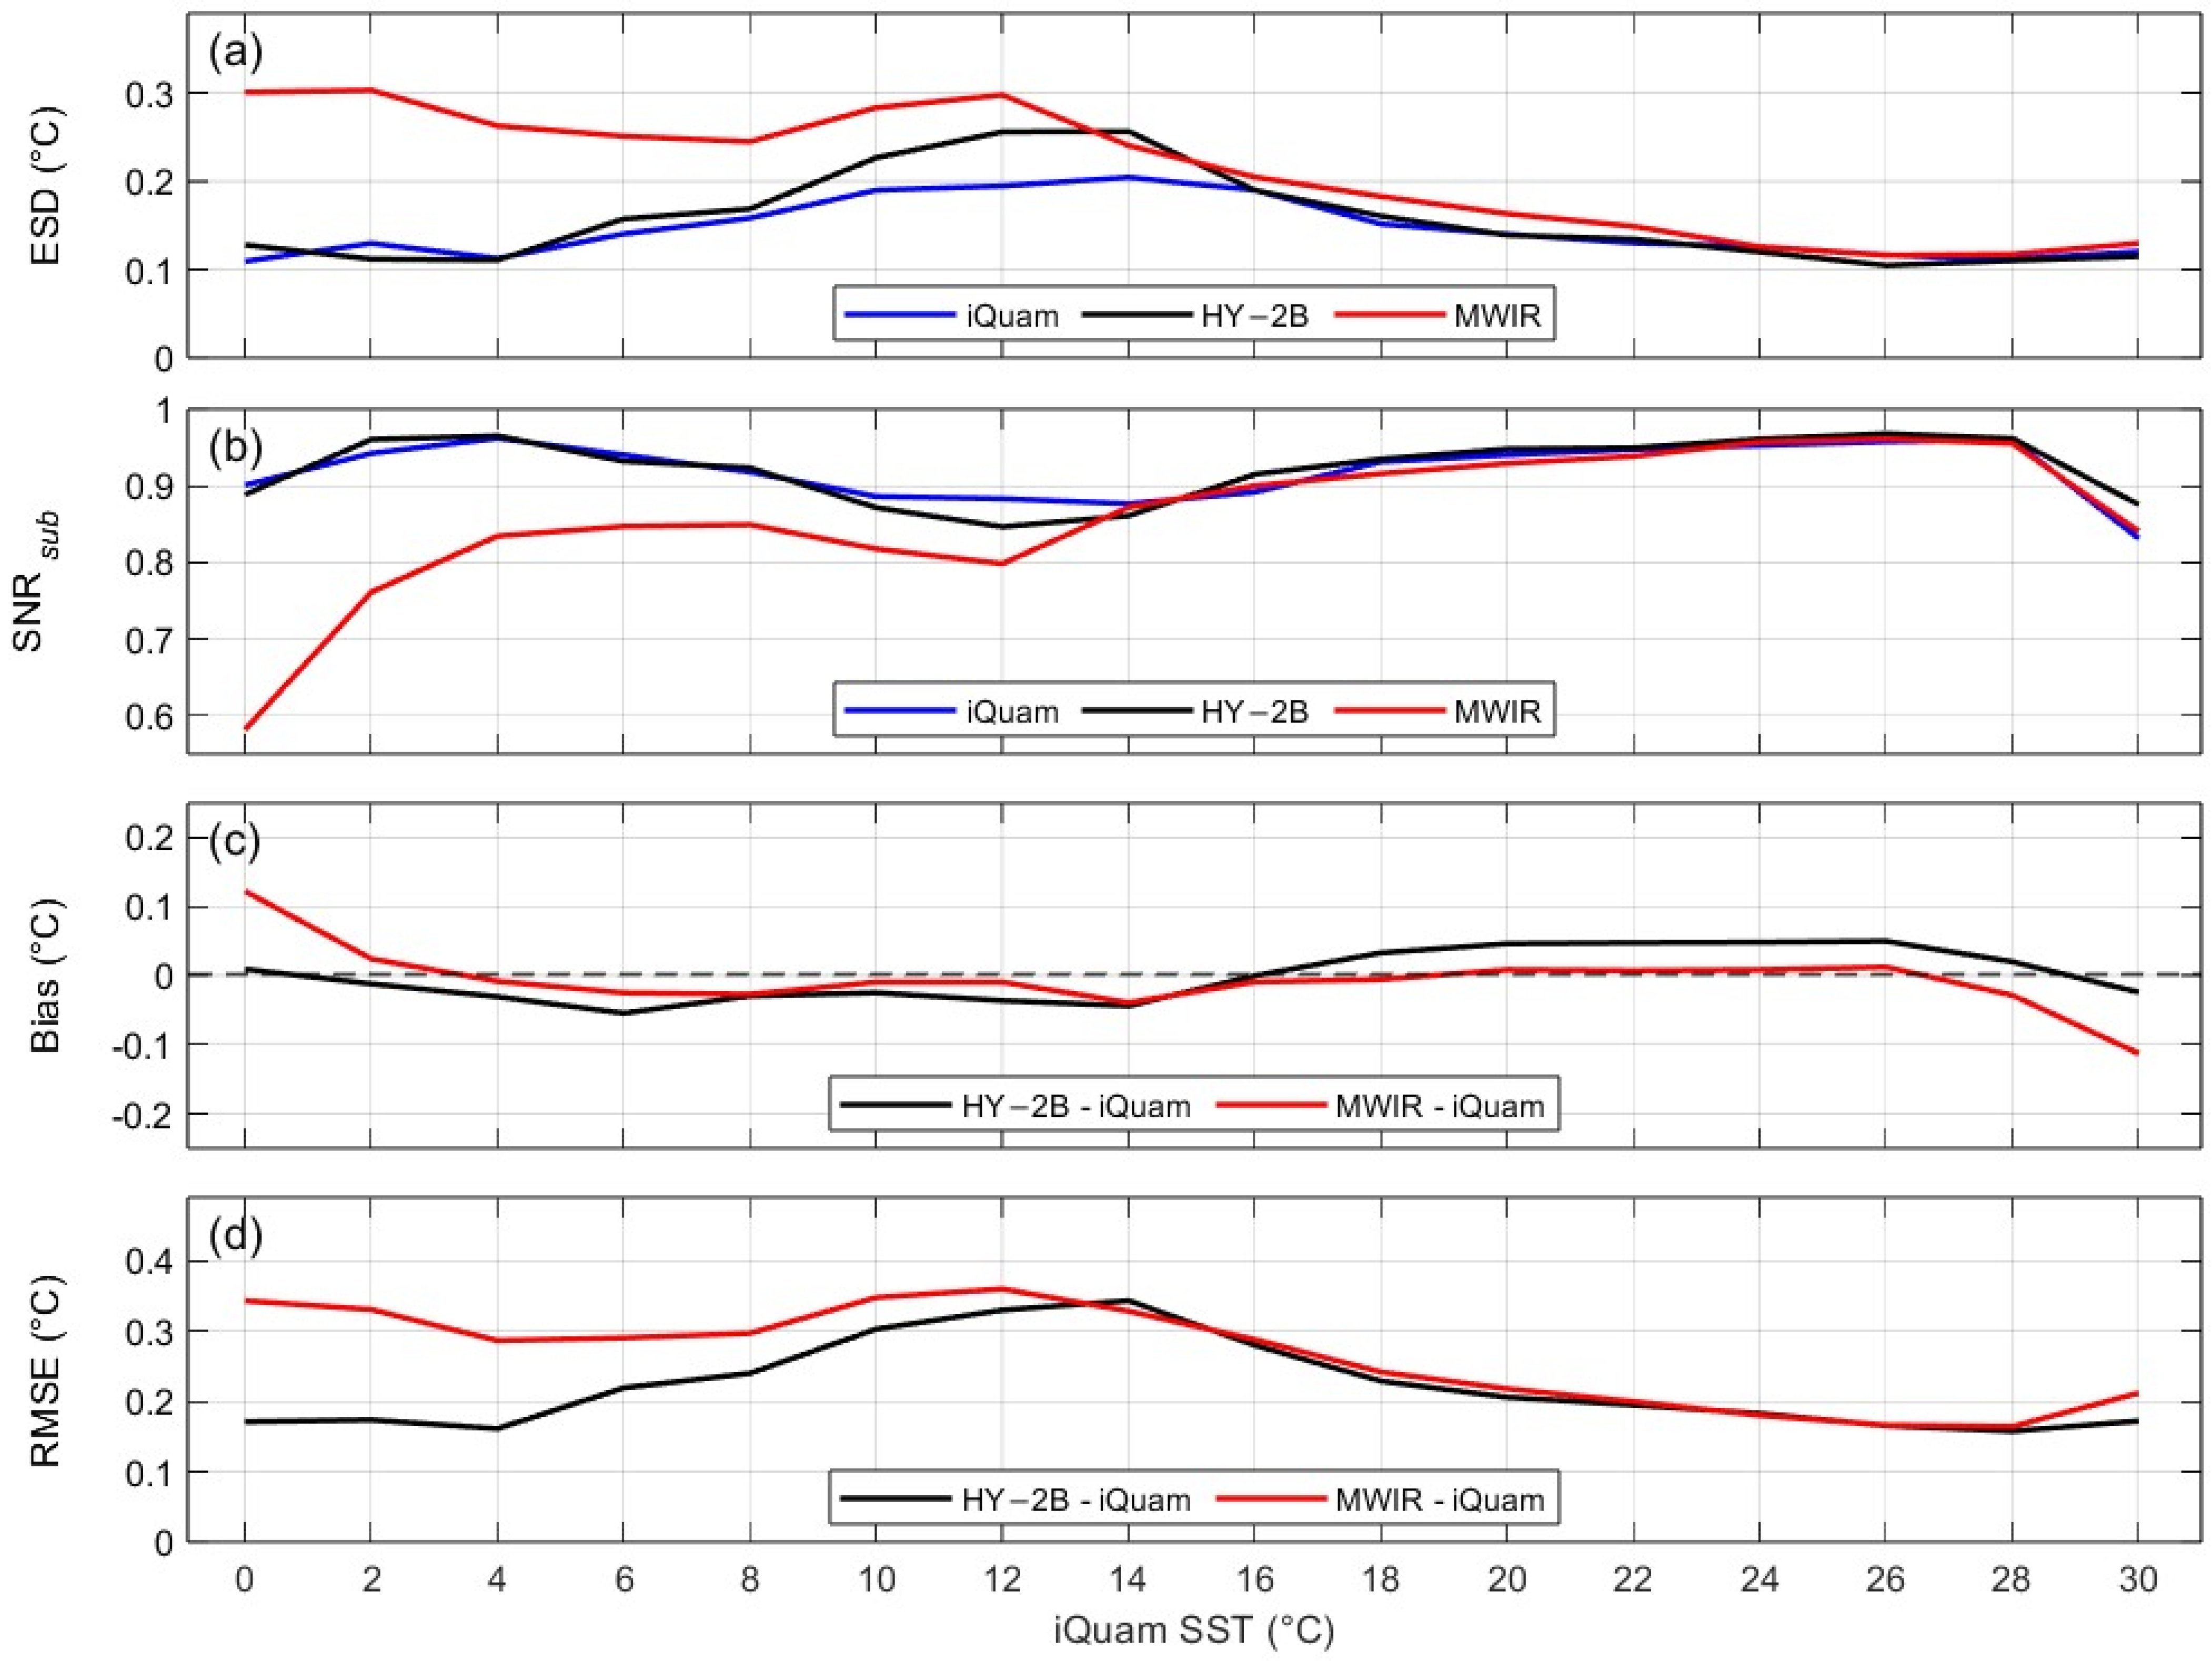
Figure 11 shows the changes in error characteristics within the 2 °C in situ sea surface temperature interval, ranging from 0 to 30 °C. Since there are few data matching points above 30 °C, these data will be excluded in this paper. The ESD changes of HY-2B and iQuam are similar. Within the 0 to 14 °C range, the ESD of both systems increases with rising temperature. In contrast, MWIR starts at a higher ESD value (0.3 °C). Subsequently, the ESD of all three products decreases with increasing sea surface temperature, from about 0.25 °C to 0.1 °C. Where HY-2B and iQuam have similar ESD values, both lower than MWIR, it indicates that the random error of HY-2B is smaller than that of MWIR in the low temperature range. The SNR sub of iQuam and HY-2B changes similarly with SST. Within the SST range of 0 to 14 °C, SNR sub decreases with increasing SST, while MWIR’s SNR sub slightly increases with rising SST. However, as sea surface temperature increases, the SNR sub of all three products gradually increases to above 0.99. As shown in Figure 11, under extreme high-temperature conditions, the errors of all three products increase.
As shown in Figure 11c,d, within the range excluding extreme low and high temperatures, the bias of HY-2B and MWIR relative to iQuam SST remains around 0 degrees. Compared to HY-2B, MWIR has a higher RMSE relative to iQuam at low temperatures (0.35 °C), but as SST increases, the two become increasingly similar. The overall performance is similar to the ESD variation, with both showing a decreasing trend with increasing SST after 14 °C.

4.4. Variations in SST Error Under Wind Speed Influence

Sea surface wind speed is an important environmental parameter affecting the accuracy of sea surface temperature measurements, largely due to the “cold skin effect” [36]. High wind speeds increase water mixing, thereby reducing temperature differences between different depths. Additionally, high sea surface wind speeds can cause white caps, thereby increasing the uncertainty of sea temperature measurements.
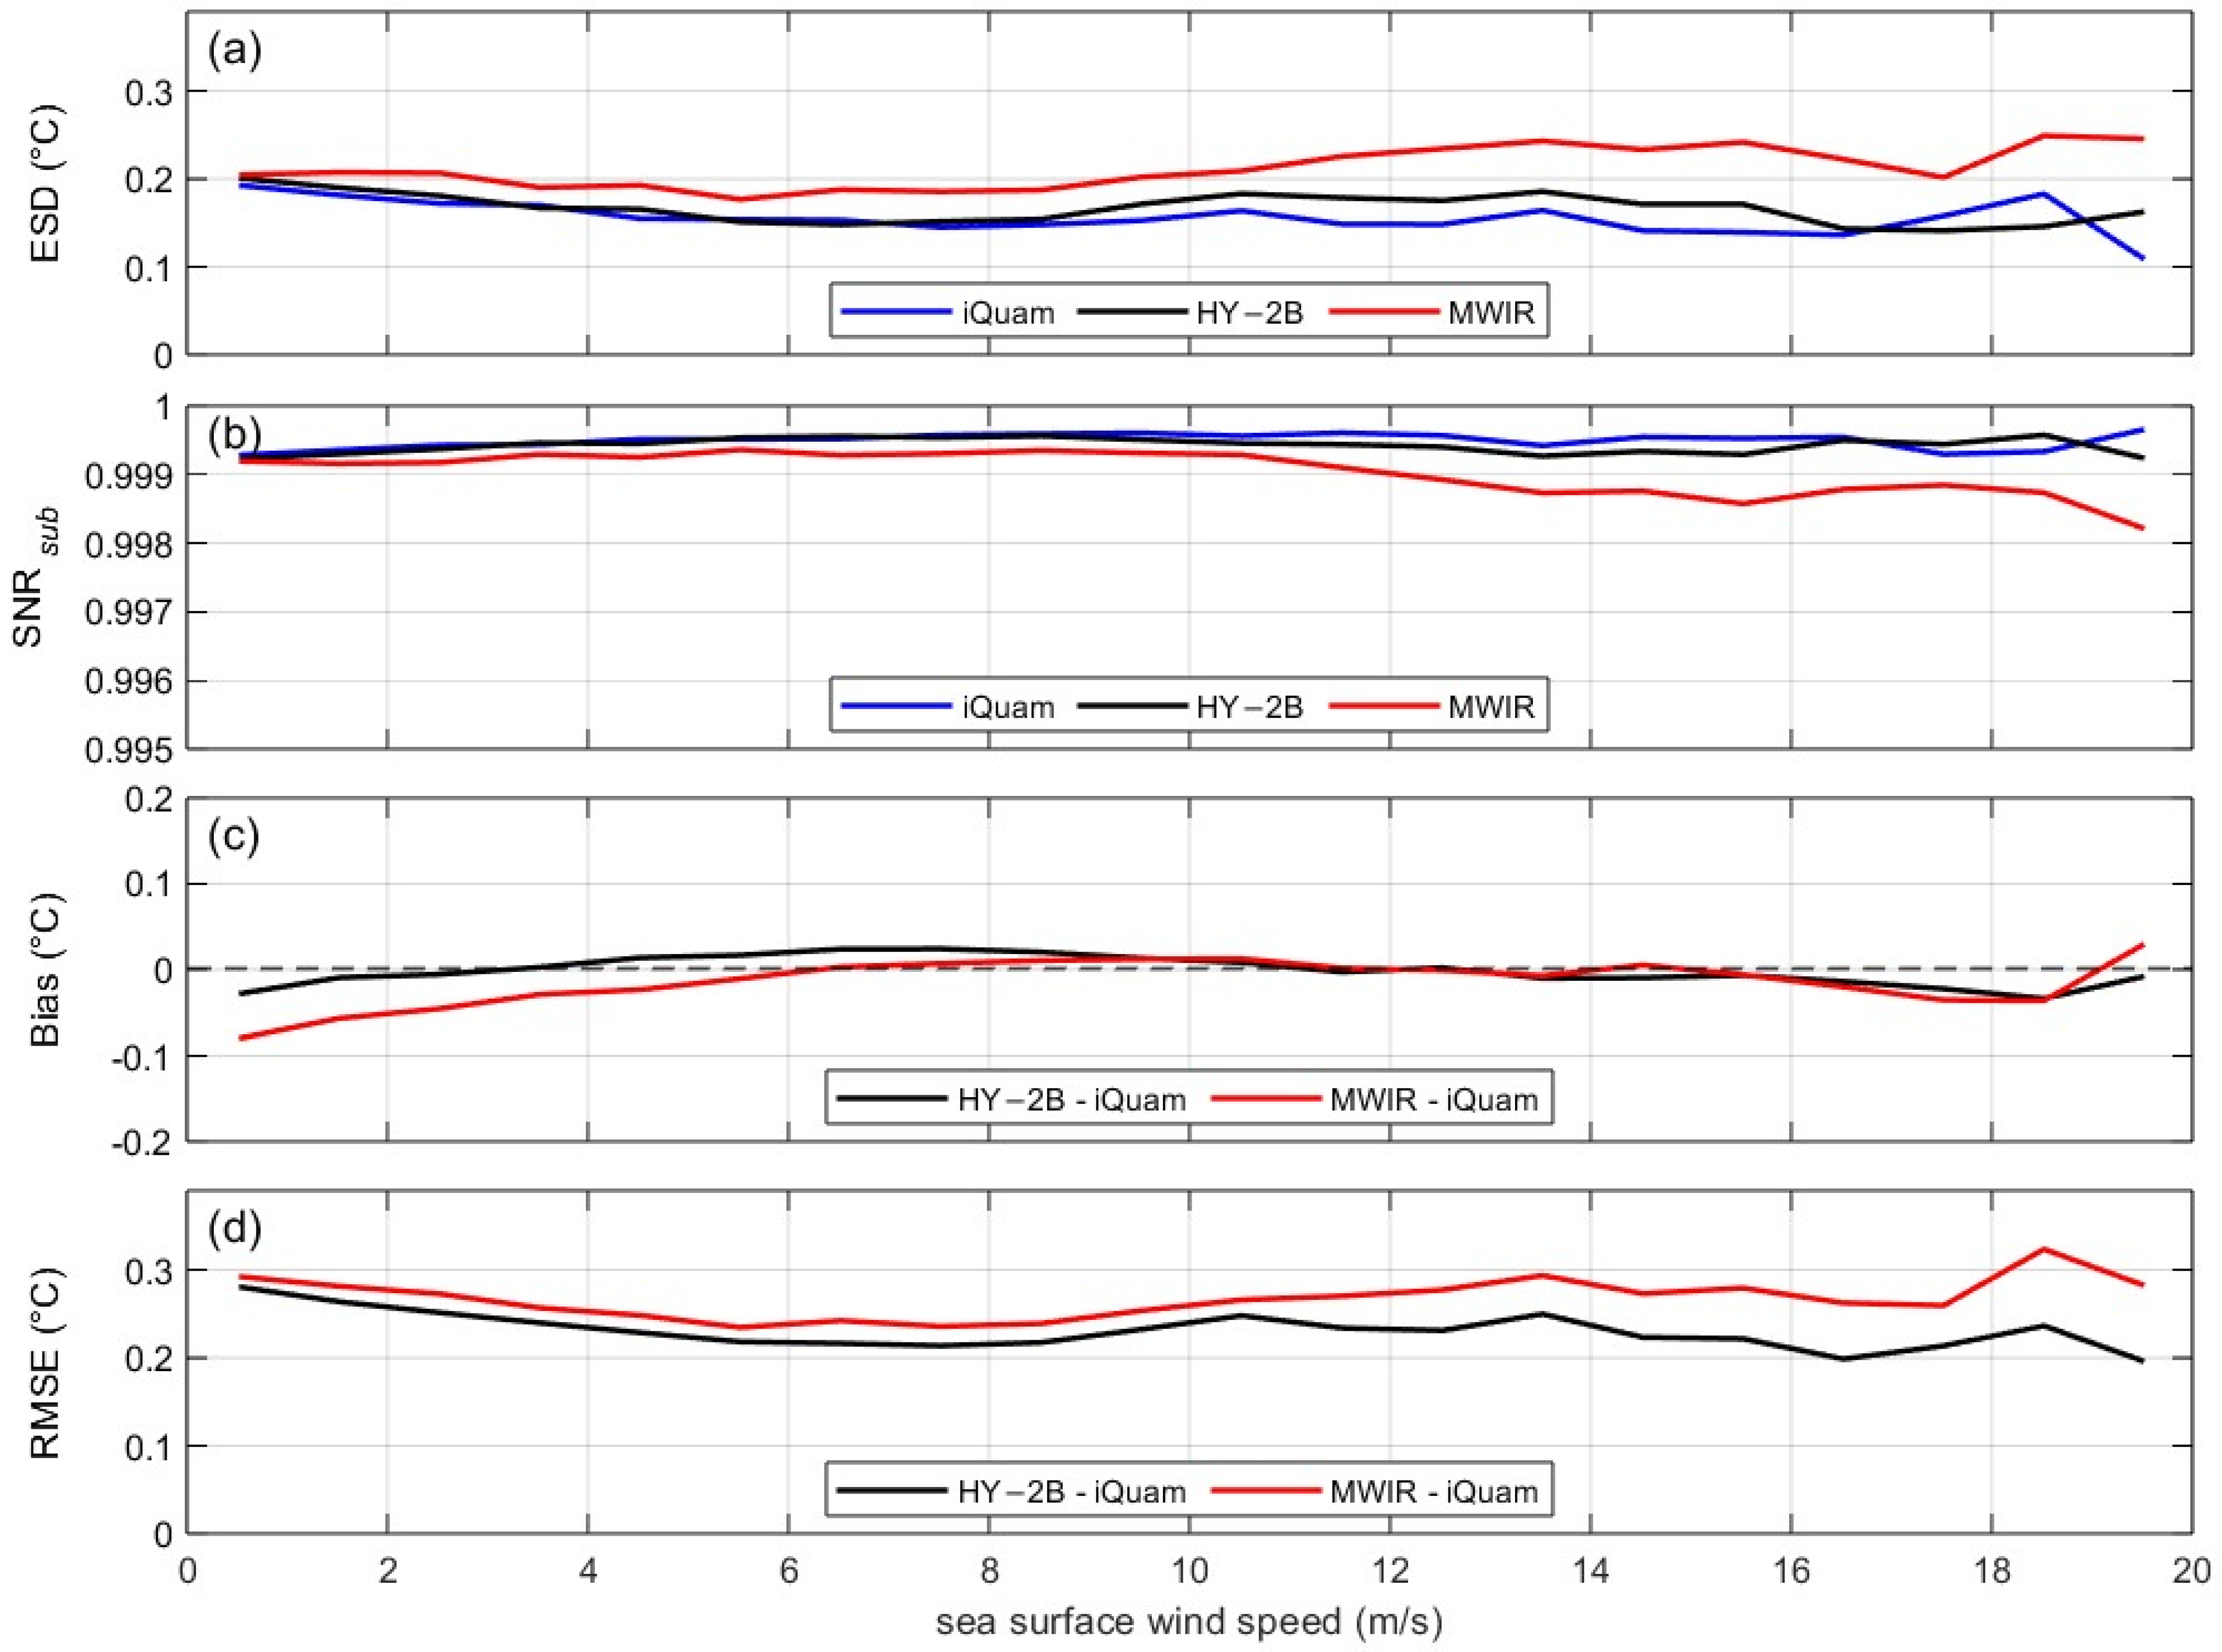
Figure 12 shows error metrics as a function of surface wind speed (0–19 m/s). As wind increases, MWIR’s ESD begins to rise noticeably above 10 m/s, and its SNR sub correspondingly decreases (Figure 12a,b). By contrast, HY-2B and iQuam show no obvious trend in ESD or SNR sub with wind speed; both remain relatively stable with only small fluctuations. Both products’ biases stay near 0 °C across wind speeds (Figure 12c). The RMSE of HY-2B remains low and stable up to 10 m/s, with only slight increases in variability beyond that (Figure 12d). MWIR’s RMSE, however, clearly increases with wind speeds above 10 m/s. These observations are consistent with the cool-skin interpretation [56,57]: increasing wind speeds enhance mixing and reduce the skin–subskin temperature difference, thereby diminishing the cool-skin contribution to satellite minus in situ differences. Since HY-2B SMR retrieves a sub-skin temperature (∼1 mm), the direct cool-skin contribution to HY-2B minus typical in situ near-surface differences is small in our aggregated comparisons; nevertheless, wind-driven roughness and foam remain important contributors to the increased uncertainty at high winds.

4.5. Variations in SST Error Under Columnar Water Vapor Conditions

The attenuation and radiation of water vapor in the atmosphere can affect the signals received by microwave radiometers, thereby increasing the uncertainty in sea surface temperature retrieval [58]. This study investigates the relationship between the SST error characteristics of HY-2B and columnar water vapor (Figure 13). Since columnar water vapor does not directly affect in situ data, the analysis in this section does not include iQuam SST.
Figure 13 analyzes HY-2B and MWIR errors versus total column water vapor (1–75 mm). Between 1 and 35 mm of vapor, both HY-2B and MWIR ESD decrease, reaching about 0.14 °C (Figure 13a), after which the ESD remains roughly constant; minor oscillations occur at very high vapor (>60 mm). The SNR sub for both products (Figure 13b) drops when vapor is below 10 mm or above 40 mm (reaching minima) and then increases again at very high vapor (>65 mm). In terms of bias, HY-2B tends to have a slight positive bias in the mid range (11–55 mm), whereas MWIR shows a slight negative bias at very low and very high vapor, being near zero otherwise (Figure 13c). The RMSE trends (Figure 13d) largely mirror those of ESD: RMSE declines with increasing vapor up to 35 mm and then fluctuates. These patterns suggest that moderate amounts of water vapor improve retrieval (reducing random error), but extremes of low or high vapor content degrade accuracy through increased attenuation.

4.6. Impact of Cloud Liquid Water Content on SST Error Characteristics

Similar to water vapor, the presence of liquid water in clouds also increases the uncertainty of microwave SST retrieval. Figure 14 shows the effect of columnar cloud liquid water (0–1.0 mm) on HY-2B and MWIR SST errors. As liquid water content rises from 0 to ~0.5 mm, the ESD of both HY-2B and MWIR increases substantially (Figure 14a), with MWIR’s ESD exceeding that of HY-2B. Beyond 0.5 mm, the errors tend to saturate or even decrease slightly. Both products maintain generally negative biases as liquid water increases (Figure 14c), and the RMSE (Figure 14d) follows a similar upward trend. This behavior indicates that cloud liquid water exacerbates SST retrieval errors (due to increased microwave attenuation and scattering), although beyond a certain point the incremental effect levels off.
Our analysis indicates that HY-2B SST errors are most pronounced under extreme conditions. For example, at high latitudes (around 60°N), we observe HY-2B biases up to 0.13 °C and RMSE 0.36 °C. The harsher environments there (strong winds, sea ice) contribute to higher retrieval errors. In contrast, tropical and subtropical waters have more uniform conditions (weaker winds, less vapor variability), leading to lower and more stable errors. Overall, HY-2B SST performs reliably under most conditions, but errors increase under conditions of high winds, high latitudes, and heavy atmospheric moisture.

5. Conclusions

This study systematically assessed the observational performance of the HY-2B L4A fusion SST product by comparing it with RSS MWIR satellite SST and NOAA iQuam in situ data from October 2023 to March 2025. All datasets were collocated in time and space for a fair comparison. The HY-2B and iQuam comparison yielded a near-zero mean bias (–0.002 °C), an RMSE of 0.279 °C, and an R2 = 0.9987, indicating negligible systematic error and very high accuracy. Platform-specific analysis showed that HY-2B has the lowest RMSE (0.145–0.177 °C) on drifters and tropical moored buoys, outperforming MWIR on those platforms. Ships and coastal moorings exhibited higher RMSE (0.376–0.427 °C) for HY-2B, as expected for these heterogeneous environments. These differences arise because drifters and tropical moorings are located in open ocean with uniform SST, resulting in low representativeness error, whereas ships and coastal moorings often operate in areas with large temperature gradients or local disturbances.
In a direct comparison between the two satellite fusion products, HY-2B and MWIR agree very closely: the average bias is 0.009 °C and the RMSE is 0.270 °C, with most errors within ±0.5 °C. This demonstrates the consistency and reliability of both products under broad conditions. Extended triple collocation analysis confirms these findings. Drifter and tropical moored platforms have the lowest ESD values (e.g., HY-2B ESD of 0.088–0.120 °C), while ships and coastal moorings have higher ESD. Overall, HY-2B’s aggregate ESD (0.163 °C) lies between iQuam (0.157 °C) and MWIR (0.196 °C). The corresponding signal-to-noise ratios are nearly identical for all three products, indicating robust detection of true SST signals. These results suggest that HY-2B has slightly better random error control than MWIR, which contains more noise.
Finally, our analysis revealed that HY-2B SST errors increase under extreme environmental conditions: high winds, high latitudes, and high water vapor or cloud content. For instance, above 50°N, random errors and SNR sub fluctuations increase due to colder sea and rougher conditions. At wind speeds above 10 m/s, HY-2B RMSE begins to rise (the “cold skin effect”), whereas MWIR errors increase more steadily. Very high or very low total water vapor causes a modest bias increase (0.05 °C) and higher RMSE, reflecting increased attenuation. Similarly, columnar cloud water up to 0.5 mm raises HY-2B and MWIR ESD and RMSE. These findings suggest that atmospheric attenuation and cloud radiation notably affect microwave SST retrieval. Future work could incorporate environmental corrections or advanced multi-source fusion to improve SST accuracy under such challenging conditions.
Overall, the HY-2B L4A fusion SST product demonstrates high accuracy and consistency across most conditions, providing a reliable resource for oceanographic applications.

Author Contributions

Conceptualization, L.J. and G.Z.; methodology, L.J.; software, L.J.; validation, L.J., G.Z. and X.C.; formal analysis, Y.W.; investigation, Y.D.; resources, Y.W.; data curation, S.M.; writing—original draft preparation, L.J.; writing—review and editing, L.J.; visualization, S.M.; supervision, X.C.; project administration, X.C.; funding acquisition, Y.D. All authors have read and agreed to the published version of the manuscript.

Funding

This research was funded by the National Key Research and Development Program of China, grant number 2024YFC2813602; the National Natural Science Foundation of China, grant numbers 42306260 and U23A20649; and the Shanghai Frontiers Science Center of Polar Science (SCOPS), grant number SOO2025-04.

Data Availability Statement

All the data and products are publicly available through the websites of the respective organizations. The HY-2B L4A data are available at https://osdds.nsoas.org.cn/OceanDynamics (accessed 1 April 2025). The MWIR data are available at https://data.remss.com/SST/daily/mw_ir/v05.1/ (accessed 31 April 2025). The iQuam data are available at https://www.star.nesdis.noaa.gov/socd/sst/iquam/ (accessed 31 April 2025). The ERA5 data are available at https://doi.org/10.24381/cds.4991cf48 (accessed 1 April 2025).

Acknowledgments

The authors would like to thank the National Satellite Ocean Application Service (NSOAS), Remote Sensing System (RSS), and National Oceanic, Atmospheric Administration (NOAA) and European Centre for Medium-Range Weather Forecasts (ECMWF) for providing the data used in this study.

Conflicts of Interest

The authors declare no conflicts of interest.

References

  1. Pisano, A.; Marullo, S.; Artale, V.; Falcini, F.; Yang, C.; Leonelli, F.E.; Santoleri, R.; Buongiorno Nardelli, B. New evidence of Mediterranean climate change and variability from sea surface temperature observations. Remote Sens. 2020, 12, 132. [Google Scholar] [CrossRef]
  2. Ateweberhan, M.; McClanahan, T.R. Relationship between historical sea-surface temperature variability and climate change–induced coral mortality in the western Indian Ocean. Mar. Pollut. Bull. 2010, 60, 964–970. [Google Scholar] [CrossRef]
  3. Enfield, D.B.; Mestas-Nuñez, A.M. Multiscale variabilities in global sea surface temperatures and their relationships with tropospheric climate patterns. J. Clim. 1999, 12, 2719–2733. [Google Scholar] [CrossRef]
  4. Ruela, R.; Sousa, M.C.; de Castro, M.; Dias, J.M. Global and regional evolution of sea surface temperature under climate change. Glob. Planet. Change 2020, 190, 103190. [Google Scholar] [CrossRef]
  5. O’Carroll, A.G.; Armstrong, E.M.; Beggs, H.M.; Bouali, M.; Casey, K.S.; Corlett, G.K.; Dash, P.; Donlon, C.J.; Gentemann, C.L.; Høyer, J.L.; et al. Observational needs of sea surface temperature. Front. Mar. Sci. 2019, 6, 420. [Google Scholar] [CrossRef]
  6. Hausmann, U.; Czaja, A. The observed signature of mesoscale eddies in sea surface temperature and the associated heat transport. Deep-Sea Res. Part I Oceanogr. Res. Pap. 2012, 70, 60–72. [Google Scholar] [CrossRef]
  7. Wang, Y.; Yu, Y.; Zhang, Y.; Zhang, H.-R.; Chai, F. Distribution and variability of sea surface temperature fronts in the South China Sea. Estuar. Coast. Shelf Sci. 2020, 240, 106793. [Google Scholar] [CrossRef]
  8. Tandeo, P.; Chapron, B.; Ba, S.; Autret, E.; Fablet, R. Segmentation of mesoscale ocean surface dynamics using satellite SST and SSH observations. IEEE Trans. Geosci. Remote Sens. 2014, 52, 4227–4235. [Google Scholar] [CrossRef]
  9. Zhang, H.; Ignatov, A. A completeness and complementarity analysis of the data sources in the NOAA in situ sea surface temperature quality monitor (iQuam) system. Remote Sens. 2021, 13, 3741. [Google Scholar] [CrossRef]
  10. Minnett, P.J.; Alvera-Azcárate, A.; Chin, T.M.; Corlett, G.K.; Gentemann, C.L.; Karagali, I.; Li, X.; Marsouin, A.; Marullo, S.; Maturi, E.; et al. Half a century of satellite remote sensing of sea-surface temperature. Remote Sens. Environ. 2019, 233, 111366. [Google Scholar] [CrossRef]
  11. Wentz, F.J.; Gentemann, C.; Smith, D.; Chelton, D. Satellite measurements of sea surface temperature through clouds. Science 2000, 288, 847–850. [Google Scholar] [CrossRef]
  12. Biswas, S.K.; Gopalan, K.; Jones, W.L.; Bilanow, S. Correction of time-varying radiometric errors in TRMM Microwave Imager calibrated brightness temperature products. IEEE Geosci. Remote Sens. Lett. 2010, 7, 851–855. [Google Scholar] [CrossRef]
  13. Wentz, F.J. A 17-yr climate record of environmental parameters derived from the Tropical Rainfall Measuring Mission (TRMM) Microwave Imager. J. Clim. 2015, 28, 6882–6902. [Google Scholar] [CrossRef]
  14. Stammer, D.; Wentz, F.; Gentemann, C. Validation of microwave sea surface temperature measurements for climate purposes. J. Clim. 2003, 16, 73–87. [Google Scholar] [CrossRef]
  15. Qian, G. China launches HY-2B satellite atop a LM-4B. Aerosp. China 2018, 19, 57. [Google Scholar]
  16. Liu, S.B.; Cui, X.D.; Li, Y.N.; Jin, X.; Zhou, W.; Dang, H.X.; Li, H. Retrieval of sea surface temperature from the scanning microwave radiometer aboard HY-2B. Int. J. Remote Sens. 2021, 42, 4621–4643. [Google Scholar] [CrossRef]
  17. Zhou, W.; Lin, M.; Yin, X.; Ma, X.; Huang, L.; Wang, S.; Ma, C.; Zhang, Y. Preliminary estimate of sea surface temperature from the scanning microwave radiometer onboard HY-2B satellite. In Proceedings of the IGARSS 2019—2019 IEEE International Geoscience and Remote Sensing Symposium, Yokohama, Japan, 28 July–2 August 2019; pp. 8173–8176. [Google Scholar] [CrossRef]
  18. Zhang, L.; Yu, H.; Wang, Z.; Yin, X.; Yang, L.; Du, H.; Li, B.; Wang, Y.; Zhou, W. Evaluation of the initial sea surface temperature from the HY-2B scanning microwave radiometer. IEEE Geosci. Remote Sens. Lett. 2021, 18, 137–141. [Google Scholar] [CrossRef]
  19. Dash, P.; Ignatov, A.; Martin, M.; Donlon, C.; Brasnett, B.; Reynolds, R.W.; Banzon, V.; Beggs, H.; Cayula, J.; Chao, Y.; et al. Group for High Resolution Sea Surface Temperature (GHRSST) analysis fields inter-comparisons—Part 2: Near real time web-based level 4 SST Quality Monitor (L4-SQUAM). Deep Sea Res. Part II Top. Stud. Oceanogr. 2012, 77–80, 31–43. [Google Scholar] [CrossRef]
  20. Casey, K.S.; Adamec, D. Sea surface temperature and sea surface height variability in the North Pacific Ocean from 1993 to 1999. J. Geophys. Res. 2002, 107, 14-1–14-12. [Google Scholar] [CrossRef]
  21. Werb, B.E.; Rudnick, D.L. Remarkable changes in the dominant modes of North Pacific sea surface temperature. Geophys. Res. Lett. 2023, 50, e2022GL101078. [Google Scholar] [CrossRef]
  22. Xu, F.; Ignatov, A. In situ SST Quality Monitor (iQuam). J. Atmos. Ocean. Technol. 2014, 31, 164–180. [Google Scholar] [CrossRef]
  23. Wang, H.; Lin, M.; Ma, C.; Yin, X.; Guan, L. Evaluation of sea surface temperature from HY-1C data. In Proceedings of the IGARSS 2020—2020 IEEE International Geoscience and Remote Sensing Symposium, Waikoloa, HI, USA, 26 September–2 October 2020; pp. 5897–5900. [Google Scholar] [CrossRef]
  24. Tu, Q.; Hao, Z. Validation of sea surface temperature derived from Himawari-8 by JAXA. IEEE J. Sel. Top. Appl. Earth Obs. Remote Sens. 2020, 13, 448–459. [Google Scholar] [CrossRef]
  25. Chen, Y.; Qu, L.; Guan, L. Evaluation of NOAA/AVHRR sea surface temperature at full HRPT resolution in the Northwest Pacific Ocean. J. Ocean Univ. China 2021, 20, 1431–1439. [Google Scholar] [CrossRef]
  26. Xu, F.; Ignatov, A. Error characterization in iQuam SSTs using triple collocations with satellite measurements. Geophys. Res. Lett. 2016, 43, 10826–10834. [Google Scholar] [CrossRef]
  27. Bell, B.; Hersbach, H.; Simmons, A.; Berrisford, P.; Dahlgren, P.; Horányi, A.; Muñoz-Sabater, J.; Nicolas, J.; Radu, R.; Schepers, D.; et al. The ERA5 global reanalysis: Preliminary extension to 1950. Q. J. R. Meteorol. Soc. 2021, 147, 4186–4227. [Google Scholar] [CrossRef]
  28. Hersbach, H.; Bell, B.; Berrisford, P.; Hirahara, S.; Horányi, A.; Muñoz-Sabater, J.; Nicolas, J.; Peubey, C.; Radu, R.; Schepers, D.; et al. The ERA5 global reanalysis. Q. J. R. Meteorol. Soc. 2020, 146, 1999–2049. [Google Scholar] [CrossRef]
  29. Gentemann, C.L.; Wentz, F.J.; Mears, C.A.; Smith, D.K. In situ validation of Tropical Rainfall Measuring Mission microwave sea surface temperatures. J. Geophys. Res. Oceans 2004, 109, C04021. [Google Scholar] [CrossRef]
  30. Gentemann, C.L.; Hilburn, K.A. In situ validation of sea surface temperatures from the GCOM-W1 AMSR2 RSS calibrated brightness temperatures. J. Geophys. Res. Oceans 2015, 120, 3567–3585. [Google Scholar] [CrossRef]
  31. Zhao, Y.; Zhu, J.; Lin, M.; Chen, C.; Huang, X.; Wang, H.; Zhang, Y.; Peng, H. Assessment of the initial sea surface temperature product of the scanning microwave radiometer aboard on HY-2 satellite. Acta Oceanol. Sin. 2014, 33, 109–113. [Google Scholar] [CrossRef]
  32. Woo, H.-J.; Park, K.-A. Inter-comparisons of daily sea surface temperatures and in-situ temperatures in the coastal regions. Remote Sens. 2020, 12, 1592. [Google Scholar] [CrossRef]
  33. Kennedy, J.J. A review of uncertainty in in situ measurements and data sets of sea surface temperature. Rev. Geophys. 2014, 52, 1–32. [Google Scholar] [CrossRef]
  34. Kennedy, J.J.; Rayner, N.A.; Smith, R.O.; Parker, D.E.; Saunby, M. Reassessing biases and other uncertainties in sea surface temperature observations measured in situ since 1850: 1. Measurement and sampling uncertainties. J. Geophys. Res. Atmos. 2011, 116, D14103. [Google Scholar] [CrossRef]
  35. Dong, S.; Gille, S.T.; Sprintall, J.; Gentemann, C. Validation of the Advanced Microwave Scanning Radiometer for the Earth Observing System (AMSR-E) sea surface temperature in the Southern Ocean. J. Geophys. Res. Oceans 2006, 111, C04002. [Google Scholar] [CrossRef]
  36. Donlon, C.J.; Minnett, P.J.; Gentemann, C.; Nightingale, T.J.; Barton, I.J.; Ward, B.; Murray, M.J. Toward improved validation of satellite sea surface skin temperature measurements for climate research. J. Clim. 2002, 15, 353–369. [Google Scholar] [CrossRef]
  37. Minnett, P.J. Radiometric measurements of the sea-surface skin temperature: The competing roles of the diurnal thermocline and the cool skin. Int. J. Remote Sens. 2003, 24, 5033–5047. [Google Scholar] [CrossRef]
  38. Fairall, C.W.; Bradley, E.F.; Godfrey, J.S.; Wick, G.A.; Edson, J.B.; Young, G.S. Cool-skin and warm-layer effects on sea surface temperature. J. Geophys. Res. Oceans 1996, 101, 1295–1308. [Google Scholar] [CrossRef]
  39. Liu, Z.; Yang, M.; Qu, L.; Guan, L. Regional study on the oceanic cool skin and diurnal warming effects: Observing and modeling. Remote Sens. 2023, 15, 3814. [Google Scholar] [CrossRef]
  40. Stoffelen, A. Toward the true near-surface wind speed: Error modeling and calibration using triple collocation. J. Geophys. Res. Oceans 1998, 103, 7755–7766. [Google Scholar] [CrossRef]
  41. Gruber, A.; Su, C.-H.; Zwieback, S.; Crow, W.; Dorigo, W.; Wagner, W. Recent advances in (soil moisture) triple collocation analysis. Int. J. Appl. Earth Obs. Geoinf. 2016, 45, 200–211. [Google Scholar] [CrossRef]
  42. Draper, C.; Reichle, R.; de Jeu, R.; Naeimi, V.; Parinussa, R.; Wagner, W. Estimating root mean square errors in remotely sensed soil moisture over continental scale domains. Remote Sens. Environ. 2013, 137, 288–298. [Google Scholar] [CrossRef]
  43. Peng, J.; Misra, S.; Piepmeier, J.R.; Dinnat, E.P.; Yueh, S.H.; Meissner, T.; Vine, D.M.L.; Shelton, K.E.; Freedman, A.P.; Dunbar, R.S.; et al. Soil Moisture Active/Passive (SMAP) L-Band Microwave Radiometer post-launch calibration upgrade. IEEE J. Sel. Top. Appl. Earth Obs. Remote Sens. 2019, 12, 1647–1657. [Google Scholar] [CrossRef]
  44. Hong, Z.; Moreno, H.A.; Li, Z.; Li, S.; Greene, J.S.; Hong, Y.; Alvarez, L.V. Triple collocation of ground-, satellite- and land surface model-based surface soil moisture products in Oklahoma—Part I: Individual product assessment. Remote Sens. 2022, 14, 5641. [Google Scholar] [CrossRef]
  45. Li, C.; Tang, G.; Hong, Y. Cross-evaluation of ground-based, multi-satellite and reanalysis precipitation products: Applicability of the triple collocation method across mainland China. J. Hydrol. 2018, 562, 71–83. [Google Scholar] [CrossRef]
  46. Wild, A.; Chua, Z.-W.; Kuleshov, Y. Triple collocation analysis of satellite precipitation estimates over Australia. Remote Sens. 2022, 14, 2724. [Google Scholar] [CrossRef]
  47. Hoareau, N.; Portabella, M.; Lin, W.; Ballabrera-Poy, J.; Turiel, A. Error characterization of sea surface salinity products using triple collocation analysis. IEEE Trans. Geosci. Remote Sens. 2018, 56, 5160–5168. [Google Scholar] [CrossRef]
  48. Caires, S.; Sterl, A. Validation of ocean wind and wave data using triple collocation. J. Geophys. Res. Oceans 2003, 108, 3098. [Google Scholar] [CrossRef]
  49. McColl, K.A.; Vogelzang, J.; Konings, A.G.; Entekhabi, D.; Piles, M.; Stoffelen, A. Extended triple collocation: Estimating errors and correlation coefficients with respect to an unknown target. Geophys. Res. Lett. 2014, 41, 6229–6236. [Google Scholar] [CrossRef]
  50. Saha, K.; Dash, P.; Zhao, X.; Zhang, H.-m. Error estimation of Pathfinder version 5.3 Level-3C SST using extended triple collocation analysis. Remote Sens. 2020, 12, 590. [Google Scholar] [CrossRef]
  51. Cao, M.; Mao, K.; Yan, Y.; Shi, J.; Wang, H.; Xu, T.; Fang, S.; Yuan, Z. A new global gridded sea surface temperature data product based on multisource data. Earth Syst. Sci. Data 2021, 13, 2111–2134. [Google Scholar] [CrossRef]
  52. Hosoda, K.; Kawamura, H. Seasonal variation of space/time statistics of short-term sea surface temperature variability in the Kuroshio region. J. Oceanogr. 2005, 61, 709–720. [Google Scholar] [CrossRef]
  53. Wu, X.; Xiao, Q.; Wen, J.; You, D. Direct comparison and triple collocation: Which is more reliable in the validation of coarse-scale satellite surface albedo products. J. Geophys. Res. Atmos. 2019, 124, 5198–5213. [Google Scholar] [CrossRef]
  54. Wu, X.; Lu, G.; Wu, Z.; He, H.; Scanlon, T.; Dorigo, W. Triple collocation-based assessment of satellite soil moisture products with in situ measurements in China: Understanding the error sources. Remote Sens. 2020, 12, 2275. [Google Scholar] [CrossRef]
  55. Liu, P.; Zhao, Y.; Zhou, W.; Wang, S. Evaluation of HY-2B SMR sea surface temperature products from 2019 to 2024. Remote Sens. 2025, 17, 300. [Google Scholar] [CrossRef]
  56. Merchant, C.J.; Le Borgne, P. Retrieval of sea surface temperature from space based on modeling of infrared radiative transfer: Capabilities and limitations. J. Atmos. Ocean. Technol. 2004, 21, 1734–1746. [Google Scholar] [CrossRef]
  57. Price, J.F.; Weller, R.A.; Pinkel, R. Diurnal cycling: Observations and models of the upper ocean response to diurnal heating, cooling, and wind mixing. J. Geophys. Res. Oceans 1986, 91, 8411–8427. [Google Scholar] [CrossRef]
  58. Anding, D.; Kauth, R. Estimation of sea surface temperature from space. Remote Sens. Environ. 1970, 1, 217–220. [Google Scholar] [CrossRef]
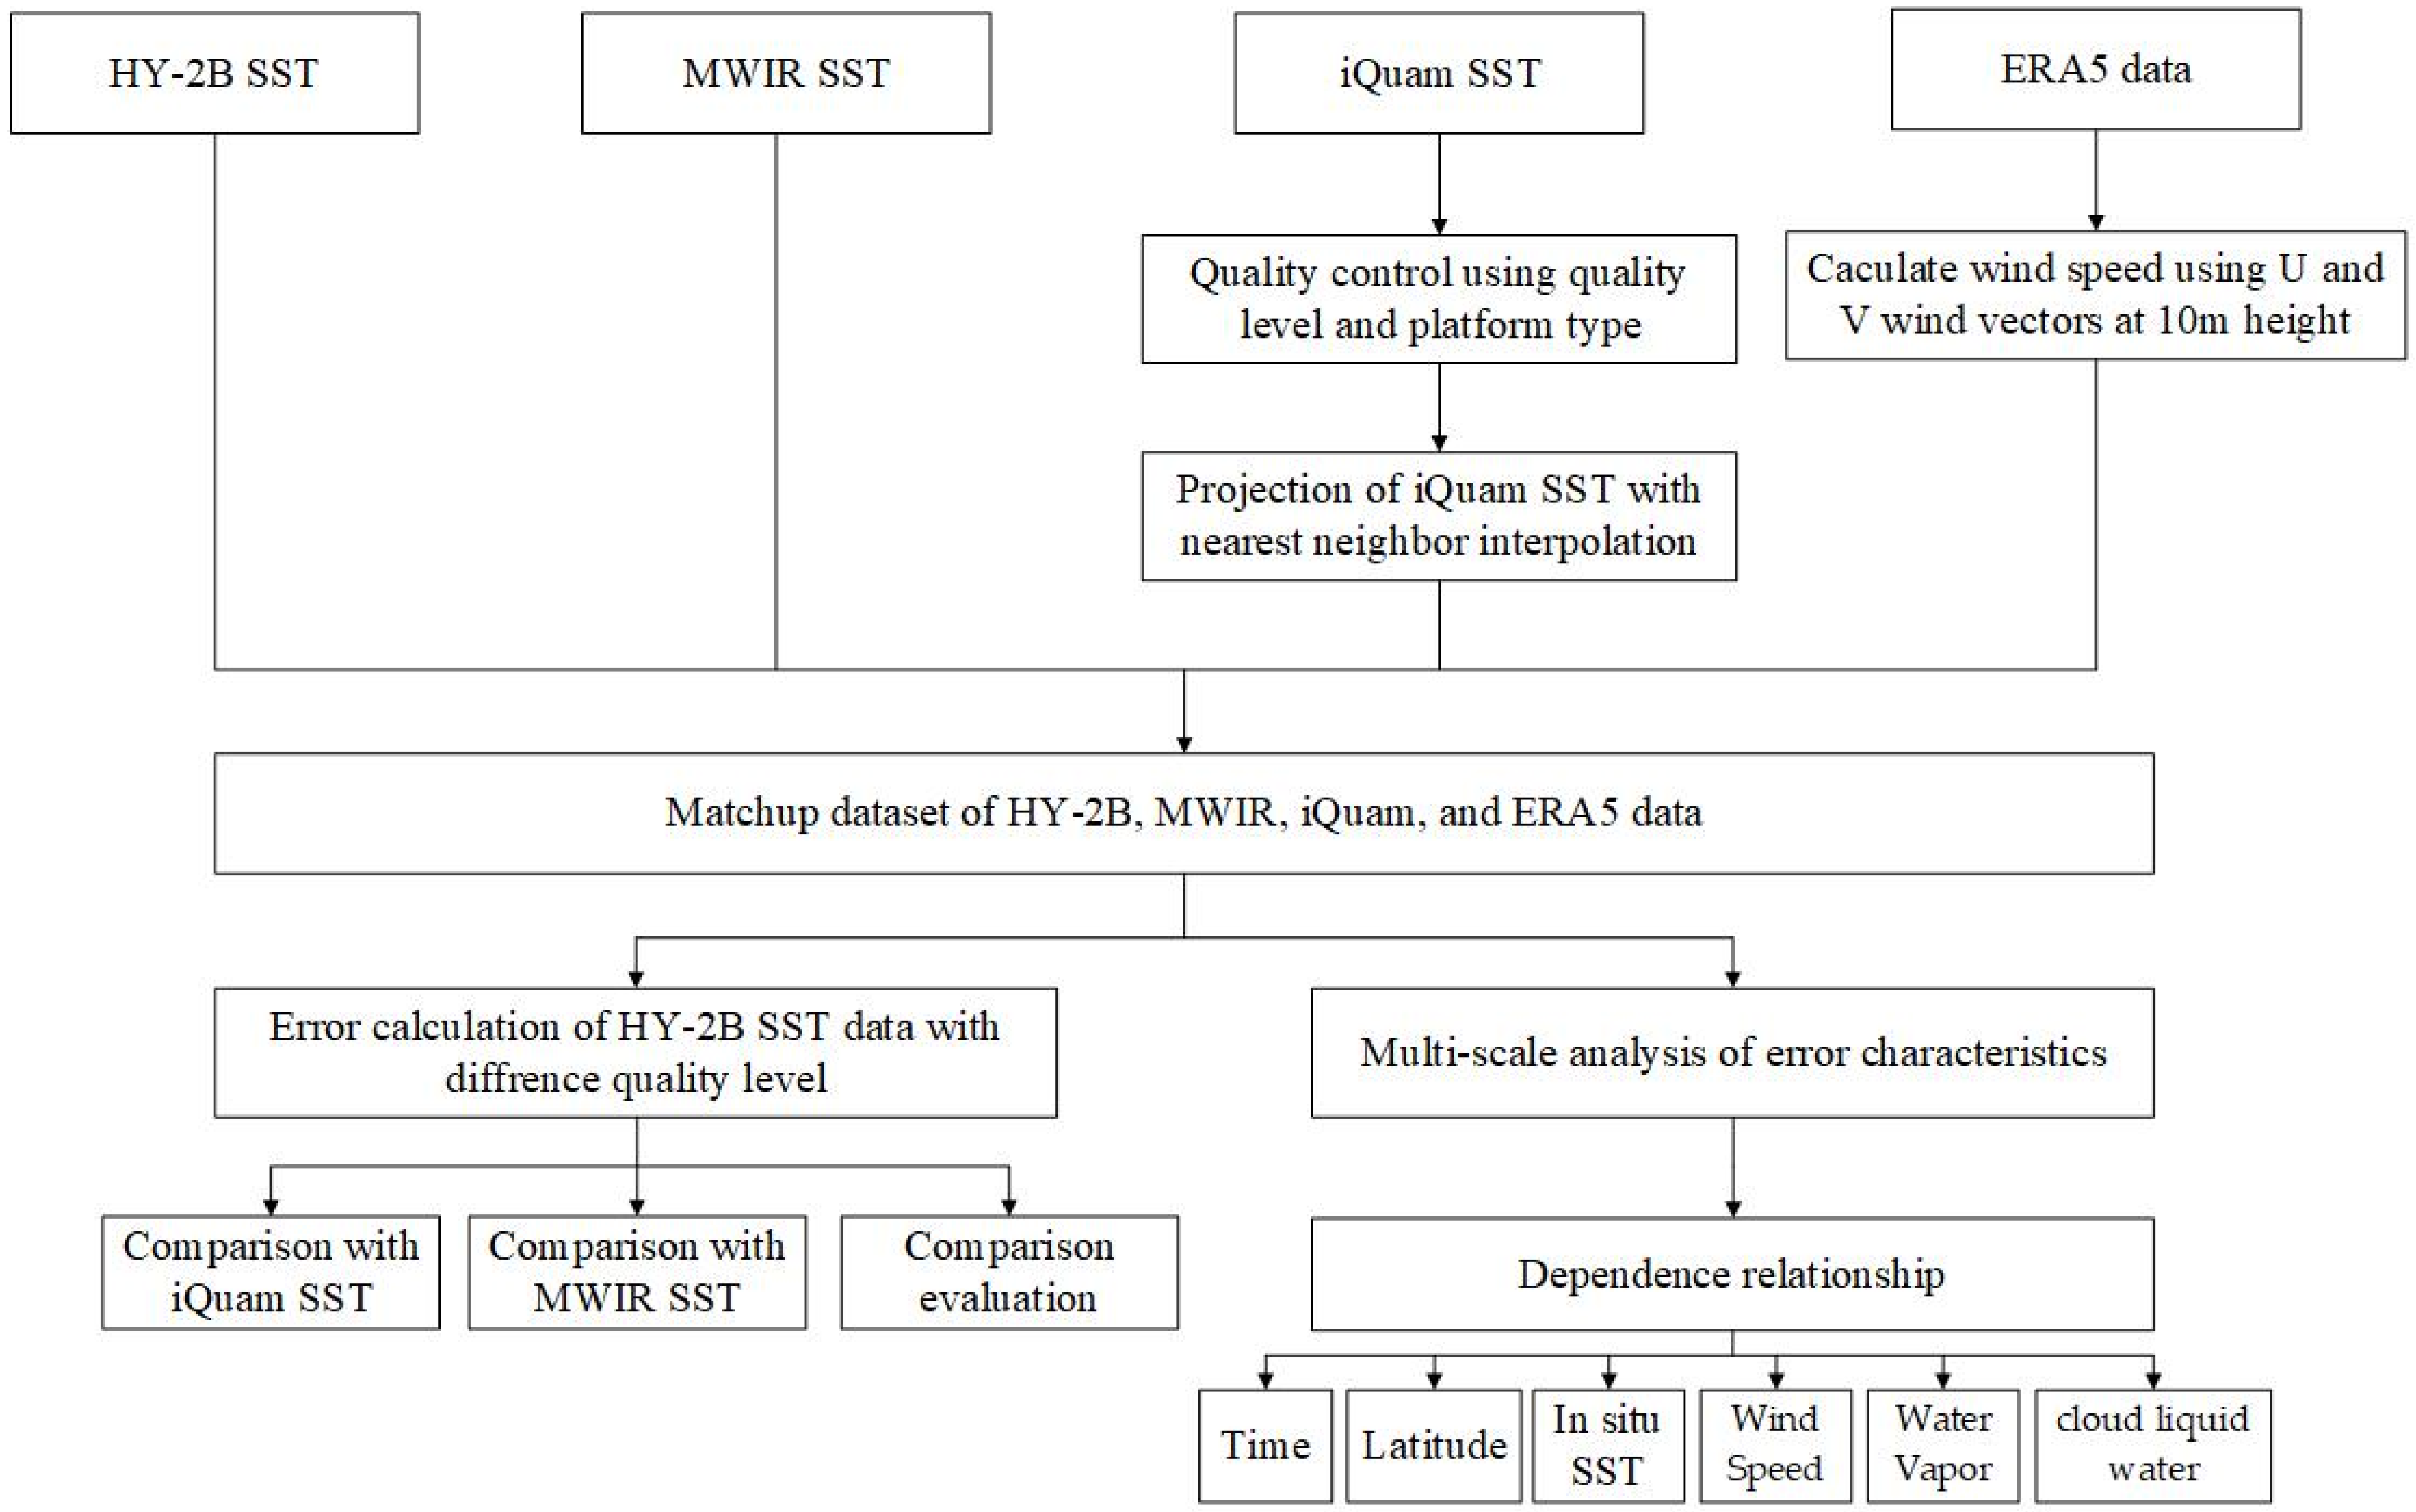
Figure 1. Flowchart of the research methods.
Remotesensing 17 03043 g001
Figure 2. HY-2B L4A SST distribution on 1 March 2025 over the North Pacific.
Remotesensing 17 03043 g002
Figure 3. Spatial distribution of all matched collocations (October 2023–March 2025). (a) Ships. (b) Drifting buoys. (c) Tropical moored buoys (d) Coastal moored buoys.
Remotesensing 17 03043 g003
Figure 4. Comparison results between HY-2B and MWIR with iQuam SST. (a) Scatter plot of HY-2B and iQuam. (b) Scatter plot of MWIR and iQuam. (c) HY-2B bias histogram. (d) MWIR bias histogram.
Remotesensing 17 03043 g004
Figure 5. Spatial distribution of HY-2B SST versus iQuam SST on a 2° × 2° grid. (a) Mean bias, (b) RMSE, (c) Pearson’s correlation coefficient (R), and (d) number of collocated samples.
Remotesensing 17 03043 g005
Figure 6. HY-2B and MWIR SST comparison. (a) Scatter density plot. (b) Bias histogram.
Remotesensing 17 03043 g006
Figure 7. Monthly mean bias map of HY-2B minus RSS MWIR SST from October 2023 to June 2024.
Remotesensing 17 03043 g007
Figure 8. Monthly mean bias map of HY-2B minus RSS MWIR SST from July 2024 to March 2025.
Remotesensing 17 03043 g008
Figure 9. Time variation of error characteristics (10-day averages). (a) ESD. (b) SNR sub . (c) Bias (relative to iQuam). (d) RMSE.
Remotesensing 17 03043 g009
Figure 10. Latitudinal variation of error characteristics. (a) ESD. (b) SNR sub . (c) Bias (relative to iQuam). (d) RMSE.
Remotesensing 17 03043 g010
Figure 11. Error characteristics as a function of iQuam SST. (a) ESD. (b) SNR sub . (c) Bias (relative to iQuam). (d) RMSE.
Remotesensing 17 03043 g011
Figure 12. Error characteristics as a function of sea surface wind speed. (a) ESD. (b) SNR sub . (c) Bias (relative to iQuam). (d) RMSE.
Remotesensing 17 03043 g012
Figure 13. Error characteristics as a function of columnar water vapor. (a) ESD. (b) SNR sub . (c) Bias (relative to iQuam). (d) RMSE.
Remotesensing 17 03043 g013
Figure 14. Error characteristics as a function of liquid water content in columnar clouds. (a) ESD. (b) SNR sub . (c) Bias (relative to iQuam). (d) RMSE.
Remotesensing 17 03043 g014
Table 1. Bias, RMSE, and R2 of HY-2B and RSS MWIR SST against iQuam in situ observations by platform.
Match TypeIndicatoriQuam Platforms
AllShipDrifterT-MC-M
HY-2B
VS
iQuam
Bias (°C)−0.002−0.0900.0420.007−0.063
RMSE (°C)0.2790.4270.1770.1450.376
R-squared0.99870.99740.99940.99030.9969
Number5,686,212535,3823,359,875126,8261,663,980
MWIR
VS
iQuam
Bias (°C)−0.011−0.0170.002−0.057−0.042
RMSE°C0.2530.3370.2050.1750.350
R-squared0.99890.99830.99910.98710.9970
Number5,252,568200,5503,635,475135,7131,280,670
Table 2. ETC analysis results of HY-2B, MWIR, and iQuam on different platforms.
DataETCALLShipDriftingT-MC-M
HY-2BESD (°C)0.1630.2380.1200.0880.238
SNR sub 0.99960.99910.99970.99620.9986
MWIRESD (°C)0.1960.2520.1640.1150.267
SNR sub 0.99930.99900.99940.99330.9983
iQuamESD (°C)0.1570.2200.1230.1110.218
SNR sub 0.99960.99920.99970.99410.9988
Disclaimer/Publisher’s Note: The statements, opinions and data contained in all publications are solely those of the individual author(s) and contributor(s) and not of MDPI and/or the editor(s). MDPI and/or the editor(s) disclaim responsibility for any injury to people or property resulting from any ideas, methods, instructions or products referred to in the content.