Article

DATNet: Dynamic Adaptive Transformer Network for SAR Image Denoising

Shijiazhuang Campus, Army Engineering University of PLA, Shijiazhuang 050003, China
*
Author to whom correspondence should be addressed.
Remote Sens. 2025, 17(17), 3031; https://doi.org/10.3390/rs17173031
Submission received: 14 July 2025 / Revised: 20 August 2025 / Accepted: 28 August 2025 / Published: 1 September 2025

Abstract

Aiming at the problems of detail blurring and structural distortion caused by speckle noise, additive white noise and hybrid noise interference in synthetic aperture radar (SAR) images, this paper proposes a Dynamic Adaptive Transformer Network (DAT-Net) integrating a dynamic gated attention module and a frequency-domain multi-expert enhancement module for SAR image denoising. The proposed model leverages a multi-scale encoder–decoder framework, combining local convolutional feature extraction with global self-attention mechanisms to transcend the limitations of conventional approaches restricted to single noise types, thereby achieving adaptive suppression of multi-source noise contamination. Key innovations comprise the following: (1) A Dynamic Gated Attention Module (DGAM) employing dual-path feature embedding and dynamic thresholding mechanisms to precisely characterize noise spatial heterogeneity; (2) A Frequency-domain Multi-Expert Enhancement (FMEE) Module utilizing Fourier decomposition and expert network ensembles for collaborative optimization of high-frequency and low-frequency components; (3) Lightweight Multi-scale Convolution Blocks (MCB) enhancing cross-scale feature fusion capabilities. Experimental results demonstrate that DAT-Net achieves quantifiable performance enhancement in both simulated and real SAR environments. Compared with other denoising algorithms, the proposed methodology exhibits superior noise suppression across diverse noise scenarios while preserving intrinsic textural features.

Graphical Abstract

1. Introduction

Synthetic Aperture Radar (SAR), as an active imaging modality operational under all-weather and day–night conditions, plays an indispensable role in critical domains such as military target identification [1,2,3] and terrain monitoring [4,5,6]. However, the SAR imaging process is inherently susceptible to two primary categories of noise interference: multiplicative coherent speckle noise, originating from the coherent imaging mechanism [7,8,9,10], and additive white noise, introduced by complex electromagnetic environments [11,12,13,14]. These two noise types exhibit markedly distinct physical characteristics. Speckle noise intensity correlates with the scattering properties of ground targets and manifests spatial heterogeneity, whereas additive white noise typically presents as a random disturbance exhibiting a globally uniform distribution [15]. Critically, real-world imaging scenarios frequently suffer from mixed contamination by both noise types. This complexity renders traditional denoising methodologies largely ineffective in achieving a balance between noise suppression and feature preservation, often leading to the dual pitfalls of over-smoothing and under-smoothing [16]. Specifically, spatial-domain filters (e.g., Lee [17], Kuan [18], and Frost [19]) induce edge blurring and texture loss due to static window constraints, while wavelet-based techniques [20] suffer from ringing artifacts and pseudo-Gibbs phenomena. Hybrid methods like PPB [21] and SAR-BM3D [22] improve robustness but remain limited by handcrafted priors and inadequate adaptability to heterogeneous scenes [23]. The SAR imaging process and application scenarios are shown in Figure 1.
Recent advances in deep learning have opened new avenues for SAR image denoising, overcoming the generalization limits of traditional approaches through data-driven feature extraction [24]. Convolutional neural networks (CNNs) have dominated early research, with architectures like SAR-CNN [25] and ID-CNN [26] leveraging residual learning for speckle suppression, while dilated convolutions (SAR-DRN [27]) and attention mechanisms (CBAM [28] and SAR-CAM [29]) enhance contextual feature capture. Encoder–decoder frameworks (e.g., U-Net variants [30]) and hybrid paradigms (e.g., PDSNet [31]) further bridge classical and data-driven methodologies. Nevertheless, CNN-based models remain constrained by fixed receptive fields, limiting long-range dependency modeling [32].
Transformers have emerged as a promising alternative, leveraging global self-attention to address SAR noise heterogeneity [33,34]. Pioneering studies like Perera et al. [35] and Yu et al. [36] have demonstrated their speckle suppression efficacy, while hybrid designs (e.g., Trans-NLM [37] and Swin-Transformer U-Nets [38]) integrate classical non-local means or multi-scale processing. However, existing Transformer approaches lack efficiency in complex electromagnetic environments and exhibit feature degradation during multi-scale fusion [39].
Despite these advancements, a critical gap persists: current methodologies predominantly target singular noise types (e.g., speckle [40] or additive noise [41]), with limited systematic investigation of hybrid noise scenarios. Furthermore, computational inefficiencies and inadequate physical interpretability constrain real-world deployment [31,39]. Such intricate noise distributions not only significantly degrade the visual quality of SAR imagery but also adversely impact downstream tasks, including image interpretation and target recognition. Consequently, developing effective SAR image denoising techniques holds significant importance for enhancing image quality and improving the execution efficiency of downstream applications [42,43,44,45]. To address these challenges, we propose DAT-Net, a dynamic adaptive Transformer network designed for hybrid noise suppression.
To address these limitations, we propose the Dynamic Adaptive Transformer Network (DAT-Net). DAT-Net integrates the complementary strengths of CNNs for local feature extraction and Transformers for global context modeling within a multi-scale encoder–decoder architecture. Experimental results demonstrate the superior performance of DAT-Net under both single- and hybrid-noise conditions, achieving significant quantitative and qualitative improvements. This advancement provides a robust solution for enhancing SAR image quality in complex electromagnetic environments.
In summary, the core contributions of this work are as follows:
(1)
We propose a novel Dynamic Gated Attention Module (DGAM) to address the spatial heterogeneity of noise intensity and terrain structure in SAR images. DGAM constructs multi-granularity association maps through dual-path feature embeddings. It incorporates a dynamic gating mechanism that critically screens interaction pathways, breaking away from the static weight allocation paradigm of conventional attention mechanisms. This enables robust suppression of high-noise regions while simultaneously preserving intricate edge and textural details.
(2)
We introduce an innovative frequency-aware feature enhancement strategy that integrates frequency-domain decomposition with dynamic expert networks. High- and low-frequency components are separated via the Fourier transform and adaptively processed by activating the top-K expert networks. This strategy specifically optimizes high-frequency components for enhanced noise suppression and detail preservation while reinforcing low-frequency components to improve structure retention, thereby achieving complementary optimization of spatial- and frequency-domain features.
(3)
We design a lightweight multi-scale convolutional block that captures multi-scale terrain features through parallel depthwise separable convolutions. By incorporating a channel shuffle strategy, this block significantly enhances cross-scale feature fusion. It effectively enlarges the receptive field while maintaining computational efficiency, thereby overcoming the feature degradation issue prevalent in existing methods when handling multi-scale SAR images.
(4)
The proposed model achieves adaptive discrimination of noise typologies and targeted suppression through its dynamically gated attention module and frequency-domain multi-expert enhancement module, thereby completing coordinated removal of multi-source noise within a unified architecture. This innovation bridges a critical research gap in understudied hybrid noise scenarios, which existing methods fail to adequately address.

2. Related Work

Denoising SAR imagery presents a significant technical challenge. This difficulty arises primarily from the inherent characteristics of SAR speckle noise and the scarcity of readily available ground-truth reference data. Speckle noise represents an intrinsic artifact inherent in coherent imaging systems like SAR. It originates from random constructive or destructive interference induced by the wavelength-scale surface roughness of illuminated targets. Consequently, it manifests as stochastic intensity variations in the resulting images. Furthermore, under complex electromagnetic environments, radio frequency interference (RFI) noise superimposes radar echoes. This superimposed noise typically exhibits characteristics that can be approximately modeled as additive in the imagery, which fundamentally differs from the multiplicative nature of speckle noise.
The significant challenge of denoising SAR imagery, coupled with the scarcity of high-quality ground truth data, has led to the common practice of leveraging optical remote sensing imagery for training SAR denoising models. Optical imagery typically exhibits significantly lower noise levels and superior spatial resolution compared to SAR, facilitating the acquisition of high-fidelity ground-truth information. By utilizing these clean optical references and incorporating precise models of SAR noise mechanisms—which encompass multiplicative speckle noise and potential additive interference noise—high-fidelity synthetic SAR data can be generated for training. This approach ultimately enhances the model’s generalization capability and denoising accuracy when applied to real SAR data.
The model of additive white noise in SAR images can be represented as follows [46]:
Y a d d = X + N a d d ,
where Y a d d represents the image containing additive white noise, X represents the clean image, and N a d d represents the additive white noise.
The variable N a d d is conventionally assumed to follow a Gaussian distribution, defined as follows:
N a d d N μ , σ 2 ,
where μ denotes the noise mean, and σ 2 represents the noise variance.
The speckle noise model in SAR imagery can typically be expressed as follows [47]:
Y c o r = X N c o r ,
where Y c o r denotes the observed speckle-corrupted image, X represents the corresponding noise-free image, and N c o r signifies the multiplicative speckle noise component.
Assuming that the multiplicative noise N c o r follows an L -order Gamma distribution with a mean of 1 and a variance of 1 / L , the probability density distribution function of the multiplicative noise can be expressed as follows:
P N c o r = 1 Γ L L L N c o r L 1 e L N c o r , N c o r 0 , L 1 ,
where Γ represents the Gamma function, and L is the shape parameter of the Gamma distribution. This parameter corresponds to the Equivalent Number of Looks ( E N L ), characterizing the speckle noise intensity in SAR imagery. The E N L is derived from homogeneous regions in the SAR image using
E N L = μ r e g i o n σ r e g i o n 2 ,
with μ r e g i o n and σ r e g i o n denoting the sample mean and sample standard deviation, respectively, computed over a radiometrically uniform area.

2.1. Traditional Denoising Methods

Traditional methodologies for SAR image denoising have established a relatively comprehensive theoretical framework. Early research primarily developed along two main technical pathways: spatial-domain local filtering strategies and transform-domain methods employing multi-scale analysis [23]. Spatial filtering techniques utilize statistical modeling of pixel-wise neighborhood correlations. Representative methods include Lee filtering [17], which applies the local linear minimum mean square error criterion; Kuan filtering [18], incorporating variance statistics within localized windows; and Frost filtering [19], based on exponentially weighted spatial autocorrelation functions. Although these approaches reduce noise through pixel intensity adjustments guided by statistical models, they often cause edge blurring and texture detail loss during speckle suppression. Furthermore, their performance demonstrates significant sensitivity to filtering window dimensions.
Subsequent research addressing the limitations of spatial-domain techniques led to the development of multi-scale denoising frameworks based on wavelet transforms [20]. These methods decompose images into multi-resolution subbands using wavelet basis functions. They effectively attenuate noise by applying soft-thresholding to the high-frequency coefficients. While wavelet-based approaches preserve geometric features more effectively than spatial filters, they introduce inherent ringing artifacts and pseudo-Gibbs phenomena, which often cause pixel value distortions. This degradation is particularly pronounced in regions exhibiting strong scattering.
Recent advancements in non-local similarity block-matching have stimulated hybrid algorithms, such as Probabilistic Patch-Based (PPB) denoising [21] and SAR Block-Matching 3D (SAR-BM3D) filtering [22]. The PPB algorithm integrates Gamma distribution parameter estimation and iterative refinement mechanisms within a non-local means framework, significantly enhancing denoising robustness in low signal-to-noise ratio scenarios. Nevertheless, its Euclidean distance-based similarity metric demonstrates insufficient sensitivity to thin structures and low-intensity regions.
The SAR-BM3D method combines three-dimensional block grouping with collaborative filtering in the wavelet domain. It employs a generalized likelihood ratio test to cluster similar patches and implements Wiener filtering within the transform domain for signal reconstruction. This approach achieves superior edge sharpness and preserves periodic textures effectively. However, it still suffers from localized over-smoothing when processing complex scenes.
Traditional SAR denoising methodologies universally depend on a priori noise model assumptions and handcrafted feature engineering. Their static parameter configurations fundamentally lack adaptability to the highly variable scene characteristics and noise distributions inherent in SAR imaging, thereby constraining algorithmic generalization capabilities. These inherent limitations have driven a paradigm shift toward data-driven deep learning frameworks.

2.2. Deep Learning-Based Denoising Methods

Recent advances in deep learning have fundamentally reshaped the methodological landscape of SAR image denoising. These data-driven approaches demonstrate significantly superior performance over conventional methodologies through automated feature extraction capabilities [24]. Unlike traditional algorithms dependent on handcrafted features, deep learning models utilize multi-layer nonlinear transformations to extract high-dimensional abstract representations directly from raw data. This capability confers enhanced generalization capacity in complex noise environments.
Researchers have developed specialized deep architectures targeting the inherent speckle characteristics of SAR imagery. Cascaded convolutional networks with multi-scale attention mechanisms enable balanced noise suppression and texture preservation. By integrating multi-scale feature fusion and spatial–channel attention modules, these networks effectively address the local detail processing limitations of conventional CNNs [48]. Meanwhile, denoising frameworks incorporating Wasserstein Generative Adversarial Networks (WGANs) enhance adaptability to unknown noise distributions through residual structures and probabilistic discriminators. However, their training stability requires further optimization [41].
Deep learning architectures for SAR denoising exhibit increasing diversification. Residual learning frameworks have gained broad adoption, with implementations such as SAR-CNN, which directly map noise distributions through residual estimation [25], and ID-CNN, which enhances precision using component-wise residual layers with composite loss functions [26]. To overcome receptive field limitations, SAR-DRN employs dilated convolutions to construct computationally efficient lightweight networks that expand feature capture capacity [27]. More advanced solutions integrate attention mechanisms with residual architectures. Hybrid dilated residual attention networks leverage Convolutional Block Attention Modules (CBAMs) to amplify critical feature representation [28], while SAR-CAM improves detail reconstruction through multi-scale contextual blocks [29]. Notably, zero-shot learning strategies applied to single-image SAR denoising offer promising solutions for scenarios with scarce annotated data [49,50,51].
Furthermore, encoder–decoder architectures have been extensively investigated for SAR denoising due to their multi-scale feature extraction capabilities. The U-shaped network developed by Can Wang et al. optimizes noise–edge tradeoffs through cross-layer feature fusion [38]. Concurrently, Vitale’s team introduced G-MONet, which incorporates generalized Gamma coherence models with classification loss functions to mitigate mismatches between synthetic training data and optimization objectives [52].
Critically, emerging hybrid paradigms bridge classical and deep learning methodologies. Enhanced adaptive bilateral filtering leverages deep learning-driven parameter optimization while retaining classical edge preservation properties [53]. Concurrently, Lin et al.’s Prior-driven Denoising Stream Network (PDSNet) enables end-to-end optimization for both denoising and parameter recovery by incorporating reconstructed image parameters into network weights [31].
Nevertheless, two fundamental challenges persist. First, dominant models’ reliance on supervised learning limits scalability due to scarce annotated datasets. Second, most methods’ exclusive focus on singular noise types (e.g., speckle) compromises adaptability to real-world complexities, including RFI and hybrid noise. Additionally, prevalent network architectures lack physical interpretability, undermining their ability to generalize across heterogeneous noise distributions.

2.3. Vision Transformer

Transformers have recently gained prominence in SAR image denoising due to their inherent global attention modeling and long-range dependency capture capabilities [33]. Unlike conventional CNNs, Transformers dynamically model inter-region semantic correlations through self-attention mechanisms. This characteristic makes them particularly suitable for addressing the spatially heterogeneous distribution of SAR speckle noise [34]. In 2022, Perera et al. pioneered the adaptation of Transformer architectures to SAR denoising. They developed an end-to-end model enhanced by a compound loss function that demonstrated effective speckle suppression on synthetic datasets [35]. Further advancing this domain, Yu’s team achieved significant edge preservation improvements through a self-supervised framework that integrates residual blocks with Transformer modules. An innovatively designed regularized loss function substantially reduces over-smoothing artifacts in this approach [36].
Recognizing the complementary strengths of CNNs in local feature extraction and Transformers in modeling long-range dependencies, several hybrid architectures have recently been explored for SAR image denoising. These approaches primarily aim to integrate Transformer modules within established CNN frameworks, such as U-Net variants, to enhance contextual modeling beyond the limitations of local receptive fields. Xiao et al.’s Trans-NLM [37] algorithm integrates the classical Non-Local Means (NLM) filter with a Transformer-based attention mechanism. The core idea is to use the learned attention weights from the Transformer module to guide patch similarity calculation and weighting in the NLM framework, thereby improving the efficiency and effectiveness of patch matching for denoising. While it leverages Transformer attention, its underlying structure still heavily relies on the classical NLM paradigm and requires explicit patch matching [37]. Recently, U-Net architectures have incorporated Swin Transformer blocks into the skip connections and/or bottleneck of a U-Net architecture. The Swin Transformer’s shifted window mechanism reduces computational complexity compared to standard global self-attention. The pixel-shuffle downsampling strategy aims to improve cross-scene generalization. This represents a more direct fusion of modern Transformer variants with the popular CNN-based encoder–decoder structure [38]. Designed for robust feature reconstruction under severe contamination, the newly proposed Cross Aggregation Transformer (CAT) [39] employs hierarchical attention mechanisms. While its primary application was hyperspectral image denoising, the hierarchical attention concept is relevant to SAR processing. It demonstrates the potential of sophisticated attention designs within hybrid frameworks. Architectures like HCformer [54] (for medical image denoising) and Restormer [55] (for general image restoration) demonstrate the efficacy of combining convolutional layers for initial feature extraction/local processing with Transformer blocks for global context aggregation. While not specifically designed for SAR, their core hybrid design philosophy is influential.
Despite their contributions, existing Transformer–CNN hybrids for SAR denoising still face significant challenges:
Limited Spatial Adaptability to Noise Heterogeneity: Most methods employ standard self-attention mechanisms (global or window-based, like Swin) that assign weights based on feature similarity, often assuming uniform importance or interaction patterns. They lack explicit mechanisms to dynamically modulate attention pathways based on the local noise intensity and structural complexity inherent in SAR imagery (e.g., high-noise urban edges vs. low-noise water bodies). This static interaction paradigm can lead to insufficient suppression in high-noise regions or over-smoothing in low-noise regions.
Inadequate Exploitation of Frequency Domain: Existing hybrids primarily operate within the spatial domain. They do not explicitly decompose features into frequency components for targeted processing, missing the opportunity to leverage the distinct spectral characteristics of noise (medium–high frequency) and structural information (low frequency) in SAR images.
Feature Degradation in Multi-Scale Fusion: While multi-scale processing is common (e.g., in U-Nets), the feature fusion strategies, especially when integrating Transformer outputs with CNN features across scales, are often simplistic (e.g., concatenation followed by convolution). This can lead to suboptimal cross-scale interaction and potential information loss or degradation, hindering the preservation of fine details crucial for SAR interpretation.
To bridge these critical gaps, we propose DAT-Net, a Dynamic Adaptive Transformer Network. DAT-Net is built upon a multi-scale encoder–decoder backbone but introduces three key innovations specifically designed to address the limitations above: (1) A Dynamic Gated Attention Module (DGAM) for spatially adaptive feature interaction conditioned on local noise/structure; (2) A Frequency-domain Multi-Expert Enhancement (FMEE) module for targeted processing of frequency components; (3) A lightweight Multi-scale Convolution Block (MCB) with enhanced cross-scale fusion capability. This synergistic design aims to achieve superior adaptive denoising for complex, hybrid SAR noise while preserving intricate details.

3. Methodology

3.1. Overall Network Architecture

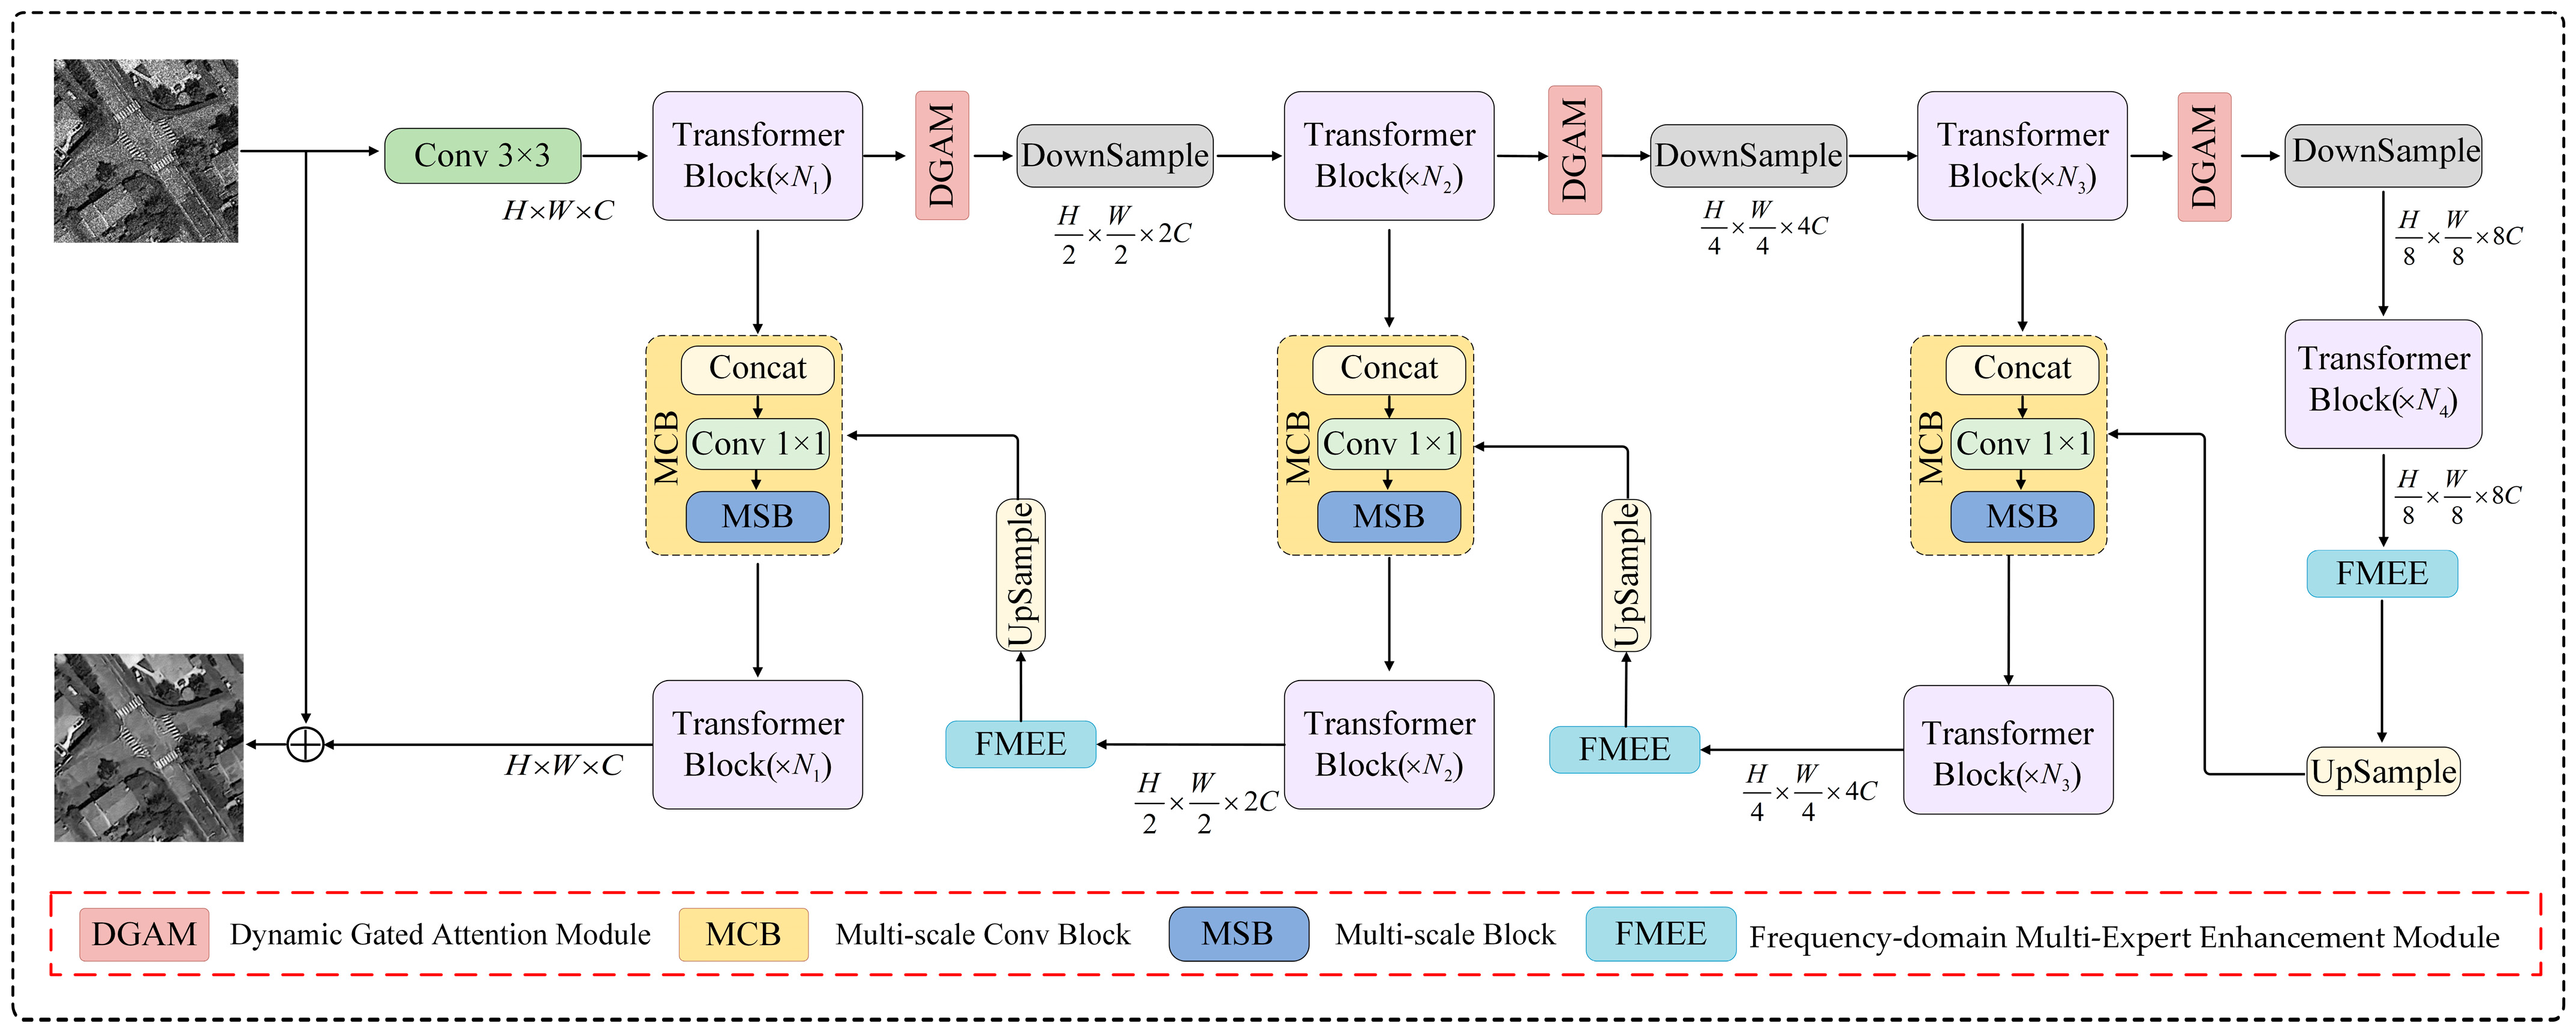
The proposed DAT-Net employs a three-tier hybrid encoder–decoder architecture. This design integrates convolutional and Transformer paradigms through residual skip connections. The complete network configuration is depicted in Figure 2.
The proposed DAT-Net employs a multi-scale encoder–decoder architecture featuring hierarchical feature processing. To strike a balance between denoising efficacy and structural fidelity, our framework incorporates three specialized modules addressing SAR-specific challenges: (1) DGAM for spatially adaptive feature refinement, (2) FMEE module enabling dual-domain processing, and (3) MCB for multi-scale feature interaction fusion. Residual connections bridge the encoder and decoder stages, facilitating direct propagation of hierarchical feature representations.
The denoising process employs a three-stage encoder–decoder architecture for progressive feature extraction, with each stage containing multiple Transformer blocks. This hierarchical design enhances local feature utilization and denoising efficacy. Each encoder phase combines Transformer blocks with a DGAM module. Initially, input images undergo feature extraction through a 3 × 3 convolutional layer. Subsequent encoder stages progressively reduce spatial dimensions while increasing channel depth, capturing higher-level abstract representations.
The DGAM incorporates dynamic thresholding to adaptively recalibrate attention weights, addressing the static weight limitations inherent in conventional attention mechanisms. This module generates input-dependent attention masks through learnable thresholds and biases, selectively suppressing noise-correlated features while preserving structural integrity. By combining spatial locality with adaptive recalibration, DGAM effectively handles the complex noise distributions characteristic of SAR imagery.
The decoder architecture integrates upsampling convolution layers with Transformer blocks. Prior to upsampling, the FMEE module decomposes features into frequency domains using the Fast Fourier Transform (FFT). High-frequency components, corresponding to edges and details, are processed by noise-suppression experts. Low-frequency components, representing smooth regions, undergo structural-preservation transformations. This multi-expert strategy enables dynamic, feature-adaptive processing capability.
Following the upsampling stage, the MCB implements parallel depthwise separable convolutions with varying receptive fields. This design captures multi-scale contextual information efficiently. Channel shuffle operations facilitate cross-branch feature fusion, and 1 × 1 convolutions enable feature recombination with dimensionality reduction. Residual skip connections maintain the original information flow throughout the network.
The synergistic integration of DGAM, FMEE, and MCB modules in DAT-Net provides significant advancements for SAR denoising. Distinct from conventional CNNs’ local feature extraction, DGAM enables dynamic filtering of noise-sensitive regions. FMEE combines frequency-domain decomposition with task-specific expert processing, while MCB fuses multi-scale contexts through depthwise separable convolutions. The Transformer-based encoder–decoder framework incorporates residual propagation pathways to mitigate gradient vanishing and facilitate efficient fusion of low-level and high-level features. This architecture demonstrates enhanced capability for handling complex SAR noise distributions while preserving textural details.

3.2. Dynamic Gated Attention Module

Conventional attention mechanisms in SAR denoising typically assume uniform regional importance, employing fixed weighting schemes for global feature interactions. However, this assumption contradicts the fundamental physical properties of SAR imagery. Due to the multiplicative nature of speckle noise [7], noise intensity in actual SAR data correlates strongly with terrain scattering properties. Specifically, homogeneous regions such as calm water bodies exhibit lower noise intensity, whereas edge structures and texturally complex areas like urban infrastructures demonstrate substantial amplification. Such spatial heterogeneity causes structural information loss during aggressive noise suppression while retaining artifacts in low-noise regions.
Critically, effectively capturing long-range pixel dependencies is paramount for SAR denoising due to the inherent nature of both the noise and the underlying structures:
Distinguishing Persistent Structures from Random Noise: Speckle manifests as spatially uncorrelated, high-frequency random fluctuations. Conversely, genuine image structures (e.g., long linear features like roads or coastlines, large homogeneous regions like fields, and periodic patterns in urban areas) exhibit strong correlations over extended spatial distances. By establishing long-range dependencies, DGAM enables the network to aggregate information from distant pixels sharing similar scattering characteristics. This provides crucial contextual evidence to differentiate true, spatially persistent structures from localized, uncorrelated speckle noise. Suppressing noise becomes more reliable when supported by evidence from coherent regions far beyond the immediate neighborhood.
Preserving Large-Scale Structural Continuity: Many important features in SAR imagery (e.g., geological formations, agricultural field boundaries, and large-scale infrastructure) span significant distances. Traditional local filters or limited receptive fields struggle to maintain the continuity and smoothness of these large structures, often introducing breaks or inconsistencies during denoising. DGAM’s ability to model interactions across the entire scene allows it to enforce global consistency, ensuring that the denoised output faithfully preserves the integrity and connectivity of these extended features.
Exploiting Non-local Self-Similarity: Natural and man-made scenes often contain repeating patterns or similar textures distributed across the image (e.g., similar building blocks in an urban area, rows of crops in agriculture, and ripple patterns on water). Capturing long-range dependencies allows DGAM to identify and leverage these non-local self-similarities. Information from a distant patch exhibiting a similar scattering response can be used to reinforce the signal and suppress noise in the current patch, significantly enhancing the denoising fidelity, especially in textured regions where local information alone is ambiguous.
Mitigating Multiplicative Noise Impact: The multiplicative nature of speckle means noise variance scales with signal intensity. In complex, high-backscatter areas (e.g., urban centers), noise is amplified, making local details extremely noisy. Local operators risk over-smoothing or losing structure entirely. Long-range dependencies provide a broader statistical perspective, allowing DGAM to better estimate the true underlying signal intensity in such regions by referencing correlated areas (even if distant) that might be less noisy or offer contextual clues about expected structures, leading to more robust detail preservation.
To address these limitations and harness the power of long-range contextual modeling, we propose the DGAM, whose core innovation reformulates patch interactions as an adaptive graph-structured learning framework. DGAM constructs multi-granularity correlation graphs through dual-path feature embedding. Global semantic anchors are extracted using coarse-stride Overlapping Spatial-wise Patch Partition (OSP) [56], explicitly designed to capture long-range contextual relationships. Simultaneously, fine-grained geometric details are preserved via dense-stride OSP. During graph construction, a dynamic threshold gating mechanism utilizes independent convolutional branches to predict noise-sensitivity thresholds and biases per semantic node. This design adaptively filters critical interaction pathways according to local noise distributions, enabling two key functions: (1) sparse attention activation in high-noise regions to suppress irrelevant responses while still allowing essential long-range connections to guide denoising, and (2) receptive field expansion in low-noise regions to enhance structural preservation by freely leveraging long-range dependencies for context. Thus, DGAM inherently facilitates robust modeling of long-range pixel dependencies, which is essential for distinguishing noise from true structure, preserving large-scale features, exploiting non-local similarities, and handling the signal-dependent nature of SAR noise. As shown in Figure 3, DGAM achieves spatially variant denoising intensity through explicit noise–structure coupling, maintaining computational efficiency while surpassing static interaction paradigms.
The proposed DGAM module achieves a synergistic fusion of local details and global semantics through multi-granular interaction and adaptive gating. Subsequent subsections elaborate its implementation across four hierarchical components: feature embedding, patch similarity graph construction, adaptive gating, and feature reconstruction.

3.2.1. Feature Embedding and Multi-Scale Patch Extraction

Let X B × C × H × W denote the input feature map, where B , C , H , and W represent the batch size, number of channels, height, and width, respectively. The DGAM first generates embedded features through three independent convolutional branches:
B 1 = Conv 3 × 3 X B × K × H × W ,
B 2 = Conv 1 × 1 X B × K × H × W ,
and
B 1 = B 2 ,
where K denotes the intermediate channel dimension (default K = 4 ), and Conv k × k indicates a convolution operation with kernel size k × k .
Subsequently, multi-scale patch representations are extracted via OSP operations with strides s 1 (default s 1 = 4 ) and s 2 (default: s 2 = 1 ):
P s 1 = OSP B 1 , k , s 1 B × K k 2 × L 1 ,
Q s 2 = OSP B 2 , k , s 2 B × K k 2 × L 2 ,
and
V s 2 = OSP B 3 , k , s 2 B × K k 2 × L 2 ,
where k denotes the unified patch dimension (default k = 3 ), and L 1 = H / s 1 W / s 1 and L 2 = H W .

3.2.2. Patch Similarity Graph Construction

To reduce computational complexity, dimensionality reduction is performed on the multi-scale patches extracted via OSP using fully connected layers:
P ˜ s 1 = FC 1 P s 1 B × L 1 × d
and
Q ˜ s 2 = FC 2 Q s 2 B × L 2 × d ,
where d = K k 2 / 4 denotes the reduced dimensionality, and FC 1 and FC 2 comprise linear transformations followed by ReLU activation functions.
Subsequently, the patch similarity matrix is constructed via matrix multiplication:
S = P ˜ s 1 Q ˜ s 2 T L 1 × L 2 ,
where S i , j quantifies the semantic similarity between the coarse-grained patch i and the fine-grained patch j .

3.2.3. Adaptive Threshold Gating

Upon obtaining the patch similarity matrix, we introduce learnable thresholding and biasing parameters to dynamically filter critical nodes, effectively attenuating noise while preserving essential structural details.The learnable thresholds and biases are computed as follows:
θ = Conv k × k thr Pad X B × L 1
and
β = Conv k × k bias Pad X B × L 1 ,
where Pad denotes symmetric padding, and Conv thr , Conv bias generate per-location thresholds and biases for coarse-grained patches, respectively. The gated attention weights are then derived by applying thresholding to the patch similarity matrix:
S ^ i , j = ReLU S i , j μ S i θ i + β i
and
A i , j = exp γ S ^ i , j j exp γ S ^ i , j ,
where μ S i is the row-wise mean of the patch similarity matrix, γ denotes the Softmax scaling factor (default: 10), and the ReLU function enforces sparse activation.

3.2.4. Feature Reconstruction and Aggregation

The fine-grained patches are aggregated using the attention weights A through
V ˜ = A V s 2 L 1 × K k 2 .
Subsequently, the aggregated patches are remapped to the feature space via Reversed Overlapping Spatial-wise Patch Partition (ROSP) reassembly:
Y = ROSP V ˜ B × K × H × W .
The final output is generated by channel dimension restoration via convolutional layers, followed by residual concatenation:
O = Conv 1 × 1 Y + X .

3.3. Frequency-Domain Multi-Expert Enhancement Module

The coherent imaging mechanism and complex electromagnetic environment result in intricate noise distributions in SAR imagery, which poses considerable challenges for separating noise from structural information in the spatial domain. In contrast, within the frequency domain, the distinct spectral characteristics of SAR speckle noise and terrain features become clearly distinguishable due to the physics of radar scattering: speckle noise—resulting from the coherent summation of random scatterers—exhibits a broadband spectral energy distribution, with significant power concentrated in the medium-to-high frequency range, whereas genuine terrain structures, such as extensive homogeneous regions and linear edges, manifest as energy-compact low-frequency components due to their spatial continuity translating into spectral locality. This inherent disparity in spectral properties offers a theoretically well-founded pathway for superior noise–structure separation—a capability fundamentally beyond the reach of purely spatial-domain approaches.
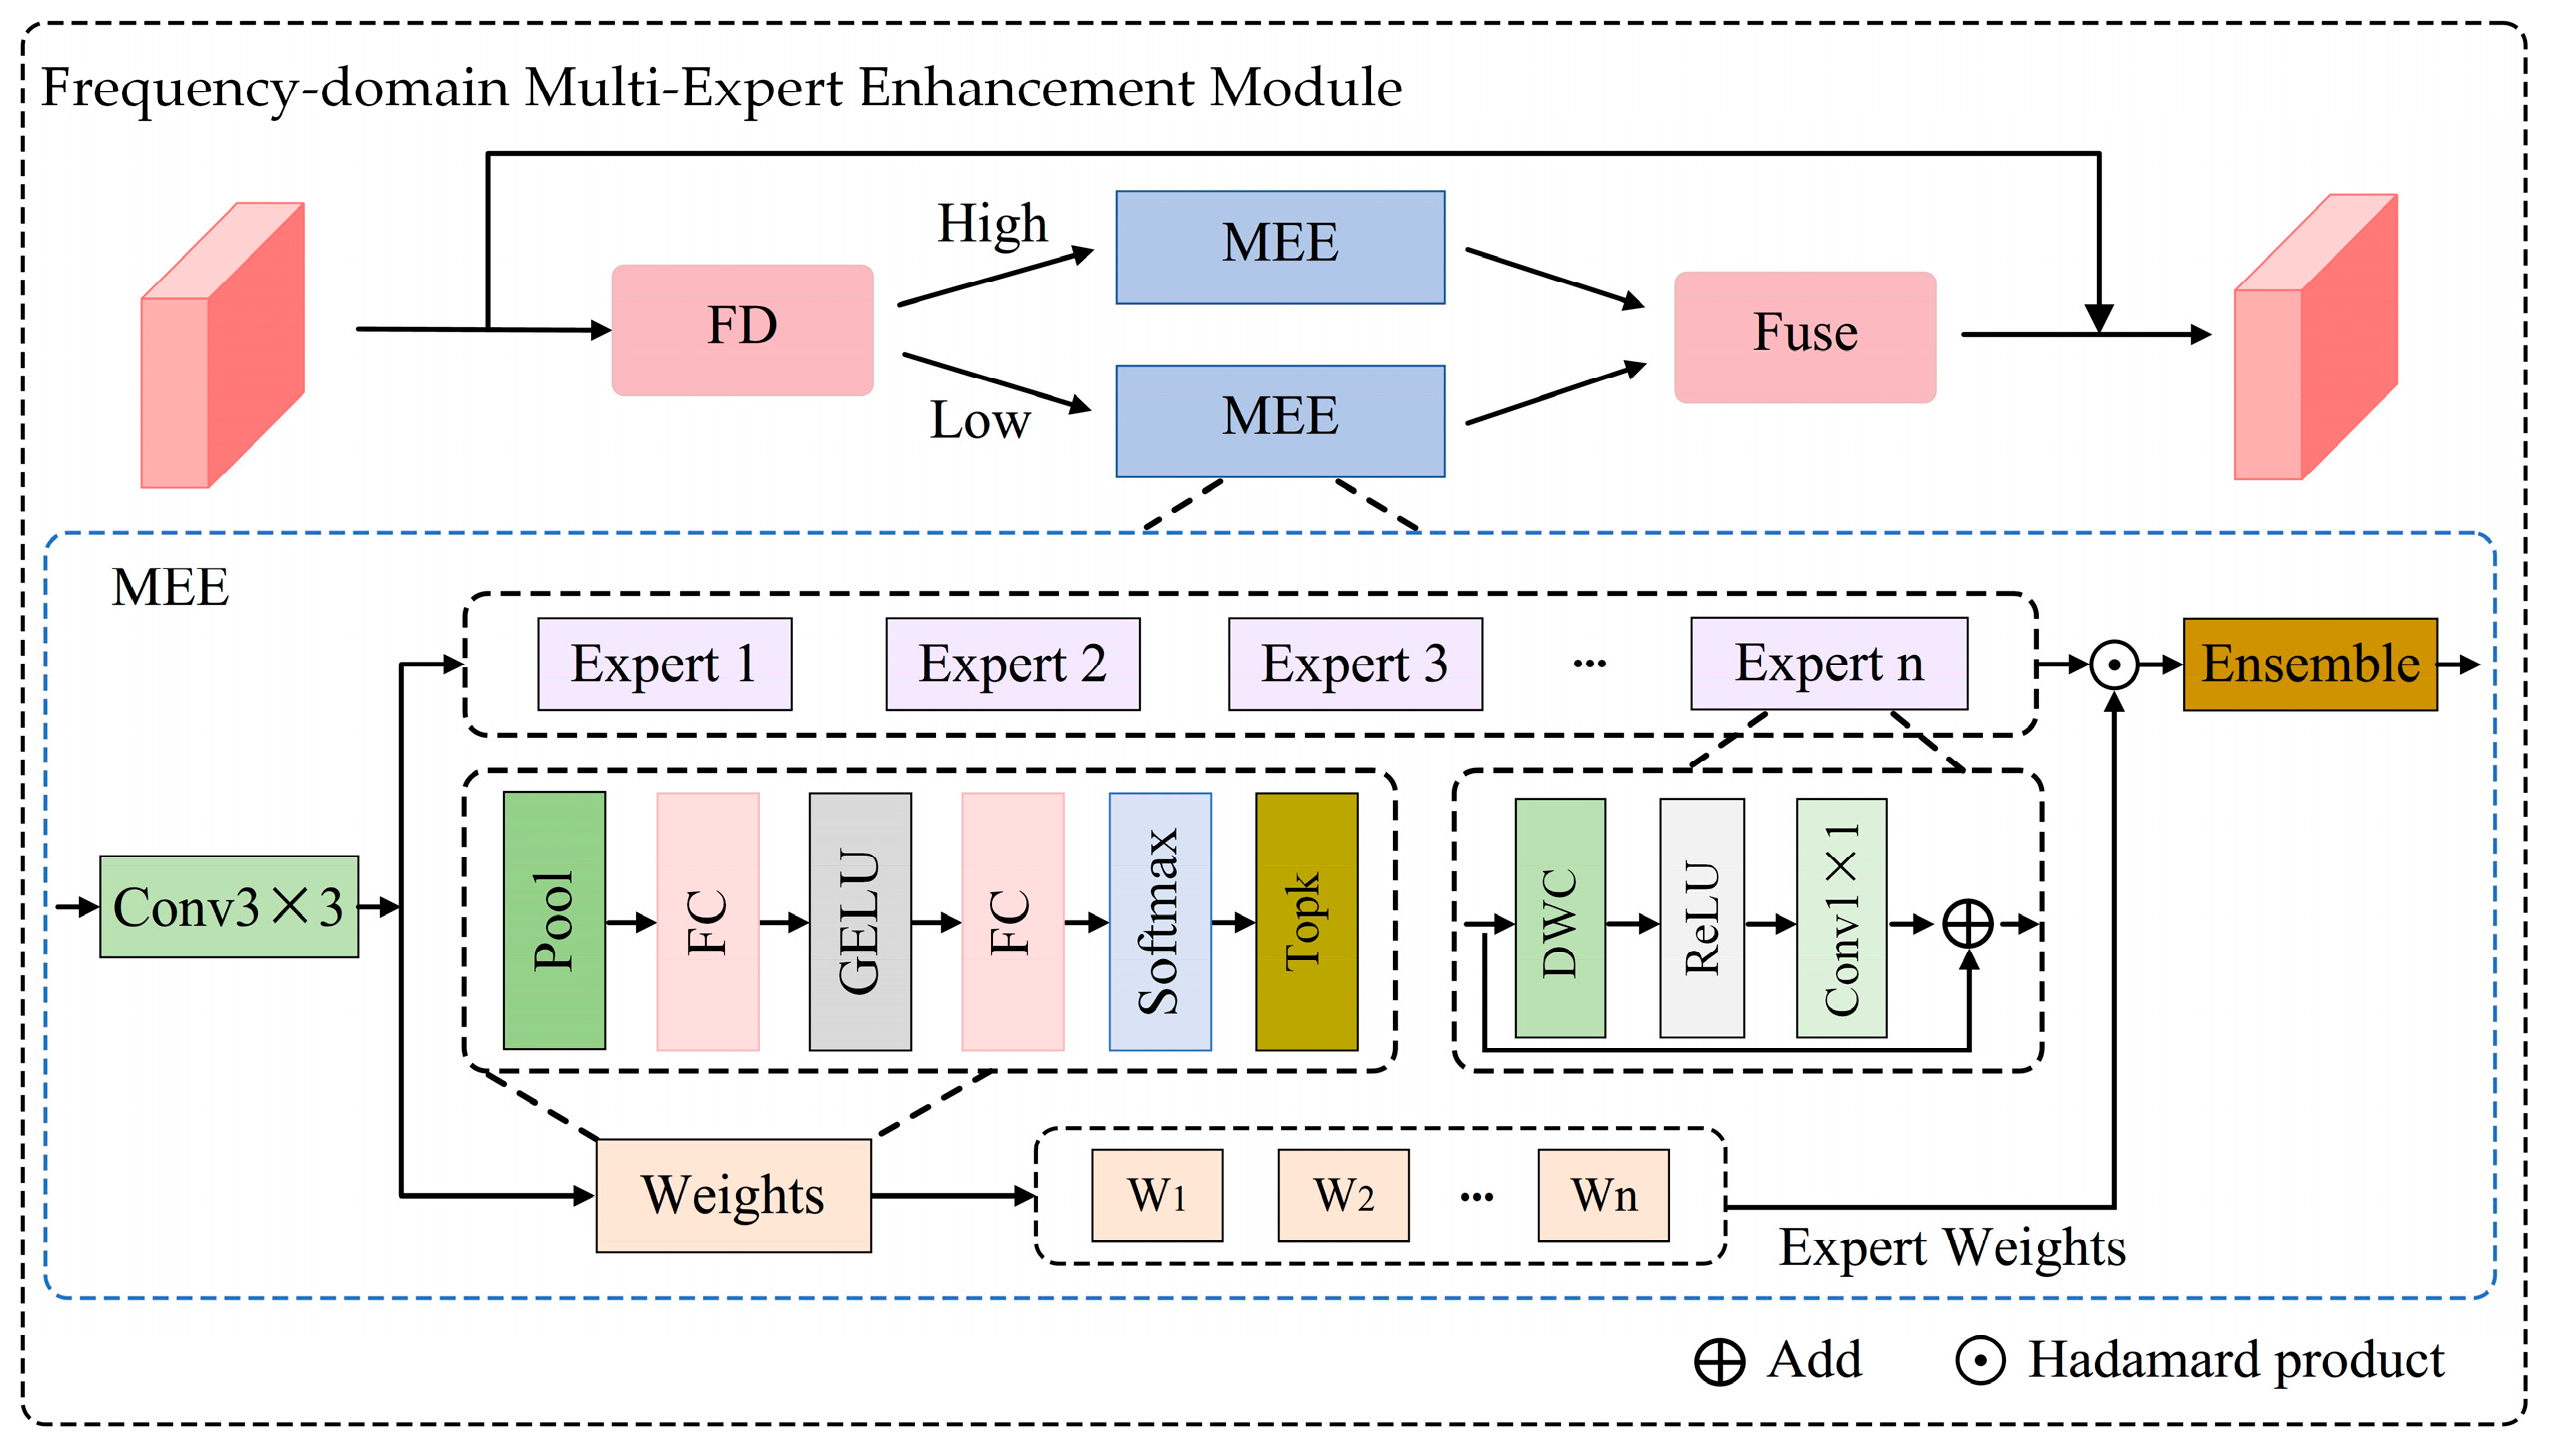
To fully utilize the advantages of frequency domain processing, we propose the FMEE module, whose architecture is depicted in Figure 4. The FMEE module first employs the FFT with Gaussian low-pass filtering to decouple high-frequency (HF) and low-frequency (LF) components. These partitioned components undergo adaptive enhancement through dynamically sparse expert networks, which activate only the top-K most relevant experts based on input characteristics. The refined HF and LF components are then reconstructed and integrated via residual connections, preserving representational capacity while preventing information degradation. FMEE fundamentally transforms spectral priors into actionable denoising operations, establishing a new paradigm for physics-aware SAR restoration.
Due to the unique structure of FMEE, its unique advantages in SAR denoising include the following:
  • Physics-Driven Noise Suppression:
Gaussian low-pass filtering in the frequency domain directly attenuates noise-dominant mid/high-frequency bands while preserving structural low-frequencies. This exploits SAR’s inherent spectral separability, achieving near-optimal noise filtering grounded in electromagnetic scattering theory.
2.
Adaptive Enhancement for SAR-Specific Artifacts:
SAR’s coherent imaging process introduces structured noise artifacts—such as ghost targets and sidelobes—that contaminate specific spectral regions. FMEE employs dynamically sparse expert networks to provide targeted artifact suppression: its High-Frequency Experts (HF) specialize in preserving genuine textures (e.g., urban areas) while suppressing stochastic speckle and mitigating coherent artifacts through depthwise separable convolutions, which explicitly model local phase correlations inherent to SAR interference. Meanwhile, the Low-Frequency Experts (LF) focus on enhancing semantic continuity across homogeneous regions (e.g., water bodies) and preventing over-smoothing of weak backscatter targets via residual learning. A top-K gating mechanism ensures computational resources are concentrated on regionally dominant artifacts, a capability essential for efficient large-scene SAR processing.
3.
Cross-Domain Synergy:
By performing spectral decoupling prior to spatial reconstruction, FMEE avoids the “frequency leakage” problem inherent in wavelet-based methods, where noise residuals persist in reconstructed spatial features. Instead, FMEE enforces strict spectral isolation throughout the enhancement process: high-frequency enhancement is confined solely to edge and texture refinement, while low-frequency enhancement homogenizes noise without blurring critical high-frequency details. This orthogonal form of processing proves particularly advantageous for SAR imagery, where noise and structural features exhibit significantly stronger spectral separability compared to optical images.
4.
Robustness to Complex Scattering:
Urban areas containing dense corner reflectors produce non-Gaussian spike noise that contaminates multiple frequency bands. FMEE addresses this through its multi-expert design, which dynamically assembles specialized filters by leveraging routing features that encode local spectral statistics, along with a weighted expert fusion mechanism that adapts to regional noise distributions. This approach enables context-aware denoising that cannot be achieved using fixed spectral filters—such as Wiener filters—which are ineffective in handling the spatially varying scattering complexity typical of SAR imagery.
The proposed FMEE module enables globally adaptive feature refinement via spectrum-aware multi-expert enhancement. This architecture contains two core components: a Frequency Decomposition (FD) unit and a Multi-Expert Enhancement (MEE) Network. The detailed operational principles of these components are presented in subsequent subsections.

3.3.1. Frequency Decomposition

Given the feature map X B × C × H × W , it is first transformed into the frequency domain via the FFT:
X ^ = F X = 1 H W h = 0 H 1 w = 0 W 1 X h , w e j 2 π u h H + v w W ,
where F denotes the FFT, u represents the horizontal frequency index ( 0 μ < H ), and ν indicates the vertical frequency index ( 0 ν < W ).
Spectral centering is then performed via a shift operation S to relocate the zero-frequency component to the spectrum center:
X ^ = S X ^ .
To decouple HF and LF components, a Gaussian low-pass filter M is introduced:
M i , j = exp i H 2 2 + j W 2 2 2 σ W 2 , i , j 0 , H × 0 , W .
The frequency-domain features undergo spectral decoupling into LF component X ^ l o w and HF component X ^ h i g h through Gaussian filtering:
X ^ l o w = S 1 X ^ M X ^ h i g h = S 1 X ^ 1 M ,
where S 1 denotes the inverse shift operation restoring the original coordinate system, and represents the Hadamard product for conducting spectral filtering operations.
Spatial-domain reconstruction is subsequently performed via the inverse FFT:
X l o w = F 1 X ^ l o w X h i g h = F 1 X ^ h i g h .

3.3.2. Multi-Expert Enhancement Network

After decomposing the feature maps into HF and LF components, a dynamically routed MEE network processes these components independently. The enhanced representations are then fused and delivered via residual connections.
Initially, a 3 × 3 convolutional layer doubles the channel dimension of the input feature tensor. The tensor is subsequently partitioned along the channel axis into two components: the expert network input X i n and routing features K :
X i n , K = Split Conv 3 × 3 X ,
where Split denotes channel-wise partitioning with equal dimensionality.
The weight network computes the expert weighting coefficients by processing routing features K through global pooling and linear transformations:
w = Softmax MLP GAP K ,
where the multilayer perceptron ( MLP ) incorporates a single hidden layer with dimensionality C / 4 .
A sparse gating mechanism selects the top-k expert weights while suppressing non-selected coefficients to zero. The activated experts then perform adaptive feature transformation on X i n :
X ¯ i n = i = 1 k w i ε i X i n ,
where ε i denotes the i -th expert network, and its structure is defined as follows:
ε i X i n = X i n + Conv 1 × 1 ReLU DWC 3 × 3 X i n ,
with DWC 3 × 3 indicating a depthwise separable convolution of kernel size 3.
The refined features from both frequency branches are subsequently fused and augmented through residual connections:
X o u t = ReLU MEE l o w X l o w + MEE h i g h X h i g h + X .

3.4. Multi-Scale Convolution Block

Adopting multi-scale processing is a common approach in deep learning models for object detection and image processing. The adoption of a multi-scale processing paradigm in SAR despeckling is fundamentally motivated by the inherent scale-dependent characteristics of both SAR imagery and speckle noise:
1.
Scale-Variant Structural Complexity:
SAR scenes encompass diverse targets exhibiting vastly different spatial scales. Small-scale objects (e.g., vehicles, isolated buildings, point targets) demand fine-grained feature extraction for precise localization and shape preservation. Conversely, large-scale homogeneous regions (e.g., agricultural fields, water bodies, forests) benefit more from coarse-grained contextual information to achieve effective noise averaging while maintaining uniformity. A single fixed receptive field is insufficient to optimally capture this wide spectrum of structural information.
2.
Multiplicative Noise and Edge Preservation:
Speckle noise, being multiplicative and signal-dependent, manifests differently across scales. Small, high-frequency noise components are prominent in fine details and textures, requiring small receptive fields for localized suppression. However, near edges and strong scatterers, noise variance is amplified, potentially corrupting larger areas. Aggressive local filtering risks blurring or obliterating crucial edges and textures. Multi-scale analysis allows for targeted noise suppression: small kernels preserve edges while smoothing homogeneous interiors, and larger kernels provide broader context to distinguish true edges from noise-induced artifacts and to smooth larger homogeneous areas more effectively.
3.
Complementary Feature Abstraction:
Features extracted at different scales offer complementary perspectives. Fine-scale features capture intricate textures and sharp boundaries, while coarse-scale features encode semantic context and global structural relationships. Integrating these multi-granularity features provides a more holistic representation, enabling the network to make more informed decisions about noise suppression and detail preservation across the entire image.
To enhance multi-scale feature extraction capability and improve cross-channel interaction efficiency, leveraging the rationale and addressing the limitations above, we designed the lightweight Multi-scale Convolution Block (MCB). This module implements parallel depthwise separable convolution pathways with heterogeneous receptive fields (k = {3,5,7}) to capture complementary multi-scale semantic abstractions efficiently. Subsequent channel shuffle operations explicitly facilitate efficient inter-scale and inter-channel fusion, overcoming the isolation inherent in simple concatenation. Finally, 1 × 1 convolutions achieve channel compression and further integration. The MCB architecture is illustrated in Figure 5.
While multi-scale strategies are not novel in image processing, the design of MCB addresses critical limitations prevalent in conventional and many existing deep learning-based multi-scale methods:
1.
Computational Efficiency via Depthwise Separable Convolutions (DSC):
Many approaches employ standard convolutions with different kernel sizes (e.g., Inception-like modules) or dilated convolutions to achieve multi-scale receptive fields. These incur substantial computational and parametric costs, especially with larger kernels. MCB fundamentally mitigates this burden by utilizing parallel pathways of lightweight Depthwise Separable Convolutions (DSC) with heterogeneous kernels (k = {3,5,7}). DSC significantly reduces parameters and FLOPs compared to standard convolutions, making MCB highly suitable for resource-constrained or real-time SAR processing scenarios.
2.
Enhanced Cross-Scale Interaction via Channel Shuffle:
A common drawback of simple parallel multi-branch concatenation is the limited interaction between features originating from different scales. Features from different branches remain largely segregated within their own channel groups after concatenation. MCB explicitly addresses this by introducing a Channel Shuffle operation after feature concatenation. This operation fundamentally reorganizes the grouped channels, forcing information exchange across the feature maps generated by different kernel sizes. This promotes efficient cross-scale fusion before channel compression, allowing fine details to inform coarse representations and vice versa, leading to more coherent and contextually aware feature representations. This is a distinct advantage over methods relying solely on concatenation followed by a 1 × 1 convolution for fusion, which often results in weaker inter-scale communication.
3.
Balanced Representation and Gradient Flow:
The design incorporates a residual connection. This not only alleviates the vanishing gradient problem and enhances training stability, common concerns in deep networks, but also ensures that essential information from the input is preserved alongside the learned multi-scale features. This promotes a more balanced representation, preventing multi-scale processing from discarding valuable low-level details.
The MCB module processes the output tensors from the preceding Transformer block and UpSample layer through channel-wise concatenation, followed by a 1 × 1 convolutional layer for channel dimensionality reduction before inputting to the Multi-Scale Block (MSB). The MSB architecture integrates three parallel branches of depthwise separable convolutions with kernel sizes k = {3,5,7}. Each branch maintains identical output dimensions and implements sequential operations as follows:
X k = ReLU BN DWC k × k X ,
where X B × C × H × W denotes the input feature map, D W C k × k represents a depthwise separable convolution with kernel size k , B N indicates batch normalization, and X k B × C × H × W corresponds to the output feature map of the branch with kernel size k .
The output features from all three branches are concatenated along the channel dimension to form an expanded feature representation:
X c a t = Concat X 3 , X 5 , X 7 B × 3 C × H × W
To enhance inter-channel information flow, a channel shuffle operation is introduced, which fundamentally reorganizes grouped channels through dimension permutation. Formally, given a group number G = gcd 3 C , C = C , this operation is defined as:
X s h u f f l e d = ChannelShuffle X c a t , G B × 3 C × H × W .
Finally, channel compression is achieved via a 1 × 1 convolution followed by batch normalization to restore the original channel dimensionality. A residual connection is incorporated to mitigate gradient vanishing and enhance training stability:
X o u t = B N Conv 1 × 1 X s h u f f l e d + X .

4. Experimental Results and Analysis

4.1. Training and Test Data

Due to the scarcity of noise-free reference imagery for real SAR data, this study utilizes the publicly available NWPU-RESISC45 remote sensing dataset [57], curated by Northwestern Polytechnical University, as foundational training data. This dataset contains 31,500 images of 256 × 256 pixels covering 45 scene categories, with 700 images per category. For training set construction, 25 images per category were systematically selected, resulting in a total of 1125 training samples. During each training epoch, these samples were divided into training and validation subsets following an 8:2 ratio.
Given that the color images in NWPU-RESISC45 present distinct spectral characteristics compared to authentic single-channel SAR imagery, the dataset was converted to grayscale format. This transformation eliminates irrelevant chromatic information and enhances the model’s ability to learn SAR-specific structural features for denoising tasks.
To improve model adaptability to SAR noise properties, synthetically noised variants were generated. Specifically, referencing the noise models defined in Equations (2) and (4), simulated SAR images were produced incorporating the following noise types for constructing the training set:
1.
Additive noise: Four intensity levels with variances σ 2 25 , 50 , 75 , 100 .
2.
Multiplicative noise: Four levels parametrized by values L 1 , 4 , 8 , 16 .
3.
Hybrid noise: Combined additive and multiplicative noise emulating complex real-world SAR noise distributions ( σ 2 = 25 + L = 1 ; σ 2 = 50 + L = 4 ; σ 2 = 75 + L = 8 ; σ 2 = 100 + L = 16 ).
Each synthetically noised image was paired with its original noise-free grayscale counterpart to form training tuples.
To evaluate the generalization performance of denoising algorithms across different scenarios from multiple dimensions, we use simulated images and real SAR images to evaluate the model:
1.
Simulated Images Evaluation: To comprehensively evaluate denoising performance under conditions analogous to SAR image characteristics, we utilized four widely recognized benchmark natural image datasets:
  • Classic5 [58]: This dataset comprises five classic grayscale test images (e.g., Lena, Barbara, Boat, House, and Peppers) known for their diverse content, including smooth regions, strong edges, periodic patterns, and fine textures. Its small size allows for efficient testing while covering fundamental image features crucial for assessing detail preservation and artifact suppression.
  • Kodak24 [59]: Consisting of 24 uncompressed, high-quality true-color photographic images (each 768 × 512 pixels), this dataset offers a rich variety of natural scenes, including landscapes, portraits, and man-made objects with complex textures and color transitions. Its moderate size and visual appeal make it a standard for evaluating the perceptual quality and robustness of denoising algorithms across diverse content.
  • McMaster [60]: This dataset contains 18 high-resolution color images (minimum dimension 500 pixels) featuring significant amounts of fine details, intricate textures (e.g., feathers, fabrics, and foliage), and challenging smooth regions. It is particularly valuable for assessing an algorithm’s ability to recover subtle structures and preserve high-frequency information without introducing artifacts, which is critical for SAR image interpretation.
  • Set12 [61]: A commonly used benchmark comprising 12 standard grayscale test images of varying sizes and content (e.g., aerial images, faces, and textural patterns). It provides a good balance of different structural elements and is frequently used for direct comparison with state-of-the-art denoising methods, ensuring consistency in benchmarking.
  • These datasets were artificially corrupted with additive, multiplicative, and hybrid noise at multiple intensity levels. To ensure unbiased evaluation, quantitative metrics were computed individually per image and subsequently averaged over each complete dataset. This protocol mitigates performance bias toward images while enabling robust evaluation under diverse noise conditions.
2.
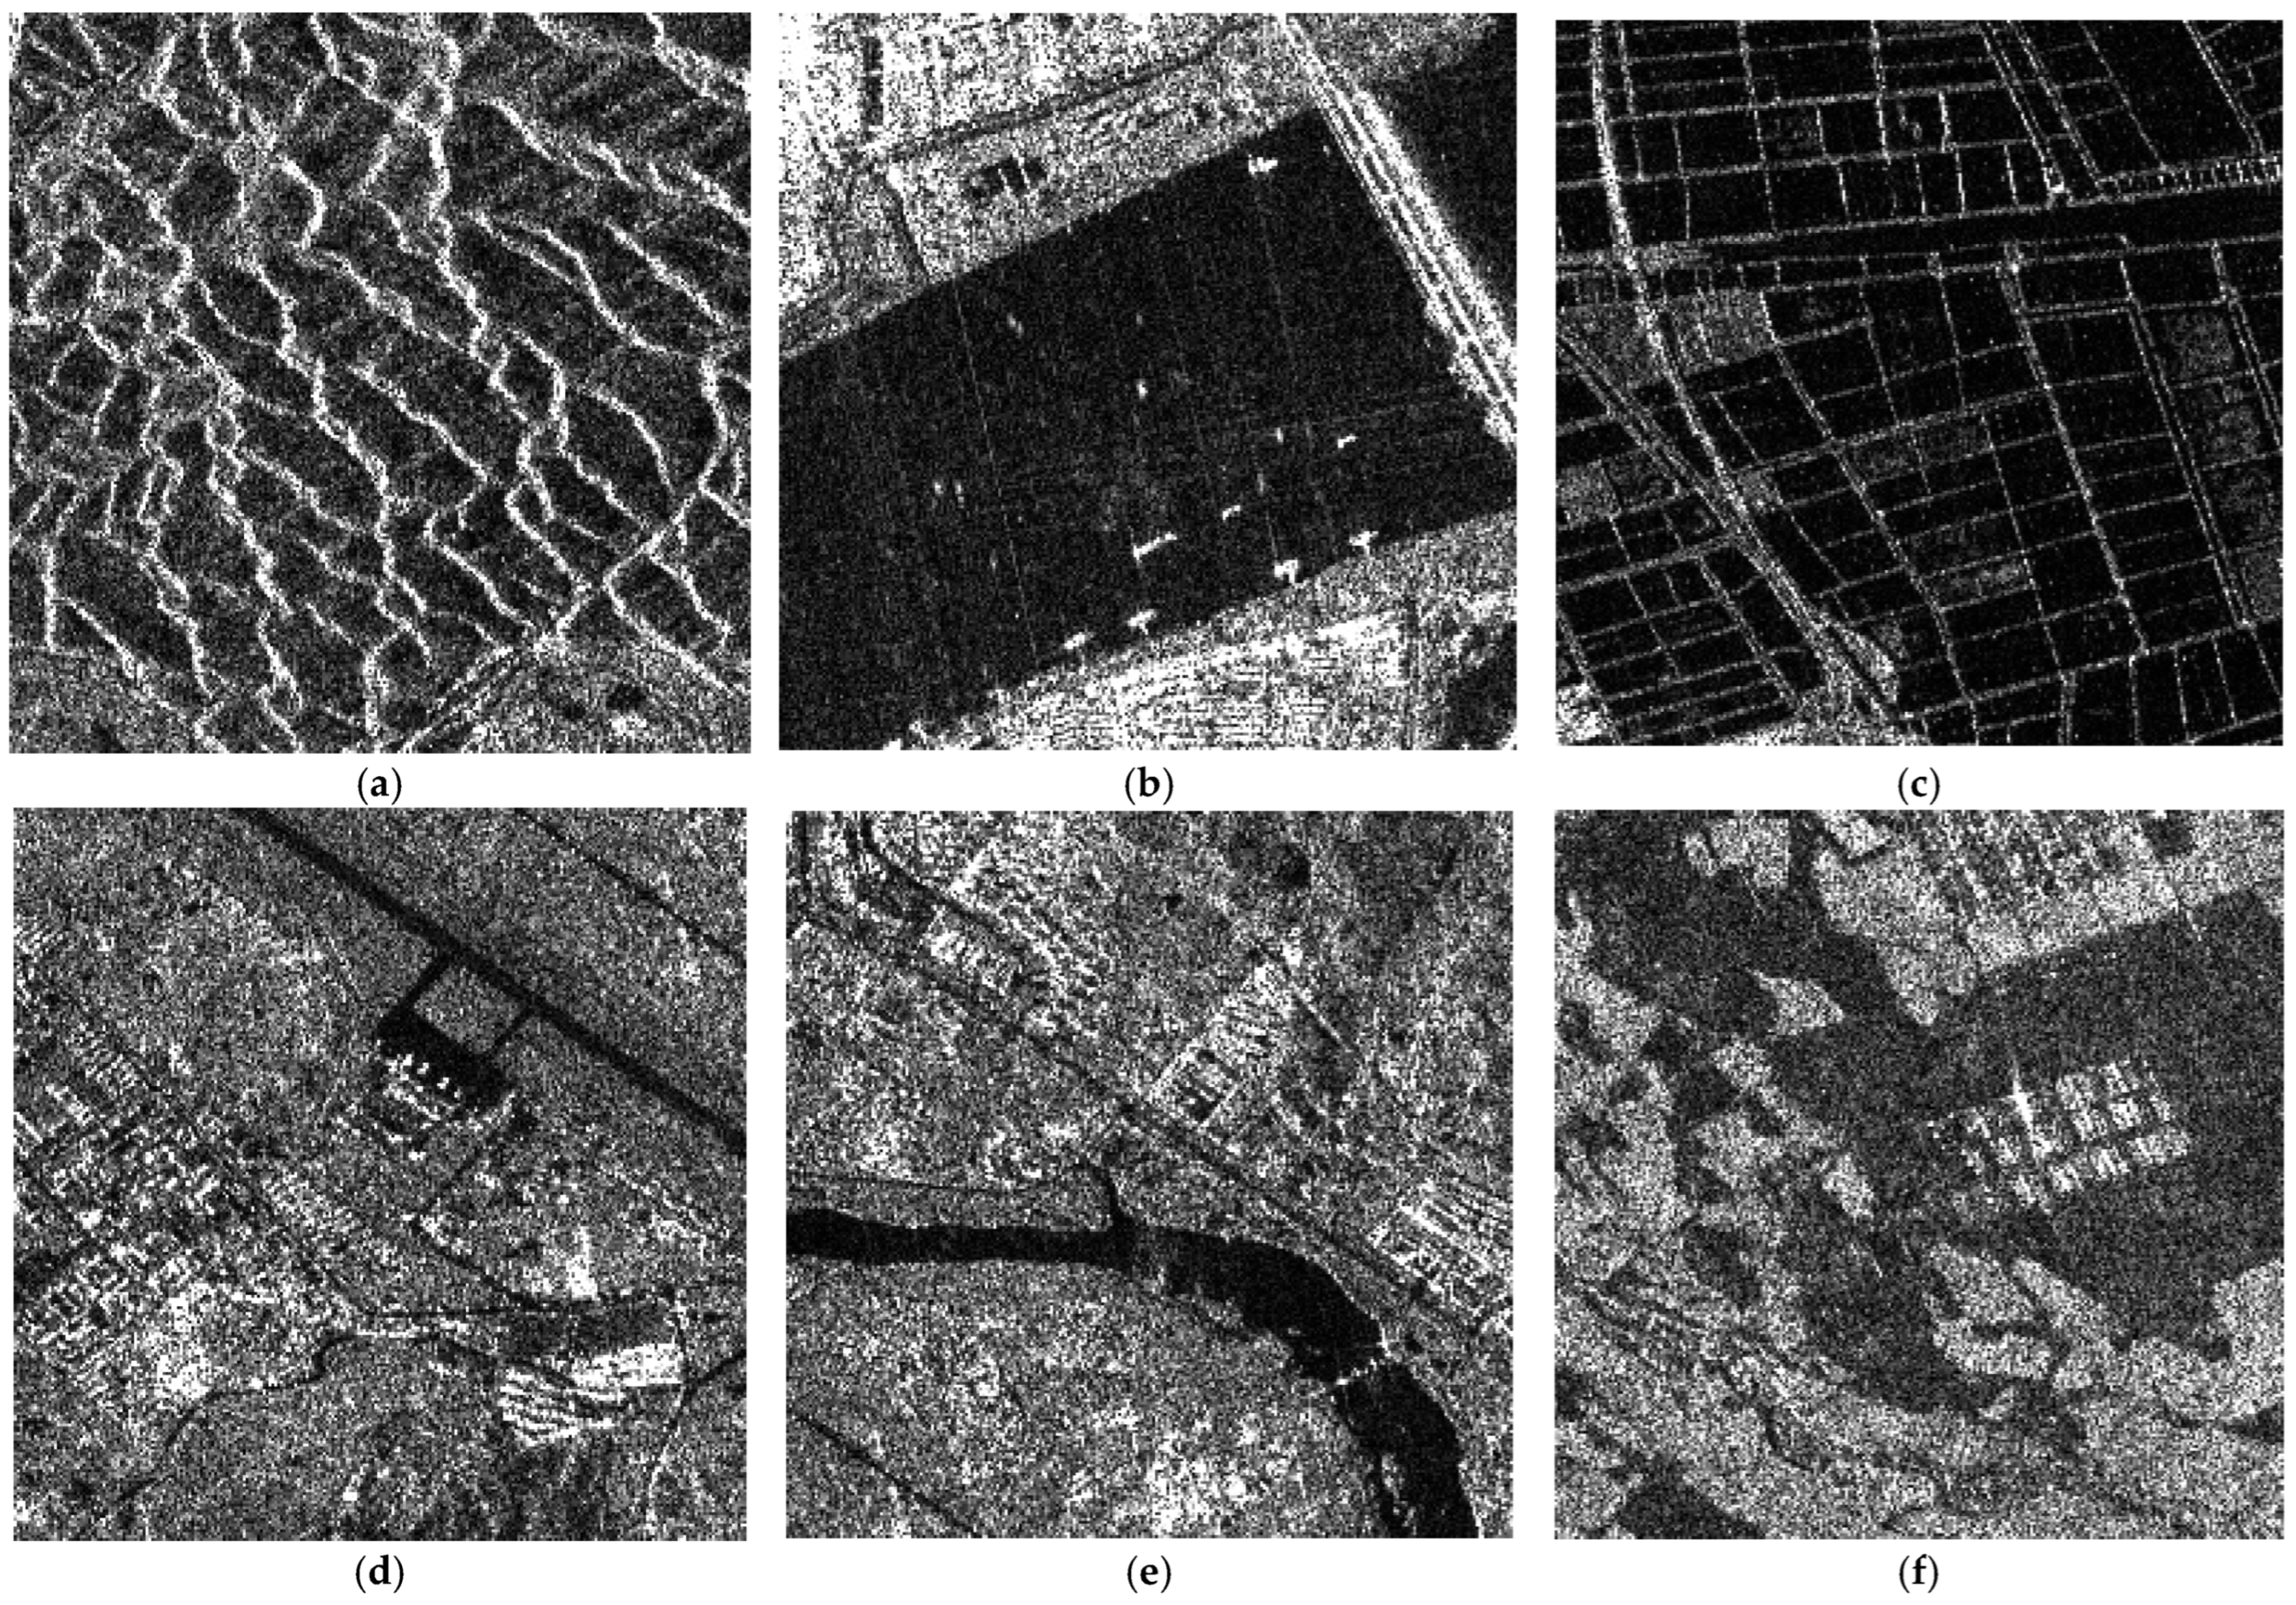
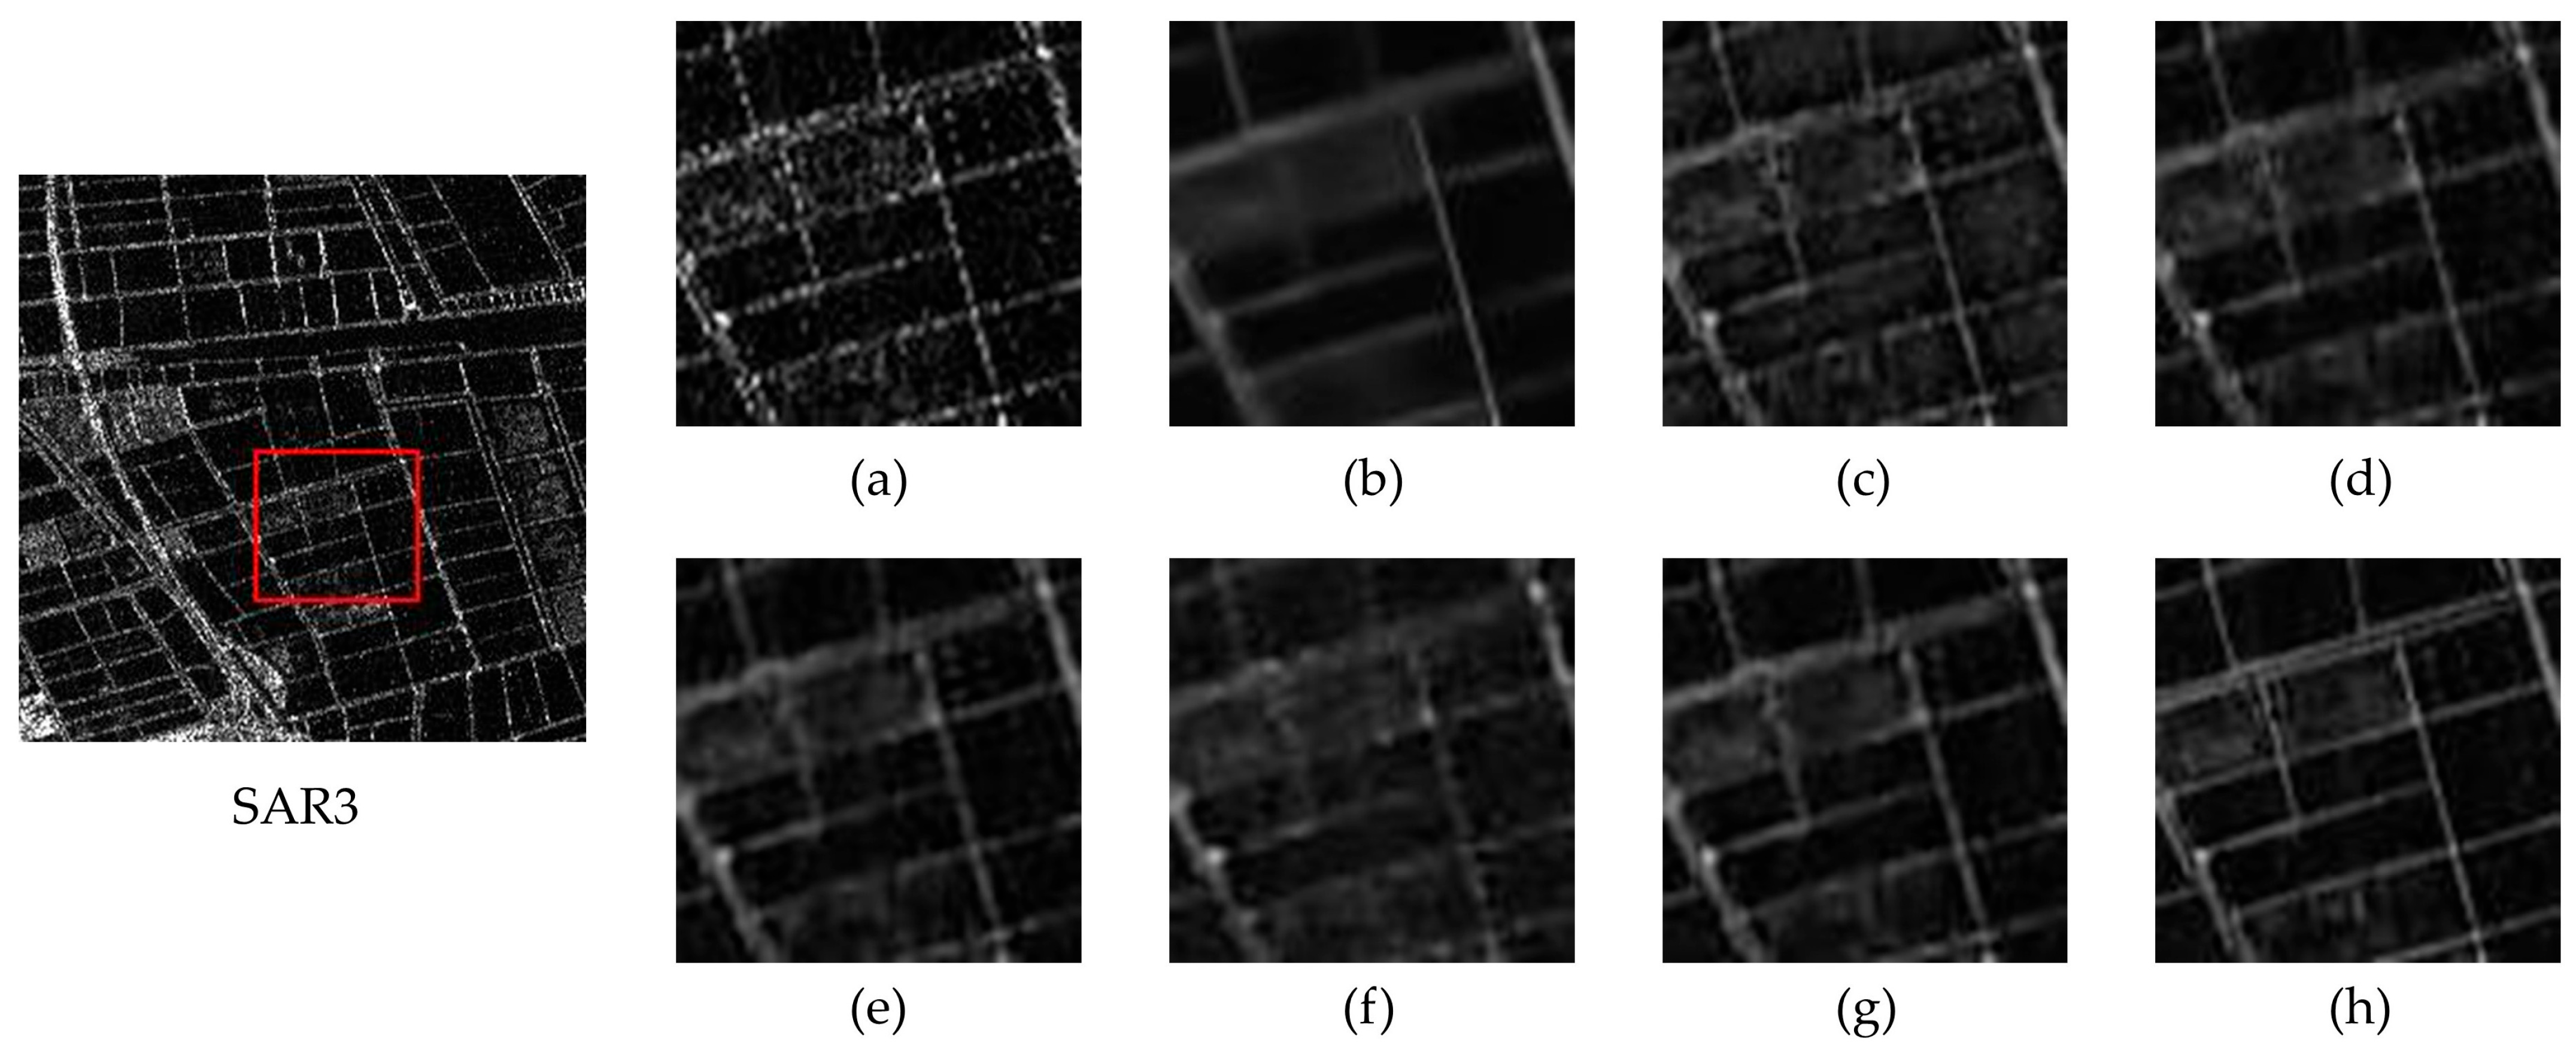
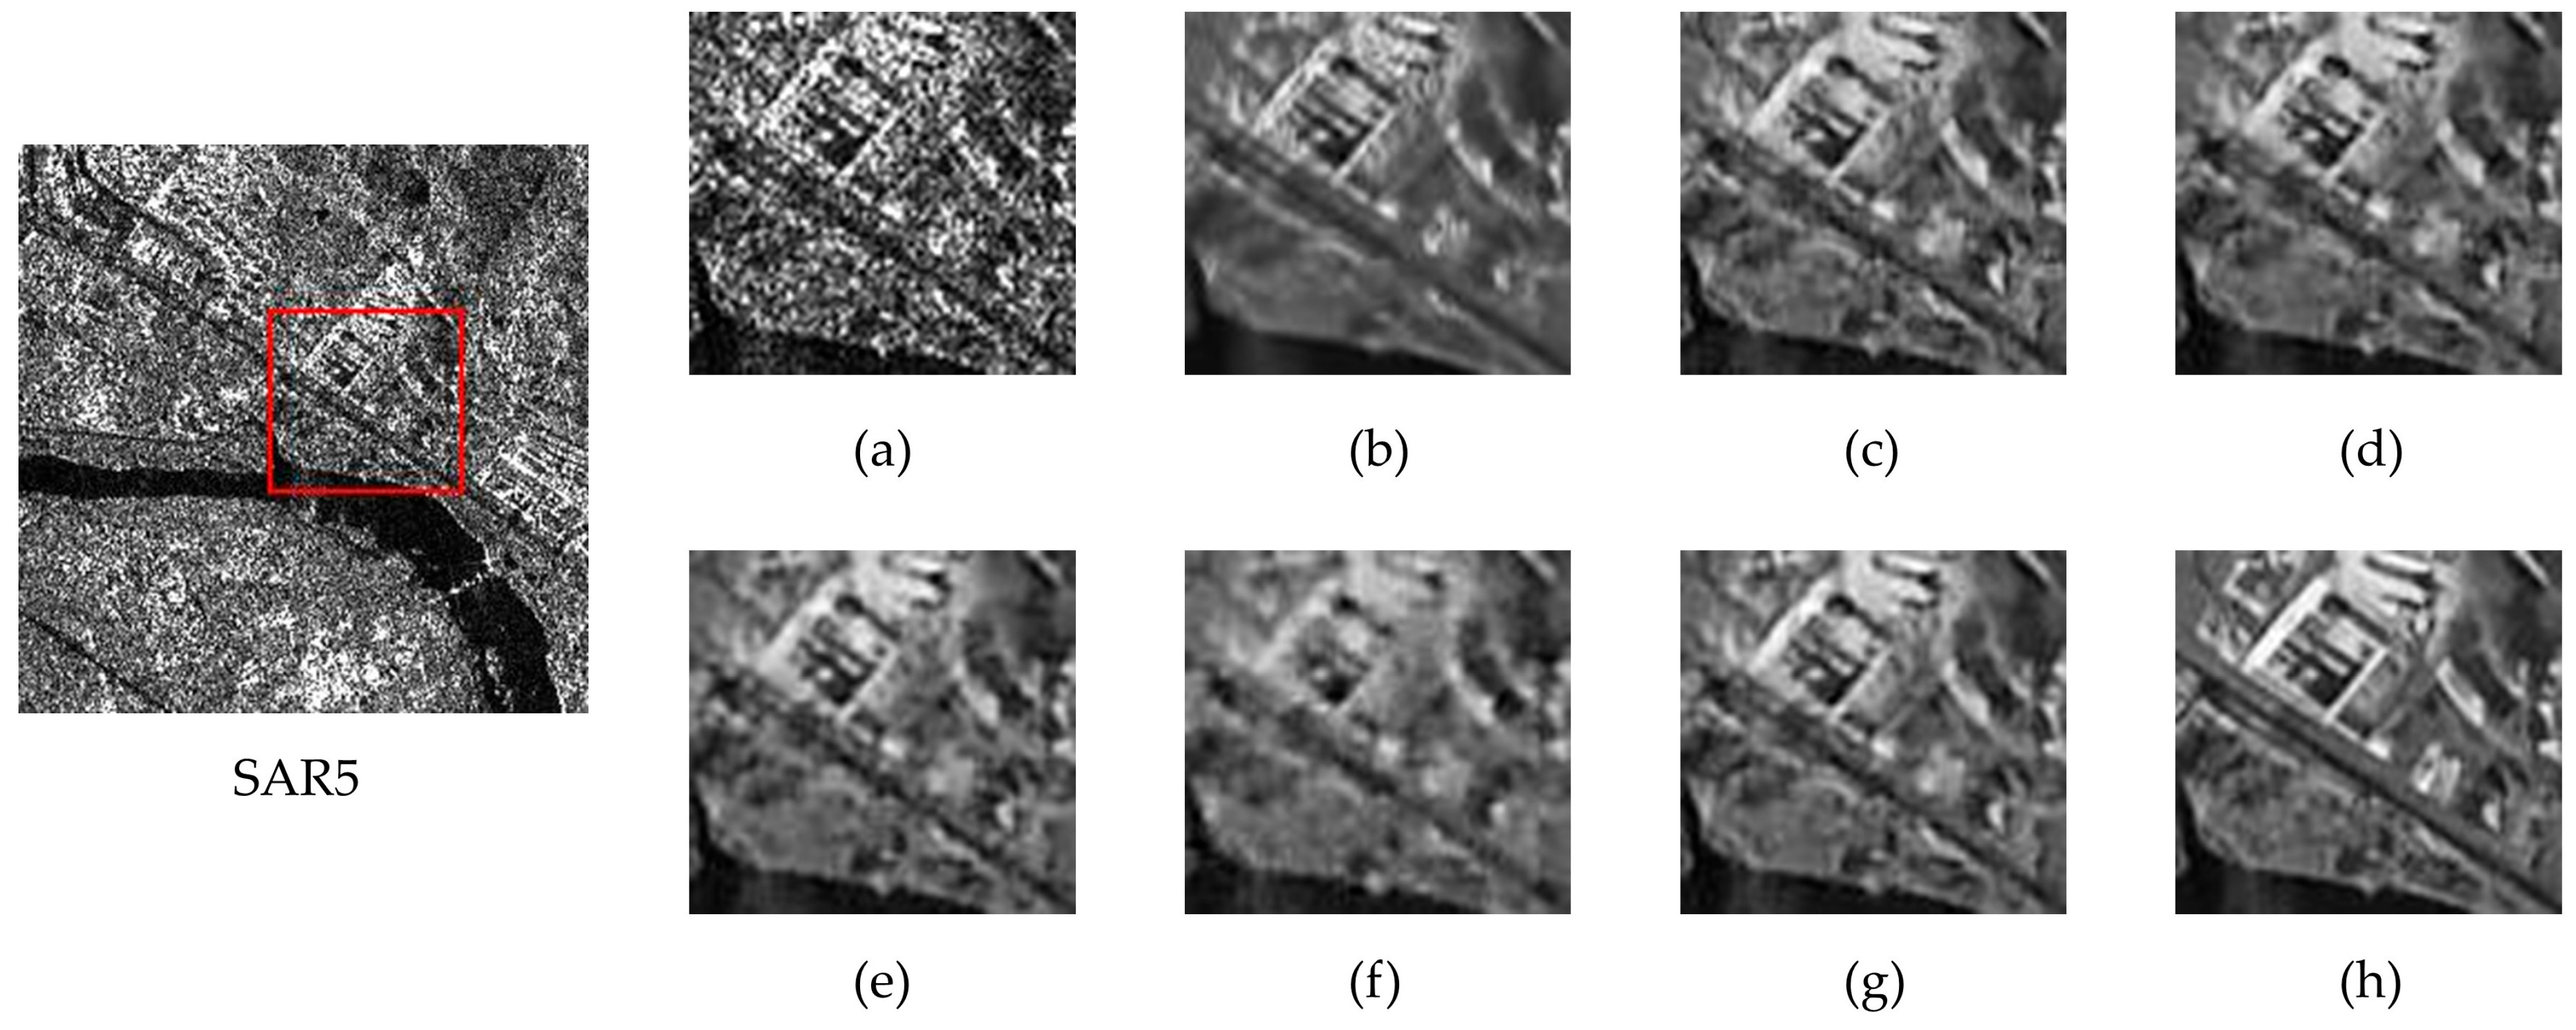
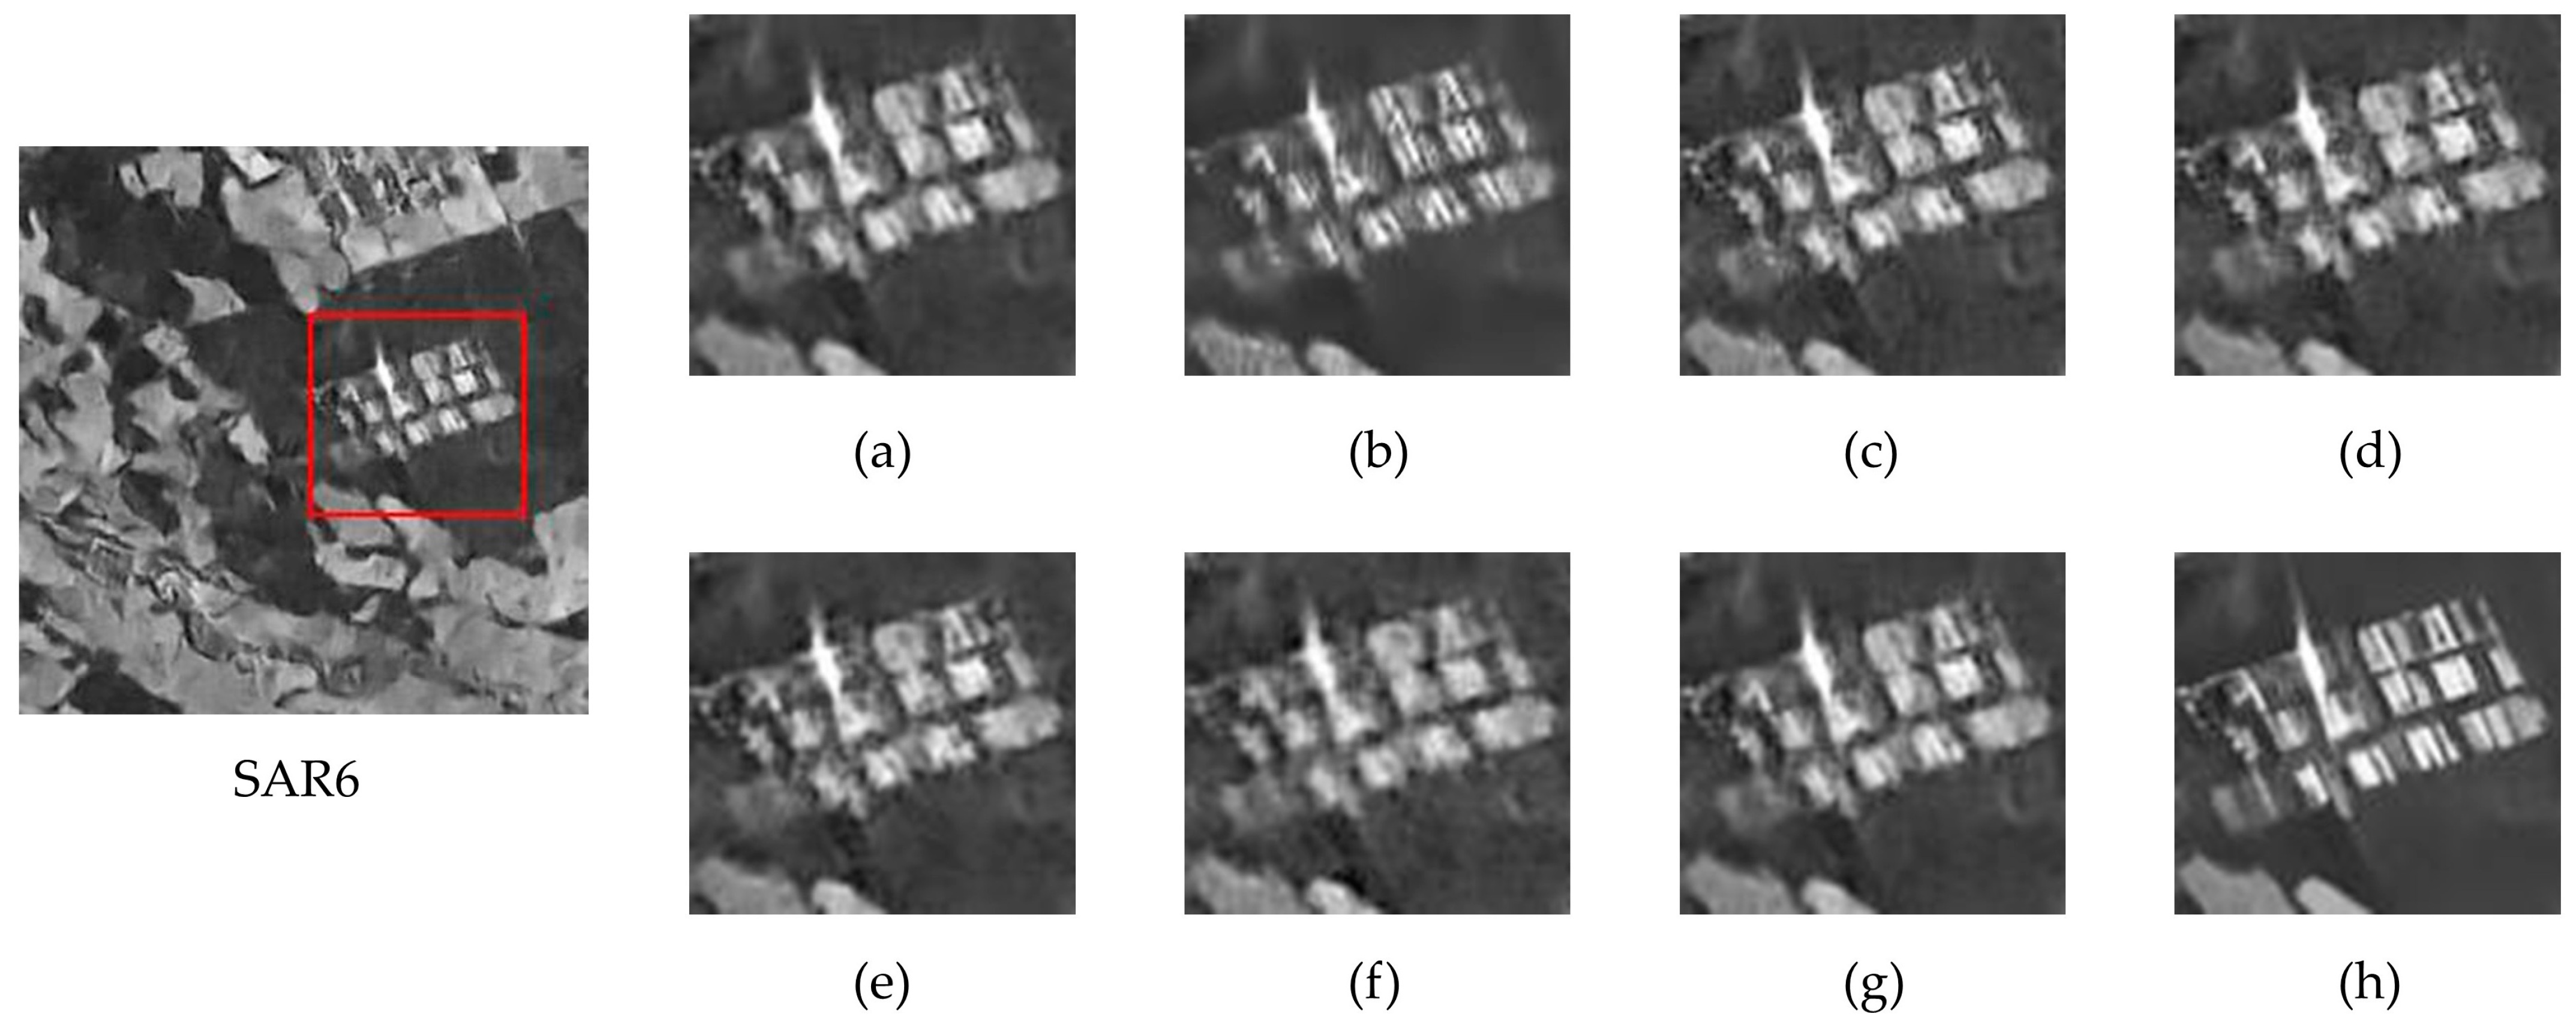
Real SAR Image Evaluation: Real SAR images evaluation was conducted on three distinct 256 × 256 SAR scenes (designated SAR1-SAR6 in Figure 6) to validate the superiority of the proposed method. These samples were selected from the SARBuD 1.0 dataset [62], a building inventory compiled by the Aerospace Information Research Institute, Chinese Academy of Sciences (AIRCAS). The dataset comprises single-polarization Gaofen-3 satellite imagery acquired in fine stripmap mode.

4.2. Experimental Setting

4.2.1. Parameter Setting and Network Training

The model was trained on an NVIDIA GeForce RTX 4090D GPU using the BasicSR framework with a batch size of eight. Optimization employed the AdamW algorithm, configured with an initial learning rate of 3 × 10⁻⁴, momentum coefficients β1 = 0.9 and β2 = 0.999, and weight decay regularization of 1 × 10⁻⁴. Training proceeded for 100,000 iterations under a two-phase learning rate schedule: the rate remained fixed for the initial 30,000 iterations, followed by cosine annealing decay gradually reducing it to 1 × 10⁻⁶. To enhance generalization, random 90° rotational transformations and axis-aligned flipping (horizontal/vertical) were dynamically applied during training data loading.

4.2.2. Comparison Method

To validate the denoising performance and edge-preservation capability of the proposed method, five benchmark algorithms (BM3D [22], DnCNN [46], SAR-CNN [25], SAR-DRN [27], and SAR-Transformer [35]) were selected for comparison. Two experimental frameworks were implemented: one using simulated SAR imagery and another with authentic SAR data. All comparative algorithms were strictly reproduced using official source codes and hyperparameters from their original publications. During testing, both the proposed and benchmark methods utilized identical computational environments and standardized evaluation protocols to ensure fair comparison.

4.3. Evaluation Metrics and Computational Efficiency Analysis

4.3.1. Evaluation Metrics

To objectively quantify denoising performance, multiple evaluation metrics were employed. Primary assessment criteria include the following: (1) Peak Signal-to-Noise Ratio (PSNR) [63] and Structural Similarity Index (SSIM) [64] for simulated imagery, and (2) Entropy [65] and Average Gradient (AG) [66] for authentic SAR data. Quantitative evaluation was supplemented by qualitative analysis examining critical visual attributes such as structural preservation, texture fidelity, artifact suppression, and residual noise levels.
PSNR: The PSNR serves as a widely adopted objective metric for evaluating image restoration quality, primarily quantifying the dissimilarity between pristine and denoised imagery. This metric computes the logarithmic ratio of the maximum possible pixel intensity to the Mean Squared Error (MSE), thereby assessing noise-induced distortion in decibel (dB) units. Higher PSNR values indicate superior fidelity preservation and reduced distortion, defined as follows:
P S N R = 10 log 10 M A X I 2 M S E ,
where M A X I denotes the maximum representable pixel intensity. The M S E between the denoised image K and original image I is computed using
M S E = 1 m n i = 0 m 1 j = 0 n 1 I i , j K i , j 2
with m and n representing the image height and width in pixels, respectively.
SSIM: The SSIM constitutes a perception-based image quality metric that holistically evaluates luminance, contrast, and structural fidelity. By integrating these three fundamental perceptual dimensions, SSIM serves as a standard benchmark for quantifying texture feature preservation in image denoising applications. The metric ranges theoretically between 0 and 1, with values approaching 1 indicating minimal perceptual divergence between the denoised image and the pristine reference. Its mathematical formulation is given by
S S I M I , K = 2 μ I μ K + C 1 2 σ I K + C 2 μ I 2 + μ K 2 + C 1 σ I 2 + σ K 2 + C 2
where μ I and μ K denote the mean intensities of images I and K , σ I 2 and σ K 2 represent their variances, σ I K signifies the cross-covariance, and C 1 and C 2 are stabilization constants preventing division by zero.
Entropy: Evaluating denoised real SAR imagery faces inherent methodological constraints due to the absence of noise-free ground-truth references, which limits conventional objective assessment frameworks. To address this limitation, we integrate qualitative visual perception analysis with information entropy as a pivotal quantitative metric for denoising evaluation. Entropy quantifies an image’s informational complexity by characterizing pixel value distribution stochasticity where entropy reduction indicates effective noise suppression, whereas excessive diminution suggests structural degradation. Optimal performance emerges when entropy maintains moderate reduction within well-defined boundaries, achieving an equilibrium between artifact removal and feature preservation. This metric is mathematically expressed as follows:
Eentropy = i = 0 L 1 p x i log 2 p x i ,
where x i denotes the i -th grayscale level, p x i signifies the occurrence probability of grayscale x i , and L represents the total number of distinct grayscale levels in the image.
AG: The AG serves as a critical quantitative metric for assessing image quality, characterizing spatial variation attributes and edge information preservation. This metric quantifies image sharpness and textural richness by computing the mean magnitude of gradient vectors across all pixel coordinates. In denoising applications, elevated AG values correlate with enhanced edge definition and superior detail retention, whereas diminished AG values suggest detrimental over-smoothing and structural information loss. The AG is mathematically expressed as follows:
AG = 1 m n i = 1 m j = 1 n I x | ( i , j ) 2 + I y | ( i , j ) 2 ,
where m and n denote the image width and height, respectively, I x and I y represent the horizontal and vertical gradient components, and i , j indicates the spatial coordinates of each pixel.

4.3.2. Computational Efficiency Analysis

To comprehensively assess the practicality of denoising models, we report key computational efficiency metrics: Floating-Point Operations (FLOPs), number of parameters (Params), and inference time per image on our test platform (NVIDIA GeForce RTX 4090D). The results are summarized in Table 1. Since BM3D is a traditional method and there are no parameters “FLOPs” and “Params” that only deep learning models have, “N/A” is used to represent these two parameters.
Table 1 reveals significant disparities in computational efficiency among the evaluated models. As a classical non-local method, the traditional approach BM3D requires no training. However, its high computational complexity results in substantially slower inference on GPUs compared to all deep learning methods, thus limiting its practicality. Lightweight CNN methods (DnCNN, SAR-CNN, and SAR-DRN) demonstrate exceptional efficiency. DnCNN and SAR-CNN share similar architectures, possessing identical FLOPs (72.63 G) and Params (0.56 M), and exhibit very close inference times (3.1 ms), signifying high efficiency. SAR-DRN further enhances efficiency through a more streamlined design (Params: 0.24 M, FLOPs: 31.61 G), achieving the fastest inference speed among all methods (1.58 ms). The introduction of Transformer modules in SAR-Transformer significantly increases model complexity. Its FLOPs (147.8 G) and Params (2.14 M) exceed those of the lightweight CNNs, leading to a markedly higher inference time (18.7 ms). Nevertheless, it still represents an order-of-magnitude improvement over the traditional BM3D. SAR-CAM, which incorporates a channel attention mechanism, occupies an intermediate position in terms of model complexity (Params: 1.37 M, FLOPs: 84.2 G) and inference time (9.5 ms) between the lightweight CNNs and the Transformer-based method.
Compared to the benchmark methods, DAT-Net faces challenges in computational efficiency. Its FLOPs (310.5 G) and Params (28.7 M) are significantly higher than those of the other comparative methods. This directly translates to the longest single-image inference time (42.8 ms). This substantial computational overhead primarily stems from its carefully designed deep architecture, which integrates modules like DGAM, FMEE, and MCB. These modules are specifically engineered to more effectively model the complex multiplicative noise structure, long-range dependencies, and subtle texture details inherent in SAR images.
SAR images are characterized by multiplicative speckle noise, which exhibits a complex structure, intensity dependent on the signal itself, and highly non-Gaussian, non-stationary properties. Effectively suppressing this noise while preserving crucial information such as strong scatterers, weak textures, edges, and structural details demands models with stronger representational capacity and more sophisticated modeling mechanisms. While simple lightweight CNN models offer optimal efficiency, their denoising capability and detail preservation often reach a bottleneck when handling extremely complex SAR scenes or those with high noise levels. In critical SAR applications such as remote sensing interpretation, topographic mapping, and target recognition, the precision and structural fidelity of the denoising results are typically prioritized over real-time performance. Compromising computational efficiency for significant gains in image quality is often acceptable, even necessary. DAT-Net’s design explicitly prioritizes meeting these stringent quality requirements. As evidenced by the experimental results presented later, DAT-Net achieves substantial improvements in both PSNR and SSIM metrics compared to other algorithms.
Furthermore, although DAT-Net’s inference time (42.8 ms) is considerably higher than that of SAR-DRN (1.58 ms) or SAR-CNN (3.15 ms), it remains two orders of magnitude faster (~83.6×) than the traditional BM3D method (3580 ms). This demonstrates that even deep models with higher computational complexity vastly outperform classical non-deep methods in efficiency. Operating at ≈23 frames per second for 256 × 256 images on an NVIDIA GeForce RTX 4090D (42.8 ms per image), DAT-Net provides sufficient speed for the majority of SAR applications, including terrain monitoring and military reconnaissance.

4.4. Performance Comparisons on Simulated Image

4.4.1. Qualitative Analysis

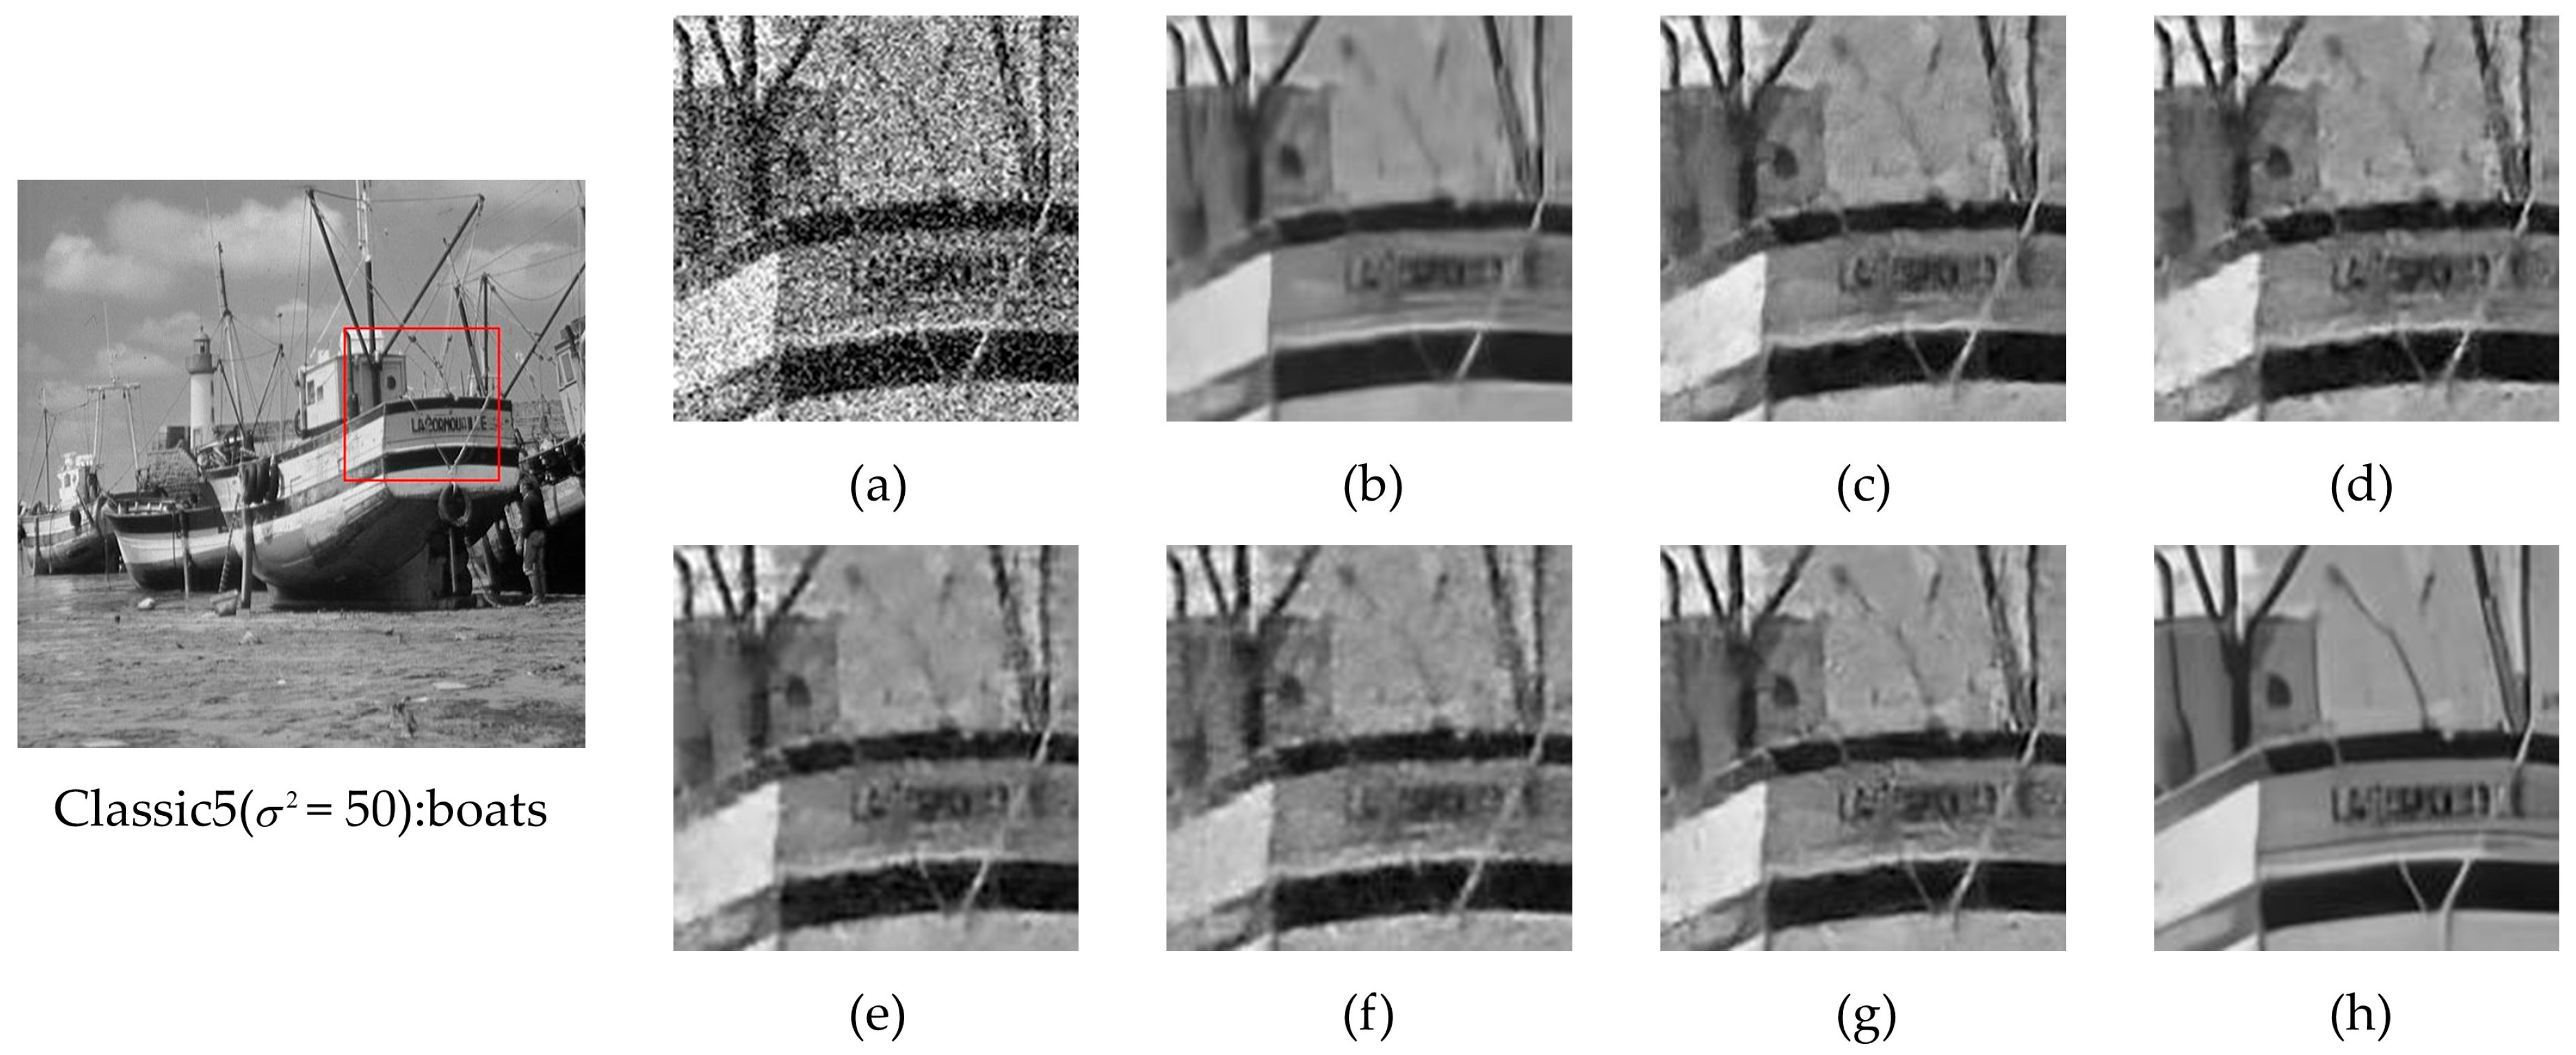
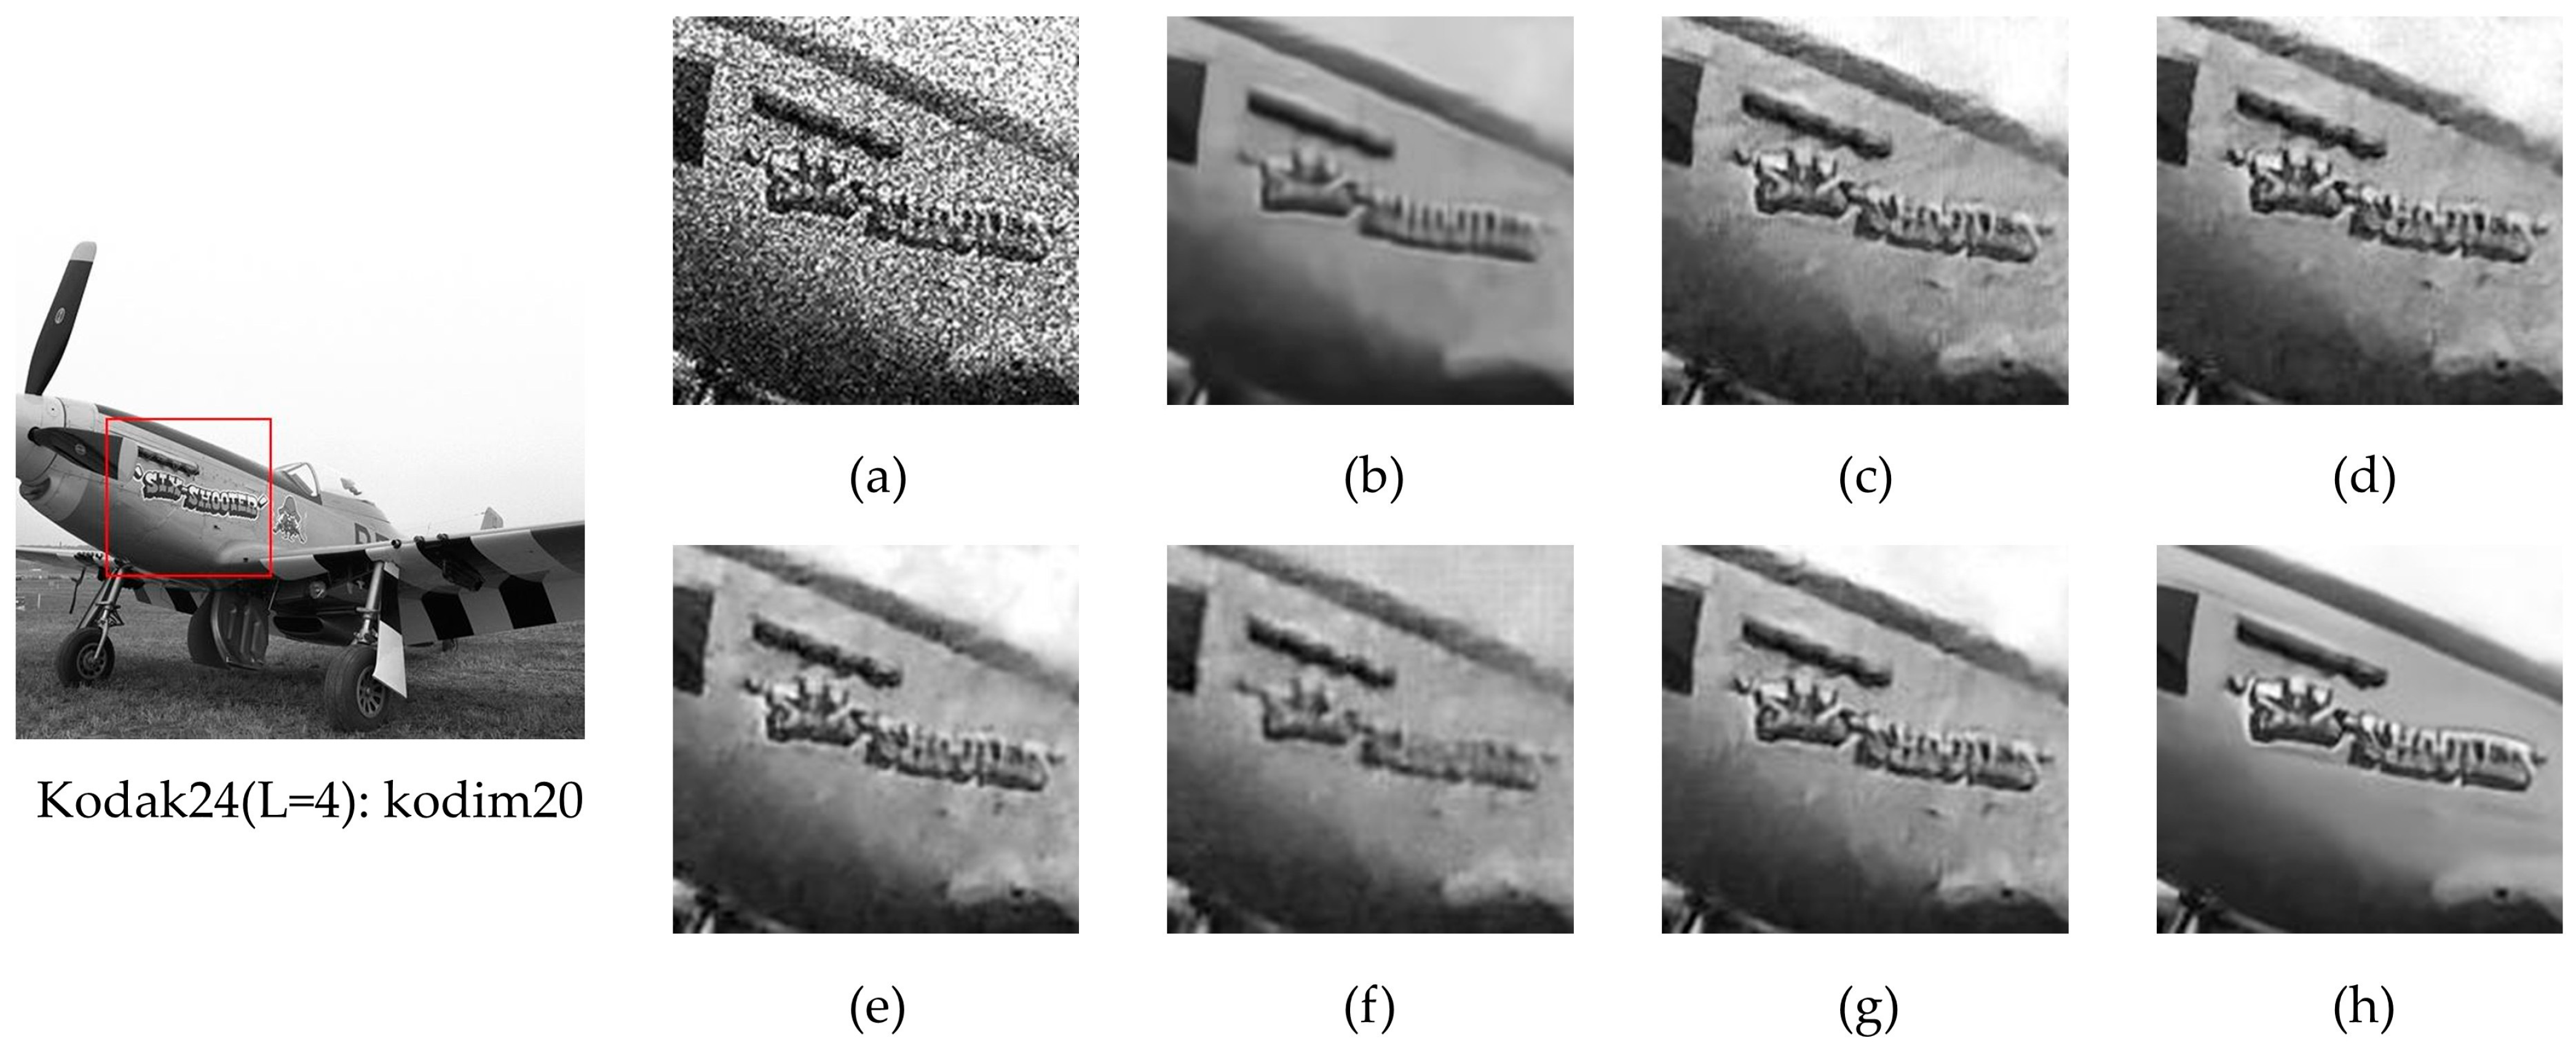
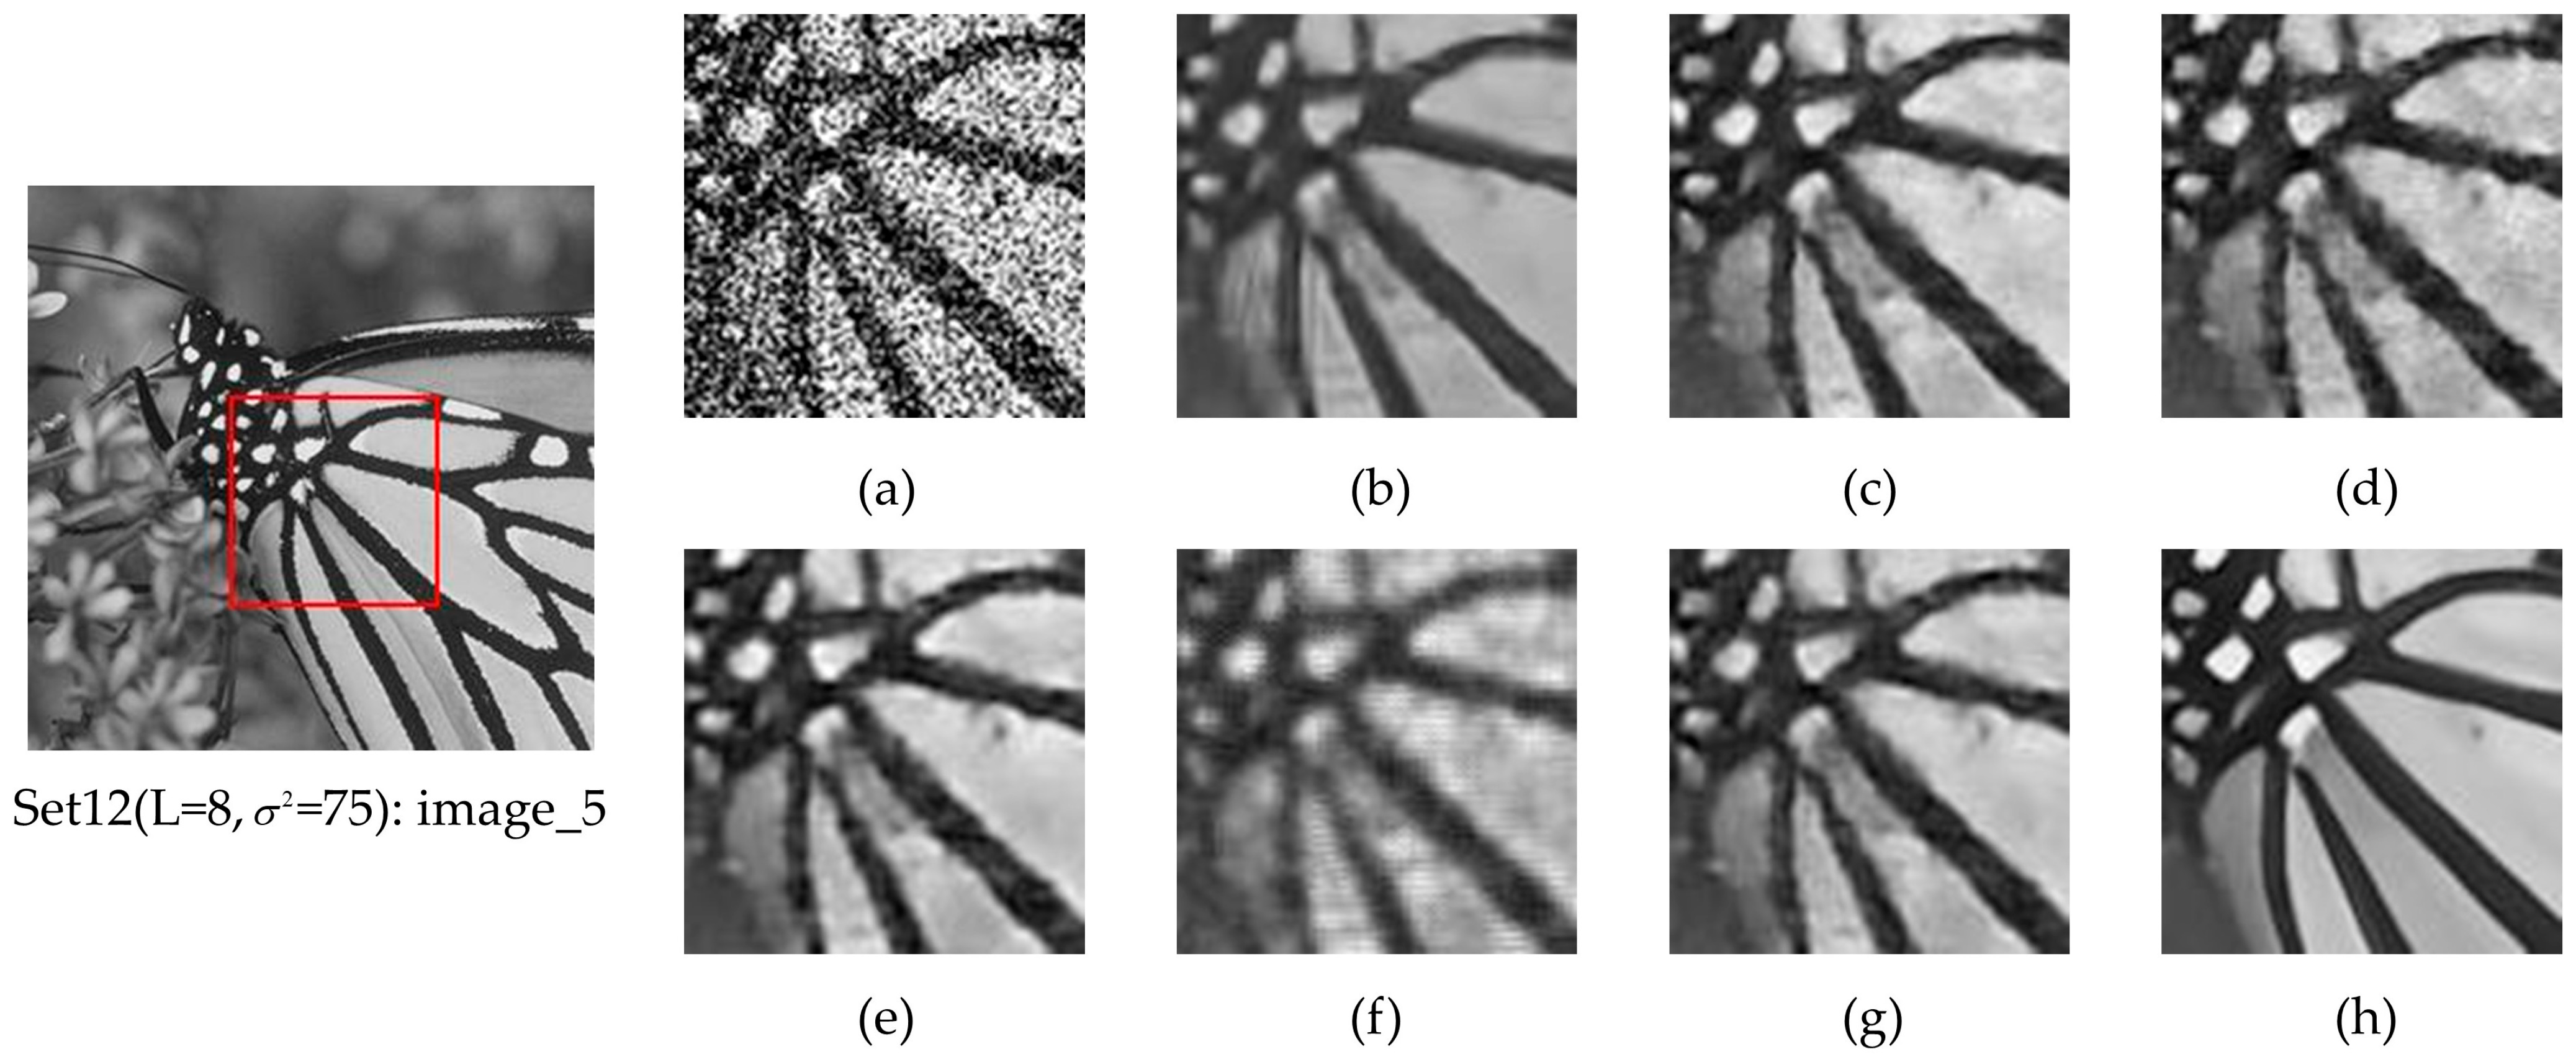
Figure 7, Figure 8, Figure 9 and Figure 10 provide visual comparisons of four representative test images processed under four noise scenarios: additive noise ( σ = 50 ), multiplicative noise ( L = 4 ), hybrid noise ( σ = 50 + L = 4 ), and another hybrid noise ( σ = 75 + L = 8 ). Critical regions in all categories are enlarged to enable detailed visual inspection. In additive noise suppression, all seven methods exhibit distinct noise reduction effects. While BM3D demonstrates robust denoising capability, its excessive smoothing compromises structural clarity and degrades fine details. SAR-CNN and similar multiplicative-noise-optimized methods show suboptimal performance, leaving residual artifacts. In contrast, DAT-Net achieves effective additive noise suppression while maintaining structural integrity.
In multiplicative noise suppression, BM3D continues to exhibit problematic over-smoothing. While DnCNN partially preserves details better than BM3D, it retains substantial residual noise. SAR-CNN and SAR-DRN show performance comparable to DnCNN but introduce halo-type artifacts. SAR-Transformer attains satisfactory global denoising while compromising local detail preservation. SAR-CAM moderately retains textural details but inadequately resolves edge boundaries. In contrast, DAT-Net simultaneously achieves effective multiplicative noise suppression and maintains superior edge sharpness.
Under hybrid noise scenarios, deep learning methods significantly outperform BM3D, which induces excessive contrast reduction. While DnCNN, SAR-CNN, SAR-DRN, and SAR-CAM demonstrate comparable hybrid noise reduction, they exhibit insufficient denoising performance characterized by residual noise and clarity degradation. SAR-Transformer fails to effectively separate hybrid noise components, resulting in blurred outputs. In contrast, DAT-Net adaptively distinguishes between noise artifacts and structural features, achieving optimal performance through effective noise suppression while preserving textural details and enhancing image clarity.
Collectively, these experiments demonstrate distinct generalization capabilities across different noise scenarios. Deep learning methods consistently outperform traditional techniques in complex noise environments. Although DnCNN, SAR-CNN, SAR-DRN, SAR-Transformer, and SAR-CAM achieve task-specific performance, their cross-noise generalizability remains constrained. The proposed methodology significantly exceeds all six benchmark methods in cross-scenario generalization, delivering superior edge preservation, clearer object delineation, and enhanced structural fidelity. This approach generates denoised results with the highest congruence to reference images.

4.4.2. Quantitative Analysis

Table 2, Table 3, Table 4, Table 5, Table 6 and Table 7 detail quantitative comparisons of multiple denoising algorithms across four benchmark datasets. These tables report PSNR and SSIM metrics for additive, multiplicative, and hybrid noise conditions at various noise intensities. The optimal and secondary results are indicated in bold and red font, respectively.
As demonstrated in Table 2 and Table 3 under additive noise conditions, DAT-Net achieves superior PSNR and SSIM values across all four datasets. At high noise intensity (σ = 100), DAT-Net attains PSNR values of 24.11 dB (Classic5), 24.56 dB (Kodak24), 24.88 dB (McMaster), and 23.77 dB (Set12), exceeding the second-best methods by 1.2–1.8 dB. The corresponding SSIM values, ranging from 0.6061 to 0.6761, significantly outperform conventional BM3D (0.5609–0.6087) and DnCNN (0.5060–0.5622), demonstrating robust performance against high-intensity additive noise.
Table 4 and Table 5 quantify DAT-Net’s superior performance under extreme multiplicative noise conditions ( L = 1 ), with PSNR values ranging from 23.72 dB to 25.11 dB across datasets. This represents a 1.34–2.15 dB improvement over SAR-DRN. Concurrently observed SSIM values (0.5909–0.7170) show an 8.0–16.5% enhancement compared to benchmark methods. Even at lower noise levels ( L = 16 ), DAT-Net maintains leading PSNR performance (29.29–31.33 dB) while achieving SSIM values above 0.80 (0.8882 on McMaster), confirming consistent efficacy across varying noise intensities.
As demonstrated in Table 6 and Table 7 under hybrid noise conditions, DAT-Net demonstrates further performance advantages. In the challenging scenario combining additive ( σ = 25 ) and multiplicative noise ( L = 1 ), it achieves PSNR values ranging from 22.77 dB to 24.79 dB and SSIM values between 0.5840 and 0.7010. This performance exceeds all benchmarks, particularly surpassing SAR-DRN by 1.99 dB on the McMaster dataset. While SAR-Transformer exhibits significant performance variations—for instance, PSNR declines to 19.71 dB on Set12—DAT-Net maintains stable superiority across all noise levels, quantitatively confirming exceptional generalization capability.
Collectively, DAT-Net consistently achieves optimal quantitative metrics across all three noise types, four datasets, and the entire noise-intensity spectrum. Its performance advantages are most significant under high-intensity and hybrid noise conditions, with mean PSNR gains of 1.2–3.5 dB and SSIM improvements of 0.05–0.15. This superiority originates from three key innovations: (1) dynamic gating attention mechanisms that accurately model noise spatial heterogeneity, (2) frequency-spatial co-optimization that minimizes structural information loss, and (3) multi-scale feature enhancement enabling adaptive multi-source noise suppression within a unified architecture. Such key innovations significantly enhance model robustness in extreme noise environments, establishing a novel technical framework for SAR image denoising.

4.5. Performance Comparisons on Real SAR Images

4.5.1. Qualitative Analysis

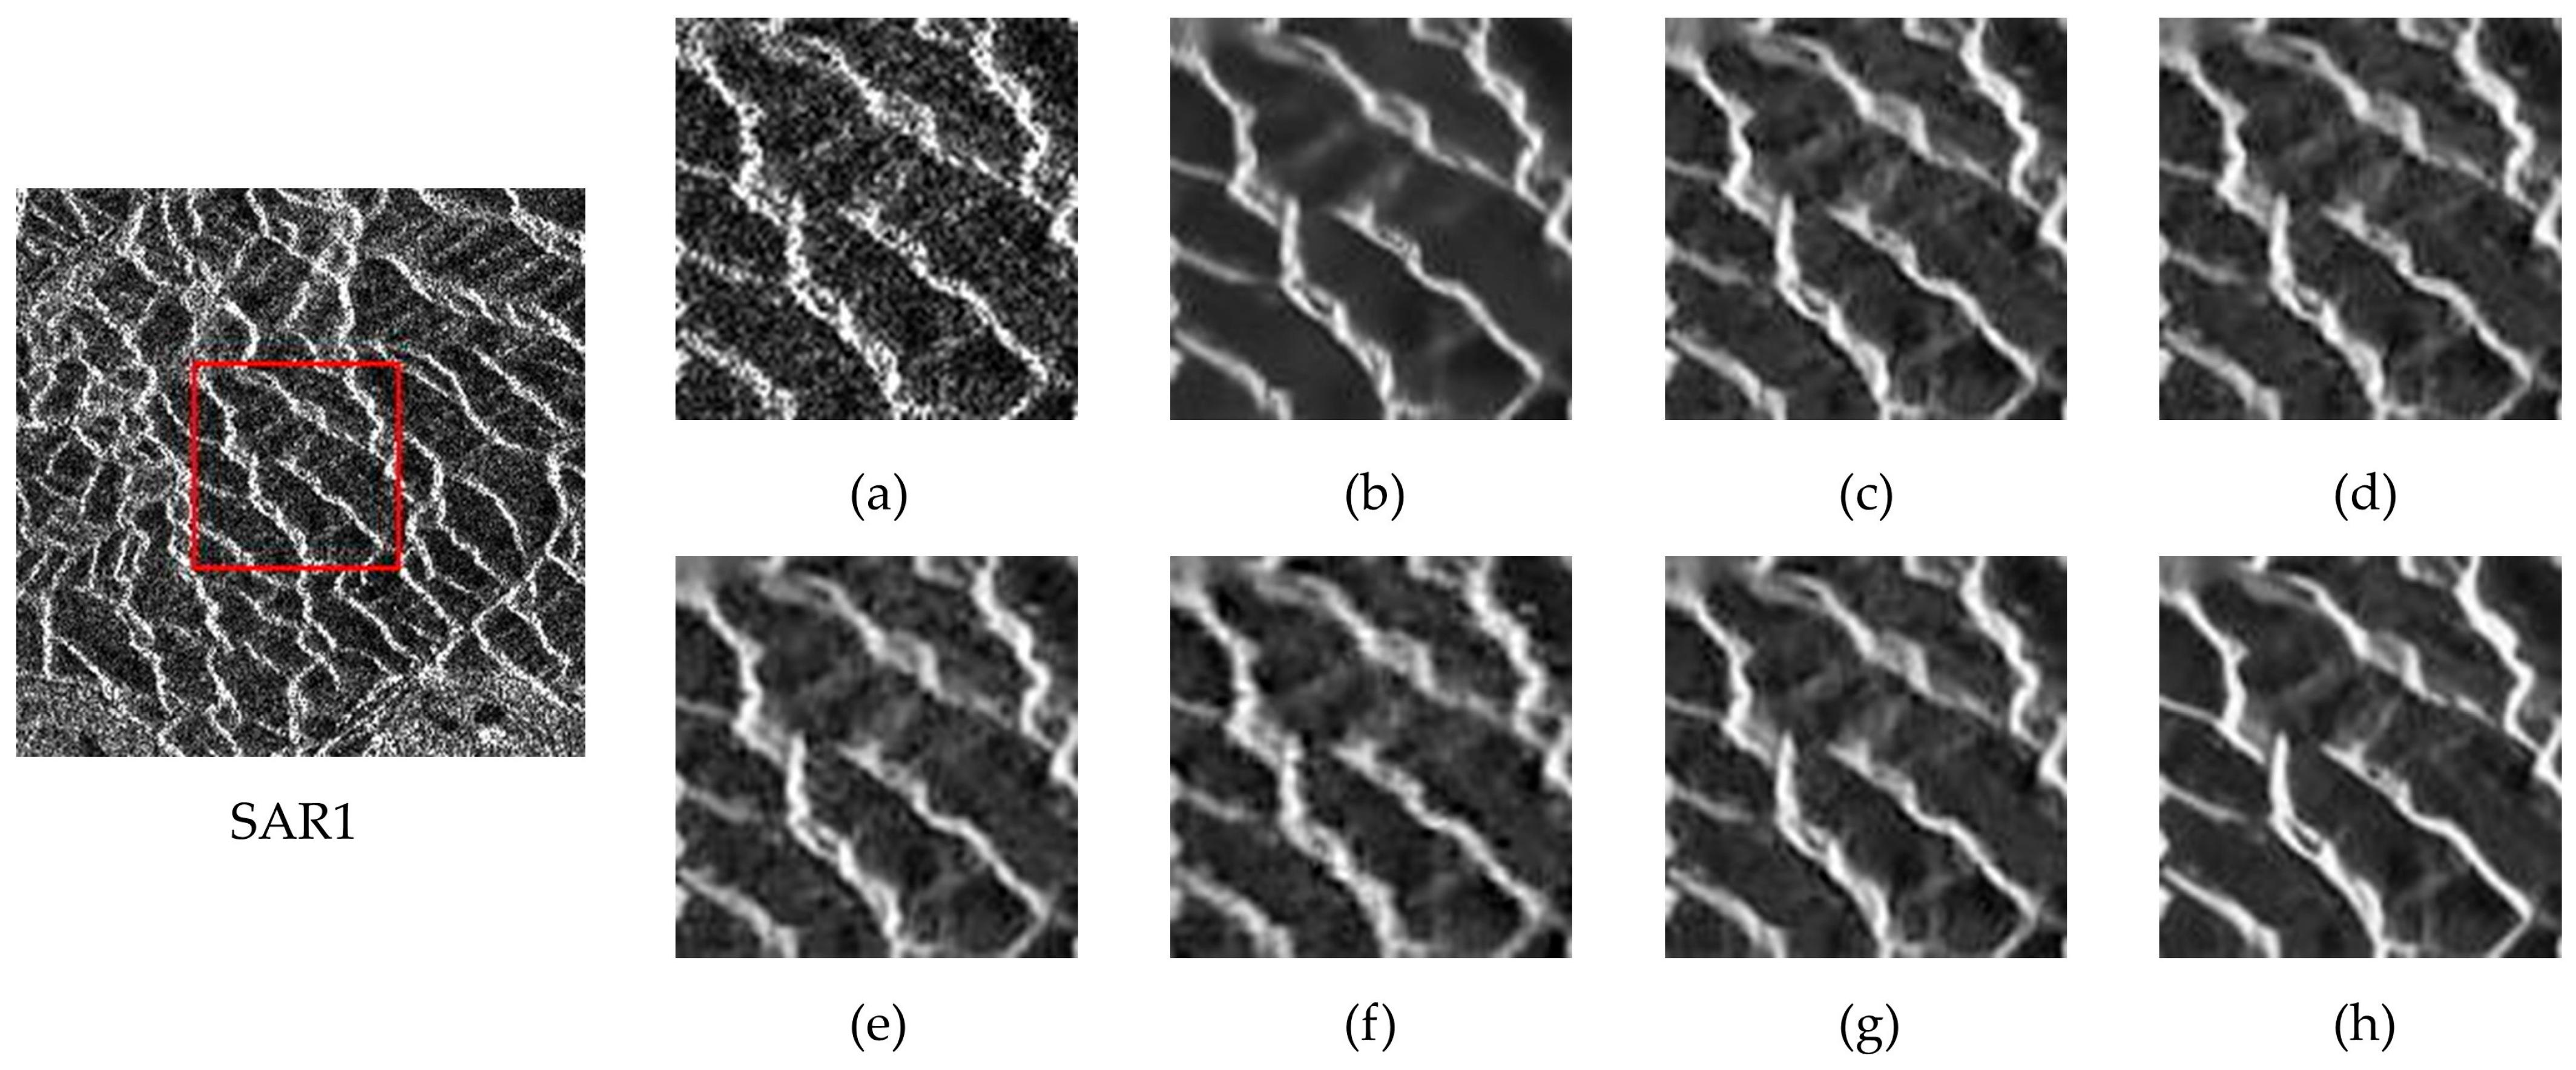
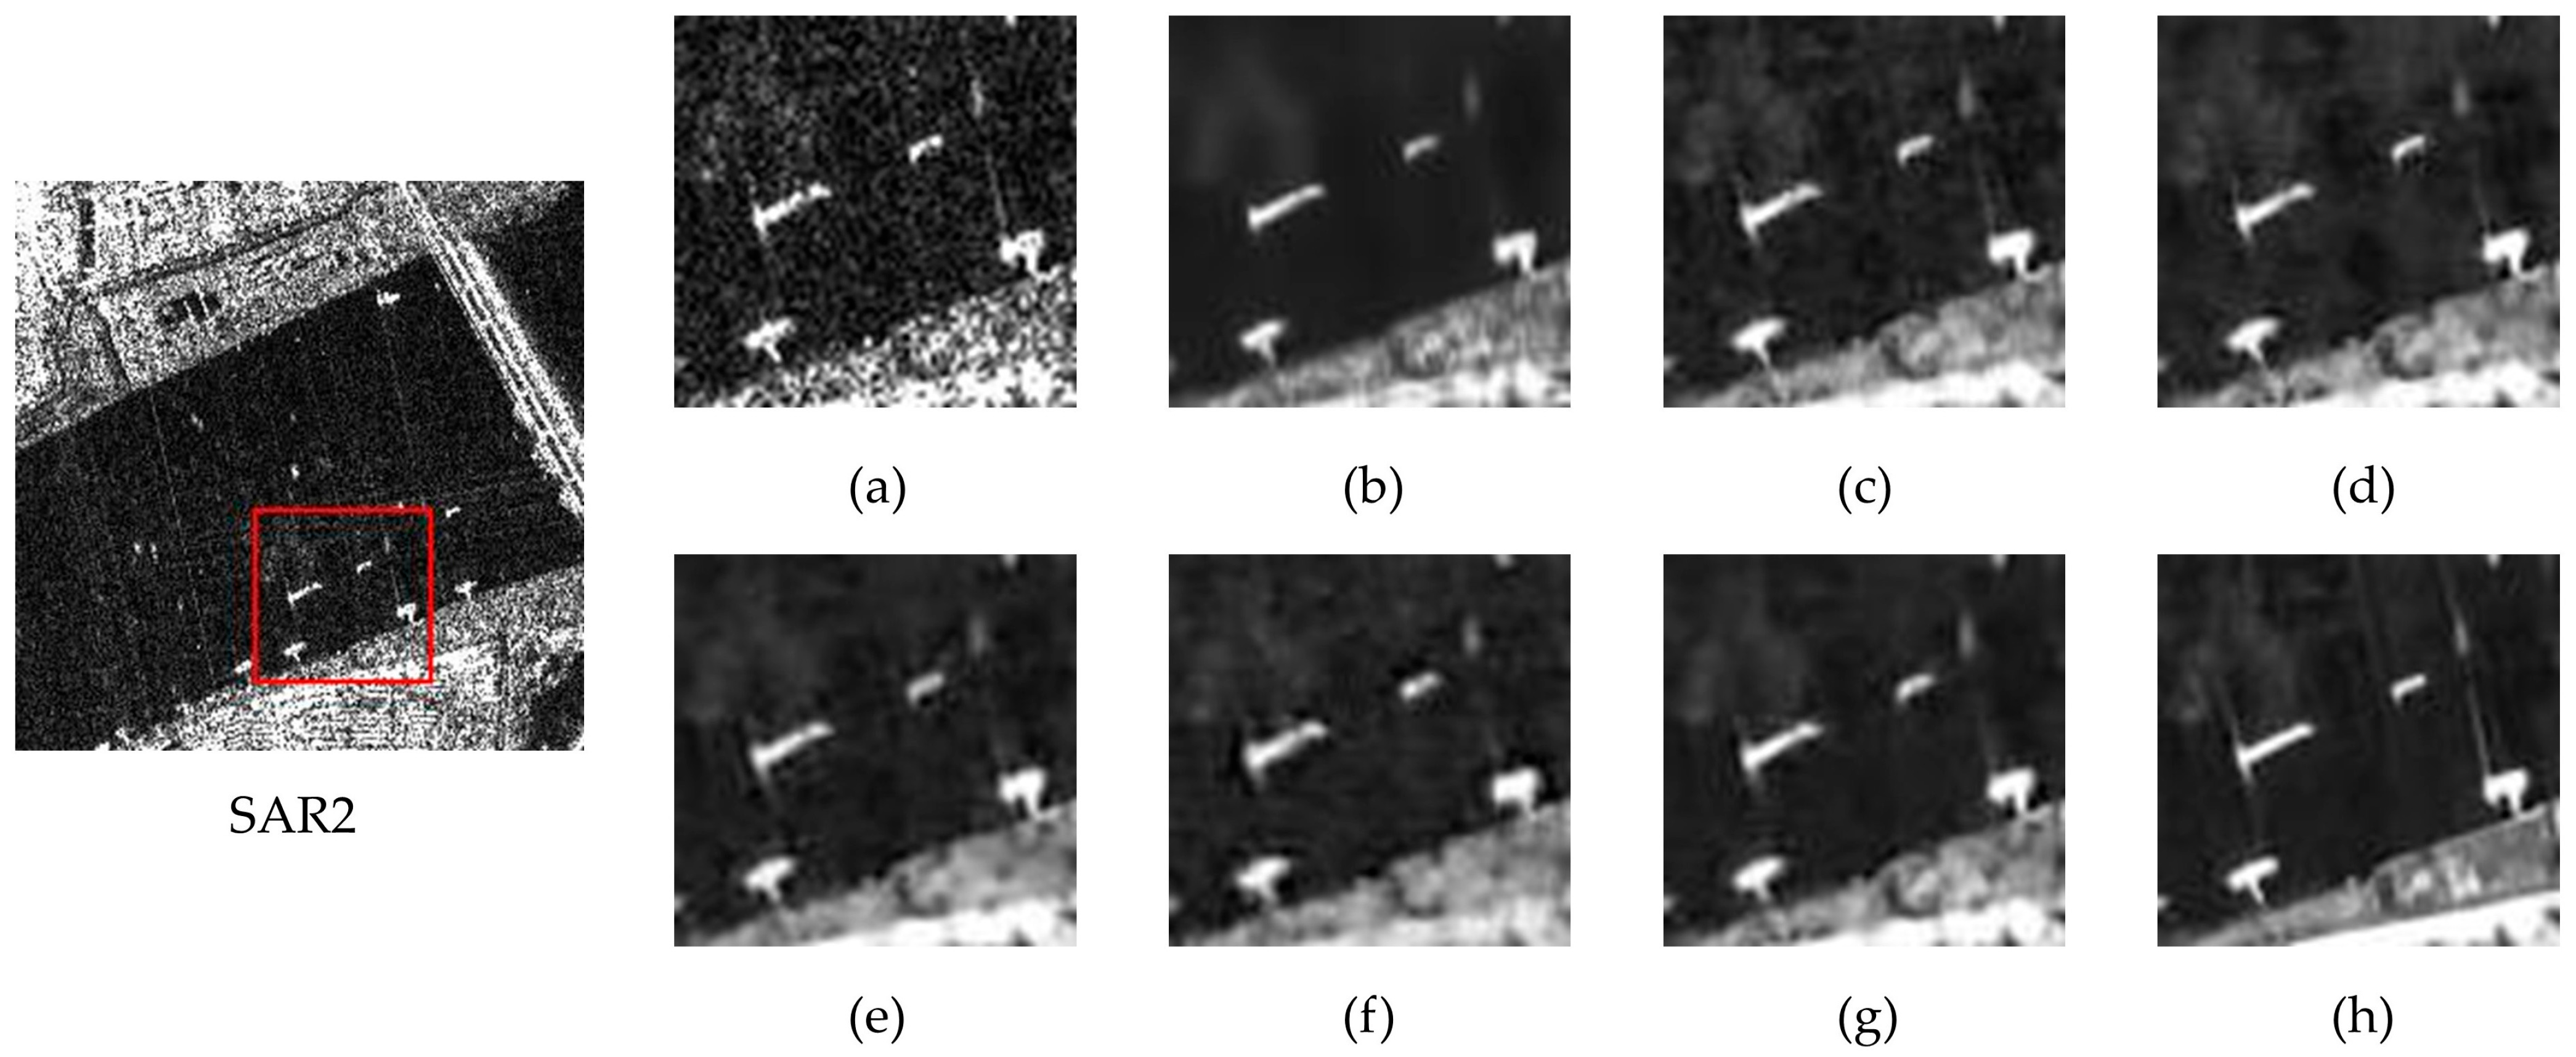
To further assess the practical efficacy of the denoising algorithm, seven methods were evaluated using six real SAR images, with the denoising results presented in Figure 11, Figure 12, Figure 13, Figure 14, Figure 15 and Figure 16. Key regions within each image are delineated by red boundaries and magnified to facilitate detailed comparative analysis. Figure 11, Figure 12 and Figure 13 depict natural landscapes with relatively low background noise, including scenes of mountains, harbors, and farmlands. In contrast, Figure 14, Figure 15 and Figure 16 showcase urban landscapes with stronger noise, featuring various building complexes and road networks.
As shown in Figure 11, while BM3D partially suppresses genuine SAR noise, its output exhibits excessive smoothing that degrades essential textural details. DnCNN, SAR-CNN, and SAR-Transformer demonstrate limited performance—preserving some structural clarity but leaving significant residual noise that compromises edge sharpness. SAR-DRN and SAR-CAM show improved noise reduction and edge preservation yet introduce artificial shadow-like artifacts.
Close inspection of the magnified regions confirms the superior performance of DAT-Net on SAR1. It effectively suppresses speckle noise while preserving critical edge features, such as mountain terrain morphology, without generating extraneous artifacts.
Figure 12 and Figure 13 reveal consistent performance patterns across the remaining SAR images. Specifically, the recovered edges of the ship in Figure 12 and the preserved farmland boundaries in Figure 13 attest to DAT-Net’s exceptional capability in balancing noise suppression with structural detail retention, outperforming all comparative methods.
Figure 11, Figure 12 and Figure 13 demonstrate DAT-Net’s exceptional capability in denoising and preserving details within natural scenes. DAT-Net also exhibits outstanding performance in the complex urban scenes presented in Figure 14, Figure 15 and Figure 16.
As shown in Figure 14, while the BM3D algorithm excessively smooths the image, resulting in significant detail loss, CNN-based algorithms such as DnCNN, SAR-CNN, SAR-DRN, and SAR-CAM show insufficient denoising effectiveness. SAR-Transformer introduces artifacts that cause image blurring. In contrast, DAT-Net demonstrates superior denoising capability and detail reconstruction, rendering the edges of urban structures clearly visible compared to the original image.
Figure 15 features higher noise intensity. In this scenario, DAT-Net more clearly restores road edges and building outlines than other algorithms, yielding a cleaner visual appearance. Outputs from comparative methods consistently exhibit residual noise or other artifacts.
The large-scale building clusters in Figure 16 present a significant challenge to the detail preservation capacity of denoising algorithms. DAT-Net again demonstrates remarkable performance here, with well-defined boundaries between structures. Conversely, images restored by other algorithms exhibit blurred boundaries between buildings.
In summary, the visual evidence confirms that DAT-Net possesses three key advantages: comprehensive noise suppression, preservation of high-frequency edge details with enhanced structural fidelity in the denoised output, and effective mitigation of blocking artifacts and spurious features. This integrated capability validates the practical utility of DAT-Net for real-world SAR denoising applications.

4.5.2. Quantitative Analysis

The denoising efficacy on real SAR imagery was rigorously assessed using Entropy and Average Gradient (AG) metrics, and the results are shown in Table 8. Comparative analysis across the six real SAR images reveals significant performance variations among the seven benchmarked algorithms. DAT-Net consistently achieves the optimal noise–detail tradeoff, demonstrating moderate entropy reduction (mean: 6.725, variance: 0.45) while simultaneously attaining the highest AG values (mean: 118.68, variance: 28.37), indicative of its superior balance and stability.
Key observations emerge across the diverse scenarios. DAT-Net consistently secures the highest AG values in four out of six scenarios (SAR1, SAR2, SAR4, and SAR5), with particularly notable margins in SAR1 (155.75, exceeding the second-best by 2.8%) and SAR2 (101.19, outperforming the next highest by 6.6%). While BM3D achieves the lowest entropy in five scenarios, signifying strong noise removal, it consistently delivers the worst or near-worst AG performance, confirming severe detail loss due to excessive smoothing, evidenced by examples like last-place AG in SAR1 (125.78), SAR3 (69.97, falling 29.12 units below optimal), SAR4 (84.29), and SAR6 (76.65). DAT-Net demonstrates remarkable overall balance, leading in AG while maintaining moderate entropy. This balance is clear even where it does not rank first for individual metrics: in SAR3, DAT-Net ranks second in both AG (99.09) and Entropy (6.1563), but contextual analysis shows the AG leader DnCNN (101.28) has significantly higher entropy (6.4752), indicating noise retention, while the entropy leader BM3D (5.9628) has the minimum AG (69.97). In SAR6, DAT-Net achieves the lowest entropy (6.9711) and highest AG (88.40), again showcasing its effective trade-off.
Further analysis of the other methods highlights specific limitations. DnCNN shows contradictory behavior, exemplified in SAR3 (AG: 101.28, Entropy: 6.4752) and SAR5 (AG: 123.6, Entropy: 7.4117), suggesting concurrent retention of both noise and image details. SAR-Transformer exhibits inadequate denoising capability, particularly in SAR1 (highest entropy: 7.4886, suboptimal second-worst AG: 147.46) and SAR4 (high entropy: 7.0952, low AG: 89.64). SAR-DRN and SAR-CAM display significant performance volatility; SAR-DRN ranges from third-best AG in SAR1 (150.32) to second-worst in SAR2 (84.29) and performs poorly in SAR4 (105.41) and SAR5 (111.32), while SAR-CAM performs well in SAR1 (Entropy: 7.3649, AG: 151.47) but underperforms significantly in SAR2 (AG: 89.85, 9.3% below scenario mean) and SAR4 (AG: 112.65). SAR-CNN shows substantial denoising deficiencies, yielding the highest entropy in SAR2 (7.1687) and consistently high entropy elsewhere (e.g., SAR1: 7.3114, SAR4: 7.1415, and SAR5: 7.3737), coupled with mediocre AG values.
This comprehensive analysis across six real SAR images confirms that an ideal denoising algorithm must simultaneously minimize entropy (suppress noise) and maximize AG (preserve details). DAT-Net uniquely maintains this critical balance across all scenarios, as evidenced by its consistently high AG and moderate-to-low entropy. Its stable performance, reflected in low variance for both metrics, validates exceptional robustness. Such consistent superiority establishes DAT-Net as a technically reliable and high-performing solution for practical engineering applications in SAR image processing.

5. Discussion

The experimental results demonstrate that the proposed DAT-Net significantly outperforms existing denoising methods across both simulated and real SAR images under various noise conditions. The superior performance can be attributed to the synergistic integration of the Dynamic Gated Attention Module (DGAM), Frequency-domain Multi-Expert Enhancement (FMEE) module, and Multi-scale Convolution Block (MCB), which collectively address the inherent limitations of current methods. Specifically, DGAM enables adaptive feature interaction by dynamically gating attention based on local noise intensity and structural complexity, thereby effectively suppressing high-noise regions while preserving fine details. The FMEE module leverages frequency-domain decomposition to separately enhance high-frequency and low-frequency components, exploiting the distinct spectral characteristics of noise and structural information in SAR imagery. This dual-domain approach mitigates the common issue of frequency leakage encountered in wavelet-based methods. Furthermore, the MCB enhances multi-scale feature fusion through efficient depthwise separable convolutions and channel shuffling, facilitating better cross-scale context aggregation without significant computational overhead.
Despite these advancements, DAT-Net exhibits higher computational complexity compared to lightweight CNN-based methods, as evidenced by its greater number of parameters and FLOPs. However, this trade-off is justified by its markedly improved denoising performance and detail preservation, which are critical in applications such as military reconnaissance and terrain monitoring where image quality takes precedence over processing speed. Moreover, DAT-Net remains considerably faster than traditional non-deep learning methods like BM3D, making it suitable for practical deployment. Future work may explore model compression techniques or knowledge distillation to reduce computational cost while maintaining performance. Additionally, extending DAT-Net to handle multi-temporal or multi-polarimetric SAR data could further enhance its applicability in complex remote sensing scenarios.

6. Conclusions

This study addresses the critical challenge of multi-source noise interference in SAR imagery by introducing DAT-Net, a dynamic adaptive Transformer network for robust denoising. The proposed architecture integrates a dynamic gated attention mechanism with a frequency-domain multi-expert network to achieve unified suppression of speckle, additive, and hybrid noise patterns. Crucially, DAT-Net overcomes limitations inherent in conventional approaches dependent on a priori noise models and localized filtering. It resolves the fundamental trade-off between noise suppression and edge preservation through a multi-scale encoder–decoder structure that simultaneously enhances local details and models global semantics.
Experimental validation demonstrates DAT-Net’s superior performance on both simulated and real-world datasets. The method consistently outperforms benchmark algorithms in quantitative metrics and visual quality assessments, with particularly enhanced robustness under high-intensity hybrid noise conditions. This work establishes a novel methodological framework for SAR image enhancement in complex electromagnetic environments and provides a transferable paradigm for noise modeling and feature fusion in multimodal remote sensing data processing.

Author Contributions

Conceptualization, Y.S. and Y.C.; methodology, Y.S. and L.M.; writing—original draft preparation, Y.S.; writing—review and editing, X.Z. and Y.C.; project administration, Y.W. and Y.C. All authors have read and agreed to the published version of the manuscript.

Funding

This research was funded by key projects of the National Defense Basic Research Program of China Fund under Grant No. LJ20212C031157.

Data Availability Statement

The Dataset is available on request from the authors.

Acknowledgments

The authors would like to thank the anonymous reviewers for their valuable comments and suggestions, which led to substantial improvements to this paper.

Conflicts of Interest

The authors declare no conflicts of interest.

References

  1. Amitrano, D.; Di Martino, G.; Di Simone, A.; Imperatore, P. Flood Detection with SAR: A Review of Techniques and Datasets. Remote Sens. 2024, 16, 656. [Google Scholar] [CrossRef]
  2. Yasir, M.; Jianhua, W.; Mingming, X.; Hui, S.; Zhe, Z.; Shanwei, L.; Colak, A.T.; Hossain, M.S. Ship detection based on deep learning using SAR imagery: A systematic literature review. Soft Comput. 2023, 27, 63–84. [Google Scholar] [CrossRef]
  3. Zhou, J.; Xiao, C.; Peng, B.; Liu, Z.; Liu, L.; Liu, Y.; Li, X. DiffDet4SAR: Diffusion-Based Aircraft Target Detection Network for SAR Images. IEEE Geosci. Remote Sens. Lett. 2024, 21, 4007905. [Google Scholar] [CrossRef]
  4. Wang, X.; Feng, G.; He, L.; An, Q.; Xiong, Z.; Lu, H.; Wang, W.; Li, N.; Zhao, Y.; Wang, Y.; et al. Evaluating Urban Building Damage of 2023 Kahramanmaras, Turkey Earthquake Sequence Using SAR Change Detection. Sensors 2023, 23, 6342. [Google Scholar] [CrossRef]
  5. Wessels, K.; Li, X.; Bouvet, A.; Mathieu, R.; Main, R.; Naidoo, L.; Erasmus, B.; Asner, G.P. Quantifying the sensitivity of L-Band SAR to a decade of vegetation structure changes in savannas. Remote Sens. Environ. 2023, 284, 113369. [Google Scholar] [CrossRef]
  6. Kim, M.; Park, S.-E.; Lee, S.-J. Detection of Damaged Buildings Using Temporal SAR Data with Different Observation Modes. Remote Sens. 2023, 15, 308. [Google Scholar] [CrossRef]
  7. Singh, P.; Shree, R. Analysis and effects of speckle noise in SAR images. In Proceedings of the 2016 2nd International Conference on Advances in Computing, Communication, & Automation (ICACCA), Bareilly, India, 30 September–1 October 2016; pp. 1–5. [Google Scholar] [CrossRef]
  8. Zhang, C.; Zhang, Z.; Deng, Y.; Zhang, Y.; Chong, M.; Tan, Y.; Liu, P. Blind Super-Resolution for SAR Images with Speckle Noise Based on Deep Learning Probabilistic Degradation Model and SAR Priors. Remote Sens. 2023, 15, 330. [Google Scholar] [CrossRef]
  9. Parhad, S.V.; Warhade, K.K.; Shitole, S.S. Speckle noise reduction in SAR images using improved filtering and supervised classification. Multimed. Tools Appl. 2024, 83, 54615–54636. [Google Scholar] [CrossRef]
  10. Wang, X.; Wu, Y.; Shi, C.; Yuan, Y.; Zhang, X. ANED-Net: Adaptive Noise Estimation and Despeckling Network for SAR Image. IEEE J. Sel. Top. Appl. Earth Obs. Remote Sens. 2024, 17, 4036–4051. [Google Scholar] [CrossRef]
  11. Mao, Y.; Huang, Y.; Yu, X.; Wang, Y.; Tao, M.; Zhang, Z.; Yang, Y.; Hong, W. Radio Frequency Interference Mitigation in SAR Systems via Multi-Polarization Framework. IEEE Trans. Geosci. Remote Sens. 2024, 62, 5210216. [Google Scholar] [CrossRef]
  12. Zhao, J.; Wang, Y.; Liao, G.; Liu, X.; Li, K.; Yu, C.; Zhai, Y.; Xing, H.; Zhang, X. Intelligent Detection and Segmentation of Space-Borne SAR Radio Frequency Interference. Remote Sens. 2023, 15, 5462. [Google Scholar] [CrossRef]
  13. Yang, H.; Lang, P.; Lu, X.; Chen, S.; Xi, F.; Liu, Z.; Yang, J. Robust Block Subspace Filtering for Efficient Removal of Radio Interference in Synthetic Aperture Radar Images. IEEE Trans. Geosci. Remote Sens. 2024, 62, 5206812. [Google Scholar] [CrossRef]
  14. Fang, L.; Zhang, J.; Ran, Y.; Chen, K.; Maidan, A.; Huan, L.; Liao, H. Blind Signal Separation with Deep Residual Networks for Robust Synthetic Aperture Radar Signal Processing in Interference Electromagnetic Environments. Electronics 2025, 14, 1950. [Google Scholar] [CrossRef]
  15. Singh, P.; Diwakar, M.; Shankar, A.; Shree, R.; Kumar, M. A Review on SAR Image and its Despeckling. Arch. Comput. Methods Eng. 2021, 28, 4633–4653. [Google Scholar] [CrossRef]
  16. Singh, P.; Shankar, A.; Diwakar, M. Review on nontraditional perspectives of synthetic aperture radar image despeckling. J. Electron. Imaging 2022, 32, 021609. [Google Scholar] [CrossRef]
  17. Lee, G. Refined filtering of image noise using local statistics. Comput. Graph. Image Process. 1981, 15, 380–389. [Google Scholar] [CrossRef]
  18. Kuan, D.T.; Sawchuk, A.A.; Strand, T.C.; Chavel, P. Adaptive noise smoothing filter for images with signal-dependent noise. IEEE Trans. Pattern Anal. Mach. Intell. 1985, 7, 165–177. [Google Scholar] [CrossRef]
  19. Frost, V.S.; Stiles, J.A.; Shanmugam, K.S.; Holtzman, J.C.; Smith, S.A. An adaptive filter for smoothing noisy radar images. Proc. IEEE 1981, 69, 133–135. [Google Scholar] [CrossRef]
  20. Vijay, M.; Devi, L.S.; Shankaravadivu, M.; Santhanamari, M. Image denoising based on adaptive spatial and Wavelet Thresholding methods. In Proceedings of the IEEE-International Conference on Advances in Engineering, Science and Management (ICAESM-2012), Nagapattinam, India, 30–31 March 2012; pp. 161–166. [Google Scholar]
  21. Deledalle, C.-A.; Denis, L.; Tupin, F. Iterative Weighted Maximum Likelihood Denoising with Probabilistic Patch-Based Weights. IEEE Trans. Image Process. 2009, 18, 2661–2672. [Google Scholar] [CrossRef] [PubMed]
  22. Dabov, K.; Foi, A.; Katkovnik, V.; Egiazarian, K. Image Denoising by Sparse 3-D Transform-Domain Collaborative Filtering. IEEE Trans. Image Process. 2007, 16, 2080–2095. [Google Scholar] [CrossRef]
  23. Painam, R.K.; Manikandan, S. A comprehensive review of SAR image filtering techniques: Systematic survey and future directions. Arab. J. Geosci. 2021, 14, 37. [Google Scholar] [CrossRef]
  24. Jebur, R.S.; Zabil, M.H.B.M.; Hammood, D.A.; Cheng, L.K. A comprehensive review of image denoising in deep learning. Multimed. Tools Appl. 2024, 83, 58181–58199. [Google Scholar] [CrossRef]
  25. Chierchia, G.; Cozzolino, D.; Poggi, G.; Verdoliva, L. SAR image despeckling through convolutional neural networks. In Proceedings of the 2017 IEEE International Geoscience and Remote Sensing Symposium (IGARSS), Fort Worth, TX, USA, 23–28 July 2017; pp. 5438–5441. [Google Scholar] [CrossRef]
  26. Wang, P.; Zhang, H.; Patel, V.M. SAR Image Despeckling Using a Convolutional Neural Network. IEEE Signal Process. Lett. 2017, 24, 1763–1767. [Google Scholar] [CrossRef]
  27. Zhang, Q.; Yuan, Q.; Li, J.; Yang, Z.; Ma, X. Learning a Dilated Residual Network for SAR Image Despeckling. Remote Sens. 2018, 10, 196. [Google Scholar] [CrossRef]
  28. Li, J.; Li, Y.; Xiao, Y.; Bai, Y. HDRANet: Hybrid Dilated Residual Attention Network for SAR Image Despeckling. Remote Sens. 2019, 11, 2921. [Google Scholar] [CrossRef]
  29. Ko, J.; Lee, S. SAR Image Despeckling Using Continuous Attention Module. IEEE J. Sel. Top. Appl. Earth Obs. Remote Sens. 2022, 15, 3–19. [Google Scholar] [CrossRef]
  30. Lattari, F.; Gonzalez Leon, B.; Asaro, F.; Rucci, A.; Prati, C.; Matteucci, M. Deep Learning for SAR Image Despeckling. Remote Sens. 2019, 11, 1532. [Google Scholar] [CrossRef]
  31. Lin, C.; Qiu, C.; Jiang, H.; Zou, L. A Deep Neural Network Based on Prior-Driven and Structural Preserving for SAR Image Despeckling. IEEE J. Sel. Top. Appl. Earth Obs. Remote Sens. 2023, 16, 6372–6392. [Google Scholar] [CrossRef]
  32. Panati, C.; Wagner, S. Investigating SAR Data Denoising: A Comparative Analysis of CNN Models with Multi-Channel Signal Processing Features. In Proceedings of the 2024 International Radar Conference (RADAR), Rennes, France, 21–25 October 2024; pp. 1–6. [Google Scholar] [CrossRef]
  33. Aleissaee, A.A.; Kumar, A.; Anwer, R.M.; Khan, S.; Cholakkal, H.; Xia, G.-S.; Khan, F.S. Transformers in Remote Sensing: A Survey. Remote Sens. 2023, 15, 1860. [Google Scholar] [CrossRef]
  34. Sivapriya, M.S.; Suresh, S. ViT-DexiNet: A Vision Transformer-Based Edge Detection Operator for Small Object Detection in SAR Images. Int. J. Remote Sens. 2023, 44, 7057–7084. [Google Scholar] [CrossRef]
  35. Perera, M.V.; Bandara, W.G.C.; Valanarasu, J.M.J.; Patel, V.M. Transformer-Based SAR Image Despeckling. In Proceedings of the IGARSS 2022—2022 IEEE International Geoscience and Remote Sensing Symposium, Kuala Lumpur, Malaysia, 17–22 July 2022; pp. 751–754. [Google Scholar] [CrossRef]
  36. Yu, C.; Shin, Y. SAR Image Despeckling Based on U-Shaped Transformer from a Single Noisy Image. In Proceedings of the 2022 13th International Conference on Information and Communication Technology Convergence (ICTC), Jeju Island, Republic of Korea, 19–21 October 2022; pp. 1738–1740. [Google Scholar] [CrossRef]
  37. Xiao, S.; Zhang, S.; Huang, L.; Wang, W.Q. Trans-NLM Network for SAR Image Despeckling. IEEE Trans. Geosci. Remote Sens. 2024, 62, 5211912. [Google Scholar] [CrossRef]
  38. Wang, C.; Zheng, R.; Zhu, J.; Xu, W.; Li, X. A Practical SAR Despeckling Method Combining Swin Transformer and Residual CNN. IEEE Geosci. Remote Sens. Lett. 2023, 21, 4001205. [Google Scholar] [CrossRef]
  39. Liu, Y.; Ji, Y.; Xiao, J.; Guo, Y.; Jiang, P.; Yang, H.; Wang, F. Spectral Aggregation Cross-Square Transformer for Hyperspectral Image Denoising. In Proceedings of the International Conference on Pattern Recognition, Kolkata, India, 1–5 December 2024; pp. 458–474. [Google Scholar] [CrossRef]
  40. Imad, H.; Sara, Z.; Hajji, M.; Yassine, T.; Abdelkrim, N. Recent Advances in SAR Image Analysis Using Deep Learning Approaches: Examples of Speckle Denoising and Change Detection. In Proceedings of the 2024 4th International Conference on Innovative Research in Applied Science, Engineering and Technology (IRASET), Fez, Morocco, 16–17 May 2024; pp. 1–6. [Google Scholar] [CrossRef]
  41. Wang, Y.; Luo, S.; Ma, L.; Huang, M. RCA-GAN: An Improved Image Denoising Algorithm Based on Generative Adversarial Networks. Electronics 2023, 12, 4595. [Google Scholar] [CrossRef]
  42. Liu, W.; Zhou, L. Multilevel Denoising for High-Quality SAR Object Detection in Complex Scenes. IEEE Trans. Geosci. Remote Sens. 2024, 62, 5226813. [Google Scholar] [CrossRef]
  43. Yuan, Y.; Wu, Y.; Feng, P.; Fu, Y.; Wu, Y. Segmentation-Guided Semantic-Aware Self-Supervised Denoising for SAR Image. IEEE Trans. Geosci. Remote Sens. 2023, 61, 5218416. [Google Scholar] [CrossRef]
  44. Yang, C.; Gong, G.; Liu, C.; Deng, J.; Ye, Y. RMSO-ConvNeXt: A Lightweight CNN Network for Robust SAR and Optical Image Matching Under Strong Noise Interference. IEEE Trans. Geosci. Remote Sens. 2025, 63, 5208013. [Google Scholar] [CrossRef]
  45. Zha, C.; Min, W.; Han, Q.; Li, W.; Xiong, X.; Wang, Q.; Zhu, M. SAR ship localization method with denoising and feature refinement. Eng. Appl. Artif. Intell. 2023, 123, 106444. [Google Scholar] [CrossRef]
  46. Zhang, K.; Zuo, W.; Chen, Y.; Meng, D.; Zhang, L. Beyond a Gaussian Denoiser: Residual Learning of Deep CNN for Image Denoising. IEEE Trans. Image Process. 2017, 26, 3142–3155. [Google Scholar] [CrossRef]
  47. Gu, F.; Zhang, H.; Wang, C. A Two-Component Deep Learning Network for SAR Image Denoising. IEEE Access 2020, 8, 17792–17803. [Google Scholar] [CrossRef]
  48. Shan, H.; Fu, X.; Lv, Z.; Xu, X.; Wang, X.; Zhang, Y. Synthetic aperture radar images denoising based on multi-scale attention cascade convolutional neural network. Meas. Sci. Technol. 2023, 34, 085403. [Google Scholar] [CrossRef]
  49. Dalsasso, E.; Denis, L.; Tupin, F. SAR2SAR: A Semi-Supervised Despeckling Algorithm for SAR Images. IEEE J. Sel. Top. Appl. Earth Obs. Remote Sens. 2021, 14, 4321–4329. [Google Scholar] [CrossRef]
  50. Xiao, S.; Huang, L.; Zhang, S. Unsupervised SAR Despeckling Based on Diffusion Model. In Proceedings of the IGARSS 2023—2023 IEEE International Geoscience and Remote Sensing Symposium, Pasadena, CA, USA, 16–21 July 2023; pp. 810–813. [Google Scholar] [CrossRef]
  51. Li, J.; Lin, L.; He, M.; He, J.; Yuan, Q.; Shen, H. Sentinel-1 Dual-Polarization SAR Images Despeckling Network Based on Unsupervised Learning. IEEE Trans. Geosci. Remote Sens. 2024, 62, 5106315. [Google Scholar] [CrossRef]
  52. Vitale, S.; Ferraioli, G.; Frery, A.C.; Pascazio, V.; Yue, D.-X.; Xu, F. SAR Despeckling Using Multiobjective Neural Network Trained with Generic Statistical Samples. IEEE Trans. Geosci. Remote Sens. 2023, 61, 5216812. [Google Scholar] [CrossRef]
  53. Liu, S.; Tian, S.; Zhao, Y.; Hu, Q.; Li, B.; Zhang, Y.D. LG-DBNet: Local and Global Dual-Branch Network for SAR Image Denoising. IEEE Trans. Geosci. Remote Sens. 2024, 62, 5205515. [Google Scholar] [CrossRef]
  54. Yuan, J.; Zhou, F.; Guo, Z.; Li, X.; Yu, H. HCformer: Hybrid CNN-Transformer for LDCT Image Denoising. J. Digit. Imaging 2023, 36, 2290–2305. [Google Scholar] [CrossRef]
  55. Zamir, S.W.; Arora, A.; Khan, S.; Hayat, M.; Khan, F.S.; Yang, M.H. Restormer: Efficient Transformer for High-Resolution Image Restoration. In Proceedings of the IEEE/CVF Conference on Computer Vision and Pattern Recognition, New Orleans, LA, USA, 21–24 June 2022; pp. 5728–5739. [Google Scholar] [CrossRef]
  56. Du, Z.; Hu, Z.; Zhao, G.; Jin, Y.; Ma, H. Cross-Layer Feature Pyramid Transformer for Small Object Detection in Aerial Images. IEEE Trans. Geosci. Remote Sens. 2025, 63, 5625714. [Google Scholar] [CrossRef]
  57. Cheng, G.; Han, J.; Lu, X. Remote Sensing Image Scene Classification: Benchmark and State of the Art. Proc. IEEE 2017, 105, 1865–1883. [Google Scholar] [CrossRef]
  58. Foi, A.; Katkovnik, V.; Egiazarian, K. Pointwise Shape-Adaptive DCT for High-Quality Denoising and Deblocking of Grayscale and Color Images. IEEE Trans. Image Process. 2007, 16, 1395–1411. [Google Scholar] [CrossRef] [PubMed]
  59. Franzen, R. Kodak Lossless True Color Image Suite. 1999. Available online: https://github.com/Soniya2829/KODAK24 (accessed on 23 June 2025).
  60. Zhang, L.; Wu, X.; Buades, A.; Li, X. Color Demosaicking by Local Directional Interpolation and Nonlocal Adaptive Thresholding. J. Electron. Imaging 2011, 20, 023016. [Google Scholar] [CrossRef]
  61. Zeyde, R.; Elad, M.; Protter, M. On Single Image Scale-Up Using Sparse-Representations. In Proceedings of the 7th International Conference, Curves and Surfaces, Avignon, France, 24–30 June 2010; pp. 711–730. [Google Scholar] [CrossRef]
  62. Wu, F.; Zhang, H.; Wang, C.; Li, L.; Li, J.J.; Chen, W.R.; Zhang, B. SARBuD1.0: A SAR Building Dataset Based on GF-3 FSII Imageries for Built-up Area Extraction with Deep Learning Method. Natl. Remote Sens. Bull. 2022, 26, 620–631. [Google Scholar] [CrossRef]
  63. Wang, Z.; Bovik, A.C.; Sheikh, H.R.; Simoncelli, E.P. Image quality assessment: From error visibility to structural similarity. IEEE Trans. Image Process. 2004, 13, 600–612. [Google Scholar] [CrossRef] [PubMed]
  64. Hore, A.; Ziou, D. Image quality metrics: PSNR vs. SSIM. In Proceedings of the 2010 20th International Conference on Pattern Recognition, Istanbul, Turkey, 23–26 August 2010; pp. 2366–2369. [Google Scholar] [CrossRef]
  65. Cozzolino, D.; Verdoliva, L.; Scarpa, G.; Poggi, G. Nonlocal CNN SAR Image Despeckling. Remote Sens. 2020, 12, 1006. [Google Scholar] [CrossRef]
  66. Shen, H.; Zhao, Y.; Zhang, C.; Wang, Y. SAR image despeckling employing a recursive deep CNN prior. IEEE Trans. Geosci. Remote Sens. 2020, 59, 273–286. [Google Scholar] [CrossRef]
Figure 1. Schematic diagram of the SAR imaging process and application scenarios.
Remotesensing 17 03031 g001
Figure 2. Overall architecture of the DAT-Net network.
Remotesensing 17 03031 g002
Figure 3. Architecture of the DGAM.
Remotesensing 17 03031 g003
Figure 4. Architecture of the FMEE module.
Remotesensing 17 03031 g004
Figure 5. Architecture of the MCB module.
Remotesensing 17 03031 g005
Figure 6. Real SAR images: (a) SAR1; (b) SAR2; (c) SAR3; (d) SAR4; (e) SAR5; (f) SAR6.
Remotesensing 17 03031 g006
Figure 7. Denoising results of different denoising algorithms for images with σ 2 = 50: (a) image with noise; (b) BM3D; (c) DnCNN; (d) SAR-CNN; (e) SAR-DRN; (f) SAR-Transformer; (g) SAR-CAM; (h) proposed.
Remotesensing 17 03031 g007
Figure 8. Denoising results of different denoising algorithms for images with L = 4: (a) image with noise; (b) BM3D; (c) DnCNN; (d) SAR-CNN; (e) SAR-DRN; (f) SAR-Transformer; (g) SAR-CAM; (h) proposed.
Remotesensing 17 03031 g008
Figure 9. Denoising results of different denoising algorithms for images with L = 4 + σ 2 = 50: (a) image with noise; (b) BM3D; (c) DnCNN; (d) SAR-CNN; (e) SAR-DRN; (f) SAR-Transformer; (g) SAR-CAM; (h) proposed.
Remotesensing 17 03031 g009
Figure 10. Denoising results of different denoising algorithms for images with L = 8 + σ 2 = 75: (a) image with noise; (b) BM3D; (c) DnCNN; (d) SAR-CNN; (e) SAR-DRN; (f) SAR-Transformer; (g) SAR-CAM; (h) proposed.
Remotesensing 17 03031 g010
Figure 11. Denoising results of different denoising algorithms for SAR1: (a) original image; (b) BM3D; (c) DnCNN; (d) SAR-CNN; (e) SAR-DRN; (f) SAR-Transformer; (g) SAR-CAM; (h) proposed.
Remotesensing 17 03031 g011
Figure 12. Denoising results of different denoising algorithms for SAR2: (a) original image; (b) BM3D; (c) DnCNN; (d) SAR-CNN; (e) SAR-DRN; (f) SAR-Transformer; (g) SAR-CAM; (h) proposed.
Remotesensing 17 03031 g012
Figure 13. Denoising results of different denoising algorithms for SAR3: (a) original image; (b) BM3D; (c) DnCNN; (d) SAR-CNN; (e) SAR-DRN; (f) SAR-Transformer; (g) SAR-CAM; (h) proposed.
Remotesensing 17 03031 g013
Figure 14. Denoising results of different denoising algorithms for SAR4: (a) original image; (b) BM3D; (c) DnCNN; (d) SAR-CNN; (e) SAR-DRN; (f) SAR-Transformer; (g) SAR-CAM; (h) proposed.
Remotesensing 17 03031 g014
Figure 15. Denoising results of different denoising algorithms for SAR5: (a) original image; (b) BM3D; (c) DnCNN; (d) SAR-CNN; (e) SAR-DRN; (f) SAR-Transformer; (g) SAR-CAM; (h) proposed.
Remotesensing 17 03031 g015
Figure 16. Denoising results of different denoising algorithms for SAR6: (a) original image; (b) BM3D; (c) DnCNN; (d) SAR-CNN; (e) SAR-DRN; (f) SAR-Transformer; (g) SAR-CAM; (h) proposed.
Remotesensing 17 03031 g016
Table 1. Computational efficiency comparison of denoising methods.
MethodFLOPs (G)Params (M)Inference Time (ms)
BM3DN/AN/A3580
DnCNN72.630.563.12
SAR-CNN72.630.563.15
SAR-DRN31.610.241.58
SAR-Transformer147.82.1418.7
SAR-CAM84.21.379.5
DAT-Net310.528.742.8
Table 2. Average PSNR of different denoising methods across all datasets under different additive noise intensities.
DatasetsNoise
Variance
BM3DDnCNNSAR-CNNSAR-DRNSAR-
Transformer
SAR-CAMProposed
Classic52529.9428.7328.1227.9525.8428.0830.01
5026.6825.2624.9125.0624.2625.4327.05
7524.3023.7923.4223.4023.3323.7525.27
10022.3222.7922.7322.9221.8422.7124.11
Kodak242529.4128.9728.3628.3527.0428.3630.06
5026.1325.5725.2225.2124.6525.7227.20
7523.8523.8123.1723.3423.6223.8725.64
10021.8722.3122.6122.7621.2222.5924.56
McMaster2530.3729.9929.3529.4627.8229.6431.16
5026.6125.5026.0726.2025.6426.7028.04
7523.2024.4824.0624.1224.4024.6026.13
10020.8123.0723.0023.4221.5523.2424.88
Set122529.8029.3128.6228.4926.0528.6730.10
5026.3125.6225.2625.3524.2525.8226.97
7523.6423.8523.5223.3723.1923.9025.02
10021.4522.7622.6222.7821.2722.6623.77
Bold indicates the best result, while red indicates the secondary result.
Table 3. Average SSIM of different denoising methods across all datasets under different additive noise intensities.
DatasetsNoise
Variance
BM3DDnCNNSAR-CNNSAR-DRNSAR-
Transformer
SAR-CAMProposed
Classic5250.81890.78770.75220.76390.64650.77030.8269
500.70930.62710.60240.64300.59570.66130.7294
750.62220.54960.50060.53600.54370.55390.6609
1000.56090.51490.48150.53550.48980.48150.6061
Kodak24250.80900.79160.75350.77390.75150.77760.8267
500.69710.63380.61650.65770.69160.67590.7299
750.62260.56160.50890.54740.63880.56850.6752
1000.56800.50600.48470.54770.57350.49180.6316
McMaster250.84090.82840.79520.81600.73580.82270.8679
500.72120.64710.66340.70260.71100.72850.7839
750.63390.61550.56610.60440.67160.62150.7252
1000.56550.55580.51450.59800.58140.54380.6761
Set12250.84760.82230.78170.80130.67930.80640.8561
500.75430.67500.65160.69380.64410.71410.7754
750.67660.61030.55300.58400.59410.60810.7175
1000.60870.56220.52910.58190.52840.53380.6711
Bold indicates the best result, while red indicates the secondary result.
Table 4. Average PSNR of different denoising methods across all datasets under different levels of multiplicative noise intensity.
DatasetsLooksBM3DDnCNNSAR-CNNSAR-DRNSAR-
Transformer
SAR-CAMProposed
Classic5L = 117.9621.9821.9322.3821.2121.8923.72
L = 424.0924.3424.2924.4423.5924.7826.26
L = 826.5425.9325.5525.5224.5625.2927.83
L = 1627.6527.5226.9827.1924.9926.6029.29
Kodak24L = 118.3422.0321.9222.1920.3621.8924.08
L = 423.4924.6624.5824.6223.5425.1026.63
L = 825.6326.3626.0625.8825.8125.7328.04
L = 1626.6628.1127.5427.7526.8827.1929.50
McMasterL = 119.3221.5622.6822.9621.3122.7425.11
L = 424.8324.2625.8025.9924.6626.5128.13
L = 827.2026.6927.2227.4226.8627.1929.76
L = 1628.2729.5628.8629.3727.9228.8131.33
Set12L = 117.0221.8121.7622.0720.6221.7423.00
L = 423.2924.5524.4824.5623.4025.0226.05
L = 825.9926.3225.8525.8224.7125.5727.69
L = 1627.3028.0027.4627.6925.1727.0829.18
Bold indicates the best result, while red indicates the secondary result.
Table 5. Average SSIM of different denoising methods on all datasets under different levels of multiplicative noise intensity.
DatasetsLooksBM3DDnCNNSAR-CNNSAR-DRNSAR-
Transformer
SAR-CAMProposed
Classic5L = 10.52810.43530.43770.51000.45300.45590.5909
L = 40.64070.57610.56900.61210.56390.62820.6999
L = 80.70590.66700.61680.65560.58010.62250.7609
L = 160.72850.73990.70470.73890.58540.67940.8078
Kodak24L = 10.54850.45040.46230.53080.54460.47390.6307
L = 40.64790.61240.60240.64650.68460.66710.7322
L = 80.70500.70270.65990.69190.70210.66070.7827
L = 160.72060.77450.74480.77180.72040.71600.8289
McMasterL = 10.61390.42160.55170.60810.56100.57960.7170
L = 40.71740.63540.69700.73690.72420.75700.8141
L = 80.77190.72910.67820.77370.72640.73180.8555
L = 160.79040.83370.78900.83680.74660.79550.8882
Set12L = 10.56800.46160.48060.54920.48710.50100.6515
L = 40.69990.62410.62390.66230.61210.68530.7555
L = 80.75590.71230.66020.70450.62400.66350.8045
L = 160.78410.77610.74560.77920.62220.72110.8418
Bold indicates the best result, while red indicates the secondary result.
Table 6. Average PSNR of different denoising methods across all datasets under different hybrid noise intensities.
DatasetsLevelBM3DDnCNNSAR-CNNSAR-DRNSAR-
Transformer
SAR-CAMProposed
Classic5 σ 2 = 25, L = 117.7421.9921.7122.2520.4721.6923.51
σ 2 = 50, L = 422.8223.3923.2823.6122.9523.5124.99
σ 2 = 75, L = 823.0123.1722.9223.4222.0223.4424.57
σ 2 = 100, L = 1621.9122.7422.4322.7322.4222.5123.84
Kodak24 σ 2 = 25, L = 118.1322.0121.6822.0219.6721.8023.90
σ 2 = 50, L = 422.3123.4923.1823.5823.0923.6025.35
σ 2 = 75, L = 822.3923.2622.8623.3721.9623.3524.88
σ 2 = 100, L = 1621.2922.7522.3322.4522.4522.4524.24
McMaster σ 2 = 25, L = 119.0722.6722.3722.8020.2622.5324.79
σ 2 = 50, L = 422.9323.9924.0024.4923.9724.4826.20
σ 2 = 75, L = 822.1623.9123.5124.1222.4224.1125.52
σ 2 = 100, L = 1620.4623.2522.5822.9722.9723.0124.59
Set12 σ 2 = 25, L = 116.7621.7521.4421.9319.7121.5622.77
σ 2 = 50, L = 421.8123.4223.2923.5822.7123.5624.62
σ 2 = 75, L = 822.0723.2022.8623.3821.6423.4024.17
σ 2 = 100, L = 1620.8822.6522.2722.4422.0222.3423.39
Bold indicates the best result, while red indicates the secondary result.
Table 7. Average SSIM of different denoising methods across all datasets under different hybrid noise intensities.
DatasetsLevelBM3DDnCNNSAR-CNNSAR-DRNSAR-
Transformer
SAR-CAMProposed
Classic5 σ 2 = 25, L = 10.51450.46090.41020.51570.47500.45830.5840
σ 2 = 50, L = 40.60410.52630.51720.57790.51800.55290.6474
σ 2 = 75, L = 80.58200.52660.47270.57250.45260.56360.6228
σ 2 = 100, L = 160.55130.50380.45900.52200.49170.49420.5945
Kodak24 σ 2 = 25, L = 10.53100.47630.43200.53410.56520.47900.6224
σ 2 = 50, L = 40.61160.54430.53340.60050.62120.57590.6732
σ 2 = 75, L = 80.58990.54080.48730.59260.54460.58250.6468
σ 2 = 100, L = 160.55830.51390.46140.53170.58670.50680.6207
McMaster σ 2 = 25, L = 10.59970.56220.52390.61540.57170.57020.7010
σ 2 = 50, L = 40.64230.53500.59070.66260.65840.63980.7352
σ 2 = 75, L = 80.60050.59210.54260.64290.55870.63300.7019
σ 2 = 100, L = 160.55610.56320.49050.57730.59200.56110.6703
Set12 σ 2 = 25, L = 10.55980.49940.44870.55470.50340.50260.6438
σ 2 = 50, L = 40.65110.57180.56860.62760.56190.60270.7054
σ 2 = 75, L = 80.63030.58210.51720.62590.48600.61730.6865
σ 2 = 100, L = 160.59320.55480.50020.56060.52760.53370.6566
Bold indicates the best result, while red indicates the secondary result.
Table 8. Entropy and AG values of real SAR images processed via different denoising methods.
ImageIndicatorsBM3DDnCNNSAR-CNNSAR-DRNSAR-
Transformer
SAR-CAMProposed
SAR1Entropy7.07737.32677.31147.36217.48867.36497.252
AG125.78151.29145.47150.32147.46151.47155.75
SAR2Entropy6.70887.01787.16876.92386.92696.82236.7678
AG89.5894.9690.8584.2975.1689.85101.19
SAR3Entropy5.96286.47526.34346.39966.32206.38706.1563
AG69.97101.2890.8895.1379.2597.8699.09
SAR4Entropy6.89077.17307.14157.15427.09527.16667.0917
AG84.29114.14108.26105.4189.64112.65113.77
SAR5Entropy7.14187.41177.37377.37657.28807.39377.3303
AG100.59123.6115.64111.3294.77120.25127.59
SAR6Entropy6.97207.09967.08607.12627.19407.10436.9711
AG76.6586.3682.0879.5783.4279.9188.40
Bold indicates the best result, while red indicates the secondary result.
Disclaimer/Publisher’s Note: The statements, opinions and data contained in all publications are solely those of the individual author(s) and contributor(s) and not of MDPI and/or the editor(s). MDPI and/or the editor(s) disclaim responsibility for any injury to people or property resulting from any ideas, methods, instructions or products referred to in the content.