Abstract
On 8 September 2023, an Mw 6.8 earthquake struck the High Atlas Mountains in western Morocco, where the tectonic regime has been poorly investigated due to its remoteness and weaker seismicity compared to the northern plate boundary. In this study, we combine the measurements from the Interferometric Synthetic Aperture Radar images and the seismic data to invert the coseismic slip model of the 2023 Morocco earthquake. The results show a predominantly reverse slip motion with a minor left-lateral strike slip. The rupture process lasts about 15 s and reaches the maximum of its seismic moment release rate at about 5 s. The coseismic slip is mainly distributed in a depth range of ~20–30 km, with the ~1.4 m maximum coseismic slip at a depth of ~25 km. The Coulomb stress change suggests a significant stress loading effect on surrounding faults. The high-angle transpressive rupture kinematics of the 2023 Morocco earthquake reveal steep oblique–reverse faulting of the Tizi n’Test fault within the western High Atlas Mountains. The slight left-lateral strike slip and focal depth anomaly of this event are largely attributed to differential crustal shortening and the rejuvenation of early rift structures inherited from the Mesozoic complex evolution.
1. Introduction
On 8 September 2023, a moment magnitude (Mw) 6.8 earthquake with a focal depth of ~26 km struck the High Atlas Mountains (HAMs), Al Haouz Province, western Morocco (Figure 1). The earthquake was followed by several strong aftershocks, including an Mw 4.9 aftershock 19 min later after the mainshock, and resulted in significant fatalities and injuries: nearly 3000 people were killed and 320,000 people were exposed to seismic shocks [1,2,3]. In the past century, several damaging earthquakes have occurred in Morocco, and seismicity is primarily located at the northern plate boundary between the African and Eurasian plates [1,3,4,5,6]. The 2023 Al Haouz earthquake, an intraplate event occurring in southwest Morocco, approximately 500 km south of the northern plate boundary, was the strongest instrumentally recorded seismic event in Morocco and the deadliest since the 1960 Mw 5.8 Agadir earthquake [1]. The focal mechanism solutions from the United States Geological Survey (USGS) and the Global Centroid Moment Tensor (GCMT) indicate that the Al Haouz earthquake occurred on a steeply transpressive fault dipping to the northwest or a shallow-angle oblique–reverse fault dipping to the southwest, with nodal plane strike/dip 255°/70° or 125°/30° (Figure 1) [2]. However, different studies present distinct views on the rupture kinematics of the Al Haouz earthquake. Cheloni et al. [1] attribute the event to a southwest-dipping low-angle slip along the North Atlas Fault, while other studies argue that a steeply north-dipping fault is more likely the seismogenic structure [3,7,8]. As a result, the rupture kinematic mechanism of the 2023 Al Haouz earthquake remains ambiguous and requires further consideration.
The tectonic setting of Morocco is mainly defined by the convergence of African and Eurasian plates around the Mediterranean region. The Mediterranean region is thus seismically active due to the northward motion (4–7 mm/yr) of the African plate relative to the Eurasian plate along a complex plate boundary [4,5,9,10,11,12,13]. Although seismicity in Morocco is primarily concentrated along the northern plate boundary, the continuous convergence between plates also transmits compressive stress to the south, impacting the Moroccan Meseta and the High Atlas and Anti-Atlas Mountains, leading to the generation of several nearly east–west- and northeast-southwest-trending compressive and transpressive fault systems [14,15,16,17,18,19]. Previously, the HAMs were considered to be a low seismic region due to their remoteness from the plate boundary and weaker seismic activity. However, the 2023 Al Haouz earthquake indicates that high tectonic stress can accumulate in this region as well. The GPS data suggest a shortening rate of 1–2 mm/yr in the HAMs [9,12,13], which is partitioned by regional fold-and-thrust belts (Figure 1). Nevertheless, the seismotectonic structures and their kinematics within the HAMs have not been well investigated, therefore leading to inconsistency in the seismogenic structure and triggering mechanism of the Al Haouz earthquake.
The HAMs are an intracontinental mountain belt, extending 2000 km from Morocco to Tunisia. This mountain belt was formed during the reactivation of a Mesozoic rift, and the subsequent plate collision in the Cenozoic compressed the original extensional structures into a collisional regime [16,20,21,22,23]. Currently, the HAMs are characterized by thick-skinned thrusting and folding, and are considered as sets of double-vergent thrust systems (Figure 1) [2,15,17]. Two dominant faults, the North and South Atlas faults, bound the western HAMs (Figure 1). Within the mountain range, the closest mapped fault near the epicenter is the Tizi n’Test fault (TTF) (Figure 1). However, there is limited understanding of its kinematic characteristics. Sebrier et al. [15] suggest that the TTF is a steep-dipping reverse fault with a left-lateral strike–slip component, whereas others characterize the TTF by the high-angle faulting with a right-lateral component [13,16,19]. The discrepancy regarding the fault kinematics of the TTF has an impact on our understanding of the seismogenic structure and regional deformation pattern. However, the 2023 Al Haouz earthquake provides a rare opportunity to clarify the kinematic characteristics of the active structures within the HAMs, which are imperative to constrain the regional deformation pattern and the triggering mechanism of the 2023 Al Haouz earthquake.
Over the past decades, Interferometric Synthetic Aperture Radar (InSAR) technology has demonstrated remarkable capabilities in extracting surface deformation associated with seismic cycles, providing valuable insights into fault geometry and kinematic behavior [24,25,26,27,28,29]. Bayesian inversion is particularly valuable for earthquakes that do not rupture the surface because it provides a robust probabilistic framework to address the inherent uncertainties in constraining subsurface fault geometry and slip distribution. When surface rupture is absent, direct observations of the fault plane are unavailable, and the resolution of geodetic (e.g., InSAR) and seismic data diminishes with depth. In this study, we use the InSAR observation to map the coseismic deformation of the Al Haouz earthquake. Then, we search the geometry parameters of this blind fault with Bayesian methods. After that, we combine the InSAR observation and teleseismic data to constrain the dynamic rupture and coseismic slip model. Further, we calculate the stress disturbance caused by this earthquake and discuss the seismic hazard on the surrounding faults. Finally, we clarify the seismogenic structure of the Al Haouz earthquake based on the derived rupture kinematics and regional structural analysis.
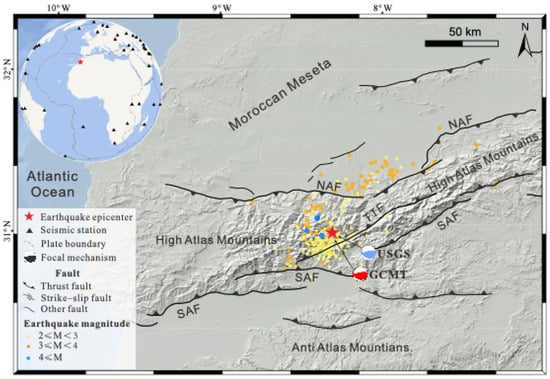
Figure 1.
Tectonic setting of the Mw 6.8 Al Haouz earthquake, western Morocco. The red stars denote the earthquake epicenter. The dashed gray lines in the global inset map represent plate boundaries. The focal mechanism beachballs are derived from the USGS (U.S. Geological Survey) and GCMT (Global Centroid Moment Tensor Project). The aftershock data are from the Euro-Mediterranean Seismological Center (https://www.emsc-csem.org/, accessed on 5 July 2025). The black solid lines are regional active faults, modified from [15,30]. NAF, North Atlas fault; SAF, South Atlas fault; TTF, Tizi n’Test fault.
2. Materials and Methods
2.1. Far-Field Body Wave Data
The teleseismic body-wave data used in this study were downloaded from the Data Management Center of the Incorporated Research Institutions for Seismology (IRIS). To obtain the precise process of source seismic rupture, it is necessary to improve the azimuth coverage of the seismic stations. We selected and used 50 vertical components of P-wave seismic phases with epicenter distances from 30° to 90° (Figure 1). First, the waveform record of instrument response acquisition speed was removed from the original data [31], and then the bandpass filtering of 0.01~0.9 Hz and resampling of 5 Hz were performed on the far-field waveform data, and the data length of 60 s in total was intercepted 10 s before the arrival of the P-wave. The theoretical Green’s function of far-field body waves is calculated using the Multitel3 program, which can calculate a more accurate Green’s function by considering direct waves and core reflected waves [32]. In the process of calculating Green’s function, the velocity model uses the crustal structure based on the CRUST 1.0 model [33] and the mantle and core parts of the AK135 reference Earth model [34].
2.2. InSAR Observation
To obtain the coseismic deformation field of the Al Haouz earthquake, we used GAMMA software (v20180704) to process differential interferograms on three tracks of Sentinel-1 InSAR data (Table 1). The interferograms were multilooked with a ratio of 10:2 (i.e., range:azimuth) to improve the signal-to-noise ratio, and a 30 m resolution digital elevation model (SRTM DEM) was used to simulate and correct the topographic phase. The interferograms are filtered by the adaptive filter and unwrapped by the minimum cost flow method [35,36]. Long-wavelength atmospheric and orbital errors were removed through polynomial fitting, and we manually masked the near-field unwrapping errors. In order to improve the computational efficiency of the inversion, we used an improved quadtree sampling method to downsample the datasets. This method uses the window gradient as the threshold, which can greatly reduce the amount of data and retain deformation details as much as possible [37]. The theoretical Green’s function of InSAR coseismic deformation is calculated by frequency wave number integration [38] and based on the layered wave velocity model [39].

Table 1.
Image information used in this study.
2.3. Fault Model Inversion
2.3.1. Bayesian Estimation for Fault Geometry with InSAR Data
According to the Okada model [40,41], a rectangular fault’s geometry and slip are characterized by nine parameters: length, width, depth, strike angle, dip angle, X and Y coordinates of the top-edge center, strike–slip displacement, and dip–slip displacement. We used the open-source code package provided by COMET (UK Centre for Observation and Modelling of Earthquake, Volcanoes and Tectonic, https://comet.nerc.ac.uk/gbis/, accessed on 5 July 2025) to solve this Okada model in a homogeneous, elastic half-space, assuming a Poisson ratio of 0.25 and a shear modulus of 30 GPa [42]. GBIS uses a Bayesian approach to invert geodetic data (GNSS, InSAR) for deformation source parameters. To efficiently sample the complex posterior probability density function (PDF), it employs a Markov Chain Monte Carlo (MCMC) method, specifically the Metropolis algorithm [43]. During each sampling step, a new set of parameters was proposed and the posterior probability was updated:
where denotes the likelihood function determined by residuals and predictions, is the prior information of model parameters, which is taken as uniform prior here, and is an unknown normalizing constant. If we consider that the data error follows the Gaussian distribution, the likelihood can be calculated as follows:
Among them, represents the forward model with model parameters m. In Equation (2), N is the number of data points and expresses the inversed data variance–covariance matrix, which is used to weight different datasets.
In order to better search for the fault parameters, we conducted a free search for all parameters, and unlike other studies, we did not constrain the strike angle and dip angle of the faults, but conducted a global search (0~360° and 0.1~89.9°, respectively). We applied uniform distribution for the priors, and the bounds for each prior are presented in Table 2. Finally, we conducted 1 million Bayesian inversions to search the source parameters. The first 100,000 samples in the final results were removed because source parameters may not converge in this burn-in period. We extracted the samples that has stabilized after the burn-in period, and then obtained the posterior PDF of each source parameter.

Table 2.
Priors and inversion results for the 2023 Al Haouz earthquake.
2.3.2. Finite Fault Inversion with Geodetic and Seismic Data
After determining the geometric parameters and location of the fault, we then extend the fault to 40 km × 40 km in the length and width direction, and discretize the fault plane into 400 sub-patches with a size of 2 km × 2 km. Then, the multi-time-window linear inversion strategy is used to jointly invert the kinematic source rupture with the InSAR coseismic deformation field and far-field body wave data [44,45,46,47]. This method builds on the representation theorem in [48] and regards the sub-patches as a point source, leading to the following observational equation:
where . In Equation (3), represents the model function of the velocity waveform, which comprises the smooth ramp function and the Green’s function , and expresses the triggering effect of the first-time window. To stabilize the inversion result, the Laplacian smoothing operation was applied to the model parameters, and the inversion equation can be expressed as follows:
in which and denote the Green function for teleseismic and InSAR data, respectively, and expresses the Laplacian smoothing factor, which was determined using Akaike’s Bayesian Information Criterion (ABIC) in this study [49]. The weights of the teleseismic data vector and InSAR data vector were set according to the data variance, respectively, and and are the smoothing operations applied in the temporal and space domain. Based on the characteristics of this earthquake, which was dominated by reverse slip, the range of slip direction for each subfault is limited to 90° ± 45°. Then, the finite slip distribution is determined by employing a Non-negative Least Squares method [50]. In order to obtain optimal finite slip distribution, we assume the weight of InSAR as 1, and the weight of the teleseismic data from 0.1 to 0.9. Then, we invert with different Laplacian smoothing factor multiple times and choose the optimal model via the ABIC value.
2.4. Coulomb Stress Change
The Coulomb stress on the 2023 Al Haouz earthquake fault plane changed, and its surrounding fault planes were analyzed using the slip models with the Coulomb 3.3 software from USGS (https://pubs.usgs.gov/of/2011/1060/, accessed on 5 July 2025). The fundamental equation for calculating the stress change is given by
where represents the effective friction coefficient on the receiver fault, which was set to a value of 0.4 in this study. denotes the shear stress change (positive when acting in the direction of the fault slip), and signifies the normal stress change (positive when the receiver fault is unclamped). The fault geometry and location in this area were modified from [15]. The fault planes were constructed with variable strike angle and width to 40 km, and then the fault planes were divided into 5 km × 5 km patches. Given that the NAF and SAF are reverse faults, we assumed the same dip angle with a rake angle of 90° as the mainshock. For the TTF, Ellero et al. [19] found several strike–slip faults in the middle of the HAMs. Therefore, we set the dip angle of these faults to 90° and the rake angle to 0°.
3. Results
3.1. Coseismic Deformation
We processed two descending and one ascending interferograms, which sufficiently covered the coseismic deformation field (Figure 2). The InSAR deformation maps reveal asymmetric crustal motion across the fault trace, characterized by significant hanging wall uplift (up to ~15 cm) in the northern block and footwall subsidence (~5 cm) in the south. This differential vertical displacement forms a sharp gradient aligned with the fault strike, consistent across ascending (AT45) and descending (DT52, DT154) satellite tracks. The three interferograms show the same deformation pattern—an uplift deformation region in north—indicating that this earthquake was mainly driven by the reverse slip motion. The maximum line-of-sight displacement of the AT45 is ~0.5 m. The maximum line-of-sight displacement of the DT52 and DT154 is ~0.4 m, slightly lower than that of AT45. We derived the east–west and vertical component from three interferograms, as shown in Figure 2g,h, in which the warm color represents a sliding motion towards the east and vertically upwards. The vertical component shows thrust slip, which is consistent with the pattern shown in the three interferograms. The deformation field of track D52 is wider than track D154, which is mainly caused by the different incidence angle of the two tracks. In addition, the surface deformation field mapped by InSAR shows notable surface uplift and subsidence, and the transition zone between uplift and subsidence nearly fits with the fault traces of the TTF (Figure 2) [15,17].
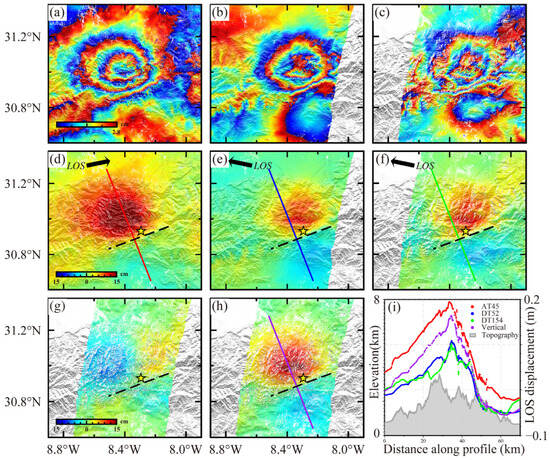
Figure 2.
InSAR-derived coseismic deformation fields from the 2023 Al Haouz earthquake. Black dashed lines represent the projected fault trace of the fault plane. The yellow star represents the epicenter in this study. (a–c) Wrapped phase map along ascending track 45, descending track 52, and descending track 154, respectively. (d–f) Unwrapped LOS displacement fields. (g,h) East–west component and vertical component derived from ascending and descending Sentinel-1 tracks. (i) Displacement profiles along AA’ shown in (d–f,h), with dot colors matching the color of each profile in (d–f,h): Red—Sentinel-1 ascending track 45, blue—Sentinel-1 descending track 52, green—Sentinel-1 descending track 154, and purple—vertical component.
3.2. Rupture Process and Slip Distribution
Given the line-of-sight (LOS) displacement data retrieved from three Sentinel-1 interferograms, we use GBIS to estimate the posterior PDF of the fault parameters. Figure 3 shows the resulting histograms of the 1-D marginal PDF for each parameter and the plots of the 2-D joint PDF for each parameter pair. From the joint probability density function distribution of each parameter (Figure 3), it can be seen that each parameter is close to a normal distribution, and the correlation between two parameters is small, which proves the stability of the inversion results and the independence of the parameters. The statistical distribution (Table 2) shows that the length of the fault is ~22.23 km (18.72–25.10, 95% confidence interval, the same below), the width is ~38.61 km (31.68–47.59), and the strike and dip are 250.3° (246.9–254.1°) and 70.3° (66.9–74.1°), respectively, and the fault dips to the northwest. The top depth of the fault is 10.77 km, which indicates that the coseismic rupture did not reach the surface. The slip on the fault surface is mainly the reverse component, with a small amount of left-lateral slip component.
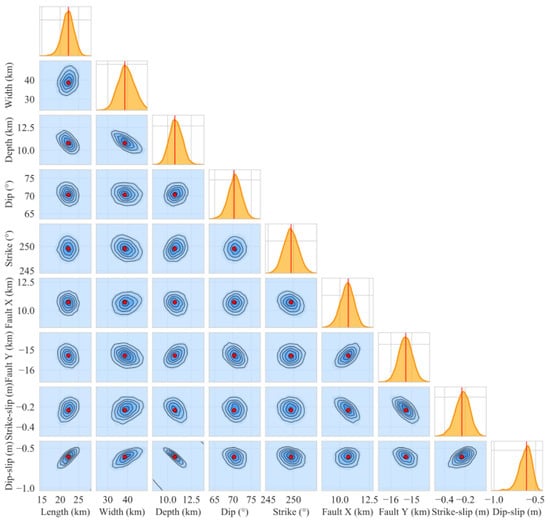
Figure 3.
1-D and 2-D marginal posterior PDF plots of a rectangular source for the 2023 Al Haouz earthquake derived from InSAR data. The red vertical lines in the histograms and the red dot in the 2D correlation maps represent the optimal solution.
Using the optimal geometric parameters, we extended the fault along the strike and dip strike direction and then jointly inverted the slip distribution using seismic data and geodetic data. In order to determine the appropriate data weight between the InSAR data and seismic data, we conducted multiple inversions using different weights and smoothing factors. As shown in Figure 4, the ABIC value obtained from the inversion of the teleseismic data with a weight of 0.1 is significantly lower than that of the other weights. Among these inversions with a weight of 0.1 for teleseismic data, the inversion result with a smoothing factor of 0.001 has the lowest ABIC value. However, a low smoothing factor may result in an uneven sliding distribution. Considering that the ABIC values of these inversion results with a weight of 0.1 are very low, we selected the set of inversion results with a smoothing factor of 0.004 as our optimal result. This can ensure both low ABIC values and smooth sliding distribution on the fault plane. In this set of inversion results, we obtained a Variance Reduction (VR) of 90.1. The optimal slip distribution inverted by the InSAR data and seismic data is shown in Figure 5, where the coseismic slip is mainly distributed in the depth range of 25–30 km with a maximum slip of ~1.4 m. The average rake is ~70°, indicating that the coseismic slip is mainly released by reverse slip motion, with minor left-lateral strike–slip motion. The coseismic slip is primarily distributed under 10 km and does not rupture to the surface. The moment tensor released by this earthquake is ~2.34 × 10¹⁹ N·m, corresponding to an Mw 6.84 earthquake, which is consistent with the Mw 6.8 reported by the USGS and Mw 6.9 by the GCMT (Table 3).
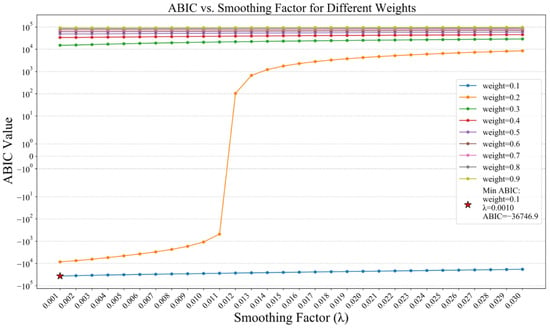
Figure 4.
ABIC values vs. smoothing factor under different weights of teleseismic body-wave data. Red star represents the globe minimum ABIC value. Colorful lines represent different weights of teleseismic body-wave data.
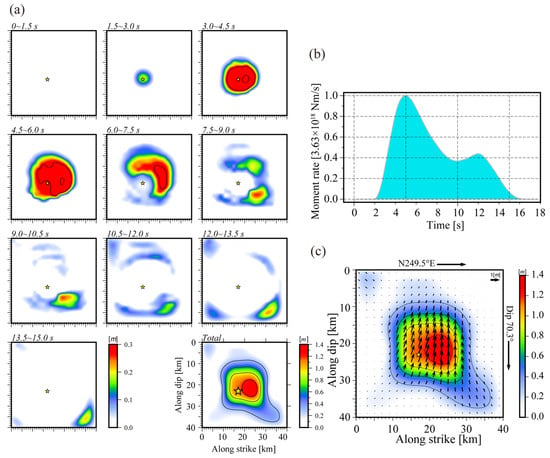
Figure 5.
(a) Snapshots of the source rupture process derived from the joint inversion. The contour interval is 0.3 m, and the yellow star indicates the rupture starting point. (b) Cumulative seismic moment releasing rate function of the optimal fault model. (c) Coseismic slip model. The slip contour is 0.3 m, and the yellow star indicates the rupture starting point.

Table 3.
The fault parameters of 2023 Mw6.8 Al Haouz earthquake.
The source rupture sub-process is shown in Figure 5. The focal model shows that the rupture of the Morocco earthquake is a disk rupture mode with a total duration of nearly 16 s. The rupture began at a depth of 23 km from the fault plane and then broke in all directions. The energy release process consists of two stages. The first stage, starting from the rupture initiation point, produces a large convex body, whose rupture lasts about 10 s, reaches the maximum of its seismic moment release rate at about 5 s, and releases most of the seismic energy. After that, the rate of seismic moment release begins to decline and then rises again in 12 s and continued to decline after reaching the second peak. The second stage is a minor slip in the lower right corner of the fault plane, which corresponds to the last 4 s of the entire fracture process.
The inversion result shows that the data from most teleseismic stations can fit the data well, and only the initial motion part of the P-wave data from a few teleseismic stations cannot fit well (Figure 6). For example, the synthetic maximum amplitude (red line) of station MBAR is about half of the observed waveforms, which may lead to the underestimation of the slip on the fault plane. The initial part of the synthetic waveform of station KONO does not fit the data well, which may lead to small differences in inversion. Figure 7 shows the simulated coseismic deformation fields of three orbits. The simulated data fits well with the observation, with the largest residuals mainly appearing near faults, which may reflect the complex geometric relationships of faults in the shallow parts of the faults or be related to inelastic deformation. The residual root mean square error (RMSE) values obtained by the joint model inversion of the InSAR data are 0.95 cm, 1.22 cm, and 1.39 cm, respectively, indicating the reasonability of our coseismic slip model (Figure 7).
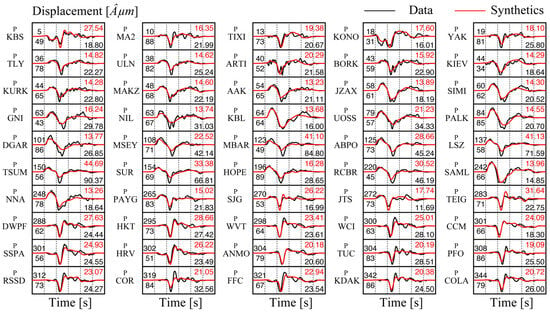
Figure 6.
Comparison between the synthetic waveforms and the observed teleseismic P-wave records (displacement). The maximum amplitude of the observed (black font) and synthetic waveform (red font) is shown to the right of each waveform, in micrometers. The azimuth and distance in degrees are shown at the beginning of each record with the azimuth on top.
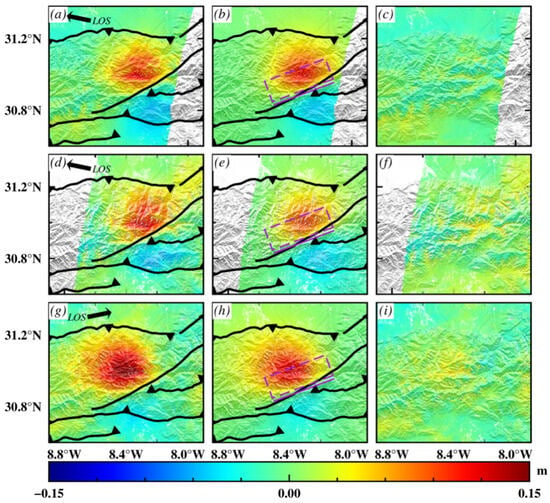
Figure 7.
(a–c) Unwrapped displacement images of the observed, modeled, and residual of the coseismic deformation acquired by Sentinel-1 track 52’s descending orbit. (d–f) Unwrapped displacement images of the observed, modeled, and residual of the coseismic deformation acquired by Sentinel-1 track 154’s descending orbit. (g–i) Unwrapped displacement images of the observed, modeled, and residual of the coseismic deformation field acquired by Sentinel-1 track 45’s ascending orbit. The dashed purple rectangles represent the fault plane of the 2023 Al Haouz earthquake and the solid line represents the projection of the fault plane on the ground.
4. Discussion
4.1. Coulomb Stress Change and Earthquake Risk
The seismic stress triggering theory shows that the regional stress accumulated by tectonic movement is released during an earthquake [51,52,53]. The accumulated stresses do not disappear immediately and are redistributed through stress transfer processes, potentially causing subsequent seismic activity. In regions where Coulomb Failure Stress (CFS) change is positive, seismic activity is enhanced, while in regions where it is negative, seismic activity is reduced [51,52,53]. To investigate potential changes in regional seismic activity resulting from the 2023 Al Haouz earthquake, we used the Coulomb 3.3 software to calculate the coseismic Coulomb stress change on the major active faults in this region, assuming a friction coefficient of 0.4 [54]. The calculated Coulomb stress changes on the surrounding fault are shown in Figure 8. The positive stresses that are larger than 0.1 Bar are mainly concentrated on the lower part of the fault planes, especially on the NAF and SAF. On the middle part of the SAF, there are negative stress values on the top of the plane, which represents Coulomb stress release near the epicenter. Overall, the results indicate that the Coulomb stress changes are mainly concentrated near the epicenter, primarily manifesting as stress loading, and reaching the triggering threshold of 0.1 Bar. Therefore, the earthquake hazard on the surrounding faults deserves further attention.
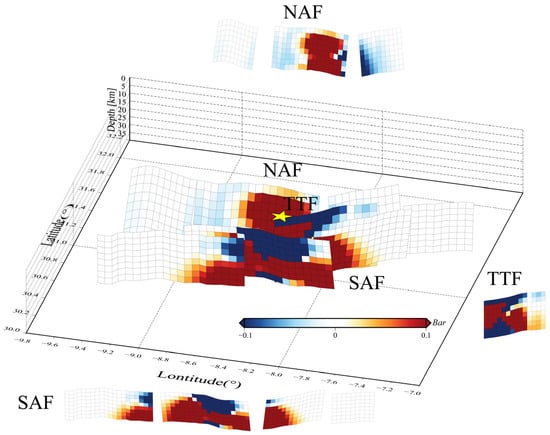
Figure 8.
Distributions of the coseismic CFS changes in surrounding active faults induced by the Morocco earthquake with an effective coefficient of 0.4. Yellow star represents the epicenter of the 2023 Al Haouz earthquake.
4.2. Seismogenic Structure of the Al Haouz Earthquake and Implications for Regional Tectonics
The determined seismogenic fault plane of the 2023 Al Haouz earthquake in this study is consistent with the USGS finite model and the primary structural alignment (NEE-SWW) in the western HAMs. The NW-SE crustal shortening in the HAMs induces a series of compressional fold-and-thrust belts extending along the ENE-WSW orientation (Figure 9a) [17,19,21]. The two mountain-bounding thrust faults, the North and South Atlas faults, can explain the compressive mechanism of the Al Haouz earthquake, but the focal depths inferred from these two faults are not consistent with the kinematic parameters of the Al Haouz earthquake. This event occurred ~20 km south of the south-dipping North Atlas fault and ~30 km north of the north-dipping South Atlas fault. Projecting the trace of the North Atlas fault 20 km southward at 30° dip reaches only ~12 km depth beneath the epicenter; projecting the South Atlas fault 30 km northward at 70° dip exceeds 82 km in depth beneath the epicenter [2]. Hence, both focal depths constrained by the mountain-bounding faults deviate significantly from the simulated values based on seismic and geodetic data, indicating that the causative fault may be another fault.
The fault geometry of the TTF within the HAMs appears to be in close agreement with the kinematic parameters of the 2023 Al Haouz earthquake. The TTF is ~10 km away from the epicenter, and its constrained focal depth is roughly 27 km [15], consistent with the main rupture depths of the Al Haouz earthquake derived in this study. Previously, the fault geometry and kinematic characteristics of the TTF were suspicious [15,16,19]. However, the Al Haouz earthquake can precisely provide effective constraints on the kinematic features of the TTF. Both the structural geometry and the surface traces of the TTF correspond closely with the rupture kinematics and deformation fields derived by InSAR observations and seismic wave inversions. Therefore, we suggest that the high-angle transpressive faulting of the TTF is responsible for the coseismic rupture of the 2023 Al Haouz earthquake.
Furthermore, the rupture kinematics of the 2023 Al Haouz earthquake reveal a minor left-lateral strike–slip component of the TTF, which is in disagreement with the right-lateral strike–slip feature described in several geological and geodetic studies [13,16,19]. The slight right-lateral slip along the HAMs is attributed to the northeastward movement of the southern Atlas region relative to the Eurasian plate [11,12,13,16,55,56]. As a result, there is a slight right-lateral slip along the mountain bounding faults in the HAMs, which has been confirmed by relevant geological surveys [16,19]. However, the 2023 Al Haouz earthquake occurred in a tectonic distortion zone between the western and eastern HAMs (Figure 9a). Divided by this transition zone, the main tectonic alignment changes eastward from W-E directed in the western HAMs to SW-NE in the central HAMs (Figure 9a) [16]. Meanwhile, the crustal shortening decreases from east to west along the HAMs as well [14]. Lanari et al. [16] estimated ~12 km of the Cenozoic shortening in the western HAMs along the NNW-SSE orientation, less than half of the amount of shortening of the central and eastern HAMs (approximately 30–34 km) [16,20,21]. The GPS velocity field also indicates that the rate of crustal shortening in the western HAMs is significantly smaller than that in the central and eastern HAMs (Figure 9a) [12,13,16,55]. The differential crustal shortening between the western and eastern HAMs is largely responsible for the localized left-lateral slip of the TTF in the transition zone (Figure 9b), which contributed the minor strike–slip component as observed in the 2023 Al Haouz earthquake.
The joint inversion analysis shows that the coseismic slip of the 2023 Al Haouz earthquake was primarily distributed in the depth range of 25–30 km, which is far beyond the typical depth of 5–15 km for general tectonic earthquakes in the compressive orogenic belts [8]. The source depth anomaly may be related to the early structural evolution of the HAMs. From the Triassic to the late Jurassic, the north African plate had undergone a long period of rifting due to the opening of the central Atlantic Ocean [16,19,20,21,22,23,57]. Subsequently, the convergence of the African and European plates during the Cenozoic led to the replacement of tectonic regimes from the rift system to collisional orogeny. Tectonic inversion affects the architecture of compressional structures, which preserves the high-angle fault geometry inherited from pre-existing extensional faults [16,17,19,20]. In addition, the maximum compressive stress transmitted from the northern plate boundary is oblique to the pre-existing fabric, and, thus, the resulting deformation is dominated by a transpressive regime, and strain is mainly partitioned by oblique–reverse slip [16,23]. The HAMs are a typical reactivated compressive orogen that develops preferentially along zones of pre-existing weakness [16], resulting from the rejuvenation of Mesozoic rift structures inherited from the pre-Alpine complex evolution [16,19,20].
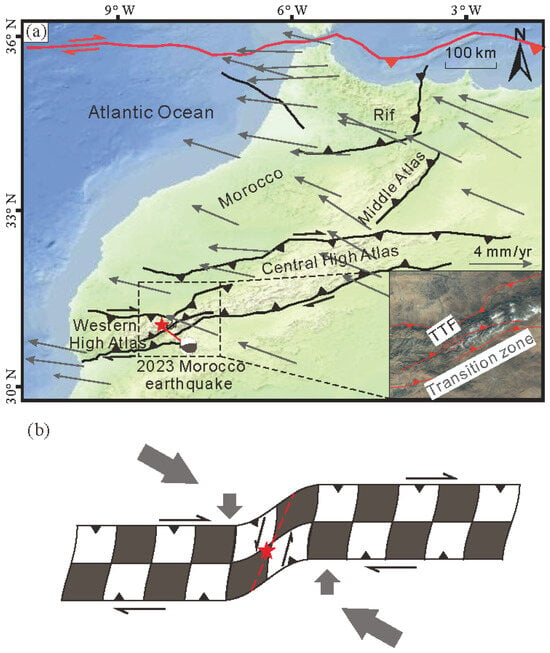
Figure 9.
Seismogenic fault and deformation model of the 2023 Morocco earthquake. (a) Morocco’s active structures and GPS velocity field with respect to a Eurasian-fixed reference frame. The GPS data are modified from [56,58]. The inset map shows the satellite image of the seismogenic fault (Tizi n’Test fault, TTF) of the 2023 Morocco earthquake. (b) Conceptual cartoon illustrating the seismotectonic environment of the 2023 Morocco earthquake.
5. Conclusions
The 2023 Mw 6.8 Morocco earthquake in the High Atlas Mountains provides critical insights into the region’s poorly understood tectonic regime. Using the joint inversion of InSAR and seismic data, this study delineates the 2023 Mw 6.8 Morocco earthquake as a high-angle transpressive rupture on the Tizi n’Test Fault (TTF), characterized by dominant reverse slip (peak slip: ~1.4 m at 25–30 km depth) with a minor left-lateral component. The rupture propagated radially over ~16 s, releasing peak moment at ~5 s. The fault geometry (strike 250.3° ± 3.6°, dip 70.3° ± 3.6°) and deep slip distribution confirm the TTF—a structure reactivated under ongoing NW-SE crustal shortening—as the seismogenic fault. The localized anomalous left-lateral slip of the TTF reflects differential shortening across the HAMs, while the deep rupture locus stems from the reactivation of Mesozoic rift structures. Significant Coulomb stress loading on adjacent faults underscores persistent seismic risk in the region. The assumption of a planar fault geometry may oversimplify the true fault structure, which could be non-planar or listric. In the future, we can try to conduct physics-based dynamic rupture simulations to test the rupture propagation in the lower crust. Overall, this study resolves kinematic ambiguities of the TTF within the HAMs and calls for reevaluating seismic hazard risks on the bounding faults of the HAMs.
Author Contributions
N.F. performed the source parameter inversion and rupture process, and drafted the manuscript. Z.C. contributed to the discussion. L.Z., K.S., L.X. and W.X. provided helpful suggestions and revised the manuscript. All authors have read and agreed to the published version of the manuscript.
Funding
This work was supported by the National Natural Science Foundation of China (Grant Nos. 42174023, 42304037), Hunan Provincial Natural Science Foundation Key Project (Grant No. 2024JJ3031), Central South University Frontier Interdisciplinary Research Project (Grant No. 2023QYJC006) and the Hunan Provincial Postgraduate Research Innovation Project (Grant No. CX20210104).
Data Availability Statement
The raw data supporting the conclusions of this article will be made available by the authors on request.
Acknowledgments
The topographic maps and satellite imagery used in this study were obtained from Tianditu online maps (http://www.tianditu.gov.cn, accessed on 5 July 2025). We thank the anonymous reviewers for their thoughtful comments. The Sentinel-1 images were obtained from the Alaska Satellite Facility (https://asf.alaska.edu/, accessed on 5 July 2025). The teleseismic data were obtained from IRIS. Part of the figures were prepared using Generic Mapping Tools.
Conflicts of Interest
The authors declare no conflicts of interest.
Correction Statement
This article has been republished with a minor correction to the Data Availability Statement. This change does not affect the scientific content of the article.
References
- Cheloni, D.; Famiglietti, N.A.; Tolomei, C.; Caputo, R.; Vicari, A. The 8 September 2023, MW 6.8, Morocco Earthquake: A Deep Transpressive Faulting Along the Active High Atlas Mountain Belt. Geophys. Res. Lett. 2024, 51, e2023GL106992. [Google Scholar] [CrossRef]
- Levandowski, W. Fault-Slip Potential near the Deadly 8 September 2023 Mw 6.8 Al Haouz, Morocco, Earthquake. Seism. Rec. 2023, 3, 367–375. [Google Scholar] [CrossRef]
- Yeck, W.L.; Hatem, A.E.; Goldberg, D.E.; Barnhart, W.D.; Jobe, J.A.T.; Shelly, D.R.; Villaseñor, A.; Benz, H.M.; Earle, P.S. Rapid Source Characterization of the 2023 Mw 6.8 Al Haouz, Morocco, Earthquake. Seism. Rec. 2023, 3, 357–366. [Google Scholar] [CrossRef]
- Pelaez, J.A.; Chourak, M.; Tadili, B.A.; Brahim, L.A.; Hamdache, M.; Casado, C.L.; Solares, J.M.M. A Catalog of Main Moroccan Earthquakes from 1045 to 2005. Seismol. Res. Lett. 2007, 78, 614–621. [Google Scholar] [CrossRef]
- Cherkaoui, T.-E.; Hassani, A.E. Seismicity and Seismic Hazard in Morocco 1901–2010. Bull. L’Institut Sci. 2012, pp. 45–55. Available online: http://www.israbat.ac.ma/wp-content/uploads/2015/01/05-Cherkaoui_BIS_ST34_45.pdf (accessed on 5 July 2025).
- Nayak, K.; López-Urías, C.; Romero-Andrade, R.; Sharma, G.; Guzmán-Acevedo, G.M.; Trejo-Soto, M.E. Ionospheric Total Electron Content (TEC) Anomalies as Earthquake Precursors: Unveiling the Geophysical Connection Leading to the 2023 Moroccan 6.8 Mw Earthquake. Geosciences 2023, 13, 319. [Google Scholar] [CrossRef]
- Huang, K.; Wei, G.; Chen, K.; Zhang, N.; Li, M.; Dal Zilio, L. The 2023 Mw 6.8 Morocco Earthquake: A Lower Crust Event Triggered by Mantle Upwelling? Geophys. Res. Lett. 2024, 51, e2024GL109052. [Google Scholar] [CrossRef]
- Touati, B.; Gu, W.; Ni, S.; Chu, R.; Sheng, M.; Xue, Q.; Bellalem, F.; Maouche, S.; Yahyaoui, H. The 2023 Mw 6.8 Adassil Earthquake (Chichaoua, Morocco) on a Steep Reverse Fault in the Deep Crust and Its Geodynamic Implications. Earth Planet. Phys. 2024, 8, 522–534. [Google Scholar] [CrossRef]
- Chalouan, A.; Gil, A.J.; Chabli, A.; Bargach, K.; Liemlahi, H.; El Kadiri, K.; Tendero-Salmerón, V.; Galindo-Zaldívar, J. cGPS Record of Active Extension in Moroccan Meseta and Shortening in Atlasic Chains under the Eurasia-Nubia Convergence. Sensors 2023, 23, 4846. [Google Scholar] [CrossRef]
- Hamdache, M.; Pelaez, J.A.; Talbi, A.; Casado, C.L. A Unified Catalog of Main Earthquakes for Northern Algeria from A.D. 856 to 2008. Seismol. Res. Lett. 2010, 81, 732–739. [Google Scholar] [CrossRef]
- McClusky, S.; Reilinger, R.; Mahmoud, S.; Ben Sari, D.; Tealeb, A. GPS Constraints on Africa (Nubia) and Arabia Plate Motions. Geophys. J. Int. 2003, 155, 126–138. [Google Scholar] [CrossRef]
- Serpelloni, E.; Vannucci, G.; Pondrelli, S.; Argnani, A.; Casula, G.; Anzidei, M.; Baldi, P.; Gasperini, P. Kinematics of the Western Africa-Eurasia Plate Boundary from Focal Mechanisms and GPS Data. Geophys. J. Int. 2007, 169, 1180–1200. [Google Scholar] [CrossRef]
- Billi, A.; Cuffaro, M.; Orecchio, B.; Palano, M.; Presti, D.; Totaro, C. Retracing the Africa–Eurasia Nascent Convergent Boundary in the Western Mediterranean Based on Earthquake and GNSS Data. Earth Planet. Sci. Lett. 2023, 601, 117906. [Google Scholar] [CrossRef]
- Tesón; Teixell, A.; Arboleya, M.L. Intraplate Tectonics: Insights from Mountain Building in the Moroccan Atlas and Related Subsidence in the Ouarzazate Foreland Basin. In Proceedings of the International Meeting of Young researchers in Structural Geology and Tectonics, Oviedo, Spain, 1–3 July 2008. [Google Scholar]
- Sébrier, M.; Siame, L.; Zouine, E.M.; Winter, T.; Missenard, Y.; Leturmy, P. Active Tectonics in the Moroccan High Atlas. Comptes Rendus Géosci. 2006, 338, 65–79. [Google Scholar] [CrossRef]
- Lanari, R.; Faccenna, C.; Fellin, M.G.; Essaifi, A.; Nahid, A.; Medina, F.; Youbi, N. Tectonic Evolution of the Western High Atlas of Morocco: Oblique Convergence, Reactivation, and Transpression. Tectonics 2020, 39, e2019TC005563. [Google Scholar] [CrossRef]
- Teixell, A.; Arboleya, M.; Julivert, M.; Charroud, M. Tectonic Shortening and Topography in the Central High Atlas (Morocco). Tectonics 2003, 22, 2002TC001460. [Google Scholar] [CrossRef]
- Helg, U.; Burkhard, M.; Caritg, S.; Robert-Charrue, C. Folding and Inversion Tectonics in the Anti-Atlas of Morocco. Tectonics 2004, 23, 2003TC001576. [Google Scholar] [CrossRef]
- Ellero, A.; Ottria, G.; Malusà, M.G.; Ouanaimi, H. Structural Geological Analysis of the High Atlas (Morocco): Evidences of a Transpressional Fold-Thrust Belt. In Tectonics—Recent Advances; Sharkov, E., Ed.; InTech: London, UK, 2012; ISBN 978-953-51-0675-3. [Google Scholar]
- Beauchamp, W.; Allmendinger, R.W.; Barazangi, M.; Demnati, A.; El Alji, M.; Dahmani, M. Inversion Tectonics and the Evolution of the High Atlas Mountains, Morocco, Based on a Geological-geophysical Transect. Tectonics 1999, 18, 163–184. [Google Scholar] [CrossRef]
- Gomez, F.; Beauchamp, W.; Barazangi, M. Role of the Atlas Mountains (Northwest Africa) within the African-Eurasian Plate-Boundary Zone. Geology 2000, 28, 775. [Google Scholar] [CrossRef]
- Medina, F.; Cherkaoui, T.-E. Focal Mechanisms of the Atlas Earthquakes, and Tectonic Implications. Geol. Rundsch. 1991, 80, 639–648. [Google Scholar] [CrossRef]
- Dewey, J.F.; Helman, M.L.; Knott, S.D.; Turco, E.; Hutton, D.H.W. Kinematics of the Western Mediterranean. Geol. Soc. Lond. Spec. Publ. 1989, 45, 265–283. [Google Scholar] [CrossRef]
- Xu, X.; Sandwell, D.T.; Smith-Konter, B. Coseismic Displacements and Surface Fractures from Sentinel-1 InSAR: 2019 Ridgecrest Earthquakes. Seismol. Res. Lett. 2020, 91, 1979–1985. [Google Scholar] [CrossRef]
- Fang, J.; Houseman, G.A.; Wright, T.J.; Evans, L.A.; Craig, T.J.; Elliott, J.R.; Hooper, A. The Dynamics of the India-Eurasia Collision: Faulted Viscous Continuum Models Constrained by High-Resolution Sentinel-1 InSAR and GNSS Velocities. J. Geophys. Res. Solid Earth 2024, 129, e2023JB028571. [Google Scholar] [CrossRef]
- Massonnet, D.; Rossi, M. The Displacement Field of the Landers Earthquake Mapped by Radar Interferometry. Nature 1993, 364, 138–142. [Google Scholar] [CrossRef]
- Fialko, Y. Interseismic Strain Accumulation and the Earthquake Potential on the Southern San Andreas Fault System. Nature 2006, 441, 968–971. [Google Scholar] [CrossRef] [PubMed]
- Bürgmann, R.; Rosen, P.A.; Fielding, E.J. Synthetic Aperture Radar Interferometry to Measure Earth’s Surface Topography and Its Deformation. Annu. Rev. Earth Planet. Sci. 2000, 28, 169–209. [Google Scholar] [CrossRef]
- Garthwaite, M.C.; Wang, H.; Wright, T.J. Broadscale Interseismic Deformation and Fault Slip Rates in the Central Tibetan Plateau Observed Using InSAR. J. Geophys. Res. Solid Earth 2013, 118, 5071–5083. [Google Scholar] [CrossRef]
- Zelenin, E.; Bachmanov, D.; Garipova, S.; Trifonov, V.; Kozhurin, A. The Database of the Active Faults of Eurasia (AFEAD): Ontology and Design behind the Continental-Scale Dataset. Earth Syst. Sci. Data 2021, 14, 4489–4503. [Google Scholar] [CrossRef]
- Wald, D.J.; Heaton, T.H.; Hudnut, K.W. The Slip History of the 1994 Northridge, California, Earthquake Determined from Strong-Motion, Teleseismic, GPS, and Leveling Data. Bull. Seismol. Soc. Am. 1996, 86, S49–S70. [Google Scholar] [CrossRef]
- Qian, Y.; Ni, S.; Wei, S.; Almeida, R.; Zhang, H. The Effects of Core-Reflected Waves on Finite Fault Inversions with Teleseismic Body Wave Data. Geophys. J. Int. 2017, 211, 936–951. [Google Scholar] [CrossRef]
- Laske, G.; Masters, G.; Ma, Z.; Pasyanos, M. Update on CRUST1.0—A 1-Degree Global Model of Earth’s Crust. In Proceedings of the EGU General Assembly Conference Abstracts, Vienna, Austria, 7–12 April 2013. [Google Scholar]
- Kennett, B.; Engdahl, E.; Buland, R. Constraints on Seismic Velocities in the Earth from Traveltimes. Geophys. J. Int. 1995, 122, 108–124. [Google Scholar] [CrossRef]
- Liu, H.; Xie, L.; Zhao, G.; Ali, E.; Xu, W. A Joint InSAR-GNSS Workflow for Correction and Selection of Interferograms to Estimate High-Resolution Interseismic Deformations. Satell. Navig. 2023, 4, 14. [Google Scholar] [CrossRef]
- Goldstein, R.M.; Werner, C.L. Radar Interferogram Filtering for Geophysical Applications. Geophys. Res. Lett. 1998, 25, 4035–4038. [Google Scholar] [CrossRef]
- Gao, H.; Liao, M.; Feng, G. An Improved Quadtree Sampling Method for InSAR Seismic Deformation Inversion. Remote Sens. 2021, 13, 1678. [Google Scholar] [CrossRef]
- Zhu, L.; Rivera, L.A. A Note on the Dynamic and Static Displacements from a Point Source in Multilayered Media. Geophys. J. R. Astron. Soc. 2010, 148, 619–627. [Google Scholar] [CrossRef]
- Shen, W.; Ritzwoller, M.H.; Kang, D.; Kim, Y.H.; Lin, F.C.; Ning, J.; Wang, W.; Zheng, Y.; Zhou, L. A Seismic Reference Model for the Crust and Uppermost Mantle beneath China from Surface Wave Dispersion. Geophys. J. Int. 2016, 206, 954–979. [Google Scholar] [CrossRef]
- Okada, Y. Surface Deformation Due to Shear and Tensile Faults in a Half Space. Bull. Seismol. Soc. Am. 1992, 82, 1018–1040. [Google Scholar] [CrossRef]
- Okada, Y. Surface Deformation Due to Shear and Tensile Faults in a Halfspace. Bull. Seismol. Soc. Am. 1985, 75, 1135–1154. [Google Scholar] [CrossRef]
- Bagnardi, M.; Hooper, A.J. GBIS (Geodetic Bayesian Inversion Software): Rapid Inversion of InSAR and GNSS Data to Estimate Surface Deformation Source Parameters and Uncertainties. In Proceedings of the AGU Fall Meeting, New Orleans, LA, USA, 11–15 December 2017. [Google Scholar]
- Metropolis, N.; Rosenbluth, A.W.; Rosenbluth, M.N.; Teller, A.H.; Teller, E. Equation of State Calculations by Fast Computing Machines. J. Chem. Phys. 1953, 21, 1087–1092. [Google Scholar] [CrossRef]
- Zheng, A.; Yu, X.; Xu, W.; Chen, X.; Zhang, W. A Hybrid Source Mechanism of the 2017 Mw 6.5 Jiuzhaigou Earthquake Revealed by the Joint Inversion of Strong-Motion, Teleseismic and InSAR Data. Tectonophysics 2020, 789, 228538. [Google Scholar] [CrossRef]
- Olson, A.H.; Apsel, R.J. Finite Faults and Inverse Theory with Applications to the 1979 Imperial Valley Earthquake. Bull. Seismol. Soc. Am. 1982, 72, 1969–2001. [Google Scholar] [CrossRef]
- Hartzell, S.H.; Heaton, T.H. Inversion of Strong Ground Motion and Teleseismic Waveform Data for the Fault Rupture History of the 1979 Imperial Valley, California, Earthquake. Bull. Seismol. Soc. Am. 1983, 73, 1553–1583. [Google Scholar] [CrossRef]
- Sekiguchi, H. Fault Geometry at the Rupture Termination of the 1995 Hyogo-Ken Nanbu Earthquake. Bull. Seismol. Soc. Am. 2000, 90, 117–133. [Google Scholar] [CrossRef]
- Aki, K.; Richards, P. Quantitative Seismology; University Science Books: New York, NY, USA, 2002. [Google Scholar]
- Akaike, H. Likelihood and the Bayes Procedure. Trab. Estada Investig. Oper. 1980, 31, 143–166. [Google Scholar] [CrossRef]
- Lawson, C.L.; Hanson, R.J. Solving Least Squares Problems; Prentice-Hall: Englewood Cliffs, NJ, USA, 1974; Available online: https://epubs.siam.org/doi/pdf/10.1137/1.9781611971217.bm (accessed on 5 July 2025).
- Stein, R.S. The Role of Stress Transfer in Earthquake Occurrence. Nature 1999, 402, 605–609. [Google Scholar] [CrossRef]
- Stein, R.S.; King, G.C.P.; Lin, J. Change in Failure Stress on the Southern San Andreas Fault System Caused by the 1992 Magnitude = 7.4 Landers Earthquake. Science 1992, 258, 1328–1332. [Google Scholar] [CrossRef]
- King, G.C.P.; Stein, R.S.; Lin, J. Static Stress Changes and the Triggering of Earthquakes. Bull. Seismol. Soc. Am. 1994, 84, 935–953. [Google Scholar]
- Toda, S.; Stein, R.S.; Sevilgen, V.; Lin, J. Coulomb 3.3 Graphic-Rich Deformation and Stress-Change Software for Earthquake, Tectonic, and Volcano Research and Teaching—User Guide. U.S. Geological Survey Open-File Report; U.S. Geological Survey: Reston, VA, USA, 2011. [Google Scholar]
- Lakhouidsi, K.; Fadil, A.; Tahayt, A.; Soulaimani, A. Present-Day Kinematics of the Northwest Moroccan Atlantic Margin from GNSS Data: West Southwest Extrusion at the Western End of the High Atlas. Can. J. Earth Sci. 2024, 61, 586–596. [Google Scholar] [CrossRef]
- García-Armenteros, J.A. Topo-Iberia CGPS Network: A New 3D Crustal Velocity Field in the Iberian Peninsula and Morocco Based on 11 Years (2008–2019). GPS Solut. 2023, 27, 155. [Google Scholar] [CrossRef]
- Ait Brahim, L.; Chotin, P.; Hinaj, S.; Abdelouafi, A.; El Adraoui, A.; Nakcha, C.; Dhont, D.; Charroud, M.; Sossey Alaoui, F.; Amrhar, M.; et al. Paleostress Evolution in the Moroccan African Margin from Triassic to Present. Tectonophysics 2002, 357, 187–205. [Google Scholar] [CrossRef]
- Koulali, A.; Ouazar, D.; Tahayt, A.; King, R.W.; Vernant, P.; Reilinger, R.E.; McClusky, S.; Mourabit, T.; Davila, J.M.; Amraoui, N. New GPS Constraints on Active Deformation along the Africa–Iberia Plate Boundary. Earth Planet. Sci. Lett. 2011, 308, 211–217. [Google Scholar] [CrossRef]
Disclaimer/Publisher’s Note: The statements, opinions and data contained in all publications are solely those of the individual author(s) and contributor(s) and not of MDPI and/or the editor(s). MDPI and/or the editor(s) disclaim responsibility for any injury to people or property resulting from any ideas, methods, instructions or products referred to in the content. |
© 2025 by the authors. Licensee MDPI, Basel, Switzerland. This article is an open access article distributed under the terms and conditions of the Creative Commons Attribution (CC BY) license (https://creativecommons.org/licenses/by/4.0/).