Article

Spatial–Temporal Characteristics and Drivers of Summer Extreme Precipitation in the Poyang Lake City Group (PLCG) from 1971 to 2022

1
School of Surveying and Geoinformation Engineering, East China University of Technology, Nanchang 330013, China
2
Key Laboratory of Mine Environmental Monitoring and Improving around Poyang Lake, Ministry of Natural Resources, Nanchang 330013, China
3
Jiangxi Key Laboratory of Watershed Ecological Process and Information, East China University of Technology, Nanchang 330013, China
4
Jiangxi Province Engineering Research Center of Surveying, Mapping and Geographic Information, Nanchang 330025, China
*
Author to whom correspondence should be addressed.
Remote Sens. 2025, 17(16), 2915; https://doi.org/10.3390/rs17162915
Submission received: 25 July 2025 / Revised: 18 August 2025 / Accepted: 18 August 2025 / Published: 21 August 2025

Abstract

Global warming has intensified the hydrological cycle, resulting in more frequent extreme precipitation events and altered spatiotemporal precipitation patterns in urban areas, thereby increasing the risk of urban flooding and threatening socio-economic and ecological security. This study investigates the characteristics of summer extreme precipitation in the Poyang Lake City Group (PLCG) from 1971 to 2022, utilizing the China Daily Precipitation Dataset and NCEP/NCAR reanalysis data. Nine extreme precipitation indices were examined through linear trend analysis, Mann–Kendall tests, wavelet transforms, and correlation methods to quantify trends, periodicity, and atmospheric drivers. The key findings include: (1) All indices exhibited increasing trends, with RX1Day and R95p exhibiting significant rises (p < 0.05). PRCPTOT, R20, and SDII also increased, indicating heightened precipitation intensity and frequency. (2) R50, RX1Day, and SDII demonstrated east-high-to-west-low spatial gradients, whereas PRCPTOT and R20 peaked in the eastern and western PLCG. More than over 88% of stations recorded rising trends in PRCPTOT and R95p. (3) Abrupt changes occurred during 1993–2009 for PRCPTOT, R50, and SDII. Wavelet analysis revealed dominant periodicities of 26–39 years, linked to atmospheric oscillations. (4) Strong subtropical highs, moisture convergence, and negative OLR anomalies were closely associated with extreme precipitation. Warmer SSTs in the eastern equatorial Pacific amplified precipitation in preceding seasons. This study provides a scientific basis for flood prevention and climate adaptation in the PLCG and highlighting the region’s vulnerability to monsoonal shifts under global warming.

1. Introduction

From 2011 to 2020, the global surface temperature was 1.1 °C higher than the average for the period from 1850 to 1900 [1]. This warming has significantly altered the hydrological cycle through increased atmospheric moisture, consistent with the Clausius–Clapeyron relationship that governs temperature–vapor pressure dynamics. The resulting moisture increase intensifies the hydrological cycle while modifying spatiotemporal precipitation patterns, leading to more frequent and severe extreme precipitation events [2,3,4,5,6]. These precipitation extremes have correspondingly elevated risks of associated natural disasters, including flash floods, landslides, and mudslides [7,8,9]. Given their profound impacts on society, economic stability, and human safety, such events have emerged as a major global concern [10]. Consequently, in-depth research into the spatiotemporal characteristics and underlying drivers of extreme precipitation is essential for disaster prevention, mitigation, and water resource planning, making it of both theoretical and practical importance.
The increasing frequency of extreme precipitation events is driven not only by global climate warming but also modulated by regional factors. Topography, urbanization, and monsoonal circulation collectively influence the intensity and distribution of these events [11,12]. In recent years, scholars have made significant progress in investigating the spatiotemporal characteristics of extreme precipitation. An increasing number of studies have confirmed a global intensification of extreme precipitation events over the past few decades [13], making their evolving patterns a central focus for meteorologists. Donat et al. [14] reported that the overall increases in extreme precipitation across both arid and humid regions. In the contiguous United States, extreme precipitation trends exhibit stronger increases during warm seasons compared to cold seasons, with a pronounced east–west spatial gradient [15]. Cheng et al. [16], focusing on Shaanxi Province, identified a significant upward trend since 1976, highlighting regional variability. Wu et al. [17] found Hurst values exceeding 0.5 for all extreme indices, indicating elevated flood risk. Mechanistically, Dong et al. [18] employed coupled models to demonstrate that CO2-induced warming substantially contributes to increases in extreme precipitation events. Zhang et al. [19] found that warmer winters in Heilongjiang Province result in more frequent precipitation anomalies; meanwhile, in Italy, a Mediterranean country, extreme precipitation displays strong seasonal fluctuations [20], underscoring the influence of climatic systems. Shi et al. [21], using standardized precipitation indices, confirmed notable increases in both frequency and intensity of extreme events in eastern China, especially in central and southern regions.
While these studies consistently report upward trends, they differ in spatial focus, temporal coverage, and methodologies—from statistical indices to climate model simulations—highlighting the necessity for comparative analyses that integrate regional patterns with underlying physical mechanisms. In China, for instance, summer extreme precipitation is primarily modulated by the interplay of atmospheric circulation patterns, anomalous summer monsoons, the western Pacific subtropical high (WPSH), and sea surface temperature anomalies [22]. Intensification of the Pacific Decadal Oscillation (PDO) is associated with an increase in the extreme precipitation events in southern China [23]. Regional variations in atmospheric circulation contribute to significant spatiotemporal differences in extreme precipitation [24]. The WPSH is a crucial circulation system affecting weather and climate in East Asia [25]. When the WPSH strengthens and shifts westward, an anomalous anticyclone forms and controls the coastal regions of East Asia south of 30°N, continuously transporting moisture from the northwest Pacific and the Southern Hemisphere to the middle and lower reaches of the Yangtze River. This leads to the development of a water vapor flux convergence zone, resulting in heavy rainfall over the Yangtze River Basin [26,27]. Summer precipitation in eastern China is primarily influenced by the East Asian summer monsoon, which transports abundant moisture from the tropical western Pacific, the Bay of Bengal, South China Sea, and the North Atlantic, contributing significant rainfall in the monsoon region of China [28]. Positive sea surface temperature anomalies in the tropical Indian Ocean during the preceding winter, coupled with a southward shift and strengthening of the South Asian monsoon and the WPSH, have been linked to an increased frequency of extreme precipitation events in the eastern part of southwest China [29]. In summary, existing research has primarily focused on the spatiotemporal evolution and driving mechanisms of large-scale extreme precipitation, and they collectively demonstrate that the extreme precipitation trends exhibit strong regional heterogeneity despite global consistency in overall intensification.
In recent years, China has witnessed an alarming rise in extreme precipitation events, which calls for urgent attention [30]. China’s eastern regions, located near the Pacific Ocean and in the eastern part of the Eurasian continent, are heavily influenced by summer monsoons, resulting in frequent rainfall during the summer months [31,32]. However, due to regional geographical differences, the variability of extreme precipitation differs markedly across regions [33]. Therefore, investigating the spatiotemporal characteristics of extreme precipitation at localized scales allows for more precise identification of trends and patterns, thereby providing valuable decision-making support for regional flood prevention, disaster mitigation, and scientific water resource management [34].
Poyang Lake, the largest freshwater lake in China, is located in northern Jiangxi Province on the southern bank of the middle and lower reaches of the Yangtze River. It is formed by the confluence of the Yangtze River and five major tributaries [35]. Li and Hu [34] found that extreme precipitation in the Poyang Lake basin intensified over the past 50 years, especially before the late 1990s, with high spatial variability and elevated flood risks in the northeast and east, largely influenced by topography. Zhang et al. [35] noted that, from 1984 to 2020, extreme precipitation events increased in frequency, intensity, and spatial extent, particularly in the northeast. This has led to greater exposure of the population and GDP to climatic and economic changes, although economic vulnerability has decreased due to improved disaster mitigation efforts. Li et al. [36] demonstrated that the timing of extreme precipitation and peak flows in the Poyang Lake basin have been delayed since 1960. This delay is projected to intensify through 2099, exacerbating flood risks by raising water levels, prolonging flood duration, and complicating future flood control efforts. Deng et al. [37] showed that extreme precipitation, particularly in the northern, central, and northeastern regions of the Poyang Lake Basin, is increasing. Compound widespread and persistent events are becoming longer in duration, more intense, and exhibit distinct moisture dynamics driven by northern and southwestern sources, which are raising flood risks. Zhang et al. [38] found that analysis of 1957–2011 climate data in the Poyang Lake Basin indicates pronounced northern-dominated warming (reduced cold extremes), intensification of seasonal precipitation extremes (in winter and summer), and a >3-month lagged impact of the ENSO on convective rainfall patterns. However, these studies primarily focus on the Poyang Lake basin as a whole, without addressing the unique characteristics of extreme precipitation at the Poyang Lake City Group (PLCG) scale. Given the varying local topographies, socio-economic factors, and urbanization patterns within the PLCG, a more localized analysis could provide a clearer understanding of the spatial and temporal characteristics and drivers of summer extreme precipitation in this region. Therefore, understanding extreme precipitation patterns at the PLCG scale is crucial for designing targeted climate adaptation strategies.
To address this gap, this study focuses on extreme precipitation in the PLCG, employing a comprehensive methodological framework integrating trend analysis, wavelet analysis, and other detection techniques, based on daily precipitation data from China obtained from the National Tibetan Plateau Data Center and NCEP/NCAR datasets. By analyzing nine extreme precipitation indices, this study systematically reveals the spatiotemporal characteristics and dynamic evolution patterns of summer extreme precipitation in the PLCG and these findings will help improve the accuracy and predictive capability of regional climate models and provide a scientific basis for government agencies and stakeholders to devise policies and measures addressing climate change.
The remainder of this paper is organized as follows: Section 2 introduces the study area and data sources; Section 3 presents the theoretical background of the methods; Section 4 reports the experimental results and analysis; and Section 5 concludes this paper.

2. Study Area and Data Sources

2.1. Study Area

The Poyang Lake City Group (PLCG), situated between 26°14′48″N and 30°04′41″N latitude and 113°34′36″E to 118°28′58″E longitude, occupies the northern part of Jiangxi Province. The study area encompasses multiple administrative regions, including the cities of Nanchang, Jiujiang, Shangrao, Jingdezhen, Xinyu, Pingxiang, Yichun, and Yingtan, as well as the counties of Jinxi, Chongren, Dongxiang, and the administrative district of Fuzhou City. The total area of the study region spans 92,300 square kilometers. Covering a total area of approximately 92,300 square kilometers, the PLCG had a population of approximately 36.43 million and a gross domestic product (GDP) of RMB 2.13 trillion (approximately USD 307 billion) in 2019. The region experiences a subtropical humid monsoon climate, with annual precipitation ranging from 1433 mm to 2105 mm. It is characterized by abundant sunshine, significant rainfall, hot and rainy summers, and mild, humid winters. The terrain primarily consists of hills and plains, with forested areas being the primary land cover.

2.2. Data Sources

The data used in this study and their sources are summarized as follows:
(1) Precipitation observations in this study were obtained from the CHM_PRE dataset, also known as the China Day-by-Day Precipitation Dataset (1961–2022), provided by the National Tibetan Plateau Science Data Center (spatial resolutions of 0.1°, 0.25°, and 0.5°) (http://data.tpdc.ac.cn) [39]. The dataset is compiled from daily precipitation records collected at 2,839 stations across China and its surrounding areas (18°N–54°N, 72°E–136°E) from 1961 to 2022. To enhance data accuracy, the CHM_PRE dataset incorporates monthly precipitation controls and adjustments for topographic features, improving upon traditional dataset construction methods. Its accuracy has been validated by interpolating daily precipitation from approximately 40,000 intensive observation sites in China during 2015–2019. After comparing eight different interpolation schemes, the optimal method was selected for dataset construction, enabling effective representation of spatial precipitation variability. In this study, weather stations with more than 30 days of missing data were excluded. Ultimately, daily precipitation data from 36 stations within the PLCG for the period June to August, 1971–2022, with a spatial resolution of 0.5° × 0.5°, were employed, as shown in Figure 1.
(2) The atmospheric circulation background was analyzed using NCEP-NCAR reanalysis data (https://psl.noaa.gov/data/index.html (accessed on 18 November 2024)). This included monthly geopotential height, specific humidity, and horizontal wind components (u and v) at 500 hPa and 850 hPa levels with a spatial resolution of 2.5° × 2.5°, monthly outgoing longwave radiation (OLR) data with a spatial resolution of 2.5° × 2.5°, and monthly sea surface temperature (SST) data at 1° × 1° resolution were also utilized. The selected climatological period selected for analysis covers from 1981 to 2010, while the OLR data extends from 1974 to 2022.
(3) To further analyze the factors influencing extreme precipitation in the PLCG, ten atmospheric circulation indices were selected. The indices and their corresponding source websites are listed in Table 1.
(4) The digital elevation model (DEM) raster data are obtained from ALOS topographic data with a spatial resolution of 12 m.

3. Methodology

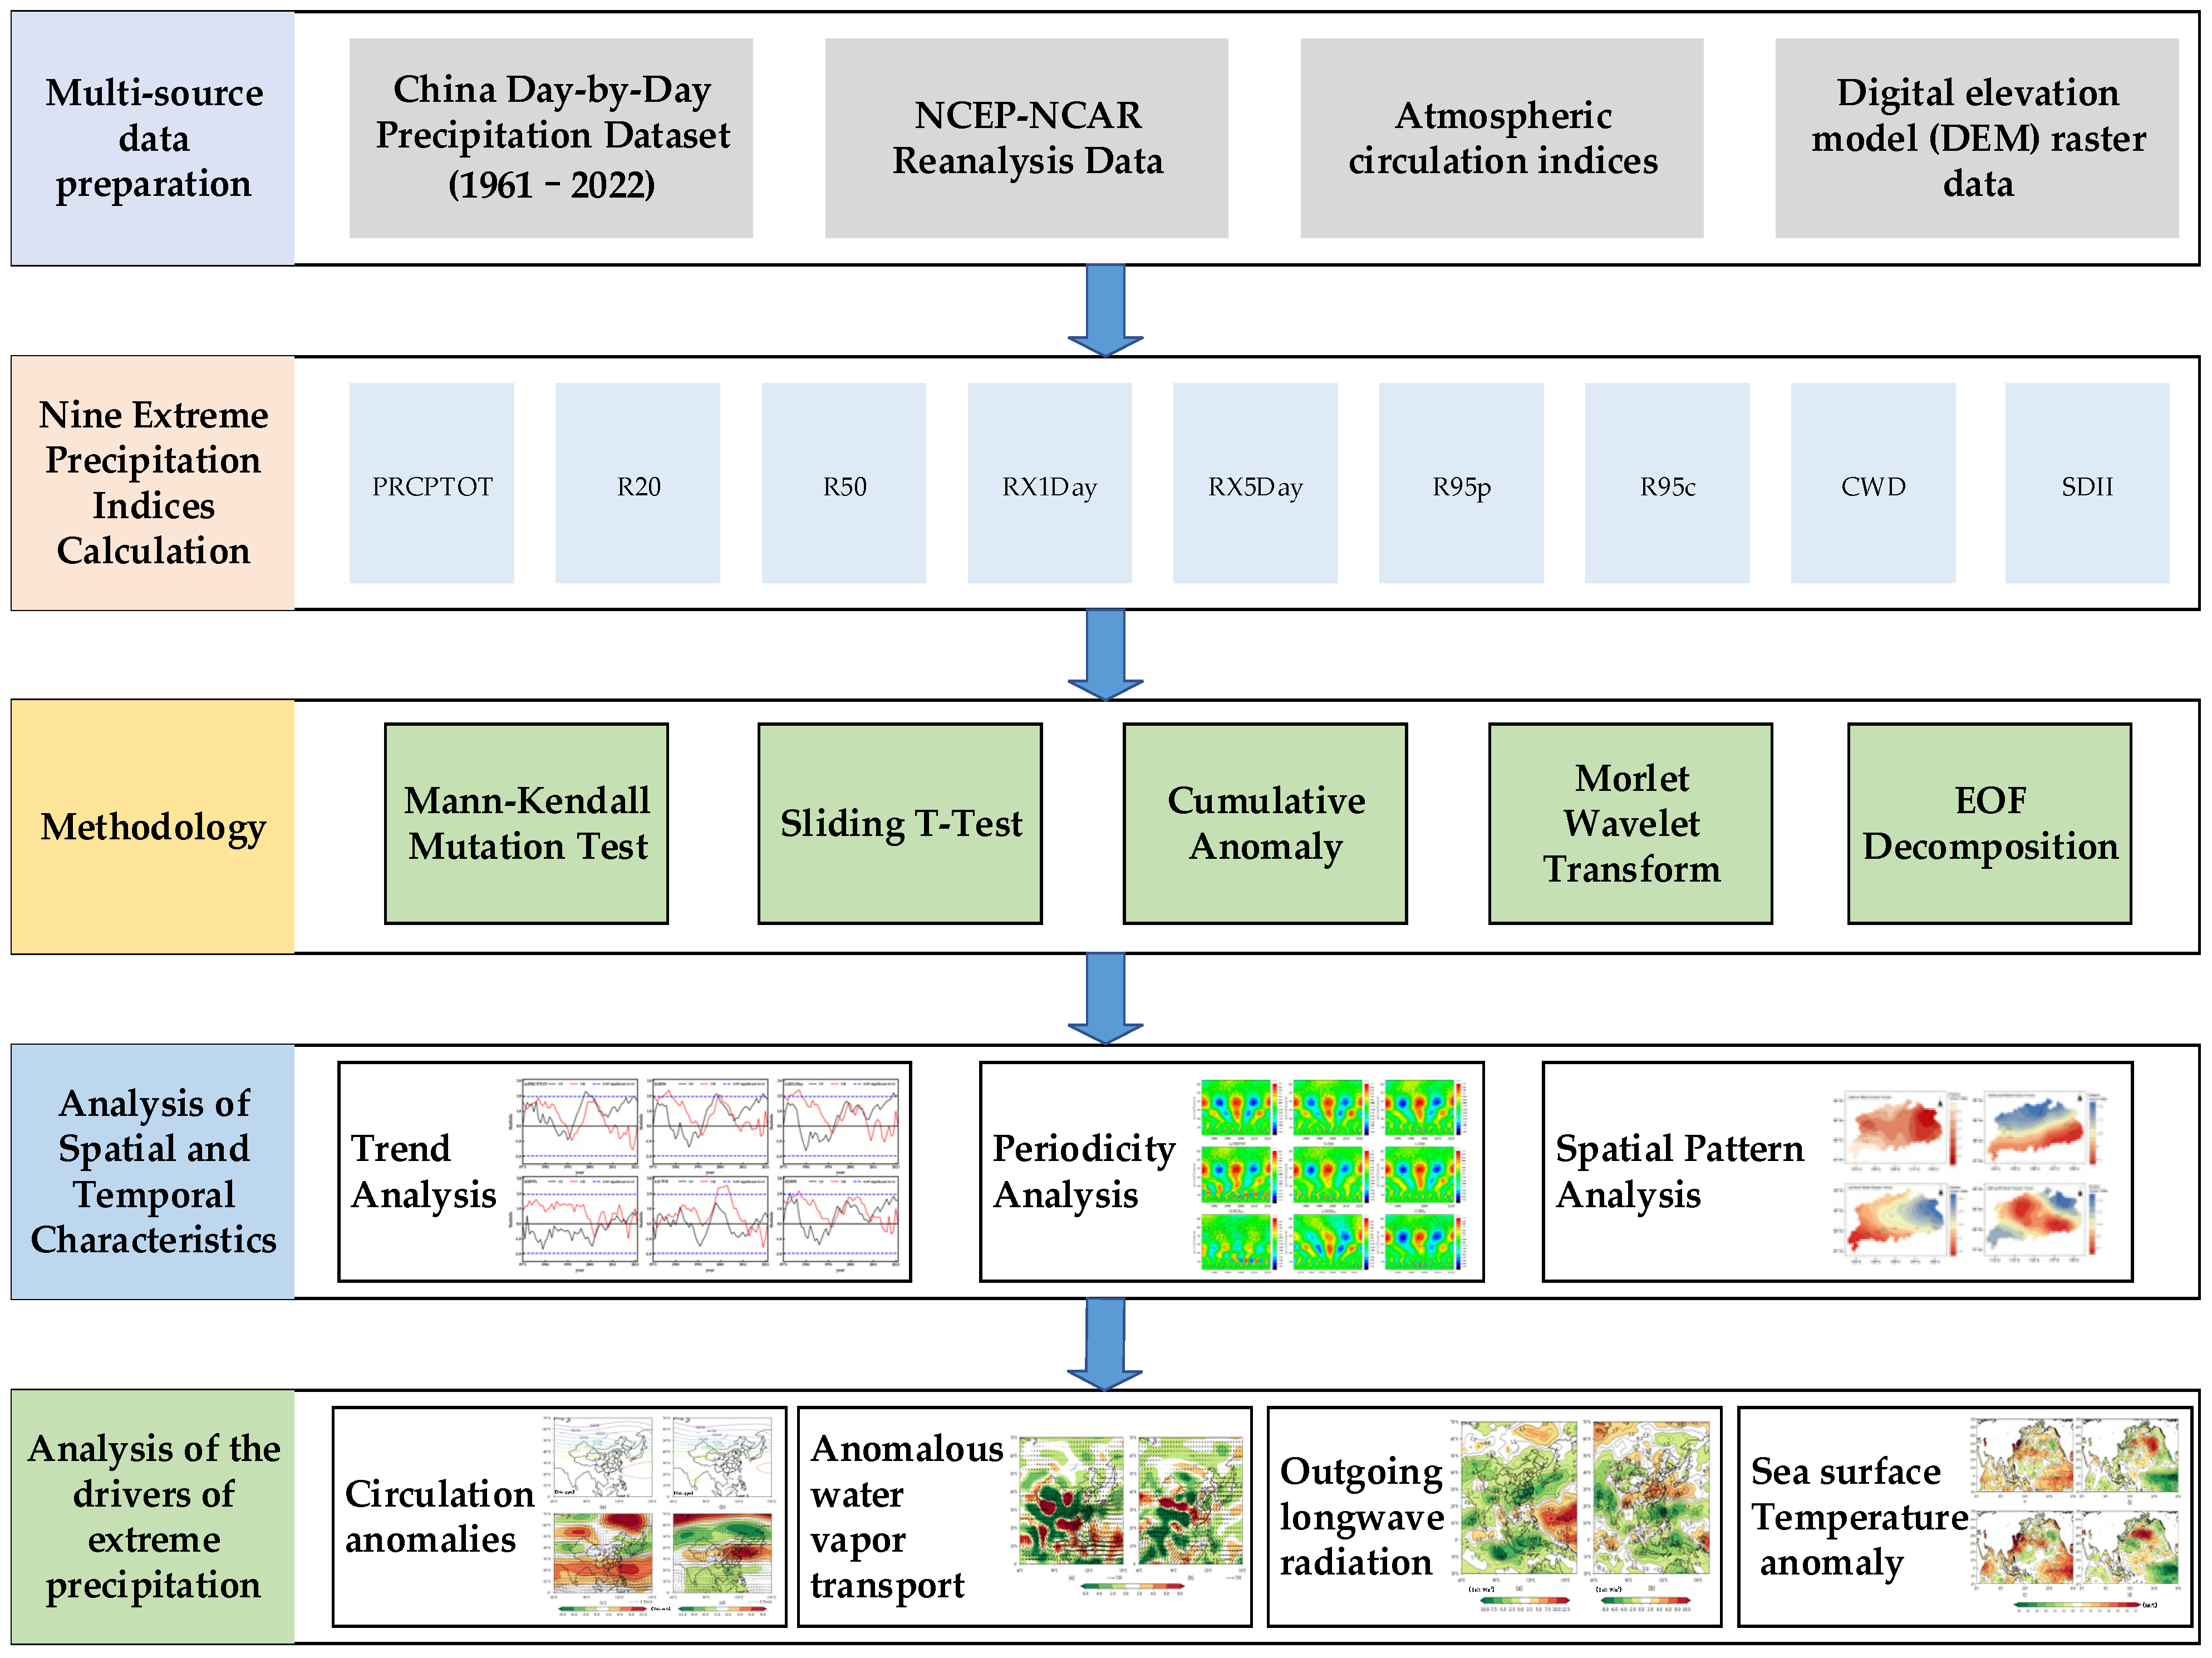
This study investigates the spatiotemporal characteristics and drivers of summer extreme precipitation in the Poyang Lake City Group (PLCG) using an integrated statistical and dynamic diagnostic approach. The methodology involves: (1) multi-source data preparation (precipitation, reanalysis, circulation indices, and DEM); (2) calculation of nine ETCCDMI extreme precipitation indices; (3) spatiotemporal analysis using the Mann–Kendall test, the sliding T-test, the cumulative anomaly method, and Morlet wavelet analysis; and (4) driver analysis through circulation diagnostics, correlation studies, and dynamic assessment of moisture transport, OLR, and SST anomalies using NCEP/NCAR reanalysis data. The framework of this study is shown as Figure 2.

3.1. The Extreme Precipitation Index

This study selected nine extreme precipitation indices from the Expert Team on Climate Change Detection Monitoring and Indices (ETCCDMI) [40], which characterize the frequency, intensity, and duration of extreme precipitation events in the PLCG region, as shown in Table 2. Daily precipitation data from 1971 to 2022 for each meteorological station were processed according to standardized ETCCDMI protocols.
For the calculation of the 95th percentile precipitation threshold (R95p), only wet days—defined as days with daily precipitation ≥ 1 mm—were considered. The 95th percentile threshold was calculated annually for each station using this subset of wet days. Subsequently, the R95p index was computed as the total precipitation on days exceeding the respective threshold. The R95t index represents the proportion of R95p relative to the annual total precipitation (PRCPTOT). All other extreme precipitation indices were calculated according to their respective ETCCDMI definitions, with the wet day threshold consistently set to 1 mm.

3.2. The Empirical Orthogonal Function (EOF)

The principle of Empirical Orthogonal Function (EOF) [41] decomposition is to extract the dominant modes of spatiotemporal variability from a variable field. EOF analysis is commonly used to analyze meteorological field datasets. In this study, the climate variable field X is represented as a matrix of n observations of meteorological elements at m spatial points, as shown in Equation (1):
X = x 11 x 1 n x m 1 x m n
Breaking down X into time function matrix Z and space function matrix V, such that and Z and V are orthogonal functions, as shown in Equations (2)–(6):
X = V Z
X X T = V Z Z T V T = V Λ V T
Z Z T = Λ
V T V = V V T = I
Let the covariance matrix S be defined as Equation (6):
S = 1 n X X T
Let S be a full-rank matrix. Then, the eigenvectors corresponding to p eigenvalues (λ1λ2 ≥ λ3 ≥ … ≥ λp) are principal components. The variance contribution rate of the p-th principal component is defined as Equation (7):
R k = λ k i = 1 p λ i
When λj+1 satisfies λjλj+1ej, the error range of the eigenvalue λj is defined as Equation (8):
e j = λ j 2 n 1 2
where n is the sample size, this Empirical Orthogonal Function is meaningful.

3.3. The Mann–Kendall Mutation Test

The Mann–Kendall mutation test method [42] is commonly used to identify abrupt changes in time series of variables such as such as precipitation, temperature, and air pressure. This method has the advantages of being applicable to non-normally distributed data and exhibiting robustness to outliers. Suppose the time series (x1, x2, …, xn) has a sample size of n. The rank statistic Sk is defined as Equation (9):
S k = i = 1 k r i , k = 2 , 3 , , n
among which ri is defined as Equation (10):
r i = 1 x i > x j 0 o t h e r , ( j = 1 , 2 , , i )
Sk is the cumulative value of sample xi > xj (1 ≤ ji). If the time series is random and independent, construct the statistical variable, as shown in Equations (11)–(13)
UF k = S k E ( S k ) var ( S k )   k = 1 , 2 , , n
E ( S k ) = k × ( k 1 ) 4
Var ( S k ) = k ( k 1 ) ( 2 k + 5 ) 72
According to the set significance level α, the normal distribution table is consulted to determine the critical value. If the test statistic exceeds this critical value, the change in the sequence is considered significant. Next, the time series of the variable is reversed, and the above procedure is repeated to obtain UBk = −UFk, k = n + 1 − k (k = 1, 2, …, n). When the forward curve UFk and backward curve UBk intersect within the confidence bounds, the point of the intersection indicates a potential change point (mutation) in the time series.

3.4. The Sliding T-Test

The sliding T-test [43] is a commonly used method for detecting significant differences in means between two groups of samples. Given a time series x with n data points, a specific moment is designated as the reference point. The sample sizes of the two subsequences, x1 and x2, before and after the reference point, are denoted as n1 and n2, respectively. The mutation statistic t is defined as Equations (14) and (15):
t = x 1 ¯ x 2 ¯ S × 1 n 1 + 1 n 2
among which:
S = n 1 s 1 2 n 2 s 2 2 n 1 + n 2 2
The degrees of freedom for the t-distribution corresponding to the statistic t are given by v = n1 + n2 − 2. Setting the significance level α, the critical value c is obtained from the t-distribution table. If the absolute value of the test statistic satisfies t < c , no mutation (change point) is detected in the climate sequence; otherwise, a mutation is considered to have occurred.

3.5. Cumulative Anomaly

The cumulative anomaly method [44] involves calculation the cumulative sum of anomalies from the mean at each time point t for a time series xi (t = 1, 2, …, n). This is expressed by Equation (16):
X = i = 1 t ( X i X ¯ )
By plotting a curve based on the accumulated anomalies from the mean at n time point, an upward trend in the curve indicates an increase in the cumulative anomaly value, while a downward trend suggests a decrease. The inflection point of the curve may represent a possible mutation point.

3.6. Morlet Wavelet Transform

The Morlet wavelet transform method [45] performs exceptionally well in processing non-stationary signals, particularly for time-frequency localization analysis of signals with nonlinear characteristics. It can precisely identify the temporal and frequency-domain locations of extreme precipitation events, making it widely applicable for periodic analysis of climatic and hydrological meteorological elements. For a precipitation time series function x t , the Morlet wavelet transform is defined as:
W a , b = 1 a x t ψ * t b a d t
where W a , b is the wavelet function, a is the scale factor determining the periodicity of the wavelet, b is the time shift factor controlling the temporal positioning of the wavelet, t represents time, and ψ * t is the complex conjugate of the mother wavelet function ψ t . The mother wavelet function is given by:
ψ t = e i w 0 t e t 2 2
Here, w 0 denotes the central frequency of the wavelet, and i is the imaginary unit. The graphical representation of the wavelet transform clearly reflects the periodic variations in the precipitation time series.

4. Results and Analysis

4.1. Analysis of Spatial and Temporal Characteristics

4.1.1. Analysis of Temporal Characteristics

This paper employed the MK trend test to analyze the trends in nine extreme precipitation indicators in the PLCG region from 1971 to 2022, revealing an overall upward trend in extreme precipitation, as shown in Figure 3. Specifically, RX1Day and R95p exhibit statistically significant increasing trends, with climate tendency rates of 3.29 mm/10 years and 8.65 days/10 years, respectively (p = 0.043 and p = 0.037, both less than 0.05). In contrast, the trends for PRCPTOT, R20, R50, RX5Day, R95c, CWD, and SDII show non-significant increases, with changes of 25.64 mm/10 years (p = 0.102), 0.37 days/10 years (p = 0.142), 0.19 days/10 years (p = 0.059), 5.21 mm/10 years (p = 0.167), 0.25%/10 years (p = 0.416), 0.2 days/10 years (p = 0.693), and 0.27 mm·day−1/10 years (p = 0.124), respectively. All significance tests were performed at the α = 0.05 level.
The increasing trends observed in PRCPTOT and CWD suggest an increase in the number of consecutive precipitation days, indicating a gradual rise in moisture levels over the PLCG region. The upward trends in R20 and R50 reflects in both the frequency and number of extreme precipitation days. Meanwhile, the rising trends in SDII, RX1Day, and R95p indicate a sustained intensification in both the amount and intensity of extreme precipitation events in the region.
The 5-year moving average curves for PRCPTOT, R20, R50, RX1Day, RX5Day, R95p, CWD, and SDII generally exhibited similar temporal variation patterns. These indices were above their multi-year average during the 1990s to 2000s and the 2010s, peaking primarily in the 1990s alongside increased precipitation levels. Notably, RX1Day displayed a double-peak pattern, with a secondary peak in the early 2020s. R95c also shows peak values during the 2000s and 2020s.
The multi-year averages for PRCPTOT, R20, R50, RX5Day, CWD, and SDII are 610.5 mm, 9.3 days, 2.2 days, 164.7 mm, 10.6 days, and 13.1 mm/day, respectively. Their respective maximum values occurred in 1998, reaching 1069.7 mm, 17.6 days, 6.4 days, 284.3 mm, 17.5 days, and 21.9 mm/day. The multi-year averages for RX1Day and R95p are 78.7 mm and 175.3 mm, respectively, with maximum values in 2020 of 113.8 mm and 277.6 mm. The multi-year average of R95c is 28.9%, with a peak of 34.7% in 1985. The minimum values for PRCPTOT, R20, R50, RX1Day, R95p, and SDII occurred in 1978, measuring 308.9 mm, 4.7 days, 0.3 days, 43.1 mm, 83.9 mm, and 8.9 mm/day, respectively.
In summary, from 1971 and 2022, the PLCG region experienced clear increasing trends in the intensity, frequency, and duration of duration of extreme precipitation events.

4.1.2. Spatial Characteristics Analysis

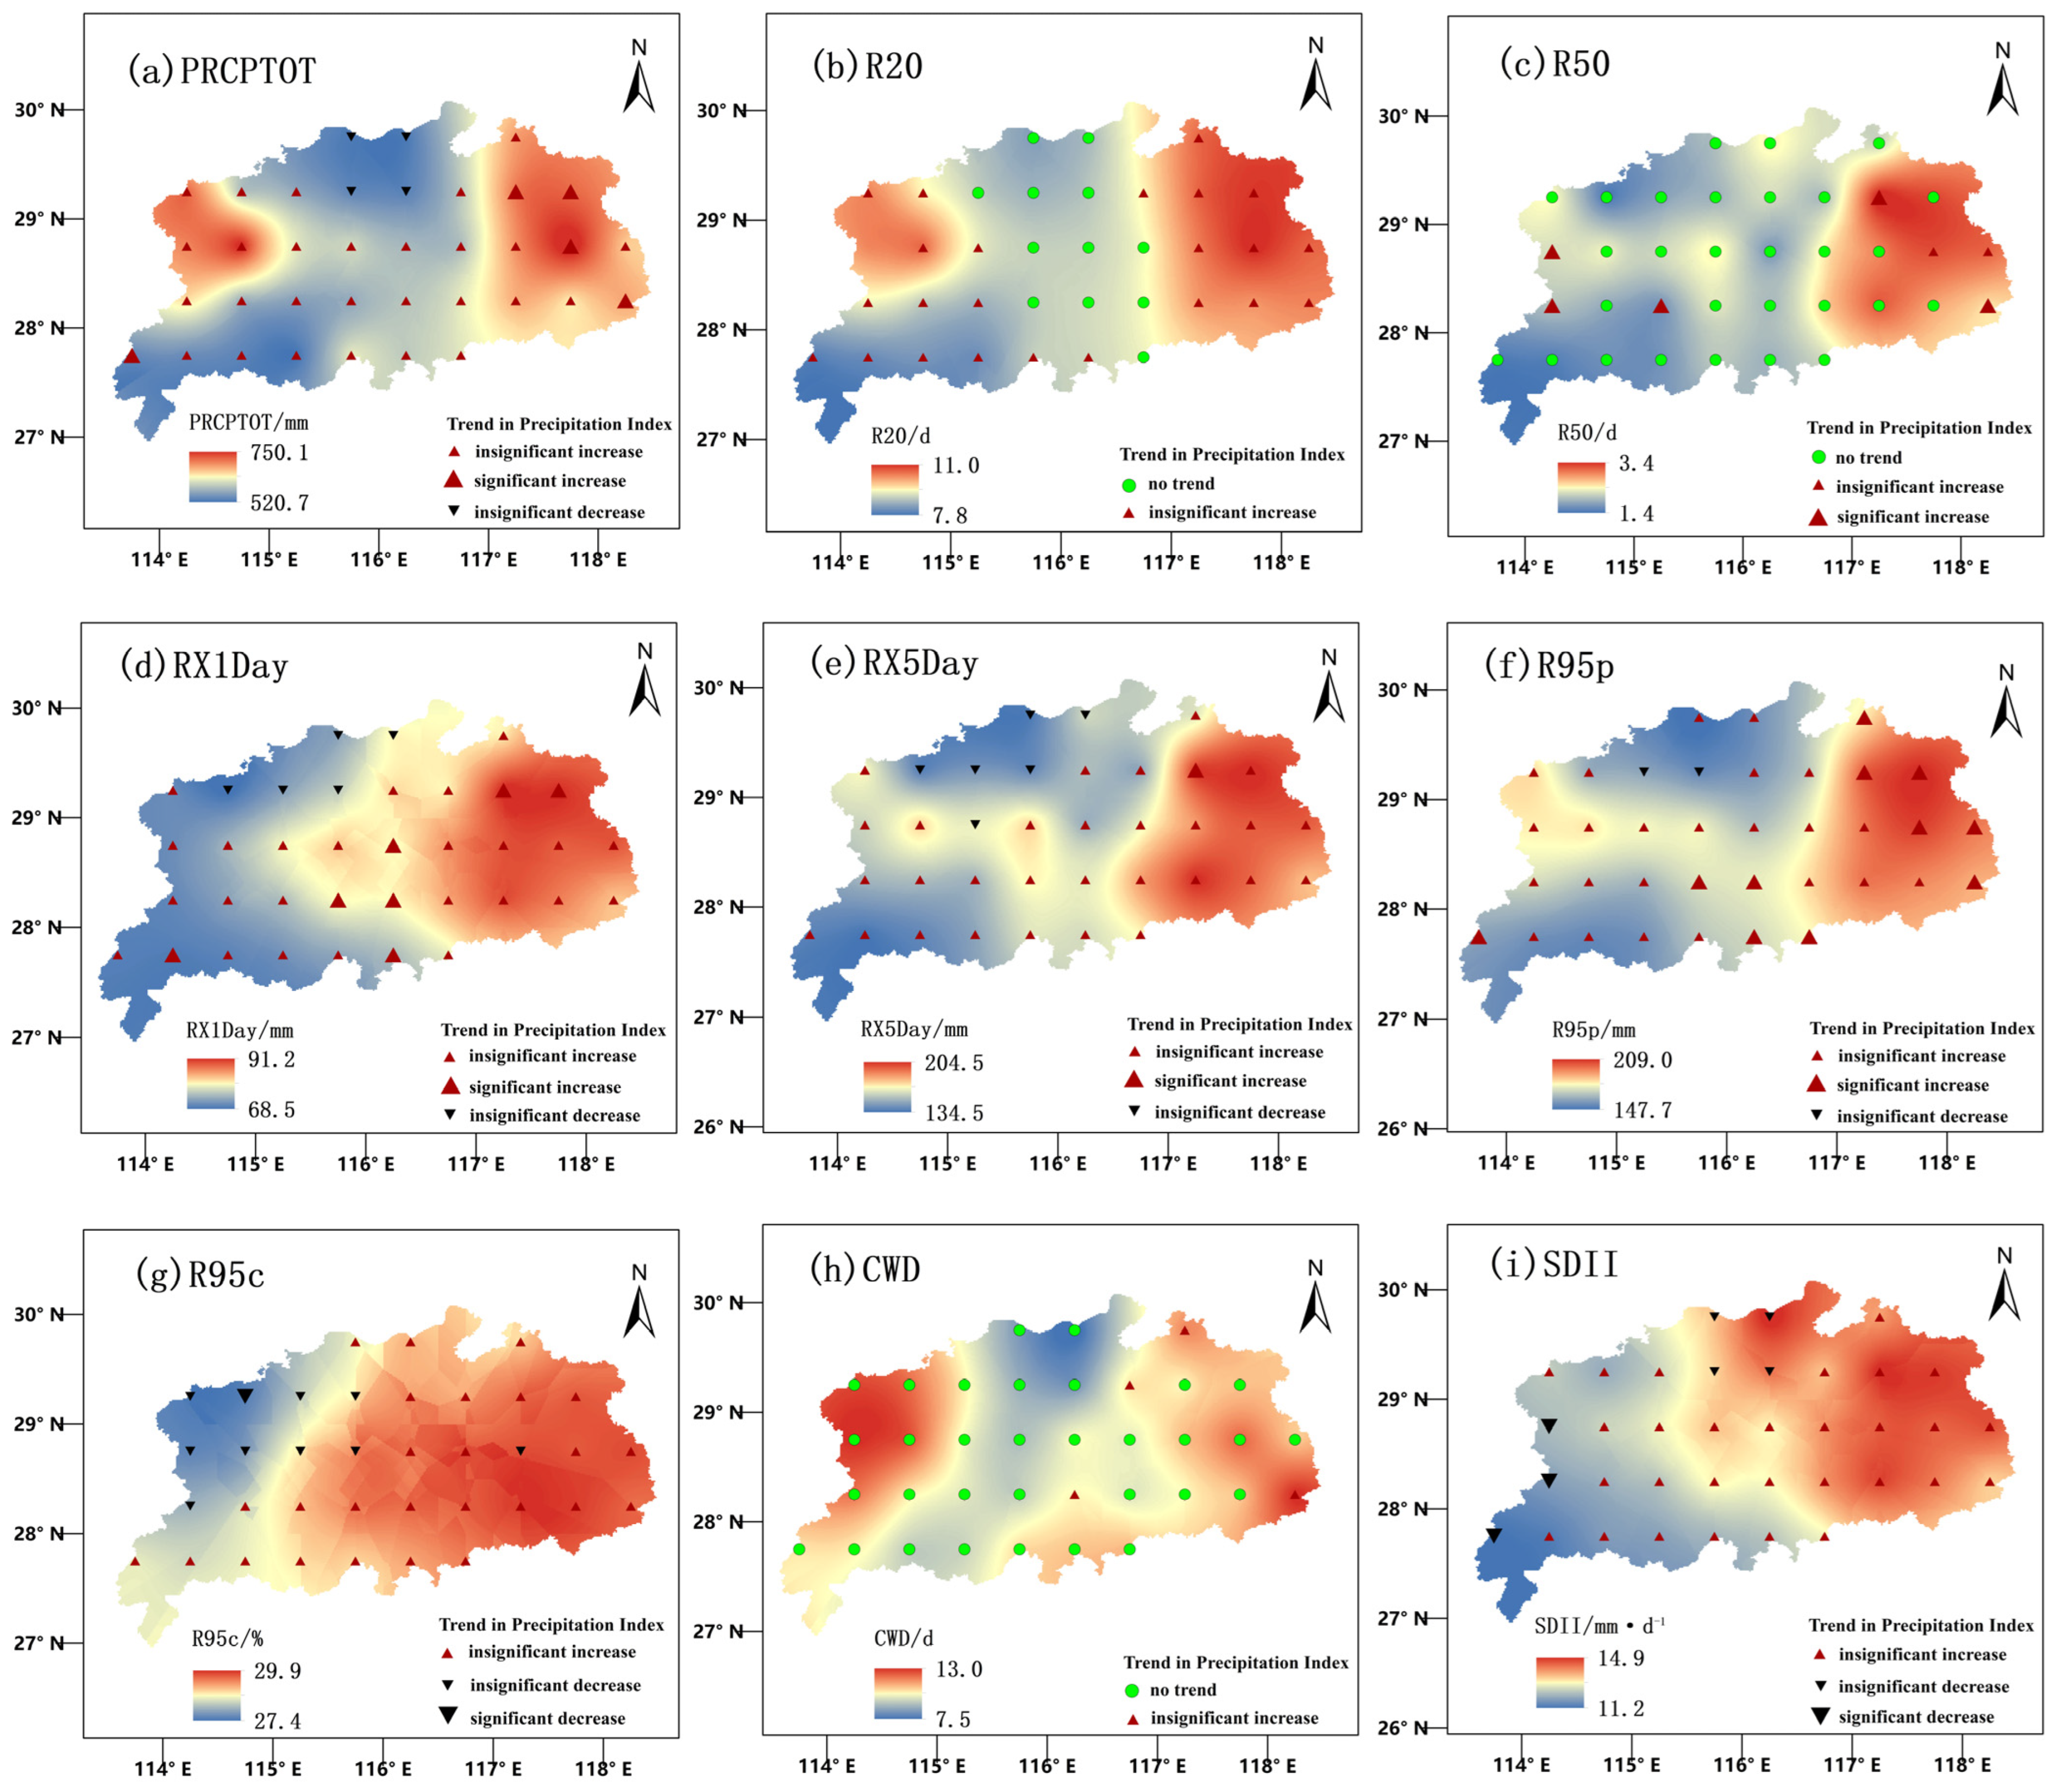
The spatial distribution and trend analysis of extreme precipitation indices in PLCG region as shown in Figure 4 reveal distinct patterns. Specifically, R50, RX1Day, RX5Day, R95p, R95c, and SDII exhibit higher values in eastern part of the region and lower values in the west, In contrast, PRCPTOT, R20, and CWD display a pattern characterized by higher values in both the eastern and western regions, with lower values in the central area.
PRCPTOT, representing cumulative annual precipitation, reaches a maximum value of 1524.66 mm. Its spatial distribution, along with that of R20, is similar, with high values concentrated in Yichun, Jiujiang, Jingdezhen, and Shangrao. Similarly, R50, RX1Day, RX5Day, and R95p share comparable spatial patterns, with elevated values primarily in Shangrao, Yingtan, and Jingdezhen. The R95c, which represents the contribution rate of extreme precipitation, shows high values in Nanchang, Shangrao, Yingtan, Jingdezhen, Jiujiang, Fuzhou, and Yingtan. CWD exhibits high values in Yichun, Jiujiang, and Shangrao, while SDII is notably high in in Jiujiang, Shangrao, Jingdezhen, and Yingtan.
These spatial distribution characteristics are closely related to the region’s geographical and climatic conditions. Higher values observed in the eastern regions, such as Shangrao, Jingdezhen, and Yingtan, can be attributed to their proximity to mountain ranges, where orographic lifting enhances precipitation. Furthermore, the influence of Poyang Lake and the associated lake–land breeze effects contribute to increased moisture convergence in surrounding areas, including Jiujiang and Nanchang. Urbanization in cities such as Nanchang and Jingdezhen could potentially intensify local convection and rainfall. Collectively, these factors shape the observed spatial heterogeneity in extreme precipitation indices.
Among the 36 stations in the study area, PRCPTOT and R95p represent heavy precipitation processes. PRCPTOT shows an increasing trend in 32 stations (88.9%), with upward trends observed across all areas of the PLCG except the northern part of Jiujiang. Similarly, R95p shows an increasing trend at 34 stations (94.4%) with 10 stations exhibiting statistically significant upward trend.
R20 and R50 represent the duration of extreme precipitation. R20 shows an upward trend in 24 stations (66.7%), whereas R50 shows an upward trend in only 7 stations (19.4%), including 5 stations with statistically significant upward trend.
RX1Day and RX5Day represent extreme heavy precipitation and the duration of strong precipitation, respectively. RX1Day exhibits an increasing trend in 31 stations (86.1%), whereas RX5Day shows an increasing trend in 30 stations (83.3%). However, decreasing trends for both RX1Day and RX5Day are observed in Jiujiang.
R95c shows an upward trend in 26 stations (72.2%), while 10 stations exhibit downward trends, including one station in Jiujiang with a significant decrease. CWD shows an increasing trend in four stations (11.1%) located in Nanchang, Shangrao, and Jingdezhen, while 32 stations show no significant trend. SDII increases at 32 stations (88.9%).
In summary, R50 and CWD largely show no significant trend. In contrast, PRCPTOT, R20, RX1Day, RX5Day, R95p, R95c, and SDII display increasing trends in most areas, indicating a likely rise in the frequency and intensity of extreme precipitation events in these regions. Notably, spatial heterogeneity exists in the trend changes in extreme precipitation indices within the PLCG, with some areas exhibiting statistically significant increases or decreases.

4.1.3. Mutation and Future Persistence Analysis

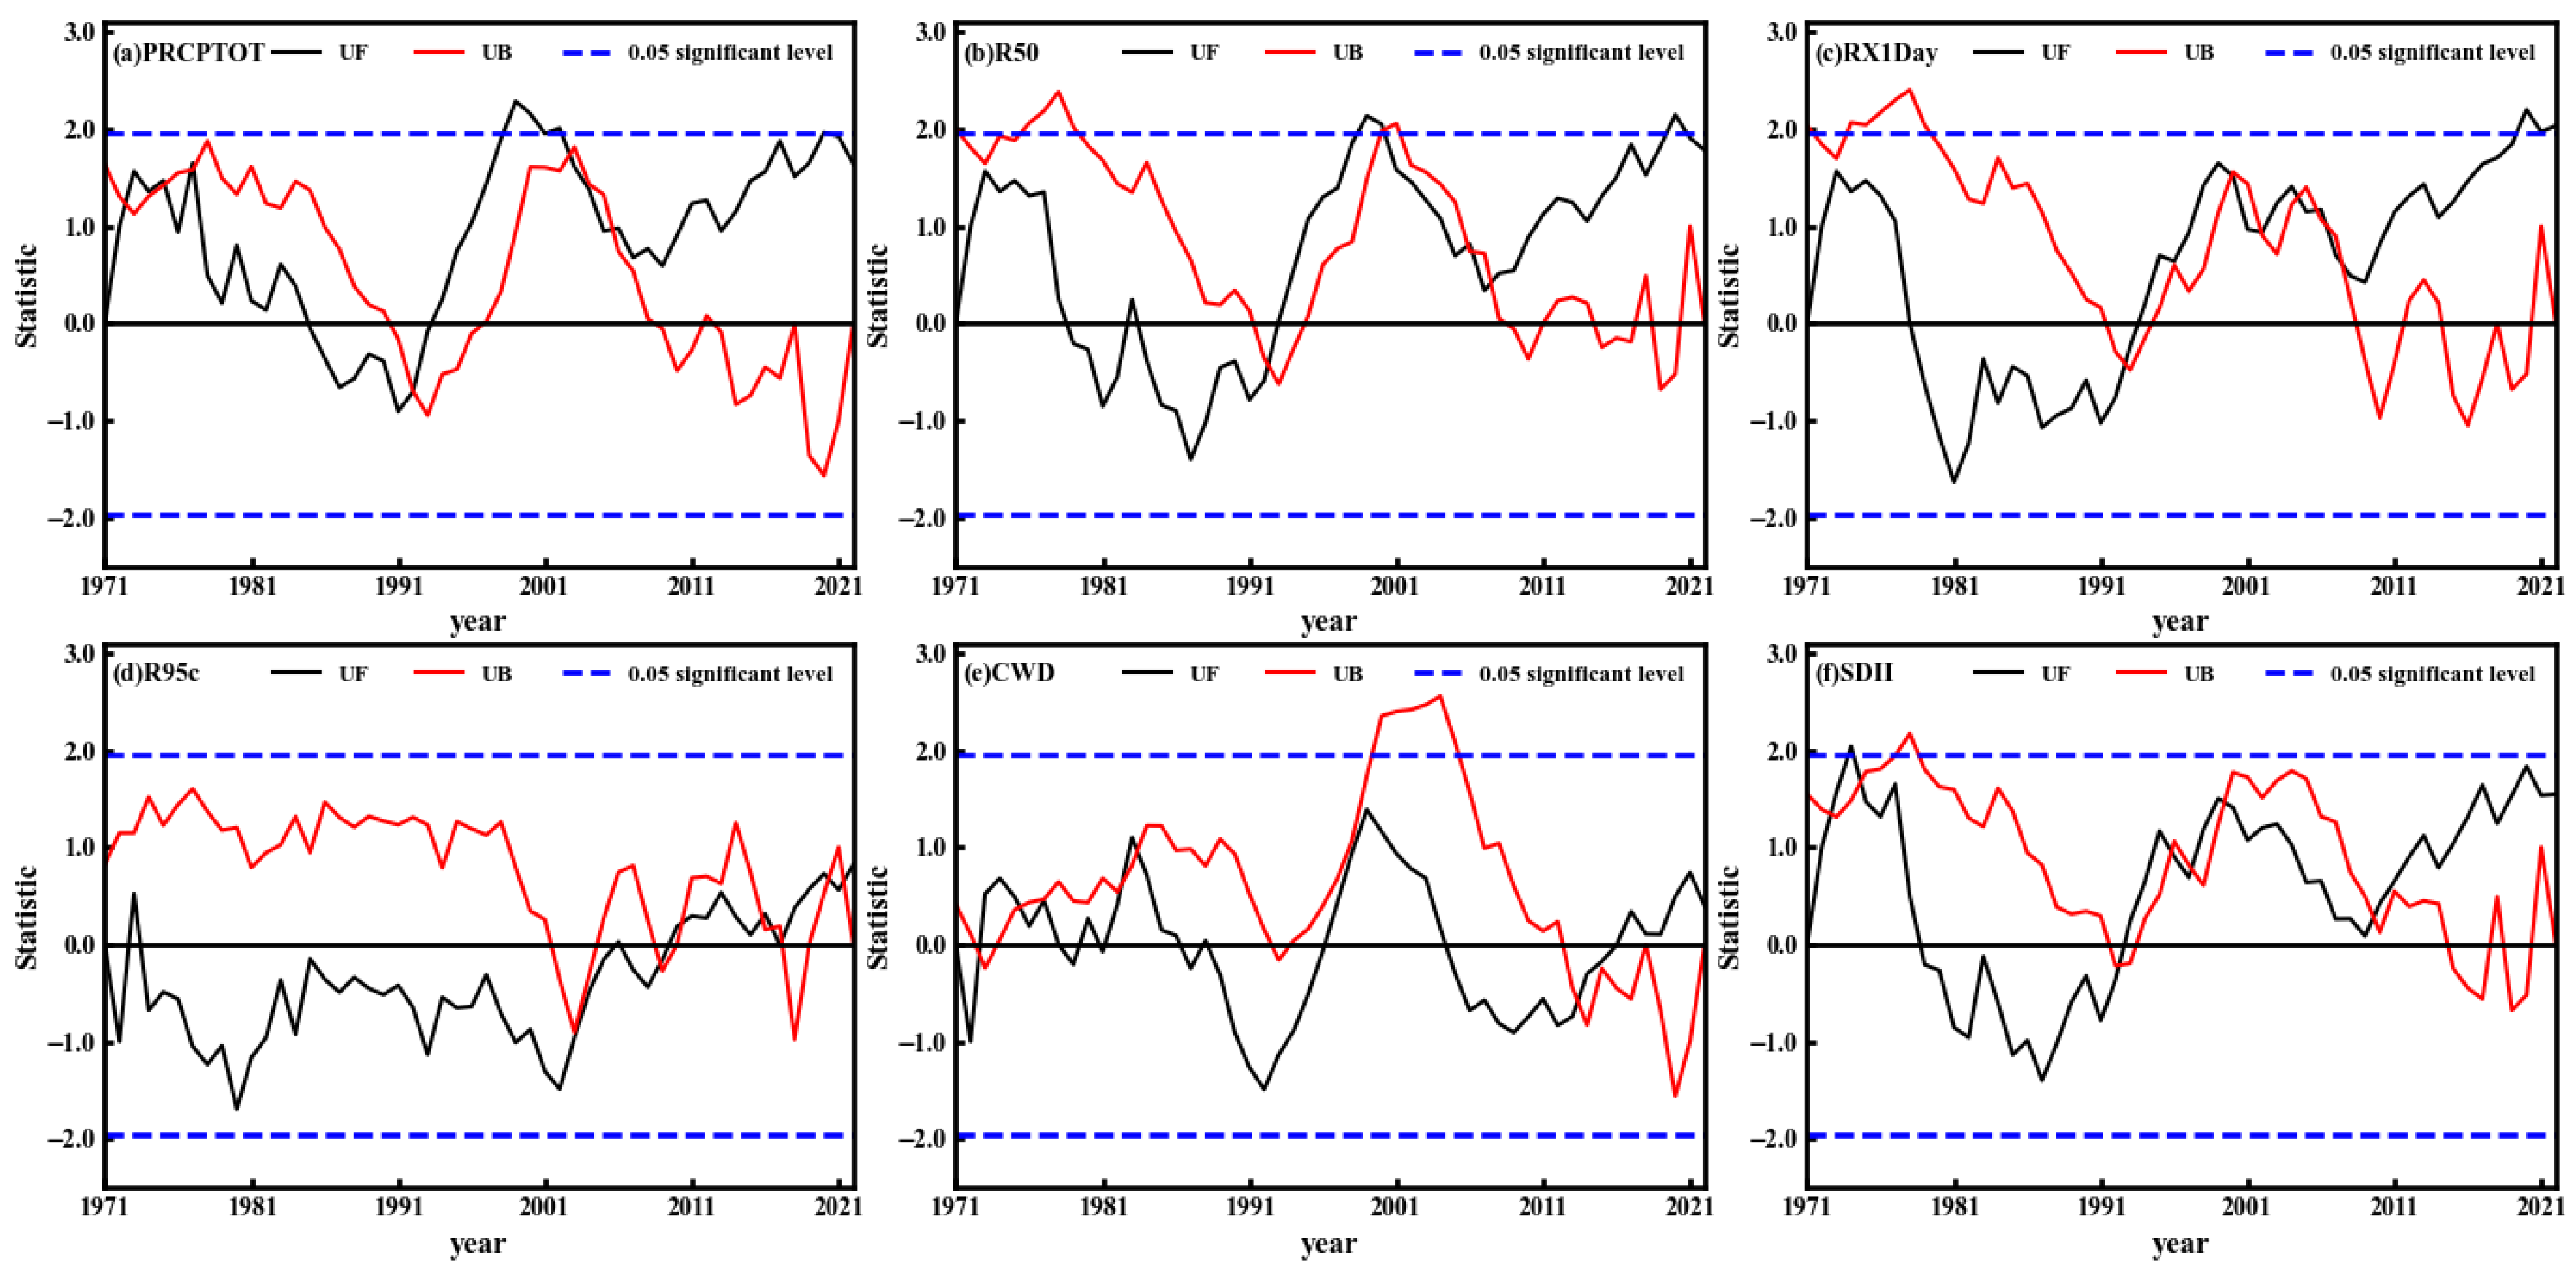
Between 1971 and 2022, the Mann–Kendall (M–K) mutation test was applied to six extreme precipitation indices in the PLCG, revealing significant mutations in PRCPTOT, R50, RX1Day, and SDII, as shown in Figure 5. PRCPTOT, R50, and CWD exhibited similar fluctuating patterns characterized by alternating periods of increase and decrease.
The UF curve for PRCPTOT showed a declining trend from 1971 to 1990, followed by a sharp increase from 1991 to 1999. It then declines between 2000 and 2008, and exhibited an upward trend after 2009. The UF curve for R50 fluctuated downward from 1971 to 1986, increased from 1987 to 1998, declined from 1999 to 2006, and rose again after 2007. The UF curve for CWD decreased from 1971 to 1991, increased from 1992 to 1998, decreased from 1999 to 2008, and showed slow growth after 2009. However, the UF curve for CWD did not exceed the critical value at the 0.05 significance level, indicating a non-significant mutation during this period.
RX1Day exhibited fluctuating declines from 1971 to 1993, followed by an increasing trend thereafter. R95c showed little fluctuation from 1971 to 2003 and began to increase with greater variation after 2003. However, neither the UF nor UB curves for R95c exceeded the critical value at the 0.05 significance level, indicating a non-significant mutation around 2003. SDII demonstrated fluctuating declines from 1971 to 1992, followed by an upward trend after 2009.
The results of the M–K mutation test reveal that extreme precipitation events in the PLCG region have undergone significant regime shifts over the past 52 years. Notable mutations were identified in PRCPTOT, R50, RX1Day, and SDII, with the majority of mutation points occurring during the early 1990s and after 2009. These shifts suggest an overall intensification and increased frequency of extreme precipitation in recent decades.
PRCPTOT, R50, and CWD exhibited similar oscillating patterns characterized by alternating periods of increase and decrease, potentially reflecting a coordinated response to regional climate variability or external forcing factors. Although CWD presented apparent fluctuations, its mutation did not reach statistical significance at the 0.05 level. Similarly, R95c remained relatively stable prior to 2003 and showed increased variability thereafter, but no statistically significant mutation was detected.
Collectively, these findings indicate a rising trend in extreme precipitation events in the PLCG region in recent years, highlighting substantial changes in regional hydrological and climatic conditions.
The R/S method was applied to analyze extreme precipitation indices in the PLCG, yielding corresponding H values, as shown in Table 3. The H values for all extreme precipitation indices are greater than 0.5, indicating different degrees of persistence and suggesting that future trends may continue following historical patterns.
Specifically, the H values for RX5Day and R95c range from 0.55 to 0.65, indicating relatively weaker persistence. The H values for R20, R50, RX1Day, and SDII range from 0.65 to 0.75, reflecting stronger persistence. Meanwhile, the H values for PRCPTOT and R95p range from 0.75 to 0.80, signifying strong persistence. Notably, the H value for CWD exceeds 0.80, indicating very strong persistence.

4.1.4. Periodic Analysis

The contour plot of the real part of wavelet coefficients illustrates the periodic variations in extreme precipitation indices at different time scales, as well as their distribution over time. The peak value of each wavelet variance represents the dominant periodic scale of the corresponding index. Positive contour lines indicate larger values of extreme precipitation indices, while negative lines indicate smaller values.
This study applies Morlet wavelet transform analysis to nine extreme precipitation indices in the PLCG from 1971 to 2022, as shown in Figure 6, extracting their periodic variation characteristics and summarizing them in a feature table as shown in Table 4. Among these, R50 exhibits three significant dominant cycles, while PRCPTOT, R20, RX1Day, RX5Day, R95p, R95c, CWD, and SDII each show four significant dominant cycles.
For R95c and CWD, no oscillation is detected during the first principal cycle across the entire period. In contrast, PRCPTOT, R20, R50, RX1Day, RX5Day, R95p, and SDII show oscillations throughout the study period, characterized by alternating phases of large–small–large–small–large.
The first and second main periods of PRCPTOT, R20, and R95p are approximately 39 years and 26 years, with the 39-year period being the most significant. The second main period, around 26 years, oscillates between 1979 and 2014. For R50 and SDII, the first and second main periods are around 38 years and 26 years. The second period is most significant for R50 from 1980 to 2015, while SDII’s second period shows noticeable oscillation after 2000.
PRCPTOT shows additional third and fourth main periods around 7 and 5 years, respectively. Similarly, R20 presents third and fourth periods around 5 and 7 years. These two indices have similar periodic characteristics: the 7-year cycle is evident from the late 1980s to 2001 and after 2010s, while the 5-year cycle dominates from the late 1970s to the early 21st century.
R95p’s third and fourth main periods occur near 20 and 7 years, with the 20-year period significant between 1985 and 2010, and the 7-year period notable between 1990 and 2000. R50’s third main period is around 7 years, prominent during 1990–2000. SDII exhibits third and fourth main periods near 7 and 12 years, with the 7-year cycle visible between 1990 and 2000 and the 12-year cycle evident between 1975 and 1980.
For R95, the main periods are approximately 11, 26, 5, and 17 years. The 11-year cycle becomes more pronounced after 1995, while the 26-year and 5-year cycle persist throughout the entire study period. The 17-year cycle is most evident between 1980 and 2000.
CWD displays main periods of roughly 26, 39, 5, and 7 years. The 26-year and 39-year cycles persist throughout the entire study period, whereas the 5-year cycle mainly appears after 2015. The 7-year cycle is most noticeable from the 1970s to the early 21st century.
For RX1Day, the main periods are approximately 38, 11s, 20, and 26 years. The 11-year cycle is prominent from the 1970s to the early 1980s and again after 2005. The 20-year cycle is significant from 1971 to the late 1990s, while the 26-year cycle becomes after 1990. Similarly, RX5Day exhibits main periods near 38, 7, 11, and 20 years. Its 7-year cycle is more pronounced after 1990, the 11-year cycle between 1971 and 1990, and the 20-year cycle most noticeable between 1985 and 2010.

4.1.5. The Correlation Between Extreme Precipitation and Atmospheric Circulation

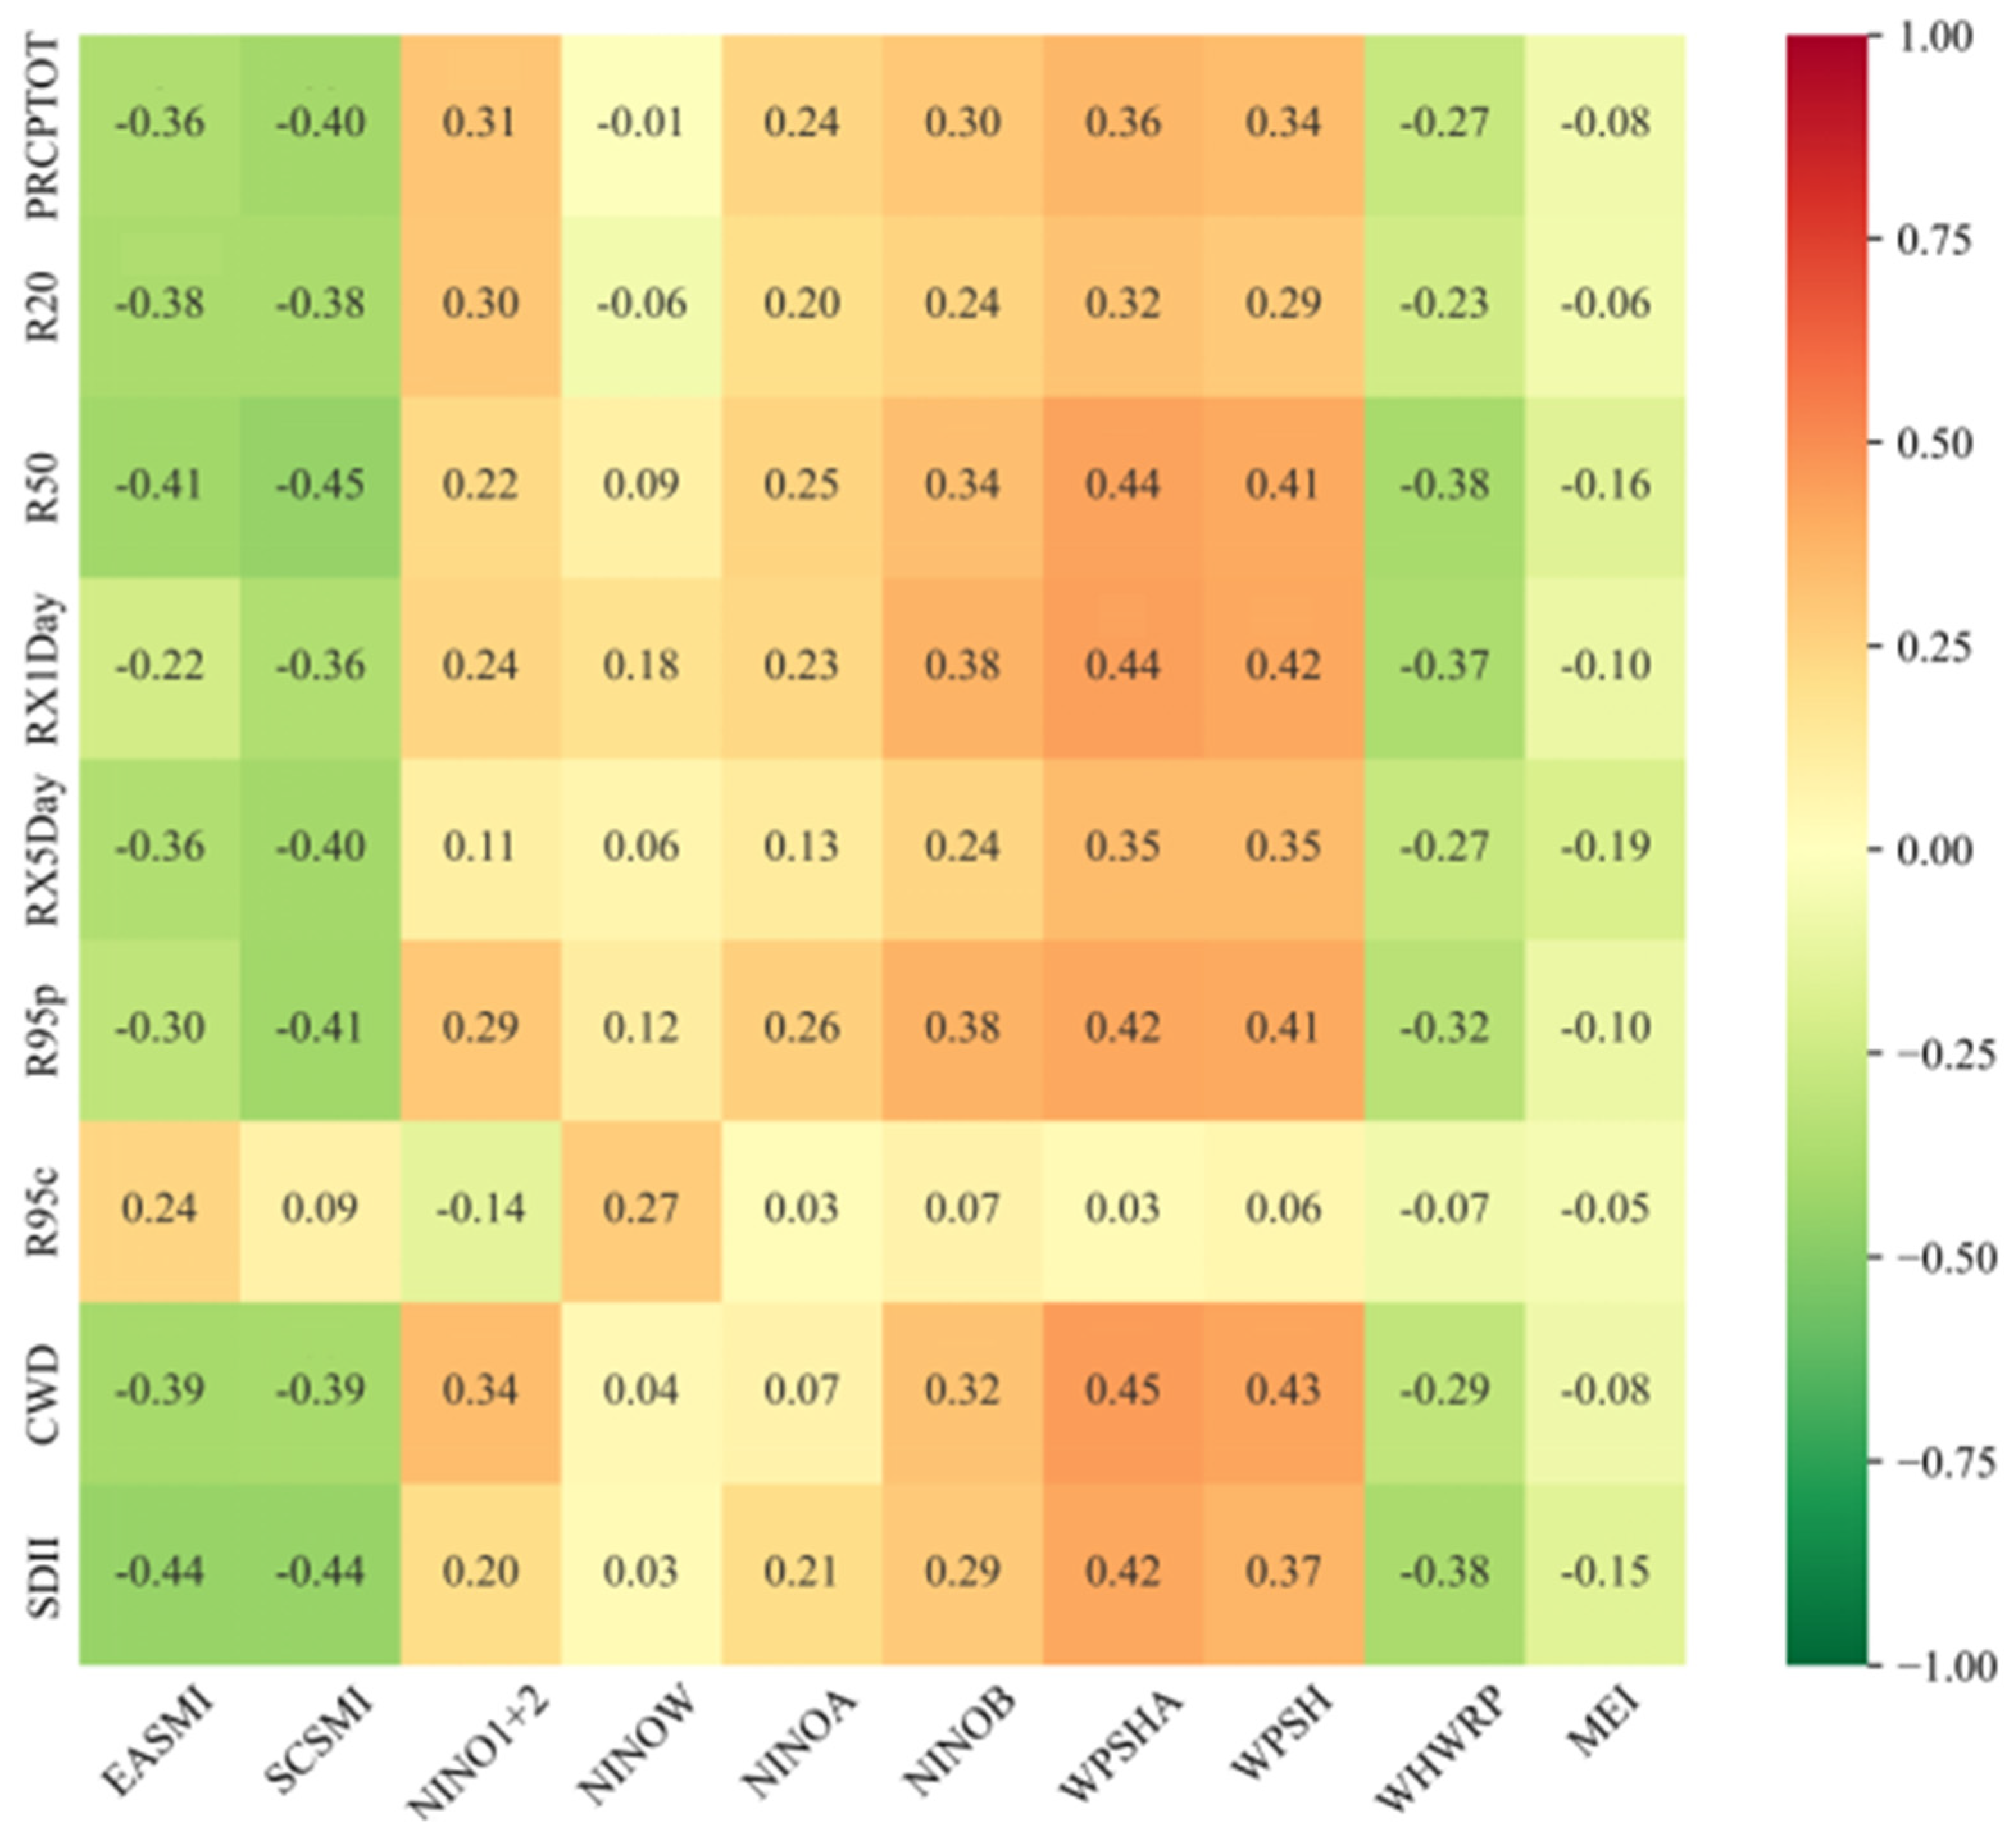
Atmospheric circulation plays a significant role in influencing regional precipitation, affecting its spatial distribution, temporal evolution, and fluctuations over short- to long-term periods [46]. Figure 7 presents a heatmap of the Pearson correlation coefficients between extreme precipitation indices and atmospheric circulation indices.
Both the EASMI and SCSMI show negative correlation with PRCPTOT, R20, R50, RX1Day, RX5Day, R95p, CWD, and SDII. Among these, correlations for PRCPTOT, R20, R50, RX5Day, R95p, CWD, and SDII are statistically significant at the 0.05 or 0.01 levels. NINO1 + 2 is positively correlated with PRCPTOT, R20, R50, RX1Day, RX5Day, R95p, CWD, and SDII, but negatively correlated with R95c. Notably, NINO1 + 2 exhibits a strong positive correlation with PRCPTOT, R20, and CWD.
The NINOW is positively correlated with R50, RX1Day, RX5Day, R95p, R95c, CWD, and SDII, while showing negatively correlated with PRCPTOT and R20. Meanwhile, NINOA, NINOB, WPSHA, and WPSH display positively correlated with PRCPTOT, R20, R50, RX1Day, RX5Day, R95p, R95c, and CWD, with NINOB demonstrating statistically significant positive correlations with R50, RX1Day, R95p, and CWD.
Both WPSHA and WPSH are significantly correlated with PRCPTOT, R20, R50, RX1Day, RX5Day, R95p, CWD, and SDII at the 95% or 99% confidence level. Conversely, WHWRP exhibits negative correlations with all nine extreme precipitation indices, especially stronger negative correlations with R50, RX1Day, R95p, and SDII. Similarly, MEI shows negative correlations across all indices.
In summary, extreme precipitation indices in the PLCG are primarily influenced by atmospheric circulation indices such as EASMI, SCSMI, WPSHA, and WPSH, underscoring their important role in regional precipitation variability.

4.1.6. Empirical Orthogonal Function (EOF) Analysis

To further investigate the spatial distribution characteristics of summer precipitation over the PLCG, EOF decomposition was performed on summer precipitation data from 36 stations across the PLCG for the period 1971–2022. After conducting the north significance test, only the first four eigenvalues showed significant separation, as shown in Figure 8. The variance contribution rates of these four primary modes were 75.63%, 10.11%, 3.94%, and 2.00%, respectively.
The first mode showed positive eigenvalues for all stations, with the highest values observed in the eastern part of the PLCG. This indicates that extreme precipitation in this region varies in a consistent manner over most years and effectively represents the dominant pattern of summer extreme precipitation across the entire PLCG.
The second mode displayed a spatial pattern characterized by positive loadings in the southern region and negative loading in the northern region. The zero-contour line passed through the central Yichun, the southern Nanchang, the northern Shangrao, and the southern Jingdezhen. This pattern suggests opposite variations in extreme precipitation between the northern and southern parts of the PLCG.
The third mode exhibited a positive loading in the western part of region and negative loading in the east. The center of negative value located in the southern Jingdezhen, while the center of positive values was in central Yichun.
The fourth mode displayed a “negative–positive–negative” distribution pattern, with the positive loading center situated in Nanchang.
Since the first mode represents the primary spatial distribution characteristic over the PLCG, analyzing the relationship between precipitation anomalies in typical years and associated meteorological elements are essential. The trend was first removed from the time series of the first mode, and the standard deviation was then calculated. Years with positive deviations from the mean were defined as strong precipitation years, while those with negative deviations were categorized as weak years. Based on this criterion, extreme summer precipitation was strong in 1993, 1995, 1998, 1999, 2017, and 2020, and weak in 1971, 1978, 1981, 1985, 1991, 2005, 2007, 2013, 2018, and 2022.

4.2. Analysis of the Drivers of Extreme Precipitation

4.2.1. Circulation Anomalies

Atmospheric circulation anomalies are the direct drivers of extreme precipitation events. This study investigates the circulation characteristics associated with extreme summer precipitation in the PLCG region during strong and weak precipitation years to better understand the anomalous circulation background influencing the urban agglomeration.
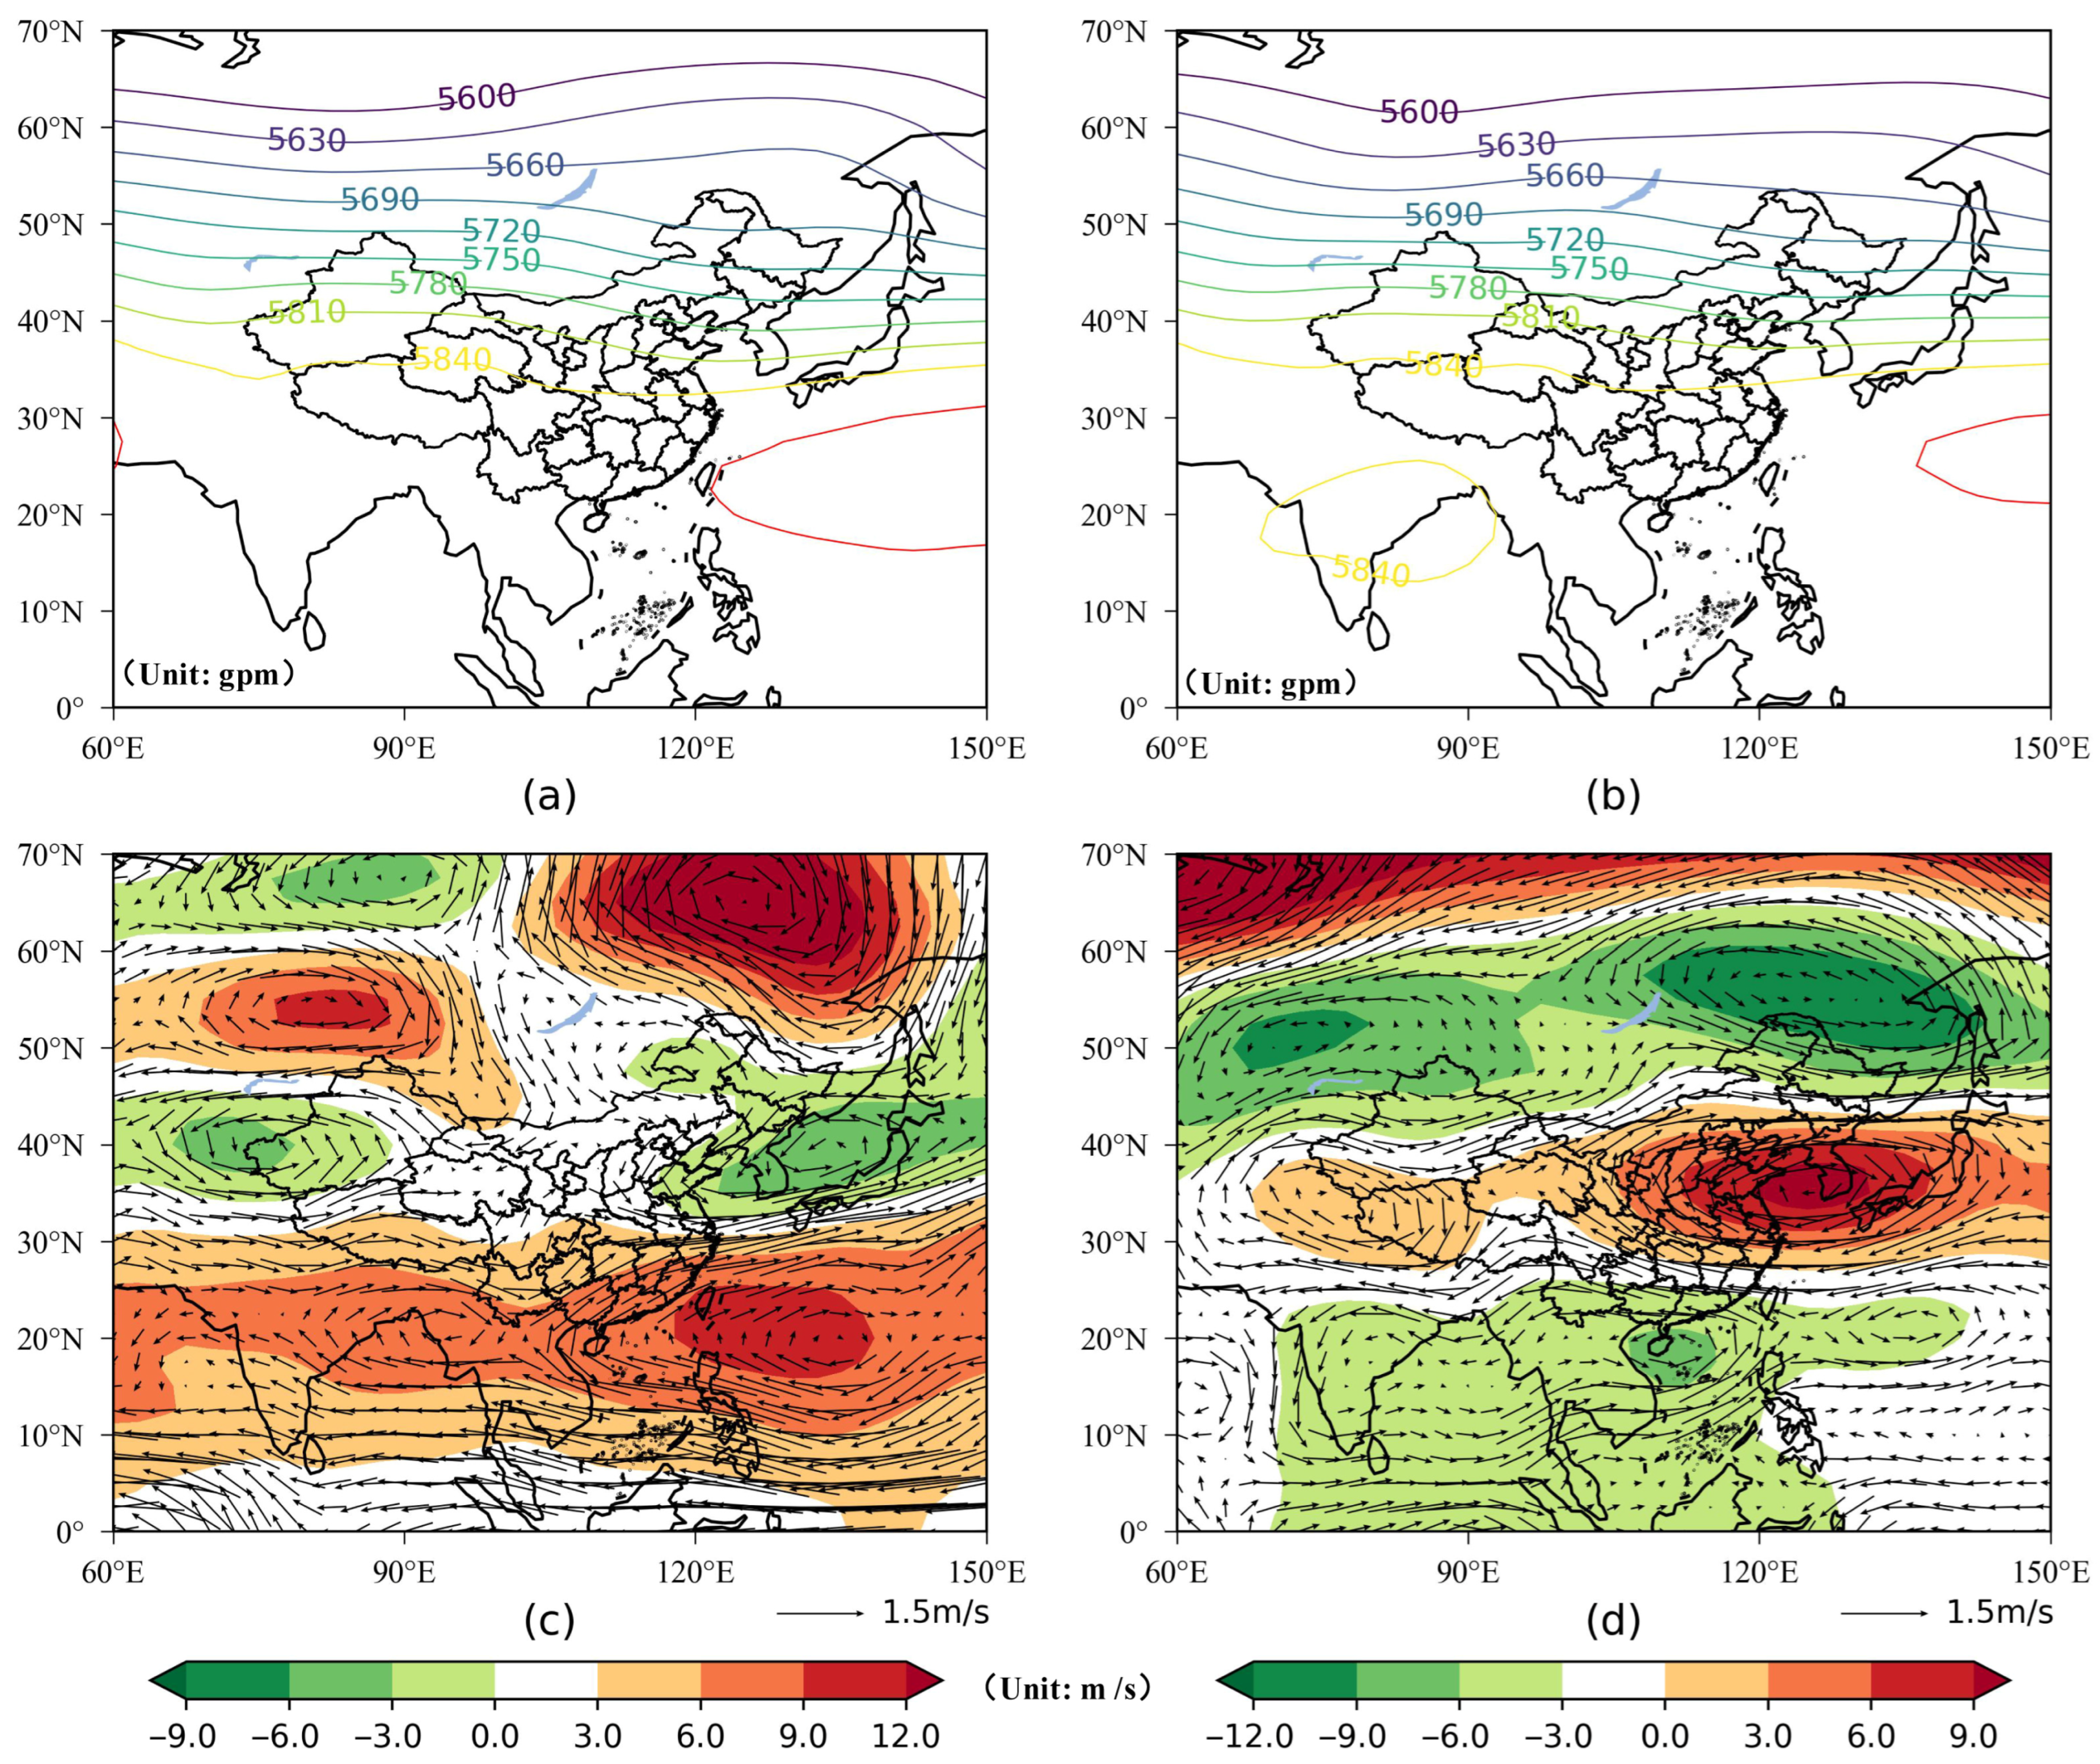
During years with significantly stronger extreme precipitation, as shown in Figure 9a,c, an anticyclonic circulation by notable positive geopotential height anomalies is observed over the western Pacific, east of the Bay of Bengal and the Philippines. The eastern part of China is dominated by robust southwesterly winds, with the PLCG situated to the northwest of this circulation system. The northward airflow from the western side of the anticyclone transports large amounts of moisture into the PLCG. In the East Asia region, a wave-like distribution pattern from high to low latitudes is observed, characterized by “+ − +” anomalies, facilitating both the southward transport of cold air from higher latitudes and the northward movement of warm, moist air from lower latitudes. During these strong precipitation years, these western Pacific subtropical high (indicated by the 5880 gpm contour) expands, reflection an enhanced subtropical high intensity. The western ridge extends westward to approximately 122°E longitude, which is linked to excessive precipitation anomalies in the PLCG.
In contrast, during years with weak extreme precipitation, as shown in Figure 9b,d, a cyclonic circulation forms over the western Pacific east of the Philippines. The PLCG is located northwest of this cyclonic circulation system, with airflow moving western from Pacific flowing westward toward the PLCG, and then turning northward toward North China. This pattern transports moisture into the region but results in reduced precipitation over the PLCG. In East Asia’s eastern sector, a wave-like anomaly pattern from mid- to low latitudes, characterized by the “− + −”, is observed. Positive geopotential height anomalies occur near 30°–40°N along the Asian coast, while negative anomalies prevail over the Bay of Bengal. The cyclonic circulation anomaly facilitates northwestward moisture transport from the Indian Ocean, which inhibits precipitation growth. Moreover, the western Pacific subtropical high ridge retreats eastward to around 136°E longitude leading to a reduced subtropical high area and a weakened western Pacific subtropical high. Consequently, precipitation anomalies over the PLCG diminish during these weak precipitation years.

4.2.2. Anomalous Water Vapor Transport

Abundant water vapor is essential for the occurrence of persistent heavy precipitation [47]. As shown in Figure 10a, during years characterized by extreme heavy precipitation, the primary moisture source for summer precipitation in the PLCG originates from the southwest airflow over the northwestern Pacific. Over the northwestern Pacific, an anomalous anticyclonic circulation is observed, with the PLCG situated in the northwest portion of this circulation. Consequently, strong southwest moisture transport occurs, leading to moisture convergence in the PLCG. This convergence causes an accumulation of warm and moist air, which favors the development of extreme precipitation events.
In contrast, as shown in Figure 10b, years with weak extreme precipitation exhibit anomalous eastward moisture transport in the East China region. This eastward transport extends to both low and high latitudes near 28°N, 114°E, and is accompanied by a cyclonic anomaly of moisture flux in the South China Sea. Within the PLCG, the moisture flux divergence demonstrates positive anomaly values, indicating a state of divergence, where moisture tends to flow outward, dispersing into the surrounding environment. Such conditions are unfavorable for the occurrence of extreme precipitation.

4.2.3. Outgoing Longwave Radiation (OLR)

OLR is a valuable indicator of tropical atmospheric convection intensity, humidity levels, divergence wind speeds, and vertical atmospheric motion. Low OLR values correspond to enhanced convection, stronger upward motion, lower-level convergence, and upper-level divergence. Conversely, high OLR values indicate suppressed convection and subsidence.
During years with significantly stronger extreme precipitation, the OLR anomaly field over the PLCG as shown in Figure 11a exhibits a prominent negative anomaly center, with central values below −10 W·m−2. This implies abundant cloud cover and intensified convective activity over the PLCG. Over the Pacific Ocean, the OLR anomaly display a north-negative and south-positive distribution pattern. Large positive anomalies are observed between 10°S and 20°N, while large negative anomalies appear between 20°N and 40°N. This pattern reflects weaker convective in the equatorial western Pacific and enhanced convective activity in the eastern Pacific near 20°N, which contributes to increase extreme summer precipitation in the PLCG.
By contrast, in years with weaker extreme precipitation as shown in Figure 11b, the OLR anomaly over the PLCG shows positive anomalies, exceeding 12.5 W·m−2, signifying weakened convective activity. In the Pacific region, the OLR anomaly pattern reverses, with positive anomalies to the north and negative anomalies to the south. Positive anomalies over the East China Sea and negative anomalies between 96° the 150°E and 8° to 22°N correspond to reduced extreme summer precipitation in the PLCG.

4.2.4. Sea Surface Temperature Anomaly

Sea surface temperature (SST) is a crucial external forcing factor for atmospheric circulation anomalies, influencing atmospheric circulation pattern through ocean-atmosphere interactions, which can subsequently trigger circulation systems [48]. Elevated SST anomalies in the eastern equatorial Pacific can affect mid-latitude atmospheric circulation by enhanced the propagation of western Pacific waves into mid-latitude regions, thereby contributing to the occurrence of extreme precipitation events.
Analysis of SST anomalies during early spring in years characterized by significantly increased extreme precipitation over the PLCG as shown in Figure 12a, it is clear that the eastern equatorial Pacific exhibits significantly positive SST anomalies, with center values exceeding 0.5 °C. In contrast, the western equatorial Pacific shows relatively weak negative anomalies, while the northwestern Pacific exhibits positive SST anomalies.
During years with weak extreme precipitation over the PLCG as shown in Figure 12b, SST anomalies in the eastern equatorial Pacific are negative, with central values below −0.4 °C, whereas the western equatorial Pacific presents positive anomalies. The SST anomaly patterns observed during early winter generally mirror those of early spring, as shown in Figure 12c,d. specifically, in years of strong extreme precipitation in early winter, positive SST anomalies persist in the eastern equatorial Pacific, with center values slightly higher than in early spring, exceeding 0.6 °C. Meanwhile, both the western equatorial Pacific and the northwestern Pacific show negative anomalies, although the positive anomaly center in the northwestern Pacific is marginally stronger than in early spring. Notably, negative SST anomalies in the eastern equatorial Pacific become more pronounced during early winter compared to early spring.
In summary, this study systematically reveals the spatiotemporal evolution characteristics and driving factors of summer extreme precipitation in the Poyang Lake City Group (PLCG), providing an important scientific basis for regional flood prevention and urban planning. First, the trend and abrupt change analyses of extreme precipitation indices facilitate the prediction of future variations in the frequency and intensity of regional extreme precipitation events. Incorporating these indices into meteorological early warning systems can enhance the accuracy and timeliness of flood warnings. Specifically, for the Poyang Lake Basin, this enables earlier detection of potential heavy precipitation events, allowing government agencies to promptly initiate emergency responses and thereby minimize casualties and property losses caused by flood disasters. Second, the analysis of circulation anomalies identifies moisture transport pathways and underlying mechanisms, offering scientific support for urban spatial planning and drainage system design. For the identified high-risk areas of extreme precipitation, urban planning should prioritize the enhancement of stormwater drainage capacity and flood control infrastructure, alongside rational land-use allocation and expansion of green spaces to improve flood regulation and drainage efficiency. Furthermore, by combining climate model projections with circulation anomaly patterns, this study supports mid- to long-term risk assessment and guides the optimization and upgrading of regional flood management systems.
In conclusion, this research not only advances the understanding of the spatiotemporal patterns and formation mechanisms of extreme precipitation but also provides valuable data support and theoretical guidance for flood warning decision making and urban planning.

5. Conclusions

This study analyzed the spatiotemporal characteristics and underlying drivers of summer extreme precipitation events in the Poyang Lake City Group (PLCG) from 1971 to 2022 by employing nine extreme precipitation indices. The key findings are summarized as follows:
(1)
From 1971 to 2022, extreme precipitation indices in the PLCG showed varying degrees of increasing trends. The climatic rates of change for intensity indices were as follows: PRCPTOT (25.64 mm/10a), R95p (8.65 d/10a), R95c (0.25%/10d), RX1Day (3.29 mm/10a), and RX5Day (5.21 mm/10a). The climatic rate for the duration index CWD was 0.2 d/10a. The climatic rates for the frequency indices R20 (0.37 days/decade), R50 (0.19 days/decade), and SDII (0.27 mm/day per decade) also showed increasing trends.
(2)
Extreme precipitation indices in most areas of the PLCG exhibited increasing trends, with significant regional variations. R50, RX1Day, RX5Day, R95p, R95c, and SDII generally increased from west to east, whereas PRCPTOT, R20, and CWD showed an increase from the central region extending toward both the east and west. Notably, R50 and CWD did not exhibit statistically significant trends across the PLCG, while indices including PRCPTOT, RX1Day, RX5Day, R95p, R95c, and SDII showed upward trends in majority of regions.
(3)
Results from the Mann–Kendall mutation test applied to six extreme precipitation indices in the PLCG region from 1971 to 2022 showed that PRCPTOT, R50, RX1Day, and SDII underwent significant shifts. Among these, PRCPTOT, R50, and CWD exhibited similar fluctuation patterns characterized by a “decrease–increase–decrease–increase” sequence. RX1Day displayed a pronounced upward trend post-1993, indicating intensification of extreme precipitation events. Conversely, despite fluctuations in R95c and CWD, neither passed the significance test, suggesting their changes were not statistically significant. Overall, extreme precipitation in the PLCG region has experienced phased evolution over the past five decades, accompanied by notable structural changes in several indices.
(4)
The Morlet wavelet transformation indicated that R95c and CWD did not exhibit oscillations during the entire duration of the first principal cycle. In contrast, PRCPTOT, R20, R50, RX1Day, RX5Day, R95p, and SDII oscillated consistently throughout the study period, alternating between phases of high and low values. Correlation analysis revealed that extreme precipitation indices were significantly influenced by circulation indices such as EASMI, SCSMI, WPSHA, and WPSH.
(5)
In years characterized by a pronounced increase in extreme precipitation, the western Pacific subtropical high intensified and shifted westward. At 500 hPa, a southwest wind anomaly was observed over the PLCG, accompanied by a negative anomaly in water vapor flux divergence, indicating of strong moisture convergence. The OLR anomaly over the PLCG was negative, while sea surface temperatures in the eastern equatorial Pacific were elevated and those in the western equatorial Pacific were reduced, collectively creating favorable conditions for extreme precipitation. Conversely, during years of weak extreme precipitation, the western Pacific subtropical high was weaker and positioned further east, with a southeast wind anomaly at 500 hPa. Water vapor flux divergence anomaly over the PLCG exhibit positive anomaly, indicating moisture divergence. The PLCG was situated within a positive OLR anomaly region, and sea surface temperatures in the eastern equatorial Pacific were cooler, whereas those in the western equatorial Pacific were warmer, thereby suppressing extreme precipitation occurrence.

Author Contributions

Conceptualization, H.L. and B.L.; methodology, H.L., Z.Z. and B.L.; software, H.L., Z.Z. and B.L.; formal analysis, H.L., Z.Z. and B.L.; investigation, H.L., Z.Z. and B.L.; writing—original draft preparation, H.L., Z.Z. and B.L.; writing—review and editing, H.L., Z.Z. and B.L.; visualization, H.L. and Z.Z.; supervision, B.L. All authors have read and agreed to the published version of the manuscript.

Funding

This research was funded by the National Natural Science Foundation of China (Nos.42161064, 42104030), the Jiangxi Provincial Natural Science Foundation (20232ACB204032, 20242BAB20129), the Ganpo Talent Support Program—Key Discipline Academic and Technical Leader Cultivating Project under Grant number 20243BCE51111, and the Science and Technology Innovation Project of the Department of Natural Resources of Jiangxi Province (ZRKJ20242620).

Data Availability Statement

The daily precipitation dataset for China can be obtained from the National Tibetan Plateau Data Center (https://data.tpdc.ac.cn/home (accessed on 10 December 2024)). The atmospheric reanalysis data can be accessed from NCEP-NCAR (https://psl.noaa.gov/data/index.html (accessed on 18 November 2024)).

Acknowledgments

We acknowledge the National Tibetan Plateau Data Center and NCEP-NCAR for providing the data used in this study.

Conflicts of Interest

The authors declare no conflicts of interest.

References

  1. Legg, S. IPCC, Climate Change 2021: The Physical Science Basis (9781009157896). Interaction 2021, 49, 44–45. [Google Scholar]
  2. Wang, X.-Y.; Bao, X.-Y.; Huang, Y.; Li, Z.-W.; Yong, J.-H.; Wu, Y.-P.; Feng, G.-L.; Sun, G.-Q. Physical Explanation for Paradoxical Climate Change in Semi-Arid Inland Eurasia Based on a Remodeled Precipitation Recycling Ratio and Clausius–Clapeyron Equation. Atmosphere 2023, 14, 376. [Google Scholar] [CrossRef]
  3. Aihaiti, A.; Jiang, Z.; Li, Y.; Tao, L.; Zhu, L.; Zhang, J. The global warming and IPO impacts on summer extreme precipitation in China. Clim. Dyn. 2023, 60, 3369–3384. [Google Scholar] [CrossRef]
  4. Cheng, Q.; Zhong, F.; Wang, P. Potential linkages of extreme climate events with vegetation and large-scale circulation indices in an endorheic river basin in northwest China. Atmos. Res. 2021, 247, 105256. [Google Scholar] [CrossRef]
  5. Ma, Q.; Li, Z.; Lei, H.; Chen, Z.; Liu, J.; Wang, S.; Su, T.; Feng, G. Interannual variability of extreme precipitation during the boreal summer over northwest China. Remote Sens. 2023, 15, 785. [Google Scholar] [CrossRef]
  6. Mukherjee, S.; Aadhar, S.; Stone, D.; Mishra, V. Increase in extreme precipitation events under anthropogenic warming in India. Weather. Clim. Extrem. 2018, 20, 45–53. [Google Scholar] [CrossRef]
  7. Ávila, A.; Justino, F.; Wilson, A.; Bromwich, D.; Amorim, M. Recent precipitation trends, flash floods and landslides in southern Brazil. Environ. Res. Lett. 2016, 11, 114029. [Google Scholar] [CrossRef]
  8. Duan, W.; He, B.; Nover, D.; Fan, J.; Yang, G.; Chen, W.; Meng, H.; Liu, C. Floods and associated socioeconomic damages in China over the last century. Nat. Hazards 2016, 82, 401–413. [Google Scholar] [CrossRef]
  9. Marengo, J.; Camarinha, P.; Alves, L.; Diniz, F.; Betts, R. Extreme Rainfall and Hydro-Geo-Meteorological Disaster Risk in 1.5, 2.0, and 4.0 °C Global Warming Scenarios: An Analysis for Brazil. Front. Clim. 2021, 3, 610433. [Google Scholar] [CrossRef]
  10. Neumayer, E.; Plümper, T.; Barthel, F. The political economy of natural disaster damage. Glob. Environ. Change 2014, 24, 8–19. [Google Scholar] [CrossRef]
  11. Yang, L.; Smith, J.; Baeck, M.L.; Zhang, Y.; Morin, E.; Goodrich, D.C.; Nikolopoulos, E.I.; Artan, G.A. Urban Impacts on Extreme Monsoon Rainfall and Flooding in Complex Terrain. Geophys. Res. Lett. 2019, 46, 5918–5927. [Google Scholar] [CrossRef]
  12. Ma, S.; Zhou, T.; Dai, A.; Han, Z. Observed Changes in the Distributions of Daily Precipitation Frequency and Amount over China from 1960 to 2013. J. Clim. 2015, 28, 6960–6978. [Google Scholar] [CrossRef]
  13. Wu, H.T.J.; Lau, W.K.M. Detecting climate signals in precipitation extremes from TRMM (1998–2013)—Increasing contrast between wet and dry extremes during the “global warming hiatus”. Geophys. Res. Lett. 2016, 43, 1340–1348. [Google Scholar] [CrossRef]
  14. Donat, M.G.; Lowry, A.L.; Alexander, L.V.; O’Gorman, P.A.; Maher, N. More extreme precipitation in the world’s dry and wet regions. Nat. Clim. Change 2016, 6, 508–513. [Google Scholar] [CrossRef]
  15. Kunkel, K.E.; Karl, T.R.; Squires, M.F.; Yin, X.; Stegall, S.T.; Easterling, D.R. Precipitation Extremes: Trends and Relationships with Average Precipitation and Precipitable Water in the Contiguous United States. J. Appl. Meteorol. Climatol. 2020, 59, 125–142. [Google Scholar] [CrossRef]
  16. Cheng, X.; Fang, J.; Lei, X. Analysis on the Frequency of Extreme Precipitation in Midsummer in Shaanxi and Its Teleconnection with Global Sea Surface Temperature. J. Arid. Meteorol. 2014, 32, 38–45. [Google Scholar]
  17. Wu, S.; Hu, Z.; Wang, Z.; Cao, S.; Yang, Y.; Qu, X.; Zhao, W. Spatiotemporal variations in extreme precipitation on the middle and lower reaches of the Yangtze River Basin (1970–2018). Quat. Int. 2021, 592, 80–96. [Google Scholar] [CrossRef]
  18. Dong, T.; Zhu, X.; Deng, R.; Ma, Y.; Dong, W. Detection and attribution of extreme precipitation events over the Asian monsoon region. Weather. Clim. Extrem. 2022, 38, 100497. [Google Scholar] [CrossRef]
  19. Zhang, L.; Li, Y.; Zhang, F.; Chen, L.; Pan, T.; Wang, B.; Ren, C. Changes of winter extreme precipitation in Heilongjiang province and the diagnostic analysis of its circulation features. Atmos. Res. 2020, 245, 105094. [Google Scholar] [CrossRef]
  20. Toreti, A.; Fioravanti, G.; Perconti, W.; Desiato, F. Annual and seasonal precipitation over Italy from 1961 to 2006. Int. J. Climatol. 2009, 29, 1976–1987. [Google Scholar] [CrossRef]
  21. Shi, J.; Wei, P.; Cui, L.; Zhang, B. Spatio-temporal characteristics of extreme precipitation in East China from 1961 to 2015. Meteorol. Z. 2018, 27, 377–390. [Google Scholar] [CrossRef]
  22. Si, D.; Liu, Y.; Shao, X. Oceanic and atmospheric circulation anomalies and their impacts on Chinese climate in 2015–2016. Meteorology 2016, 42, 481–488. [Google Scholar] [CrossRef]
  23. Wei, W.; Yan, Z.; Li, Z. Influence of Pacific Decadal Oscillation on global precipitation extremes. Environ. Res. Lett. 2021, 16, 044031. [Google Scholar] [CrossRef]
  24. Huang, W.; Chang, S.; Xie, C.; Zhang, Z. Moisture sources of extreme summer precipitation events in North Xinjiang and their relationship with atmospheric circulation. Adv. Clim. Change Res. 2017, 8, 12–17. [Google Scholar] [CrossRef]
  25. Guan, W.; Hu, H.; Ren, X.; Yang, X. Subseasonal zonal variability of the western Pacific subtropical high in summer: Climate impacts and underlying mechanisms. Clim. Dyn. 2019, 53, 3325–3344. [Google Scholar] [CrossRef]
  26. Ren, X.; Yang, X.; Sun, X. Zonal Oscillation of Western Pacific Subtropical High and Subseasonal SST Variations during Yangtze Persistent Heavy Rainfall Events. J. Clim. 2013, 26, 8929–8946. [Google Scholar] [CrossRef]
  27. Yan, Y.; Wang, H.; Li, G.; Xia, J.; Ge, F.; Zeng, Q.; Ren, X.; Tan, L. Projection of future extreme precipitation in China based on the CMIP6 from a machine learning perspective. Remote Sens. 2022, 14, 4033. [Google Scholar] [CrossRef]
  28. Yang, L.; Zhao, J.; Feng, G. Characteristics and differences of summertime moisture transport associated with four rainfall patterns over eastern China monsoon region. Chinese J. Atmos. Sci. 2018, 42, 81–95. [Google Scholar] [CrossRef]
  29. Li, Y.; Wu, Y.; Zhou, J.; Xiang, B.; He, J.; Huang, D. Characteristics of Water Vapor Transport for Extreme Summer Precipitation in the Eastern Southwest China and Its Impact Mechanism. Atmosphere 2023, 14, 1328. [Google Scholar] [CrossRef]
  30. Zhou, Z.Q.; Xie, S.P.; Zhang, R. Historic Yangtze flooding of 2020 tied to extreme Indian Ocean conditions. Proc. Natl. Acad. Sci. USA 2021, 118, e2022255118. [Google Scholar] [CrossRef]
  31. Tang, Y.; Huang, A.; Wu, P.; Huang, D.; Xue, D.; Wu, Y. Drivers of Summer Extreme Precipitation Events Over East China. Geophys. Res. Lett. 2021, 48, e2021GL093670. [Google Scholar] [CrossRef]
  32. Zhang, Q.; Zheng, Y.; Singh, V.; Luo, M.; Xie, Z. Summer extreme precipitation in eastern China: Mechanisms and impacts. J. Geophys. Res. Atmos. 2017, 122, 2766–2778. [Google Scholar] [CrossRef]
  33. Guan, Y.; Zheng, F.; Zhang, X.; Wang, B. Trends and variability of daily precipitation and extremes during 1960–2012 in the Yangtze River Basin, China. Int. J. Climatol. 2017, 37, 1282–1298. [Google Scholar] [CrossRef]
  34. Li, X.; Hu, Q. Spatiotemporal changes in extreme precipitation and its dependence on topography over the Poyang Lake Basin, China. Adv. Meteorol. 2019, 2019, 1253932. [Google Scholar] [CrossRef]
  35. Zhan, M.; Wu, Q.; Zhan, L.; Xin, J. Change in extreme precipitation events: Exposure and vulnerability in the Poyang Lake Basin, China. Front. Earth Sci. 2023, 11, 1125837. [Google Scholar] [CrossRef]
  36. Li, X.; Hu, Q.; Wang, R.; Zhang, D.; Zhang, Q. Influences of the timing of extreme precipitation on floods in Poyang Lake, China. Hydrol. Res. 2021, 52, 26–42. [Google Scholar] [CrossRef]
  37. Deng, C.; Zhang, Y.; Ma, M.; Chen, Y.; Wei, J.; Kunstmann, H.; Gao, L. Compound temporal-spatial extreme precipitation events in the Poyang Lake Basin of China. J. Hydrol. Reg. Stud. 2025, 58, 102270. [Google Scholar] [CrossRef]
  38. Zhang, Q.; Xiao, M.; Singh, V.P.; Wang, Y. Spatiotemporal variations of temperature and precipitation extremes in the Poyang Lake basin, China. Theor. Appl. Climatol. 2016, 124, 855–864. [Google Scholar] [CrossRef]
  39. Han, J.; Miao, C.; Gou, J.; Zheng, H.; Zhang, Q.; Guo, X. A new daily gridded precipitation dataset for the Chinese mainland based on gauge observations. Earth Syst. Sci. Data 2023, 15, 3147–3161. [Google Scholar] [CrossRef]
  40. Alexander, L.V.; Zhang, X.; Peterson, T.C.; Caesar, J.; Gleason, B.; Klein Tank, A.M.G.; Haylock, M.; Haylock, M.; Collins, D.; Trewim, B.; et al. Global observed changes in daily climate extremes of temperature and precipitation. J. Geophys. Res. Atmos. 2006, 111. [Google Scholar] [CrossRef]
  41. Lorenz, E.N. Empirical Orthogonal Function and Statistical Weather Prediction; Scientific Report 1; Massauchets Institute of Technology: Cambridge, MA, USA, 1956; p. 49. [Google Scholar]
  42. Wang, L.; Yao, Z.J.; Jiang, L.G.; Wang, R.; Wu, S.S.; Liu, Z.F. Changes in climate extremes and catastrophic events in the Mongolian Plateau from 1951 to 2012. J. Appl. Meteorol. Climatol. 2016, 55, 1169–1182. [Google Scholar] [CrossRef]
  43. Shao, Q.; Li, Z.; Xu, Z. Trend detection in hydrological time series by segment regression with application to Shiyang River Basin. Stoch. Environ. Res. Risk Assess. 2010, 24, 221–233. [Google Scholar] [CrossRef]
  44. An, B.; Zhou, W.; Xia, W.; Yang, H. Analysis of hydrological element variation characteristics in the Erlang River Basin. J. Water Resour. Archit. Eng. 2019, 17, 239–243. [Google Scholar]
  45. Chong, K.L.; Huang, Y.F.; Koo, C.H.; Ahmed, A.N.; El-Shafie, A. Spatiotemporal variability analysis of standardized precipitation indexed droughts using wavelet transform. J. Hydrol. 2022, 605, 127299. [Google Scholar] [CrossRef]
  46. Ullah, W.; Wang, G.; Lou, D.; Ullah, S.; Bhatti, A.S.; Ullah, S.; Karim, A.; Hagan, D.; Ali, G. Large-scale atmospheric circulation patterns associated with extreme monsoon precipitation in Pakistan during 1981–2018. Atmos. Res. 2021, 253, 105489. [Google Scholar] [CrossRef]
  47. Zhou, C.; Tang, X.; Deng, B. Characteristics of Precipitation and Analysis of Moisture Sources in a Severe Rainstorm Disaster in Sichuan. Plateau Meteorol. 2015, 34, 1636–1647. [Google Scholar] [CrossRef]
  48. Chen, H.; Xu, H.; Ma, J.; Deng, J. Characteristics of Air-Sea Interaction Associated with Large-Scale Sea Surface Temperature Warm Anomalies over the North Pacific in Winter on Submonthly Timescales. Chin. J. Atmos. Sci. 2022, 46, 293–308. [Google Scholar]
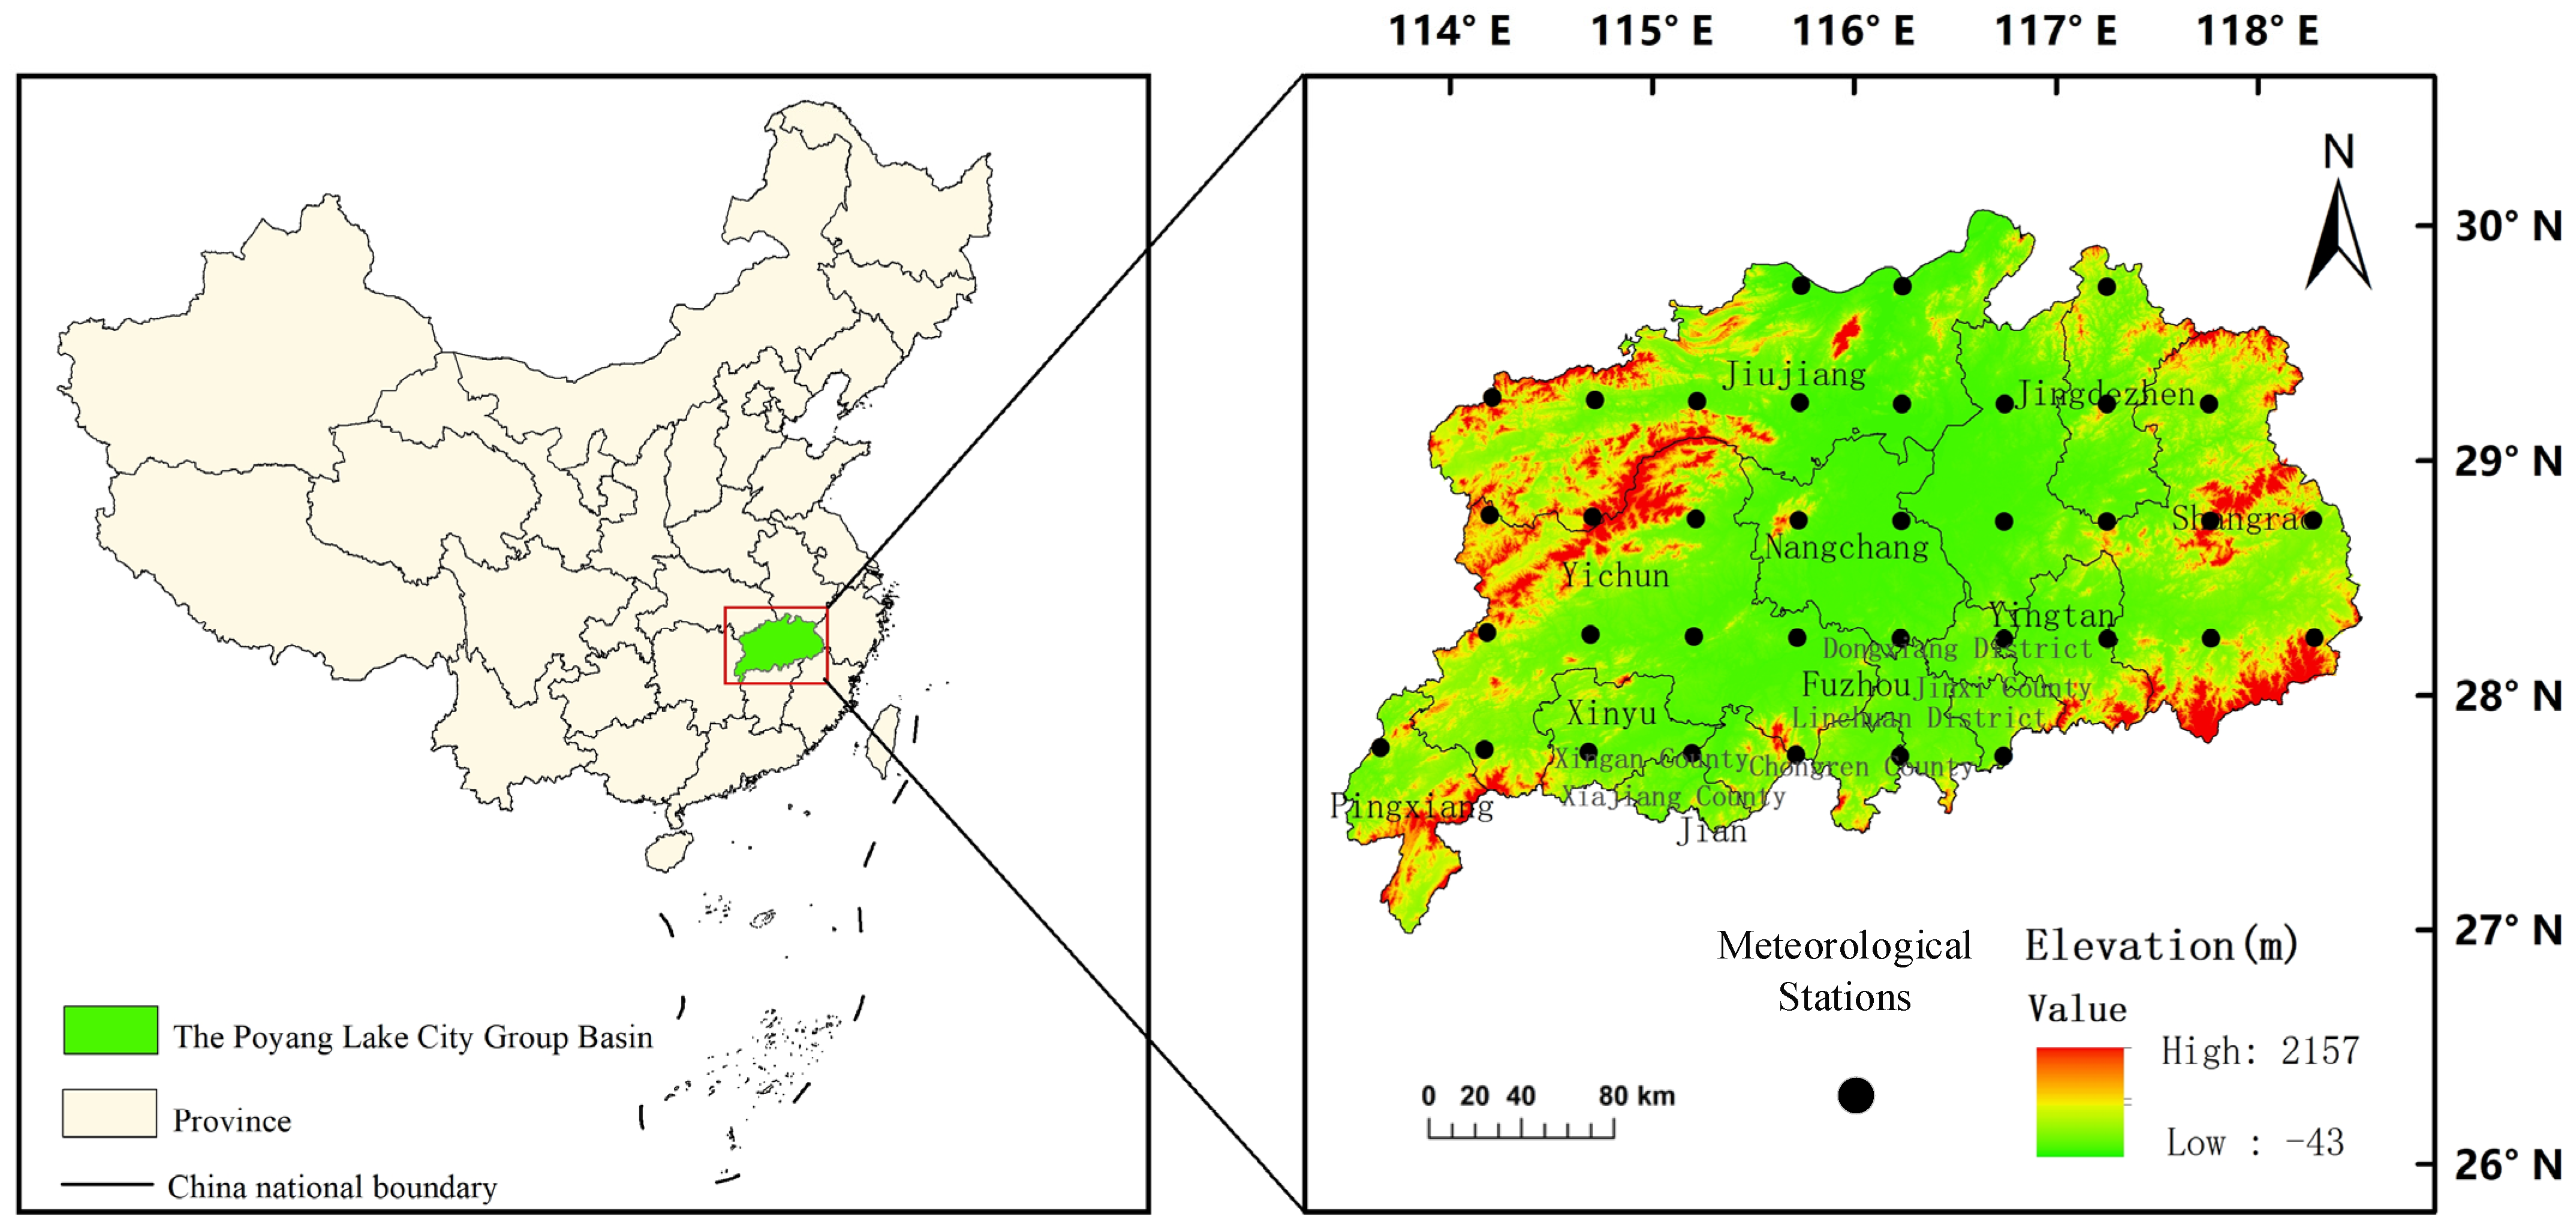
Figure 1. Schematic map of the study area.
Remotesensing 17 02915 g001
Figure 2. The framework of this study.
Remotesensing 17 02915 g002
Figure 3. Trends in extreme precipitation indices and 5-year moving average (the green line represents the 5-year moving average, the blue line represents the multi-year average, and the red dashed line represents the linear trend).
Remotesensing 17 02915 g003
Figure 4. Spatial characteristics of extreme precipitation indices.
Remotesensing 17 02915 g004
Figure 5. Results of the M–K test on extreme precipitation indices.
Remotesensing 17 02915 g005
Figure 6. Contour map of the real part of the extreme precipitation index wavelet coefficients.
Remotesensing 17 02915 g006
Figure 7. The heat map of the correlation between the extreme precipitation index and the circulation index.
Remotesensing 17 02915 g007
Figure 8. The spatial distribution of the first four modes of EOF decomposition of annual precipitation over the PLCG.
Remotesensing 17 02915 g008
Figure 9. The 500 hPa mean geopotential height (a,b); the 500 hPa anomaly height field and wind field (c,d); Strong years (a,c); weak years (b,d) (filled color, unit: m/s).
Remotesensing 17 02915 g009
Figure 10. Years with a bias toward stronger conditions (a); years with a bias toward weaker conditions (b) (the anomalous fields of 850 hPa specific humidity flux (vector arrows, unit: kg·s−1·m−1) and specific humidity flux divergence (filled color, unit: 10−5 kg·s−1·m−2)).
Remotesensing 17 02915 g010
Figure 11. The OLR anomaly fields for strong-biased years (a); weak−biased years (b).
Remotesensing 17 02915 g011
Figure 12. Sea surface temperature anomaly distribution during early spring (March, April, and May) (a,b); early winter (December, January, and February of the previous year) (c,d); strong-biased years (a,c); weak−biased years (b,d).
Remotesensing 17 02915 g012
Table 1. Sources of Atmospheric Circulation Indices.
Atmospheric Circulation IndicesAbbreviationSource Website
East Asian Summer Monsoon IndexEASMIhttp://lijianping.cn/dct/page/1 (accessed on 12 October 2024)
South China Sea Summer Monsoon IndexSCSMI
The NINO 1+2 region sea surface temperature anomaly indexNINO1+2http://ncc-cma.net/cn/ (accessed on 30 September 2024)
The NINO W region sea surface temperature anomaly indexNINOW
The NINO A region sea surface temperature anomaly indexNINOA
The NINO B region sea surface temperature anomaly indexNINOB
Western Pacific Subtropical High Area IndexWPSHA
Western Pacific Subtropical High-Intensity IndexWPSH
Western Pacific Sub Tropical High Western Ridge Point IndexWHWRP
Multivariate El Niño IndexMEIhttps://psl.noaa.gov/enso/mei/ (accessed on 18 November 2024)
Table 2. The Extreme Precipitation Index.
IndexNameDefinitionUnit
PRCPTOTannual precipitation totaltotal precipitation amount with daily rainfall ≥1 mm within the yearmm
R20number of heavy rain daysnumber of days with daily rainfall ≥20 mm within the yeard
R50number of rainstorm daysnumber of days with daily rainfall ≥50 mm within the yeard
RX1Dayannual maximum daily precipitationmaximum daily precipitation within the yearmm
RX5Daymaximum total precipitation over a continuous period of 5 daysmaximum total precipitation over a continuous period of 5 days within the yearmm
R95pextreme precipitationannual cumulative precipitation with daily rainfall ≥95% thresholdmm
R95ccontribution rate of extreme precipitationproportion of extreme precipitation to annual precipitation total%
CWDnumber of consecutive wet dayslongest duration of days with daily rainfall ≥1mm within the yeard
SDIIdaily precipitation intensityratio of total annual precipitation to the number of precipitation days (≥1 mm)mm/d
Table 3. Hurst Exponent for Extreme Precipitation Indices.
IndicesPRCPTOTR20R50RX1DayRX5DayR95pR95cCWDSDII
H value0.780.740.720.680.640.760.550.960.73
Table 4. Period Analysis of the PLCG Extreme Precipitation Index.
IndexFirst Primary PeriodSecond Primary PeriodThird Primary PeriodFourth Primary Period
PRCPTOT392675
R20392657
R5038267-
RX1Day38112026
RX5Day3871120
R95p3926207
R95c1126517
CWD263957
SDII3826712
Disclaimer/Publisher’s Note: The statements, opinions and data contained in all publications are solely those of the individual author(s) and contributor(s) and not of MDPI and/or the editor(s). MDPI and/or the editor(s) disclaim responsibility for any injury to people or property resulting from any ideas, methods, instructions or products referred to in the content.