Spatial–Temporal Characteristics and Drivers of Summer Extreme Precipitation in the Poyang Lake City Group (PLCG) from 1971 to 2022
Abstract
1. Introduction
2. Study Area and Data Sources
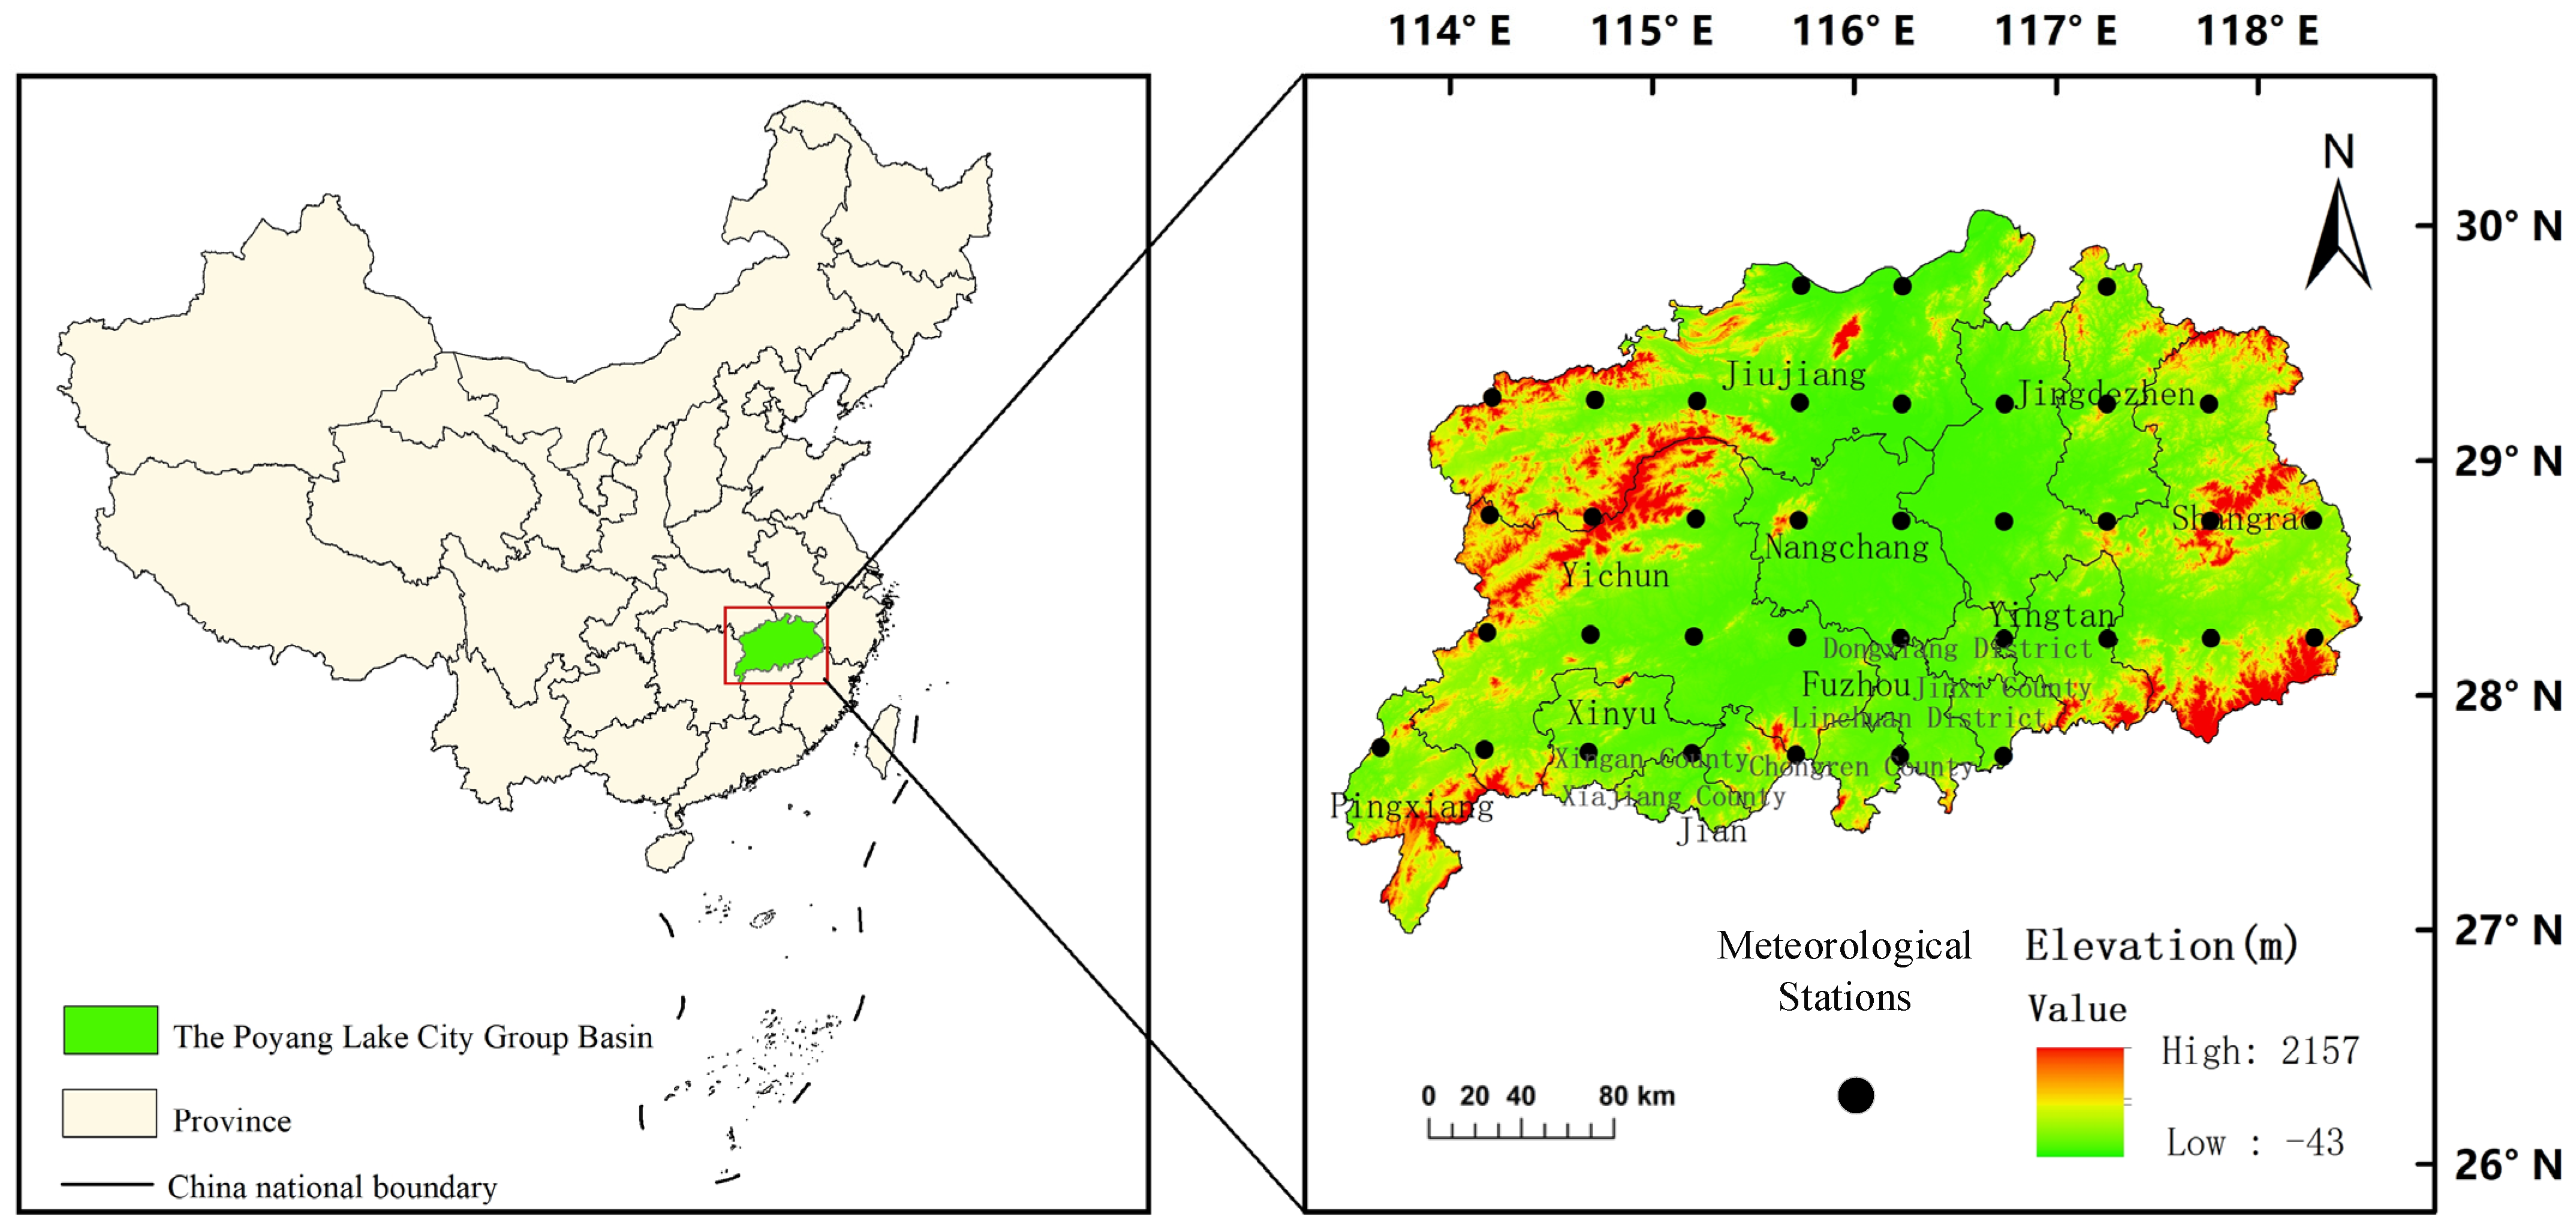
2.1. Study Area
2.2. Data Sources
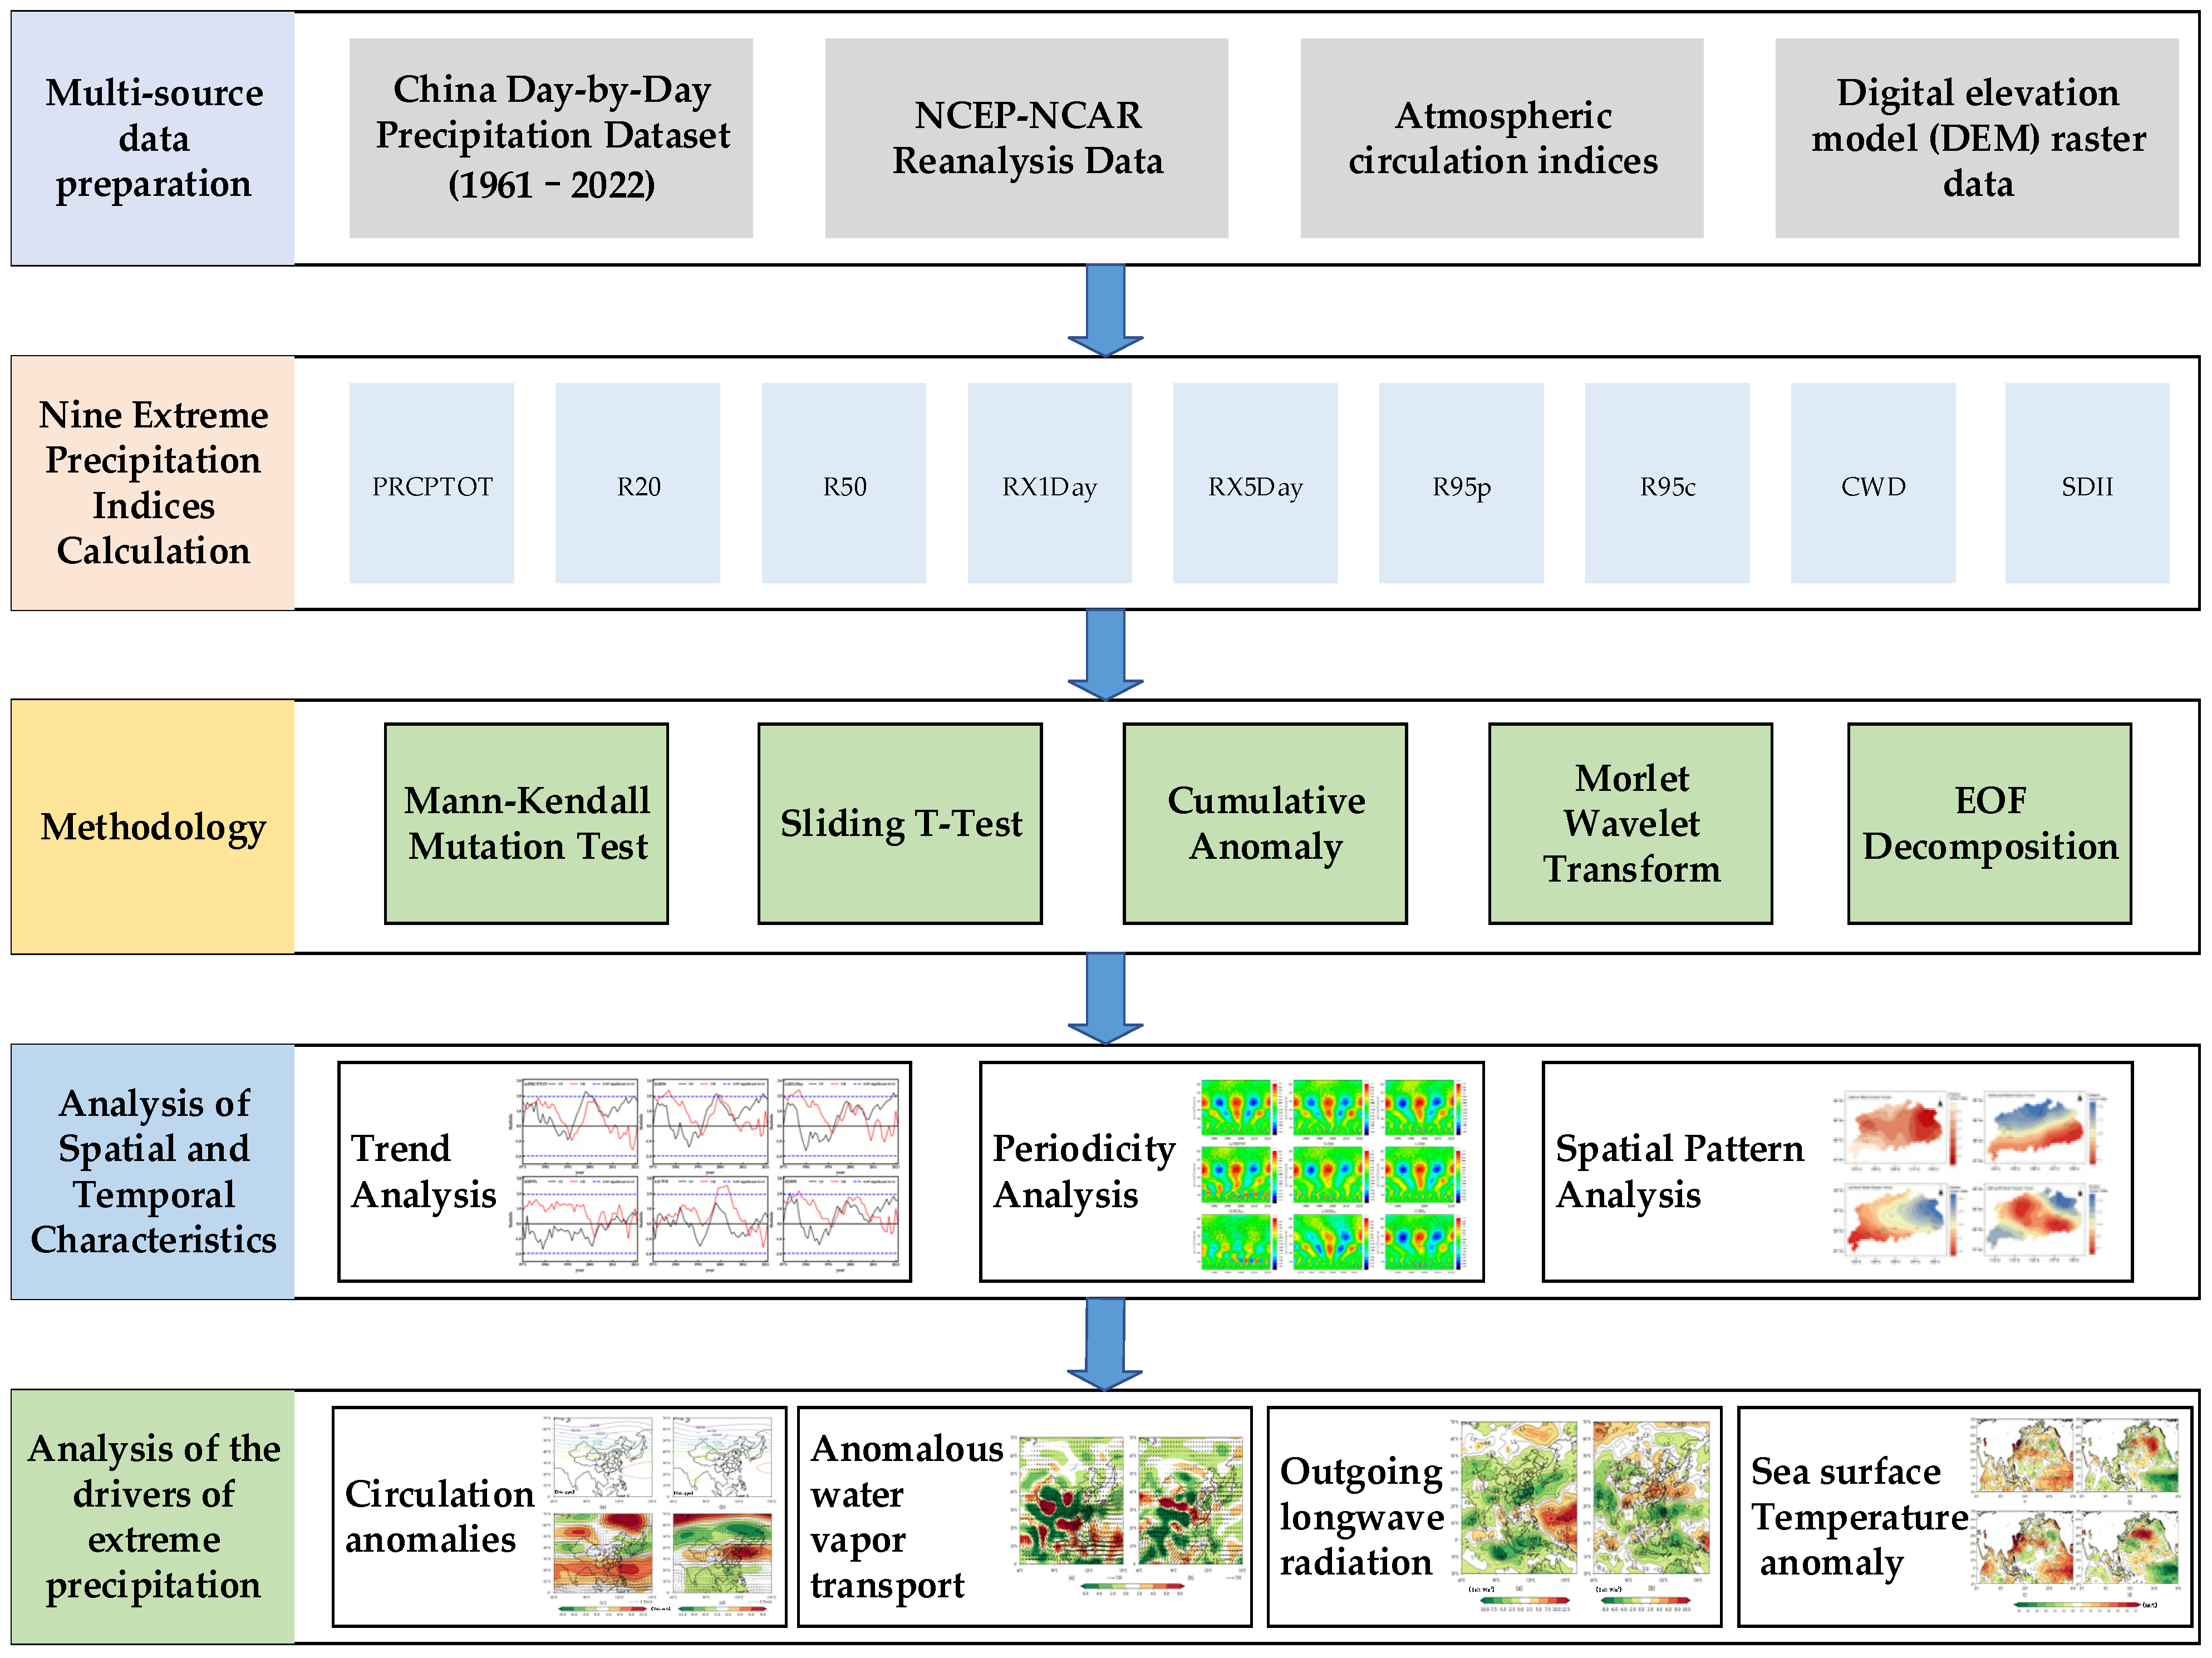
3. Methodology
3.1. The Extreme Precipitation Index
3.2. The Empirical Orthogonal Function (EOF)
3.3. The Mann–Kendall Mutation Test
3.4. The Sliding T-Test
3.5. Cumulative Anomaly
3.6. Morlet Wavelet Transform
4. Results and Analysis
4.1. Analysis of Spatial and Temporal Characteristics
4.1.1. Analysis of Temporal Characteristics
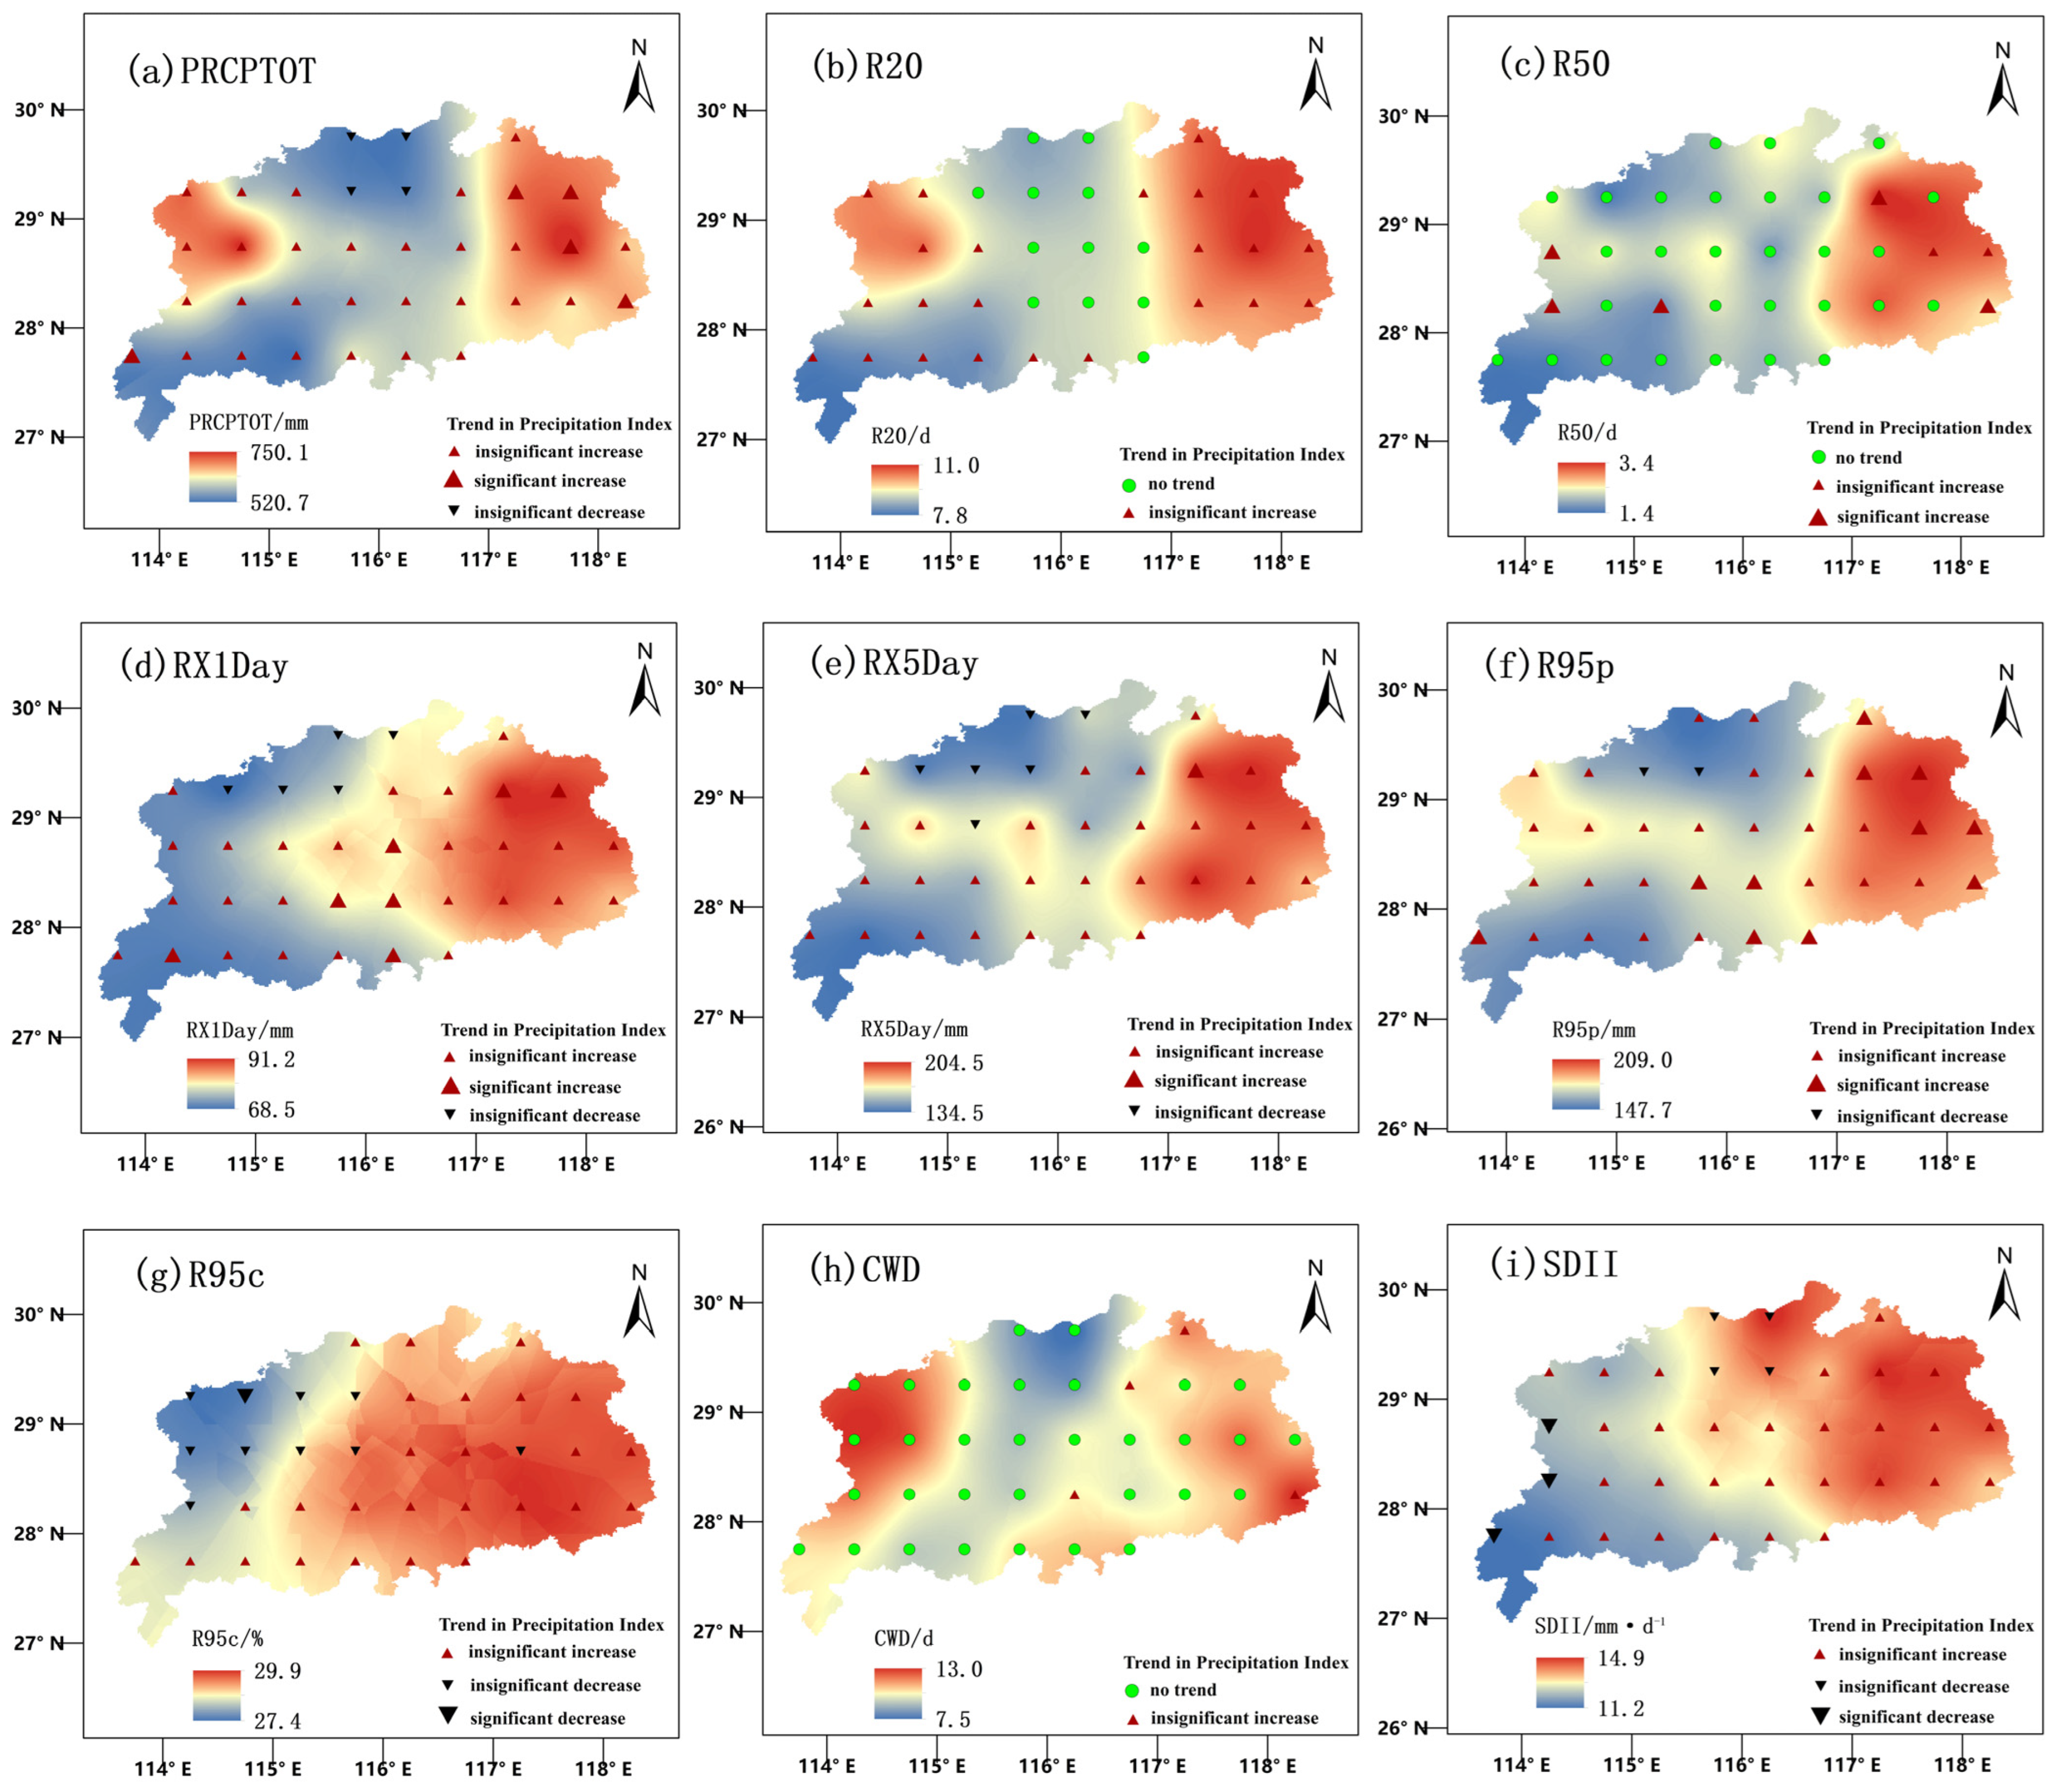
4.1.2. Spatial Characteristics Analysis
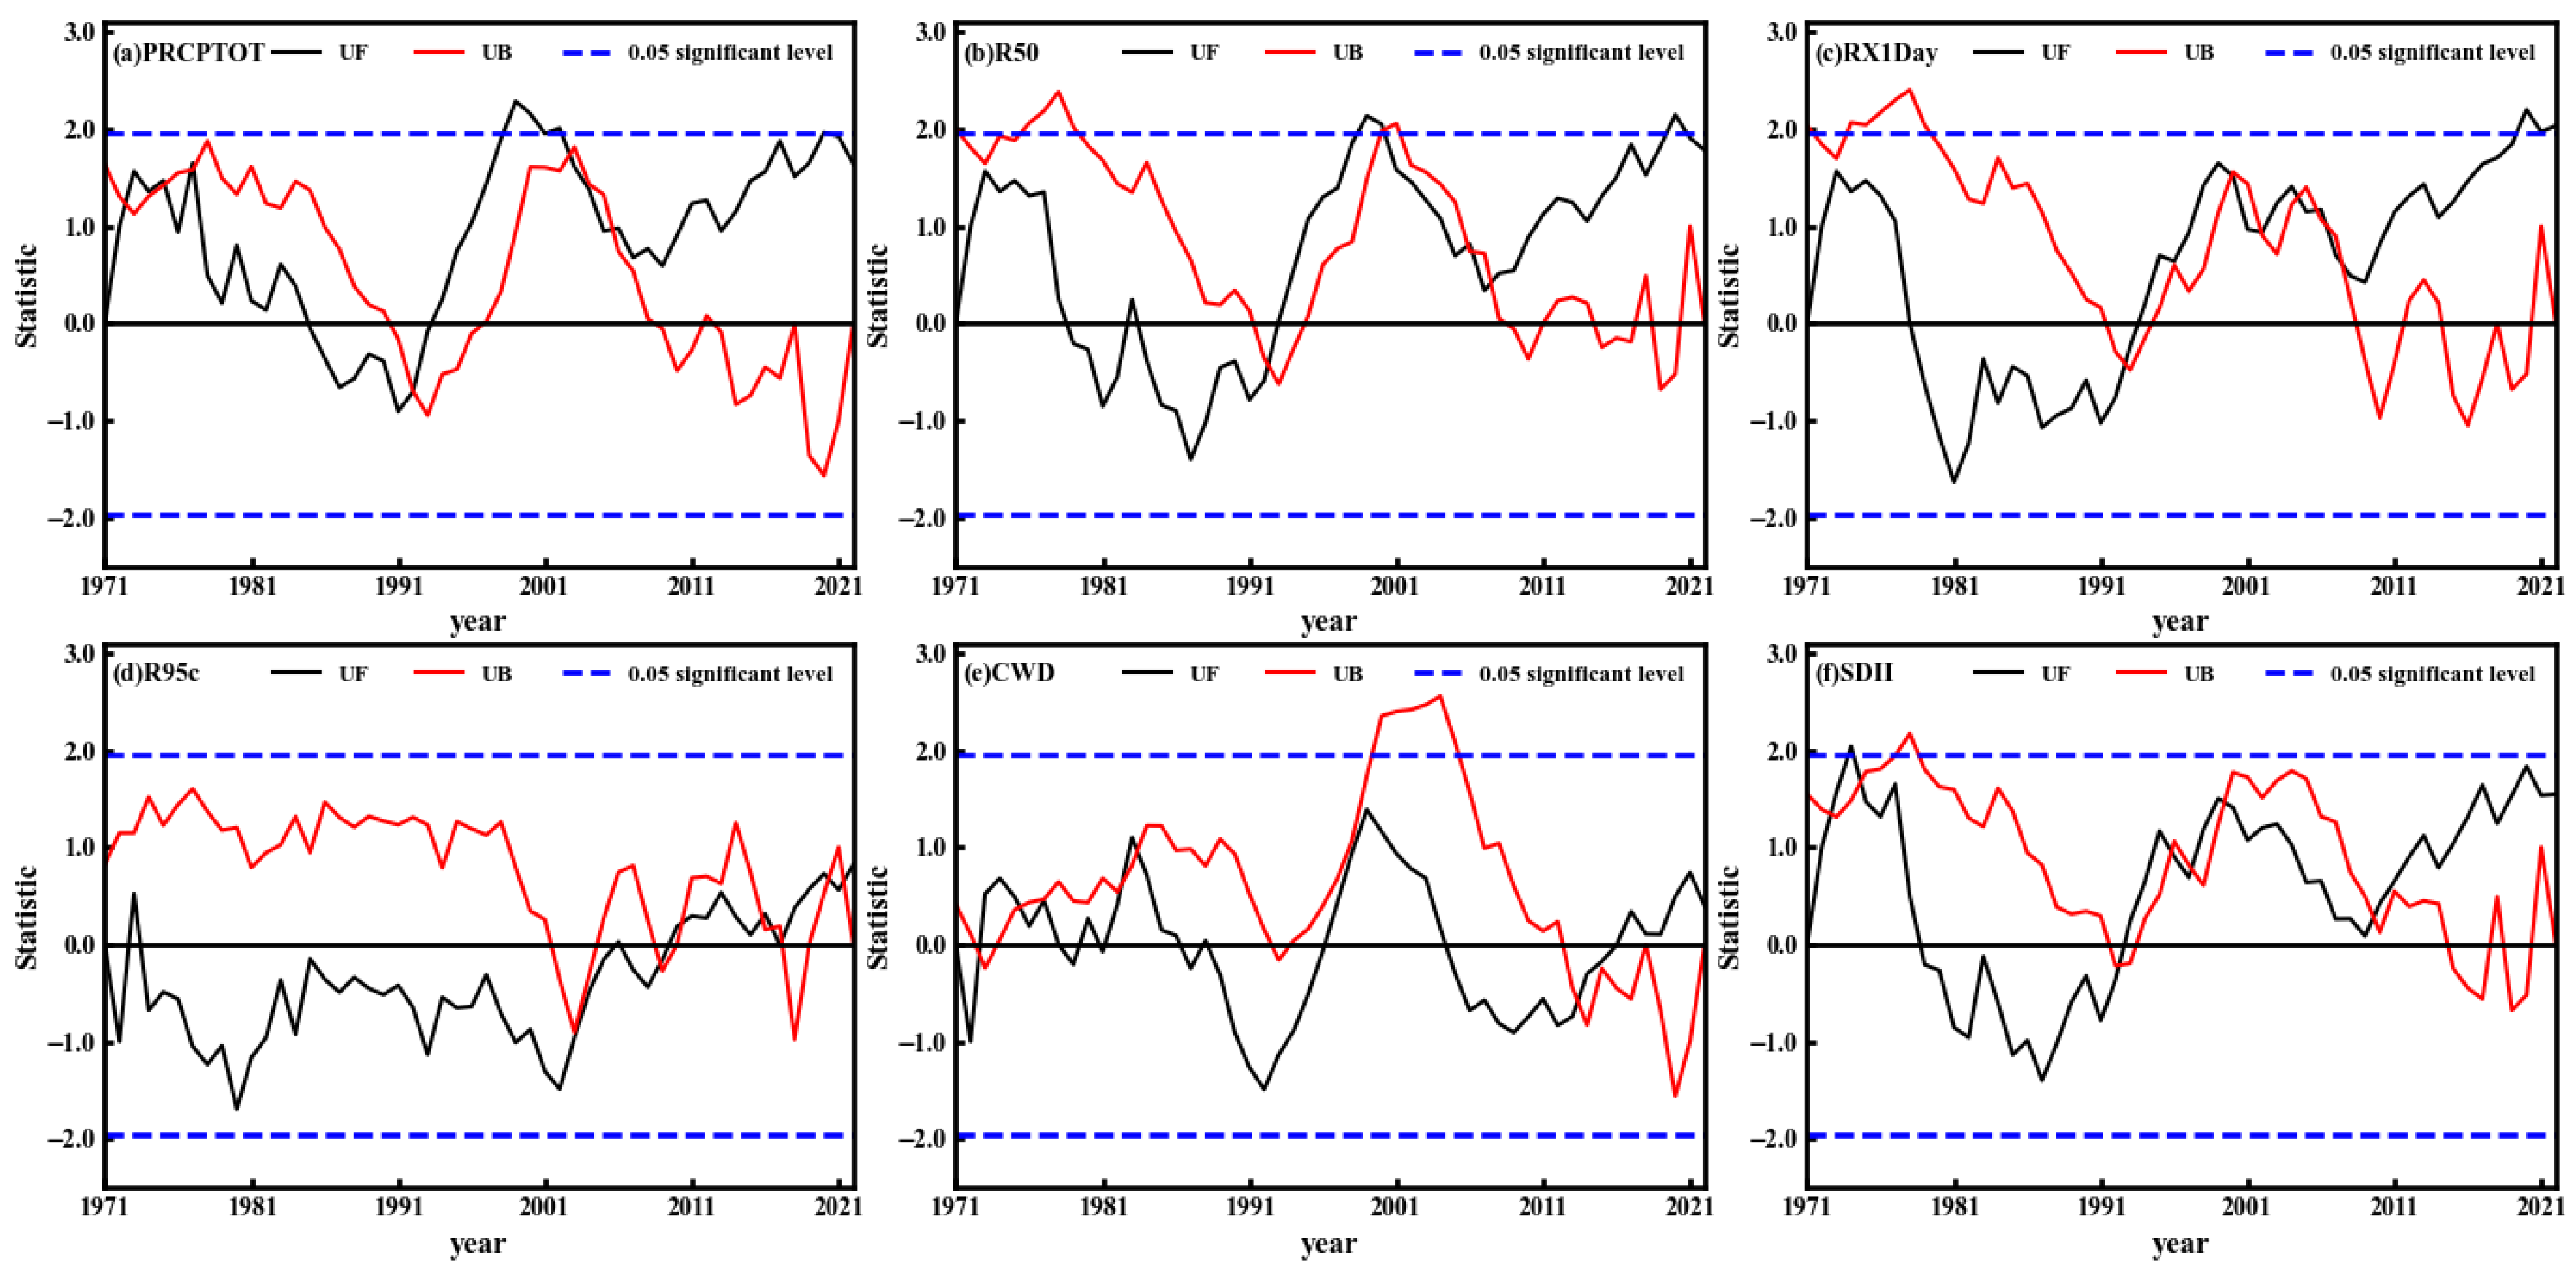
4.1.3. Mutation and Future Persistence Analysis
4.1.4. Periodic Analysis
4.1.5. The Correlation Between Extreme Precipitation and Atmospheric Circulation
4.1.6. Empirical Orthogonal Function (EOF) Analysis
4.2. Analysis of the Drivers of Extreme Precipitation
4.2.1. Circulation Anomalies
4.2.2. Anomalous Water Vapor Transport
4.2.3. Outgoing Longwave Radiation (OLR)
4.2.4. Sea Surface Temperature Anomaly
5. Conclusions
- (1)
- From 1971 to 2022, extreme precipitation indices in the PLCG showed varying degrees of increasing trends. The climatic rates of change for intensity indices were as follows: PRCPTOT (25.64 mm/10a), R95p (8.65 d/10a), R95c (0.25%/10d), RX1Day (3.29 mm/10a), and RX5Day (5.21 mm/10a). The climatic rate for the duration index CWD was 0.2 d/10a. The climatic rates for the frequency indices R20 (0.37 days/decade), R50 (0.19 days/decade), and SDII (0.27 mm/day per decade) also showed increasing trends.
- (2)
- Extreme precipitation indices in most areas of the PLCG exhibited increasing trends, with significant regional variations. R50, RX1Day, RX5Day, R95p, R95c, and SDII generally increased from west to east, whereas PRCPTOT, R20, and CWD showed an increase from the central region extending toward both the east and west. Notably, R50 and CWD did not exhibit statistically significant trends across the PLCG, while indices including PRCPTOT, RX1Day, RX5Day, R95p, R95c, and SDII showed upward trends in majority of regions.
- (3)
- Results from the Mann–Kendall mutation test applied to six extreme precipitation indices in the PLCG region from 1971 to 2022 showed that PRCPTOT, R50, RX1Day, and SDII underwent significant shifts. Among these, PRCPTOT, R50, and CWD exhibited similar fluctuation patterns characterized by a “decrease–increase–decrease–increase” sequence. RX1Day displayed a pronounced upward trend post-1993, indicating intensification of extreme precipitation events. Conversely, despite fluctuations in R95c and CWD, neither passed the significance test, suggesting their changes were not statistically significant. Overall, extreme precipitation in the PLCG region has experienced phased evolution over the past five decades, accompanied by notable structural changes in several indices.
- (4)
- The Morlet wavelet transformation indicated that R95c and CWD did not exhibit oscillations during the entire duration of the first principal cycle. In contrast, PRCPTOT, R20, R50, RX1Day, RX5Day, R95p, and SDII oscillated consistently throughout the study period, alternating between phases of high and low values. Correlation analysis revealed that extreme precipitation indices were significantly influenced by circulation indices such as EASMI, SCSMI, WPSHA, and WPSH.
- (5)
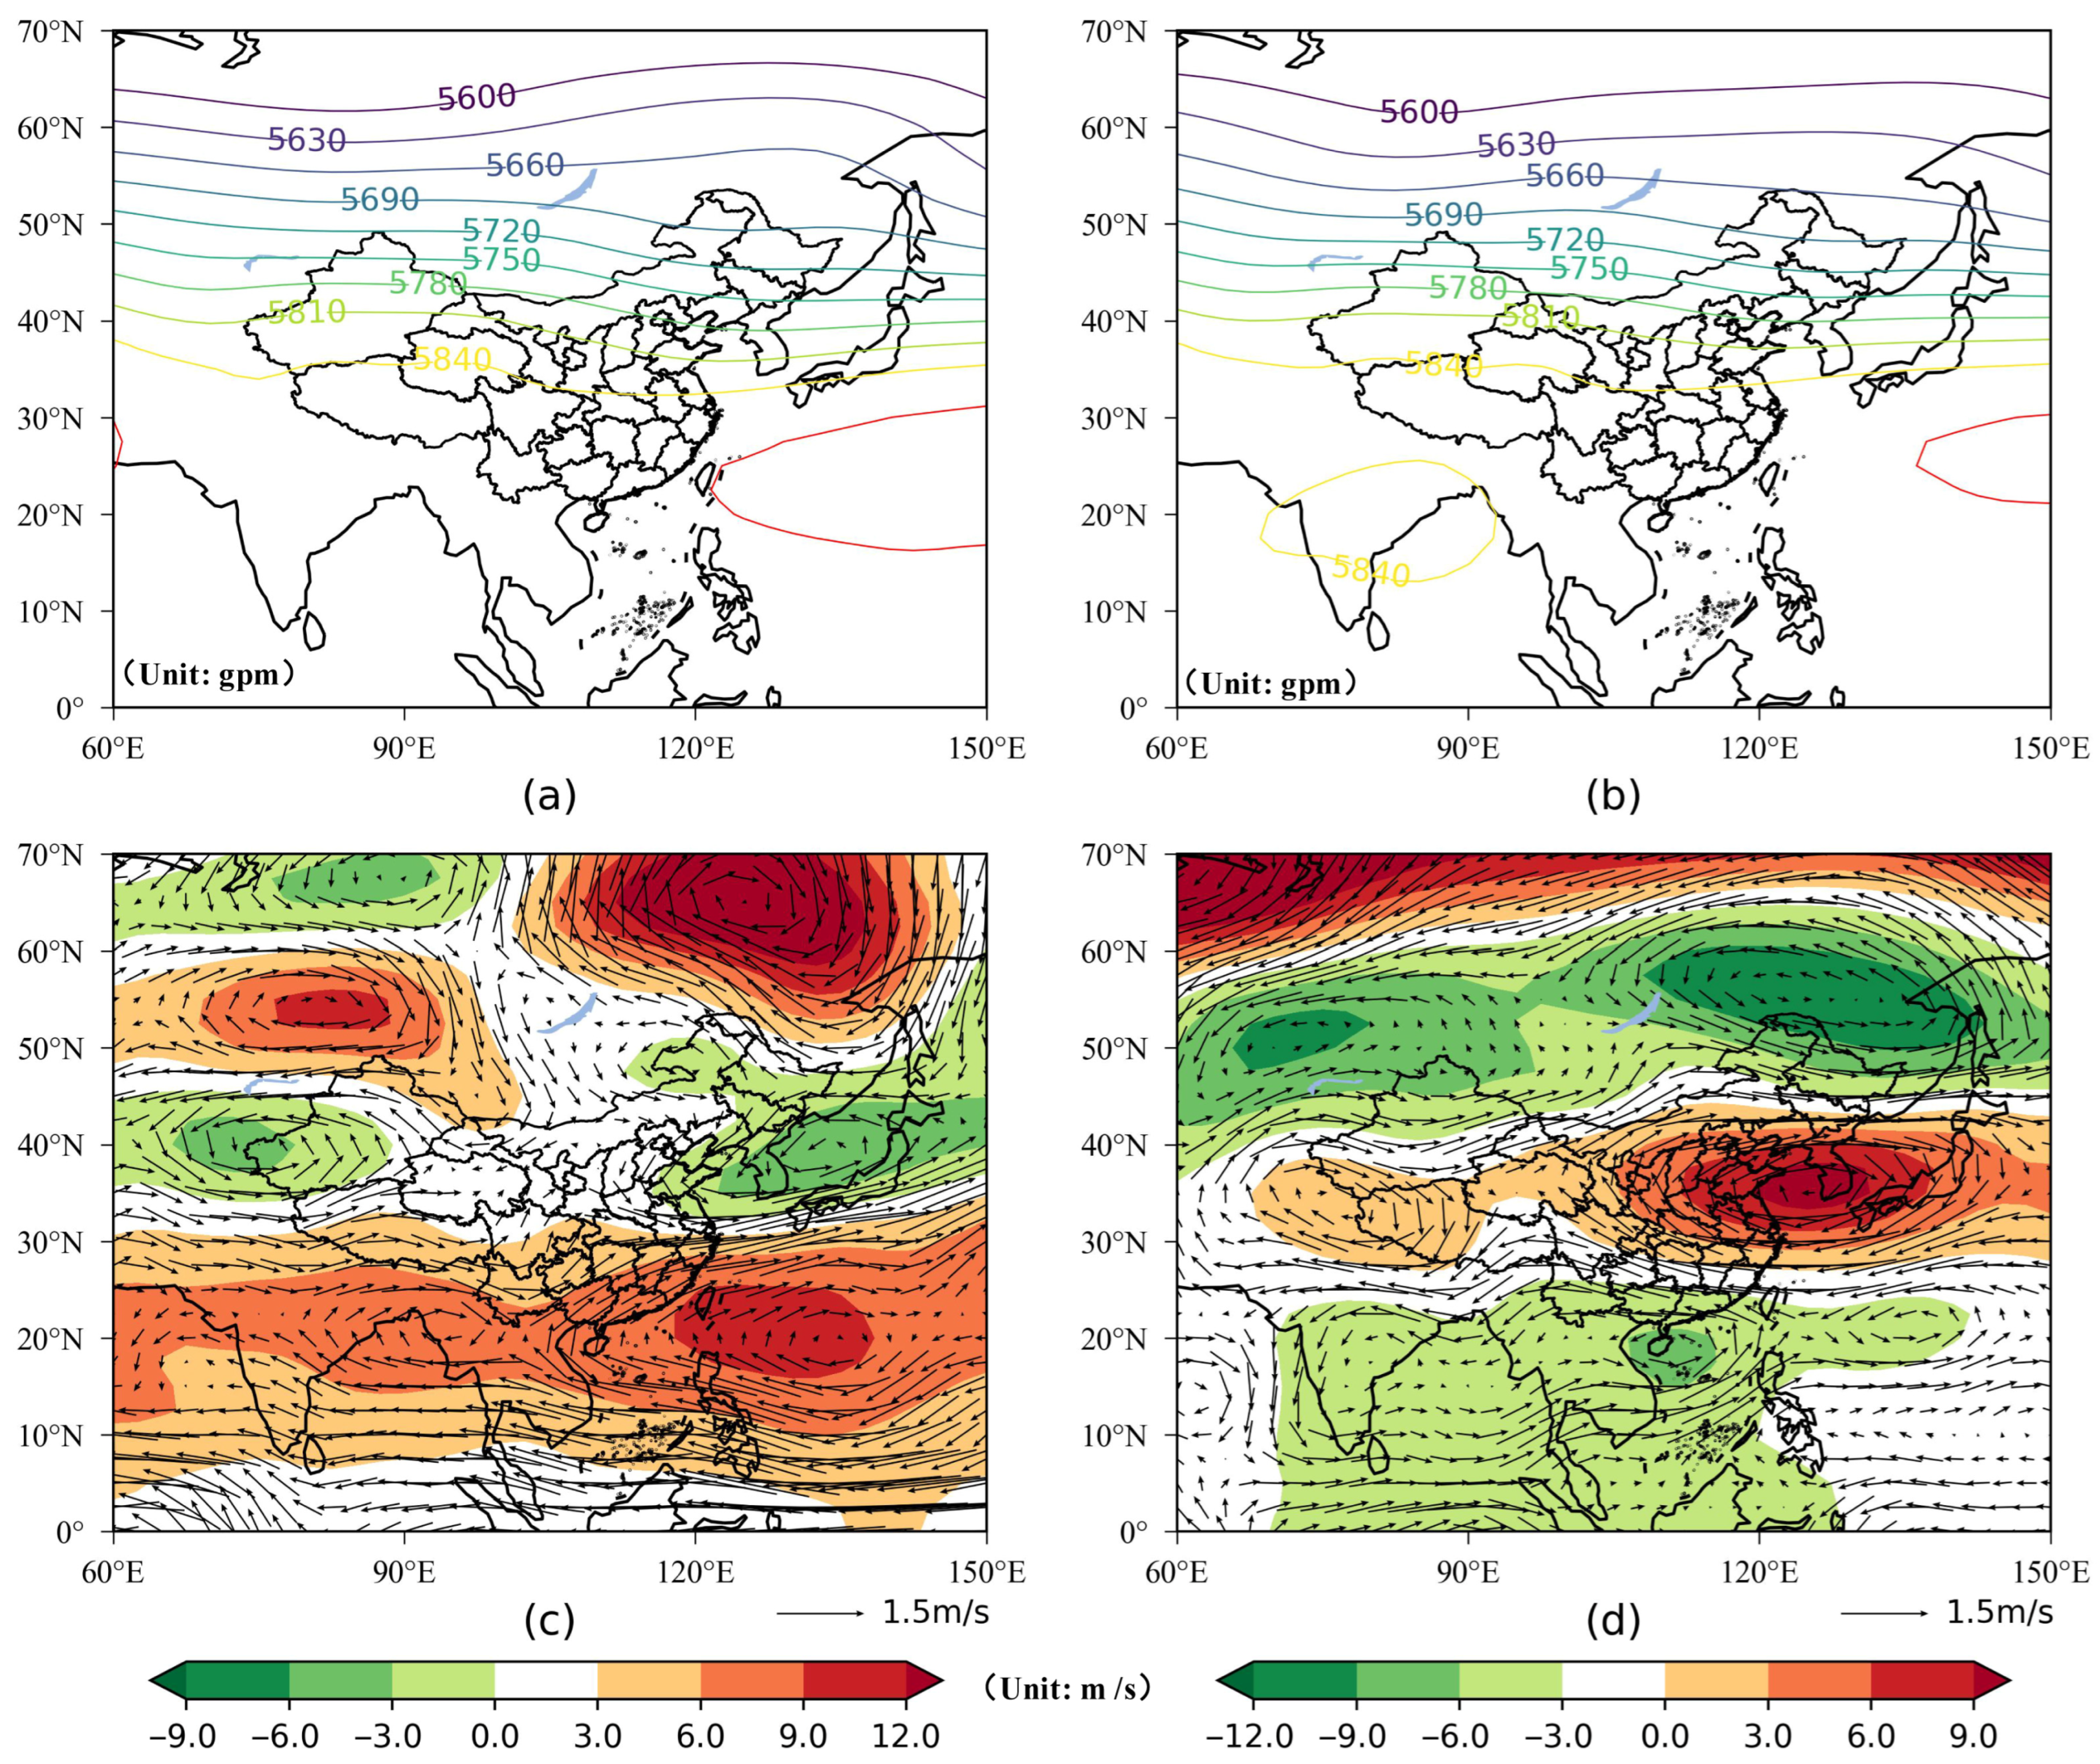
- In years characterized by a pronounced increase in extreme precipitation, the western Pacific subtropical high intensified and shifted westward. At 500 hPa, a southwest wind anomaly was observed over the PLCG, accompanied by a negative anomaly in water vapor flux divergence, indicating of strong moisture convergence. The OLR anomaly over the PLCG was negative, while sea surface temperatures in the eastern equatorial Pacific were elevated and those in the western equatorial Pacific were reduced, collectively creating favorable conditions for extreme precipitation. Conversely, during years of weak extreme precipitation, the western Pacific subtropical high was weaker and positioned further east, with a southeast wind anomaly at 500 hPa. Water vapor flux divergence anomaly over the PLCG exhibit positive anomaly, indicating moisture divergence. The PLCG was situated within a positive OLR anomaly region, and sea surface temperatures in the eastern equatorial Pacific were cooler, whereas those in the western equatorial Pacific were warmer, thereby suppressing extreme precipitation occurrence.
Author Contributions
Funding
Data Availability Statement
Acknowledgments
Conflicts of Interest
References
- Legg, S. IPCC, Climate Change 2021: The Physical Science Basis (9781009157896). Interaction 2021, 49, 44–45. [Google Scholar]
- Wang, X.-Y.; Bao, X.-Y.; Huang, Y.; Li, Z.-W.; Yong, J.-H.; Wu, Y.-P.; Feng, G.-L.; Sun, G.-Q. Physical Explanation for Paradoxical Climate Change in Semi-Arid Inland Eurasia Based on a Remodeled Precipitation Recycling Ratio and Clausius–Clapeyron Equation. Atmosphere 2023, 14, 376. [Google Scholar] [CrossRef]
- Aihaiti, A.; Jiang, Z.; Li, Y.; Tao, L.; Zhu, L.; Zhang, J. The global warming and IPO impacts on summer extreme precipitation in China. Clim. Dyn. 2023, 60, 3369–3384. [Google Scholar] [CrossRef]
- Cheng, Q.; Zhong, F.; Wang, P. Potential linkages of extreme climate events with vegetation and large-scale circulation indices in an endorheic river basin in northwest China. Atmos. Res. 2021, 247, 105256. [Google Scholar] [CrossRef]
- Ma, Q.; Li, Z.; Lei, H.; Chen, Z.; Liu, J.; Wang, S.; Su, T.; Feng, G. Interannual variability of extreme precipitation during the boreal summer over northwest China. Remote Sens. 2023, 15, 785. [Google Scholar] [CrossRef]
- Mukherjee, S.; Aadhar, S.; Stone, D.; Mishra, V. Increase in extreme precipitation events under anthropogenic warming in India. Weather. Clim. Extrem. 2018, 20, 45–53. [Google Scholar] [CrossRef]
- Ávila, A.; Justino, F.; Wilson, A.; Bromwich, D.; Amorim, M. Recent precipitation trends, flash floods and landslides in southern Brazil. Environ. Res. Lett. 2016, 11, 114029. [Google Scholar] [CrossRef]
- Duan, W.; He, B.; Nover, D.; Fan, J.; Yang, G.; Chen, W.; Meng, H.; Liu, C. Floods and associated socioeconomic damages in China over the last century. Nat. Hazards 2016, 82, 401–413. [Google Scholar] [CrossRef]
- Marengo, J.; Camarinha, P.; Alves, L.; Diniz, F.; Betts, R. Extreme Rainfall and Hydro-Geo-Meteorological Disaster Risk in 1.5, 2.0, and 4.0 °C Global Warming Scenarios: An Analysis for Brazil. Front. Clim. 2021, 3, 610433. [Google Scholar] [CrossRef]
- Neumayer, E.; Plümper, T.; Barthel, F. The political economy of natural disaster damage. Glob. Environ. Change 2014, 24, 8–19. [Google Scholar] [CrossRef]
- Yang, L.; Smith, J.; Baeck, M.L.; Zhang, Y.; Morin, E.; Goodrich, D.C.; Nikolopoulos, E.I.; Artan, G.A. Urban Impacts on Extreme Monsoon Rainfall and Flooding in Complex Terrain. Geophys. Res. Lett. 2019, 46, 5918–5927. [Google Scholar] [CrossRef]
- Ma, S.; Zhou, T.; Dai, A.; Han, Z. Observed Changes in the Distributions of Daily Precipitation Frequency and Amount over China from 1960 to 2013. J. Clim. 2015, 28, 6960–6978. [Google Scholar] [CrossRef]
- Wu, H.T.J.; Lau, W.K.M. Detecting climate signals in precipitation extremes from TRMM (1998–2013)—Increasing contrast between wet and dry extremes during the “global warming hiatus”. Geophys. Res. Lett. 2016, 43, 1340–1348. [Google Scholar] [CrossRef]
- Donat, M.G.; Lowry, A.L.; Alexander, L.V.; O’Gorman, P.A.; Maher, N. More extreme precipitation in the world’s dry and wet regions. Nat. Clim. Change 2016, 6, 508–513. [Google Scholar] [CrossRef]
- Kunkel, K.E.; Karl, T.R.; Squires, M.F.; Yin, X.; Stegall, S.T.; Easterling, D.R. Precipitation Extremes: Trends and Relationships with Average Precipitation and Precipitable Water in the Contiguous United States. J. Appl. Meteorol. Climatol. 2020, 59, 125–142. [Google Scholar] [CrossRef]
- Cheng, X.; Fang, J.; Lei, X. Analysis on the Frequency of Extreme Precipitation in Midsummer in Shaanxi and Its Teleconnection with Global Sea Surface Temperature. J. Arid. Meteorol. 2014, 32, 38–45. [Google Scholar]
- Wu, S.; Hu, Z.; Wang, Z.; Cao, S.; Yang, Y.; Qu, X.; Zhao, W. Spatiotemporal variations in extreme precipitation on the middle and lower reaches of the Yangtze River Basin (1970–2018). Quat. Int. 2021, 592, 80–96. [Google Scholar] [CrossRef]
- Dong, T.; Zhu, X.; Deng, R.; Ma, Y.; Dong, W. Detection and attribution of extreme precipitation events over the Asian monsoon region. Weather. Clim. Extrem. 2022, 38, 100497. [Google Scholar] [CrossRef]
- Zhang, L.; Li, Y.; Zhang, F.; Chen, L.; Pan, T.; Wang, B.; Ren, C. Changes of winter extreme precipitation in Heilongjiang province and the diagnostic analysis of its circulation features. Atmos. Res. 2020, 245, 105094. [Google Scholar] [CrossRef]
- Toreti, A.; Fioravanti, G.; Perconti, W.; Desiato, F. Annual and seasonal precipitation over Italy from 1961 to 2006. Int. J. Climatol. 2009, 29, 1976–1987. [Google Scholar] [CrossRef]
- Shi, J.; Wei, P.; Cui, L.; Zhang, B. Spatio-temporal characteristics of extreme precipitation in East China from 1961 to 2015. Meteorol. Z. 2018, 27, 377–390. [Google Scholar] [CrossRef]
- Si, D.; Liu, Y.; Shao, X. Oceanic and atmospheric circulation anomalies and their impacts on Chinese climate in 2015–2016. Meteorology 2016, 42, 481–488. [Google Scholar] [CrossRef]
- Wei, W.; Yan, Z.; Li, Z. Influence of Pacific Decadal Oscillation on global precipitation extremes. Environ. Res. Lett. 2021, 16, 044031. [Google Scholar] [CrossRef]
- Huang, W.; Chang, S.; Xie, C.; Zhang, Z. Moisture sources of extreme summer precipitation events in North Xinjiang and their relationship with atmospheric circulation. Adv. Clim. Change Res. 2017, 8, 12–17. [Google Scholar] [CrossRef]
- Guan, W.; Hu, H.; Ren, X.; Yang, X. Subseasonal zonal variability of the western Pacific subtropical high in summer: Climate impacts and underlying mechanisms. Clim. Dyn. 2019, 53, 3325–3344. [Google Scholar] [CrossRef]
- Ren, X.; Yang, X.; Sun, X. Zonal Oscillation of Western Pacific Subtropical High and Subseasonal SST Variations during Yangtze Persistent Heavy Rainfall Events. J. Clim. 2013, 26, 8929–8946. [Google Scholar] [CrossRef]
- Yan, Y.; Wang, H.; Li, G.; Xia, J.; Ge, F.; Zeng, Q.; Ren, X.; Tan, L. Projection of future extreme precipitation in China based on the CMIP6 from a machine learning perspective. Remote Sens. 2022, 14, 4033. [Google Scholar] [CrossRef]
- Yang, L.; Zhao, J.; Feng, G. Characteristics and differences of summertime moisture transport associated with four rainfall patterns over eastern China monsoon region. Chinese J. Atmos. Sci. 2018, 42, 81–95. [Google Scholar] [CrossRef]
- Li, Y.; Wu, Y.; Zhou, J.; Xiang, B.; He, J.; Huang, D. Characteristics of Water Vapor Transport for Extreme Summer Precipitation in the Eastern Southwest China and Its Impact Mechanism. Atmosphere 2023, 14, 1328. [Google Scholar] [CrossRef]
- Zhou, Z.Q.; Xie, S.P.; Zhang, R. Historic Yangtze flooding of 2020 tied to extreme Indian Ocean conditions. Proc. Natl. Acad. Sci. USA 2021, 118, e2022255118. [Google Scholar] [CrossRef]
- Tang, Y.; Huang, A.; Wu, P.; Huang, D.; Xue, D.; Wu, Y. Drivers of Summer Extreme Precipitation Events Over East China. Geophys. Res. Lett. 2021, 48, e2021GL093670. [Google Scholar] [CrossRef]
- Zhang, Q.; Zheng, Y.; Singh, V.; Luo, M.; Xie, Z. Summer extreme precipitation in eastern China: Mechanisms and impacts. J. Geophys. Res. Atmos. 2017, 122, 2766–2778. [Google Scholar] [CrossRef]
- Guan, Y.; Zheng, F.; Zhang, X.; Wang, B. Trends and variability of daily precipitation and extremes during 1960–2012 in the Yangtze River Basin, China. Int. J. Climatol. 2017, 37, 1282–1298. [Google Scholar] [CrossRef]
- Li, X.; Hu, Q. Spatiotemporal changes in extreme precipitation and its dependence on topography over the Poyang Lake Basin, China. Adv. Meteorol. 2019, 2019, 1253932. [Google Scholar] [CrossRef]
- Zhan, M.; Wu, Q.; Zhan, L.; Xin, J. Change in extreme precipitation events: Exposure and vulnerability in the Poyang Lake Basin, China. Front. Earth Sci. 2023, 11, 1125837. [Google Scholar] [CrossRef]
- Li, X.; Hu, Q.; Wang, R.; Zhang, D.; Zhang, Q. Influences of the timing of extreme precipitation on floods in Poyang Lake, China. Hydrol. Res. 2021, 52, 26–42. [Google Scholar] [CrossRef]
- Deng, C.; Zhang, Y.; Ma, M.; Chen, Y.; Wei, J.; Kunstmann, H.; Gao, L. Compound temporal-spatial extreme precipitation events in the Poyang Lake Basin of China. J. Hydrol. Reg. Stud. 2025, 58, 102270. [Google Scholar] [CrossRef]
- Zhang, Q.; Xiao, M.; Singh, V.P.; Wang, Y. Spatiotemporal variations of temperature and precipitation extremes in the Poyang Lake basin, China. Theor. Appl. Climatol. 2016, 124, 855–864. [Google Scholar] [CrossRef]
- Han, J.; Miao, C.; Gou, J.; Zheng, H.; Zhang, Q.; Guo, X. A new daily gridded precipitation dataset for the Chinese mainland based on gauge observations. Earth Syst. Sci. Data 2023, 15, 3147–3161. [Google Scholar] [CrossRef]
- Alexander, L.V.; Zhang, X.; Peterson, T.C.; Caesar, J.; Gleason, B.; Klein Tank, A.M.G.; Haylock, M.; Haylock, M.; Collins, D.; Trewim, B.; et al. Global observed changes in daily climate extremes of temperature and precipitation. J. Geophys. Res. Atmos. 2006, 111. [Google Scholar] [CrossRef]
- Lorenz, E.N. Empirical Orthogonal Function and Statistical Weather Prediction; Scientific Report 1; Massauchets Institute of Technology: Cambridge, MA, USA, 1956; p. 49. [Google Scholar]
- Wang, L.; Yao, Z.J.; Jiang, L.G.; Wang, R.; Wu, S.S.; Liu, Z.F. Changes in climate extremes and catastrophic events in the Mongolian Plateau from 1951 to 2012. J. Appl. Meteorol. Climatol. 2016, 55, 1169–1182. [Google Scholar] [CrossRef]
- Shao, Q.; Li, Z.; Xu, Z. Trend detection in hydrological time series by segment regression with application to Shiyang River Basin. Stoch. Environ. Res. Risk Assess. 2010, 24, 221–233. [Google Scholar] [CrossRef]
- An, B.; Zhou, W.; Xia, W.; Yang, H. Analysis of hydrological element variation characteristics in the Erlang River Basin. J. Water Resour. Archit. Eng. 2019, 17, 239–243. [Google Scholar]
- Chong, K.L.; Huang, Y.F.; Koo, C.H.; Ahmed, A.N.; El-Shafie, A. Spatiotemporal variability analysis of standardized precipitation indexed droughts using wavelet transform. J. Hydrol. 2022, 605, 127299. [Google Scholar] [CrossRef]
- Ullah, W.; Wang, G.; Lou, D.; Ullah, S.; Bhatti, A.S.; Ullah, S.; Karim, A.; Hagan, D.; Ali, G. Large-scale atmospheric circulation patterns associated with extreme monsoon precipitation in Pakistan during 1981–2018. Atmos. Res. 2021, 253, 105489. [Google Scholar] [CrossRef]
- Zhou, C.; Tang, X.; Deng, B. Characteristics of Precipitation and Analysis of Moisture Sources in a Severe Rainstorm Disaster in Sichuan. Plateau Meteorol. 2015, 34, 1636–1647. [Google Scholar] [CrossRef]
- Chen, H.; Xu, H.; Ma, J.; Deng, J. Characteristics of Air-Sea Interaction Associated with Large-Scale Sea Surface Temperature Warm Anomalies over the North Pacific in Winter on Submonthly Timescales. Chin. J. Atmos. Sci. 2022, 46, 293–308. [Google Scholar]


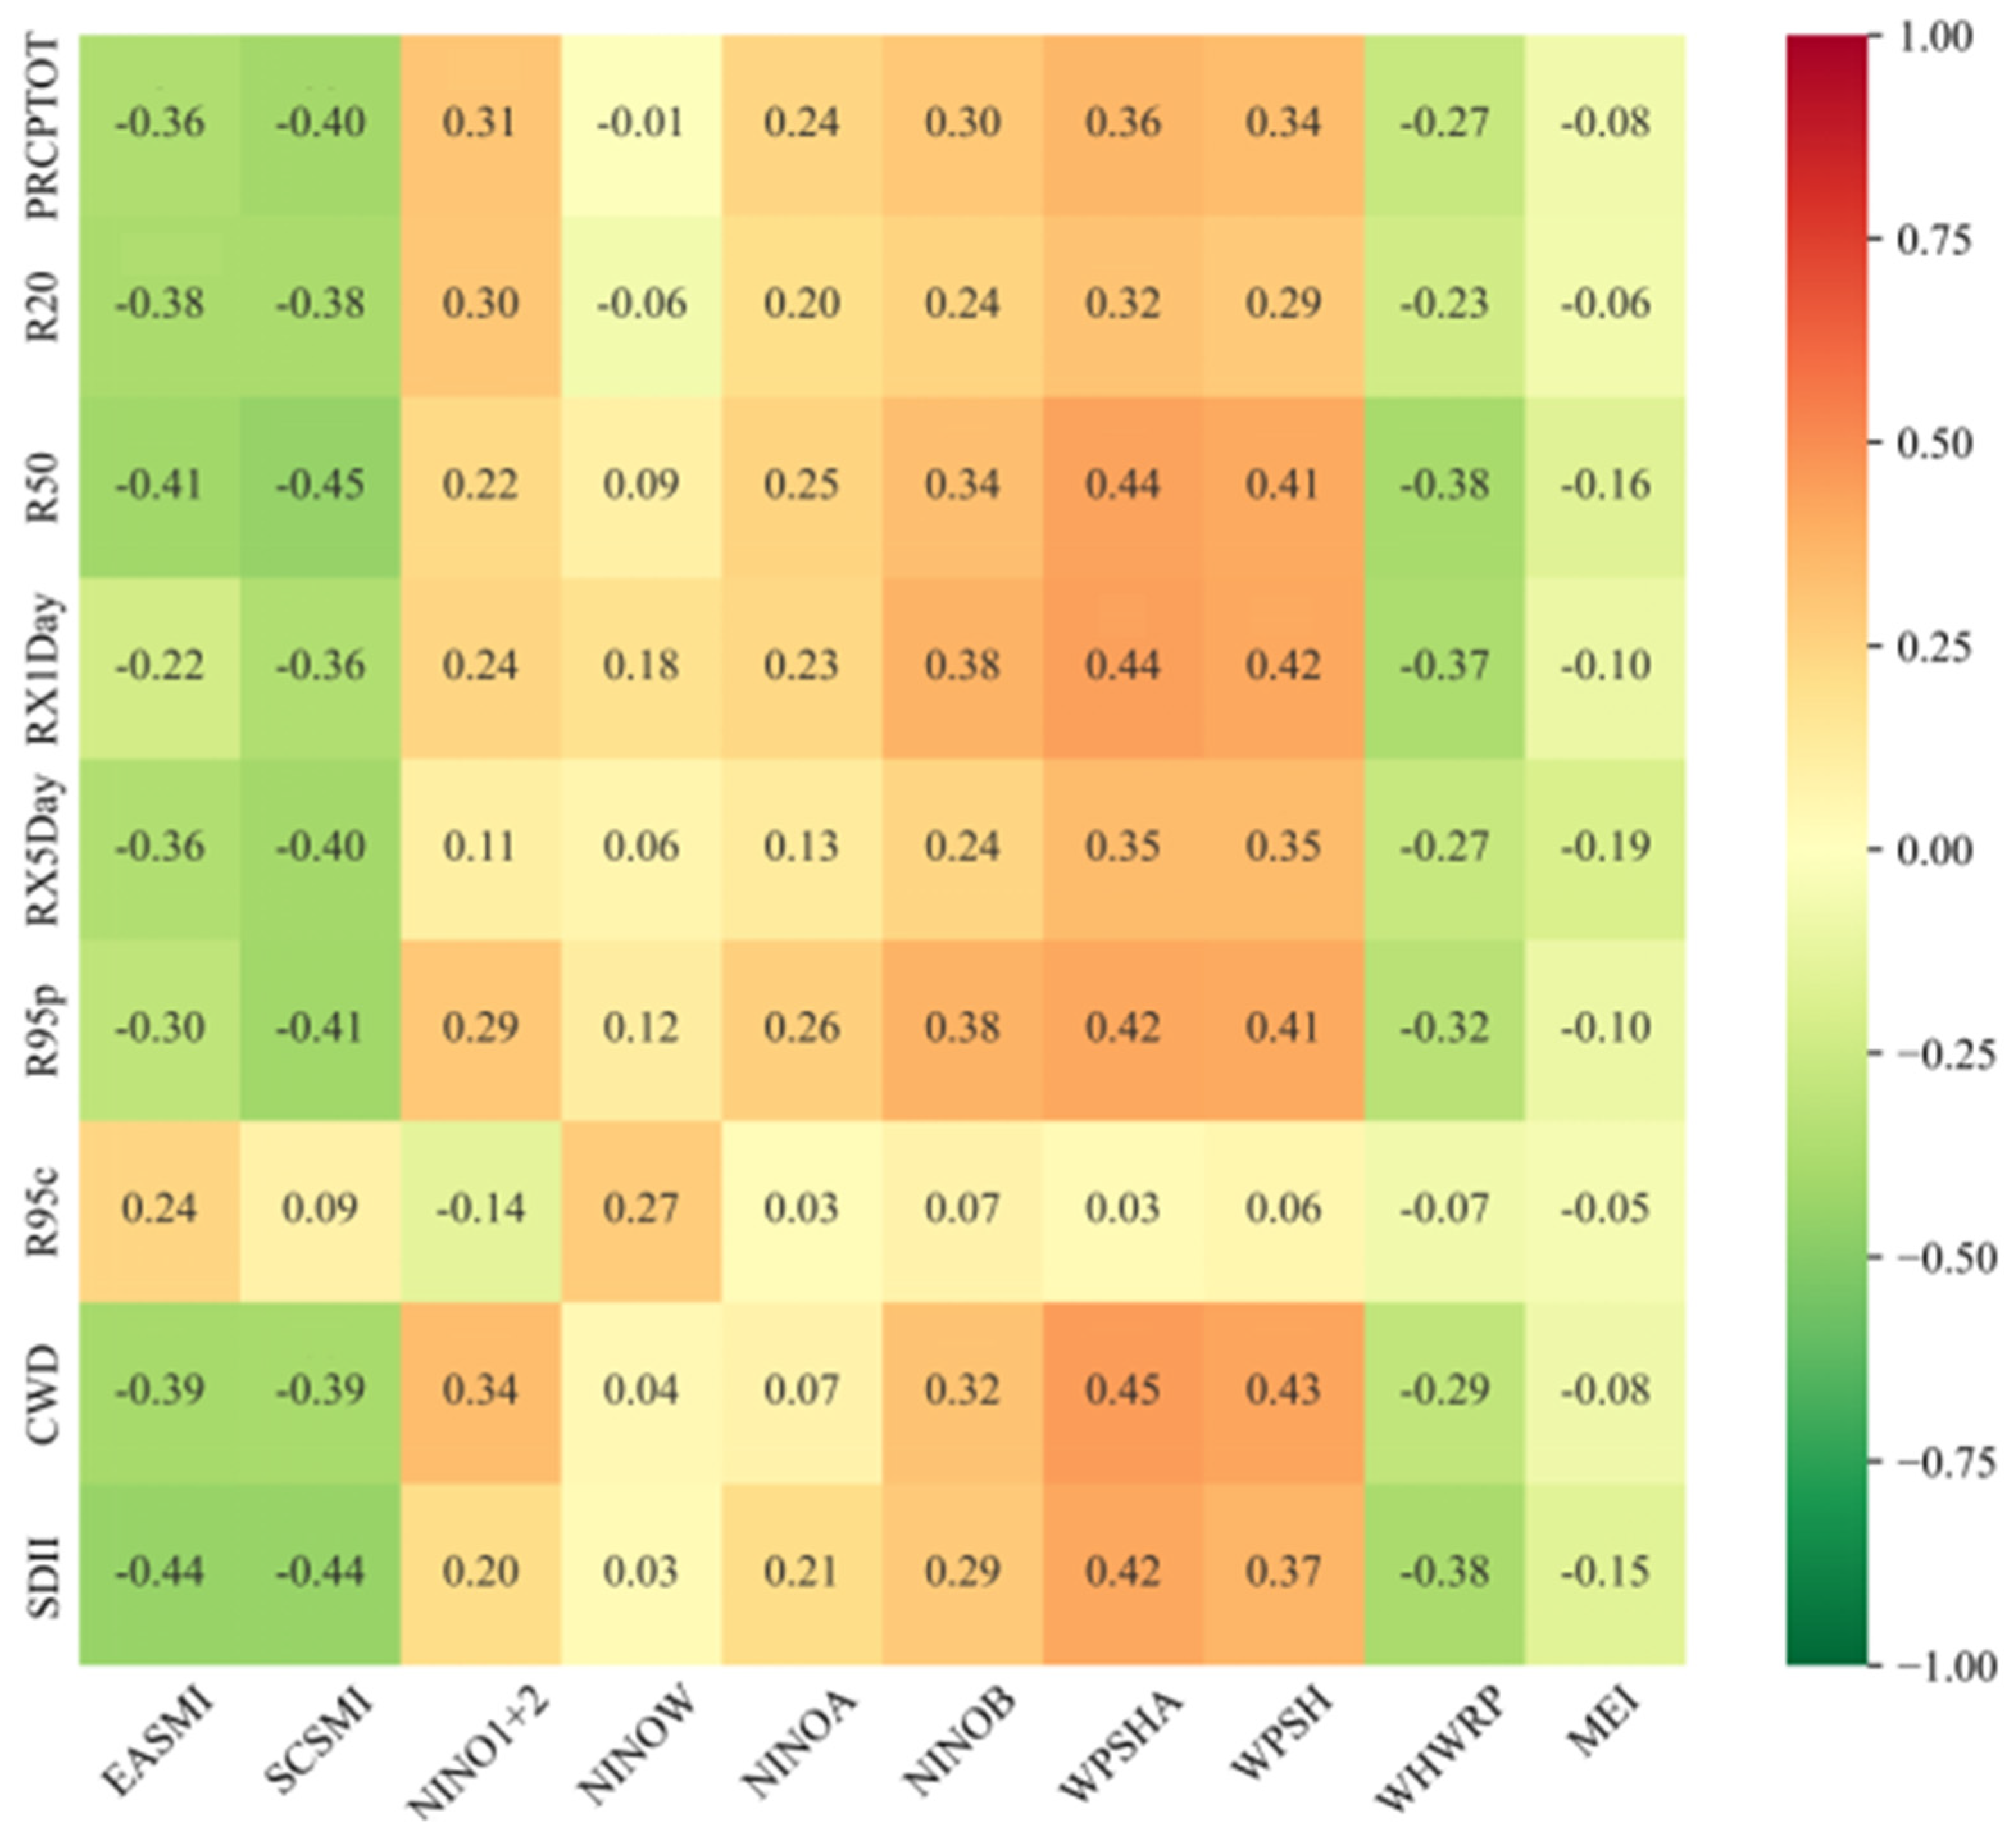



| Atmospheric Circulation Indices | Abbreviation | Source Website |
|---|---|---|
| East Asian Summer Monsoon Index | EASMI | http://lijianping.cn/dct/page/1 (accessed on 12 October 2024) |
| South China Sea Summer Monsoon Index | SCSMI | |
| The NINO 1+2 region sea surface temperature anomaly index | NINO1+2 | http://ncc-cma.net/cn/ (accessed on 30 September 2024) |
| The NINO W region sea surface temperature anomaly index | NINOW | |
| The NINO A region sea surface temperature anomaly index | NINOA | |
| The NINO B region sea surface temperature anomaly index | NINOB | |
| Western Pacific Subtropical High Area Index | WPSHA | |
| Western Pacific Subtropical High-Intensity Index | WPSH | |
| Western Pacific Sub Tropical High Western Ridge Point Index | WHWRP | |
| Multivariate El Niño Index | MEI | https://psl.noaa.gov/enso/mei/ (accessed on 18 November 2024) |
| Index | Name | Definition | Unit |
|---|---|---|---|
| PRCPTOT | annual precipitation total | total precipitation amount with daily rainfall ≥1 mm within the year | mm |
| R20 | number of heavy rain days | number of days with daily rainfall ≥20 mm within the year | d |
| R50 | number of rainstorm days | number of days with daily rainfall ≥50 mm within the year | d |
| RX1Day | annual maximum daily precipitation | maximum daily precipitation within the year | mm |
| RX5Day | maximum total precipitation over a continuous period of 5 days | maximum total precipitation over a continuous period of 5 days within the year | mm |
| R95p | extreme precipitation | annual cumulative precipitation with daily rainfall ≥95% threshold | mm |
| R95c | contribution rate of extreme precipitation | proportion of extreme precipitation to annual precipitation total | % |
| CWD | number of consecutive wet days | longest duration of days with daily rainfall ≥1mm within the year | d |
| SDII | daily precipitation intensity | ratio of total annual precipitation to the number of precipitation days (≥1 mm) | mm/d |
| Indices | PRCPTOT | R20 | R50 | RX1Day | RX5Day | R95p | R95c | CWD | SDII |
|---|---|---|---|---|---|---|---|---|---|
| H value | 0.78 | 0.74 | 0.72 | 0.68 | 0.64 | 0.76 | 0.55 | 0.96 | 0.73 |
| Index | First Primary Period | Second Primary Period | Third Primary Period | Fourth Primary Period |
|---|---|---|---|---|
| PRCPTOT | 39 | 26 | 7 | 5 |
| R20 | 39 | 26 | 5 | 7 |
| R50 | 38 | 26 | 7 | - |
| RX1Day | 38 | 11 | 20 | 26 |
| RX5Day | 38 | 7 | 11 | 20 |
| R95p | 39 | 26 | 20 | 7 |
| R95c | 11 | 26 | 5 | 17 |
| CWD | 26 | 39 | 5 | 7 |
| SDII | 38 | 26 | 7 | 12 |
Disclaimer/Publisher’s Note: The statements, opinions and data contained in all publications are solely those of the individual author(s) and contributor(s) and not of MDPI and/or the editor(s). MDPI and/or the editor(s) disclaim responsibility for any injury to people or property resulting from any ideas, methods, instructions or products referred to in the content. |
© 2025 by the authors. Licensee MDPI, Basel, Switzerland. This article is an open access article distributed under the terms and conditions of the Creative Commons Attribution (CC BY) license (https://creativecommons.org/licenses/by/4.0/).
Share and Cite
Liu, H.; Zhang, Z.; Liu, B. Spatial–Temporal Characteristics and Drivers of Summer Extreme Precipitation in the Poyang Lake City Group (PLCG) from 1971 to 2022. Remote Sens. 2025, 17, 2915. https://doi.org/10.3390/rs17162915
Liu H, Zhang Z, Liu B. Spatial–Temporal Characteristics and Drivers of Summer Extreme Precipitation in the Poyang Lake City Group (PLCG) from 1971 to 2022. Remote Sensing. 2025; 17(16):2915. https://doi.org/10.3390/rs17162915
Chicago/Turabian StyleLiu, Hua, Ziqing Zhang, and Bo Liu. 2025. "Spatial–Temporal Characteristics and Drivers of Summer Extreme Precipitation in the Poyang Lake City Group (PLCG) from 1971 to 2022" Remote Sensing 17, no. 16: 2915. https://doi.org/10.3390/rs17162915
APA StyleLiu, H., Zhang, Z., & Liu, B. (2025). Spatial–Temporal Characteristics and Drivers of Summer Extreme Precipitation in the Poyang Lake City Group (PLCG) from 1971 to 2022. Remote Sensing, 17(16), 2915. https://doi.org/10.3390/rs17162915


