Article

Integrating Multi-Temporal Landsat and Sentinel Data for Enhanced Oil Palm Plantation Mapping and Age Estimation in Malaysia

by
Caihui Li
1,2,
Bangqian Chen
2,
Xincheng Wang
2,3,
Meilina Ong-Abdullah
4,
Zhixiang Wu
2,
Guoyu Lan
2,
Kamil Azmi Tohiran
4,
Bettycopa Amit
4,
Hongyan Lai
2,
Guizhen Wang
2,
Ting Yun
3 and
Weili Kou
1,*
1
College of Soil and Water Conservation, Southwest Forestry University, Kunming 650233, China
2
Hainan Danzhou Agro-Ecosystem National Observation and Research Station, State Key Laboratory Incubation Base for Cultivation & Physiology of Tropical Crops, Rubber Research Institute (RRI), Chinese Academy of Tropical Agricultural Sciences (CATAS), Haikou 571101, China
3
Co-Innovation Center for Sustainable Forestry in Southern China, Nanjing Forestry University, Nanjing 210037, China
4
Biology and Sustainability Research Division, Malaysian Palm Oil Board (MPOB), 6 Persiaran Institusi, Bandar Baru Bangi, Kajang 43000, Selangor Darul Ehsan, Malaysia
*
Author to whom correspondence should be addressed.
Remote Sens. 2025, 17(16), 2908; https://doi.org/10.3390/rs17162908
Submission received: 2 July 2025 / Revised: 14 August 2025 / Accepted: 17 August 2025 / Published: 20 August 2025

Abstract

Mapping the oil palm (Elaeis guineensis), the globally leading oil-bearing crop and a crucial industrial commodity, is of vital importance for food security and raw material supply. However, existing remote sensing approaches for oil palm mapping present several methodological challenges including temporal resolution constraints, suboptimal feature parameterization, and limitations in age structure assessment. This study addresses these gaps by systematically optimizing temporal, spatial, and textural parameters for enhanced oil palm mapping and age structure analysis through integration of Landsat 4/5/7/8/9, Sentinel-2 multispectral, and Sentinel-1 radar data (LSMR). Analysis of oil palm distribution and dynamics in Malaysia revealed several key insights: (1) Methodological optimization: The integrated LSMR approach achieved 94% classification accuracy through optimal parameter configuration (3-month temporal interval, 3-pixel median filter, and 3 × 3 GLCM window), significantly outperforming conventional single-sensor approaches. (2) Age estimation capabilities: The adapted LandTrendr algorithm enabled precise estimation of the plantation establishment year with an RMSE of 1.14 years, effectively overcoming saturation effects that limit traditional regression-based methods. (3) Regional expansion patterns: West Malaysia exhibits continued plantation expansion, particularly in Johor and Pahang states, while East Malaysia shows significant contraction in Sarawak (3.34 × 10⁵ hectares decline from 2019–2023), with both regions now converging toward similar topographic preferences (100–120 m elevation, 6–7° slopes). (4) Age structure concerns: Analysis identified a critical “replanting gap” with 13.3% of plantations exceeding their 25-year optimal lifespan and declining proportions of young plantations (from 60% to 47%) over the past five years. These findings provide crucial insights for sustainable land management strategies, offering policymakers an evidence-based framework to balance economic productivity with environmental conservation while addressing the identified replanting gap in one of the world’s most important agricultural commodities.

1. Introduction

The oil palm (Elaeis guineensis), predominantly cultivated in Southeast Asia, is a vital economic crop and significant contributor to global food security and renewable energy resources as biodiesel feedstock [1,2]. As the world’s highest-yielding oilseed crop, it produces 5–6 times more than peanuts and 9–10 times more than soybeans, with the yields varying according to plantation age and geographical location [3]. In Malaysia, oil palm represents both a cornerstone of the national economy and a major component of the international oil market, with its products in high demand across food, cosmetic, and biofuel industries [4]. However, the expansion of cultivation has generated significant environmental and social challenges, including biodiversity loss and deforestation [5,6,7,8,9,10]. Consequently, rigorous monitoring of changes in oil palm plantations is essential for advancing the sustainable development of the oil palm industry.
Remote sensing offers an efficient approach for monitoring extensive agricultural land, providing rapid assessments of land use and crop health from high altitudes [11,12,13]. This technology enhances monitoring efficiency while supporting improved resource management and crop productivity [14,15,16,17]. Research on oil palm plantation mapping experienced significant growth after 2010, peaking in 2018–2022, with Malaysia and Indonesia representing the primary focus areas, accounting for 76% of published studies (Figure 1). Recent advances in multi-source remote sensing have overcome challenges in tropical environments through the integration of optical and radar platforms. Multi-source data integration addresses the inherent limitations of individual sensors, with optical data providing spectral information for vegetation discrimination while radar data offer cloud-penetrating capabilities essential for consistent monitoring in tropical regions characterized by persistent cloud cover [18,19]. For instance, Cheng et al. (2019) combined ALOS PALSAR with Landsat data using support vector machine (SVM) and Mahalanobis distance method (MDM) algorithms to map Malaysia’s oil palm distribution from 2007 to 2016 with 95.37% accuracy [20]. Similarly, Mohd Najib et al. (2019) demonstrated how combining ALOS PALSAR-2, Landsat, and Sentinel data achieved classification accuracies exceeding 98% for Peninsular Malaysia [21]. Additionally, progress has been made in distinguishing industrial and smallholder plantations through their distinctive spatial patterns, with recent studies employing convolutional neural networks to differentiate these plantation types at high resolution [22,23].
Despite these advances, three specific limitations restrict the effectiveness of current oil palm monitoring approaches, particularly for comprehensive age structure analysis and plantation dynamics in Malaysia. First, the temporal dimension represents a critical yet underexplored aspect of oil palm detection. While oil palm exhibits distinct phenological patterns throughout its growth cycle, existing studies have not systematically investigated the optimal temporal resolution for capturing these spectral dynamics. Li et al. (2020) utilized multi-year Landsat data to map Malaysian oil palm plantations from 2000 to 2018 but relied on discrete annual composites rather than exploring how different temporal aggregation intervals affect classification performance [4]. Sari et al. (2022) developed multi-source spectral indices for oil palm discrimination but did not empirically evaluate how temporal resolution influences the effectiveness of these indices in capturing oil palm’s distinctive characteristics [24]. Second, existing studies have not rigorously explored the optimal parameters for spatial and textural feature extraction in oil palm identification [25,26]. While various window sizes for spatial filtering and texture analysis have been employed, few studies have systematically evaluated how these parameters affect classification accuracy across different Malaysian landscapes. The gray-level co-occurrence matrix (GLCM) has proven valuable for capturing the distinctive texture of oil palm plantations, but the optimal unit size for this analysis remains underexplored in the Malaysian context, where plantation patterns vary between regions [27,28]. Third, current approaches to oil palm age estimation face significant limitations in accuracy and comprehensiveness. Jarayee et al. (2024) employed multiple vegetation indices alongside regression analysis to estimate oil palm age, identifying the Chlorophyll Content Index (CCI) as the most strongly correlated index, with an R2 value of 0.94 [29]. Asari et al. (2017) developed regression approaches for age and biomass estimation [30]. However, these regression-based approaches often encounter saturation effects with mature plantations and cannot reliably detect establishment years without long-term historical imagery. Contemporary time series algorithms such as Continuous Change Detection and Classification (CCDC) and LandTrendr have demonstrated robust capabilities for forest establishment detection through breakpoint analysis rather than regression-based approaches [31,32]. Ensemble learning methods integrating Random Forest with time series data have shown particular promise for age mapping, achieving high accuracy while leveraging textural and temporal features [33,34]. Advanced approaches like the Continuous Degradation Detection (CODED) algorithm combined with spectral unmixing have enabled effective forest disturbance mapping and age structure analysis [35]. Monitoring methods grounded in long-term time series data offer robust support for accurately determining oil palm tree age. Furthermore, they typically focus on age estimation for individual stands rather than analyzing the comprehensive age structure across regional scales, which is essential for understanding plantation dynamics and sustainability in the Malaysian context.
To address these limitations, this study develops a comprehensive methodological framework for optimizing multi-sensor remote sensing approaches to oil palm plantation mapping and age structure analysis in Malaysia. The primary aim is to systematically optimize temporal, spatial, and textural parameters in harmonized Landsat–Sentinel data fusion while developing an adapted algorithm for precise plantation establishment year estimation across Malaysia’s diverse oil palm landscapes. This research addresses three key methodological questions that directly correspond to the identified limitations: (1) What is the optimal temporal interval for detecting oil palm plantations using harmonized Landsat–Sentinel imagery in Malaysia’s tropical environment? (2) How do spatial filtering and textural analysis parameters influence classification accuracy, and what are their optimal configurations for Malaysian oil palm landscapes? (3) How can the LandTrendr algorithm be adapted to determine precise establishment years and analyze regional variations in age structure across Malaysia’s oil palm plantations? To achieve these objectives, we developed an innovative harmonized dataset integrating Landsat 4/5/7/8/9, Sentinel-2 multispectral, and Sentinel-1 radar data (Landsat-Sentinel Multispectral-Radar, hereafter referred to as LSMR), combined with systematic parameter optimization and algorithm adaptation to capture the distinct spectral–temporal characteristics of oil palm plantations in tropical environments.

2. Materials and Methods

2.1. Study Area

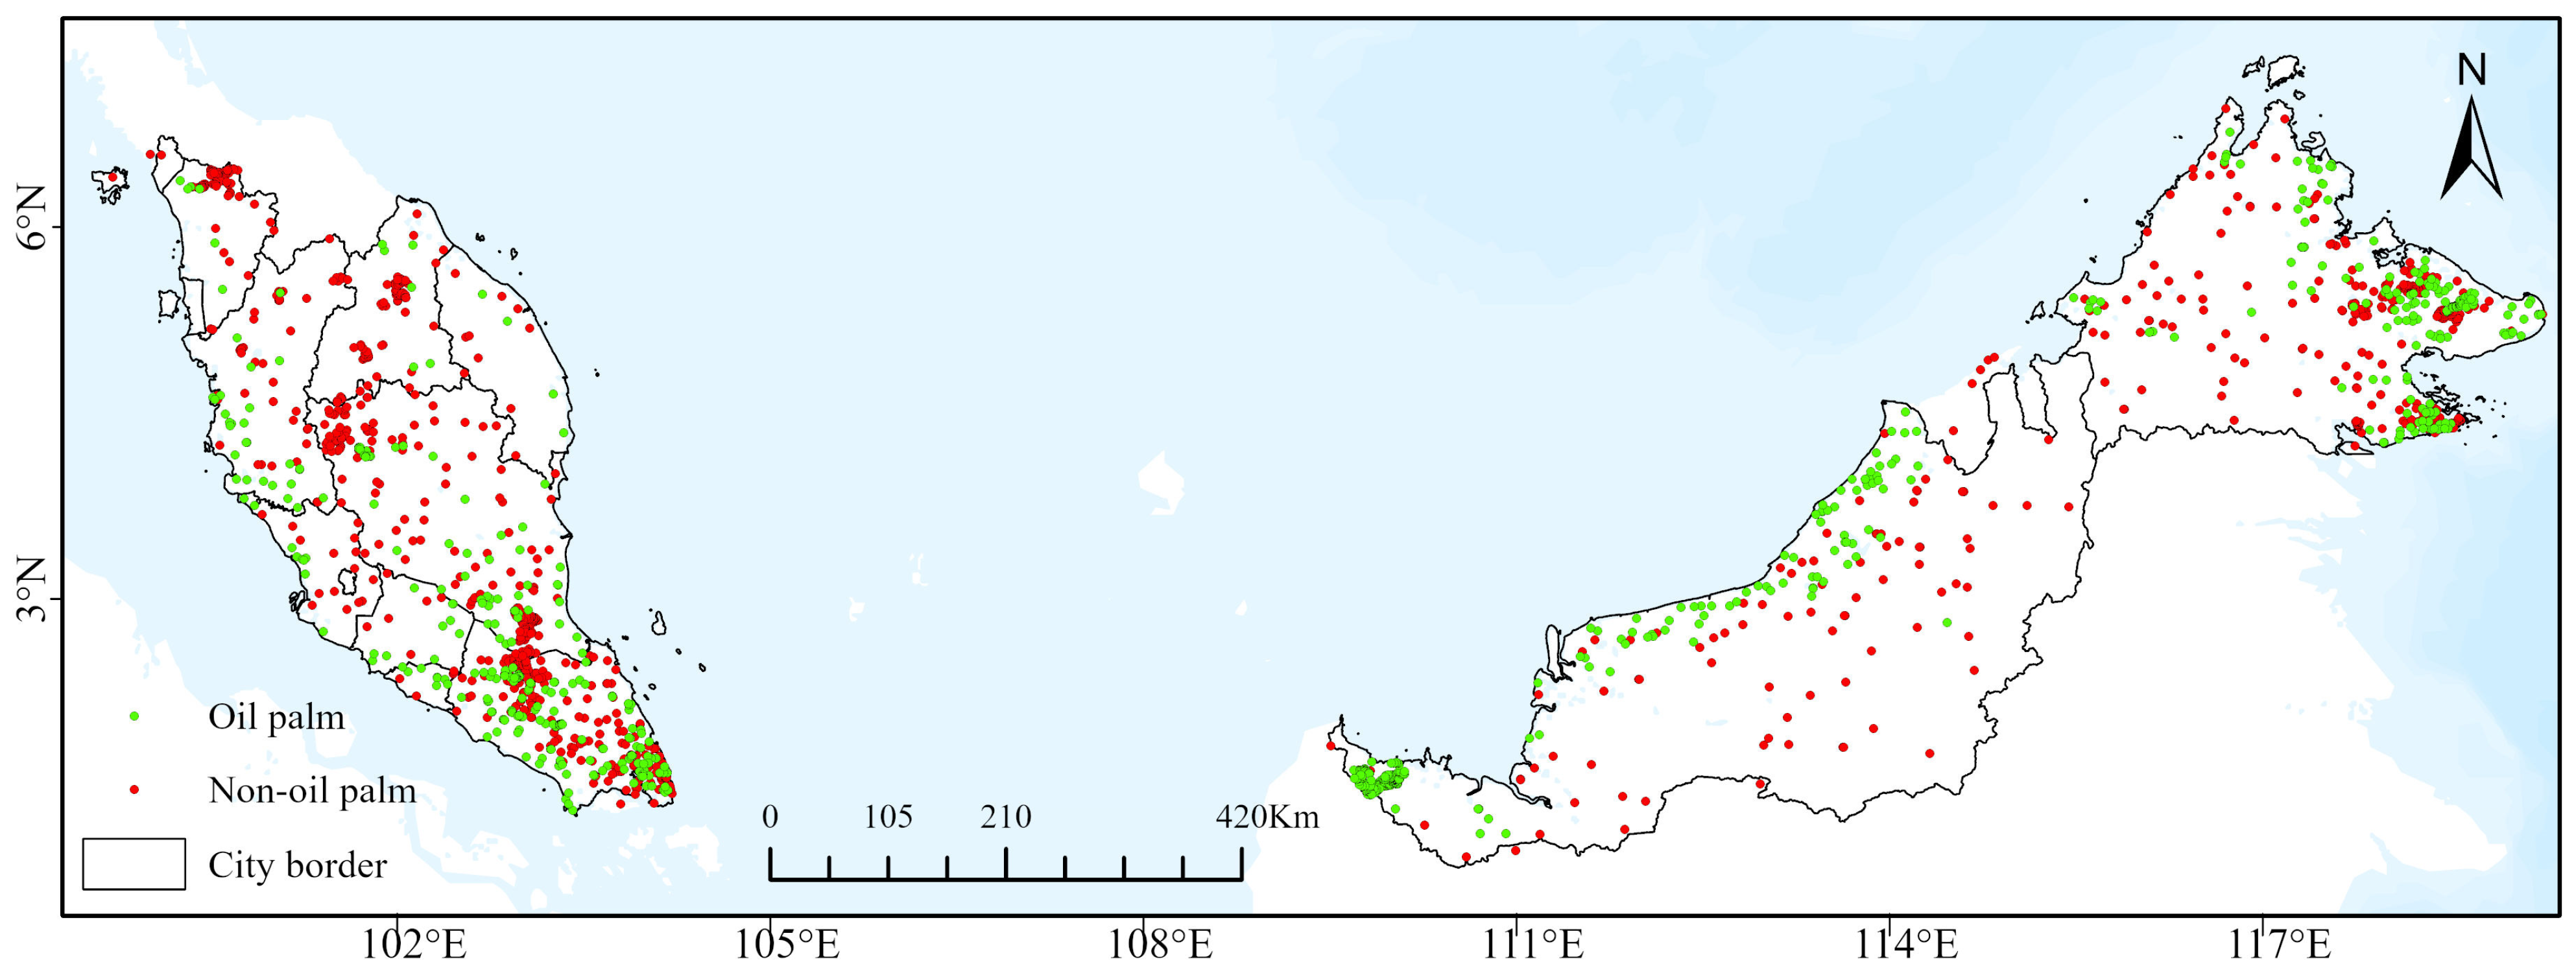
Malaysia, situated in Southeast Asia, spans two distinct regions: the Malayan Peninsula and Borneo. It shares borders with Thailand, Singapore, Indonesia, and Brunei (Figure 2). The Malay Peninsula is located between longitudes 100°32′E and 104°24′E and latitudes 1°20′N and 6°35′N, while Borneo is situated between longitudes 109°45′E and 119°18′E and latitudes 0°45′N and 7°10′N. Malaysia experiences a tropical rainforest climate, characterized by consistently high temperatures and substantial rainfall year-round. The average temperatures typically range between 24 °C and 32 °C, while mean annual precipitation exceeds 2000 mm [36,37]. The mineral and peat soil cover in Malaysia provides favorable conditions for oil palm cultivation, with the Malaysian Government historically encouraging conversion of farmland to oil palm plantations [38]. The main tree species in the study area include oil palm, rubber, coconut, and betel nut trees.

2.2. Data and Processing

2.2.1. Satellite Imagery

We developed a harmonized Landsat and Sentinel-2 dataset by integrating complementary satellite platforms to overcome the persistent cloud cover challenges in Malaysia’s tropical environment while maximizing spectral and temporal resolution for oil palm detection. All Landsat 4/5/7/8/9 imagery since 1985 and Sentinel-2 since 2014 were used to ensure comprehensive temporal coverage and optimal cloud-free observations for classification purposes (using Landsat 8/9 and Sentinel-2 images acquired in 2023) and plantation establishment year identification (using all images since 1985). The core components of this dataset include the following:
Landsat data (30 m spatial resolution) provide consistent long-term observations spanning from 1982 to present, with spectral bands covering visible, near-infrared, and short-wave infrared regions. The Thematic Mapper (TM) on Landsat 4/5, Enhanced Thematic Mapper Plus (ETM+) on Landsat 7, and Operational Land Imager (OLI) on Landsat 8/9 sensors offer comparable spectral configurations that are particularly valuable for capturing oil palm’s distinctive reflectance characteristics. The near-infrared and short-wave infrared bands across all sensors are especially effective for identifying mature oil palm’s unique spectral signatures compared to other vegetation types, enabling consistent multi-decadal analysis of oil palm expansion.
Sentinel-2 multispectral data (10–20 m spatial resolution) offer enhanced spatial detail and additional red-edge bands critical for vegetation analysis. The three red-edge bands (bands 5, 6, and 7) capture subtle variations in chlorophyll content and canopy structure that help differentiate oil palm from spectrally similar vegetation types like rubber plantations, which are common in the Malaysian landscape.
Sentinel-1 C-band SAR data (10 m spatial resolution) provide all-weather, day-and-night imaging capabilities through cloud cover. The dual-polarization backscatter measurements (VV and VH) effectively capture oil palm’s distinctive canopy structure and moisture content, with the VH polarization particularly sensitive to the crown architecture of mature oil palm plantations.
The harmonization process involved spatial and spectral alignment of these data sources, including resampling to a common 30 m grid, and cross-sensor calibration to ensure temporal consistency across the time series. All data processing and harmonization procedures were implemented using the Google Earth Engine (GEE) JavaScript API through the web-based code editor interface (https://code.earthengine.google.com/, accessed on 2 July 2023).
Multi-sensor data harmonization addresses the fundamental challenge of integrating observations from different satellite platforms with varying spectral response functions, radiometric characteristics, and acquisition geometries. The theoretical basis for our harmonization approach rests on the linear relationship assumption between corresponding spectral bands of different sensors when observing the same target under similar atmospheric and illumination conditions [39,40]. This relationship can be expressed as:
ρ _ L 8 / 9 = a × ρ _ S 2 +   b
where ρ_L8/9 and ρ_S2 represent the surface reflectance values from Landsat 8/9 OLI and Sentinel-2 MSI, respectively, while a and b are the harmonization coefficients derived through regression analysis.
Due to differences in wavelength coverage and spectral response functions between the Landsat 8/9 OLI sensor and the Sentinel-2 Multispectral Instrument (MSI) sensor, ordinary least squares (OLSs) regression was employed to establish empirical relationships for spectral band adjustment. The harmonization methodology addresses three key theoretical considerations: (1) spectral band differences—accounting for variations in central wavelength and bandwidth between corresponding bands, (2) radiometric calibration differences—normalizing sensor-specific radiometric response characteristics, and (3) temporal stability—ensuring consistent spectral relationships across different acquisition dates and atmospheric conditions.
The harmonization coefficients were calculated using the ee.Reducer.linearRegression() function in GEE, applied to concurrent image pairs acquired within temporal windows of ±15 days. Spatial resampling to the common 30 m grid was performed using the ee.Image.resample() function with bilinear interpolation. This integration provides a combination of spectral richness, temporal density, and all-weather monitoring capability for comprehensive oil palm detection and age structure analysis.

2.2.2. Auxiliary Data

The analysis incorporates the Shuttle Radar Topography Mission (SRTM) digital elevation model (DEM) dataset with 1 arc-second (~30 m) resolution, accessed through the GEE data catalog (USGS/SRTMGL1_003). This dataset provides detailed topographic information essential for analyzing terrain relationships with oil palm distribution patterns. DEM processing was conducted entirely within the GEE platform using built-in functions. Slope parameters were derived using the ee.Terrain.slope() function, which calculates slope in degrees from the elevation data. These topographic variables were used to analyze terrain constraints on plantation establishment and growth across Malaysia’s varied landscape, where oil palm cultivation has expanded from coastal lowlands into higher elevation areas.
Additionally, this study utilized the 2019 oil palm distribution map from the Global Oil Palm dataset [22] available in GEE (ee.ImageCollection(“BIOPAMA/GlobalOilPalm/v1”)) for sample collection and spatiotemporal dynamic analysis. This reference map was produced using a convolutional neural network with Sentinel-1 and Sentinel-2 semi-annual composite images, achieving 98.52% overall accuracy.

2.2.3. Ground Reference Data

To develop and validate our classification model, we utilized ground reference data from two complementary sources. The first source consisted of field data collected during a plant biodiversity investigation conducted in Malaysia in November 2023, yielding 2412 sampling points, with the participation of Malaysian Palm Oil Board (MPOB) representatives who provided expert verification of oil palm identification and age estimation [41]. The age estimation data for oil palm samples from this first source were obtained through a dual-verification approach combining expert identification by local specialists and direct interviews with plantation farmers. The second source employed random sampling based on the 2019 oil palm distribution map [22] available in GEE, generating 6868 sampling points. Oil palm sampling points were randomly selected from areas identified as oil palm in the 2019 reference map, while non-oil palm points were randomly selected from non-oil palm areas, encompassing various tree species commonly found in Malaysia, including rubber, dipterocarp, and other evergreen species.
All sample points from both sources underwent comprehensive visual interpretation and verification using multiple high-resolution imagery sources. The validation process involved primary interpretation through visual analysis using high-definition satellite images from Google Earth, which provides access to sub-meter resolution imagery from various commercial satellite providers, as well as aerial photography. To ensure temporal consistency and enhance reliability, all interpretations were cross-validated using 2023 Planet satellite imagery, which offers 5 m resolution multispectral data through the PlanetScope constellation. Additionally, a composite map of land cover in Malaysia for 2023 was first generated using Google’s near-real-time land cover classification product, Dynamic World (V1), to guide our sampling approach. This multi-source imagery approach was particularly valuable for accurate identification of oil palm stands at different growth stages.
Through this combined approach of field survey and random sampling, followed by comprehensive visual interpretation, we obtained a total of 9280 reference points across Malaysia, classified into 4205 oil palm points and 5075 non-oil palm points. To ensure a balanced representation of geographical regions, we conducted a post-stratification analysis to verify that sampling points adequately represented different administrative regions of Malaysia, though the initial selection was random rather than stratified. This comprehensive reference dataset enabled the development of a robust classification model with broad applicability to the varied plantation conditions found throughout the country. The spatial distribution of these reference points across Malaysia is illustrated in Figure 2.

2.2.4. Satellite Image Pre-Processing

To ensure data quality, we implemented rigorous pre-processing steps for both optical and radar imagery. For Sentinel-2 images, cloud and shadow layers were masked utilizing the CS+ quality assessment band. For Landsat 4/5/7/8/9 images, the QA_PIXEL and QA_RADSAT bands were used to mask and exclude cloudy and shadow [42].
For Landsat 8/9 and Sentinel-2 images, we calculated four vegetation indices to enhance feature extraction: the Normalized Difference Vegetation Index (NDVI), the Land Surface Water Index (LSWI), the Green-Red Vegetation Index (GRVI), and the Enhanced Vegetation Index (EVI) using Equations (2)–(5) as follows:
N D V I = ρ n i r ρ r e d ρ n i r + ρ r e d
L S W I = ρ n i r ρ s w i r 1 ρ n i r + ρ s w i r 1
G R V I = ρ g r e e n ρ r e d ρ g r e e n + ρ r e d
E V I = 2.5 × ρ n i r ρ r e d ρ n i r + 6 × ρ r e d 7.5 × ρ b l u e + 1
where ρblue, ρgreen, ρred, ρnir, and ρswir1 represent the spectral bands from both sensor systems: for Landsat 8/9 OLI, these correspond to the blue (452–512 nm), green (533–590 nm), red (636–673 nm), near-infrared (851–879 nm), and short-wave red band 1 (1566–1651 nm); for Sentinel-2 MSI, the equivalent bands are blue (497 nm), green (560 nm), red (665 nm), near-infrared (835 nm), and short-wave infrared band 1 (1614 nm). The harmonization process accounts for the slight spectral differences between these sensor systems to ensure consistent reflectance values across the integrated dataset.
For Sentinel-2 images, in addition to the above four vegetation indices, the red edge position index (REP) was calculated using Equation (6):
R E P = 705 + 35 × 0.5 × ( ρ r e d 3 + ρ r e d ) ρ r e d 1 ρ r e d 2 ρ r e d 1
where ρred1, ρred2, and ρred3 are the red edge band 1 (704 nm), red edge band 2 (740 nm), and red edge band 3 (783 nm), respectively, of the Sentinel-2 MSI sensor.
The Normalized Burn Ratio (NBR) index was calculated for all sensors (Landsat 4/5/7/8/9 and Sentinel-2) to monitor oil palm plantation age using Equation (7):
N B R = ρ n i r ρ s w i r 2 ρ n i r + ρ s w i r 2
where ρnir and ρswir2 represent the near-infrared and short-wave infrared band 2 for each sensor system: TM/ETM+ (770–900 nm, 2080–2350 nm), OLI (851–879 nm, 2107–2294 nm), and MSI (835 nm, 2202 nm).

2.3. Methodology

2.3.1. Method Overview

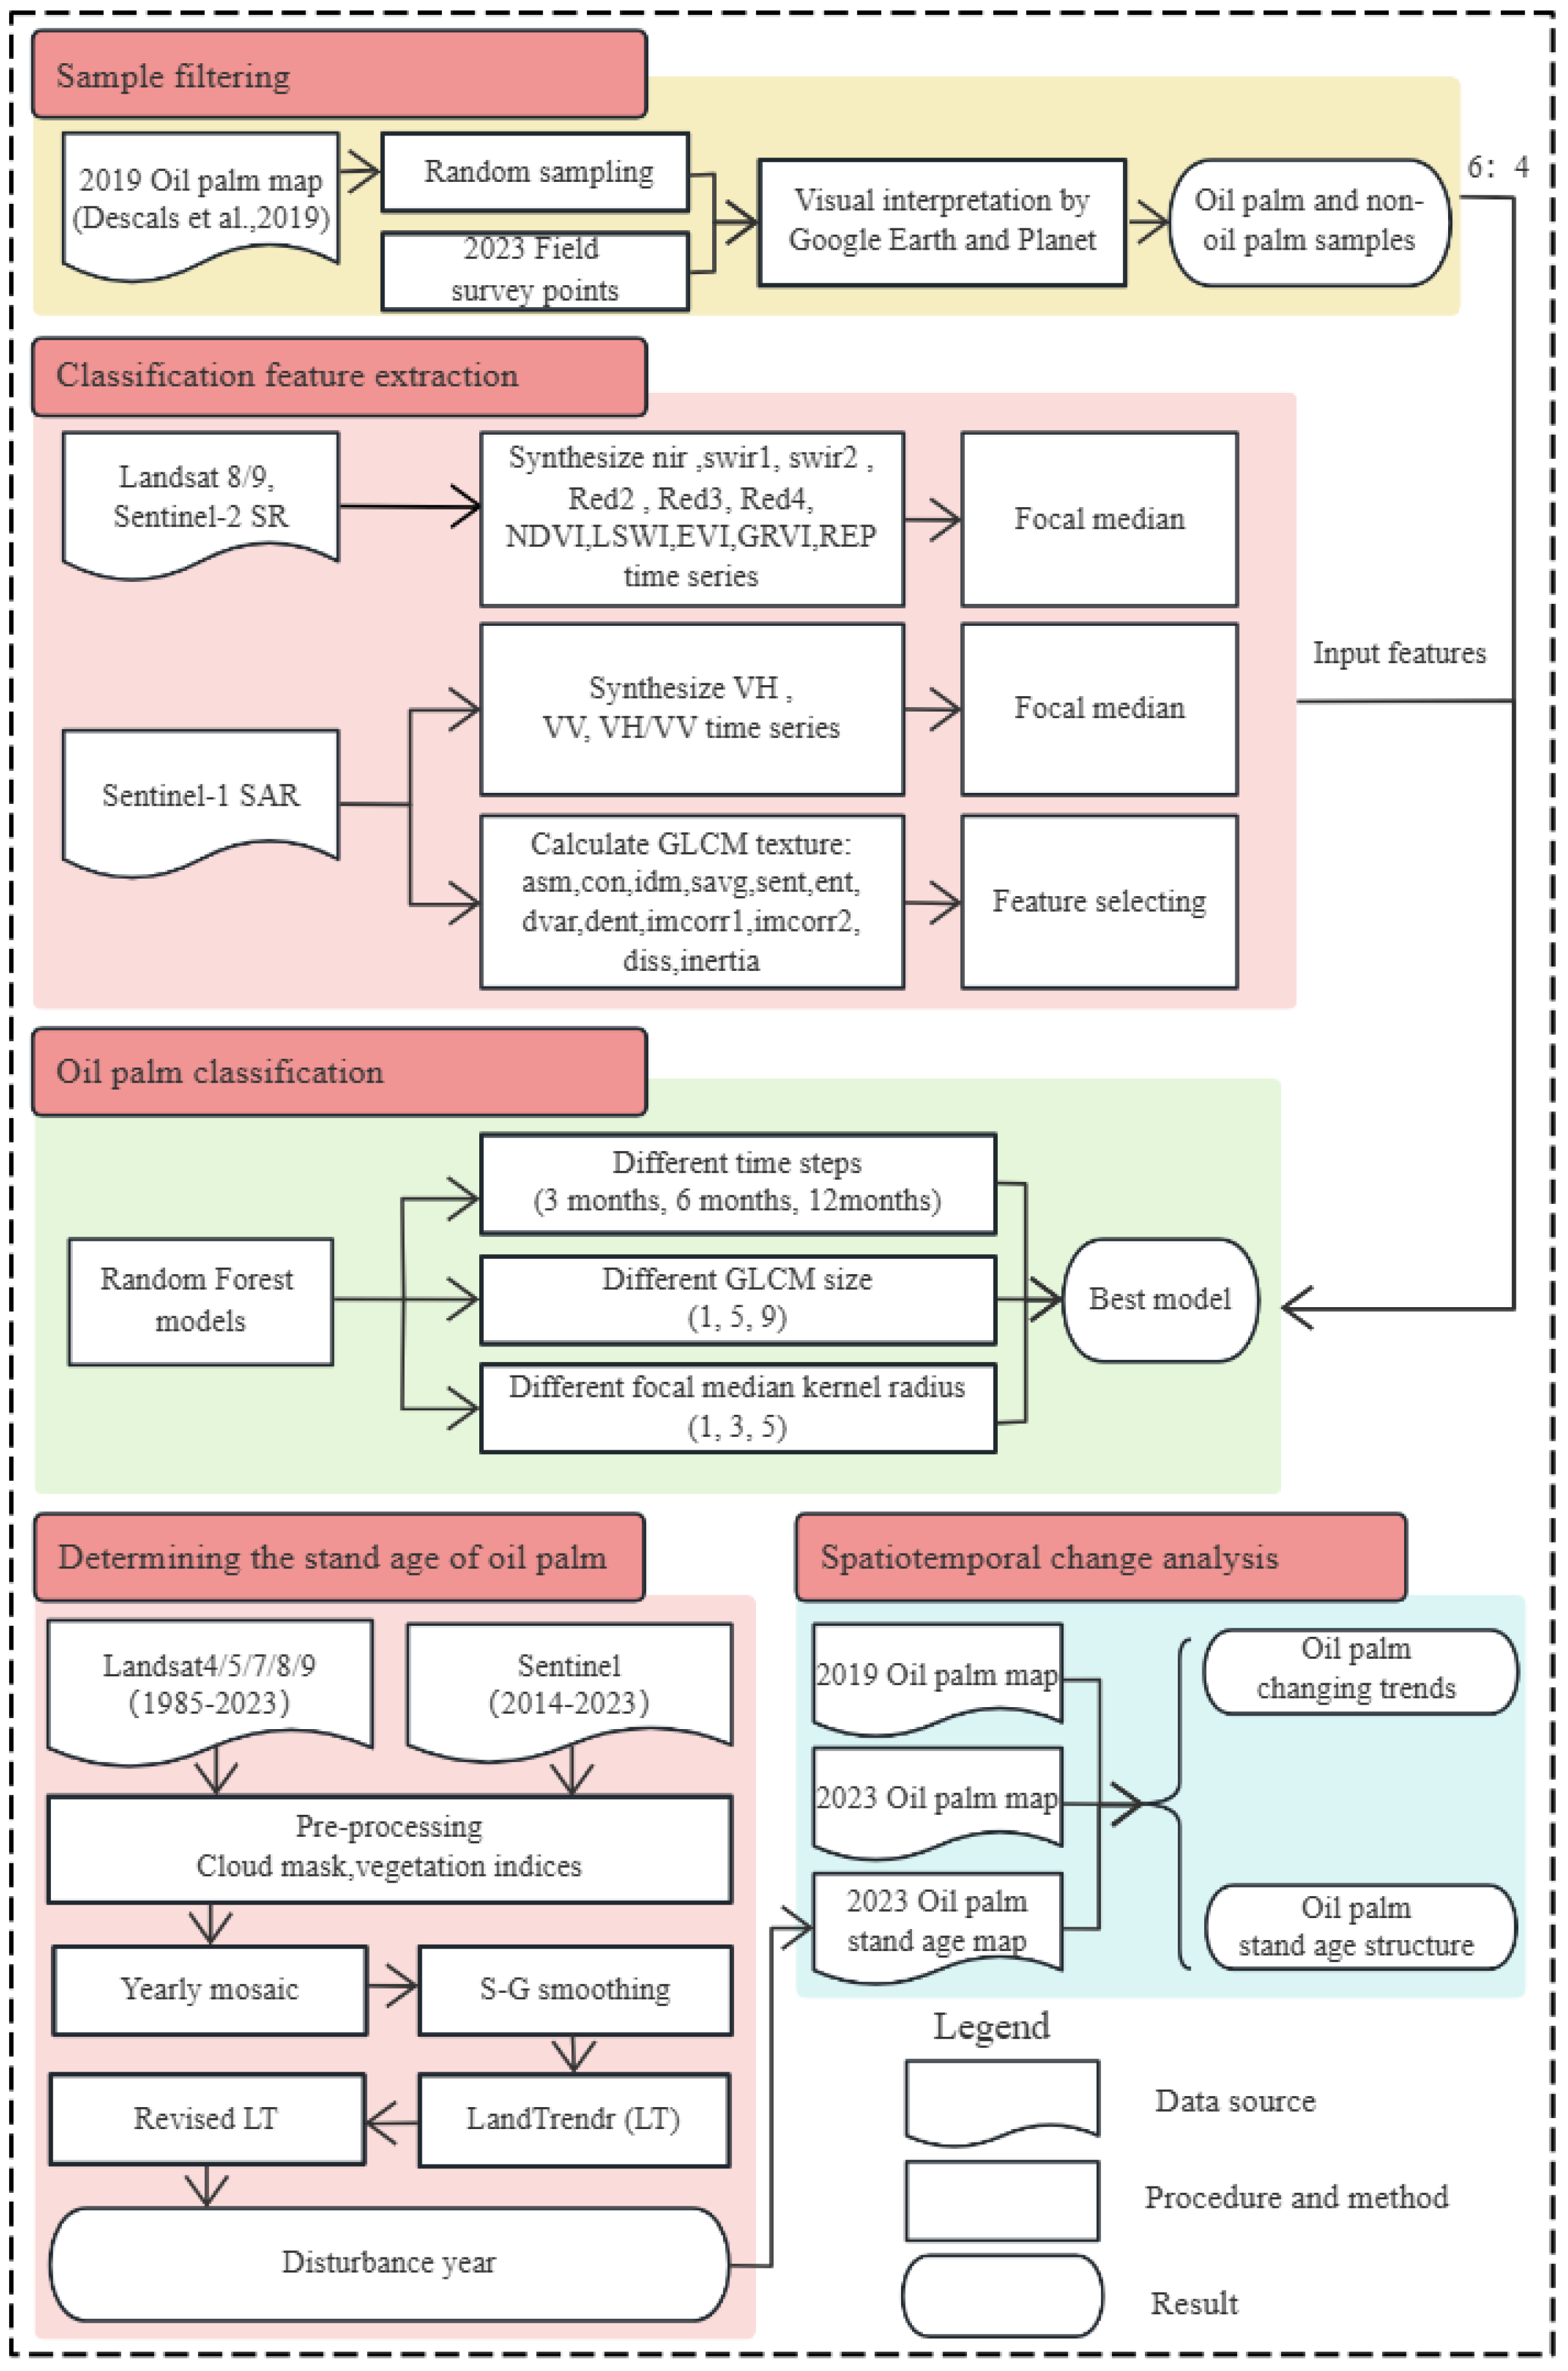
The methodological framework of this study consists of five key steps (Figure 3): (1) sample filtering through Google Earth to obtain oil palm and non-oil palm samples; (2) extraction of spectral features, vegetation indices, SAR backscatter coefficients, and texture features from Landsat and Sentinel images to create an optimized feature set; (3) implementation of the Random Forest (RF) model, with systematic optimization of different time intervals, median filter sizes, and GLCM parameters to identify the optimal classification configuration; (4) application of the LandTrendr (LT) algorithm to determine the establishment year of oil palm plantations; and (5) comprehensive analysis of the spatial and temporal patterns of oil palm cultivation in conjunction with stand age maps.

2.3.2. Feature Extraction and Data Synthesis

This study incorporated four complementary feature types to enhance classification accuracy: multitemporal spectral characteristics, SAR backscatter values, vegetation indices, and texture features (Table 1). This multi-source approach leverages diverse data characteristics for more robust oil palm detection.
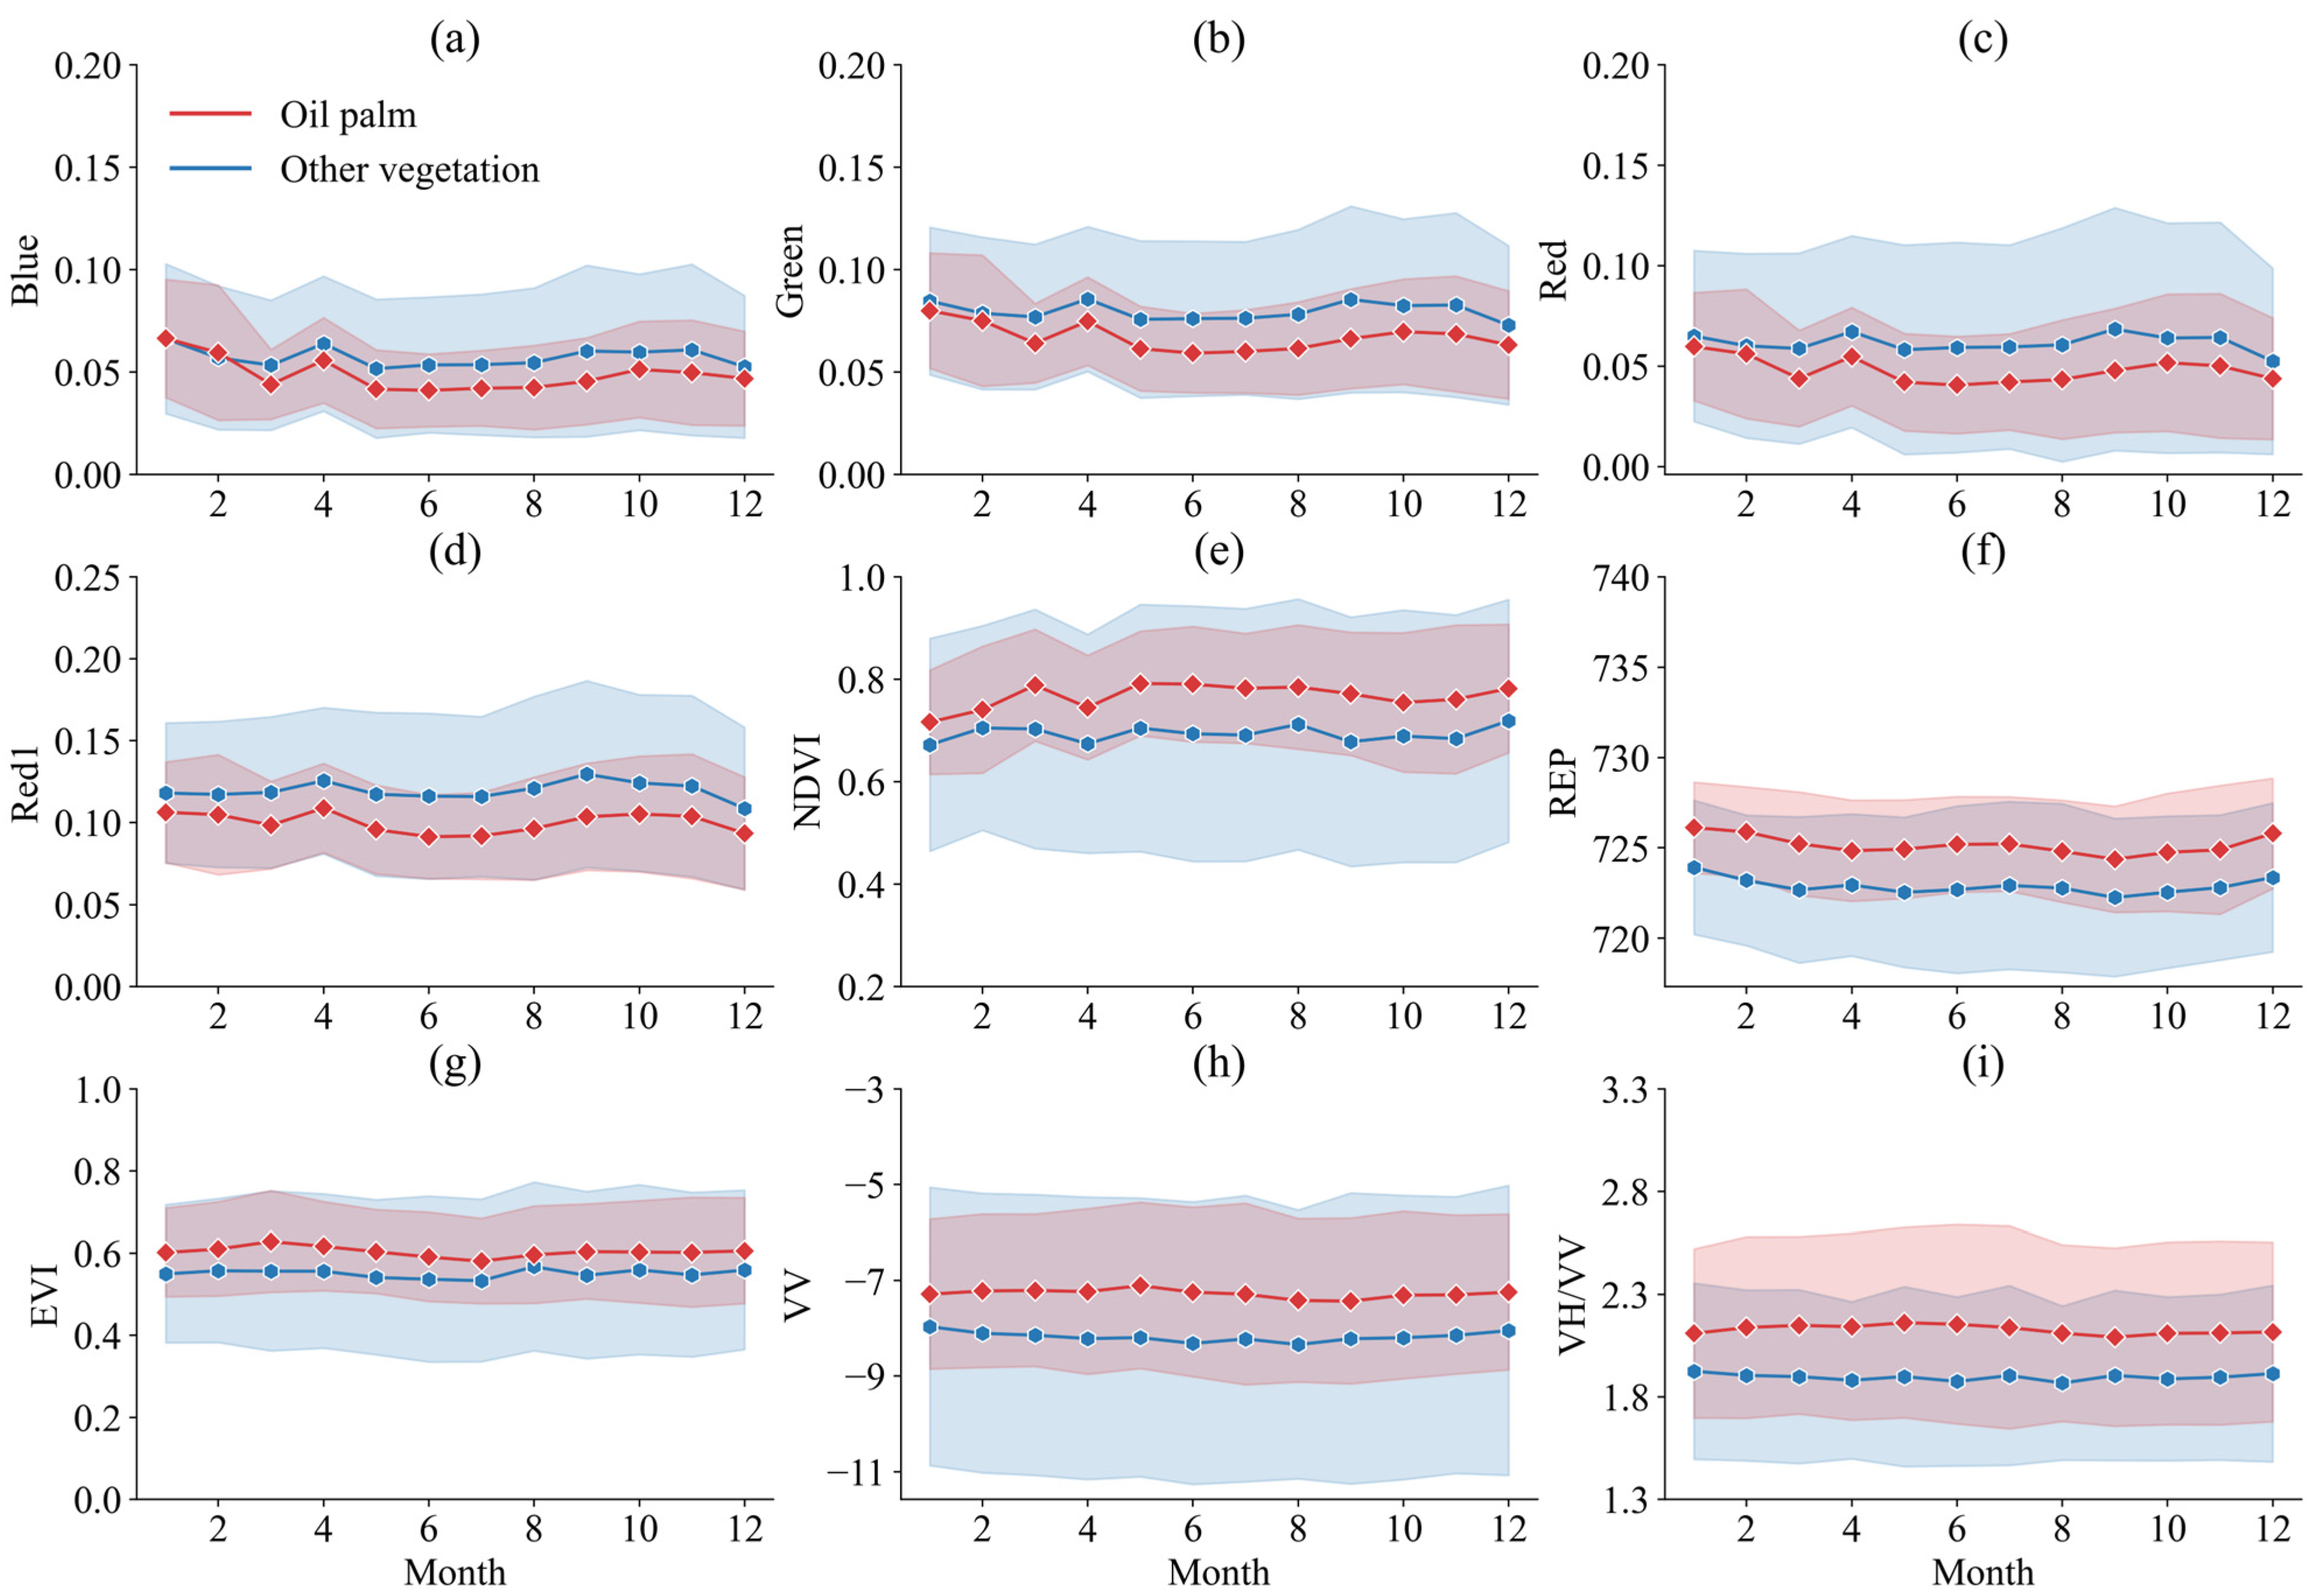
Multitemporal spectral characteristics: Multitemporal spectral features from Landsat-8/9 and Sentinel-2 provided essential information for distinguishing oil palm from other vegetation types by capturing surface reflectance characteristics across multiple bands (blue, green, red, near-infrared, SWIR1, SWIR2, and red edge bands), which also contributes to the oil palm and other vegetation discrimination according to the time series curves (Figure 4a–d).
SAR backscatter values: SAR backscatter values from Sentinel-1A were particularly valuable for oil palm classification in cloud-prone tropical areas, with VV and VH polarizations demonstrating clear separability patterns between oil palm and other vegetation types throughout the annual cycle. We utilized both the Vertical–Vertical (VV) and Vertical–Horizontal (VH) polarization bands, along with their ratio (VH/VV), which has demonstrated effectiveness in discriminating oil palm plantations in previous studies (Figure 4h–i) [43].
Vegetation indices: Five vegetation indices were selected based on their demonstrated effectiveness for oil palm monitoring, including NDVI (measuring vegetation greenness) [44]; LSWI (indicating moisture content) [45]; REP (sensitive to chlorophyll concentrations) [46]; EVI (optimized for high biomass regions) [47]; and GRVI (highlighting oil palm vigor through green–red reflectance comparison), which shows distinct temporal patterns between oil palm and other vegetation as illustrated in the time series analysis (Figure 4e–g) [48].
Texture features: Texture features derived from GLCM analysis captured the structural patterns of oil palm plantations, which typically exhibit distinctive regular spacing and crown formations [49]. The GLCM variables computed included Angular Second Moment (ASM), Contrast (CON), Inverse Difference Moment (IDM), and nine additional textural metrics (Table 1). Median filtering was applied to Sentinel-1 backscatter bands to reduce speckle while preserving the structural characteristics that distinguish oil palm from other vegetation types.
Table 1. Feature extraction and data synthesis variables used for oil palm plantation classification.
Feature VariablesReference
Landsat 8/9Blue, Green, Red, NIR, SWIR1, SWIR2[28]
Sentinel-2Blue, Green, Red, NIR, SWIR1, SWIR2, RE1, RE2, RE3, RE4 *[50]
Sentinel-1VH, VV, VH/VV[3]
Vegetable IndexNDVI, LSWI, EVI, GRVI, REP[51]
GLCM Texture FeaturesAngular Second Moment (ASM)[51,52,53,54]
Contrast (CON)
Inverse Difference Moment (IDM)
Sum Average (SAVG)
Sum Entropy (SENT)
Entropy (ENT)
Difference Variance (DVAR)
Difference Entropy (DENT)
Information Measure of Corr. 1 (IMCORR1)
Information Measure of Corr. 2 (IMCORR2)
Dissimilarity (DISS)
Inertia
* RE1, RE2, RE3, and RE4 represent the red_edge1, red_edge2, red_edge3, and red_edge4 bands in Sentinel 2 data, respectively.
Figure 3. Workflow of the study [54].
Remotesensing 17 02908 g003
Figure 4. Time series profiles of spectral bands and vegetation indices for oil palm and other vegetation classes. (a) Blue band reflectance; (b) Green band reflectance; (c) Red band reflectance; (d) Red edge1 band reflectance; (e) Normalized Difference Vegetation Index (NDVI); (f) Red Edge Position (REP); (g) Enhanced Vegetation Index (EVI); (h) VV polarization backscatter; (i) VH/VV polarization ratio. The lines represent monthly mean values, while the shaded areas indicate ±1 standard deviation for each class.
Remotesensing 17 02908 g004
To address cloud coverage challenges, we generated cloud-free composite images at different temporal intervals (3-month, 6-month, and 12-month) using median synthesis, which is less affected by extreme values than mean composites. This approach allowed us to empirically determine the optimal temporal resolution for oil palm detection in Malaysia’s tropical environment. Linear interpolation was applied to fill data gaps in the time series resulting from persistent cloud cover.

2.3.3. Model Construction

Random Forest (RF) classification was selected based on its demonstrated superiority over alternative classifiers and specific advantages for multi-source remote sensing applications. RF represents a collection of decision trees where each tree is trained on a random selection of samples using bootstrap aggregation to enhance tree diversity. Studies have demonstrated that Random Forest is more stable, accurate, and efficient than many other classifiers, including Maximum Likelihood, Single Decision Tree, and Single Layer Neural Network [55]. The RF classifier’s insensitivity to data noise makes it particularly suitable for mitigating noise effects in multi-source optical and radar data integration [56]. Moreover, RF’s reduced sensitivity to collinearity and feature redundancy makes it optimal for models incorporating large numbers of input features, as in our multi-source approach combining spectral, textural, and radar characteristics [55,56,57]. The RF algorithm enhances classification robustness through two key randomization mechanisms: bootstrap sampling for training data selection and random feature subset selection at each node split, which collectively reduce generalization error and prevent overfitting. During prediction, RF uses the averaged results from all decision trees to determine final classification outcomes, providing more stable predictions than individual classifiers.
For our implementation, we configured the RF model with 100 decision trees (numberOfTrees = 100), balancing accuracy with computational efficiency. Other parameters followed GEE default configurations: minLeafPopulation (minimum size of leaf nodes), variablesPerSplit (square root of total features), bagFraction (0.5, indicating 50% of samples used to build each tree), outOfBagMode, and seed. These settings align with best practices for preventing overfitting while maintaining classification accuracy [58].

2.3.4. Determining the Plantation Establishment Year

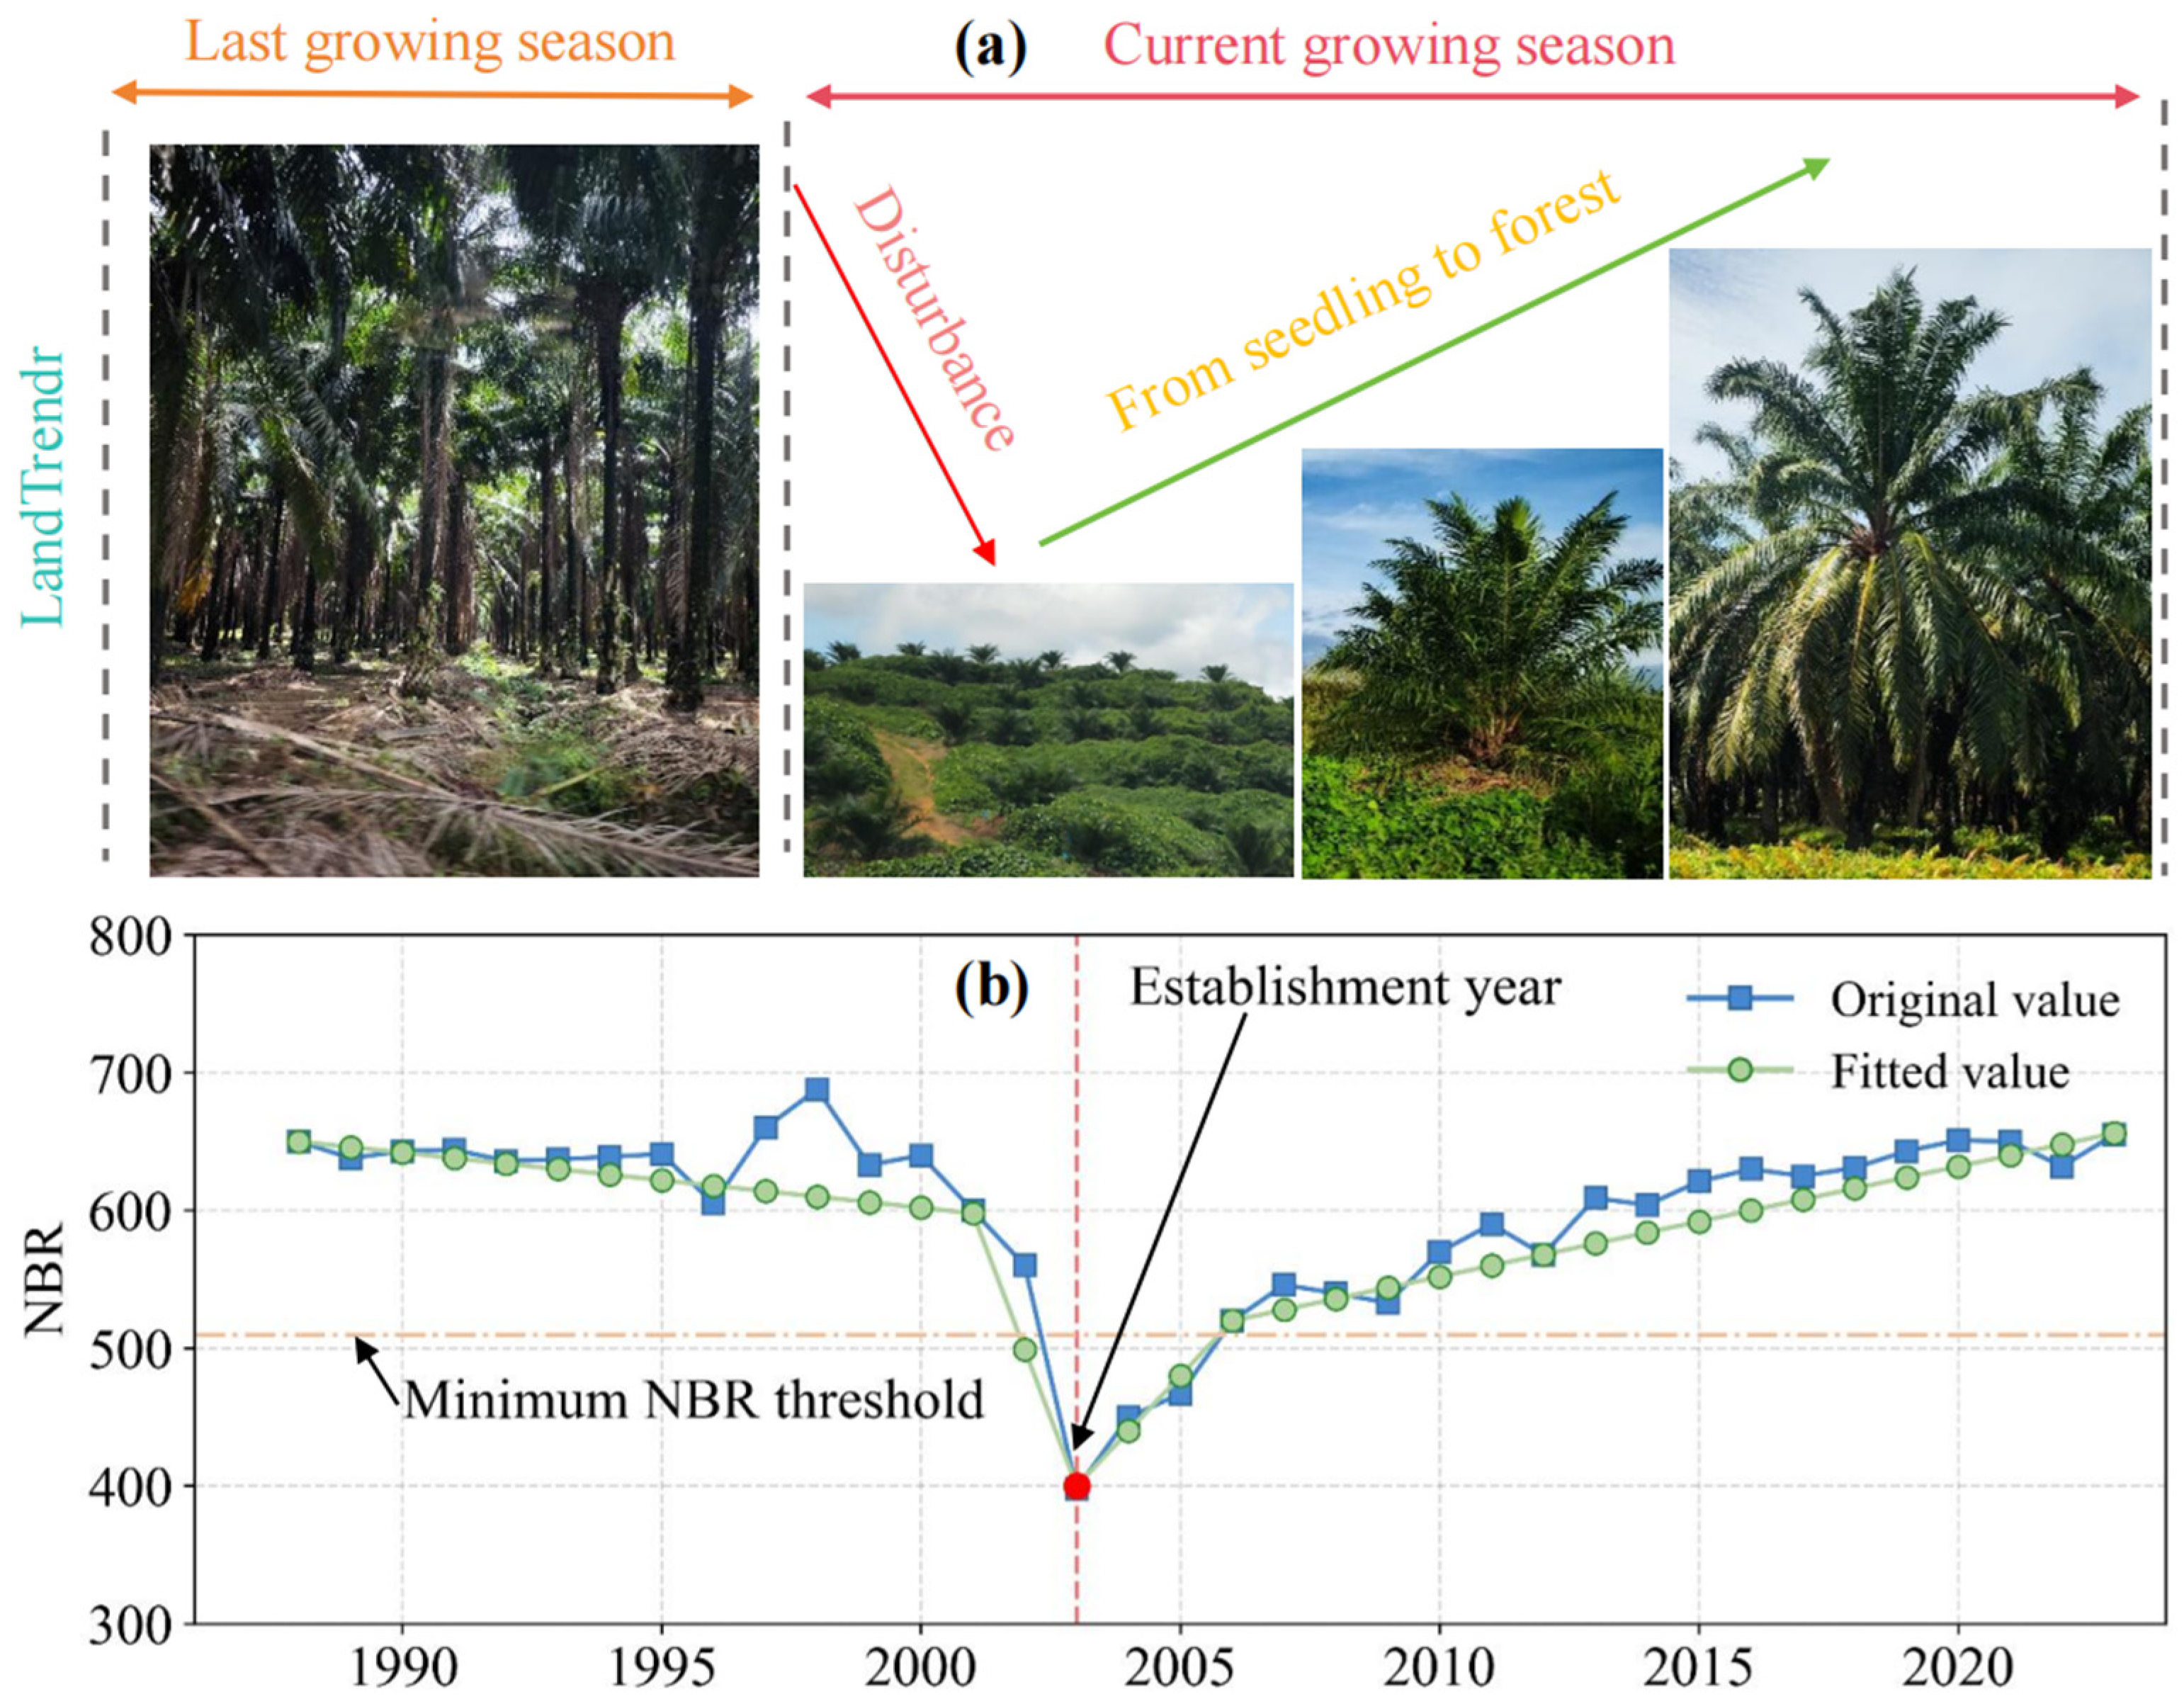
After mapping the distribution of oil palm plantations, we adapted the LandTrendr (LT) algorithm for age determination, developing a method to analyze spectral–temporal trajectories for identifying precise establishment years (Figure 5), sparking from a similar study conducted on rubber plantations [59]. Our approach employed a backward temporal analysis framework, beginning with confirmed oil palm locations in the current year and retrospectively tracing their spectral–temporal trajectories to identify the most recent major disturbance event, which we hypothesize corresponds to plantation establishment. This approach was specifically optimized for oil palm plantations to address challenges in detecting establishment-related disturbances in Malaysia’s tropical environment, where conventional age estimation approaches often struggle with saturation effects and cloud interference. The method leverages the distinctive spectral signature of oil palm establishment, characterized by initial land clearing (creating bare soil conditions with low NBR values) followed by gradual vegetation recovery as seedlings mature, distinguishing these patterns from other disturbance types through multi-criteria temporal filtering.
The LT parameters were configured as follows: maxSegments (11), SpikeThreshold (0.5), vertexCountOvershot (1), recoveryThreshold (0.5), and minObserver (4). These settings were determined through testing and fine-tuning with ground sample data, based on default settings in the GEE API and parameters recommended by [60,61]. This systematic parameterization enabled the algorithm to produce well-fitted segments for precise establishment year identification. While newly established oil palm plantations typically exhibit a brief bare soil phase, the favorable growing conditions in Malaysia often result in rapid vegetation recovery, making this phase difficult to consistently observe in cloud-affected optical imagery.
To overcome these limitations, we developed a multi-criteria approach defining the establishment year as the first year meeting four conditions: (1) Normalized Burn Ratio (NBR) below the minimum threshold; (2) lowest NBR value in the previous three years; (3) NBR gain magnitude exceeding the minimum amplitude threshold; and (4) time between segment start and end points exceeding two years. The two-year threshold for defining the immature stage was selected based on empirical evidence of intercropping practices in young plantations and rapid understory vegetation development, both of which can cause premature vegetation index recovery [62,63].

2.3.5. Accuracy Assessment

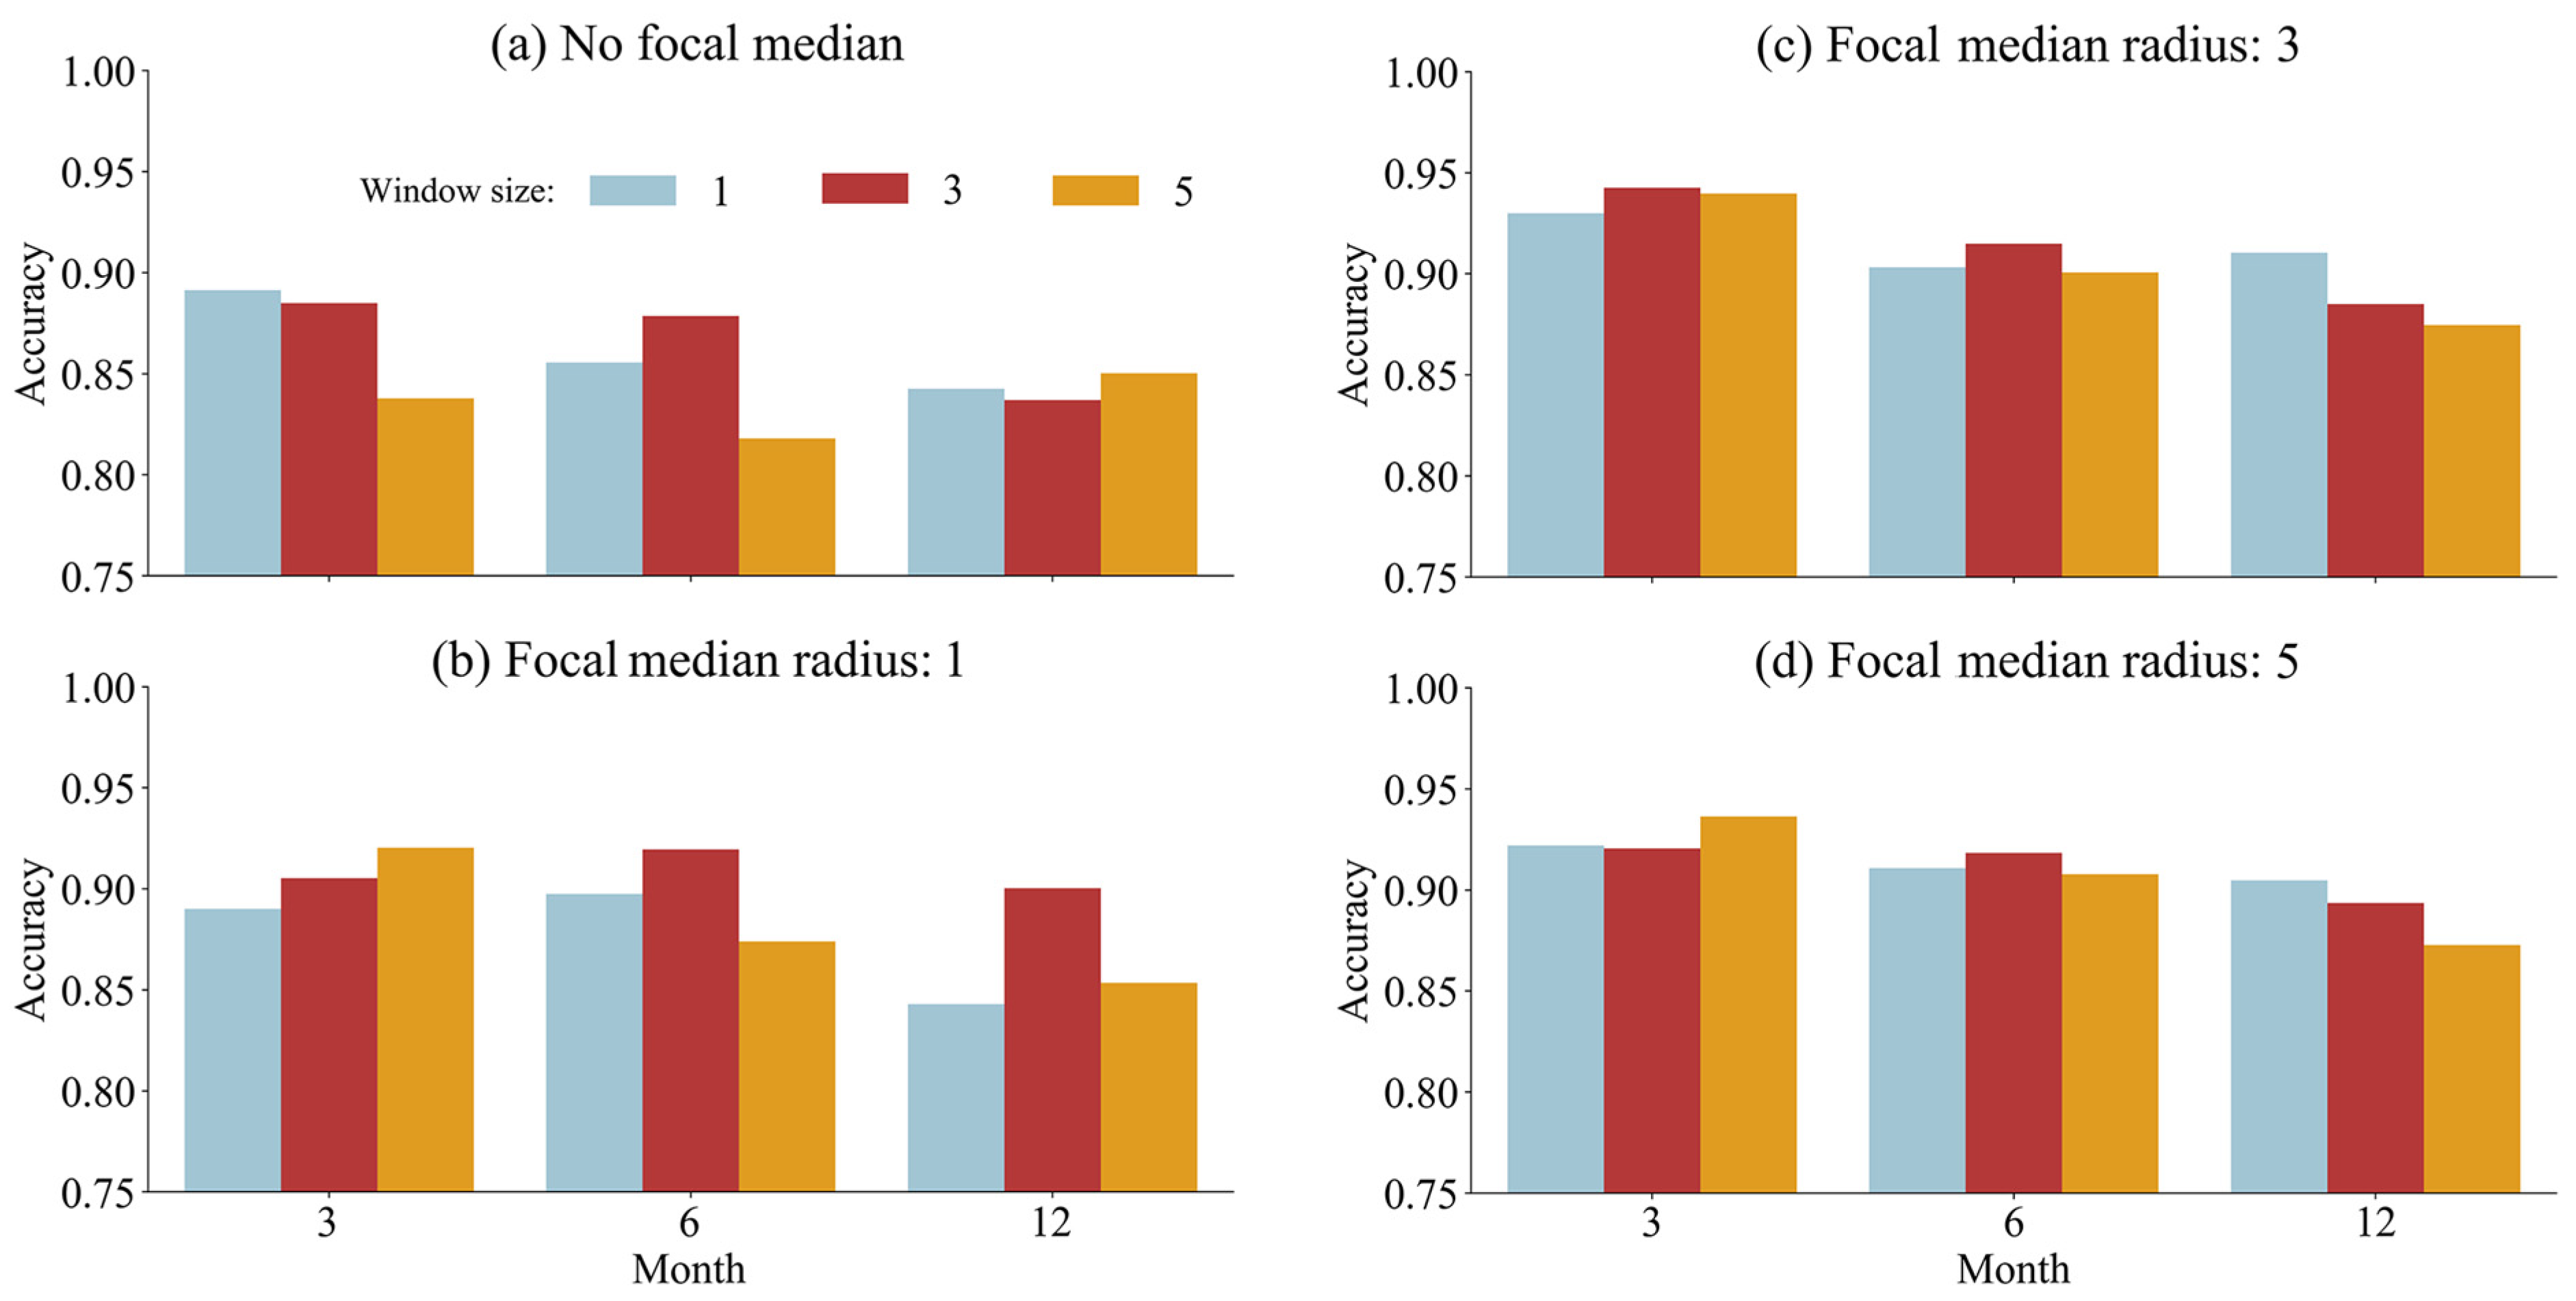
We divided our sample dataset (60% training, 40% testing) to evaluate classification accuracy while systematically testing multiple parameter configurations to determine the optimal model for Malaysian oil palm detection. Specifically, we evaluated the impact of temporal resolution (3, 6, and 12-month intervals), focal median kernel radius (1, 3, and 5 pixels), and GLCM kernel sizes (1, 3, and 5 units) on classification performance to identify the most effective parameter combination.
For validation of the oil palm maps, we used independent sample points extracted from the 2019 oil palm map [22] to assess year-by-year precision through confusion matrix analysis. Classification accuracy was evaluated using standard metrics including producer accuracy (8), user accuracy (9), overall accuracy (10), Kappa coefficient (11), and F1-score (13). The accuracy metrics were calculated using the following equations:
P A = T P T P + F N
U A = T P T P + F P
O A = T P + T N T P + T N + F P + F N
K = P o P e 1 P e
where Po is the observed agreement (OA) and Pe is the expected agreement calculated as:
P e = ( T P + T N ) ( T P   +   F P ) +   ( T N   +   F P ) ( T N   +   F N ) N 2
F 1 = 2 × U A × P A U A + P A
where TP represents true positives, TN represents true negatives, FP represents false positives, FN represents false negatives, and N is the total number of samples in the confusion matrix.
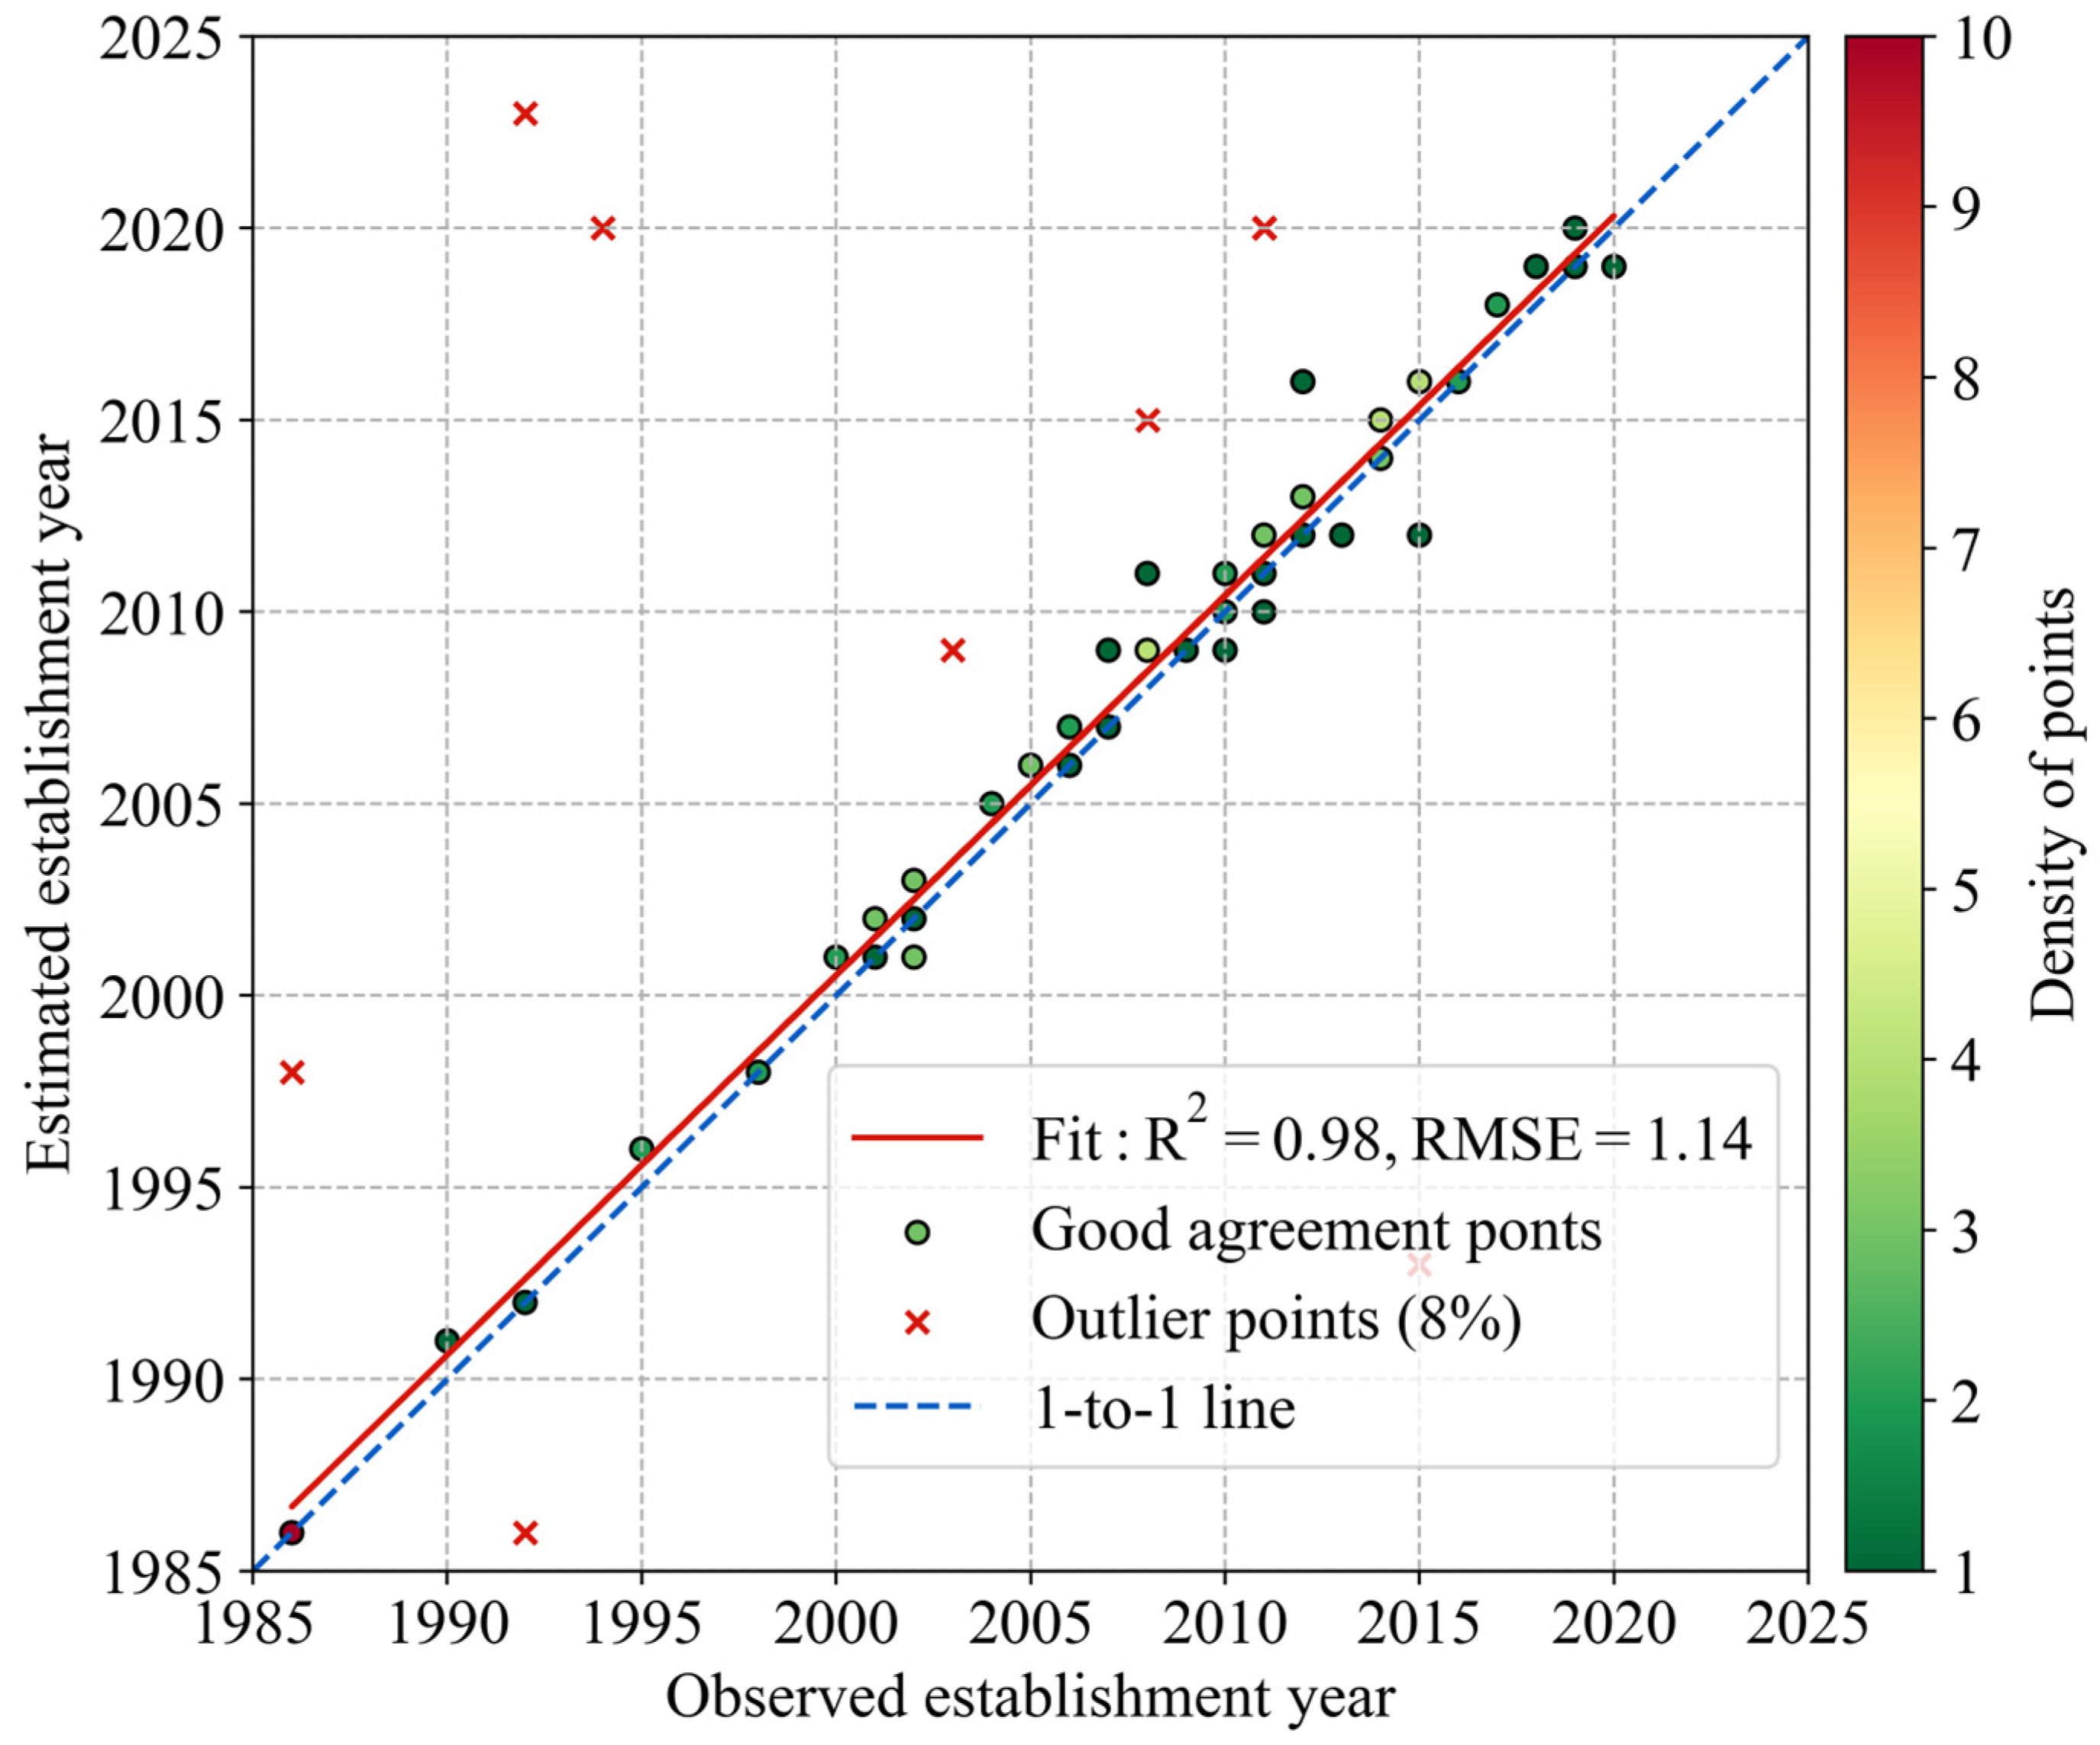
The accuracy of the oil palm establishment year dataset was assessed using 100 randomly selected samples. For each sample, the corresponding time series of the NBR was extracted using the LT-Fit algorithm via a Python script (version 3.9.16). These LT-Fit time series plots, in conjunction with historical high-resolution imagery from Google Earth, were employed for the visual interpretation of oil palm plantation establishment years. To evaluate the temporal accuracy, a scatter plot was generated to compare observed and estimated establishment years, followed by the computation of a linear regression fit. Additionally, key accuracy metrics, including the coefficient of determination (R2) and root mean square error (RMSE), were calculated to quantify the reliability of the estimated establishment years.

2.3.6. Analysis of Spatial Temporal Dynamic Changes

Using the optimized classification model, we produced an oil palm distribution map for Malaysia in 2023 and compared it with the 2019 map from Descals et al. (2021) to analyze spatial–temporal dynamics [22]. The distribution of oil palm plantations was analyzed across different administrative regions and topographic zones using the Google Earth Engine platform. To account for regional geographic differences, we conducted separate analyses for West Malaysia (elevation groups at 100 m intervals from 0 to 700 m; slope categories at 4° intervals from 0 to 24°) and East Malaysia (elevation groups at 200 m intervals from 0 to 1000 m; slope categories at 6° intervals from 0 to 30°). This regional differentiation allowed for nuanced analysis of oil palm distribution patterns across Malaysia’s diverse landscapes.

2.3.7. Analysis of Oil Palm Stand Age Structure

Our newly generated Malaysian oil palm age map enabled comprehensive analysis of age structure patterns across diverse plantation landscapes. We quantified the proportion of plantations across different age groups in 5-year intervals and conducted province-level analysis to examine regional heterogeneity in oil palm age structure. This age structure analysis was integrated with our broader spatiotemporal analysis to provide a comprehensive perspective on development trends within Malaysia’s oil palm industry. The findings from this analysis offer valuable insights for evaluating long-term sustainability, addressing environmental concerns, and guiding policy formation toward more sustainable agricultural practices.

3. Results

3.1. Impact of Parameter Selection on Oil Palm Identification Accuracy

Experimental results demonstrate that temporal resolution (time steps), spatial filtering parameters (focal median radii), and texture analysis scales (GLCM sizes) exert significant influences on oil palm classification accuracy. As shown in Figure 6, the optimal configuration comprising a 3-month temporal interval, 3-pixel focal median filter, and 3 × 3 GLCM window achieved peak classification accuracy of 0.94. Three key patterns emerge from the parameter sensitivity analysis: spatial filtering intensity showed positive correlation with accuracy metrics, where larger focal median radii (3–5 pixels) consistently outperformed smaller radii (0–1 pixel) in most cases; texture analysis scale demonstrated non-linear effects, with 3 × 3 GLCM windows yielding superior performance compared to both undersized (1 × 1) and oversized (5 × 5) configurations; and temporal resolution significantly impacted classification performance, with 3-month intervals achieving higher accuracy compared to 6-month and 12-month baselines.

3.2. Accuracy Assessment

The accuracy assessment conducted with 3712 random samples (1682 oil palm and 2030 non-oil palm), representing 40% of all sample points, demonstrated robust classification performance. The model achieved an overall accuracy of 94.0% with a Kappa coefficient of 0.95, while the F1-score reached 0.89. Detailed per-class analysis revealed that oil palm detection attained 93% producer’s accuracy and 95% user’s accuracy, while non-oil palm classification achieved 96% producer’s accuracy with 94% user’s accuracy (Table 2).
A strong correlation was identified between the estimated and observed plantation establishment years. The majority of data points are closely aligned along the 1:1 line, with the linear regression line (depicted in red) nearly coinciding with the 1:1 line (blue dashed). Eight data points (8%) were identified as statistical outliers using rigorous criteria based on standardized residuals exceeding ±2.5 standard deviations from the regression line, combined with field verification indicating potential confounding factors. These outliers were attributed to potential classification errors, or mixed pixels containing multiple age classes that could affect the spectral–temporal signature. The linear regression applied to the remaining 92 data points yielded an R2 of 0.98 and a root mean square error (RMSE) of 1.14 years (Figure 7).

3.3. Spatiotemporal Changes of Oil Palms in Malaysia

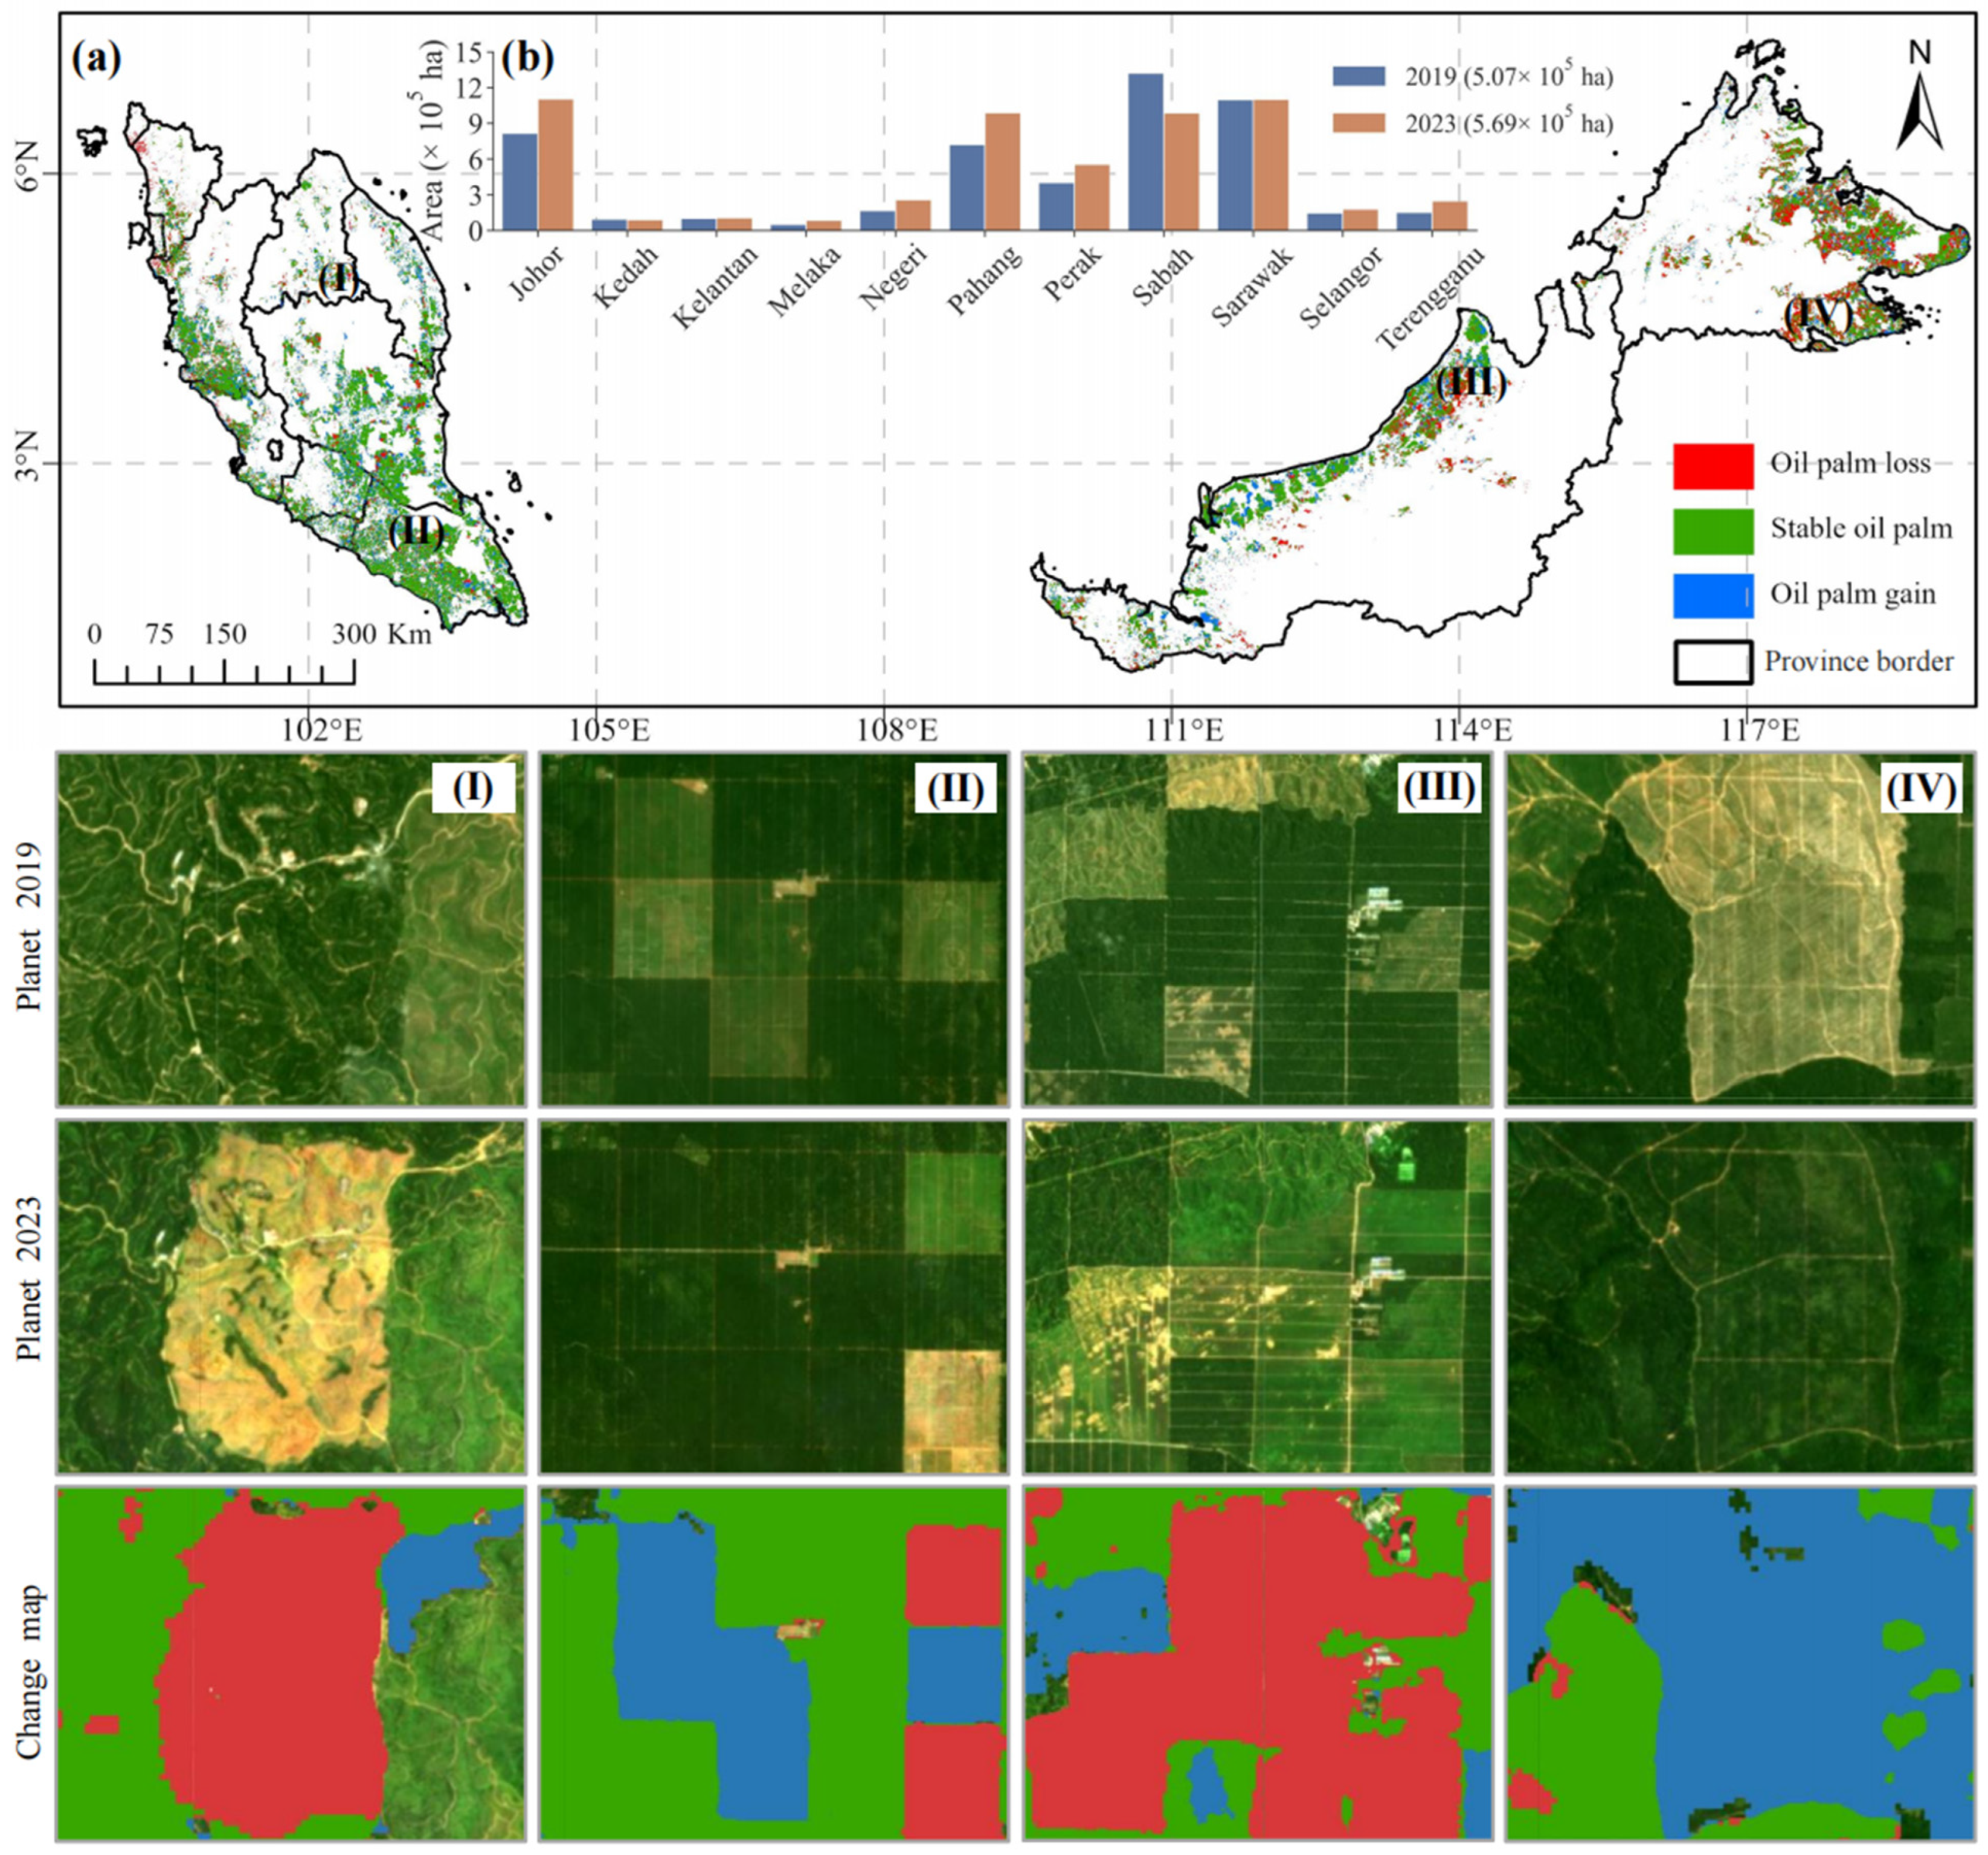
The spatial distribution of oil palm plantations in Malaysia exhibits considerable heterogeneity (based on our mapped results; Figure 8a). Despite similar total land coverage, plantations in West Malaysia are widely dispersed, with a dense concentration across most of the peninsula, except for the relatively sparse northern region. In contrast, oil palm cultivation in East Malaysia is primarily concentrated in the northern and eastern coastal regions, with negligible plantation presence in the extensive central and southern areas.
At the provincial level, the majority of oil palm plantations are concentrated in a few large provinces. According to our classification outputs, Johor, Sarawak, Pahang, and Sabah contain an estimated area of 1.10 × 10⁶ hectares, 1.09 × 10⁶ hectares, 9.88 × 10⁵ hectares, and 9.86 × 10⁵ hectares, respectively. Together, these provinces account for approximately 73% of Malaysia’s total oil palm plantation area as mapped in this study.
From a spatiotemporal perspective, notable geographical migration of oil palm plantations occurred between 2019 and 2023. West Malaysia experienced significant expansion, with plantations in Johor and Pahang increasing by 2.88 × 10⁵ hectares and 2.68 × 10⁵ hectares, respectively, over the four-year period. Conversely, oil palm cultivation in East Malaysia exhibited a downward trend, particularly in Sarawak, which in 2019 had the largest area of oil palm plantations in Malaysia. By 2023, the plantation area in Sarawak had decreased by 3.34 × 10⁵ hectares, relegating it to fourth place in terms of plantation area (Figure 8b).

3.4. Stand Age Structure of Oil Palm in Malaysia

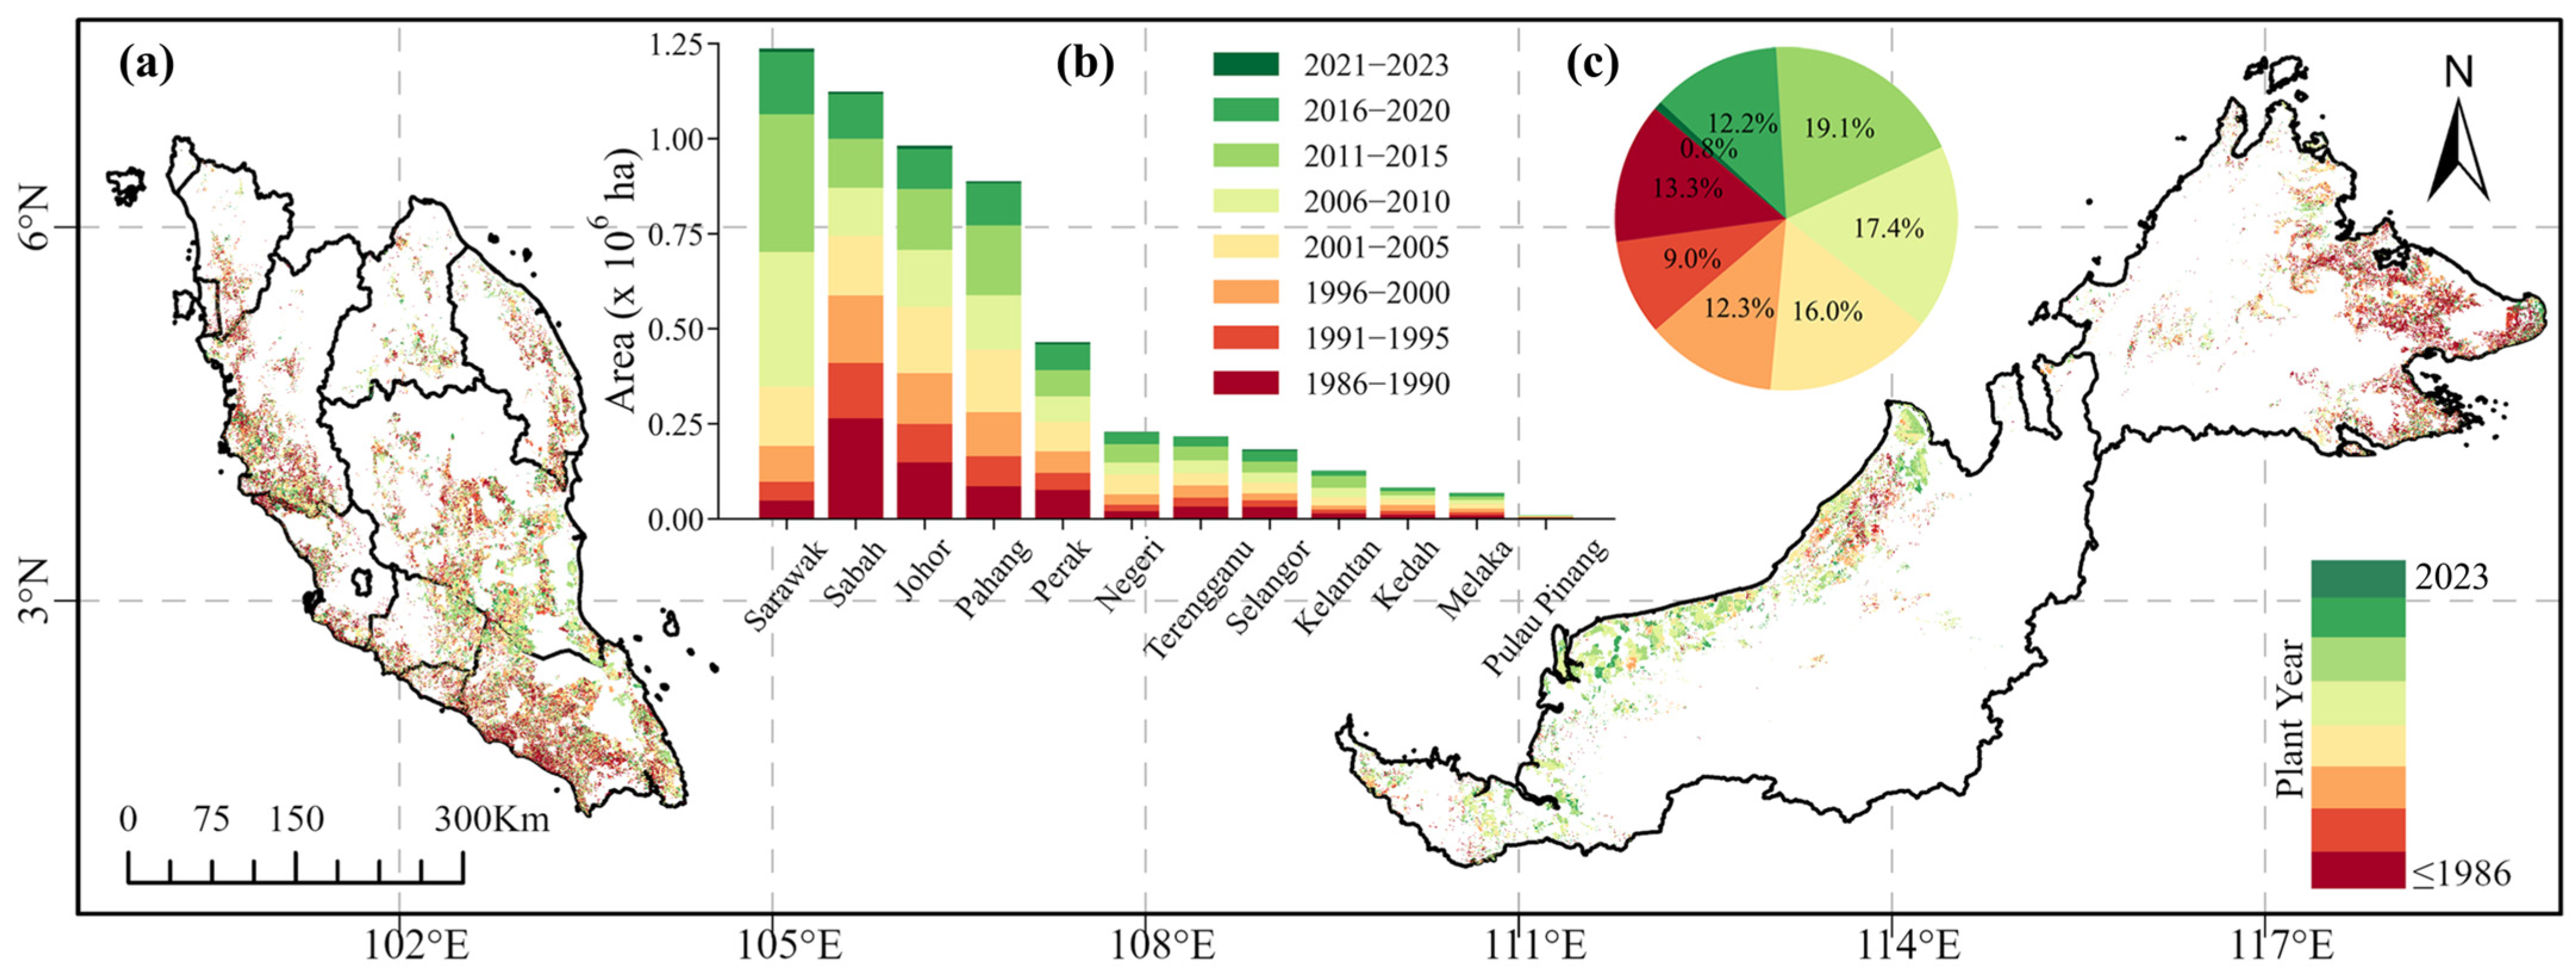
Figure 9 illustrates the age structure of oil palm plantations in Malaysia. Overall, Malaysian oil palms tend to be relatively young, with nearly half of the plantations established after 2006. The highest proportion of oil palms were planted between 2011 and 2015, accounting for 19.1%. However, there are also some older plantations that have not been replanted, with 13.3% of the oil palms exceeding 30 years of age (planted between 1986 and 1990).
From a regional perspective, distinct patterns in age structure distribution were observed. The age structure of oil palms in West Malaysia is relatively uniform, while in East Malaysia, there is pronounced regional heterogeneity. Particularly, the oil palms in the northwest coastal areas are generally younger, while those in the eastern coastal regions are predominantly older.
At the provincial level, the four provinces with the largest oil palm areas exhibit distinct age structures. Sarawak has the youngest oil palm age structure, with 71.8% of plantations established after 2006, and 43.3% of oil palms being under 10 years old (planted after 2010). In contrast, Sabah has a long history of oil palm cultivation, with approximately 52.4% of plantations established before 2000. The age structure of oil palms in Johor and Pahang is relatively consistent, with the proportion of plantations across various age groups being fairly balanced (Figure 9).

3.5. Trends in Topographic Characteristics of Oil Palm in Malaysia

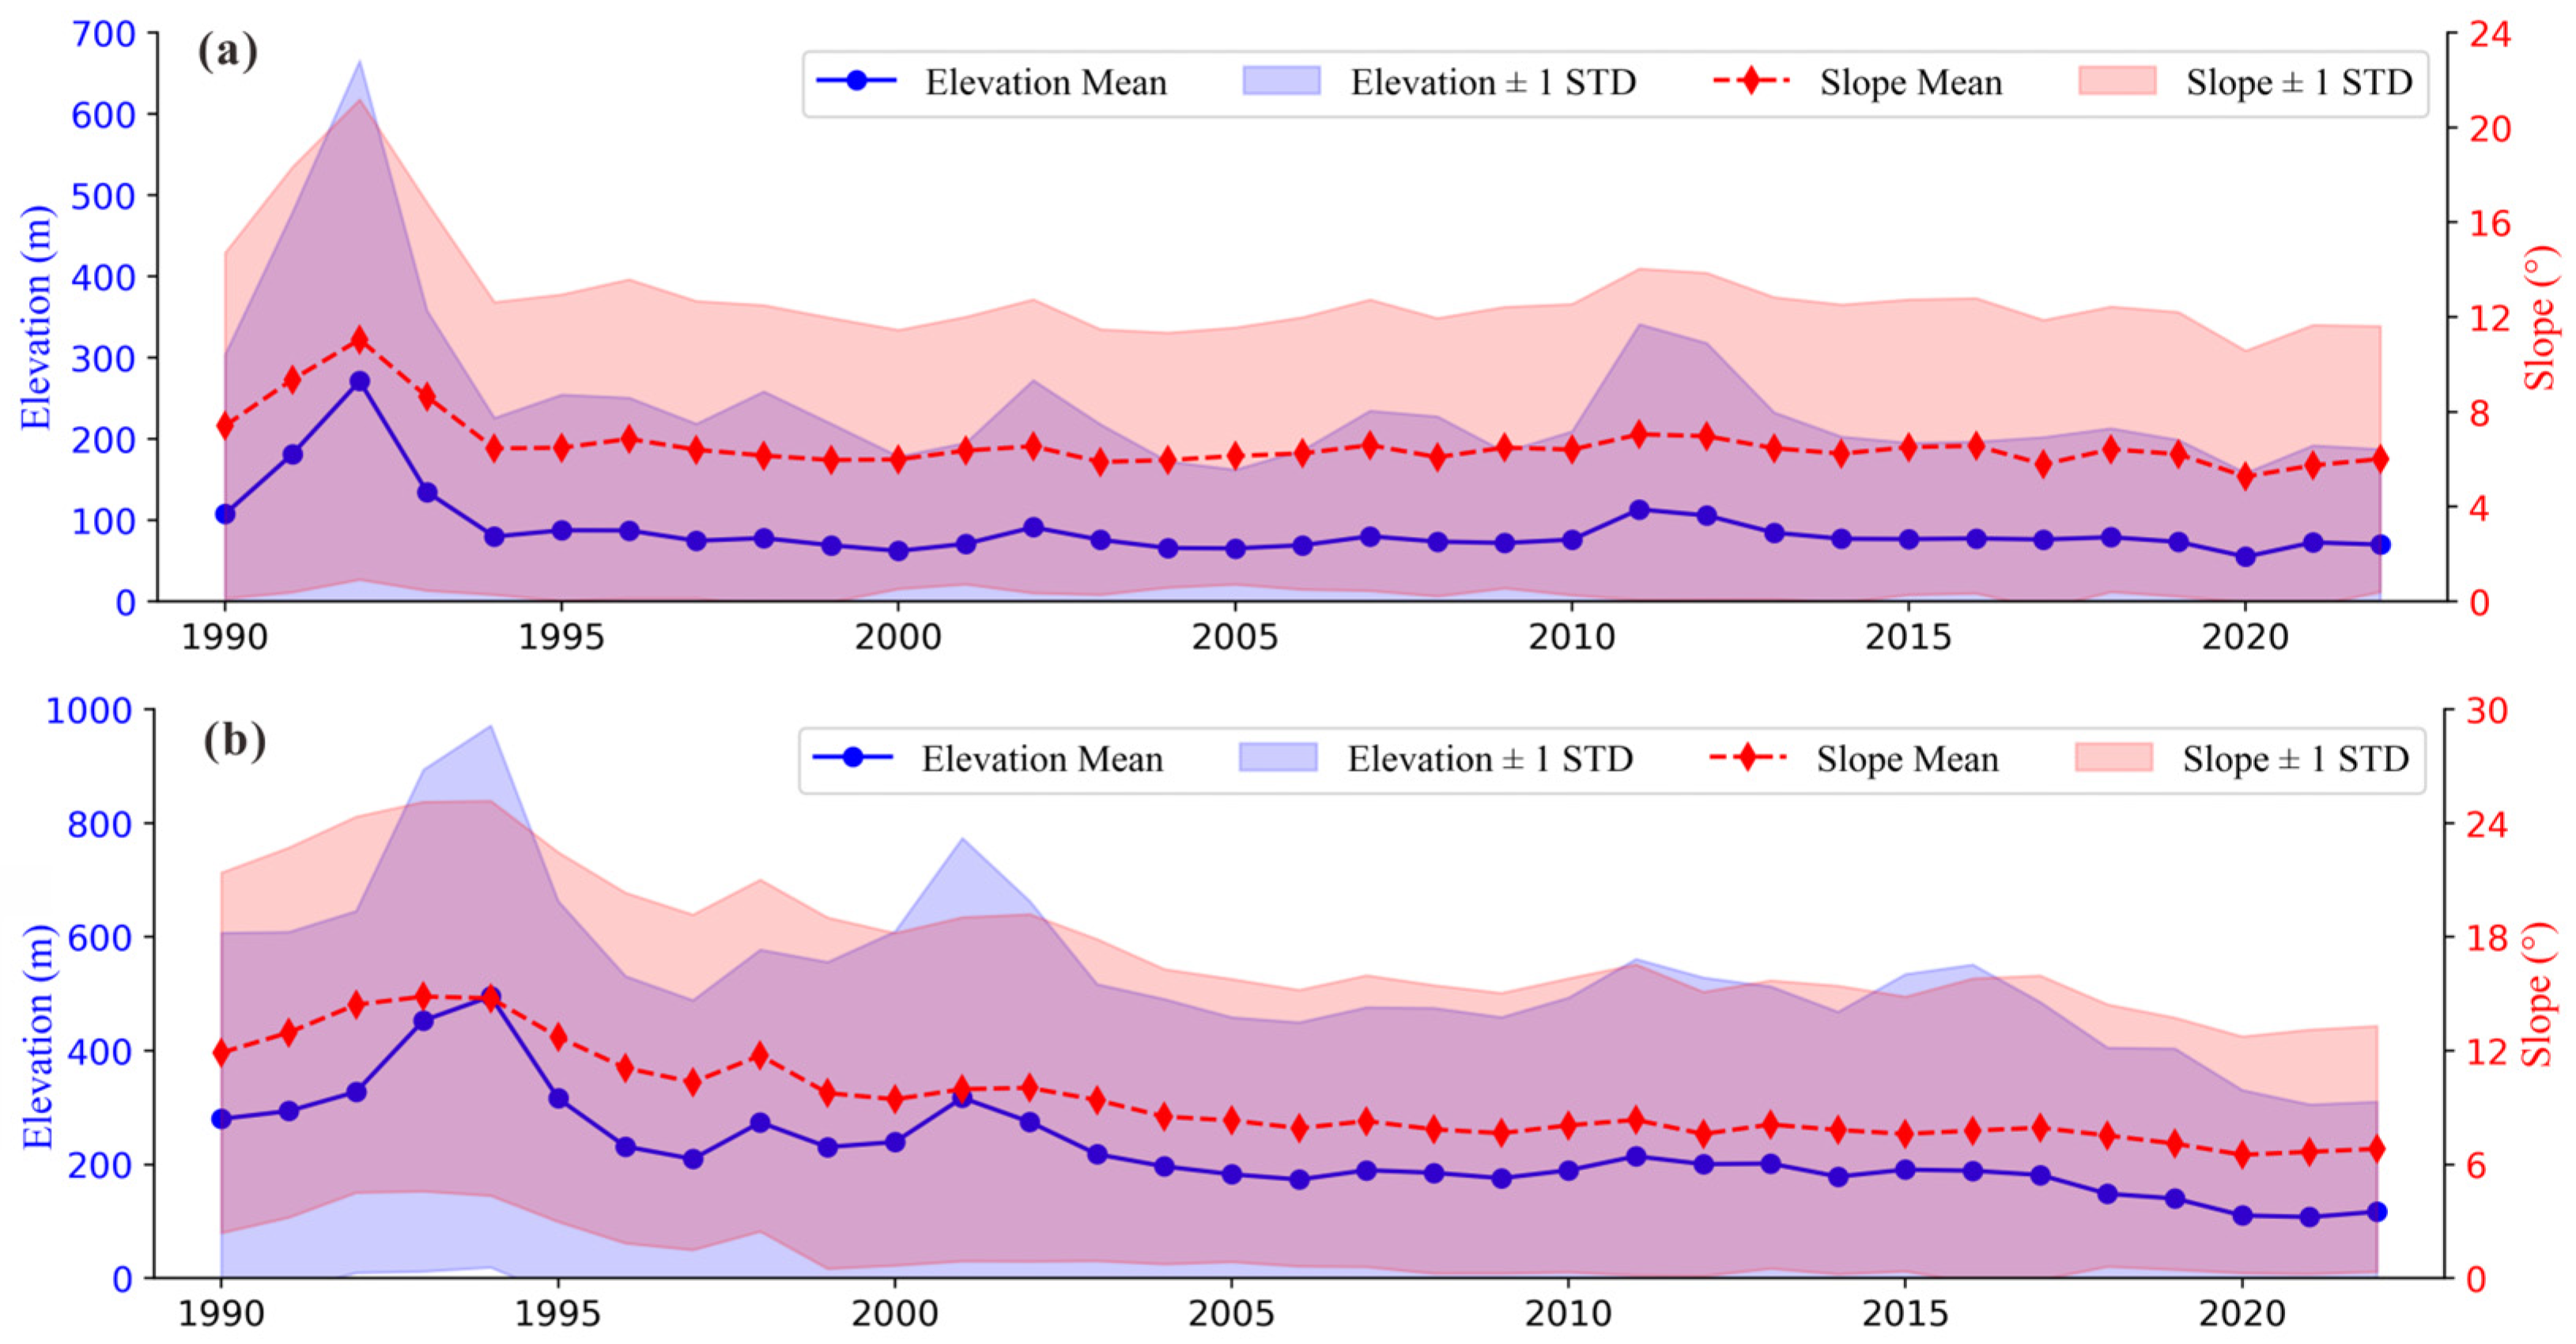
Our spatiotemporal analysis reveals divergent topographic evolution patterns in oil palm cultivation between Peninsular Malaysia and East Malaysia from 1990 to 2023 (Figure 10a,b). In Peninsular Malaysia, cultivation initially occupied low-elevation areas (100 m) before shifting to steeper terrain peaking at 271 m elevation (11° slope) in 1992, followed by a rapid return to baseline elevations (100 m) and moderate slopes (6.5°) post-1991. In stark contrast, East Malaysia exhibited sustained high-elevation cultivation until 1995, reaching a maximum elevation of 495 m (12° slope) in Sabah’s interior highlands, 73% higher than Peninsular Malaysia’s peak elevation. However, post-1995 saw a progressive altitudinal retreat to sub-200 m elevations by 2023, with slopes concurrently decreasing to 6°.
Notably, both regions demonstrate convergence toward comparable topographic envelopes since 2015 (100–120 m elevation, 6–7° slopes), suggesting depletion of prime cultivation lands. These topographic trajectories reflect distinct agricultural frontier dynamics—East Malaysia’s frontier-style expansion followed by ecological zoning constraints versus Peninsular Malaysia’s stable replanting cycles on optimized terrain.

4. Discussion

4.1. Methodological Advancements in Multi-Source Data Integration for Oil Palm Monitoring

This study effectively addresses the issue of optical image cloud interference in tropical, cloudy, and rainy regions by integrating multi-source remote sensing data, including Landsat s4/5/7/8/9, Sentinel-2, and Sentinel-1. This integration approach aligns with best practices identified in previous studies [1,64,65], but extends them through systematic parameter optimization. The approach leverages the complementary strengths of these diverse data sources: optical imagery provides spectral and vegetation index information, while radar data penetrate cloud cover via backscatter coefficients, compensating for the temporal gaps that have historically limited optical-only approaches in Southeast Asian oil palm monitoring [43]. The resulting multi-source classification feature set incorporates spectral features, vegetation indices, radar backscatter coefficients, and texture features. Key distinguishing features of oil palm, relative to other vegetation types, are identified through time series difference analysis. This methodology not only overcomes the limitations of relying on a single data source, but also presents a generalizable framework for vegetation classification in persistently cloudy regions [43].
The accuracy of our oil palm monitoring algorithm is influenced by several interrelated factors. First, the time step of image synthesis is directly linked to the ability to capture phenological features [66,67]. Previous studies in tropical regions have predominantly relied on annual composite images for land cover classification [3,68] or semi-annual composites to capture wet and dry season variations [22], assuming that shorter temporal intervals would be compromised by excessive cloud cover and atmospheric interference. Our finding that a 3-month temporal interval provides optimal classification accuracy contradicts conventional wisdom in tropical remote sensing, which has typically defaulted to annual or biannual composites to overcome cloud contamination [22,68]. A shorter time step allows for more detailed capture of phenological events during the growth cycle of oil palm. For instance, synthesizing images at 3-month intervals can capture the leaf-falling phase of rubber plantations, thereby improving oil palm identification specificity (rubber and oil palm are both prevalent in this region). Second, the size of the median filter window must strike a balance between denoising effectiveness and edge preservation [69,70,71]. Experimental results indicate that a 3 × 3 window successfully eliminates internal plantation noise while preserving edge integrity, aligning with the contiguous spatial distribution of oil palm plantations. Additionally, the window size for the GLCM in texture analysis is critical [72,73,74]. A 3 × 3 window effectively captures the regular texture of oil palm, whereas larger windows may lead to redundant information interference. These parameter optimizations reflect the coupled dynamics of “scale–feature–precision” in multi-source data fusion.
The parameter optimization framework developed in this study represents an important methodological contribution, as it systematically examines the interaction between temporal, spatial, and textural parameters rather than optimizing them in isolation. Previous studies have typically focused on either optimizing classification algorithms [75,76] or feature selection [77], but rarely on the systematic optimization of data synthesis parameters. Our non-linear findings regarding GLCM window size align with the observation of Xu et al. (2021) that texture analysis is particularly valuable for differentiating oil palm from spectrally similar vegetation types, but optimal parameterization varies by regional context [28].
Utilizing a 30-year time series of Landsat images based on NBR, this study incorporates the LandTrendr algorithm to accurately identify the year of oil palm planting (RMSE = 1.14 years). This method achieves high-precision age inversion with ecological interpretability by identifying shifts in NBR before and after oil palm establishment. This long-term time series analysis framework overcomes the limitations of traditional methods reliant on short-term data, and its core algorithm can be adapted for age identification in other forest types, providing a novel approach for global-scale vegetation dynamics monitoring. Previous approaches to oil palm age estimation have relied primarily on regression models using spectral indices [57,78], which encounter saturation effects with mature plantations. Our multi-criteria approach using NBR time series overcomes this limitation by identifying distinctive spectral–temporal signatures associated with plantation establishment, achieving an RMSE of 1.14 years compared to higher error margins in previous studies.

4.2. Spatiotemporal Dynamics and Regional Variability in Malaysian Oil Palm Development

The classification results from 2019 to 2023 reveal that the observed oil palm plantation expansion in Borneo has significantly outpaced that of the Malay Peninsula. This notable achievement is primarily attributed to the vast and sparsely populated landscapes of Sarawak and Sabah, which offer ample land resources for extensive oil palm cultivation [79]. Additionally, the expansive oil palm forests in these regions facilitate intensive palm oil production, enhancing overall production efficiency and establishing Sarawak and Sabah as the leading oil palm planting regions in Malaysia [4]. The coastal plains of Borneo boast a robust economy and comprehensive infrastructure, including palm oil factories and extensive road networks [80]. This provides an optimal environment for the cultivation, processing, transportation, and international trade of oil palm, fostering the establishment of numerous plantations. Collectively, these factors have spurred the rapid growth of Borneo’s oil palm industry, firmly establishing its significant standing in the global palm oil market [81].
Our spatiotemporal analysis reveals significant regional heterogeneity in oil palm distribution patterns between West and East Malaysia. Despite similar total cultivated areas, the spatial arrangement differs markedly, with West Malaysia characterized by widespread but fragmented plantations and East Malaysia showing concentrated coastal cultivation with limited inland development. This pattern aligns with the observation of Gaveau et al. (2016) that oil palm expansion follows distinct frontier patterns based on accessibility, land suitability, and governance structures [82]. The observed shift in the cultivation center of gravity in East Malaysia—moving approximately 100 km inland from coastal areas between 2000 and 2023—represents a significant frontier expansion that contrasts with the more stable plantation patterns in West Malaysia. This finding is consistent with the observation of Charters et al. (2019) that oil palm expansion frontiers are progressively moving inland as coastal areas reach cultivation capacity [83].
In contrast, the Malay Peninsula faces mounting challenges in the sustainable development of its oil palm sector. The region’s available land area for planting is approaching saturation, and labor shortages are becoming increasingly apparent, with a large portion of the workforce originating from neighboring Indonesia [84]. Driven by rising global demand for palm oil and limited availability of arable land, the gradual expansion of plantations into inland areas has sparked considerable societal debate [85]. This expansion raises multifaceted sustainability concerns that extend beyond land scarcity. On one hand, the industry has brought significant socioeconomic benefits to rural communities, such as improved infrastructure, increased employment, and measurable contributions to poverty alleviation. On the other hand, oil palm development has also been associated with social conflict, particularly where land acquisition displaces indigenous communities from their ancestral territories [86]. More critically, environmental repercussions include habitat fragmentation, biodiversity loss, and the clearance of carbon-rich tropical forests [5,10,87]. To address these challenges, the Malaysian government mandated compliance with the Malaysian Sustainable Palm Oil (MSPO) certification scheme in 2019, which was further strengthened with the release of a revised standard (MS2530:2022) [88]. This initiative underscores a national commitment to ensuring that palm oil production aligns with environmental protection, social equity, and long-term economic viability (mspo.org.my, accessed on 20 May 2024).
The topographic analysis reveals a notable pattern of convergence in elevation profiles between West and East Malaysia since 2015, with both regions now concentrating cultivation at similar elevations (100–120 m) and slopes (6–7°). This convergence suggests that after decades of different development trajectories, both regions have now identified comparable optimal topographic niches for oil palm cultivation. This finding extends the work of Yu et al. (2024) on topographic constraints by demonstrating not just the spatial distribution of plantations along elevation gradients, but their temporal evolution toward optimal landscape positions [89]. The historical difference in elevation patterns—with East Malaysia reaching plantation elevations up to 495 m compared to West Malaysia’s 271 m peak—illustrates how resource frontier dynamics interact with topographic constraints differently across regions with varying development histories and land availability.
The observed regional differences in expansion patterns between 2019 and 2023—with West Malaysia (particularly Johor and Pahang) showing continued growth and East Malaysia (particularly Sarawak) experiencing contraction—suggest a significant shift in development dynamics. This contrasts with the findings of [68], who reported consistent expansion across all Malaysian regions from 2001 to 2016. Our results suggest a potential turning point in East Malaysian oil palm development, possibly related to increasing environmental restrictions, market factors, or the maturation of the plantation sector in this region. The substantial decrease in Sarawak’s plantation area (3.34 × 10⁵ hectares) between 2019 and 2023 represents a reversal of the historical expansion trend in this region and warrants further investigation into the driving factors behind this contraction.

4.3. Age Structure Analysis and Implications for Sustainable Management

In addition to mapping the distribution of oil palm plantations, it is equally important to map their age distribution. The age structure of oil palm plantations significantly impacts both productivity and sustainability [90], affecting the yield of fruit bunches [57]. Specifically, palm trees have a typical productive life span of about 25 years, after which they need to be replanted or transitioned to other land uses. Knowing the palm frond area at various stages of growth is critical for yield estimates and improved management practices. Our age structure analysis provides unprecedented insight into the temporal dynamics of Malaysia’s oil palm industry, revealing that 19.1% of plantations were established between 2011–2015, representing the peak planting period. This finding is consistent with international market trends, which identified 2010–2015 as the period of most rapid oil palm expansion globally, coinciding with peak palm oil prices [91]. The significant proportion (13.3%) of plantations exceeding 30 years highlights an urgent need for replanting strategies, as these plantations are operating beyond their optimal productive lifecycle. Although the life cycle of oil palm trees is important for production, Malaysia has a large number of oil palm trees over 25 years old, which makes its palm oil production well below its potential level [92,93].
In Malaysia, our analysis revealed that in 2023, old oil palm trees (aged 25 years and above) constituted just 22% of the total planted area. Nevertheless, considering the prevailing trend of constrained oil palm expansion and sluggish replanting efforts (Figure 8), oil palm aging has emerged as a critical concern in specific Malaysian regions, notably Sabah, where a significant majority of oil palm trees exceed 25 years of age [94]. This regional variation in age structure has significant implications for future plantation management and productivity. The predominantly older plantations in Sabah (52.4% established before 2000) are approaching or exceeding their productive lifespan, suggesting imminent large-scale replanting requirements that will temporarily reduce production. Conversely, Sarawak’s younger plantation profile (71.8% established after 2006) indicates increasing productivity in coming years, despite the overall reduction in cultivated area identified in our spatiotemporal analysis.
Analyzing the oil palm age map spanning 2019 to 2023, we discerned a notable shift in the age distribution of oil palm trees, marked by a substantial decline in the area occupied by younger oil palm trees (specifically, 10-year-old trees) and a corresponding increase in the area occupied by oil palm trees in their peak production phase (10–20 years old) and those that have aged beyond 20 years. This finding suggests a potential “replanting gap” that could affect future palm oil production, corroborating concerns raised by industry bodies regarding Malaysia’s replanting rates [95]. The reduced proportion of young plantations (<10 years) identified in our analysis (from approximately 60% in 2019 to 47% currently) indicates that the replanting rate is not keeping pace with the aging of existing plantations, creating a potential production vulnerability in the medium term.
The distinct regional patterns in age structure between West and East Malaysia reflect their different development histories. West Malaysia’s relatively uniform age distribution indicates incremental expansion and consistent replanting practices over decades, while East Malaysia’s pronounced regional heterogeneity suggests more recent, concentrated development phases. This spatial pattern is consistent with the findings of Castellanos-Navarrete et al. (2017) who noted that different regions within Malaysia have followed distinct oil palm development trajectories, influenced by a combination of historical policy initiatives, market forces, and environmental constraints [96]. The concentration of young plantations in northwestern coastal areas of East Malaysia, contrasting with predominantly older plantations in eastern coastal regions, suggests sequential development waves that have progressively moved inland and westward.
By integrating the latest forest age map data, our study provides a detailed analysis of the age distribution of oil palm trees across Malaysia. This analysis reveals areas with predominantly young plantations, which are entering their peak productive phase, and regions with older plantations, which may require replanting or management interventions [97]. Understanding the age structure is vital for anticipating future yields, planning replanting activities, and managing resources efficiently. Younger plantations may be more adaptable to new agricultural practices and technologies, while older plantations might offer opportunities for rejuvenation or conversion to other sustainable land uses [9]. This age-structured perspective enhances our understanding of the temporal dynamics within the oil palm industry and supports strategic decision-making to ensure the long-term sustainability and productivity of oil palm cultivation in Malaysia. The provincial-level analysis of plantation age distribution provided in this study offers a valuable planning tool for targeted interventions that can optimize resource allocation for replanting initiatives and maximize industry productivity while minimizing environmental impacts.

4.4. Methodological Limitations and Future Research Directions

While our study developed a tailored monitoring algorithm for oil palm plantations in Malaysia, certain limitations remain. First, unlike previous studies that distinguished between industrial and smallholder plantations [22,54], our approach does not address these subdivisions, potentially limiting detailed analysis of development trends within Malaysia’s oil palm industry. The industrial and smallholder sectors follow different expansion patterns and management practices, with significant implications for sustainability and productivity [98]. Future research could extend our methodological framework to incorporate plantation typology classification, potentially enhancing the socioeconomic relevance of the findings.
Second, the algorithm is primarily designed for mature oil palm plantations with closed canopy structures, which means that newly planted young oil palms may not be fully detected, potentially leading to an underestimation of the total oil palm area. As Malaysia’s plantation sector increasingly transitions from expansion to renewal, developing methods that accurately capture young plantations will become increasingly important. The integration of object-based classification methods could enhance classification accuracy by improving spatial correlation and reducing the uncertainty inherent in pixel-based approaches [99,100,101].
Looking forward, the development of more advanced machine learning algorithms, including deep learning models, could further improve classification accuracy and the ability to generalize across different regions and conditions [102,103,104]. The integration of our spatiotemporal and age structure findings with socioeconomic data and policy analyses would provide a more comprehensive understanding of sustainability implications for Malaysia’s oil palm sector. Ultimately, these advancements will contribute to a more sustainable and informed approach to managing oil palm cultivation, balancing economic growth with environmental conservation.

5. Conclusions

This study offers a comprehensive analysis of the spatiotemporal dynamics and age structure of oil palm cultivation in Malaysia, emphasizing the need for sustainable agricultural practices. The model achieved an overall accuracy of 94%, with optimal performance using a 3-month temporal interval, 3-pixel focal median filter, and 3 × 3 GLCM window. Our spatiotemporal analysis revealed significant regional variations between West and East Malaysia, with West Malaysia showing stable plantation patterns and East Malaysia demonstrating more dynamic expansion followed by recent contraction in Sarawak. The age structure analysis identified that nearly half of Malaysia’s oil palm plantations were established after 2006, with distinct provincial profiles—Sarawak having predominantly young plantations and Sabah maintaining older stands.
The methodological framework developed here demonstrates the potential for comprehensive monitoring of oil palm plantations in tropical environments where persistent cloud cover has traditionally limited remote sensing applications. By utilizing advanced remote sensing techniques and providing detailed spatiotemporal and age structure analyses, this study contributes significantly to our understanding of oil palm dynamics in Malaysia. Future research should focus on distinguishing between industrial and smallholder plantations to enhance socioeconomic relevance, developing methods to better detect young plantations during the critical establishment phase, and integrating advanced machine learning approaches including deep learning models to improve classification accuracy across diverse regional conditions. These findings may contribute to guiding sustainable land use practices, conservation efforts, and policy development for one of the world’s most important agricultural commodities.

Author Contributions

Conceptualization, C.L., X.W., M.O.-A. and B.C.; Methodology, C.L. and B.C.; Investigation, M.O.-A., Z.W., G.L., K.A.T. and B.A.; Resources, M.O.-A., K.A.T., B.A., H.L., G.W., T.Y., W.K. and B.C.; Data curation, C.L., Z.W., G.L., H.L., G.W., T.Y. and W.K.; Visualization, C.L.; Formal analysis, C.L.; Validation, C.L., X.W. and B.C.; Writing—original draft, C.L.; Writing—review and editing, X.W., M.O.-A. and B.C.; Funding acquisition, W.K. and B.C.; Project administration, W.K. and B.C. All authors have read and agreed to the published version of the manuscript.

Funding

This research was funded by Central Public-interest Scientific Institution Basal Research Fund (1630022023007), the National Natural Science Foundation of China (42071418), Earmarked Fund for China Agriculture Research System (CARS-33), and Yunnan International Joint Laboratory of Natural Rubber Intelligent Monitor and Digital Applications (202403AP140001).

Data Availability Statement

All relevant data supporting the findings of this study are available in the Figshare digital repository (https://doi.org/10.6084/m9.figshare.28839266). The distribution and age structure of oil palm plantations in Malaysia can be found at https://ee-lch952807.projects.earthengine.app/view/oilpalm-standage (accessed on 6 April 2025).

Conflicts of Interest

The authors declare no conflicts of interest.

References

  1. Chong, K.L.; Kanniah, K.D.; Pohl, C.; Tan, K.P. A review of remote sensing applications for oil palm studies. Geo-Spat. Inf. Sci. 2017, 20, 184–200. [Google Scholar]
  2. Khatun, R.; Reza, M.I.H.; Moniruzzaman, M.; Yaakob, Z. Sustainable oil palm industry: The possibilities. Renew. Sustain. Energy Rev. 2017, 76, 608–619. [Google Scholar] [CrossRef]
  3. Danylo, O.; Pirker, J.; Lemoine, G.; Ceccherini, G.; See, L.; McCallum, I.; Hadi; Kraxner, F.; Achard, F.; Fritz, S. A map of the extent and year of detection of oil palm plantations in Indonesia, Malaysia and Thailand. Sci. Data 2021, 8, 96. [Google Scholar]
  4. Li, W.; Fu, D.; Su, F.; Xiao, Y. Spatial–Temporal Evolution and Analysis of the Driving Force of Oil Palm Patterns in Malaysia from 2000 to 2018. ISPRS Int. J. Geo-Inf. 2020, 9, 280. [Google Scholar]
  5. Pin, K.L.; Wilcove, D.S. Is oil palm agriculture really destroying tropical biodiversity. Conserv. Lett. 2008, 1, 60–64. [Google Scholar]
  6. Lee, J.S.H.; Wich, S.; Widayati, A.; Koh, L.P. Detecting industrial oil palm plantations on Landsat images with Google Earth Engine. Remote Sens. Appl. Soc. Environ. 2016, 4, 219–224. [Google Scholar]
  7. Meijaard, E.; Brooks, T.M.; Carlson, K.M.; Slade, E.M.; Garcia-Ulloa, J.; Gaveau, D.L.A.; Lee, J.S.H.; Santika, T.; Juffe-Bignoli, D.; Struebig, M.J.; et al. The environmental impacts of palm oil in context. Nat. Plants 2020, 6, 1418–1426. [Google Scholar]
  8. Choquette-Levy, N.; Wildemeersch, M.; Oppenheimer, M.; Levin, S.A. Risk transfer policies and climate-induced immobility among smallholder farmers. Nat. Clim. Change 2021, 11, 1046–1054. [Google Scholar]
  9. Numata, I.; Andrew, J.E.; Mark, A.C.; Cangjiao, W.; Jing, Z.; Zhang, A.X. Deforestation, plantation-related land cover dynamics and oil palm age-structure change during 1990–2020 in Riau Province, Indonesia. Environ. Res. Lett. 2022, 17, 94024. [Google Scholar]
  10. Xu, Y.; Yu, L.; Ciais, P.; Li, W.; Santoro, M.; Yang, H.; Gong, P. Recent expansion of oil palm plantations into carbon-rich forests. Nat. Sustain. 2022, 5, 574–577. [Google Scholar]
  11. Defourny, P.; Bontemps, S.; Bellemans, N.; Cara, C.; Dedieu, G.; Guzzonato, E.; Hagolle, O.; Inglada, J.; Nicola, L.; Rabaute, T. Near real-time agriculture monitoring at national scale at parcel resolution: Performance assessment of the Sen2-Agri automated system in various cropping systems around the world. Remote Sens. Environ. 2019, 221, 551–568. [Google Scholar]
  12. Griffiths, P.; Nendel, C.; Hostert, P. Intra-annual reflectance composites from Sentinel-2 and Landsat for national-scale crop and land cover mapping. Remote Sens. Environ. 2019, 220, 135–151. [Google Scholar]
  13. Blickensdörfer, L.; Schwieder, M.; Pflugmacher, D.; Nendel, C.; Erasmi, S.; Hostert, P. Mapping of crop types and crop sequences with combined time series of Sentinel-1, Sentinel-2 and Landsat 8 data for Germany. Remote Sens. Environ. 2022, 269, 112831. [Google Scholar]
  14. Teluguntla, P.; Thenkabail, P.S.; Oliphant, A.; Xiong, J.; Gumma, M.K.; Congalton, R.G.; Yadav, K.; Huete, A. A 30-m landsat-derived cropland extent product of Australia and China using random forest machine learning algorithm on Google Earth Engine cloud computing platform. ISPRS J. Photogramm. 2018, 144, 325–340. [Google Scholar]
  15. Dong, J.; Fu, Y.; Wang, J.; Tian, H.; Fu, S.; Niu, Z.; Han, W.; Zheng, Y.; Huang, J.; Yuan, W. Early-season mapping of winter wheat in China based on Landsat and Sentinel images. Earth Syst. Sci. Data 2020, 12, 3081–3095. [Google Scholar] [CrossRef]
  16. Chen, Y.; Hou, J.; Huang, C.; Zhang, Y.; Li, X. Mapping Maize Area in Heterogeneous Agricultural Landscape with Multi-Temporal Sentinel-1 and Sentinel-2 Images Based on Random Forest. Remote Sens. 2021, 13, 2988. [Google Scholar]
  17. Wang, Y.; Fang, S.; Zhao, L.; Huang, X.; Jiang, X. Parcel-based summer maize mapping and phenology estimation combined using Sentinel-2 and time series Sentinel-1 data. Int. J. Appl. Earth Obs. 2022, 108, 102720. [Google Scholar]
  18. Claverie, M.; Ju, J.; Masek, J.G.; Dungan, J.L.; Vermote, E.F.; Roger, J.; Skakun, S.V.; Justice, C. The Harmonized Landsat and Sentinel-2 surface reflectance data set. Remote Sens. Environ. 2018, 219, 145–161. [Google Scholar]
  19. Song, X.; Huang, W.; Hansen, M.C.; Potapov, P. An evaluation of Landsat, Sentinel-2, Sentinel-1 and MODIS data for crop type mapping. Sci. Remote Sens. 2021, 3, 100018. [Google Scholar]
  20. Cheng, Y.; Yu, L.; Xu, Y.; Lu, H.; Cracknell, A.P.; Kanniah, K.; Gong, P. Mapping oil palm plantation expansion in Malaysia over the past decade (2007–2016) using ALOS-1/2 PALSAR-1/2 data. Int. J. Remote Sens. 2019, 40, 7389–7408. [Google Scholar]
  21. Mohd Najib, N.E.; Kanniah, K.D.; Cracknell, A.P.; Yu, L. Synergy of Active and Passive Remote Sensing Data for Effective Mapping of Oil Palm Plantation in Malaysia. Forests 2020, 11, 858. [Google Scholar] [CrossRef]
  22. Descals, A.; Wich, S.; Meijaard, E.; Gaveau, D.L.A.; Peedell, S.; Szantoi, Z. High-resolution global map of smallholder and industrial closed-canopy oil palm plantations. Earth Syst. Sci. Data 2021, 13, 1211–1231. [Google Scholar]
  23. Xu, Y.; Fu, D.; Yu, H.; Su, F.; Lyne, V.; Fan, R.; He, B.; Pan, T.; Tang, J. High-resolution global mature and young oil palm plantation subclass maps for 2020. Int. J. Digit. Earth 2023, 16, 2168–2188. [Google Scholar] [CrossRef]
  24. Sari, I.L.; Weston, C.J.; Newnham, G.J.; Volkova, L. Using Bayesian multitemporal classification to monitor tropical forest cover changes in Kalimantan, Indonesia. Int. J. Digit. Earth 2022, 15, 2061–2077. [Google Scholar] [CrossRef]
  25. Daliman, S.; Rahman, S.A.; Bakar, S.A.; Busu, I. Segmentation of oil palm area based on GLCM-SVM and NDVI. In Proceedings of the 2014 IEEE Region 10 Symposium, Kuala Lumpur, Malaysia, 14–16 April 2014; IEEE: New York, NY, USA, 2014; pp. 645–650. [Google Scholar]
  26. Al-Ruzouq, R.; Shanableh, A.; Barakat, A.; Gibril, M.; Al-Mansoori, S. Image segmentation parameter selection and ant colony optimization for date palm tree detection and mapping from very-high-spatial-resolution aerial imagery. Remote Sens. 2018, 10, 1413. [Google Scholar]
  27. Kwang, C.S.; Abdul Razak, S.F.; Yogarayan, S.; Adli Zahisham, M.Z.; Tam, T.H.; Mohd Noor, M.K.; Abidin, H. Ganoderma Disease in Oil Palm Trees Using Hyperspectral Imaging and Machine Learning. J. Hum. Earth Future 2025, 6, 67–83. [Google Scholar]
  28. Xu, K.; Qian, J.; Hu, Z.; Duan, Z.; Chen, C.; Liu, J.; Sun, J.; Wei, S.; Xing, X. A New Machine Learning Approach in Detecting the Oil Palm Plantations Using Remote Sensing Data. Remote Sens. 2021, 13, 236. [Google Scholar]
  29. Jarayee, A.N.; Shafri, H.Z.; Ang, Y.; Lee, Y.P.; Bakar, S.A.; Abidin, H.; Lim, H.S.; Abdullah, R.; Junaidi, U.U.; Samad, N. Oil palm age estimation using broad-band and narrow-band vegetation indices derived from Sentinel-2 data. Asia-Pac. J. Sci. Technol. 2024, 29, 13–22. [Google Scholar]
  30. Asari, N.; Suratman, M.N.; Jaafar, J. Modelling and mapping of above ground biomass (AGB) of oil palm plantations in Malaysia using remotely-sensed data. Int. J. Remote Sens. 2017, 38, 4741–4764. [Google Scholar]
  31. Vo, T.T.; Sridhar, M.; Ju, J.; Zhou, Q.; Baker, B.; Freitag, B.; Olofsson, P.; Neigh, C.S.R. Continuous Change Detection and Classification (CCDC) Using NASA’s Harmonized Landsat and Sentinel-2 (HLS) Data in Google Earth Engine (GEE). In Proceedings of the Living Planet Symposium, Vienna, Austria, 23–27 June 2025. [Google Scholar]
  32. Lin, X.; Shang, R.; Chen, J.M.; Zhao, G.; Zhang, X.; Huang, Y.; Yu, G.R.; He, N.P.; Xu, L.; Jiao, W.Z. High-resolution forest age mapping based on forest height maps derived from GEDI and ICESat-2 space-borne lidar data. Agric. For. Meteorol. 2023, 339, 109592. [Google Scholar]
  33. Chen, J.; Du, H.; Mao, F.; Huang, Z.; Chen, C.; Hu, M.; Li, X. Improving forest age prediction performance using ensemble learning algorithms base on satellite remote sensing data. Ecol. Indic. 2024, 166, 112327. [Google Scholar] [CrossRef]
  34. Zhai, L.; Zan, M.; Ye, M.; Zhou, J.; Xue, C.; Yang, S.; Liu, Y. Time-series forest age estimation in Xinjiang based on forest disturbance and recovery detection. Ecol. Indic. 2025, 170, 113043. [Google Scholar] [CrossRef]
  35. Chi, Z.; Xu, K. Multi-Sensor Fusion and Machine Learning for Forest Age Mapping in Southeastern Tibet. Remote Sens. 2025, 17, 1926. [Google Scholar]
  36. Kardooni, R.; Yusoff, S.B.; Kari, F.B.; Moeenizadeh, L. Public opinion on renewable energy technologies and climate change in Peninsular Malaysia. Renew. Energ. 2018, 116, 659–668. [Google Scholar]
  37. Tang, K.H.D. Climate change in Malaysia: Trends, contributors, impacts, mitigation and adaptations. Sci. Total Environ. 2019, 650, 1858–1871. [Google Scholar] [PubMed]
  38. Awalludin, M.F.; Sulaiman, O.; Hashim, R.; Nadhari, W.N.A.W. An overview of the oil palm industry in Malaysia and its waste utilization through thermochemical conversion, specifically via liquefaction. Renew. Sustain. Energy Rev. 2015, 50, 1469–1484. [Google Scholar] [CrossRef]
  39. Roy, D.P.; Kovalskyy, V.; Zhang, H.K.; Vermote, E.F.; Yan, L.; Kumar, S.S.; Egorov, A. Characterization of Landsat-7 to Landsat-8 reflective wavelength and normalized difference vegetation index continuity. Remote Sens. Environ. 2016, 185, 57–70. [Google Scholar]
  40. Zhang, H.K.; Roy, D.P.; Yan, L.; Li, Z.; Huang, H.; Vermote, E.; Skakun, S.; Roger, J.C. Characterization of Sentinel-2A and Landsat-8 top of atmosphere, surface, and nadir BRDF adjusted reflectance and NDVI differences. Remote Sens. Environ. 2018, 215, 482–494. [Google Scholar]
  41. Chen, B.; Ma, J.; Yang, C.; Xiao, X.; Kou, W.; Wu, Z.; Yun, T.; Zaw, Z.; Nawan, P.; Sengprakhon, R.; et al. Diversified land conversion deepens understanding of impacts of rapid rubber plantation expansion on plant diversity in the tropics. Sci. Total Environ. 2023, 874, 162505. [Google Scholar] [PubMed]
  42. Poortinga, A.; Tenneson, K.; Shapiro, A.; Nquyen, Q.; San Aung, K.; Chishtie, F.; Saah, D. Mapping plantations in Myanmar by fusing Landsat-8, Sentinel-2 and Sentinel-1 data along with systematic error quantification. Remote Sens. 2019, 11, 831. [Google Scholar]
  43. Srestasathiern, P.; Rakwatin, P. Oil Palm Tree Detection with High Resolution Multi-Spectral Satellite Imagery. Remote Sens. 2014, 6, 9749–9774. [Google Scholar]
  44. Gao, L.; Wang, X.; Johnson, B.A.; Tian, Q.; Wang, Y.; Verrelst, J.; Mu, X.; Gu, X. Remote sensing algorithms for estimation of fractional vegetation cover using pure vegetation index values: A review. ISPRS J. Photogramm. 2020, 159, 364–377. [Google Scholar]
  45. Sarzynski, T.; Giam, X.; Carrasco, L.; Lee, J.S.H. Combining radar and optical imagery to map oil palm plantations in Sumatra, Indonesia, using the Google Earth Engine. Remote Sens. 2020, 12, 1220. [Google Scholar]
  46. Clevers, J.; De Jong, S.M.; Epema, G.F.; Van Der Meer, F.D.; Bakker, W.H.; Skidmore, A.K.; Scholte, K.H. Derivation of the red edge index using the MERIS standard band setting. Int. J. Remote Sens. 2002, 23, 3169–3184. [Google Scholar]
  47. Nurmasari, Y.A.A.W. Oil palm plantation detection in Indonesia using Sentinel-2 and Landsat-8 optical satellite imagery (case study: Rokan Hulu regency, Riau Province). Int. J. Remote Sens. Earth Sci. (IJRESES) 2021, 18, 3537. [Google Scholar]
  48. Nagai, S.; Ishii, R.; Suhaili, A.B.; Kobayashi, H.; Matsuoka, M.; Ichie, T.; Motohka, T.; Kendawang, J.J.; Suzuki, R. Usability of noise-free daily satellite-observed green–red vegetation index values for monitoring ecosystem changes in Borneo. Int. J. Remote Sens. 2014, 35, 7910–7926. [Google Scholar]
  49. Mohanaiah, P.; Sathyanarayana, P.; GuruKumar, L. Image texture feature extraction using GLCM approach. Int. J. Sci. Res. Publ. 2013, 3, 1–5. [Google Scholar]
  50. Zeng, J.; Tan, M.L.; Tew, Y.L.; Zhang, F.; Wang, T.; Samat, N.; Tangang, F.; Yusop, Z. Optimization of Open-Access Optical and Radar Satellite Data in Google Earth Engine for Oil Palm Mapping in the Muda River Basin, Malaysia. Agriculture 2022, 12, 1435. [Google Scholar] [CrossRef]
  51. Torbick, N.; Ledoux, L.; Salas, W.; Zhao, M. Regional Mapping of Plantation Extent Using Multisensor Imagery. Remote Sens. 2016, 8, 236. [Google Scholar]
  52. Haralick, R.M.; Shanmugam, K.; Dinstein, I. Textural Features for Image Classification. IEEE Trans. On. Syst. 1973, SMC-3, 610–621. [Google Scholar]
  53. Conners, R.W.; Trivedi, M.M.; Harlow, C.A. Segmentation of a high-resolution urban scene using texture operators. Comput. Vis. Graph. Image Process. 1984, 25, 273–310. [Google Scholar] [CrossRef]
  54. Descals, A.; Szantoi, Z.; Meijaard, E.; Sutikno, H.; Rindanata, G.; Wich, S. Oil Palm (Elaeis guineensis) Mapping with Details: Smallholder versus Industrial Plantations and their Extent in Riau, Sumatra. Remote Sens. 2019, 11, 2590. [Google Scholar] [CrossRef]
  55. Breiman, L. Random forests. Mach. Learn. 2001, 45, 5–32. [Google Scholar] [CrossRef]
  56. Belgiu, M.; Drăguţ, L. Random forest in remote sensing: A review of applications and future directions. ISPRS J. Photogramm. 2016, 114, 24–31. [Google Scholar] [CrossRef]
  57. Tan, K.P.; Kanniah, K.D.; Cracknell, A.P. Use of UK-DMC 2 and ALOS PALSAR for studying the age of oil palm trees in southern peninsular Malaysia. Int. J. Remote Sens. 2013, 34, 7424–7446. [Google Scholar] [CrossRef]
  58. You, N.; Dong, J. Examining earliest identifiable timing of crops using all available Sentinel 1/2 imagery and Google Earth Engine. ISPRS J. Photogramm. 2020, 161, 109–123. [Google Scholar] [CrossRef]
  59. Chen, B.; Dong, J.; Thi Thu Hien, T.; Yun, T.; Kou, W.; Wu, Z.; Yang, C.; Wang, G.; Lai, H.; Liu, R. A full time series imagery and full cycle monitoring (FTSI-FCM) algorithm for tracking rubber plantation dynamics in the Vietnam from 1986 to 2022. ISPRS J. Photogramm. 2025, 220, 377–394. [Google Scholar] [CrossRef]
  60. Kennedy, R.E.; Yang, Z.; Cohen, W.B. Detecting trends in forest disturbance and recovery using yearly Landsat time series: 1. LandTrendr—Temporal segmentation algorithms. Remote Sens. Environ. 2010, 114, 2897–2910. [Google Scholar] [CrossRef]
  61. Kennedy, R.E.; Yang, Z.; Gorelick, N.; Braaten, J.; Cavalcante, L.; Cohen, W.B.; Healey, S. Implementation of the LandTrendr algorithm on google earth engine. Remote Sens. 2018, 10, 691. [Google Scholar] [CrossRef]
  62. Putra, E.T.S.; Simatupang, A.F.; Waluyo, S.; Indradewa, D. The growth of one year-old oil palms intercropped with soybean and groundnut. J. Agric. Sci. 2012, 4, 169. [Google Scholar] [CrossRef]
  63. van Leeuwen, S. Analysis of a Pineapple-Oil Palm Intercropping System in Malaysia. Master’s Thesis, Wageningen University, Wageningen, The Netherlands, 2019. [Google Scholar]
  64. Cheng, Y.; Yu, L.; Xu, Y.; Liu, X.; Lu, H.; Cracknell, A.P.; Kanniah, K.; Gong, P. Towards global oil palm plantation mapping using remote-sensing data. Int. J. Remote Sens. 2018, 39, 5891–5906. [Google Scholar] [CrossRef]
  65. Azizan, F.A.; Kiloes, A.M.; Astuti, I.S.; Abdul Aziz, A. Application of optical remote sensing in rubber plantations: A systematic review. Remote Sens. 2021, 13, 429. [Google Scholar] [CrossRef]
  66. Liang, L.; Schwartz, M.D.; Fei, S. Validating satellite phenology through intensive ground observation and landscape scaling in a mixed seasonal forest. Remote Sens. Environ. 2011, 115, 143–157. [Google Scholar] [CrossRef]
  67. Weiss, M.; Jacob, F.; Duveiller, G. Remote sensing for agricultural applications: A meta-review. Remote Sens. Environ. 2020, 236, 111402. [Google Scholar] [CrossRef]
  68. Xu, Y.; Yu, L.; Li, W.; Ciais, P.; Cheng, Y.; Gong, P. Annual oil palm plantation maps in Malaysia and Indonesia from 2001 to 2016. Earth Syst. Sci. Data 2020, 12, 847–867. [Google Scholar] [CrossRef]
  69. Zhang, Y.; Cheng, H.; Huang, J.; Tang, X. An effective and objective criterion for evaluating the performance of denoising filters. Pattern Recogn. 2012, 45, 2743–2757. [Google Scholar] [CrossRef]
  70. Zuo, W.; Zhang, L.; Song, C.; Zhang, D.; Gao, H. Gradient histogram estimation and preservation for texture enhanced image denoising. IEEE T. Image Process 2014, 23, 2459–2472. [Google Scholar]
  71. de Araujo, A.F.; Constantinou, C.E.; Tavares, J.M.R. Smoothing of ultrasound images using a new selective average filter. Expert. Syst. Appl. 2016, 60, 96–106. [Google Scholar] [CrossRef]
  72. Kayitakire, F.; Hamel, C.; Defourny, P. Retrieving forest structure variables based on image texture analysis and IKONOS-2 imagery. Remote Sens. Environ. 2006, 102, 390–401. [Google Scholar] [CrossRef]
  73. Agüera, F.; Aguilar, F.J.; Aguilar, M.A. Using texture analysis to improve per-pixel classification of very high resolution images for mapping plastic greenhouses. ISPRS J. Photogramm. 2008, 63, 635–646. [Google Scholar] [CrossRef]
  74. Rampun, A.; Strange, H.; Zwiggelaar, R. Texture segmentation using different orientations of GLCM features. In Proceedings of the 6th International Conference on Computer Vision/Computer Graphics Collaboration Techniques and Applications, Berlin, Germany, 6–7 June 2013; pp. 1–8. [Google Scholar]
  75. Li, W.; Fu, H.; Yu, L.; Cracknell, A. Deep Learning Based Oil Palm Tree Detection and Counting for High-Resolution Remote Sensing Images. Remote Sens. 2017, 9, 22. [Google Scholar] [CrossRef]
  76. Yarak, K.; Witayangkurn, A.; Kritiyutanont, K.; Arunplod, C.; Shibasaki, R. Oil palm tree detection and health classification on high-resolution imagery using deep learning. Agriculture 2021, 11, 183. [Google Scholar] [CrossRef]
  77. Puttinaovarat, S.; Horkaew, P. Deep and machine learnings of remotely sensed imagery and its multi-band visual features for detecting oil palm plantation. Earth Sci. Inform. 2019, 12, 429–446. [Google Scholar] [CrossRef]
  78. Chemura, A.; van Duren, I.; van Leeuwen, L.M. Determination of the age of oil palm from crown projection area detected from WorldView-2 multispectral remote sensing data: The case of Ejisu-Juaben district, Ghana. ISPRS J. Photogramm. 2015, 100, 118–127. [Google Scholar] [CrossRef]
  79. Lindsay, E.; Convery, I.; Ramsey, A.D.; Simmons, E. Changing place: Palm oil and sense of place in Borneo. Hum. Geogr. J. Stud. Res. Hum. Geogr. 2012, 6, 45–54. [Google Scholar] [CrossRef]
  80. Lee, B.T.F.; Sims, J.P.; Ouyang, H.; Komšić, F.; Bettani, S.A. Nusantara’s Northern Neighbors: Brunei, Sabah, Sarawak, and the Prospects of a Pan-Borneo Railway in ASEAN. Unnes Political Sci. J. 2024, 8, 54–68. [Google Scholar] [CrossRef]
  81. Ordway, E.M.; Naylor, R.L.; Nkongho, R.N.; Lambin, E.F. Oil palm expansion and deforestation in Southwest Cameroon associated with proliferation of informal mills. Nat. Commun. 2019, 10, 114. [Google Scholar] [CrossRef] [PubMed]
  82. Gaveau, D.L.; Sheil, D.; Husnayaen; Salim, M.A.; Arjasakusuma, S.; Ancrenaz, M.; Pacheco, P.; Meijaard, E. Rapid conversions and avoided deforestation: Examining four decades of industrial plantation expansion in Borneo. Sci. Rep. 2016, 6, 32017. [Google Scholar] [CrossRef] [PubMed]
  83. Charters, L.J.; Aplin, P.; Marston, C.G.; Padfield, R.; Rengasamy, N.; Bin Dahalan, M.P.; Evers, S. Peat swamp forest conservation withstands pervasive land conversion to oil palm plantation in North Selangor, Malaysia. Int. J. Remote Sens. 2019, 40, 7409–7438. [Google Scholar] [CrossRef]
  84. Sayer, J.; Ghazoul, J.; Nelson, P.; Klintuni Boedhihartono, A. Oil palm expansion transforms tropical landscapes and livelihoods. Glob. Food Secur. 2012, 1, 114–119. [Google Scholar] [CrossRef]
  85. Mosnier, A.; Boere, E.; Reumann, A.; Yowargana, P.; Pirker, J.; Havlík, P.; Pacheco, P. Palm Oil and Likely Futures: Assessing the Potential Impacts of Zero Deforestation Commitments and a Moratorium on Large-Scale Oil Palm Plantations in Indonesia; No. 51; CIFOR: Bogor, Indonesia, 2017. [Google Scholar]
  86. Colchester, M. Do commodity certification systems uphold indigenous peoples’ rights? Lessons from the Roundtable on Sustainable Palm Oil and Forest Stewardship Council. Policy Matters 2016, 21, 150–165. [Google Scholar]
  87. Fitzherbert, E.B.; Struebig, M.J.; Morel, A.; Danielsen, F.; Brühl, C.A.; Donald, P.F.; Phalan, B. How will oil palm expansion affect biodiversity? Trends Ecol. Evol. 2008, 23, 538–545. [Google Scholar] [CrossRef]
  88. MS 2530:2022; Malaysian Sustainable Palm Oil (MSPO). Department of Standards Malaysia: Cyberjaya, Malaysia, 2022.
  89. Koh, P.L.; Wilcove, D.S.; Yu, H.; Fu, D.; Yuan, Z.; Tang, J.; Xiao, Y.; Kang, L.; Lyne, V.; Su, F. Regimes of global and national oil palm cultivations from 2001 to 2018. Glob. Environ. Change 2024, 86, 102845. [Google Scholar]
  90. Mansor, S.A.; Sarker, M.L.R. Remote sensing technique for estimating the age of oil palm using high resolution image. In Proceedings of the 36th Asian Conference on Remote Sensing 2015, Quezon, Phillipines, 24–28 October 2015; pp. 24–28. [Google Scholar]
  91. Gaveau, D.; Locatelli, B.; Salim, M.A.; Husnayaen; Manurung, T.; Descals, A.; Angelsen, A.; Meijaard, E.; Sheil, D. Slowing deforestation in Indonesia follows declining oil palm expansion and lower oil prices. PLoS ONE 2022, 17, e266178. [Google Scholar] [CrossRef] [PubMed]
  92. Aholoukpè, H.; Dubos, B.; Flori, A.; Deleporte, P.; Amadji, G.; Chotte, J.; Blavet, D. Estimating aboveground biomass of oil palm: Allometric equations for estimating frond biomass. For. Ecol. Manag. 2013, 292, 122–129. [Google Scholar] [CrossRef]
  93. Ardana, I.K.; Wulandari, S.; Hartati, R.S. Urgency to accelerate replanting of Indonesian oil palm: A review of the role of seed institutions. Iop Conf. Series. Earth Environ. Sci. 2022, 974, 12104. [Google Scholar] [CrossRef]
  94. Hati, D.P.; Mulyani, A.; Nugroho, E.S. An estimation method for oil palm replanting potential in Kampar Regency, Province of Riau. Iop Conf. Ser. Earth Environ. Sci. 2021, 757, 12034. [Google Scholar]
  95. Zhao, J.; Elmore, A.J.; Lee, J.S.H.; Numata, I.; Zhang, X.; Cochrane, M.A. Replanting and yield increase strategies for alleviating the potential decline in palm oil production in Indonesia. Agric. Syst. 2023, 210, 103714. [Google Scholar] [CrossRef]
  96. Castellanos-Navarrete, A.; Jansen, K. Oil palm expansion without enclosure: Smallholders and environmental narratives. In Global Land Grabbing and Political Reactions ‘from Below’; Routledge: New York, NY, USA, 2017; pp. 325–350. [Google Scholar]
  97. Abubakar, A.; Kasim, S.; Ishak, M.Y.; Uddin, M.K. Maximizing Oil Palm Yield: Innovative Replanting Strategies for Sustainable Productivity. J. Environ. Earth Sci. 2023, 5, 61–75. [Google Scholar] [CrossRef]
  98. Rhebergen, T.; Fairhurst, T.; Whitbread, A.; Giller, K.E.; Zingore, S. Yield gap analysis and entry points for improving productivity on large oil palm plantations and smallholder farms in Ghana. Agr. Syst. 2018, 165, 14–25. [Google Scholar] [CrossRef]
  99. Hussain, M.; Chen, D.; Cheng, A.; Wei, H.; Stanley, D. Change detection from remotely sensed images: From pixel-based to object-based approaches. ISPRS J. Photogramm. 2013, 80, 91–106. [Google Scholar] [CrossRef]
  100. Chen, Y.; Zhou, Y.N.; Ge, Y.; An, R.; Chen, Y. Enhancing land cover mapping through integration of pixel-based and object-based classifications from remotely sensed imagery. Remote Sens. 2018, 10, 77. [Google Scholar] [CrossRef]
  101. Meghraoui, K.; Sebari, I.; Bensiali, S.; El Kadi, K.A. Can Pixel-Based Approach Achieve Similar Performance to Area-Based Approach in Crop Yield Forecasting Using Sentinel-2 Imagery and Deep Neural Networks? A Probabilistic Analysis. In Proceedings of the 2024 2nd International Conference on Technology Innovation and Its Applications (ICTIIA), Medan, Indonesia, 12–13 September 2024; pp. 1–6. [Google Scholar]
  102. Pouyanfar, S.; Sadiq, S.; Yan, Y.; Tian, H.; Tao, Y.; Reyes, M.P.; Shyu, M.L.; Chen, S.C.; Iyengar, S.S. A survey on deep learning: Algorithms, techniques, and applications. ACM Comput. Surv. (CSUR) 2018, 51, 1–36. [Google Scholar] [CrossRef]
  103. Dargan, S.; Kumar, M.; Ayyagari, M.R.; Kumar, G. A survey of deep learning and its applications: A new paradigm to machine learning. Arch. Comput. Method Eng. 2020, 27, 1071–1092. [Google Scholar] [CrossRef]
  104. Zhang, W.; Gu, X.; Tang, L.; Yin, Y.; Liu, D.; Zhang, Y. Application of machine learning, deep learning and optimization algorithms in geoengineering and geoscience: Comprehensive review and future challenge. Gondwana Res. 2022, 109, 1–17. [Google Scholar] [CrossRef]
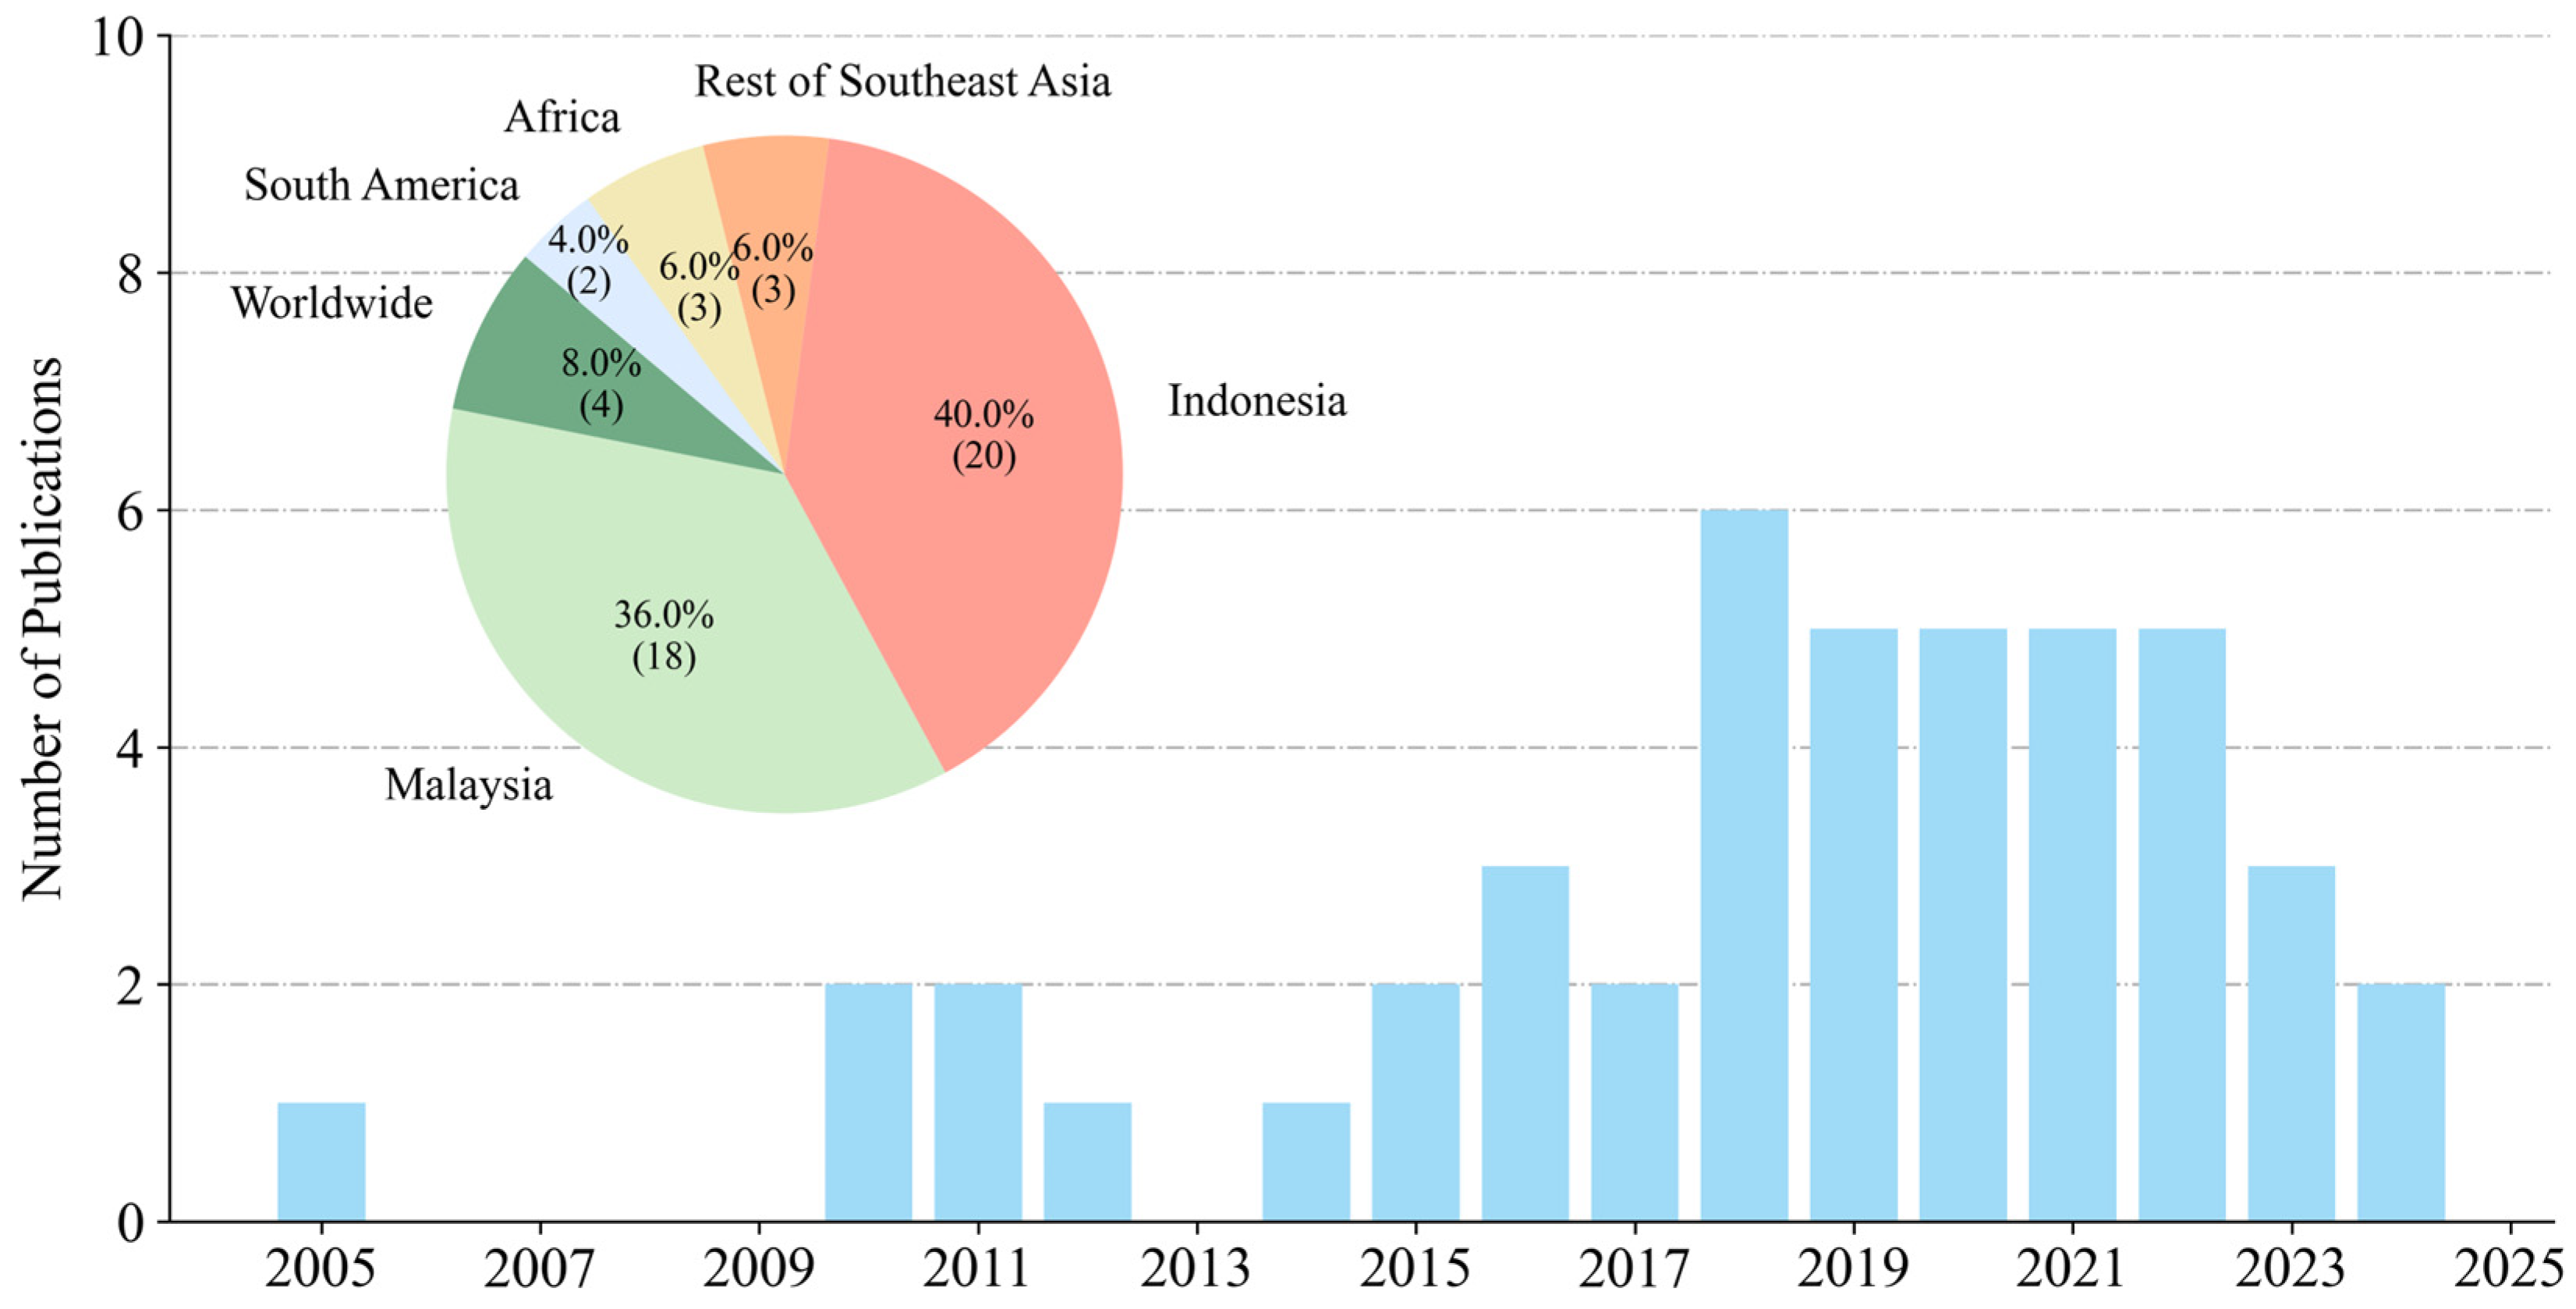
Figure 1. Overview of the peer-reviewed publications on mapping oil palm plantations using remote sensing by year and region.
Remotesensing 17 02908 g001
Figure 2. Location of Malaysia and the sample plots.
Remotesensing 17 02908 g002
Figure 5. Schematic diagram of the oil palm establishment year detection method based on the adapted LandTrendr approach. (a) Conceptual illustration of oil palm disturbance and regrowth stages, from mature canopy to replanting and recovery. (b) Time series of NBR showing original and fitted values, where the establishment year is identified following the minimum NBR point, indicating post-disturbance regrowth.
Remotesensing 17 02908 g005
Figure 6. Accuracy comparison across combinations of temporal intervals (3, 6, and 12 months), focal median filter radii (0–5), and gray-level co-occurrence matrix (GLCM) window sizes (1, 3, and 5; shown in legend). Subfigures (ad) correspond to increasing focal median filter radii.
Remotesensing 17 02908 g006
Figure 7. Comparison of observed versus estimated establishment years derived from random sampling points.
Remotesensing 17 02908 g007
Figure 8. Oil palm change between 2019 and 2023 in Malaysia: (a) distribution of planting changes; (b) regional statistics: (I–IV) zoom view of Planet images and change maps for four regions in 2019 and 2023. The locations of I–IV are shown on figure (a).
Remotesensing 17 02908 g008
Figure 9. Establishment year of oil palm in Malaysia and their area structure in different years: (a) establishment year of oil palm plantations, (b) area structure of different oil palm plantations at 5-year intervals, (c) and the percentage of different age groups.
Remotesensing 17 02908 g009
Figure 10. Changes in average elevation and slope of oil palm planted in Malaysia between 1990 and 2020: (a) Peninsular Malaysia (West Malaysia) and (b) East Malaysia.
Remotesensing 17 02908 g010
Table 2. Error matrix for classification of oil palm and non-oil palm.
SampleUser’s Acc.Overall Acc.KappaF1-Score
Oil PalmsNon-Oil PalmsTotal
2023ClassificationOil Palms15948816820.950.940.950.89
Non-Oil Palms114191620300.94
Total170820043712
Producer’s Acc.0.930.96
Disclaimer/Publisher’s Note: The statements, opinions and data contained in all publications are solely those of the individual author(s) and contributor(s) and not of MDPI and/or the editor(s). MDPI and/or the editor(s) disclaim responsibility for any injury to people or property resulting from any ideas, methods, instructions or products referred to in the content.