Abstract
The online coupling of aerosols and clouds and its effect on surface global horizontal irradiance (GHI) has not yet been thoroughly investigated in the Weather Research and Forecasting Model with Solar extensions (WRF-Solar), despite its potential significance for solar energy applications. This study addresses this critical gap by implementing a computationally efficient, coupled aerosol–cloud scheme and evaluating its impacts on GHI predictability. Simulations with online aerosol–cloud coupling are systematically compared to uncoupled simulations during March 2021, a period marked by two distinct pollution episodes over north China. The online coupling enhances aerosol optical depth (AOD) simulations, increasing the correlation coefficient from 0.19 to 0.51 while reducing the absolute bias from 0.54 to 0.48 and root mean square error from 0.82 to 0.72, compared to uncoupled simulations. Enhanced cloud microphysics (droplet concentration, water path) yields better cloud optical depth estimates, reducing all-sky GHI bias by 14.5% (63.5 W/m2 for the uncoupled scenario and 54.3 W/m2 for the coupled scenario) through improved aerosol–cloud–meteorology interactions. Notably, the simultaneous spatiotemporal improvement of both AOD and GHI suggests enhanced internal consistency in aerosol–cloud–radiation interactions, which is crucial for operational solar irradiance forecasting in pollution-prone regions. The results also highlight the practical value of incorporating online aerosol coupling in solar forecasting models.
1. Introduction
Carbon neutrality achievement in China necessitates photovoltaic (PV) and wind power capacity expansion from 1 to 10–15 PWh/year between 2020 and 2060 [1,2]. This substantial increase in capacity underscores the urgent need for accurate global horizontal irradiance (GHI) forecasting to optimize grid integration and energy planning strategies [3].
Atmospheric aerosols are the primary medium governing the radiation transfer process [4] through aerosol–radiation interactions (ARIs, the “direct effect”) and aerosol–cloud interactions (ACIs, the “indirect effects”) [5,6,7]. Among aerosols, hydrophilic species—commonly referred to as ‘‘water-friendly’’ aerosols (NWFAs)—including sulfate, nitrate, and organic aerosols, play a particularly important role due to their capacity to act as cloud condensation nuclei (CCN) under high relative humidity conditions [8]. NWFAs alter cloud microphysical properties by increasing droplet number and reducing droplet size, thereby enhancing the Twomey and Albrecht effects, which in turn affect cloud albedo and lifetime [9,10,11]. Additionally, these species are key drivers of aerosol hygroscopic growth [12,13], enhancing aerosol scattering and absorption through increased shortwave extinction coefficients, ultimately contributing to surface cooling [14].
ARI processes have been extensively characterized through observational campaigns and numerical modeling studies [12,15,16,17], with contributions accounting for 10–70% of clear-sky shortwave radiative heating across Asian regions [18]. However, ACI mechanisms remain poorly constrained, with estimates of ACI-related effective radiative forcing exhibiting substantial variability, ranging from −1.45 to −0.25 W/m−2 in climate models [19]. ACI represents the most uncertain component of aerosol climate impacts due to inadequate parameterizations [20]. Under cloudy conditions, ACI processes can substantially modify cloud properties by either enhancing or suppressing cloud cover and optical depth, resulting in substantial GHI fluctuations over short time scales [17]. Consequently, the inherent complexity of ACI poses significant challenges for accurate all-sky GHI forecasting and simulations, particularly in regions characterized by high aerosol loading such as eastern China [21,22].
Numerical weather prediction (NWP) models demonstrate distinct advantages for solar forecasting beyond 6-h lead times due to their capability to represent fundamental physical processes [23]. However, traditional offline modeling approaches, such as the Weather Research and Forecasting model with Solar extensions (WRF-Solar), rely on prescribed aerosol climatology data, failing to capture dynamic ACI processes and thereby limiting forecast accuracy in aerosol-laden regions such as eastern China [24]. Integrating atmospheric chemistry, particularly ACI mechanisms, is thus essential for enhancing forecasting precision [25]. While WRF-Chem is capable of simulating ACI through real-time aerosol–cloud–radiation feedbacks, its limited applicability in real forecasting underscores the need for more efficient modeling approaches [26].
To address this challenge, recent studies have incorporated the Thompson–Eidhammer aerosol-aware microphysics scheme and the Goddard Chemistry Aerosol Radiation and Transport (GOCART) module into WRF-Solar, resulting in a fully coupled version termed WRF-Chem-Solar [27]. Unlike WRF-Chem, which resolves detailed aerosol and gas-phase chemistry, WRF-Chem-Solar dynamically links aerosol mass concentrations with cloud droplet activation processes, providing more realistic ACI representation while maintaining physical consistency. Crucially, it achieves similar this at relatively lower computational expense, making WRF-Chem-Solar more suitable for operational forecasting compared to WRF-Chem. Both WRF-Chem and WRF-Chem-Solar outperform WRF-Solar in dynamic aerosol environments, yet only the latter balances physical fidelity with efficiency.
Despite these advancements, a quantitative comparison between WRF-Chem-Solar and traditional WRF-Solar has not yet been conducted, and the mechanisms by how ACI modulate all-sky GHI remain insufficiently explored.
This study investigates the role of online-coupled aerosol representation in WRF-Solar, with a specific focus on its influence on cloud microphysics and subsequent impacts on all-sky GHI via ACI processes. Clarifying these interactions is essential for improving solar energy forecasting in China and facilitating the efficient integration of solar power into the national grid. The findings also offer valuable insights into aerosol–cloud interactions within regional climate models, contributing to enhanced accuracy in solar radiation prediction.
2. Materials and Methods
2.1. Aerosol Optical Depth (AOD) Observations
Aerosol Optical Depth (AOD) data are obtained from two ground-based networks: the Aerosol Robotic Network (AERONET) and the Sun–Sky Radiometer Observation Network (SONET). AERONET delivers globally automated, continuous AOD measurements [28]. We employed quality-assured AERONET Version 3 retrievals (uncertainty: ±0.01) [29] to validate the simulated AOD at temporal scale. SONET, with a mean deviation of only 0.002 compared to AERONET, also offers reliable ground-based measurements [30]. As AERONET and SONET do not report AOD at 550 nm, we estimate it via logarithmic interpolation using the Ångström law between 440 and 675 nm. The interpolated values are then hourly averaged within a ±30-min window to match the model output frequency. More details of the procedures can be found in Wang et al., (2025) [27]. Finally, a total of 19 AERONET and 18 SONET sites are used in this analysis, with their locations shown as black dots in Figure 1b.
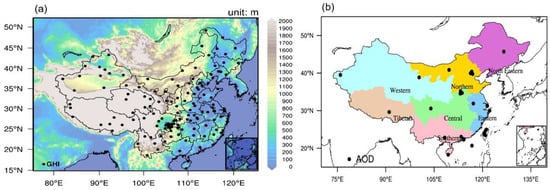
Figure 1.
(a) Simulation domain and terrain height (Units: meters). (b) The zoning map of seven main electricity grids in China in colors. The locations of the GHI and AOD monitoring network used in this study are also shown by black dots.
2.2. Moderate Resolution Imaging Spectroradiometer (MODIS) Satellite Observations
The combined Deep Blue (DB) and Dark Target (DT) AOD Level 2 Collection 6.1 products at 550 nm (with spectral widths of approximately 20 nm) from Aqua (MYD04_L2) and Terra (MOD04_L2) of Moderate Resolution Imaging Spectroradiometer (MODIS) are used to evaluate the model performance of AOD at the spatial scale. It is typically interpolated from multi-band reflectance retrievals depending on aerosol models and viewing geometry, and the products are at stage 2 validation, indicating maturity and extensive testing with regular radiometric calibration updates to address sensor degradation. These products are regridded to match the model resolution and compared to monthly mean simulated AOD [31,32]. MODIS AOD data have a spatial resolution of 10 km × 10 km and a temporal resolution of approximately one to two days [33].
2.3. Solar Radiation Data
Hourly GHI data from the Surface Downward Solar Radiation Compositions (SSRC) system (accessed 21 Jun 2023, https://www.slrss.cn/care/sp/pc/) are used to assess the spatial performance of the model under all-sky conditions at hourly scale [34]. It is a near-real-time monitoring system that integrates data from Himawari-8/9 and Fengyun-4 satellites. It fully considers the effects of aerosol types, cloud phases, and gas components. Validation against ground-based measurements have indicated its superior accuracy for GHI [34]. Additionally, GHI data from 138 China Meteorological Administration (CMA) stations across China are used to validate modeled GHI for all-sky conditions with temporal scale. The GHI measurements are obtained using pyranometers with a spectral response ranging from 300 to 3000 nm, covering the full shortwave radiation spectrum. All measurements are subject to rigorous quality control procedures [35,36]. The locations of all 138 stations are depicted in Figure 1a.
2.4. Cloud Optical Thickness (COD) Data
Hourly Cloud Optical Thickness (COD) data at 500 nm are obtained from the SSRC system, which provides spatial COD across east Asia at hourly scale [34]. To distinguish COD dominated by hygroscopic aerosols, only cloud phase taken as water is used. All the results are interpolated into the WRF model grid for comparison.
2.5. Experiments Design
The Weather Research and Forecasting model with Chemistry (WRF-Chem) version 4.4 is used in this study [26]. The simulation domain covers eastern Asia at a horizontal resolution of 9 km with 45 vertical levels (Figure 1a). Initial and boundary meteorological conditions are provided by the NCEP-FNL Operational Global Analysis dataset (accessed 6 Jan 2025, https://rda.ucar.edu/datasets/ds083.2/). Anthropogenic aerosol emissions are derived from the 2018 HTAPv3 mosaic inventory [37], while sea salt emissions followed the GOCART scheme. A 20 s time step is set to ensure numerical stability, and hourly outputs is used for analysis. The key physical and chemical parameterizations applied in the simulations can be found in Table 1.

Table 1.
Configuration of the model used in the study.
In the baseline WRF-Solar configuration, aerosol number concentrations are derived from a multi-year (2001–2007) GOCART climatology [38], which lacks the ability to capture temporal variability in aerosol loading. An enhanced WRF-Chem-Solar configuration replaces default prognostic aerosol number concentrations—water-friendly aerosols (QNWFA), ice-friendly aerosols (QNIFA), and black carbon aerosols (QNBCA)—with real-time values derived from GOCART mass concentrations [27]. Details of this modification are available in earlier study [27].
To investigate the impacts of online aerosol coupling on cloud microphysical processes and all-sky GHI, two experimental configurations are designed, as shown in Table 2. The first configuration, implemented within WRF-Solar, excludes chemical interactions and is designated as Aero_Aware. The second configuration, implemented within WRF-Chem-Solar, represents a fully coupled model incorporating real-time aerosol concentrations and feedback processes, designated as Aero_Couple. Both experiments are configured with identical aerosol optical properties, ensuring that any differences in simulation outcomes arise solely from variations in aerosol representation, rather than inconsistencies in parameterization. Additionally, the aer_rad_feedback = 1 setting is activated exclusively in the Aero_Couple experiment to enable aerosol–radiation–cloud feedbacks, allowing aerosols to influence both the radiation field and cloud/meteorological variables. These feedback mechanisms are absent in the Aero_Aware configuration. All other model configurations remain consistent across both experiments. Simulations cover the period from 26 February to 31 March 2021, capturing two severe pollution events over north China [44]. A 6-day spin-up period is implemented to stabilize the model’s chemical and aerosol fields from their initial conditions. Subsequently, daily reinitialization using FNL data is performed to prevent meteorological drift while maintaining the chemical equilibrium.
Table 2.
Summary of the two experiments in this study.
2.6. Validation Methods
Model performance is evaluated using four standard statistical metrics: correlation coefficient (CORR), root mean square error (RMSE), mean bias error (BIAS), and index of agreement (IOA), following the methodology in [27]. The equations are described as:
where represents the simulations results, means the observations, is the total number of observations, and are the mean values.
3. Results
Activating aerosol–cloud–radiation interactions in WRF-Chem-Solar enables real-time feedbacks between aerosols and meteorological fields. Meteorological conditions are first evaluated, with results presented in the Supplementary Materials. The Aero_Couple experiment successfully captures the spatial distribution of key meteorological fields. Meanwhile, the coupling significantly alters their vertical profiles.
3.1. The Comparison of the Aerosol Characterization
In the Aero_Aware experiment, aerosol number concentrations are not explicitly calculated. Instead, they are prescribed as fixed climatological inputs to drive activation processes. Consequently, Figure 2 presents the monthly averaged spatial distributions of vertically integrated QNWFA, QNIFA, and QNBCA rather than aerosol burdens.
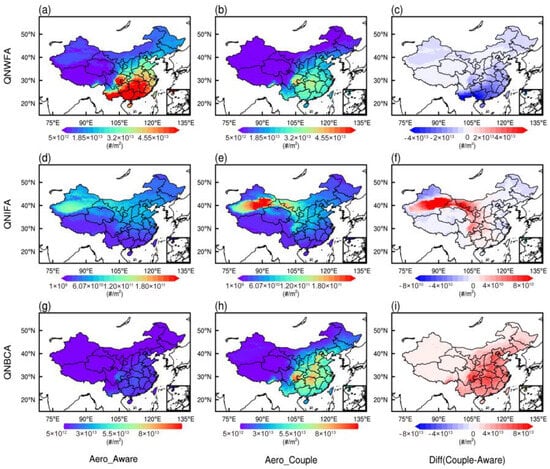
Figure 2.
Spatial distributions of the monthly mean number concentrations of vertically integrated water-friendly aerosol (QNWFA), ice-friendly aerosol (QNIFA), and black carbon aerosol (QNBCA) in the Aero_Aware (left, a,d,g), Aero_ Couple (middle, b,e,h) simulations from 4 to 31 March 2021, respectively and their differences (right, c,f,i); units: #/m2.
The implementation of online aerosol coupling in Aero_Couple leads to a substantial reduction in QNWFA across southeastern China. In the Aero_Aware experiment, a high-concentration center, exceeding 5.0 × 10¹³ m−2 (Figure 2a), drops to below 3.50 × 10¹³ m−2 in the Aero_Couple experiment (Figure 2b). This decline aligns with the significant reduction in sulfate concentrations due to continuous emission control measures implemented in China since 2013 [45,46], which contributes to the obvious reduce of QNWFA. Moreover, slightly increased precipitation along coastal areas (Figure S3a) may enhance wet scavenging processes, further contributing to reduced QNWFA in these regions. Earlier results confirm that wet scavenging during light precipitation can reduce CCN, including QNWFA, by activating aerosols into cloud droplets removed [47,48,49]. In polluted environments, a reductions of 10–20% aerosol number concentrations has been detected with light precipitation [50], which needs further study.
For QNIFA, the Aero_Aware experiment exhibits a weak concentration center over northwestern China (Figure 2d), while Aero_Couple captures a prominent dust-induced peak exceeding 3.0 × 10¹¹ m−2, demonstrating the enhanced capability of the fully coupled model to represent real-time dust activity. Additionally, widespread increases in QNBCA are evident in the Aero_Couple experiment (Figure 2h) with differences reaching up to 3.6 × 10¹³ m−2 in central China (Figure 2i). These enhancements are likely associated with increased biomass burning from open-field crop residue combustion and wildfires during the spring [51,52,53], highlighting the advantages of online coupling in capturing regional aerosol variability.
Then, the monthly mean spatial distributions of AOD in the two experiments are compared with observation from MODIS and shown in Figure 3.
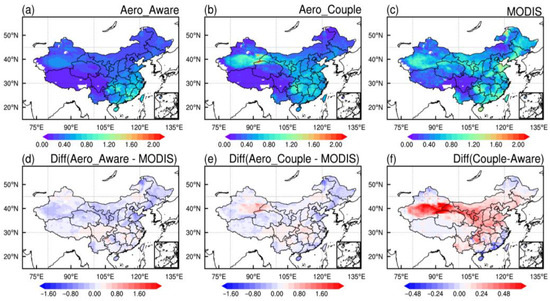
Figure 3.
Spatial distributions of the monthly mean AOD simulated in the (a) Aero_Aware, (b) Aero_Couple, and (c) MODIS as well as their differences (d–f) from 4 to 31 March 2021.
In the Aero_Aware simulation, the AOD high-value center with values exceeding 1.2 is located over southeastern China, with a secondary in southern Xinjiang (Figure 3a). By contrast, the Aero_Couple experiment captures intense dust events in northwestern China, with AOD values exceeding 1.6 (Figure 3b), closely aligning with MODIS observations (Figure 3b), and accurately reflecting the major March 2021 dust events [44,54]. These results are consistent with the QNIFA patterns shown in Figure 2. Furthermore, the dust transport pathway from northwestern China to the North China Plain (NCP) is well-represented in the Aero_Couple experiment but not resolved in the Aero_Aware experiment, indicating that more realistic aerosol representation substantially improves AOD simulations. Compared to Aero_Aware, AOD increases are observed across most regions of China, particularly from Xinjiang to east China. The difference is consistent with the distribution of planetary boundary layer height (PBLH) shown in Figure S2.
Despite the overall reduction in QNWFA over southeastern China, Aero_Couple exhibits concurrent increases in QNBCA [55]. As black carbon constitutes a major light-absorbing aerosol species, increased QNBCA contributes to higher absorbing AOD in southern regions [56]. Overall, the maximum AOD differences between the two simulations reach 0.50, underscoring the importance of including online aerosol calculations in AOD simulation. We also notice the overestimation of AOD in northwestern China compared with measurements from MODIS, which is primarily attributed to the limitation of current dust parameterizations. Similar overestimation trends during March 2021 have been reported using WRF-Chem [27,54,57]. Tuning the ratio of the 10 m wind speed from FNL reanalysis data to the simulated 10 m wind speed could help reduce friction velocity and improve AOD accuracy during dust events.
To further evaluate AOD performance across China, the simulation domain is subdivided into seven regional electricity regions based on criteria from China’s power transmission system: Western China, Northeastern China, Northern China, Central China, Eastern China, Southern China, and the Tibetan Plateau (Tibetan), separately [58]. The separation is under the consideration of geographical, climatic, and administrative boundaries, can be found in Figure 1b. Dividing China into these zones allows for region-specific analysis of model performance, showing how aerosol affect power transmission system across regions. Figure 4 illustrates time series of regionally averaged hourly AOD values across seven electricity regions, compared with AERONET and SONET observations.
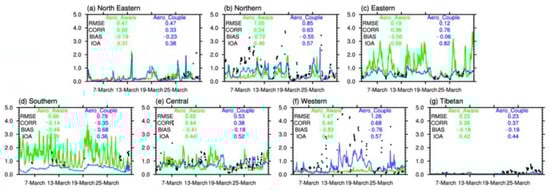
Figure 4.
Time series of the observed and simulated regional averaged hourly AOD in the Aero_Aware and Aero_Couple experiments in seven electricity: (a) Northeastern China, (b) Northern China, (c) Eastern China, (d) Southern China, (e) Central China, (f) Western China, and (g) the Tibetan Plateau) regions from 4 to 31 March 2021; the black dots represent the observations.
As shown in Figure 4, in dust-prone areas such as Northern and Western China, the Aero_Couple experiment successfully captures drastic temporal variations that are absent in the Aero_Aware results. During the first dust event, observed AOD exhibits a sharp increase in Western China, peaking around 15–16 March at approximately 4.5 to 5.0. This rapid rise clearly reflects the occurrence of a strong dust event in the western region. A similar increase appears from 25–27 March, though less intense, with a peak AOD of approximately 3.0 to 3.5. These findings indicate that incorporating online-calculated aerosols significantly improves the representation of dust events in Western China (Figure 4f), resulting in a 9.30% decrease in BIAS, 14.29% reduction in RMSE, 70.00% increase in CORR, and 29.55% improvement in IOA. Similarly, AOD in the Aero_Aware experiment fails to capture pollution events on 7–11 March and 25–27 March in Northern China, which are accurately reproduced in the Aero_Couple experiment (Figure 4b). Consequently, the CORR value improves substantially from 0.34 to 0.63, representing an 85.39% relative increase, with corresponding reductions in BIAS (23.78%) and RMSE (19.05%).
In Northeastern China, temporal AOD variations are poorly captured by the Aero_Aware experiment, but substantial improvements are observed in Aero_Couple, with CORR increasing from 0.00 to 0.33 (Figure 4a). This result may be influenced by data limitations, which requires further investigation. In Eastern China, the Aero_Couple experiment improves CORR from 0.36 to 0.76, representing a 111.11% relative increase (Figure 4c). Simultaneously, IOA increases by 41.38% while RMSE decreases by 19.05%. For Central China, the Aero_Couple experiment shows limited improvement in CORR but demonstrates advantages in reducing RMSE (18.46%) and BIAS (56.30%) while increasing IOA (18.18%) compared to the Aero_Aware experiment (Figure 4e). In the Tibetan region, although RMSE and BIAS show minimal changes, CORR increases by 42.31% (Figure 4g). Both experiments fail to capture AOD variations in Southern China, potentially due to unaccounted wildfire emissions [59]. Previous studies have emphasized the importance of wildfire emissions during spring in Southern China [60,61], which will be incorporated in future work.
Subsequently, simulated hourly AOD during 4–31 March 2021 is evaluated against all observations across China using probability density distributions, as illustrated in Figure 5. The Aero_Couple experiment effectively captures AOD temporal dynamics, with high-AOD values aligning closer to the 1:1 line. It achieves a CORR of 0.51, representing a 168.42% improvement over the Aero_Aware experiment (Figure 5b). With the revised aerosol representation scheme, a 15.56% relative increase in IOA further substantiates the enhanced performance of Aero_Couple. These findings highlight the necessity of incorporating fully-coupled aerosol–cloud–radiation processes. In contrast, the Aero_Aware experiment exhibits higher BIAS and RMSE values of −0.54 and 0.82, respectively (Figure 5a). The BIAS values are moderately reduced to −0.48 and 0.73 in the Aero_Couple simulation, consistent with regional-scale improvements.
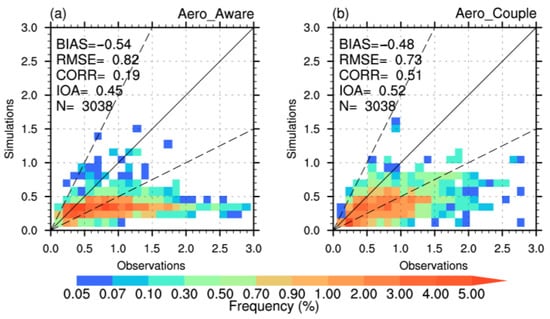
Figure 5.
Probability density distribution of the observed (from AERONET and SONET) AOD versus the simulated AOD in (a) Aero_Aware and (b) Aero_Couple experiments, calculated at hourly scale from 4 to 31 March 2021. The continuous black line is the 1:1 line, and the dashed black lines correspond to the 1:2 and 2:1 lines. N shows the number of data used.
Collectively, these results collectively highlight the critical importance of incorporating online aerosol dynamics to improve spatial and temporal accuracy in AOD simulations across diverse regions of China.
3.2. Impact of QNWFA on Cloud Microphysical Processes and Cloud Fraction
When using bulk microphysics schemes, variations in QNWFA directly influence cloud water number concentration (QNCLOUD) and mixing ratio (QCLOUD) [39]. Given the spatial differences in QNWFA between experiments, Figure 6 presents their zonal mean vertical profiles alongside QNCLOUD, QCLOUD, and cloud fraction (CLDFRA).
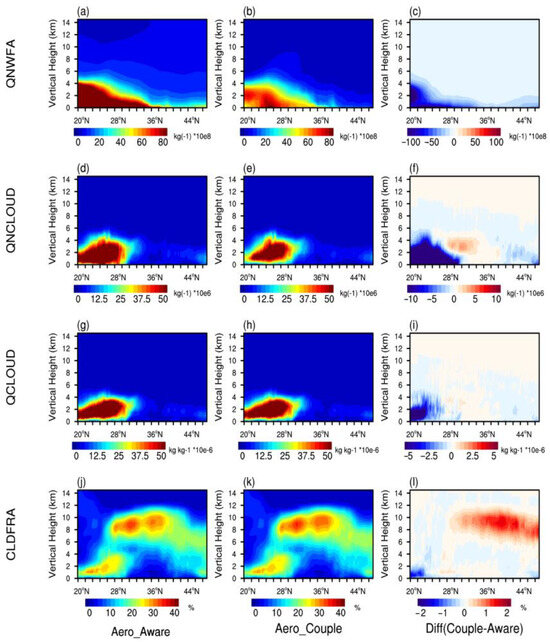
Figure 6.
Vertical profiles of (a,b) QNWFA (units: #/kg), (d,e) QNCLOUD (#/kg), (g,h) QCLOUD (kg/kg), and (j,k) CLDFRA over China from 4 to 31 March 2021. The panels (c,f,i,l) show differences between the Aero_Aware and Aero_Couple experiments. The profiles represent zonal means from the surface to 15 km. Zonal mean refers to the longitudinal average at each latitude.
As can be seen, higher aerosol emissions near the surface generally enhance QNWFA concentrations below 6 km (Figure 6a,b). Below 4 km, anthropogenic emissions contribute to elevated QNWFA values, particularly in south of 36°N. In the Aero_Couple experiment, QNWFA exhibits a narrower high-value zone, mainly constrained to below 28°N. Moreover, the observed QNWFA reduction near the surface around 20°N in coastal southern China (Figure 6b) is attributable to both reduced emissions and enhanced wet scavenging and vertical redistribution. As shown in Figure S2l, stronger upward motion near 20°N in Aero_Couple promotes aerosol lifting from surface to higher altitudes. Simultaneously, this region experiences suppressed QCLOUD (Figure 6i) and CLDFRA (Figure 6l), associated with slightly warmer temperatures (Figure S2i) and lower relative humidity (RH) (Figure S2f), collectively reducing QNCLOUD (Figure 6f). These conditions favor below-cloud scavenging, thereby contributing to reduced surface QNWFA. Compared to Aero_Aware, QNWFA values in southern China decrease significantly, especially below 25°N, with reductions exceeding 1.0 × 10¹⁰ #/kg (Figure 6c). This reduction aligns with diminished coastal emissions shown in Figure 1.
In the Thompson–Eidhammer scheme, QNCLOUD is primarily governed by CCN activation followed by Köhler theory [39]. This process responds to QNWFA, temperature (T), vertical velocity (W), fixed hygroscopicity parameters, and aerosol mean radii [39,62]. Between 20°N and 28°N, strong updrafts and moderate temperatures (Figure S2) support the high-value center of QNCLOUD exceeding 5.0 × 10⁷ #/kg (Figure 6d,e). Reduced QNWFA in Aero_Couple leads to lower QNCLOUD below 6 km, particularly in south of 28°N [63]. In southeastern China, weaker updrafts between 24°N and 28°N (Figure S2l) and higher temperatures below 26°N (Figure S2i) suppress supersaturation by elevating saturation vapor pressure [62], which collectively leads to QNCLOUD reductions exceeding 10 × 10−6 #/kg below 28°N. Conversely, stronger updrafts (Figure S2l) and lower T (Figure S2i) enhance QNCLOUD between 28°N and 36°N, especially between 2–6 km (Figure 6f).
QCLOUD, governed by the condensation–microphysics balance, correlates strongly with QNCLOUD [39]. Consequently, regions with reduced QNCLOUD exhibit diminished QCLOUD. Simultaneously, T, W, and RH similarly influence its distribution, resulting in analogous spatial patterns with pronounced reductions below 28°N. CLDFRA in the lower troposphere is sensitive to hygroscopic aerosols [64,65]. The combination of lower QNCLOUD, RH, QVAPOR, and weaker updrafts results in reduced low-level cloud cover below 4 km in coastal regions in south of 24°N (Figure 6j,k). In contrast, upper-level cloud fractions depends more on ice-nucleating aerosols and large-scale meteorological conditions [64]. Enhanced RH, QVAPOR, W, and slightly elevated T in north of 28°N promote increased high-level CLDFRA, facilitating more extensive cloud vertical development between 6–12 km.
To further investigate the aerosol impact on cloud microphysics, we examine changes in cloud effective radius (CER) and liquid water path (LWP), as shown in Figure 7. Regions in northeast China with missing SSRC data are excluded to ensure comparability. In the Aero_Couple experiment, CER increases over central China, while decreases toward the coastal regions (Figure 7c), reflecting the higher sensitivity of CER to QNCLOUD relative to QCLOUD [11]. LWP demonstrates a dipole pattern, decreasing over northern/coastal China while increasing centrally (Figure 7d,e). Enhanced condensation and elevated QNCLOUD drive LWP increases in central China, whereas suppressed cloud development under reduced CCN conditions explains decreases elsewhere.
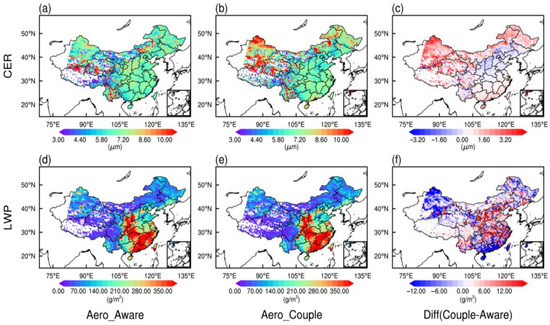
Figure 7.
Spatial distribution of the monthly averaged CER (a,b) and LWP (d,e) in Aero_Aware and Aero_Couple experiments from 4 to 31 March 2021; their differences (c,f) are also shown in the right panel.
The differences of COD in two experiments and observations from SSRC are depicted in Figure 8. While both simulations capture the observed spatial pattern of elevated COD (>40) in southeastern China (Figure 8a,b), but systematic overestimations are present. The Aero_Couple experiment significantly reduces the mean COD bias from −2.99 (Aero_Aware) to −0.15. These improvements align with Twomey effect [11], where increased CER and decreased LWP in coastal and northern China reduce COD, while opposite changes in central China enhance COD (Figure 8d). Strong COD–AOD correlations in eastern industrial regions reflect the dominance of hygroscopic aerosols. The observed aerosol-driven transition to fewer but larger cloud droplets explains both reduced COD and lower AOD, consistent with earlier findings [66,67].
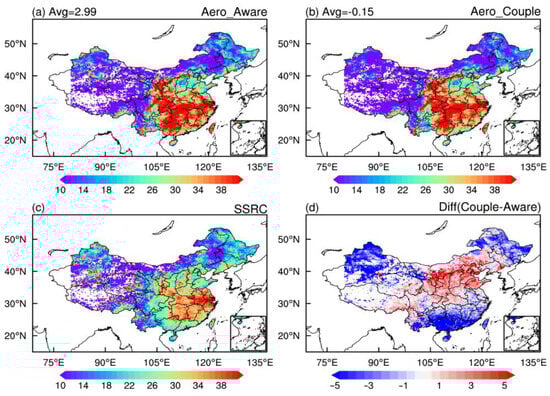
Figure 8.
Spatial distribution of the monthly averaged COD (a,b) in Aero_Aware and Aero_Couple experiments and (c) observations from SSRC from 4 to 31 March 2021; (d) their differences are also shown in the plot. All the values equal to zero have been deleted before calculation. The number in the upper left corner represents the mean value of observations minus the model simulations.
3.3. Impact of Aerosols on GHI Under All Sky Conditions
To assess the influence of aerosols on GHI simulation performance, the modeled GHI under all-sky conditions is compared with observations from SSRC, as illustrated in Figure 9.
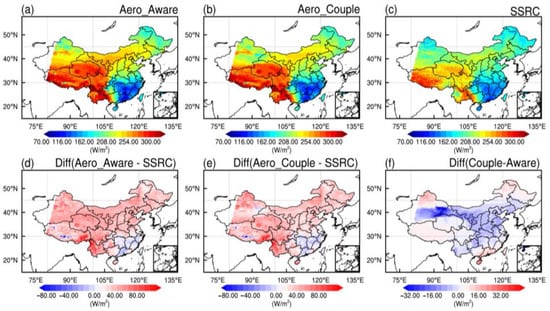
Figure 9.
Spatial distributions of the monthly mean GHI under all sky condition simulated in the (a) Aero_Aware, (b) Aero_Couple, and (c) SSRC as well as their differences (d–f) from 4 to 31 March 2021.
Both experiments successfully reproduce the general spatial characteristics of GHI under all-sky conditions, although a systematic underestimation persists throughout the domain. The Aero_Aware experiment exhibits a more pronounced positive bias in western China relative to Aero_Couple (Figure 9d,e), primarily due to inaccuracies in aerosol number concentrations and deficiencies in associated meteorological feedback. In contrast, improved aerosol representation in Aero_Couple substantially mitigates these biases, particularly in regions where aerosol–cloud interactions dominate.
The vertical distribution of clouds plays a critical role in modulating solar radiation, owing to altitude-dependent variations in cloud microphysical and optical properties [68,69]. In coastal and northern China, lower COD and reduced low-level CLDFRA in the Aero_Couple experiment decrease cloud radiative effects, resulting in higher simulated GHI (Figure 9f). Conversely, mid-latitude regions exhibit opposing behavior, where modest low-level CLDFRA increases correspond to localized reductions in GHI. Although extensive high-level cloud cover persists north of 28°N, its limited scattering efficiency minimally affects surface radiation [70,71].
We further validate simulated GHI using hourly observations from 138 CMA stations, stratified by seven major electricity regions, with results summarized in Table 3.
Table 3.
Summary statistics of the observed hourly GHI under all sky conditions with simulated ones for two experiments in seven electricity regions. The nighttime values have been removed before calculation; units: W/m2.
Compared to the Aero_Aware experiment, lower BIAS values are observed across most regions in China, accompanied by modest reductions in RMSE. Performance improvements are particularly notable in northeastern China, where all statistical metrics show enhancement, including a reduction in GHI bias from 50.11 W/m2 to 43.55 W/m2. Northern China exhibits the most significant improvements, with 24.49% and 10.36% reductions in bias and RMSE, respectively, corresponding to enhanced AOD simulations. These regions also show consistent but moderate increases in CORR and IOA, underscoring the benefit of updated aerosol parameterizations.
Central and western China exhibit similar improvements, with bias reductions of 35.03% and 25.97%, respectively. Eastern China displays more limited enhancements despite substantial AOD modifications, highlighting the complexity of aerosol–cloud–radiation interactions in this region. Southern China shows negligible improvement, largely due to persistent AOD simulation challenges, suggesting the need for further model development.
The probability density distributions in Figure 10 further give the overall performance of simulated hourly GHI under all sky across China. BIAS correct from 63.47 W/m2 to 54.26 W/m2 in the Aero_Couple experiment, reflecting a 14.51% reduction. The RMSE values also decrease from 188.10 W/m2 to 180.42 W/m2.
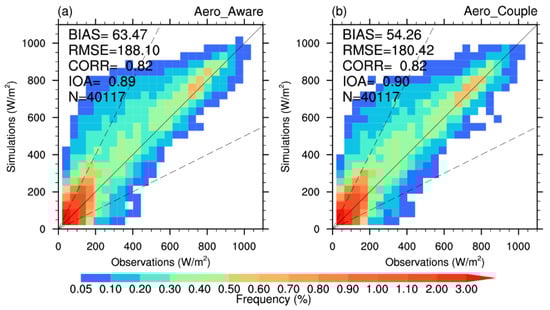
Figure 10.
Probability density distribution of the observed (ground-based GHI observations) versus the simulated GHI under all sky in the (a) Aero_Aware and (b) Aero_Couple experiments, calculated at hourly scale from 4 to 31 March 2021. The continuous black line is the 1:1 line, and the dashed black lines correspond to the 1:2 and 2:1 lines. All the nighttime values have been removed before calculation.
Overall, these results demonstrate that the Aero_Couple configuration—by incorporating online aerosol calculations and a more realistic representation of aerosol–cloud–radiation processes—achieves superior agreement with observations throughout China.
4. Discussion
These findings align with previous observational and modeling studies that highlight how aerosol–cloud interactions—through microphysical adjustments and indirect radiative effects—substantially modulate surface solar radiation [72,73,74], particularly in aerosol-laden regions such as eastern China [75].
It is worth mentioning that several limitations still persist. The model tends to underestimate GHI in southern China, potentially due to insufficient representation of wildfire emissions. Future work should consider integrating dynamic fire emission inventories to address this issue. In addition, the simplified chemical mechanism used in this study, though computationally efficient, may limit the representation of secondary aerosol formation and their interactions with clouds. However, considering the application needs of operational photovoltaic forecasting, this trade-off between accuracy and computational cost is acceptable. Furthermore, as this study is limited to a single month, expanding the analysis to seasonal or annual scales would provide a more comprehensive evaluation of the robustness and generalizability of the improvements. Future research should also focus on integrating dynamic fire and biogenic emission inventories, refining cloud activation parameterizations, and validating the model performance across different aerosol regimes and solar resource zones.
5. Conclusions
This study investigates online aerosol-cloud-radiation feedback mechanisms and their impacts on global horizontal irradiance (GHI) simulations under all-sky conditions across China. By comparing two Weather Research and Forecasting (WRF)-Solar configurations—the baseline Aero_Aware and the fully coupled Aero_Couple experiments—we demonstrate how improved aerosol representation enhances the accuracy of aerosol–cloud interaction (ACI) simulations and GHI predictions.
The Aero_Couple experiment shows substantial improvements in aerosol optical depth (AOD) simulation, with the correlation coefficient increasing from 0.19 to 0.51 (168% enhancement) against ground-based observations, accompanied by reductions in mean bias error (BIAS, 14.5%) and root mean square error (RMSE), respectively. These improvements are most evident in dust-influenced regions of northern and western China, where online aerosol calculations better capture realistic atmospheric loading.
The enhanced aerosol representation initiates a series of physical feedbacks within cloud microphysics and radiative processes. Specifically, in the Aero_Couple experiment, reduced water-friendly aerosol concentrations (QNWFA) in southeastern coastal regions lead to weaker droplet activation under elevated temperatures and reduced supersaturation, resulting in larger cloud droplet sizes (increased cloud effective radius, CER), lower liquid water path (LWP), and reduced cloud optical depth (COD). These changes are accompanied by a decline in low-level cloud fraction (CLDFRA), collectively diminishing the cloud radiative effects and enhancing surface GHI. These feedbacks are amplified by concomitant decreases in relative humidity and boundary-layer aerosols, which reduce cloud formation potential. The coupled model captures these processes by dynamically linking aerosol emissions with cloud microphysical evolution, which is absent in the uncoupled configuration.
Driven by changes in COD and CLDFRA, the all-sky GHI simulations in the Aero_Couple experiment exhibit a reduction in BIAS from 63.47 W/m2 to 54.26 W/m2, corresponding to a 14.5% improvement in accuracy compared to the baseline. Regional diagnostics further indicate that the most notable improvements occur in northern and central China, where both direct and indirect aerosol–cloud interactions are particularly strong.
These results highlight the critical role of aerosol–cloud–radiation interactions in improving the accuracy of solar irradiance simulations. The demonstrated enhancements in both AOD and GHI simulations underscore the practical value of incorporating real-time aerosol feedbacks into mesoscale numerical weather prediction models. This approach is especially beneficial in regions with heavy aerosol pollution, such as northern China, where complex aerosol–cloud processes significantly affect surface solar radiation. By capturing these interactions more realistically, the model will support informed decision-making in solar energy planning and grid integration.
Supplementary Materials
The following supporting information can be downloaded at: https://www.mdpi.com/article/10.3390/rs17162829/s1, Figure S1: Spatial distribution of the monthly averaged (b,c) T2, (f,g) RH2, and (j,k) PBLH in Aero_Aware and Aero_Couple experiments and observations from ERA5 from 4 to 31 March 2021; Figure S2: vertical profiles of (a,b) QVAPOR, (d,e) RH, (g,h) T, (j,k) and W over China in Aero_Aware and Aero_Couple experiments and their differences from 4 to 31 March 2021; Figure S3: Spatial distributions of the monthly total precipitation simulated in the (a) Aero_Aware, (b) Aero_Couple, and their differences from 4 to 31 March 2021 [76,77,78,79,80,81,82].
Author Contributions
Conceptualization, S.W. and G.H.; data curation, C.L., L.H., and R.M.; supervision, G.H.; writing—original draft, S.W.; review and editing, T.D. and X.X. All authors have read and agreed to the published version of the manuscript.
Funding
This project received support from the National Natural Science Foundation of China (Grant No. 42305202), the National Natural Science Foundation of China (Grant No. 42141019, 42261144687, 42430611, 42405145), Intelligent Perception and Control Key Laboratory of Sichuan Province (2024RYY03), National Key Research and Development Program of China (2024YFB3908701), and the Natural Science Foundation of Sichuan Province (2024NSFSC0770).
Data Availability Statement
The code of the WRF-Solar model can be downloaded from https://ral.ucar.edu/pressroom/features/wrf-solar (accessed on 12 June 2022). GHI and COD data from the Surface Downward Solar Radiation Compositions system are available from www.slrss.cn/care/sp/pc/ (accessed on 10 January 2024). The AOD of MODIS is available from https://ladsweb.modaps.eosdis.nasa.gov/archive/allData/61/MYD04_L2/ (accessed on 15 January 2024). The AOD of The Aerosol Robotic Network (AERONET) is available from https://aeronet.gsfc.nasa.gov/ (accessed on 12 January 2024). The SONET data are obtained from http://www.sonet.ac.cn (accessed on 12 January 2024). The HTAP v3 dataset is available from https://edgar.jrc.ec.europa.eu/dataset_htap_v3 (accessed on 1 September 2022).
Acknowledgments
The study is supported by the Weather Research and Forecasting Model with Chemistry (WRF-Chem) and Weather Research and Forecasting model with solar extensions (WRF-Solar). The observed data from AERONET, SONET, SSRC, MODIS, and CMA also helped to research this dust event.
Conflicts of Interest
The authors declare no conflicts of interest.
References
- Zhang, S.; Chen, W. Assessing the energy transition in China towards carbon neutrality with a probabilistic framework. Nat. Commun. 2022, 13, 87. [Google Scholar] [CrossRef]
- Duan, H.; Zhou, S.; Jiang, K.; Bertram, C.; Harmsen, M.; Kriegler, E.; van Vuuren, D.P.; Wang, S.; Fujimori, S.; Tavoni, M.; et al. Assessing China’s efforts to pursue the 1.5 °C warming limit. Science 2021, 372, 378–385. [Google Scholar] [CrossRef]
- Chadly, A.; Moawad, K.; Salah, K.; Omar, M.; Mayyas, A. State of glo bal solar energy market: Overview, China’s role, Challenges, and Opportunities. Sustain. Horiz. 2024, 11, 100108. [Google Scholar] [CrossRef]
- Gautam, S.; Elizabeth, J.; Gautam, A.S.; Singh, K.; Abhilash, P. Impact Assessment of Aerosol Optical Depth on Rainfall in Indian Rural Areas. Aerosol Sci. Eng. 2022, 6, 186–196. [Google Scholar] [CrossRef]
- Boucher, O.; Randall, D.; Artaxo, P.; Bretherton, C.; Feingold, G.; Forster, P.; Kerminen, V.-M.; Kondo, Y.; Liao, H.; Lohmann, U.; et al. Clouds and aerosols. In Climate Change 2013: The Physical Science Basis. Contribution of Working Group I to the Fifth Assessment Report of the Intergovernmental Panel on Climate Change; Stocker, T.F., Qin, D., Plattner, G.-K., Tignor, M., Allen, S.K., Doschung, J., Nauels, A., Xia, Y., Bex, V., Midgley, P.M., Eds.; Cambridge University Press: Cambridge, UK, 2013; pp. 571–657. [Google Scholar]
- Forster, P.; Storelvmo, T.; Armour, K.; Collins, W.; Dufresne, J.-L.; Frame, D.; Lunt, D.J.; Mauritsen, T.; Palmer, M.D.; Watanabe, M.; et al. The Earth’s Energy Budget, Climate Feedbacks, and Climate Sensitivity. In Climate Change 2021: The Physical Science Basis. Contribution of Working Group I to the Sixth Assessment Report of the Intergovernmental Panel on Climate Change; Cambridge University Press: Cambridge, UK, 2021; pp. 923–1054. [Google Scholar] [CrossRef]
- Szopa, S.; Naik, V.; Adhikary, B.; Artaxo, P.; Berntsen, T.; Collins, W.D.; Fuzzi, S.; Gallardo, L.; Kiendler-Scharr, A.; Klimont, Z.; et al. Short-Lived Climate Forcers. In Climate Change 2021: The Physical Science Basis. Contribution of Working Group I to the Sixth Assessment Report of the Intergovernmental Panel on Climate Change; Cambridge University Press: Cambridge, UK, 2021; pp. 817–922. [Google Scholar] [CrossRef]
- Douglas, A.; L’Ecuyer, T. Quantifying cloud adjustments and the radiative forcing due to aerosol–cloud interactions in satellite observations of warm marine clouds. Atmos. Chem. Phys. 2020, 20, 6225–6241. [Google Scholar] [CrossRef]
- Albrecht, B. Aerosols, cloud microphysics, and fractional cloudiness. Science 1989, 245, 1227–1230. [Google Scholar] [CrossRef]
- Ming, Y.; Ramaswamy, V. Nonlinear Climate and Hydrological Responses to Aerosol Effects. J. Clim. 2009, 22, 1329–1339. [Google Scholar] [CrossRef]
- Twomey, S. Influence of pollution on shortwave albedo of clouds. J. Atmos. Sci. 1977, 34, 1149–1152. [Google Scholar] [CrossRef]
- Haslett, S.L.; Taylor, J.W.; Deetz, K.; Vogel, B.; Babić, K.; Kalthoff, N.; Wieser, A.; Dione, C.; Lohou, F.; Brito, J.; et al. The radiative impact of out-of-cloud aerosol hygroscopic growth during the summer monsoon in southern West Africa. Atmos. Chem. Phys. 2019, 19, 1505–1520. [Google Scholar] [CrossRef]
- Li, L.; Li, M.; Fan, X.; Chen, Y.; Lin, Z.; Hou, A.; Zhang, S.; Zheng, R.; Chen, J. Measurement report: The variation properties of aerosol hygroscopic growth related to chemical composition during new particle formation days in a coastal city of Southeast China. Atmos. Chem. Phys. 2025, 25, 3669–3685. [Google Scholar] [CrossRef]
- Seinfeld, J.H.; Pandis, S.N.; Noone, K. Atmospheric Chemistry and Physics: From Air Pollution to Climate Change. Phys. Today 1998, 51, 88–90. [Google Scholar] [CrossRef]
- Briant, R.; Tuccella, P.; Deroubaix, A.; Khvorostyanov, D.; Menut, L.; Mailler, S.; Turquety, S. Aerosol-radiation interaction modelling using online coupling between the WRF 3.7.1 meteorological model and the CHIMERE 2016 chemistry-transport model, through the OASIS3-MCT coupler. Geosci. Model Dev. 2017, 10, 927–944. [Google Scholar] [CrossRef]
- Feng, J.; Zhao, C.; Du, Q.; Yang, Z.; Jin, C. Amending the algorithm of aerosol–radiation interactions in WRF-Chem (v4.4). Geosci. Model Dev. 2025, 18, 585–603. [Google Scholar] [CrossRef]
- Wen, W.; Hua, T.; Liu, L.; Ma, X.; Tharaka, W.; Xing, Y.; Deng, Z.; Shen, L. Assessment of the Impact of Aerosol Radiation Interaction on “Pollution Reduction and Carbon Reduction Synergy” by Wrf-Chem-Solar; Elsevier: Amsterdam, The Netherlands, 2024. [Google Scholar] [CrossRef]
- Gao, J.; Huang, Y.; Peng, Y.; Wright, J.S. Aerosol Effects on Clear-Sky Shortwave Heating in the Asian Monsoon Tropopause Layer. J. Geophys. Res. Atmos. 2023, 128, e2022JD036956. [Google Scholar] [CrossRef]
- Bellouin, N.; Quaas, J.; Gryspeerdt, E.; Kinne, S.; Stier, P.; Watson-Parris, D.; Boucher, O.; Carslaw, K.S.; Christensen, M.; Daniau, A.-L.; et al. Bounding Global Aerosol Radiative Forcing of Climate Change. Rev. Geophys. 2020, 58, e2019RG000660. [Google Scholar] [CrossRef]
- Stevens, B.; Feingold, G. Untangling aerosol effects on clouds and precipitation in a buffered system. Nature 2009, 461, 607–613. [Google Scholar] [CrossRef]
- Ruiz, J.J.; Pulido, M.; Miyoshi, T. Estimating Model Parameters with Ensemble-Based Data Assimilation: Parameter Covariance Treatment. J. Meteorol. Soc. Japan. Ser. II 2013, 91, 453–469. [Google Scholar] [CrossRef]
- Wang, S.; Dai, T.; Li, C.; Cheng, Y.; Huang, G.; Shi, G. Improving Clear-Sky Solar Power Prediction over China by Assimilating Himawari-8 Aerosol Optical Depth with WRF-Chem-Solar. Remote Sens. 2022, 14, 4990. [Google Scholar] [CrossRef]
- Zhong, X.; Ruiz-Arias, J.A.; Kleissl, J. Dissecting surface clear sky irradiance bias in numerical weather prediction: Application and corrections to the New Goddard Shortwave Scheme. Sol. Energy 2016, 132, 103–113. [Google Scholar] [CrossRef]
- Jimenez, P.A.; Hacker, J.P.; Dudhia, J.; Haupt, S.E.; Ruiz-Arias, J.A.; Gueymard, C.A.; Thompson, G.; Eidhammer, T.; Deng, A. WRF-Solar: Description and Clear-Sky Assessment of an Augmented NWP Model for Solar Power Prediction. Bull. Am. Meteorol. Soc. 2016, 97, 1249–1264. [Google Scholar] [CrossRef]
- Rosenfeld, D.; Andreae, M.; Asmi, A.; Chin, M.; de Leeuw, G.; Donovan, D.; Kahn, R.; Kinne, S.; Kivekas, N.; Kulmala, M.; et al. Global observations of aerosol-cloud-precipitation-climate interactions. Rev. Geophys. 2014, 52, 750–808. [Google Scholar] [CrossRef]
- Grell, G.A.; Peckham, S.E.; Schmitz, R.; McKeen, S.A.; Frost, G.; Skamarock, W.C.; Eder, B. Fully coupled “online” chemistry within the WRF model. Atmos. Environ. 2005, 39, 6957–6975. [Google Scholar] [CrossRef]
- Wang, S.; Huang, G.; Dai, T.; Cao, J.; Husi, L.; Ma, R.; Li, C. Investigating the role of aerosol wet scavenging on global horizontal irradiance simulation in the WRF-Chem-solar model. Appl. Energy 2025, 396, 126062. [Google Scholar] [CrossRef]
- Holben, B.N.; Eck, T.F.; Slutsker, I.; Tanré, D.; Buis, J.P.; Setzer, A.; Vermote, E.; Reagan, J.A.; Kaufman, Y.J.; Nakajima, T.; et al. AERONET—A Federated Instrument Network and Data Archive for Aerosol Characterization. Remote Sens. Environ. 1998, 66, 1–16. [Google Scholar] [CrossRef]
- Sinyuk, A.; Holben, B.N.; Eck, T.F.; Giles, D.M.; Slutsker, I.; Korkin, S.; Schafer, J.S.; Smirnov, A.; Sorokin, M.; Lyapustin, A. The AERONET Version 3 aerosol retrieval algorithm, associated uncertainties and comparisons to Version 2. Atmos. Meas. Tech. 2020, 13, 3375–3411. [Google Scholar] [CrossRef]
- Li, Z.Q.; Xu, H.; Li, K.T.; Li, D.H.; Xie, Y.S.; Li, L.; Zhang, Y.; Gu, X.F.; Zhao, W.; Tian, Q.J.; et al. Comprehensive Study of Optical, Physical, Chemical, and Radiative Properties of Total Columnar Atmospheric Aerosols over China: An Overview of Sun–Sky Radiometer Observation Network (SONET) Measurements. Bull. Am. Meteorol. Soc. 2018, 99, 739–755. [Google Scholar] [CrossRef]
- Levy, R.C.; Hsu, N.C.; Eck, T.F.; Smirnov, A.; Goloub, P.; Holben, B.N.; Dubovik, O.; O’Neill, N.T.; Tanré, D.; Slutsker, I.; et al. MODIS Atmosphere L2 Aerosol Product. In NASA MODIS Adaptive Processing System; Goddard Space Flight Center: Greenbelt, MD, USA, 2015. [Google Scholar] [CrossRef]
- Hsu, N.C.; Tsay, S.-C.; King, M.D.; Herman, J.R. Herman Deep Blue Retrievals of Asian Aerosol Properties During ACE-Asia. IEEE Trans. Geosci. Remote Sens. 2006, 44, 3180–3195. [Google Scholar] [CrossRef]
- Kaufman, Y.J.; Tanré, D.; Remer, L.A.; Vermote, E.F.; Chu, A.; Holben, B.N. Operational remote sensing of tropospheric aerosol over land from EOS moderate resolution imaging spectroradiometer. J. Geophys. Res. Atmos. 1997, 102, 17051–17067. [Google Scholar] [CrossRef]
- Letu, H.; Ma, R.; Nakajima, T.Y.; Shi, C.; Hashimoto, M.; Nagao, T.M.; Baran, A.J.; Nakajima, T.; Xu, J.; Wang, T.; et al. Surface Solar Radiation Compositions Observed from Himawari-8/9 and Fengyun-4 Series. Bull. Am. Meteorol. Soc. 2023, 104, E1772–E1789. [Google Scholar] [CrossRef]
- Yang, S.; Wang, X.L.; Wild, M. Causes of Dimming and Brightening in China Inferred from Homogenized Daily Clear-Sky and All-Sky in situ Surface Solar Radiation Records (1958–2016). J. Clim. 2019, 32, 5901–5913. [Google Scholar] [CrossRef]
- Yang, S.; Wang, X.L.; Wild, M. Homogenization and Trend Analysis of the 1958–2016 In Situ Surface Solar Radiation Records in China. J. Clim. 2018, 31, 4529–4541. [Google Scholar] [CrossRef]
- Crippa, M.; Guizzardi, D.; Butler, T.; Keating, T.; Wu, R.; Kaminski, J.; Kuenen, J.; Kurokawa, J.; Chatani, S.; Morikawa, T.; et al. The HTAP_v3 emission mosaic: Merging regional and global monthly emissions (2000–2018) to support air quality modelling and policies. Earth Syst. Sci. Data 2023, 15, 2667–2694. [Google Scholar] [CrossRef]
- Tegen, I.; Hollrig, P.; Chin, M.; Fung, I.; Jacob, D.; Penner, J. Contribution of different aerosol species to the global aerosol extinction optical thickness: Estimates from model results. J. Geophys. Res.-Atmos. 1997, 102, 23895–23915. [Google Scholar] [CrossRef]
- Thompson, G.; Eidhammer, T. A Study of Aerosol Impacts on Clouds and Precipitation Development in a Large Winter Cyclone. J. Atmos. Sci. 2014, 71, 3636–3658. [Google Scholar] [CrossRef]
- Schaake, J.C.; Koren, V.I.; Duan, Q.-Y.; Mitchell, K.; Chen, F. Simple water balance model for estimating runoff at different spatial and temporal scales. J. Geophys. Res. Atmos. 1996, 101, 7461–7475. [Google Scholar] [CrossRef]
- Grell, G.A.; Freitas, S.R. A scale and aerosol aware stochastic convective parameterization for weather and air quality modeling. Atmos. Chem. Phys. 2014, 14, 5233–5250. [Google Scholar] [CrossRef]
- Nakanishi, M.; Niino, H. An Improved Mellor–Yamada Level-3 Model: Its Numerical Stability and Application to a Regional Prediction of Advection Fog. Bound.-Layer Meteorol. 2006, 119, 397–407. [Google Scholar] [CrossRef]
- LeGrand, S.L.; Polashenski, C.; Letcher, T.W.; Creighton, G.A.; Peckham, S.E.; Cetola, J.D. The AFWA dust emission scheme for the GOCART aerosol model in WRF-Chem v3.8.1. Geosci. Model Dev. 2019, 12, 131–166. [Google Scholar] [CrossRef]
- Sun, X.; Fan, X.; Zhang, T.; Wang, Y.; Wang, Y.; Lyu, D.; Zheng, M. Tempo-Spatial Distributions and Transport Characteristics of Two Dust Events over Northern China in March 2021. Remote Sens. 2022, 14, 5967. [Google Scholar] [CrossRef]
- Gao, Y.; Zhang, M.; Guo, J.; Xu, L. Impact of the oxidation of SO2 by NO2 on regional sulfate concentrations over the North China Plain. Atmos. Pollut. Res. 2022, 13, 101337. [Google Scholar] [CrossRef]
- Meng, F.; Zhang, Y.; Kang, J.; Heal, M.R.; Reis, S.; Wang, M.; Liu, L.; Wang, K.; Yu, S.; Li, P.; et al. Trends in secondary inorganic aerosol pollution in China and its responses to emission controls of precursors in wintertime. Atmos. Chem. Phys. 2022, 22, 6291–6308. [Google Scholar] [CrossRef]
- Tao, W.-K.; Chen, J.-P.; Li, Z.; Wang, C.; Zhang, C. Impact of aerosols on convective clouds and precipitation. Rev. Geophys. 2012, 50. [Google Scholar] [CrossRef]
- Fan, J.; Wang, Y.; Rosenfeld, D.; Liu, X. Review of Aerosol–Cloud Interactions: Mechanisms, Significance, and Challenges. J. Atmos. Sci. 2016, 73, 4221–4252. [Google Scholar] [CrossRef]
- Xia, W.; Wang, Y.; Zhang, G.J.; Wang, B. Light Precipitation rather than Total Precipitation Determines Aerosol Wet Removal. Environ. Sci. Technol. 2024, 58, 19222–19230. [Google Scholar] [CrossRef]
- Alizadeh-Choobari, O. Impact of aerosol number concentration on precipitation under different precipitation rates. Meteorol. Appl. 2018, 25, 596–605. [Google Scholar] [CrossRef]
- Liu, Y.; Zhao, H.; Zhao, G.; Zhang, X.; Xiu, A. Carbonaceous gas and aerosol emissions from biomass burning in China from 2012 to 2021. J. Clean. Prod. 2022, 362, 132199. [Google Scholar] [CrossRef]
- Tiwari, P.; Cohen, J.B.; Lu, L.; Wang, S.; Li, X.; Guan, L.; Liu, Z.; Li, Z.; Qin, K. Multi-platform observations and constraints reveal overlooked urban sources of black carbon in Xuzhou and Dhaka. Commun. Earth Environ. 2025, 6, 38. [Google Scholar] [CrossRef]
- He, C.; Niu, X.; Ye, Z.; Wu, Q.; Liu, L.; Zhao, Y.; Ni, J.; Li, B.; Jin, J. Black carbon pollution in China from 2001 to 2019: Patterns, trends, and drivers. Environ. Pollut. 2023, 324, 121381. [Google Scholar] [CrossRef]
- Tang, W.; Dai, T.; Cheng, Y.; Wang, S.; Liu, Y. A Study of a Severe Spring Dust Event in 2021 over East Asia with WRF-Chem and Multiple Platforms of Observations. Remote Sens. 2022, 14, 3795. [Google Scholar] [CrossRef]
- Hansen, A.D.A.; Rosen, H.; Novakov, T. The aethalometer—An instrument for the real-time measurement of optical absorption by aerosol particles. Sci. Total Environ. 1984, 36, 191–196. [Google Scholar] [CrossRef]
- Dehkhoda, N.; Sim, J.; Joo, S.; Shin, S.; Noh, Y. Retrieval of Black Carbon Absorption Aerosol Optical Depth from AERONET Observations over the World during 2000–2018. Remote Sens. 2022, 14, 1510. [Google Scholar] [CrossRef]
- Kim, K.-M.; Kim, S.-W.; Choi, M.; Kim, M.; Kim, J.; Shin, I.; Kim, J.; Chung, C.-Y.; Yeo, H.; Kim, S.-W.; et al. Modeling Asian Dust Storms Using WRF-Chem During the DRAGON-Asia Field Campaign in April 2012. J. Geophys. Res. Atmos. 2021, 126, e2021JD034793. [Google Scholar] [CrossRef]
- Li, X.; Wagner, F.; Peng, W.; Yang, J.; Mauzerall, D.L. Reduction of solar photovoltaic resources due to air pollution in China. Proc. Natl. Acad. Sci. USA 2017, 114, 11867–11872. [Google Scholar] [CrossRef] [PubMed]
- Saide, P.E.; Thompson, G.; Eidhammer, T.; da Silva, A.M.; Pierce, R.B.; Carmichael, G.R. Assessment of biomass burning smoke influence on environmental conditions for multiyear tornado outbreaks by combining aerosol-aware microphysics and fire emission constraints. J. Geophys. Res. Atmos. 2016, 121, 10–294. [Google Scholar] [CrossRef]
- Cheng, Y.; Dai, T.; Zhang, H.; Xin, J.; Chen, S.; Shi, G.; Nakajima, T. Comparison and evaluation of the simulated annual aerosol characteristics over China with two global aerosol models. Sci. Total Environ. 2021, 763, 143003. [Google Scholar] [CrossRef]
- Jose, R.S.; Pérez, J.L.; González, R.M.; Pecci, J.; Palacios, M. Improving air quality modelling systems by using on-line wild land fire forecasting tools coupled into WRF/Chem simulations over Europe. Urban Clim. 2017, 22, 2–18. [Google Scholar] [CrossRef]
- Petters, M.D.; Kreidenweis, S.M. A single parameter representation of hygroscopic growth and cloud condensation nucleus activity. Atmos. Chem. Phys. 2007, 7, 1961–1971. [Google Scholar] [CrossRef]
- MacDonald, A.B.; Hossein Mardi, A.; Dadashazar, H.; Azadi Aghdam, M.; Crosbie, E.; Jonsson, H.H.; Flagan, R.C.; Seinfeld, J.H.; Sorooshian, A. On the relationship between cloud water composition and cloud droplet number concentration. Atmos. Chem. Phys. 2020, 20, 7645–7665. [Google Scholar] [CrossRef]
- Xu, J.; Liu, D.; Wang, Z.; Wu, D.; Yu, S.; Wang, Y. A Study of the Characteristics of Vertical Cloud Base Height Distribution over Eastern China. Atmosphere 2019, 10, 307. [Google Scholar] [CrossRef]
- Virtanen, A.; Joutsensaari, J.; Kokkola, H.; Partridge, D.G.; Blichner, S.; Seland, Ø.; Holopainen, E.; Tovazzi, E.; Lipponen, A.; Mikkonen, S.; et al. High sensitivity of cloud formation to aerosol changes. Nat. Geosci. 2025, 18, 289–295. [Google Scholar] [CrossRef]
- Peng, C.; Wang, Y.; Wu, Z.; Chen, L.; Huang, R.-J.; Wang, W.; Wang, Z.; Hu, W.; Zhang, G.; Ge, M.; et al. Tropospheric aerosol hygroscopicity in China. Atmos. Chem. Phys. 2020, 20, 13877–13903. [Google Scholar] [CrossRef]
- Schwartz, S.E.; Harshvardhan; Benkovitz, C.M. Influence of anthropogenic aerosol on cloud optical depth and albedo shown by satellite measurements and chemical transport modeling. Proc. Natl. Acad. Sci. USA 2002, 99, 1784–1789. [Google Scholar] [CrossRef]
- Yang, J.; Yi, B.; Wang, S.; Liu, Y.; Li, Y. Diverse cloud and aerosol impacts on solar photovoltaic potential in southern China and northern India. Sci. Rep. 2022, 12, 19671. [Google Scholar] [CrossRef]
- Tzoumanikas, P.; Nikitidou, E.; Bais, A.F.; Kazantzidis, A. The effect of clouds on surface solar irradiance, based on data from an all-sky imaging system. Renew. Energy 2016, 95, 314–322. [Google Scholar] [CrossRef]
- Papachristopoulou, K.; Fountoulakis, I.; Bais, A.F.; Psiloglou, B.E.; Papadimitriou, N.; Raptis, I.-P.; Kazantzidis, A.; Kontoes, C.; Hatzaki, M.; Kazadzis, S. Effects of clouds and aerosols on downwelling surface solar irradiance nowcasting and short-term forecasting. Atmos. Meas. Tech. 2024, 17, 1851–1877. [Google Scholar] [CrossRef]
- Wang, W.; Zhang, T.; Pan, Z. Four-year ground-based observations of the aerosol effects on cloud base height in Wuhan, China. Atmos. Pollut. Res. 2019, 10, 1531–1535. [Google Scholar] [CrossRef]
- Gao, D.; Zhao, B.; Wang, S.; Wang, Y.; Gaudet, B.; Zhu, Y.; Wang, X.; Shen, J.; Li, S.; He, Y.; et al. Increased importance of aerosol–cloud interactions for surface PM2.5 pollution relative to aerosol–radiation interactions in China with the anthropogenic emission reductions. Atmos. Chem. Phys. 2023, 23, 14359–14373. [Google Scholar] [CrossRef]
- Bei, N.; Xiao, B.; Wang, R.; Yang, Y.; Liu, L.; Han, Y.; Li, G. Impacts of aerosol-radiation and aerosol-cloud interactions on a short-term heavy rainfall event—A case study in the Guanzhong Basin, China. EGUsphere 2025, 1–29. [Google Scholar] [CrossRef]
- Jerez, S.; Palacios-Peña, L.; Gutiérrez, C.; Jiménez-Guerrero, P.; López-Romero, J.M.; Pravia-Sarabia, E.; Montávez, J.P. Sensitivity of surface solar radiation to aerosol–radiation and aerosol–cloud interactions over Europe in WRFv3.6.1 climatic runs with fully interactive aerosols. Geosci. Model Dev. 2021, 14, 1533–1551. [Google Scholar] [CrossRef]
- Song, Y.; Chen, G.; Wang, W.-C. Aerosol Direct Radiative and Cloud Adjustment Effects on Surface Climate over Eastern China: Analyses of WRF Model Simulations. J. Clim. 2019, 32, 1293–1306. [Google Scholar] [CrossRef]
- Alduchov, O.A.; Eskridge, R.E. Improved Magnus Form Approximation of Saturation Vapor Pressure. J. Appl. Meteorol. 1996, 601–609. [Google Scholar] [CrossRef]
- He, J.; Chen, D.; Gu, Y.; Jia, H.; Zhong, K.; Kang, Y. Evaluation of Planetary Boundary Layer Schemes in WRF Model for Simulating Sea-Land Breeze in Shanghai, China. Atmos. Res. 2022, 278, 106337. [Google Scholar] [CrossRef]
- Trenberth, K.E.; Dai, A.; Rasmussen, R.M.; Parsons, D.B. The Changing Character of Precipitation. Bull. Am. Meteorol. Soc. 2003, 84, 1205–1218. [Google Scholar] [CrossRef]
- Gao, C.; Xiu, A.; Zhang, X.; Tong, Q.; Zhao, H.; Zhang, S.; Yang, G.; Zhang, M. Two-Way Coupled Meteorology and Air Quality Models in Asia: A Systematic Review and Meta-Analysis of Impacts of Aerosol Feedbacks on Meteorology and Air Quality. Atmos. Chem. Phys. 2022, 22, 5265–5329. [Google Scholar] [CrossRef]
- Saide, P.E.; Spak, S.N.; Carmichael, G.R.; Mena-Carrasco, M.A.; Yang, Q.; Howell, S.; Leon, D.C.; Snider, J.R.; Bandy, A.R.; Collett, J.L.; et al. Evaluating WRF-Chem Aerosol Indirect Effects in Southeast Pacific Marine Stratocumulus during VOCALS-REx. Atmos. Chem. Phys. 2012, 12, 3045–3064. [Google Scholar] [CrossRef]
- Poliukhov, A.A.; Chubarova, N.Y.; Volodin, E.M. Impact of Inclusion of the Indirect Effects of Sulfate Aerosol on Radiation and Cloudiness in the INMCM Model. Izv. Atmos. Ocean. Phys. 2022, 58, 486–493. [Google Scholar] [CrossRef]
- Wen, W.; Hua, T.; Liu, L.; Ma, X.; Tharaka, W.A.N.D.; Xing, Y.; Deng, Z.; Shen, L. Assessing Aerosol-Radiation Interaction with WRF-Chem-Solar: Case Study on the Impact of the “Pollution Reduction and Carbon Reduction Synergy” Policy. Atmos. Res. 2024, 308, 107537. [Google Scholar] [CrossRef]


Disclaimer/Publisher’s Note: The statements, opinions and data contained in all publications are solely those of the individual author(s) and contributor(s) and not of MDPI and/or the editor(s). MDPI and/or the editor(s) disclaim responsibility for any injury to people or property resulting from any ideas, methods, instructions or products referred to in the content. |
© 2025 by the authors. Licensee MDPI, Basel, Switzerland. This article is an open access article distributed under the terms and conditions of the Creative Commons Attribution (CC BY) license (https://creativecommons.org/licenses/by/4.0/).