Article

A Study on the Coastline Extraction and Coastal Change Analysis Using Sentinel-2 Imagery in Funafuti, Tuvalu

by
Sree Juwel Kumar Chowdhury
1,2 and
Chan-Su Yang
1,2,3,*
1
Sea Power Reinforcement and Security Research Department, Korea Institute of Ocean Science & Technology, Busan 49111, Republic of Korea
2
Department of Convergence Study on the Ocean Science and Technology, Ocean Science and Technology School, National Korea Maritime & Ocean University, Busan 49111, Republic of Korea
3
Marine Technology and Convergence Engineering, University of Science & Technology, Daejeon 34111, Republic of Korea
*
Author to whom correspondence should be addressed.
Remote Sens. 2025, 17(16), 2794; https://doi.org/10.3390/rs17162794
Submission received: 27 May 2025 / Revised: 25 July 2025 / Accepted: 3 August 2025 / Published: 12 August 2025
(This article belongs to the Special Issue Application of Remote Sensing in Coastline Monitoring)

Abstract

Temporal alterations in coastlines depict the significant changes in coastal areas, driven by both natural processes and human activities. For island nations, monitoring of the coastline is essential due to their vulnerability to such impacts. In this study, Funafuti Atoll, an archipelago of small and scattered islands around the capital of Tuvalu, is selected as the study region, and the aim is to extract coastlines of different islands and investigate coastal area changes between 2019 and 2023 using Sentinel-2 imagery. A simple linear iterative clustering-based superpixel segmentation and adaptive thresholding approach is employed for coastline extraction. Initially, superpixel segmentation is conducted to cluster 3-band image pixels into coherent regions, excluding the sea area. Subsequently, the normalized difference vegetation index (NDVI) is calculated, and the superpixels are used to obtain corresponding NDVI regions, on which adaptive Gaussian thresholding is applied to extract coastlines. Finally, the areas enclosed by the extracted coastline boundaries are utilized for change analysis. The results indicate that islands along the western rim of Funafuti exhibited significant alteration (an average decrease of −14.48%), whereas those along the eastern rim remained relatively stable due to the presence of coral rubble ridges and steep slopes. The change analysis revealed that from 2019 to 2020, approximately 15.1 hectares (ha) were eroded, resulting in a net area change rate of −4.14%. Between 2020 and 2021, erosion increased to 20.2 ha, yielding a net change of −7.75%. From 2021 to 2022, 13.2 ha were eroded, corresponding to a −1.74% change. From 2022 to 2023, a net gain of 10.3 ha occurred (+0.25%), primarily due to land reclamation along the lagoon-facing coast of Fongafale Island. Overall, all islands showed a decreasing area trend between 2019 and 2023, with an average net change of −12.97%. The coastal changes occurred along the sand-dominated coast with gentle slopes, possibly driven by the impact of tropical cyclones, prolonged swells, and coastal flooding, which act as the primary driving forces for the study region.

1. Introduction

The coastal zone is among the most densely populated and developed regions globally, with over half of the world’s population residing within 100 km of the coastline [1,2], and approximately a quarter of global economic production occurring within this area [3]. However, coastal regions are highly susceptible to natural processes such as erosion, accretion, sea level rise, and cyclones, as well as anthropogenic pressures. Consequently, frequent monitoring and analysis of changes in coastal regions are essential for sustainable coastal zone management. Coastlines are typically conceptualized as the continually evolving boundary between land and water [4]. Extracting coastlines is a fundamental step for analyzing spatial and temporal changes in coastal morphology [5,6], and therefore, different coastline indicators have been widely used by researchers [7]. According to [7], coastline indicators are generally classified into two main categories: those based on clearly visible features—such as the instantaneous waterline or the vegetation line—and those by where the coastal profile meets a particular elevation reference, like the 0 m contour above mean sea level. Most widely utilized approaches characterize the land–water boundary as the representation of the coastline [5].
The most widely employed methods to extract coastline include traditional field surveys [8,9,10], aerial photography [5], and remote sensing techniques [11]. Field surveys offer highly precise data on coastlines. However, they are labor-intensive, time-consuming, and limited to capturing large-scale or rapidly changing coastlines [5,11]. Aerial photography provides detailed spatial coverage of coastal areas [4]; however, it often lacks sufficient temporal resolution due to limited acquisition frequency [7]. To overcome these constraints, remote sensing has emerged as a robust alternative, driven by the increasing availability of satellite imagery, advancements in satellite sensor resolution (spatial, temporal, and radiometric), and the development of geographic data analysis tools such as Geographic Information Systems (GIS) and advanced image processing techniques [11].
As satellite sensors continue to advance, methods for extracting coastline using multi-source remote sensing data have become increasingly diverse and advanced. A wide range of satellite datasets—such as Landsat, Sentinel-2, PlanetScope, and WorldView-2—have been extensively utilized for coastline extraction and change detection studies [2]. Numerous image processing techniques have been developed to support coastline-related studies, including simple segmentation and single-band thresholding approaches [12,13], as well as more complex methods such as segmentation based on local spectral histograms and level set algorithms based on active contours [14,15,16]. Additional approaches include the use of water indices [17,18], machine learning and classification techniques—such as neural networks, isodata, and support vector machines [19,20]— band ratio methods [5], high waterline visual interpretation [21,22], and edge detection algorithms. Some of these approaches comprise manual delineation [14], while others support automated processing of images, which is often advantageous for eliminating water pixels through classifying surface water and monitoring applications [23].
Chen et al. [24] utilized Landsat MSS and TM multispectral imagery to automatically classify dry land, water, and urban regions, as well as to monitor changes along Lingding Bay, employing a hybrid image processing approach validated through visual inspection and the maximum likelihood algorithm. Ekercin [25] conducted a long-term analysis along the Aegean coast using Landsat MSS, TM, and ETM+ images, where temporal difference and ratio-derived images were used to extract coastline, and ISODATA classification was employed to analyze spatiotemporal changes. Similarly, Wang et al. [26] extracted shorelines along Ningbo City using Landsat images by employing water indices and Otsu thresholding, and the spatiotemporal changes from 1976 to 2015 were analyzed. Saleem and Awange [3] conducted image preprocessing (dark object subtraction, co-registration, and enhancement) on Sentinel-2 imagery and manually digitized the coastline with high positional accuracy to assess coastline shifts. Vos et al. [27] employed supervised classification and sub-pixel border segmentation on Landsat 5, 7, 8, and Sentinel-2 images to extract the coastline, and the positional accuracy of the extracted line was improved by incorporating the tidal correction. Abdelhady et al. [28] proposed a new water index to enhance the land–water contrast, and the wet/dry line was delineated through adaptive thresholding from multiple images, including PlanetScope, RapidEye, Sentinel-2, and Landsat 8. Bishop-Taylor et al. [29] proposed an approach to extract instantaneous waterlines from Landsat imagery by integrating a sub-pixel resolution technique with a tide-modeling framework that adjusts individual satellite observations to a consistent tidal datum [29]. Bergsma et al. [30] proposed a purpose-built multispectral index tailored for Sentinel-2 imagery, which enhanced the sub-pixel waterline extraction through a refined Otsu thresholding method. Most of these methods have demonstrated reliable performance in extracting coastlines of continental regions and large islands, particularly along sandy beaches [24,27,29]; however, extracting coastlines in areas with different morphological features, such as atolls, remains a significant challenge [30]. Atolls typically consist of several distinct, small, and spatially scattered islands, where some coasts might be sand-dominated, while other areas are characterized by narrow coastal ridges composed of coral rubble [31]. Thus, delineating the coastline of each island is complicated by this variability and spatial fragmentation. Therefore, despite the increasing number of studies on coastal monitoring, limited research has been conducted on coastline extraction for atoll islands—such as Tuvalu, a low-lying atoll nation in the South Pacific Ocean—which is vulnerable to coastal change [31].
Tuvalu is a densely populated island nation comprising small islands and atolls, each featuring extensive coastlines exposed to the sea. These islands are extremely low-lying, with elevations not exceeding 4.6 m above sea level [31]. As a result of their long coastlines and limited land mass, most islands are situated very close to the shore. Therefore, the coastal zones are highly dynamic, influenced by factors such as low elevation, loose coralline calcareous sand and gravel soils, and small landmasses [32,33]. Harun-Al-Rashid and Yang [32] observed that prior to 2015, most in-depth coastal change studies in Tuvalu focused primarily on Funafuti, often using the edge of vegetation (EoV) as the coastline indicator [34]. However, recent alterations in Funafuti’s coastal area have not been investigated. Furthermore, the scattered distribution of Funafuti’s islands with different distinct features (e.g., sandy islands and gravel-dominated islands) presents a challenge for coastline extraction. Therefore, methods that rely on a single global threshold or segmentation are insufficient in such heterogeneous environments due to a lack of consistent contrast between land and water [2,6,35]. To address this, the simple linear iterative clustering (SLIC) algorithm was employed to generate superpixels—compact, perceptually meaningful groups of pixels—by jointly considering spatial proximity and spectral similarity [36]. This segmentation strategy produces boundaries that adhere closely to natural features within the image, such as land masses, water bodies, and infrastructure, and enables targeted region extraction (as detailed in the methodology). Subsequently, adaptive Gaussian thresholding was applied independently (as detailed in the methodology) to each selected superpixel region (i.e., each island) to extract coastline boundaries. Thus, this study integrates superpixel-based segmentation with adaptive thresholding to independently extract the coastlines of different islands in Funafuti and then analyzes coastal changes that occurred between 2019 and 2023.

2. Materials and Methods

2.1. Study Area and Data

Funafuti Atoll (8.5°S, 179°E), an island of Tuvalu, accommodates more than half of the country’s total population. Geographically, the atoll extends approximately 25 km from north to south and about 17 km from east to west [31]. Regarding land area, Funafuti positions as the sixth largest among Tuvalu’s islands and atolls; however, it is the most spatially extensive, encompassing the largest lagoon and the longest coastline of all the atolls and islands in the nation [32]. The atoll comprises small and scattered islands situated along its reef rims, the majority of which are uninhabited. These islands vary in size, sedimentary composition, and degree of anthropogenic modification. The morphodynamic characteristics of the beaches within the study area vary by exposure and reef orientation [37]. Islands along the eastern and southern rim of Funafuti are typically narrow, aligned with the reef crest, and are composed primarily of coral rubble ridges forming steep, reflective ocean-facing beaches [37]. On the other hand, lagoon-facing shores and islands on the western rim are predominantly composed of finer, sandy sediments and display more complex shapes and gentler slopes [37]. Fongafale, the capital of Funafuti and its largest and most populated island, is situated on the eastern rim of the atoll. It is characterized by a narrow and low-lying topography, making it highly vulnerable to inundations during extreme events such as storm surges and tropical cyclones, with limited options available for resident evacuation [31]. The study area experiences a semidiurnal tidal regime with two high and two low tides per day, as well as an average tidal range of approximately 2 m, based on tide gauge data from Funafuti (location in Figure 1) over the period between 2019 and 2023. Wave conditions (wave height and direction) in Funafuti vary with the seasons. During the summer (December–February), the highest mean wave heights (2.0–2.1 m) are observed in the northeast region, while the southwest experienced similarly elevated wave heights during the winter (June–August) [38]. In contrast, the autumn (March–May) is characterized by slightly lower-than-average wave heights, and the spring (September–November) shows the lowest seasonal wave energy with mean significant wave heights below 1.7 m with a corresponding mean wave period of 10 s [38]. In addition, between December and May, waves approaching the eastern side of the islands primarily propagate from the east, while from June to November, the mean direction shifts to east–southeast. In contrast, on the western side, mean wave directions exhibit more southerly components and show less seasonal variation [38]. During extreme weather events such as tropical cyclones, significant wave heights reach up to 4.8 m, and waves generally propagate from the east–southeast and are associated with mean wave periods ranging from 7 to 11.5 s, indicating a strong influence of long-period swell [39].
Sentinel-2 is a multispectral optical imaging system consisting of two polar-orbiting satellites—Sentinel-2A and Sentinel-2B—operating in a sun-synchronous orbit and positioned 180° apart. The system offers a revisit time of five days and captures imagery of Earth’s surface across 13 spectral bands spanning the visible, near-infrared (NIR), and shortwave infrared (SWIR) regions. These bands are available at varying spatial resolutions: four bands at 10 m (bands 2, 3, 4, and 8), six bands at 20 m (bands 5, 6, 7, 8a, 11, and 12), and three bands at 60 m (bands 1, 9, and 10). In this study, Sentinel-2 Level-1C products were utilized, which represent top-of-atmosphere reflectance data. The cloud-free selected imagery (as listed in Table 1) between 2019 and 2023 covering the study area was acquired from the Copernicus Open Access Hub website. The satellite images used in this study were acquired under approximately mid- to low-tide conditions according to the Funafuti tidal predictions calendar [40].
Furthermore, sea level information was used to understand the circumstances of the tide range during the study period, and therefore, sea level data for Funafuti Atoll were obtained from the ERDDAP website [41]. The tide gauge station is located at approximately 8.502°S, 179.195°E (Figure 1(iii)). The dataset includes hourly and daily averaged tide gauge measurements where the sea level values are provided as relative sea level, along with corresponding timestamps and geographic coordinates (Table 1). As the acquisition time of the sea level and satellite was different, linear interpolation was conducted to obtain the sea level at the satellite acquisition time. The tide gauge at Funafuti is part of the Global Sea Level Observing System (GLOSS) Core Network (GCN), which comprises around 300 stations worldwide specific to tracking coastal sea level changes over various periods [41].

2.2. Methodology

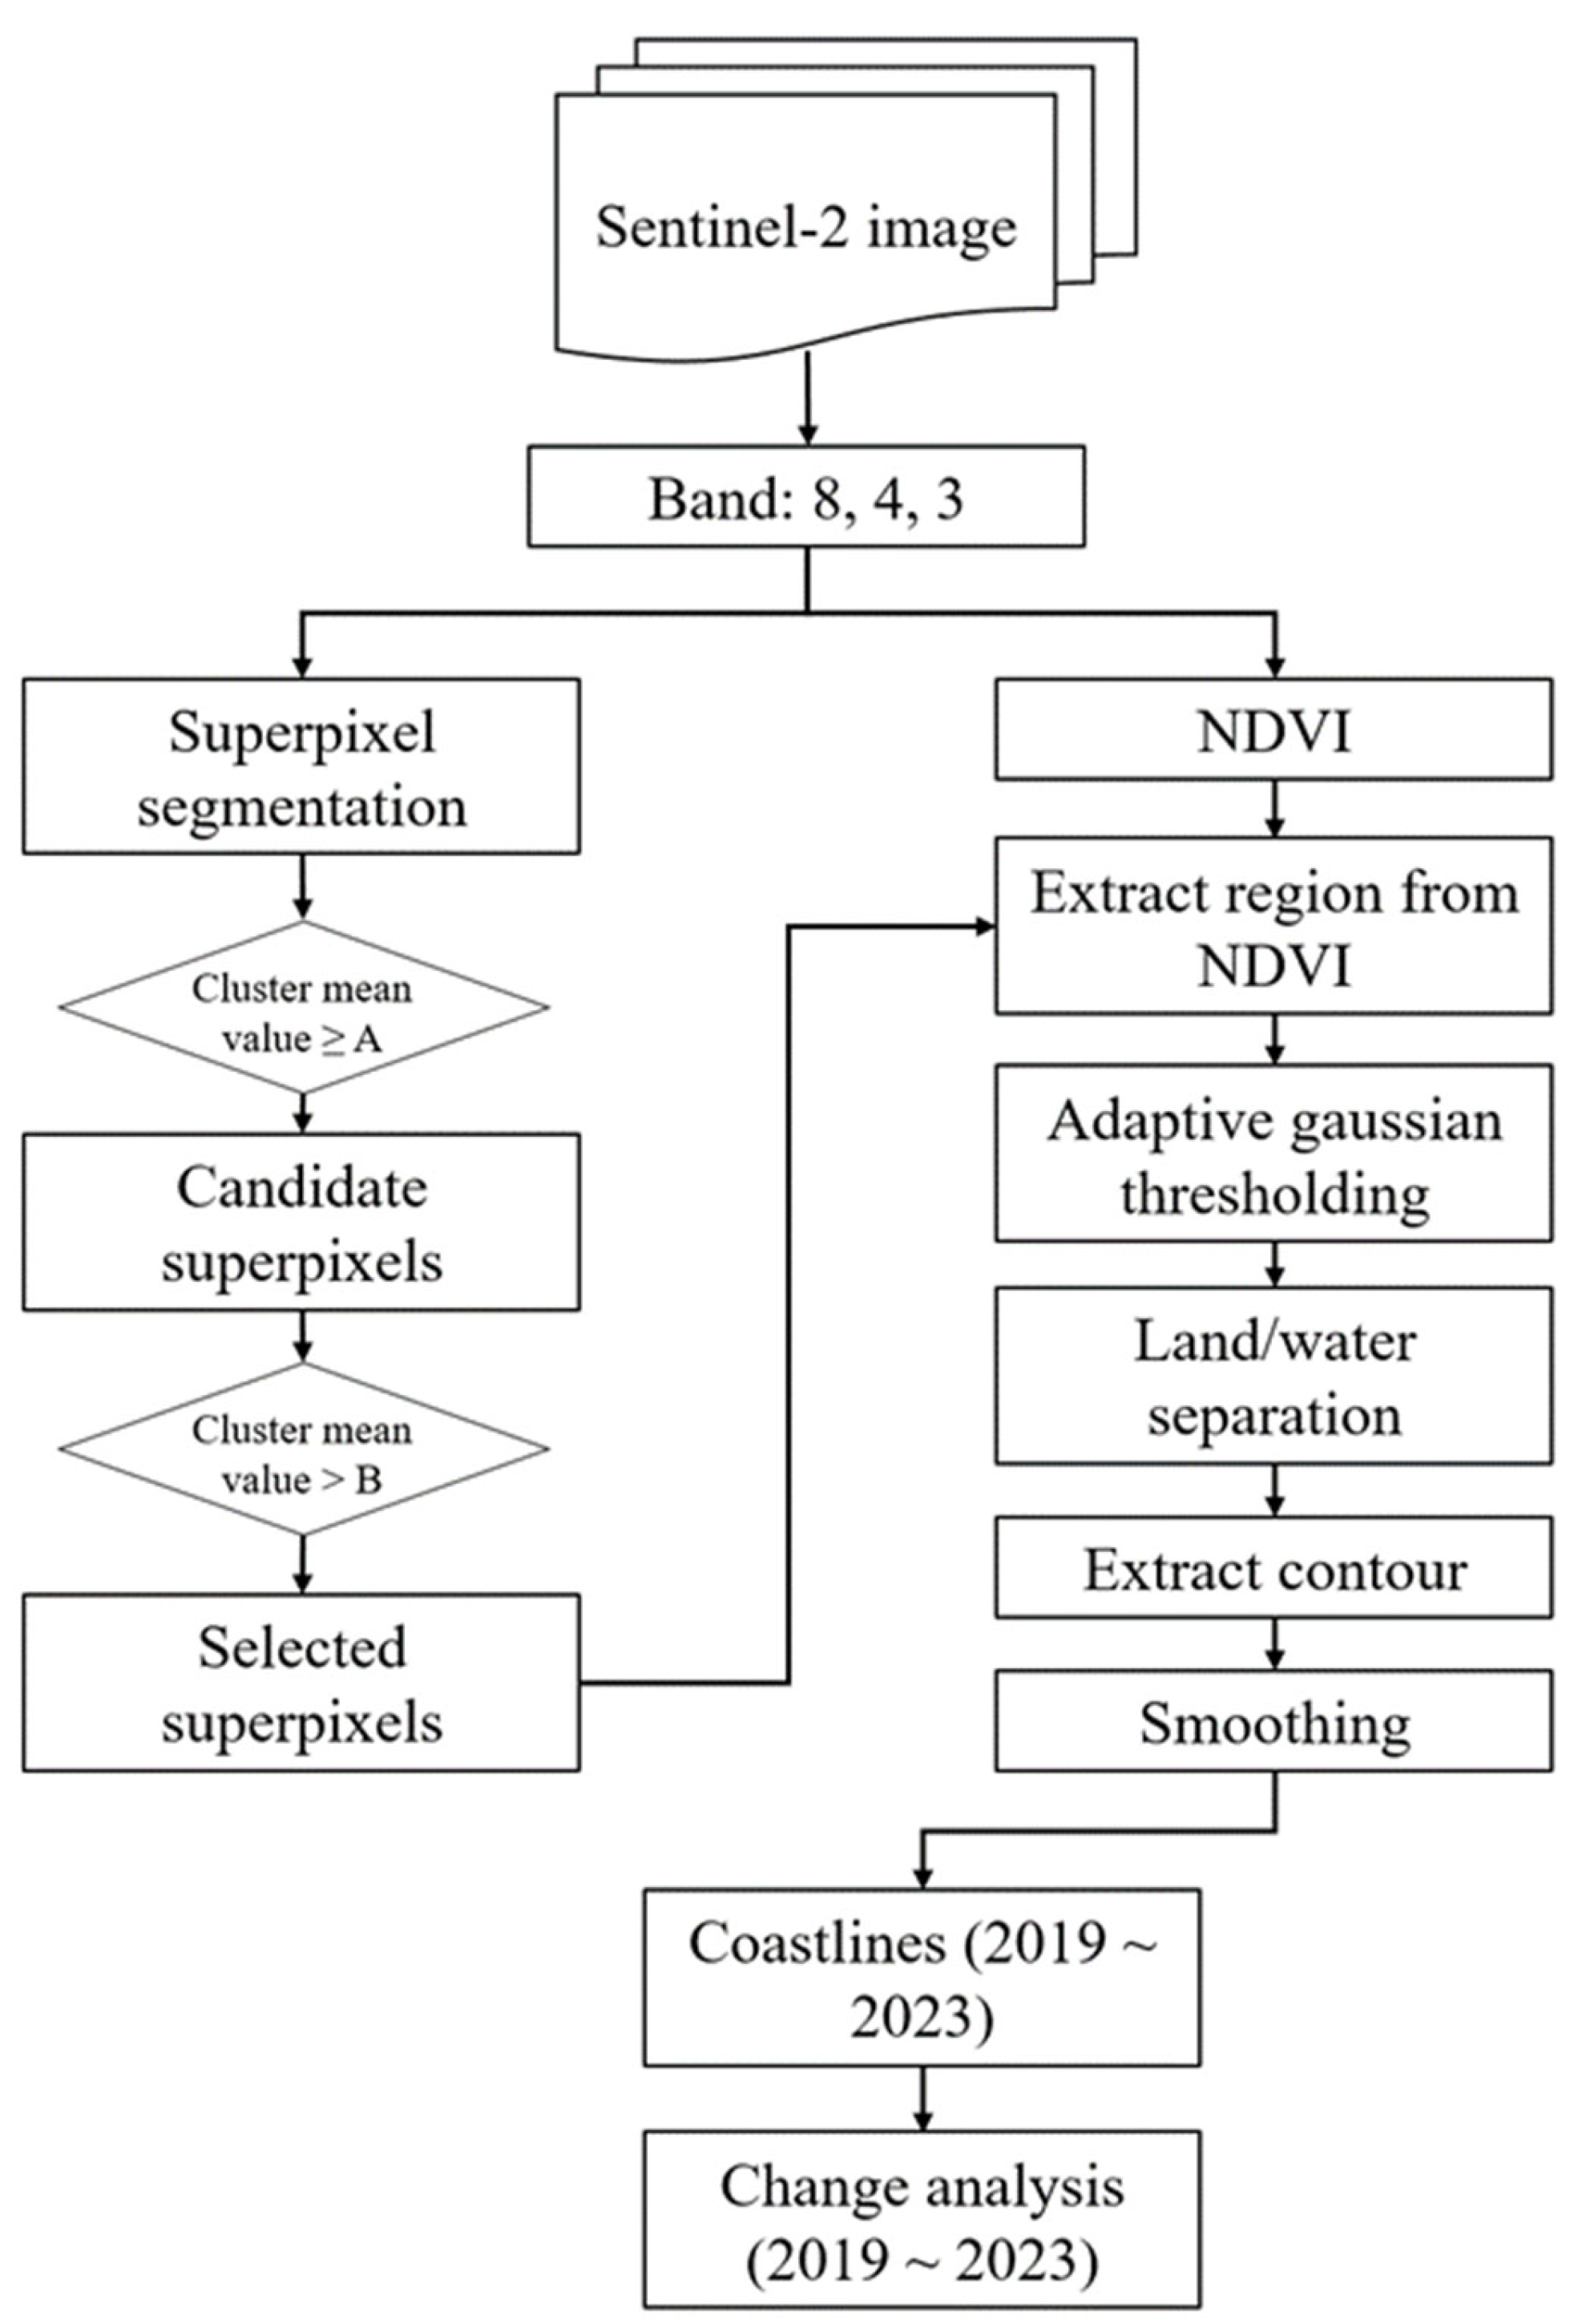
Since most of Tuvalu’s islands have mangroves, earlier research on coastline changes in atoll islands has widely utilized the edge of vegetation (seaward boundary of vegetation) (EoV) as a coastline indicator, as vegetation is relatively easy to distinguish in satellite images [31,32,34]. Moreover, EoV is also preferred in coastline analysis due to its relatively greater long-term stability compared to the short-term variability often exhibited by the dynamic coastline [31,42,43]. However, the objective of this study was to extract the coastline and assess the recent alterations in coastal areas and therefore, the selected coastline indicator was the boundary between wet (water) and dry (land) area, commonly referred to as the wet/dry line [7]. Figure 2 illustrates the comprehensive flowchart for coastline extraction and change analysis in the coastal region.
Various indices, including the normalized difference vegetation index (NDVI) and normalized difference water index (NDWI), are commonly employed in coastline extraction studies [9]. In this study, NDVI (Equation (1)) was utilized to highlight land pixels over water pixels, thereby facilitating the distinction between land and water areas.
NDVI = (RNIRRRed)/(RNIR + RRed)
where the reflectance of NIR (865 nm) and Red (655 nm) bands are indicated by RNIR and RRed, respectively. NDVI values extend between −1 and +1. A very low NDVI value (0.1 or less) indicates barren surfaces like rock or sand. Moderate NDVI values (between 0.2 and 0.3) are typical of shrublands and grasslands, while high values (greater than 0.6) are associated with dense forests. Bare soil generally has NDVI values close to zero, and negative NDVI values signify water bodies [44].
Before extracting the coastline, image segmentation was performed to cluster pixels into indicative features according to their spectral similarities [31,45]. This study utilized a superpixel segmentation approach based on the simple linear iterative clustering (SLIC) algorithm [36]. The algorithm requires three input bands, and bands 8 (NIR), 4 (Red), and 3 (Green) were selected for this purpose. SLIC algorithm clusters image pixels into visually coherent and spatially consistent regions. The process begins by converting the image from the RGB color space to the conceptually uniform CIELAB color space, which better aligns with human visual perception, and initializing cluster centers in a five-dimensional space, [l a b x y], where [l a b] represents the pixel’s color in CIELAB space and [x y] denote the spatial coordinates of each pixel. To assign pixels to a cluster, SLIC computes a composite distance metric, D, which quantifies the dissimilarity between pixels by combining both color similarity and spatial proximity, as defined in Equation (2).
d c = ( l j l i ) 2 + a j a i 2 + ( b j b i ) 2   d r = ( x j x i ) 2 + y j y i 2 D = d c 2 + ( d r S ) 2 m 2
S represents the size of each superpixel, while m is a constant that balances the weight between color similarity and spatial proximity in the clustering process; in this study, m was set to 40. The terms dc and dr denote the color and spatial distances, respectively, between pixels i and cluster center j in the five-dimensional space. Each pixel is then assigned to the nearest cluster center based on the computed distance metric. Subsequently, new cluster centers are determined by averaging all pixels assigned to each cluster. This process is iterated until convergence, typically when cluster centers stabilize. To ensure spatial continuity, orphaned pixels—those not strongly associated with any cluster—are reassigned to the nearest cluster center using a connected components algorithm. The SLIC algorithm effectively aligns with image boundaries while maintaining uniformity in the size and shape of superpixels. In this study, this segmentation step was used to group pixels of different islets according to similarity, resulting in distinct clusters that delineated land and water regions.
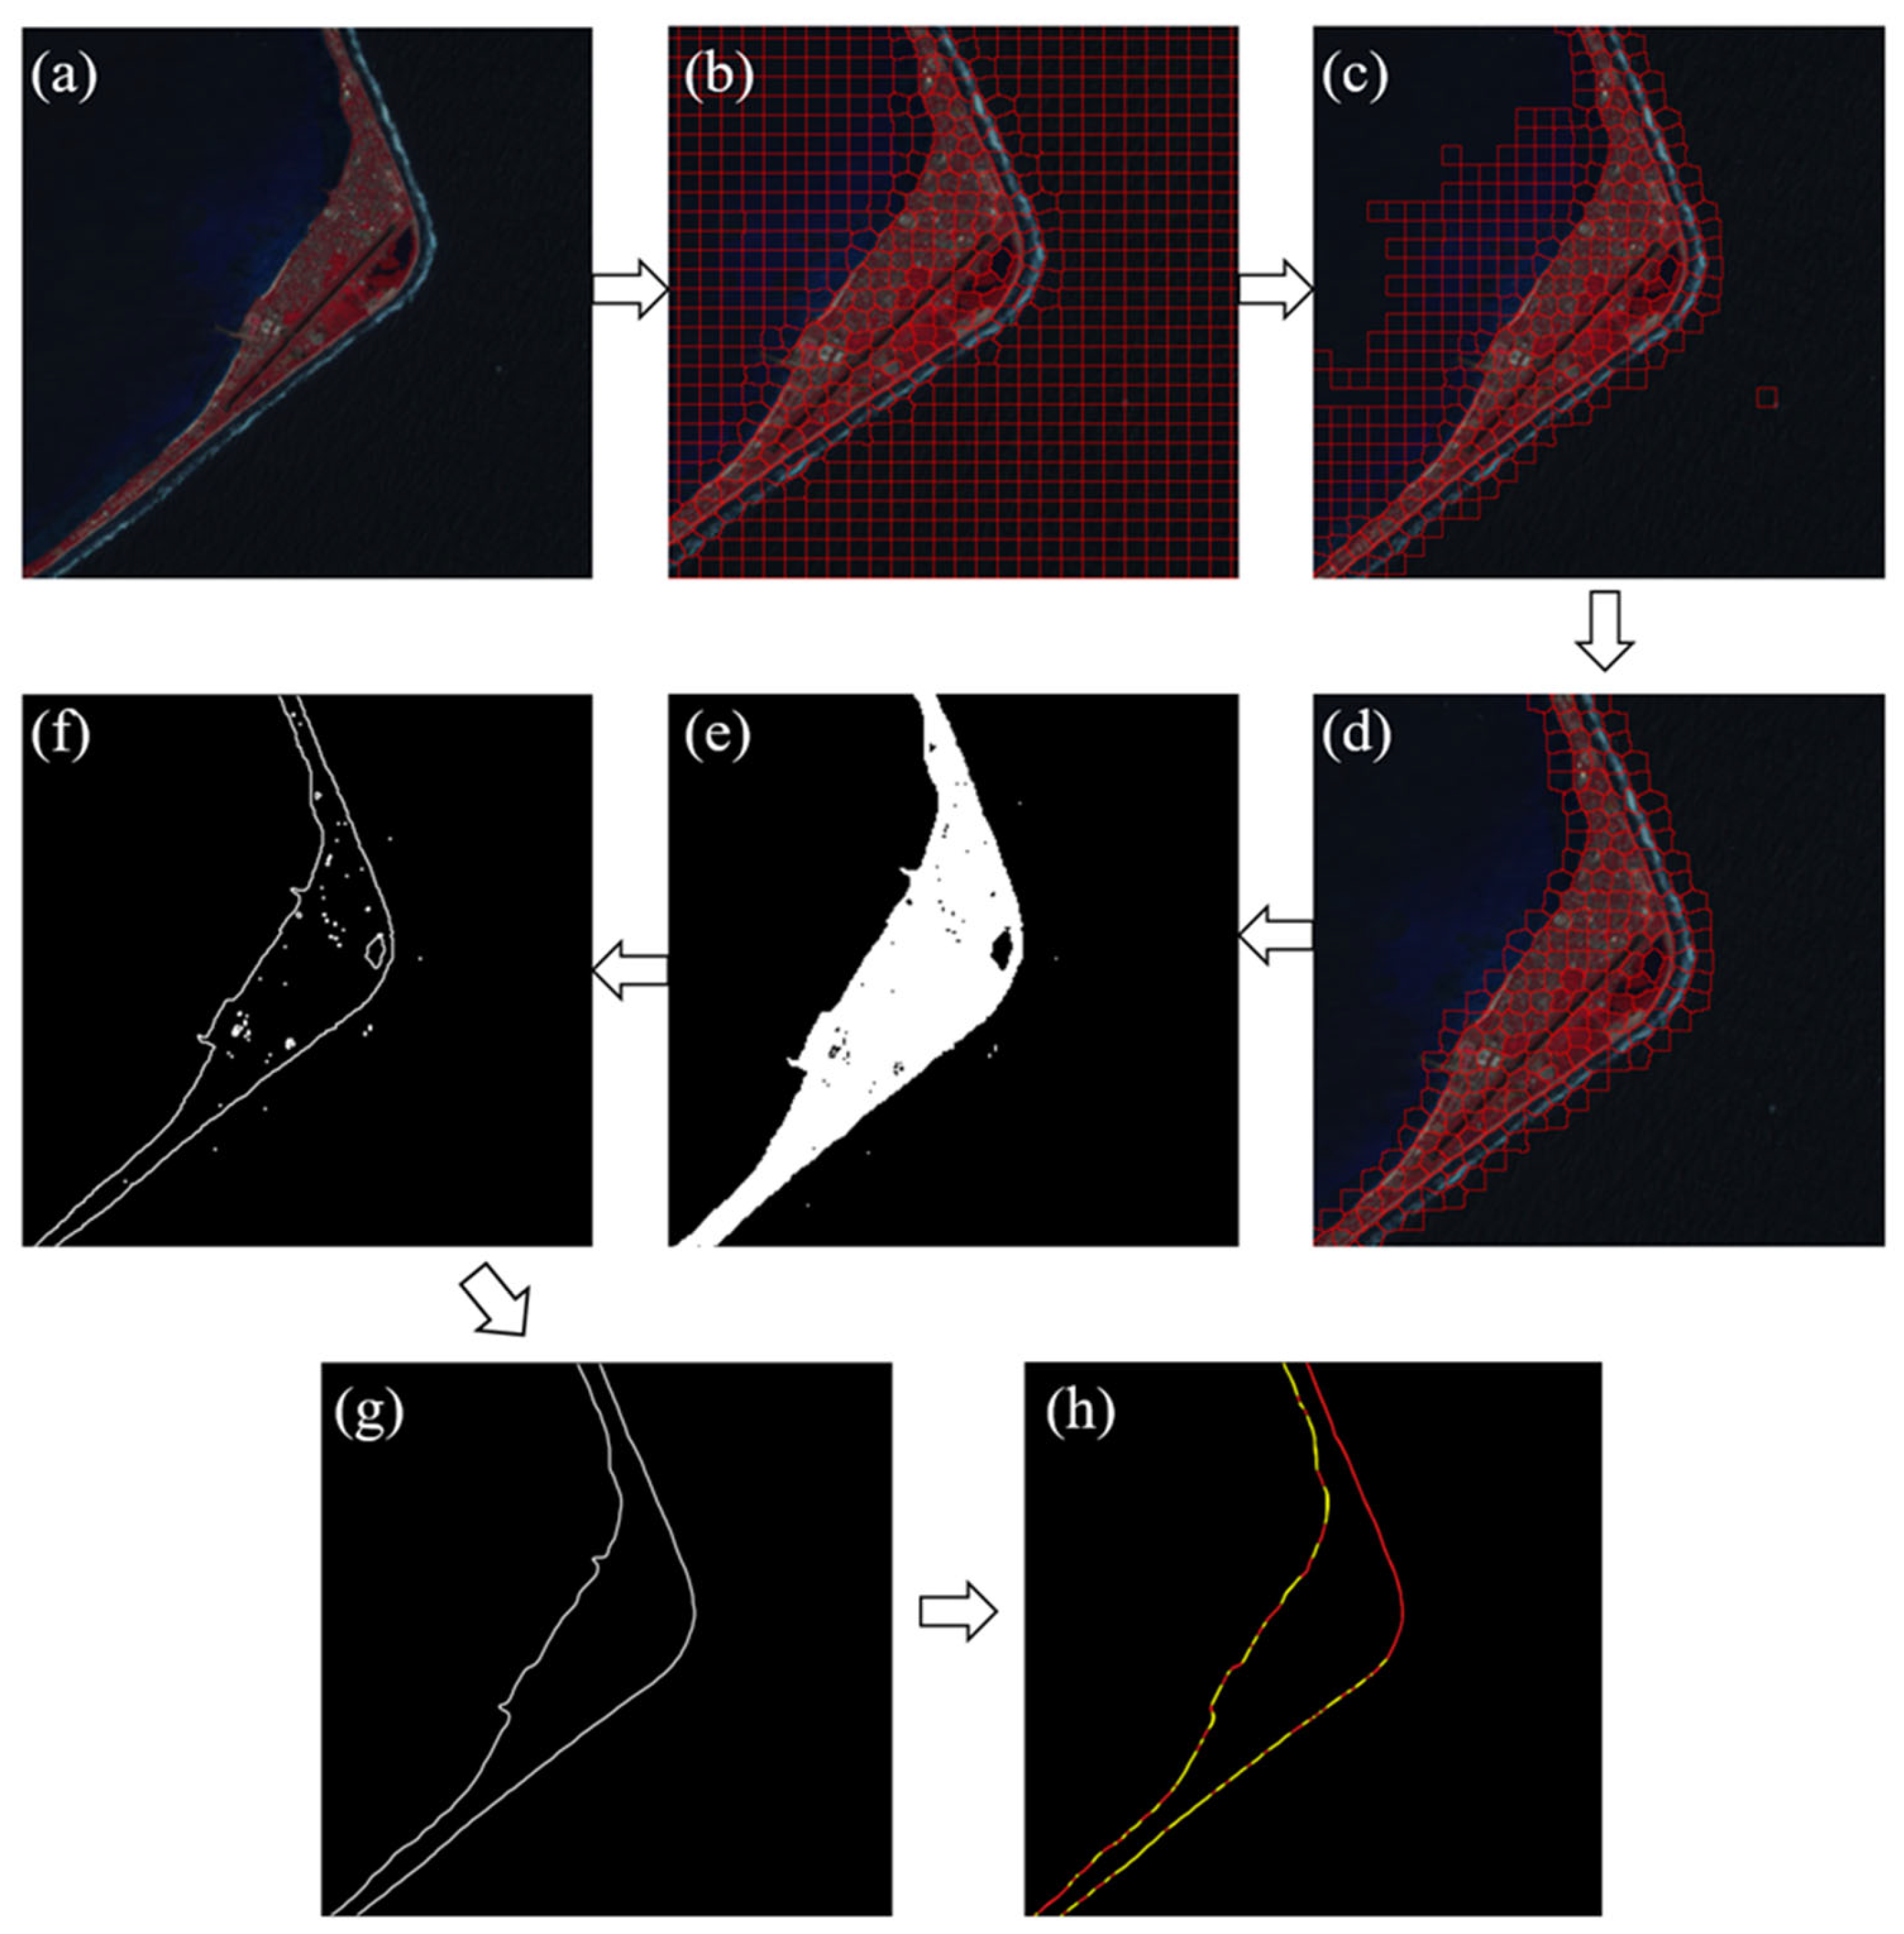
The subsequent step involved the selection of candidate superpixels by applying a threshold, determined through trial-and-error analysis, to eliminate non-target water regions. A superpixel was retained if its mean value was equal to or greater than the predefined threshold. This criterion ensured the inclusion of superpixels corresponding to target land features while effectively suppressing water-dominated regions. The threshold values utilized for different image scenes in this study were 0.1885835, 0.17290345, 0.06995773, 0.07165654, and 0.13306413. Afterward, a filtering step was implemented using a 3-connected superpixel approach to further refine the selection of candidate superpixels. In this process, each superpixel within a connected region was individually analyzed, and the mean spectral value of each superpixel was computed. To evaluate its spatial connectivity, a sliding window of 3 × 3 pixels was used to identify neighboring superpixels by shifting the spatial mask horizontally and vertically. The mean spectral values of all neighboring superpixels within this 3 × 3 window were calculated, and superpixels with an average value greater than 0.15 were retained. Afterward, the selected superpixels were used to extract the region from the NDVI image. Then, a Gaussian adaptive thresholding technique was applied to the NDVI image, utilizing a local window of 5 × 5 pixels to distinguish land from water. This locally adaptive approach allows threshold values to vary based on the statistical properties of pixel intensities within the window, thereby enhancing boundary detection in heterogeneous regions. The resulting land–water boundary was designated as the coastline indicator. Subsequently, contours were extracted from the resulting binary image, and the marching squares algorithm [46] was applied to smooth the extracted coastline. The illustration of the overall step for coastline extraction and change analysis is depicted in Figure 3.
To validate the extracted coastline, a reference coastline was utilized, derived from the Sentinel-2 image (10 m resolution) acquired on 28 September 2023. The reference line was manually digitized through visual inspection of the satellite image [2]. The sea level was identical for both the extracted and reference coastlines, as both were derived from the same satellite image. Following the approach of Lee [47], the extracted coastline was compared against the reference lines using a transect-based method. First, the reference line was selected, and a fixed sampling interval—two meters in this study—was defined. Nodes were placed along the reference line at this interval. At each node, a transect line was drawn that was perpendicular to the reference line. The intersection points between each transect and the extracted coastline were identified, and the distance between these points and the corresponding node on the reference line was calculated. Subsequently, the Mean Absolute Error (MAE), defined as the arithmetic mean of absolute positional differences [29], was employed as the accuracy assessment metric to provide a quantitative estimate of shoreline mapping precision (Equation (3)).
M A E = i = 1 n E i R i n
where n represents the total number of points (transects), E i indicates the points on the extracted line, and R i indicates the points on the reference line.
Finally, for coastal change analysis between 2019 and 2023, the area enclosed by the extracted coastlines was computed and used as a quantitative metric to assess shoreline dynamics over time. Furthermore, the area of uncertainty was estimated using a first-order approximation by multiplying the total coastline length by the MAE for each island, wherein the coastline was treated as a linear feature and the positional error was assumed to propagate uniformly and orthogonally to the coastline [28].

3. Results

3.1. Coastline Extraction Result Between the Years 2019 and 2023

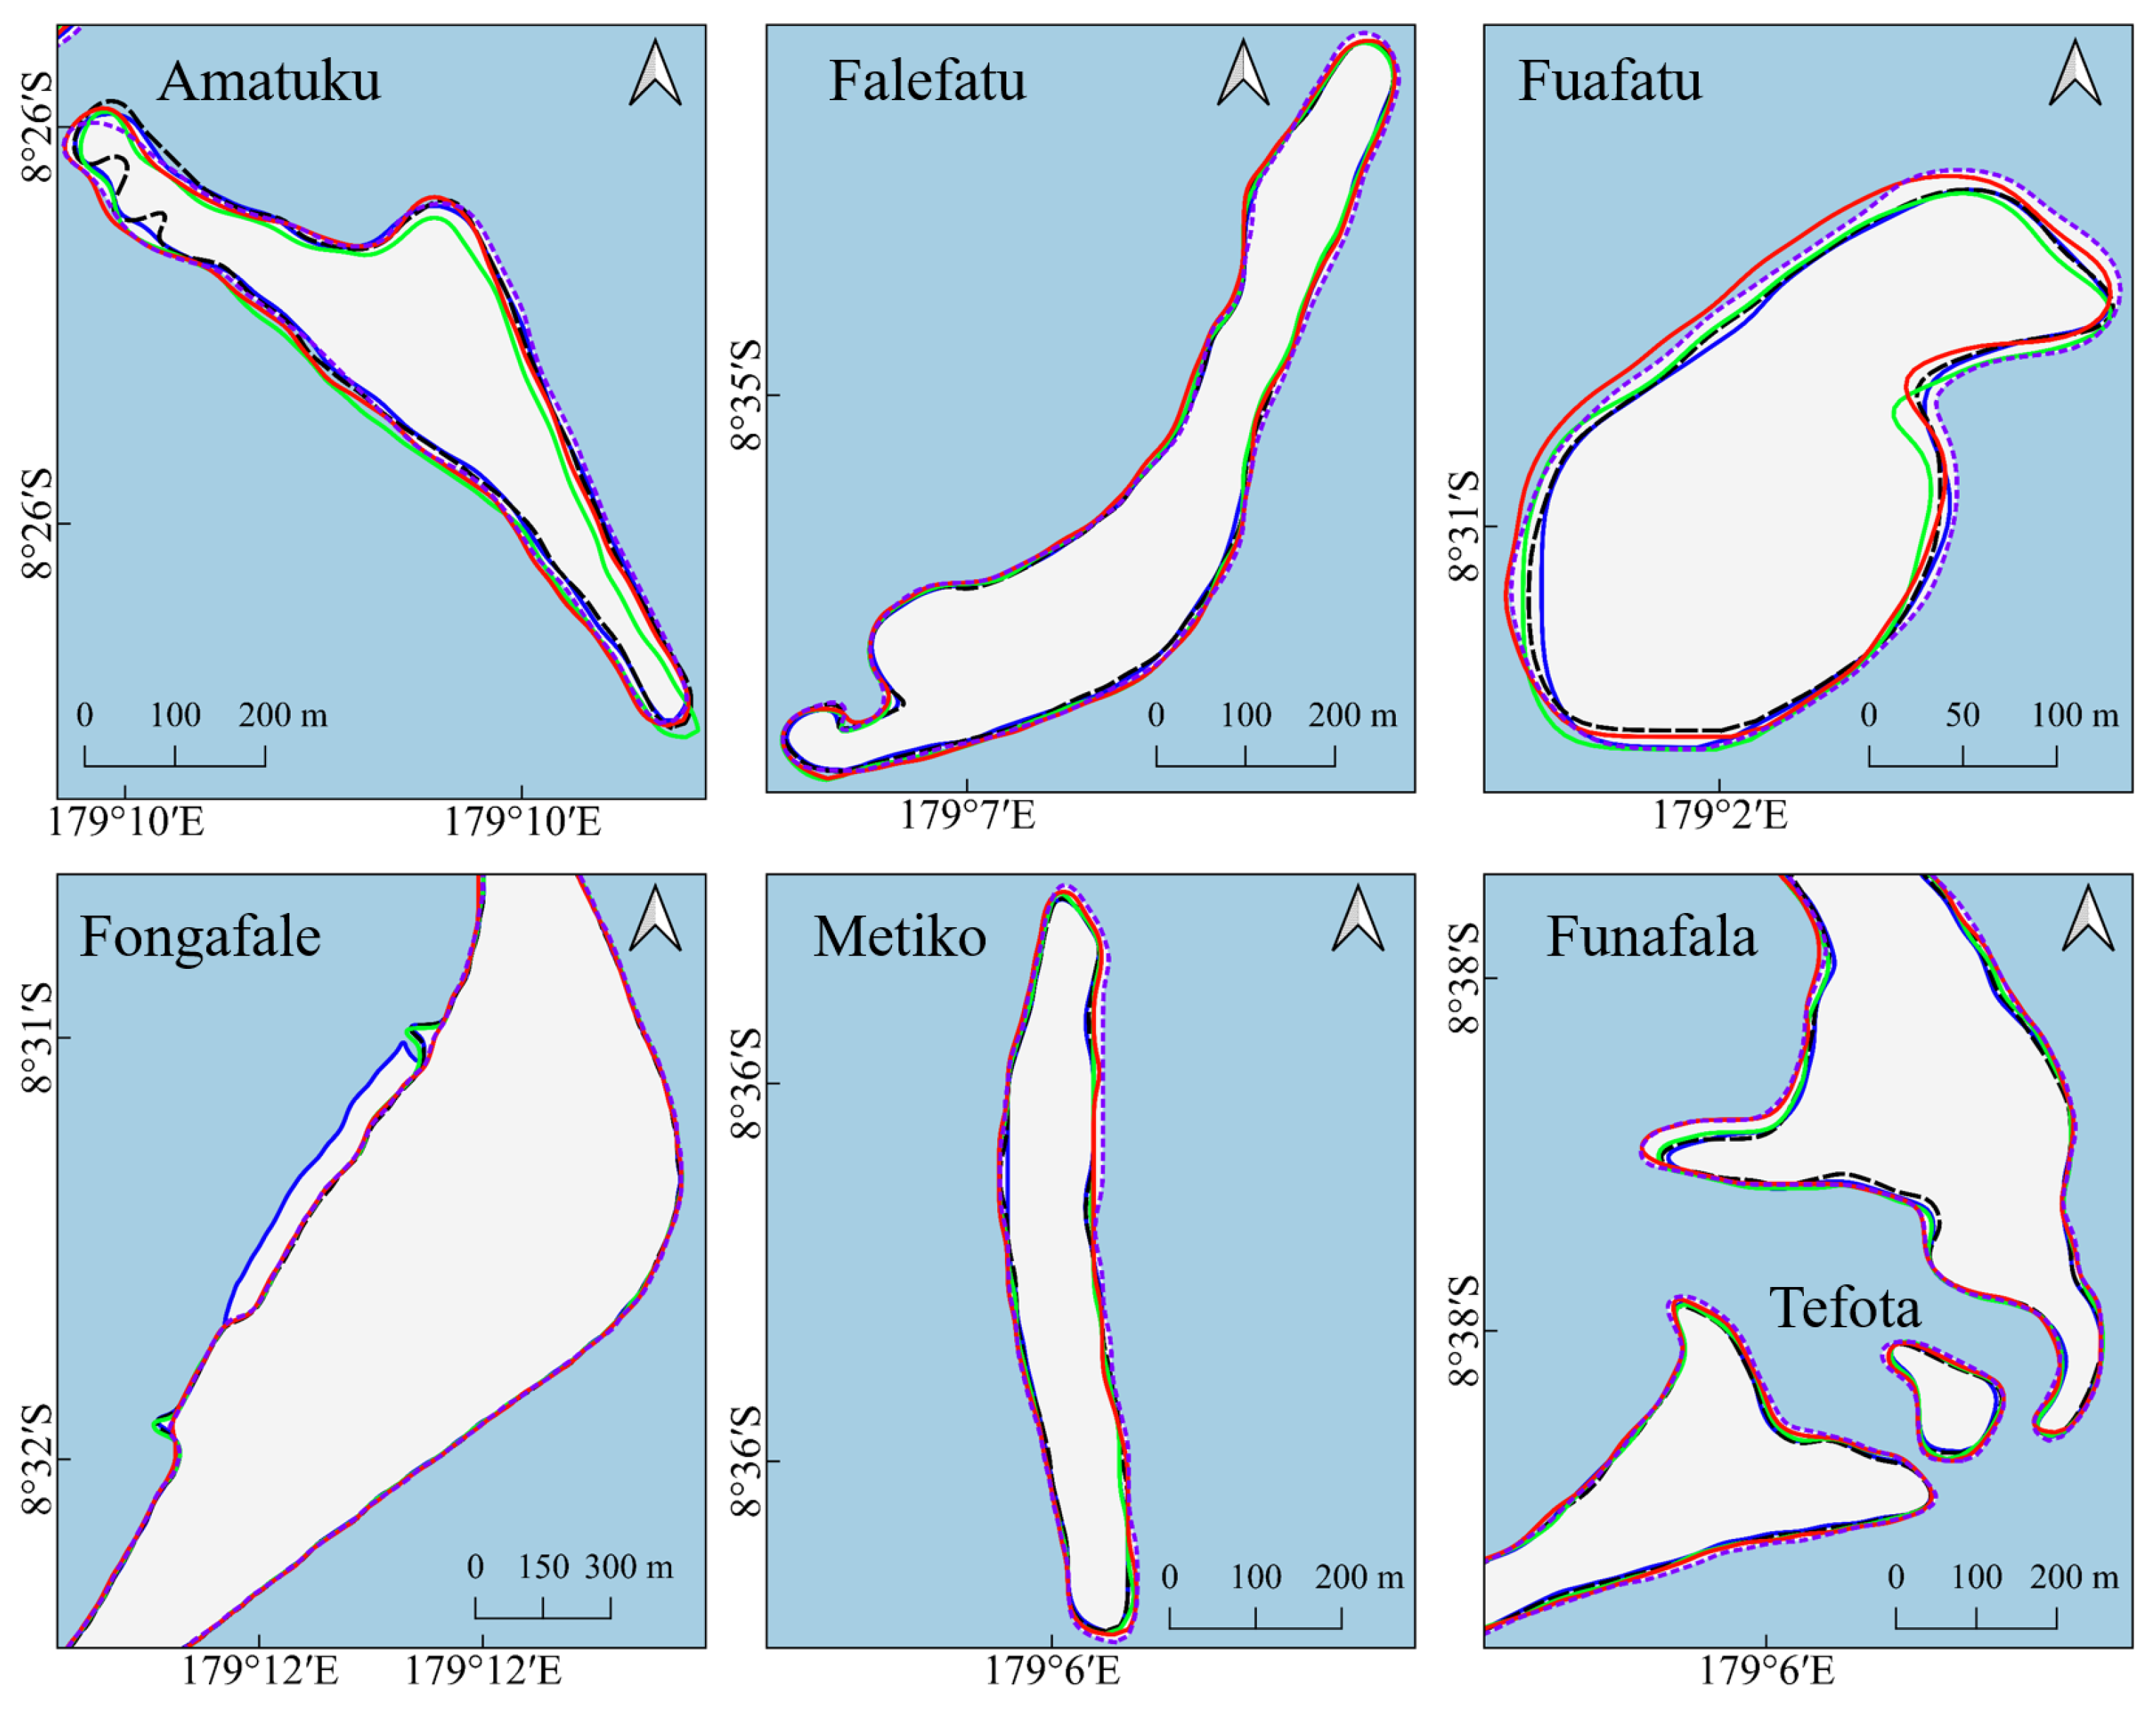
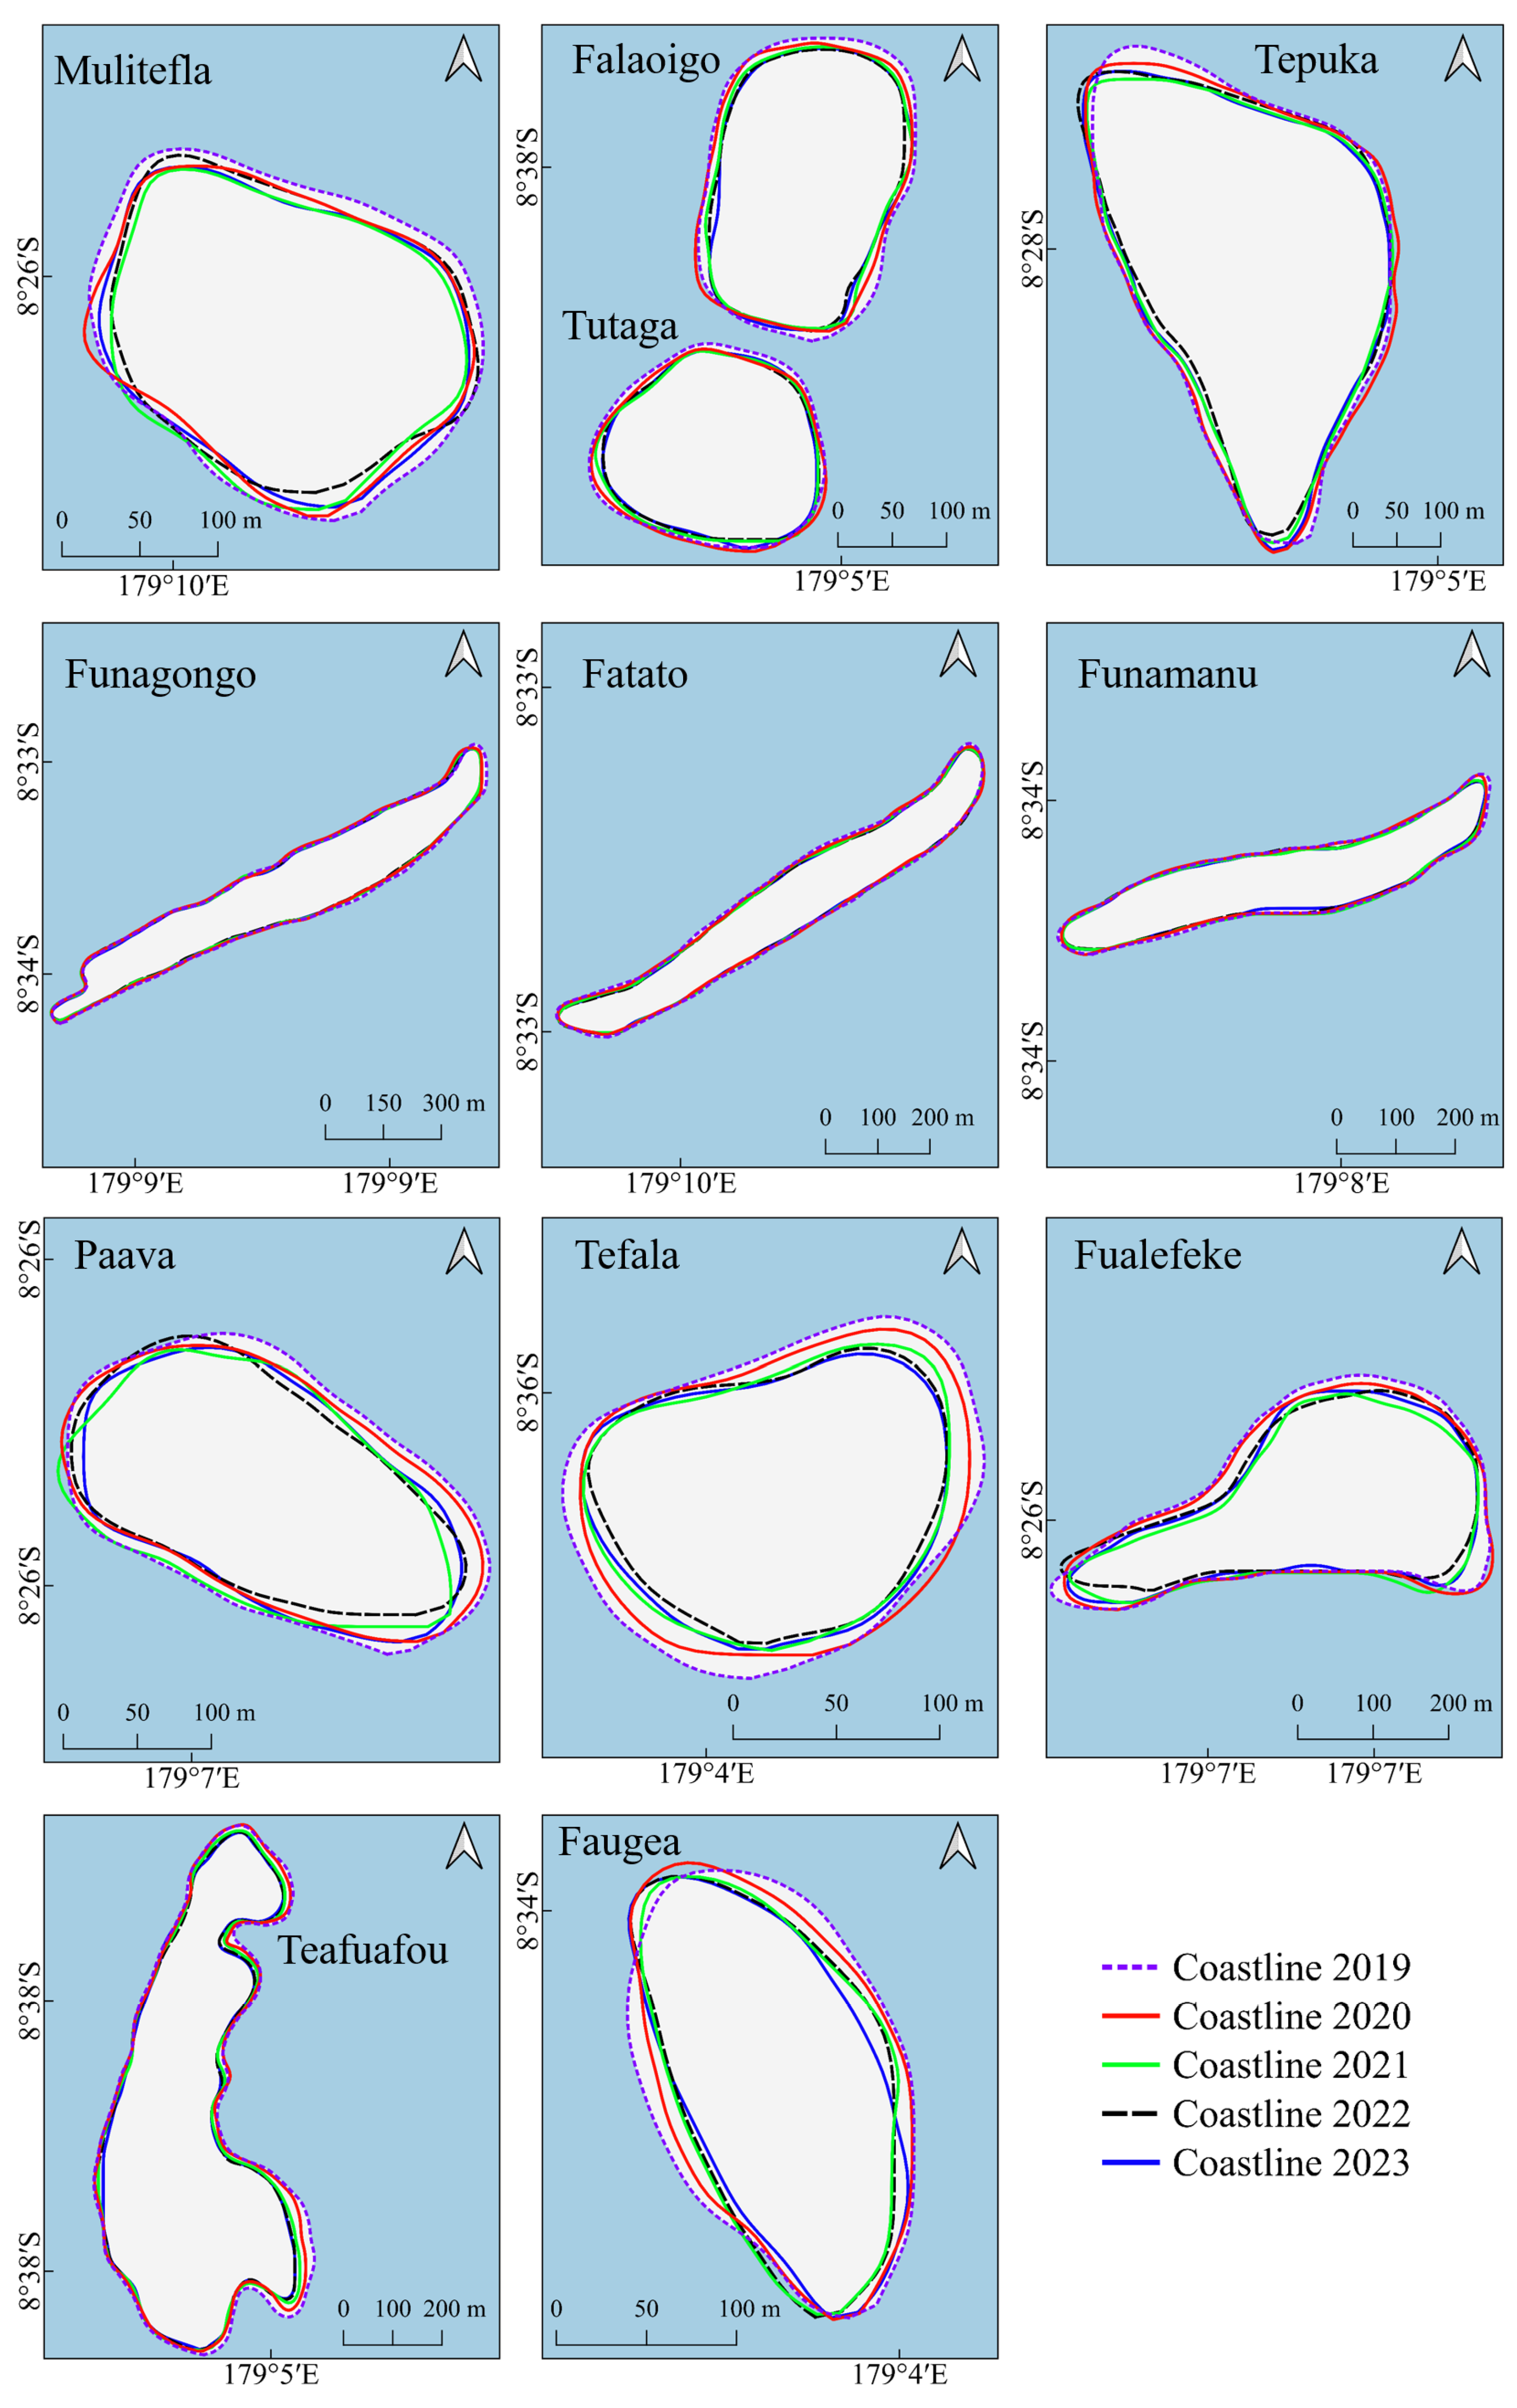
Figure 4 displays the extracted coastline of different islands of Funafuti, including Amatuku, Falefatu, Fuafatu, Fongafale, Metiko, Tefota, Luamoto, Funafala, Mulitefla, Falaoigo, Tepuka, Fualopa, Funagongo, Fatato, Te-Afualiku, Paava, Telele-Motusanapa, Motuloa, Funamanu, Tefala, Fualefeke, Teafuafou, Avalau, Tegasu, Tutaga, and Faugea.
The extracted coastline and the reference coastline were compared, and the estimated MAE for each island is summarized in Table 2, where the lowest MAE is calculated to be 3.38 m for Metiko and the highest (7.32 m) is estimated for Fongafale. The number of transects utilized for estimating MAE varied significantly among islands, reflecting differences in coastline length. Fongafale has the highest number of transects (12,761), allowing for a detailed evaluation of accuracy. Conversely, smaller islands such as Tefota and Te-Afualiku have fewer transects (205 and 232, respectively).
The extracted coastlines of the different islands within the Funafuti atoll depict the shift in coastline over the study period (Figure 4). The ocean-facing coastline of Fongafale Island exhibits a minimal positional change (~2 m), likely due to the presence of coral rubble ridges and steep coastal slopes, which act as natural barriers against high-energy wave impacts. In contrast, the lagoon-facing shoreline of Fongafale shows an advancement towards the lagoon (~100 m), primarily driven by land reclamation activities (Figure 4) [48,49]. Islands located along the eastern and southern rims of Funafuti—including Amatuku, Fatato, Funagongo, Funamanu, Falefatu, Metiko, Luamoto, Funafala, Telele–Motusanapa, and Motuloa—feature steep, gravel-dominated, ocean-facing coasts that contribute to shoreline stability, alongside more gently sloping, lagoon-facing shores. Conversely, islands along the western rim of the atoll (sand-dominated beach), such as Tefala, Falaoigo, Tutaga, Tepuka, Paava, Fualefeke, and Faugea, exhibit landward retreat, indicating a potential susceptibility to erosion, as the image used to extract coastline was obtained under mid- to low-tide conditions within a narrow tidal range; the influence of tidal fluctuations on the extracted coastline is expected to be not significant. The average length of extracted coastlines exhibits a substantial spatial variability, ranging from 0.4 km (Tefota) to 25 km (Fongafale). Fongafale, the largest island in Funafuti, accounts for the longest continuous coastline, comprising a significant portion of the total atoll perimeter. Other relatively extensive coastlines include Luamoto, Funafala (6.8 km), and Telele-Motusanapa (6.1 km). On the other hand, smaller islands such as Te-Afualiku, Tefala, and Tutaga have coastlines less than 1 km. Between the period of 2019 and 2023, the length change rate of the Fongafale coastline was estimated to be 0.5%, which indicates an increase in coastline length. For other islands, the coastline in 2019 was longer than the coastline in 2023 (Table 3).

3.2. Coastal Changes Between the Years 2019 and 2023

Table 4 depicts the alterations that include erosion and accretion in the coastal area of each island in Funafuti that occurred within the extracted coastline boundary from 2019 to 2020. Between the years 2019 and 2020, Te-Afualiku displayed the highest erosion rate at 12.8%, followed by Mulitefla at 11.8%, Paava and Tefala both at 10.1%, and Tefota and Faugea each at 8.6%. Fualopa, in contrast, shows the highest accretion at 10.1% and one of the lowest erosion rates (2.6%), indicating net land gain. Moderate erosion is observed in Amatuku (6.5%, 5.3%), Fuafatu (6.8%, 3.6%), Fatato (5.9%, 1.3%), Tutaga (5.4%, 1.7%), Teafuafou (5.0%, 1.8%), Fualefeke (4.9%, 1.9%), and Luamoto (3.6%, 2.4%), all with erosion exceeding accretion. The low eroded area is seen in Fongafale (1.9% erosion, 1.6% accretion) and Tepuka (2.7% erosion, 2.6% accretion), both showing less difference between erosion and accretion. In addition, Falefatu and Funamanu display low erosion rates (3.2% and 3.1%, respectively) with modest accretion (3.7% and 1.1%, respectively). Funagongo exhibits 3.8% erosion and 2.5% accretion, while Metiko experiences 7.7% erosion with low accretion (1.1%). Falaoigo follows with 7.3% erosion and 0.3% accretion. Overall, the analysis indicates that most islands were undergoing net area loss due to higher erosion than accretion.
Between the years 2020 and 2021 (Table 5), Fualopa exhibits the most geomorphic activity, with the highest erosion rate at 18.9% and a substantial accretion of 5.1%. Fualefeke follows with 17.8% erosion and only 1.1% accretion, reflecting significant net land loss. Te-Afualiku and Tefala also show obvious erosion at 15.2% and 15.6%, respectively, with low or no accretion (2.6% and 0%). Faugea experiences 13.1% erosion and 1.5% accretion, while Paava has 12.4% erosion and 4.0% accretion. A similar trend is exhibited by Amatuku, with 12.8% erosion and 3.2% accretion. Other islets with moderate-to-high erosion include Fuafatu (10.1% erosion, 3.7% accretion), Tepuka (9.2%, 0.0%), Mulitefla (8.7%, 2.7%), Tefota (8.1%, 0.0%), Falaoigo (7.8%, 0.03%), and Tutaga (7.6%, 0.2%). Furthermore, moderate erosion and minimal accretion are displayed by the islands Luamoto (5.7%, 1.6%), Funamanu (5.6%, 1.3%), Telele-Motusanapa (6.1%, 0.5%), Teafuafou (5.3%, 0.2%), and Metiko (5.1%, 0.2%). In addition, Falefatu (4.5% erosion, 0.2% accretion), Fatato (4.1% erosion, 1.0% accretion), and Funagongo (3.2% erosion, 0.6% accretion) reflect lower rates of geomorphic change. Moreover, Fongafale, with 2.2% erosion and 1.1% accretion, indicates fewer changes in the land area. Overall, most islands exhibit a trend of erosion surpassing accretion.
Between the years 2021 and 2022 (Table 6), erosion percentages range from 0% (Tefota) to a maximum of 20.9% (Fualopa), while accretion percentages span from 0.2% (Falaoigo) to 20.1% (Fualopa). The average erosion rate among all 22 islands is approximately 5%, whereas the average accretion rate is around 3.7%. A total of 14 islands exhibit greater erosion than accretion, indicating a net loss in land area, such as Luamoto (5.5% erosion, 0.7% accretion) and Tefala (7.3%, 1.2%). On the other hand, 8 islands show higher accretion than erosion, demonstrating net area gain; examples include Amatuku (12.3%, 15.3%) and Te-Afualiku (7.6%, 10.4%). Moreover, minimal overall changes are exhibited by Fongafale (accretion: 1.7%, erosion: 0.6%) and Funagongo (accretion: 2.1%, erosion: 0.6%), while Tefota presents no erosion and a modest accretion rate (2.6%).
Between the period 2022 and 2023 (Table 7), Fualopa displays the most significant changes, with the highest erosion rate of 12.3% and the highest accretion rate of 16.8%. On the other hand, Fongafale shows minimal erosion at 1.1% and relatively high accretion at 2.6%, indicating a net area gain. Tefota records a notably high erosion rate of 7.8% with moderate accretion (2.4%), indicating a net area loss. Faugea also exhibits considerable erosion (6.7%) compared to its accretion (3.8%). Other islands with erosion exceeding accretion include Amatuku (4.4% erosion, 3.7% accretion), Falefatu (2.3%, 0.7%), Metiko (2.7%, 0.6%), Luamoto (3.3%, 1.7%), Funagongo (2.4%, 1.3%), Fatato (2.1%, 0.5%), Telele-Motusanapa (3.3%, 2.1%), Funamanu (3.7%, 0.6%), and Teafuafou (2.1%, 0.5%). Conversely, several islands exhibit net land gain where accretion surpasses erosion: Fualefeke (4.3%, 6.1%), Tefala (1.7%, 5.6%), Mulitefla (4.1%, 5.1%), Paava (3.9%, 8.3%), and Te-Afualiku, with 3.3% erosion and a high 9.8% accretion rate. Fuafatu and Tepuka also demonstrate a slight expansion, with 2.4% erosion and 2.6% accretion for Fuafatu and 2.3% erosion versus 3.1% accretion for Tepuka. A few islands, such as Falaoigo (1.1%, 2.7%) and Tutaga (1.8%, 1.9%), show minimal overall change.
Figure 5 depicts the temporal variations in the island’s land area (hectares) within the coastline boundary of Funafuti Atoll from 2019 to 2023. During the five-year period, Tefala exhibited the most proportional land loss, with an erosion of 0.64 hectares, equivalent to 25.27% of its area in 2019. Similarly, Tefota experienced 0.32 ha of erosion, which constituted 23.23% of its area in 2019, while Faugea lost 0.57 ha (20.23%). Other islands with notable erosion include Paava with 0.74 ha (18.38%), Fualefeke with 1.68 ha (16.40%), Metiko with 1.35 ha (16.14%), Falaoigo at 0.70 ha (15.83%), and Te-Afualiku, which eroded by 0.26 ha (15.53%). Mulitefla and Luamoto experienced losses of 0.60 ha (14.03%) and 4.58 ha (11.29%), respectively, while Tutaga lost 0.41 ha (12.89%), and Telele-Motusanapa experienced a loss of 3.38 ha, comprising 12.53% of its area. Fuafatu experienced 0.72 ha of erosion, representing 12.85%, and Fatato lost 0.93 ha or 10.22%. Funamanu also recorded a significant loss with 0.73 ha eroded (10.11%). Moderate erosion occurred for Amatuku (0.92 ha, 8.70%), Falefatu (1.09 ha, 8.46%), Tepuka (1.07 ha, 8.55%), and Teafuafou, which experienced 3.75 ha of erosion, amounting to 14.05%. Funagongo lost 1.09 ha, corresponding to 6.48%. In contrast, Fualopa witnessed a relatively low loss of 0.11 ha, only 3.26% of its 2019 area. Fongafale had the lowest erosion in both percentage and area, with 2.10 ha lost, accounting for only 0.98% of its total area, despite being the largest island by size.

4. Discussion

This study presents an approach for coastline extraction that combines simple linear iterative clustering superpixel segmentation with Gaussian adaptive thresholding, allowing for the independent delineation of coastline for each island within the Funafuti atoll. The islands are geographically dispersed and characterized by unconsolidated coralline calcareous sand and gravel-dominated substrates, with maximum elevations generally not exceeding 4.6 m above sea level [32,33,37,50]. Therefore, each island was analyzed individually to extract the coastline, and thus superpixel segmentation was employed to group spectrally similar pixels into homogeneous and spatially contiguous regions, producing segmentation boundaries that facilitated identification of individual island areas [36,45]. In addition, the NDVI was computed to enhance the spectral contrast between land and water features [44]. Using the segmentation boundaries, the corresponding island regions were extracted from the NDVI image. Subsequently, adaptive thresholding was applied to each island, allowing threshold values to vary in response to the statistical properties of pixel intensities within each region. This adaptability improved boundary detection in spectrally heterogeneous environments. As a result, coastlines were extracted for all islands, yielding a moderate positional accuracy with MAE ranging from 3.3 to 8.3 m. The integration of segmentation and adaptive thresholding techniques demonstrated the potential for automated shoreline delineation, offering a significant reduction in processing time compared to manual digitization methods.
Subsequently, coastline changes and variations in coastal area across the islands of Funafuti between 2019 and 2023 were analyzed. The primary drivers of coastal area change in Funafuti include tropical cyclones, flooding, and sea level rise [31,32,51]. The tropical cyclone season typically spans from November to April, during which 14 cyclones passed within 700 km of Funafuti between 2015 and 2021 [39]. These events generate storm surges and swells that induce coastal flooding and morphological change, particularly in areas (western rim) lacking protective infrastructure [32,51]. Moreover, coastal flooding has occurred repeatedly in recent years as a result of king tides, which push saltwater over low-lying sections of the atolls, leading to road inundation, increased soil salinity, groundwater contamination, and accelerated coastal changes [32,51]. At present, the middle part of Fongafale is situated below the level of high spring tides, resulting in frequent saline flooding of low-lying areas. Moreover, satellite altimetry data indicate that sea level in the vicinity of Tuvalu has increased at an average rate of approximately 5 mm per year since 1993, which exceeds the global mean rate of 2.8–3.6 mm per year [32,51]. With ongoing sea level rise, the frequency and extent of such flooding events are projected to increase, thereby playing a critical role in the continued transformation of coastal landforms and degradation of vulnerable low-lying areas [31,51]. Islands located along the eastern and southern rims exhibited minimal coastline displacement (between 2019 and 2023), which is possibly due to the presence of coral rubble ridges and steep coastal slopes that provide structural resistance to alteration [37]. However, the middle part of Fongafale (situated in the eastern rim) displayed a noticeable lagoonward coastline advancement, primarily attributed to anthropogenic land reclamation (780 m long and 100 m wide) activities [48,49]. Meanwhile, the islands on the western rim—characterized by sand-dominated beaches with broader and more gradual slopes—experienced landward coastline retreat, possibly driven by the impact of storm surges and prolonged swells generated by tropical cyclones [31,32,37,39].
Between 2019 and 2023, all islands exhibited erosion, with corresponding area changes rates of 8.6%, 8.4%, 12.8%, 0.9%, 16.1%, 23.2%, 11.2%, 14.1%, 15.8%, 8.5%, 3.2%, 6.4%, 10.2%, 15.5%, 18.3%, 12.5%, 10.1%, 25.2%, 16.4%, 14.1%, 12.8%, and 20.2% for the islands of Amatuku, Falefatu, Fuafatu, Fongafale, Metiko, Tefota, Luamoto, Mulitefla, Falaoigo, Tepuka, Fualopa, Funagongo, Fatato, Te-Afualiku, Paava, Telele-Motusanapa, Funamanu, Tefala, Fualefeke, Teafuafou, Tutaga, and Faugea, respectively. To comprehend whether the observed changes on each island were possibly significant, the area of uncertainty was estimated using a first-order approximation, representing the surface area buffer within which the extracted coastline position is expected to lie. A change in surface area was assumed to be possibly significant when the absolute value of the net change exceeded the corresponding area uncertainty. Thus, possible significant changes were identified for the following thirteen islands: Falaoigo (net change: 0.7 ha; area uncertainty: 0.3 ha), Fuafatu (0.7 ha; 0.5 ha), Metiko (1.3 ha; 0.6 ha), Funafala (4.5 ha; 2.7 ha), Mulitefla (0.5 ha; 0.4 ha), Tepuka (1.1 ha; 0.6 ha), Te-Afualiku (0.3 ha; 0.2 ha), Paava (0.7 ha; 0.3 ha), Tefala (0.6 ha; 0.1 ha), Fualefeke (1.6 ha; 0.8 ha), Teafuafou (3.8 ha; 2.2 ha), Tutaga (0.4 ha; 0.2 ha), and Faugea (0.5 ha; 0.4 ha). Among these, nine islands—Fuafatu, Tepuka, Te-Afualiku, Paava, Tefala, Fualefeke, Teafuafou, Tutaga, and Faugea—are located along the western rim of Funafuti. These islands are predominantly composed of sand and generally have gentle coastal slopes. Such geomorphic characteristics increase their susceptibility to coastal forcing, particularly tropical cyclones and storm surges, which are assumed to be the primary drivers of the observed changes [37,51]. For example, Hisabayashi et al. [31] reported that significant changes in the shape and extent of vegetated areas were observed on the islands of Faugea, Tefala, and Vasafua (located on the western rim of Funafuti) as a result of Cyclone Pam, a Category 5 tropical cyclone that impacted the Pacific region between March 9 and 16, 2015. Conversely, the area changes observed along the eastern rim—particularly in the central part of Fongafale—are predominantly associated with land reclamation activities along the lagoon-facing coastline. Although detailed topographic characteristics of individual islands were not incorporated into this analysis, these assumptions align with previous studies on the morphological responses of low-lying reef islands [31,32,37,43]. Overall, the coastal changes that occurred in Funafuti between 2019 and 2023 are possibly influenced by the aforementioned factors; however, a comprehensive analysis that integrates tropical cyclone occurrence, temporal patterns, and coastal geomorphology is required to accurately determine the primary drivers of these changes.
In this study, satellite imagery acquired at sea levels ranging from 1.3 to 1.6 m was utilized, corresponding to mid- to low-tide conditions given the local tidal range of approximately 2.0 m. As all acquisitions occurred within a narrow tidal range (~0.3 m), the influence of tidal variability on coastline delineation was expected to be minimal. However, in gently sloping coastal zones—such as the sandy islands along the western rim of Funafuti—moderate differences in water level can produce visible shifts in coastline position. Therefore, future studies will focus on incorporating imagery captured across a broader range of tidal stages, and the approach will be enhanced by integrating other moderate- to high-resolution satellite data (e.g., Landsat 8/9, WorldView-2) and topographic data to identify the significant coastal changes. The inclusion of topographic data, such as digital elevation models, will enable more detailed, island-scale assessment of significant erosion or accretion patterns under diverse coastal environments.

5. Conclusions

This study depicts a coastline extraction approach by integrating SLIC-based superpixel segmentation with Gaussian adaptive thresholding, enabling the extraction of coastlines across multiple islands of the Funafuti atoll between 2019 and 2023. The extracted coastlines facilitated a short-term coastal change analysis of the islands of Funafuti. The results indicate that islands along the western rim of Funafuti—such as Tefala, Tefota, and Faugea—with sand-dominated coasts and gentle slopes, experienced a potentially significant alteration, whereas islands with steeper beach profiles (eastern rim of Funafuti), such as Fongafale, remained relatively stable. However, the lagoon-facing coastline of Fongafale exhibited a lagoonward shift (particularly in the middle part of Fongafale) due to land reclamation activities. In addition, the analysis reveals a transition from widespread erosion during 2019–2021 to ongoing changes in 2021–2022, followed by partial stabilization and localized accretion from 2022 to 2023, underscoring the spatial variability in coastal dynamics among the islands. The observed coastal changes are assumed to be driven by the impact of tropical cyclones and coastal flooding, which act as the primary driving forces for the study region. Future research will aim to incorporate potential drivers of coastal change, including topographic and digital elevation model data, to improve understanding of susceptibility to significant alterations, particularly islands characterized by sand-dominating and gentle coastal slopes.

Author Contributions

Conceptualization, S.J.K.C. and C.-S.Y.; methodology, S.J.K.C. and C.-S.Y.; software, S.J.K.C. and C.-S.Y.; validation, S.J.K.C. and C.-S.Y.; formal analysis, S.J.K.C. and C.-S.Y.; investigation, S.J.K.C. and C.-S.Y.; resources, S.J.K.C. and C.-S.Y.; data curation, S.J.K.C. and C.-S.Y.; writing—original draft preparation, S.J.K.C. and C.-S.Y.; writing—review and editing, C.-S.Y. and S.J.K.C.; visualization, S.J.K.C. and C.-S.Y.; supervision, C.-S.Y.; project administration, C.-S.Y.; funding acquisition, C.-S.Y. All authors have read and agreed to the published version of the manuscript.

Funding

This research was supported under the “Development of Decision Ready Tools to Support Coastal and Marine Spatial Planning” project funded by the Ministry of Foreign Affairs, Republic of Korea.

Data Availability Statement

The original contributions presented in this study are included in the article. Further inquiries can be directed to the corresponding author.

Conflicts of Interest

The authors declare no conflicts of interest.

References

  1. Small, C.; Nicholls, R.J. A global analysis of human settlement in coastal zones. J. Coast. Res. 2003, 19, 584–599. [Google Scholar]
  2. Minghelli, A.; Spagnoli, J.; Lei, M.; Chami, M.; Charmasson, S. Shoreline extraction from WorldView2 satellite data in the presence of foam pixels using multispectral classification method. Remote Sens. 2020, 12, 2664. [Google Scholar] [CrossRef]
  3. Saleem, A.; Awange, J.L. Coastline shift analysis in data deficient regions: Exploiting the high spatio-temporal resolution Sentinel-2 products. Catena 2019, 179, 6–19. [Google Scholar] [CrossRef]
  4. Dolan, R.; Fenster, M.S.; Holme, S.J. Temporal analysis of shoreline recession and accretion. J. Coast. Res. 1991, 7, 723–744. [Google Scholar]
  5. Wu, X.; Liu, C.; Wu, G. Spatial-temporal analysis and stability investigation of coastline changes: A case study in Shenzhen, China. IEEE J. Sel. Top. Appl. Earth Obs. Remote Sens. 2018, 11, 45–56. [Google Scholar] [CrossRef]
  6. Alesheikh, A.A.; Ghorbanali, A.; Nouri, N. Coastline change detection using remote sensing. Int. J. Environ. Sci. Technol. 2007, 4, 61–66. [Google Scholar] [CrossRef]
  7. Boak, E.H.; Turner, I.L. Shoreline definition and detection: A review. J. Coast. Res. 2005, 21, 688–703. [Google Scholar] [CrossRef]
  8. Viaña-Borja, S.P.; Ortega-Sánchez, M. Automatic methodology to detect the coastline from Landsat images with a new water index assessed on three different Spanish Mediterranean deltas. Remote Sens. 2019, 11, 2186. [Google Scholar] [CrossRef]
  9. Holland, K.T.; Holman, R.A. Field observations of beach cusps and swash motions. Mar. Geol. 1996, 134, 77–93. [Google Scholar] [CrossRef]
  10. Masselink, G.; Russell, P.; Coco, G.; Huntley, D. Test of edge wave forcing during formation of rhythmic beach morphology. J. Geophys. Res. Ocean. 2004, 109, C06003. [Google Scholar] [CrossRef]
  11. Tang, W.; Zhao, C.; Lin, J.; Jiao, C.; Zheng, G.; Zhu, J.; Pan, X.; Han, X. Improved spectral water index combined with Otsu algorithm to extract muddy coastline data. Water 2022, 14, 855. [Google Scholar] [CrossRef]
  12. El-Asmar, H.M.; White, K. Changes in coastal sediment transport processes due to construction of New Damietta Harbour, Nile Delta, Egypt. Coast. Eng. 2002, 46, 127–138. [Google Scholar] [CrossRef]
  13. Pardo-Pascual, J.E.; Almonacid-Caballer, J.; Ruiz, L.A.; Palomar-Vázquez, J. Automatic extraction of shorelines from Landsat TM and ETM+ multi-temporal images with sub-pixel precision. Remote Sens. Environ. 2012, 123, 1–11. [Google Scholar] [CrossRef]
  14. Modava, M.; Akbarizadeh, G.; Soroosh, M. Integration of Spectral Histogram and Level Set for Coastline Detection in SAR Images. IEEE Trans. Aerosp. Electron. Syst. 2019, 55, 810–819. [Google Scholar] [CrossRef]
  15. Liu, C.; Xiao, Y.; Yang, J. A coastline detection method in polarimetric SAR images mixing the region-based and edge-based active contour models. IEEE Trans. Geosci. Remote Sens. 2017, 55, 3735–3747. [Google Scholar] [CrossRef]
  16. Paravolidakis, V.; Ragia, L.; Moirogiorgou, K.; Zervakis, M. Automatic Coastline Extraction Using Edge Detection and Optimization Procedures. Geosciences 2018, 8, 407. [Google Scholar] [CrossRef]
  17. Kuleli, T.; Guneroglu, A.; Karsli, F.; Dihkan, M. Automatic detection of shoreline change on coastal Ramsar wetlands of Turkey. Ocean Eng. 2011, 38, 1141–1149. [Google Scholar] [CrossRef]
  18. Li, W.; Gong, P. Continuous monitoring of coastline dynamics in western Florida with a 30-year time series of Landsat imagery. Remote Sens. Environ. 2016, 179, 196–209. [Google Scholar] [CrossRef]
  19. Yu, K.; Hu, C.; Muller-karger, F.E. Shoreline changes in west-central Florida between 1987 and 2008. Int. J. Remote Sens. 2011, 32, 8299–8313. [Google Scholar] [CrossRef]
  20. Sarp, G.; Ozcelik, M. Water Body Extraction and Change Detection Using Time Series: A Case Study from Lake Burdur, Turkey. J. Taibah Univ. Sci. 2016, 3, 381–391. [Google Scholar] [CrossRef]
  21. Aguilar, F.J.; Fernandez-Luque, I.; Aguilar, M.A.; García-Lorca, A.; Viciana, A.R. The integration of multi-source remote sensing data for the modelling of shoreline change rates in a mediterranean coastal sector. Int. J. Remote Sens. 2019, 40, 1148–1174. [Google Scholar] [CrossRef]
  22. Hou, X.; Wu, T.; Hou, W.; Chen, Q.; Wang, Y.D.; Yu, L.J. Characteristics of coastline changes in mainland China since the early 1940s. Sci. China Earth Sci. 2016, 59, 1791–1802. [Google Scholar] [CrossRef]
  23. Fisher, A.; Flood, N.; Danaher, T. Comparing Landsat water index methods for automated water classification in eastern Australia. Remote Sens. Environ. 2016, 175, 167–182. [Google Scholar] [CrossRef]
  24. Chen, S.; Chen, L.; Liu, Q.; Li, X.; Tan, Q. Remote sensing and GIS-based integrated analysis of coastal changes and their environmental impacts in Lingding Bay, Pearl River Estuary, South China. Ocean Coast. Manag. 2005, 48, 65–83. [Google Scholar] [CrossRef]
  25. Ekercin, S. Coastline change assessment at the Aegean Sea coasts in Turkey using multitemporal Landsat imagery. J. Coast. Res. 2007, 23, 691–698. [Google Scholar] [CrossRef]
  26. Wang, X.; Liu, Y.; Ling, F.; Liu, Y.; Fang, F. Spatio-Temporal change detection of Ningbo coastline using Landsat time-series images during 1976–2015. ISPRS Int. J. Geo-Inf. 2017, 6, 68. [Google Scholar] [CrossRef]
  27. Vos, K.; Harley, M.D.; Splinter, K.D.; Simmons, J.A.; Turner, I.L. Sub-annual to multi-decadal shoreline variability from publicly available satellite imagery. Coast. Eng. 2019, 150, 160–174. [Google Scholar] [CrossRef]
  28. Abdelhady, H.U.; Troy, C.D.; Habib, A.; Manish, R. A Simple, Fully Automated Shoreline Detection Algorithm for High-Resolution Multi-Spectral Imagery. Remote Sens. 2022, 14, 557. [Google Scholar] [CrossRef]
  29. Bishop-Taylor, R.; Nanson, R.; Sagar, S.; Lymburner, L. Mapping Australia’s dynamic coastline at mean sea level using three decades of Landsat imagery. Remote Sens. Environ. 2021, 267, 112734. [Google Scholar] [CrossRef]
  30. Bergsma, E.W.J.; Klotz, A.N.; Artigues, S.; Graffin, M.; Prenowitz, A.; Devit, J.-M.; Almar, R. Shoreliner: A sub-pixel coastal waterline extraction pipeline for multi-spectral satellite optical imagery. Remote Sens. 2024, 16, 2795. [Google Scholar] [CrossRef]
  31. Hisabayashi, M.; Rogan, J.; Elmes, A. Quantifying shoreline change in Funafuti Atoll, Tuvalu using a time series of Quickbird, Worldview and Landsat data. GISci. Remote Sens. 2018, 55, 307–330. [Google Scholar] [CrossRef]
  32. Harun-Al-Rashid, A.; Yang, C.-S. A review on multidecadal coastline changes at Funafuti, Tuvalu from 1897 to 2015. Korean J. Remote Sens. 2023, 39, 23–45. [Google Scholar]
  33. Siose, T.K.; Guinto, D.F.; Kader, M.A. Organic amendments increased sweetpotato (Ipomoea batatas L.) yield in a calcareous sandy soil of Samoa. S. Pac. J. Nat. Appl. Sci. 2018, 36, 36–45. [Google Scholar] [CrossRef]
  34. Ceccarelli, D.M. Tuvalu. In World Seas: An Environmental Evaluation; Academic Press: Cambridge, MA, USA, 2019; pp. 699–711. [Google Scholar]
  35. Aedla, R.; Dwarakish, G.S.; Reddy, D.V. Automatic shoreline detection and change detection analysis of Netravati-Gurpur River mouth using histogram equalization and adaptive thresholding techniques. Aquat. Procedia 2015, 4, 563–570. [Google Scholar] [CrossRef]
  36. Achanta, R.; Shaji, A.; Smith, K.; Lucchi, A.; Fua, P.; Süsstrunk, S. SLIC superpixels compared to state-of-the-art superpixel methods. IEEE Trans. Pattern Anal. Mach. Intell. 2012, 34, 2274–2282. [Google Scholar] [CrossRef]
  37. Kench, P.S.; Chan, J.; Owen, S.D.; McLean, R.F. The geomorphology, development and temporal dynamics of Tepuka Island, Funafuti atoll, Tuvalu. Geomorphology 2014, 222, 46–58. [Google Scholar] [CrossRef]
  38. Wandres, M.; Espejo, A.; Damlamian, H. Wave climate variability and trends in Tuvalu based on a 44-year high-resolution wave hindcast. J. Geophys. Res. Ocean. 2023, 128, e2022JC019523. [Google Scholar] [CrossRef]
  39. Chowdhury, S.J.K.; Yang, C.-S. Long-term analysis of tropical cyclones in the southwest Pacific and influences on Tuvalu from 2000 to 2021. Korean J. Remote Sens. 2023, 39, 441–458. [Google Scholar]
  40. Tuvalu-Funafuti. 2019 Tide Prediction Calendars, Climate and Oceans Support Program in the Pacific. Available online: https://oceanportal.spc.int/portal/library/assets/Tuvalu.Funafuti.2019.Tide.Calendar.Work.Plan.pdf (accessed on 10 July 2025).
  41. Caldwell, P.C.; Merrifield, M.A.; Thompson, P.R. Sea Level Measured by Tide Gauges from Global Oceans—The Joint Archive for Sea Level Holdings (NCEI Accession 0019568), Version 5.5, NOAA National Centers for Environmental Information, 2015, Dataset. Available online: https://www.ncei.noaa.gov/access/metadata/landing-page/bin/iso?id=gov.noaa.nodc:JIMAR-JASL (accessed on 10 April 2025).
  42. Ford, M. Shoreline changes interpreted from multi-temporal aerial photographs and high resolution satellite images: Wotje Atoll, Marshall Islands. Remote Sens. Environ. 2013, 135, 130–140. [Google Scholar] [CrossRef]
  43. Webb, A.P.; Kench, P.S. The dynamic response of reef islands to sea-level rise: Evidence from multi-decadal analysis of island change in the central Pacific. Glob. Planet. Change 2010, 72, 234–246. [Google Scholar] [CrossRef]
  44. Bhandari, A.K.; Kumar, A.; Singh, G.K. Feature extraction using Normalized Difference Vegetation Index (NDVI): A case study of Jabalpur city. Proc. Technol. 2012, 6, 612–621. [Google Scholar] [CrossRef]
  45. Blaschke, T. Object based image analysis for remote sensing. ISPRS J. Photogramm. Remote Sens. 2010, 65, 2–16. [Google Scholar] [CrossRef]
  46. Bishop-Taylor, R.; Sagar, S.; Lymburner, L.; Alam, I.; Sixsmith, J. Sub-pixel waterline extraction: Characterising accuracy and sensitivity to indices and spectra. Remote Sens. 2019, 11, 2984. [Google Scholar] [CrossRef]
  47. Lee, I.-C. Instantaneous shoreline mapping from WorldView-2 satellite images by using shadow analysis and spectrum matching techniques. J. Mar. Sci. Technol. 2016, 24, 18. [Google Scholar]
  48. Ganic, E. Groundbreaking Ceremony in Funafuti for Tuvalu’s Coastal Adaptation. 2022. Available online: https://www.dredgingtoday.com/2022/12/07/groundbreaking-ceremony-in-funafuti-for-tuvalus-coastal-adaptation/ (accessed on 23 July 2025).
  49. Turner, N. Groundbreaking Ceremony Marks New Chapter in Tuvalu’s Climate Resilience Journey. 2024. Available online: https://reliefweb.int/report/tuvalu/groundbreaking-ceremony-marks-new-chapter-tuvalus-climate-resilience-journey (accessed on 23 July 2025).
  50. McLean, R.F.; Hosking, P.L. Geomorphology of reef islands and atoll motu in Tuvalu. S. Pac. J. Nat. Sci. 1991, 11, 167–189. [Google Scholar]
  51. UNDRR 2022. Disaster Risk Reduction in Tuvalu: Status Report 2022, United Nations Office for Disaster Risk Reduction (UNDRR), Sub-Regional Office for the Pacific. Available online: https://www.undrr.org/publication/disaster-risk-reduction-tuvalu-status-report-2022 (accessed on 10 July 2025).
Figure 1. Location of the study area. (i) Tuvalu in the world map. (ii) Islands of Tuvalu; the black rectangle box represents the coverage of the Sentinel-2 image. (iii) True RGB composite image (Sentinel-2) of Funafuti atoll and its islands: (a) Fualefeke, (b) Mulitefla, (c) Amatuku, (d) Fongafale, (e) Fatato, (f) Funagongo, (g) Funamanu, (h) Falefatu, (i) Metiko, (j) Luamotu, (k) Funafala, (l) Tefota, (m) Telele-Motusanapa, (n) Motuloa, (o) Teafuafou, (p) Avalau, (q) Tegasu, (r) Tutaga, (s) Falaoigo, (t) Tefala, (u) Faugea, (v) Fuafatu, (w) Fualopa, (x) Tepuka, (y) Te-Afualiku, and (z) Paava. Islands b–n are situated along the eastern rim, and islands a, o–z are situated along the western rim of Funafuti. The yellow point indicates the location of the tide gauge.
Remotesensing 17 02794 g001
Figure 2. Schematic flowchart of the coastline extraction process and change analysis. A and B indicate the threshold value.
Remotesensing 17 02794 g002
Figure 3. Illustration of different steps of the coastline extraction and change analysis. (a) Sentinel-2 image (false RGB composite); (b) Superpixel segmentation; (c) Candidate superpixels; (d) Selected superpixels; (e) Binarized image (extracted NDVI region and then adaptive thresholding); (f) Contour extraction; (g) Coastline smoothing; (h) Change analysis (red area: erosion; yellow area: accretion).
Remotesensing 17 02794 g003
Figure 4. The overall coastline extraction results between 2019 and 2023 for the different islands (enlarged) of Funafuti atoll.
Remotesensing 17 02794 g004aRemotesensing 17 02794 g004b
Figure 5. Temporal variation in island area (enclosed by the extracted coastline boundary) within Funafuti over the period 2019 and 2023. A broken Y-axis is used to enhance the visualization of smaller islands relative to larger Fongafale.
Remotesensing 17 02794 g005
Table 1. Description of Sentinel-2 data and sea level information used in this study.
Acquisition Time (Sentinel-2)Tile NumberInterpolated
Sea Level
(m)
Location of
Tide Gauge
DateUTC
2019.11.2322:28:01T60LYR1.4−8.502, 179.195
2020.10.0322:27:591.6
2021.11.1222:27:591.5
2022.11.1722:28:011.6
2023.09.2822:27:591.3
Table 2. Description of the total no. of transects used to estimate the Mean Absolute Error (MAE) for the different islands of Funafuti.
IslandsTotal No. of TransectsMAE (m)
Amatuku10366.27
Falefatu12075.43
Fuafatu5175.21
Fongafale127617.32
Metiko8943.38
Tefota2054.94
Luamoto, Funafala34604.04
Mulitefla3555.73
Falaoigo3585.16
Tepuka7324.46
Fualopa4746.01
Funagongo14045.29
Fatato9936.52
Te-Afualiku2324.88
Paava3494.66
Telele-Motusanapa, Motuloa31125.79
Funamanu8086.39
Tefala2743.32
Fualefeke6886.31
Teafuafou, Avalau, Tegasu13548.35
Tutaga3113.81
Faugea3337.34
Table 3. Description of the extracted coastline length for the different islands of Funafuti from the year 2019 to 2023.
IslandsLength of Coastline (km) in Different YearsChange Rate (%)
20192020202120222023
Amatuku2.102.132.122.212.08−0.6
Falefatu2.442.412.432.432.40−1.9
Fuafatu0.991.00.980.960.95−4.1
Fongafale25.4225.3925.5125.4925.560.5
Metiko1.861.831.811.791.79−3.6
Tefota0.470.450.440.430.42−11.3
Luamoto, Funafala6.956.956.96.906.87−1.09
Mulitefla0.760.720.690.700.70−6.7
Falaoigo0.780.760.730.720.72−7.1
Tepuka1.451.451.391.401.42−2.2
Fualopa0.810.870.950.930.79−0.9
Funagongo2.812.782.762.772.76−1.5
Fatato2.052.032.022.022.02−1.3
Te-Afualiku0.510.470.440.460.46−8.8
Paava0.770.740.700.700.70−8.6
Telele-Motusanapa, Motuloa6.146.106.206.206.150.14
Funamanu1.661.651.621.611.61−3.01
Tefala0.580.550.510.500.50−13.5
Fualefeke1.491.451.361.361.38−7.2
Teafuafou, Avalau, Tegasu2.842.832.752.732.71−4.6
Tutaga0.640.620.600.600.59−6.4
Faugea0.640.640.610.610.61−4.08
Table 4. Changes in the coastal area of different islands of Funafuti in hectares and in percentage from 2019 to 2020.
IslandArea in 2019 (ha)Area in 2020 (ha)ErosionAccretion
(ha)(%)(ha)(%)
Amatuku10.5210.390.696.50.555.3
Falefatu12.8212.880.413.20.483.7
Fuafatu5.585.390.386.80.193.6
Fongafale214.27213.534.151.93.421.6
Metiko8.387.820.657.70.091.1
Tefota1.361.250.118.60.0060.4
Luamoto, Funafala40.5540.051.483.60.982.4
Mulitefla4.263.780.5011.80.020.5
Falaoigo4.444.140.327.30.030.7
Tepuka12.4512.440.342.70.332.6
Fualopa3.483.770.092.60.3810.1
Funagongo16.8916.660.653.80.422.5
Fatato9.078.650.545.90.111.3
Te-Afualiku1.691.480.2112.80.010.7
Paava4.013.620.4010.10.010.3
Telele-Motusanapa, Motuloa26.9925.371.294.70.030.1
Funamanu7.227.070.223.10.071.1
Tefala2.542.300.2510.10.020.9
Fualefeke10.239.920.504.90.191.9
Teafuafou, Avalau, Tegasu26.6926.191.3650.491.8
Tutaga3.153.030.175.40.051.7
Faugea2.802.620.248.60.052.2
Table 5. Changes in the coastal area of different islands of Funafuti in hectares and in percentage from 2020 to 2021.
IslandArea in 2020 (ha)Area in 2021 (ha)ErosionAccretion
(ha)(%)(ha)(%)
Amatuku10.399.351.3312.80.303.2
Falefatu12.8812.330.584.50.030.2
Fuafatu5.395.030.5410.10.183.7
Fongafale213.53210.924.842.22.231.1
Metiko7.827.440.405.10.020.2
Tefota1.251.160.108.1-0
Luamoto, Funafala40.0538.422.285.70.651.6
Mulitefla3.783.540.328.70.092.7
Falaoigo4.143.810.327.80.0010.03
Tepuka12.4411.291.159.2-0
Fualopa3.773.220.7118.90.165.1
Funagongo16.6616.210.543.20.090.6
Fatato8.658.370.354.10.081
Te-Afualiku1.481.290.2215.20.032.6
Paava3.623.300.4412.40.134
Telele-Motusanapa, Motuloa25.3724.751.576.10.120.5
Funamanu7.076.770.395.60.091.3
Tefala2.301.940.3615.6-0
Fualefeke9.928.251.7717.80.091.1
Teafuafou, Avalau, Tegasu26.1924.021.395.30.050.2
Tutaga3.032.800.237.60.0060.2
Faugea2.622.310.3413.10.031.5
Table 6. Changes in the coastal area of different islands of Funafuti in hectares and in percentage from 2021 to 2022.
IslandArea in 2021 (ha)Area in 2022 (ha)ErosionAccretion
(ha)(%)(ha)(%)
Amatuku9.359.681.1512.31.4815.3
Falefatu12.3311.930.564.50.151.3
Fuafatu5.034.850.326.40.143.1
Fongafale210.92208.703.611.71.380.6
Metiko7.447.180.344.60.091.3
Tefota1.161.11-00.022.6
Luamoto, Funafala38.4236.562.115.50.260.7
Mulitefla3.543.630.154.20.236.4
Falaoigo3.813.670.154.10.0090.2
Tepuka11.2911.310.282.40.302.6
Fualopa3.223.190.6720.90.6420.1
Funagongo16.2115.970.342.10.100.6
Fatato8.378.270.161.90.060.8
Te-Afualiku1.291.330.097.60.1310.4
Paava3.303.120.3510.60.175.5
Telele-Motusanapa, Motuloa24.7523.891.104.40.251.1
Funamanu6.776.700.172.50.101.5
Tefala1.941.820.147.30.021.2
Fualefeke8.258.400.546.50.698.2
Teafuafou, Avalau, Tegasu24.0223.310.783.20.070.3
Tutaga2.802.740.083.10.020.8
Faugea2.312.300.052.20.042.1
Table 7. Changes in the coastal area of different islands of Funafuti in hectares and in percentage from 2022 to 2023.
IslandArea in 2022 (ha)Area in 2023 (ha)ErosionAccretion
(ha)(%)(ha)(%)
Amatuku9.689.610.434.40.363.7
Falefatu11.9311.730.282.30.090.7
Fuafatu4.854.860.112.40.122.6
Fongafale208.70212.162.221.15.682.6
Metiko7.187.030.192.70.040.6
Tefota1.111.040.087.80.022.4
Luamoto, Funafala36.5635.971.213.30.611.7
Mulitefla3.633.660.144.10.185.1
Falaoigo3.673.730.041.10.102.7
Tepuka11.3111.380.272.30.343.1
Fualopa3.193.360.3912.30.5616.8
Funagongo15.9715.790.392.40.201.3
Fatato8.278.140.172.10.040.5
Te-Afualiku1.331.430.043.30.149.8
Paava3.123.270.123.90.278.3
Telele-Motusanapa, Motuloa23.8923.610.803.30.512.1
Funamanu6.706.490.253.70.040.6
Tefala1.821.900.031.70.105.6
Fualefeke8.408.550.364.30.526.1
Teafuafou, Avalau, Tegasu23.3122.940.492.10.110.5
Tutaga2.742.740.051.80.051.9
Faugea2.302.230.156.70.083.8
Disclaimer/Publisher’s Note: The statements, opinions and data contained in all publications are solely those of the individual author(s) and contributor(s) and not of MDPI and/or the editor(s). MDPI and/or the editor(s) disclaim responsibility for any injury to people or property resulting from any ideas, methods, instructions or products referred to in the content.