Article

Using Multitask Machine Learning to Type Clouds and Aerosols from Space-Based Photon-Counting Lidar Measurements

1
Department of Physics & Astronomy, University of Iowa, Iowa City, IA 52242, USA
2
Science Systems and Applications, Inc., Lanham, MD 20706, USA
3
Department of Chemical and Biochemical Engineering, University of Iowa, Iowa City, IA 52242, USA
*
Author to whom correspondence should be addressed.
Remote Sens. 2025, 17(16), 2787; https://doi.org/10.3390/rs17162787
Submission received: 2 July 2025 / Revised: 6 August 2025 / Accepted: 9 August 2025 / Published: 12 August 2025

Abstract

Space-based, photon-counting lidar instruments are effective tools for observing cloud and aerosol layers in the atmosphere. Cloud phases and several different kinds of aerosols are presently identified and typed using sophisticated, fine-tuned classification algorithms that operate using processed lidar data. We present a deep neural network semantic segmentation model that was trained using raw, uncalibrated photon count data and data products from the Cloud/Aerosol Transport System’s (CATS) 1064 nm lidar. Our approach successfully types layers in complex scenes using only raw photon counts, bin altitudes, and ground surface type at 14 to 171 times the spatial resolution of the CATS operational data product. We observe comparable cloud detection and phase determination to the CATS operational algorithm while also exhibiting a 15-point improvement in finding tenuous aerosol layers. Because the model is lightweight, does not rely upon ancillary information, and is optimized to leverage GPU computing, it has the potential to be deployed on-instrument to perform cloud and aerosol typing in real time.

1. Introduction

Space-based lidar instruments are a powerful way to provide vertically resolved atmospheric measurements, e.g., Cloud–Aerosol Lidar and Infrared Pathfinder Satellite Observation (CALIPSO; [1]) or Ice, Cloud, and Land Elevation Satellite-2 (ICESat-2; [2]). From laser pulse time-of-flight and polarized backscatter information, these instruments observe the Earth’s atmosphere and provide measurements for the identification and classification of layers of material (e.g., clouds, smoke, dust, etc.). In comparison with airborne lidars, an instrument in orbit is capable of operating continuously, and in comparison with ground-based lidars, a space-based lidar in an inclined orbit provides a fine spatial sampling of large swaths of the atmosphere. Continuous observation over years of operation results in rich datasets that are important inputs for climate forecasting models. For example, recent work shows the importance of understanding the distribution and type of aerosolized material from wildfire [3] and volcanic [4] events to determine their impact on regional and global climate.
One way to increase the usefulness of space-based lidars is to improve or develop new ways to interpret their measurements. Identifying atmospheric features and subsequently classifying their composition (referred to as typing) initially involves a thresholding algorithm; put simply, backscatter signal above some threshold defines a layer and below the threshold defines no layer [5,6]. This strategy is largely reliant upon the signal-to-noise ratio (SNR) of the data. During the processing of nighttime observations, it is rare to find SNR that renders the traditional thresholding strategy inadequate. In daytime, however, observations are plagued by strong solar background contamination. Horizontal averaging to a coarser spatial resolution achieves an adequate SNR in most cases, but it comes at the expense of resolution. Relatively poor daytime SNR also limits the ability to identify and classify tenuous layers in the atmosphere that are buried in noise, which is especially true for aerosol layers [7]. Thus, it is desirable to develop improved methodology to increase the spatial resolution and fidelity of space-based lidar data products.
We focus here on the archive of data collected by the Cloud–Aerosol Transport System (CATS) [8] which was deployed on the International Space Station (ISS) between 10 February 2015 and 30 October 2017. CATS was based on the Cloud Physics Lidar (CPL) instrument [9] and Airborne Cloud–Aerosol Transport System (ACATS) [10]. During its lifetime, CATS primarily operated in Mode 7.2, in which it acquired backscatter profiles and depolarization measurements at 1064 nm wavelength [11]. The 51° orbital inclination angle of the ISS provided diurnally varying measurements of clouds and aerosols throughout its 33 months of operation. In earlier research, Yorks et al. [12] used U-Net to perform cloud–aerosol discrimination (CAD) by deep-learning-based image semantic segmentation [13] using the Level Zero (L0) CATS data [6]—averaged to the L2 resolution (5 km). More recent work by Selmer et al. [14] has demonstrated the application of image denoising [15] using a trained Dense-Dense U-Net model to CATS data and has shown that, when analyzed using the CATS operational algorithm [16], the traditional processing of denoised data resulted in cloud–aerosol discrimination with higher spatial resolution and more complete layer identification than the CATS operational algorithm is capable of producing on its own.
Here, we present an approach for performing cloud and aerosol identification and typing using deep-learning-based image semantic segmentation. We implement a convolutional neural network (CNN) to process raw, uncalibrated photon counts at native horizontal resolution without denoising. In a recent publication analyzing ICESat-2 data, we found that a multitask learning approach is more effective than performing layer finding and CAD simultaneously [17]. In this work, we differ from [12,17] by training a neural network that uses uncalibrated photon count data at native resolution to perform cloud and aerosol typing. We apply a modified multitask learning technique to layer finding, CAD, cloud phase typing, and aerosol typing prediction. We validate our approach using simulated CATS ground truth data and show that the CNN meaningfully outperforms the current operational algorithm in layer detection and CAD. When applied to independently selected test case studies, we observe overall good agreement between cloud and aerosol typing as performed by the CNN and the CATS operational algorithm, and note some current limitations of our method and areas for improvement. We demonstrate the ability of a deep learning model to circumvent the calibration pipeline and produce high fidelity cloud and aerosol typing using minimally processed data. Our typing technique minimizes reliance upon ancillary data, like forecasts [18] and atmosphere models [19] that some lidar data analyses require. We posit a machine learning strategy that operates on raw data at native resolution that can be deployed to analyze lidar data as it is being acquired [20].

2. Methods

2.1. CATS Data Products

CATS is an elastic backscatter lidar on board the ISS, which was in near-continuous operation between 10 February 2015 and 30 October 2017. During its lifetime, CATS primarily operated in mode 7.2, which featured a single field of view, backscatter profiles at 1064 nm, and depolarization measurements at 1064 nm. The nominal laser power output is about 2 mJ per pulse with a 4 kHz repetition rate [16]. The CATS atmospheric profiles contained within the Level 0 (L0) data product consist of binned photon returns in 78 m vertical sampling intervals along a 37.5 km vertical column. The profiles are downlinked after summing 200 shots on board, resulting in temporal sampling at 20 Hz, or ∼350 m along-track horizontal resolution.
The CATS Level 1 (L1) data products contain the raw CATS signal after geolocation, range correction, dead time correction, and normalization to laser energy, producing the normalized relative backscatter (NRB). The signal is then calibrated using the molecular profile derived from Modern-Era Retrospective analysis for Research and Applications, Version 2 (MERRA-2) meteorological reanalysis data. CATS Level 1B (L1B) report quantities such as calibrated attenuated backscatter γ and volume depolarization ratio δ . For Level 2 (L2O) operational data products, aerosol and cloud layers are detected, optical properties are determined, and typing of cloud and aerosol layers is performed. Typed layers are provided as vertical feature masks at 5 km resolution in the L2O data product.

2.2. CATS Operational Algorithm

The CATS operational data products and algorithms are described in detail in its algorithm theoretical basis document (ATBD) [16] and updated in the Version 3.00 release notes [21]. The CATS layer detection and CAD algorithms have been described previously in Yorks et al. [12] and details on the aerosol typing algorithm can be found in Nowottnick et al. [22]. Here, we summarize the important details of the operational algorithm relevant to our later discussion.
The CATS L2O layer detection algorithm follows the methodology outlined in the CALIPSO processing algorithms [5,23]. In contrast with CALIPSO, the CATS L2O algorithm uses the 1064 nm attenuated scattering ratio and volume depolarization ratio to perform layer detection. CATS also uses horizontal averaging from its native 350 m resolution to 5 km horizontal resolution before layer detection. A second pass averaged to 60 km is also conducted, and additional layers discovered are mapped onto the result from the 5 km pass.
The CATS L2O CAD algorithm is a multidimensional probability density function (PDF) technique similar to the technique used by CALIPSO [5,23]. The CATS L2O CAD vertical feature mask includes five classes: clear sky, cloud, undetermined, aerosol, and attenuated. In order to classify a layer, first, the per-layer data products such as layer-integrated attenuated backscatter ( γ ) at 1064 nm, the layer-integrated volume depolarization ratio ( δ ) at 1064 nm, the layer thickness, and the mid-layer altitude are calculated. Additionally, the mid-layer temperature, T mid , is retrieved from NASA Goddard Earth Observing System version 5 (GEOS-5) forecasts [18]. Simple thresholding tests are performed to determine cloud layers with high confidence; otherwise, per-layer attributes are input into the PDF functions for cloud–aerosol discrimination. The PDFs for cloud and aerosol layers were developed based on statistics of cloud and aerosol properties derived from measurements obtained during CPL field campaigns [24]. The PDF CAD technique assigns a score between −10 and 10, where layers scoring greater than zero are assigned as cloud, layers scoring lower than zero are assigned as aerosol, and layers scoring zero are assigned as undetermined. The attenuated class occurs where the signal below an identified layer is too weak to use. This commonly occurs below fully attenuating clouds, for example.
The CATS L2O CAD algorithm does require some manual intervention to correct for biases [16]. The CAD algorithm requires that any layer with a base altitude above 18 km is classified as an aerosol, and layers above 10 km with layer-integrated attenuated backscatters γ < 0.01 sr 1 and layer-integrated depolarization ratios δ < 0.25 are also classed as aerosols. The CATS L2O algorithm types cloud layers as either water cloud or ice cloud. Reliably identifying mixed-phase clouds can be challenging, e.g., [25], since there are a myriad of ice habits that make the depolarization signature of mixed ice and liquid water ambiguous. Cloud layers with mid-layer temperatures T mid greater than 0 °C are classed as water clouds. Cloud layers with mid-layer temperatures T mid below −20 °C are classed as ice clouds. The remaining cloud layers are typed using a cloud phase score using PDFs derived from CPL data described elsewhere [12,16,21].
The CATS L2O aerosol-typing algorithm is based upon the V3 CALIPSO aerosol-typing algorithm [26], with the important distinction that primary CATS measurement inputs to the typing algorithm are at 1064 nm as described by Nowottnick et al. [22] in detail. Of the eight potential aerosol type classes, one is not present in mode 7.2 data, since the marine mixture class requires calculating the spectral depolarization ratio fraction (the ratio of the layer-integrated depolarization at 1064 nm to layer-integrated depolarization at 532 nm). Aerosol layers that exist above 10 km are typed as the Upper-Troposphere-Lower-Stratosphere (UTLS) class. Many high-altitude features of the atmosphere can be weakly backscattering and depolarizing, which leaves their specific kind ambiguous. Next, an aerosol layer is typed as dust if the layer-integrated depolarization ratio δ > 0.25 . An aerosol layer is typed as dust mixture if 0.15 < δ < 0.25 . With depolarization ratios below 0.15, we type aerosol layers as clean background if the layer-integrated backscatter is weak ( γ < 0.0005 sr 1 ). At larger values of layer-integrated backscatter, we begin typing the polluted continental and smoke classes. The typing of polluted continental and smoke classes rely on simulated molecular-aerosol information from the NASA GEOS-5 MERRA-2 reanalysis [19,27,28]. If there are sulfates present, the aerosol layer is classed as polluted continental. If not, and there are carbonaceous species present, the aerosol layer is classed as smoke. Otherwise, the aerosol layer is classed as smoke if the layer does not extend to ground level. We note here that typing polluted continental aerosol layers requires either ancillary data from MERRA-2, or from the spectral depolarization ratio fraction available in mode 7.1. Finally, if the aerosol layer is not elevated and is present over water, the layer is classed as marine.

2.3. CNN Multitask Learning Approach

Our approach to CATS layer detection, CAD, and layer typing is based on a fully convolutional neural network (CNN) trained end-to-end for pixel-wise semantic segmentation [29]. A standard U-Net CNN was selected for training [30]. We initially approached layer detection and typing as a multiclass learning problem, following the procedure described in Yorks et al. [12] and replacing cloud and aerosol labels by their respective type labels. Our preliminary observations concluded that, while functional, this strategy resulted in models with high accuracy for layer detection and cloud–aerosol discrimination but lower accuracy for layer typing. We addressed this issue by implementing a multitask learning strategy. Multitask learning, in general, allows a network to optimize more than one loss function at the same time [31].
In our multitask learning approach, we structure cloud–aerosol typing into four separate tasks: layer detection, cloud–aerosol discrimination, cloud phase typing, and aerosol typing. For each vertical bin in each atmospheric profile, we predict as a first task whether there is a layer present in that bin or not, as a second task whether that bin contains cloud or aerosol, as a third task whether that bin contains ice cloud or water cloud, and as a fourth task whether that bin contains one of seven observed aerosol types. Each task is predicted by a shared CNN model backbone, and the training loss function is the equally weighted loss of all four tasks. The predicted vertical feature mask is then assembled in post-processing. Each vertical bin is assigned layer or no layer based on the layer detection prediction. If the vertical bin is assigned layer, we assign cloud or aerosol based on the cloud–aerosol discrimination prediction. If the vertical bin is assigned cloud, we assign ice cloud or water cloud based on the cloud phase typing prediction, and if the vertical bin is assigned aerosol, we assign one of seven aerosol types based on the aerosol typing prediction.

2.4. Dataset Preparation

For training data, we selected CATS data from October of 2017. A full month of continuous observation from the orbit of the ISS allowed CATS to scan many regions of Earth’s surface, which exposes our model to a wide range of scenes. The input to the CNN model is comprised of atmospheric profiles arranged like an image. The vertical bins are treated as individual pixels with assigned attributes representing the input channels to the CNN. Each vertical bin within each atmospheric profile is assigned three attributes: bin altitude, profile land surface type, and photon count returns. The profile land surface type is retrieved from the CATS L1B record (originally from the Clouds and the Earth’s Radiant Energy System’s International Geosphere–Biosphere Programme land classification map [32]) and the photon count data is retrieved from the CATS L0 record with some preprocessing.
To match the vertical resolution of the CATS data product, we rebin the L0 photon count data from 78 m to 60 m vertical sampling using the same count conserving method as the operational algorithm. We calculate the percent overlap in vertical extent between the coarser, 78 m vertical bins of the L0 data and the finer 60 m bins. Assuming the photons collected in the 78 m bins are homogeneously distributed, the percent spatial overlap of the bins corresponds to the percentage of photons to distribute from the coarse grid bins to the finer grid bins. Then, the per-profile surface height from the CloudSat digital elevation model (DEM) is retrieved from the CATS L2O record. The solar background of each profile is estimated by averaging the photon counts per bin below ground level and subtracted from the photon count data. Vertical bins that occur at ground level and below are reassigned photon count return of zero after background subtraction. Processed photon count return data are clipped to a maximum of 250 counts per bin. Finally, the mean and standard deviation of each input attribute are computed across the training set population. These values are used to apply a standardization transform to all data inputs.
The vertical feature mask (VFM), including cloud phase and aerosol types, are obtained from the CATS L2O record at the original 5 km horizontal resolution. We expand the VFM to match the native 350 m horizontal resolution of the CATS L0 product by assigning each L0 profile a corresponding L2O VFM based on the start, median, and end times of the L2O averaged profiles. Separate labels for each pixel are obtained from the expanded VFM: the layer detection label (layer detected or no layer detected), the cloud–aerosol discrimination label (cloud detected or aerosol detected), the cloud phase label (ice cloud detected or water cloud detected), and the aerosol type label (one of seven aerosol types detected). Vertical bins where no layer is detected by the CATS L2O algorithm or where the layer is indeterminate or fully attenuated are assigned a dummy cloud–aerosol discrimination label. Vertical bins where no cloud is detected by the CATS L2O algorithm are assigned a dummy cloud phase typing label. Vertical bins where no aerosol is detected by the CATS L2O algorithm are assigned a dummy aerosol typing label. The dummy labels are used to exclude those vertical bins from the respective loss function calculation at train time. The training dataset is prepared by a random image cropping operation that produces 32 image patches, each 256 × 256 pixels, per data record, where we require each selected patch contains at least one layer detected vertical bin. The quantity of each class in the training data after cropping is presented in Table 1.

2.5. Model Optimization and Evaluation

The Generalized Dice Loss originally proposed by Sudre et al. [33] is used to optimize the multitask CNN model. This loss function was chosen as it is suitable for both binary and multiclass segmentation model training in the presence of class-imbalanced training data. The loss function, calculated separately for each task, takes the form
Dice = 1 2 c w c n p c n y c n c w c n p c n + y c n ,
where p { p c n } [ 0 , 1 ] is the CNN output, a continuous variable representing the normalized probability for class c in the n-th pixel, and  y { y c n } are the corresponding one-hot encoded ground truth labels. Value y c n is equal to one if class c is the ground truth label of pixel n, else zero. The summation over n runs pixel-wise, the summation over c runs over all classes predicted for a particular task, and  w c may be used for class-based importance weighting in loss calculation. In this work, we weight each class equally. During training, the loss function for each task over each training batch are calculated separately and summed to give the total loss for optimization.
We evaluate model cloud–aerosol discrimination performance by calculating several accuracy metrics such as precision, recall, and F1 score:
precision = T P T P + F P ,
recall = T P T P + F N ,
F 1 = 2 precision · recall precision + recall ,
where T P , F P , F N , and  T N are the true positive, false positive, false negative, and true negative classifications, respectively. The precision measures the quality of class prediction as the ratio between the total number of true positive predictions and the sum of the true positive and false positive predictions. The recall measures the ability of the model to identify all instances of a particular class within a dataset as the ratio between the total number of true positive predictions and the sum of the true positive and false negative predictions. We report class support which is the number of examples of the class in the ground truth dataset. We calculate the accuracy metrics for each data class (cloud, aerosol, and no layer detected) individually with a one-vs-rest approach.

2.6. Implementation Details

The U-Net CNN model is built and trained using the Pytorch deep learning library [34]. We use 32 feature maps at the initial U-Net encoding step; the number of feature maps is doubled after each encoding step, and halved following each decoding step. The CNN depth, or number of convolutional layers present in the U-Net encoder network, is set to 6. The CNN model is trained with the Adam optimizer [35] with a learning rate of 2 × 10 4 , for a total of 200 epochs. The evaluation of the layer detection F1 score on the training validation data is performed once per training epoch in order to select the final model parameters by validation early stopping. We observed some variability in results when changing the random seed, most likely due to random training and validation data splitting at train time. For reproducibility, we manually set the seed (2222222) for all random number generators used in this work.

3. Results and Discussion

3.1. Layer Detection and CAD

We first compare the performance of our CNN against the CATS L2O CAD algorithm through the use of simulated ground truth data. The lidar simulator first reported by Nowottnick et al. [36] is used to construct simulated CATS L0 granules based on airborne CPL data. We selected three CPL 1064 nm scenes based on their high-quality data and reliable CAD predictions. The simulator operates under the assumption that the particulate extinction retrieved from CPL is true. Then, by applying CATS instrument parameters, the lidar Equation [37] is used to simulate the photon count returns from an identical scene as viewed by the CATS instrument. We determine the molecular component of the simulated returns using a model atmosphere, and model the detector noise and background by injecting reasonable Poisson noise for each. The CAD, as determined from the original CPL data using the CPL operational algorithm, is used as the simulated ground truth label [24]. The simulated CATS photon counts are processed by both the CATS L2O CAD algorithm as well as the CNN, which allows for straightforward comparison. In Figure 1, we demonstrate the results of one such simulation based on data collected by CPL on 18 August 2015. The granule shown in Figure 1 exhibits planetary boundary layer aerosol, which is evident in the photon count return in panel (A) and uncovered in the ground truth feature mask in panel (B). Panel (C) shows the operational algorithm CAD VFM and panel (D) shows the neural network CAD VFM. Operating at the native 350 m horizontal resolution reveals more detail in neural network’s CAD in comparison to the operational algorithm.
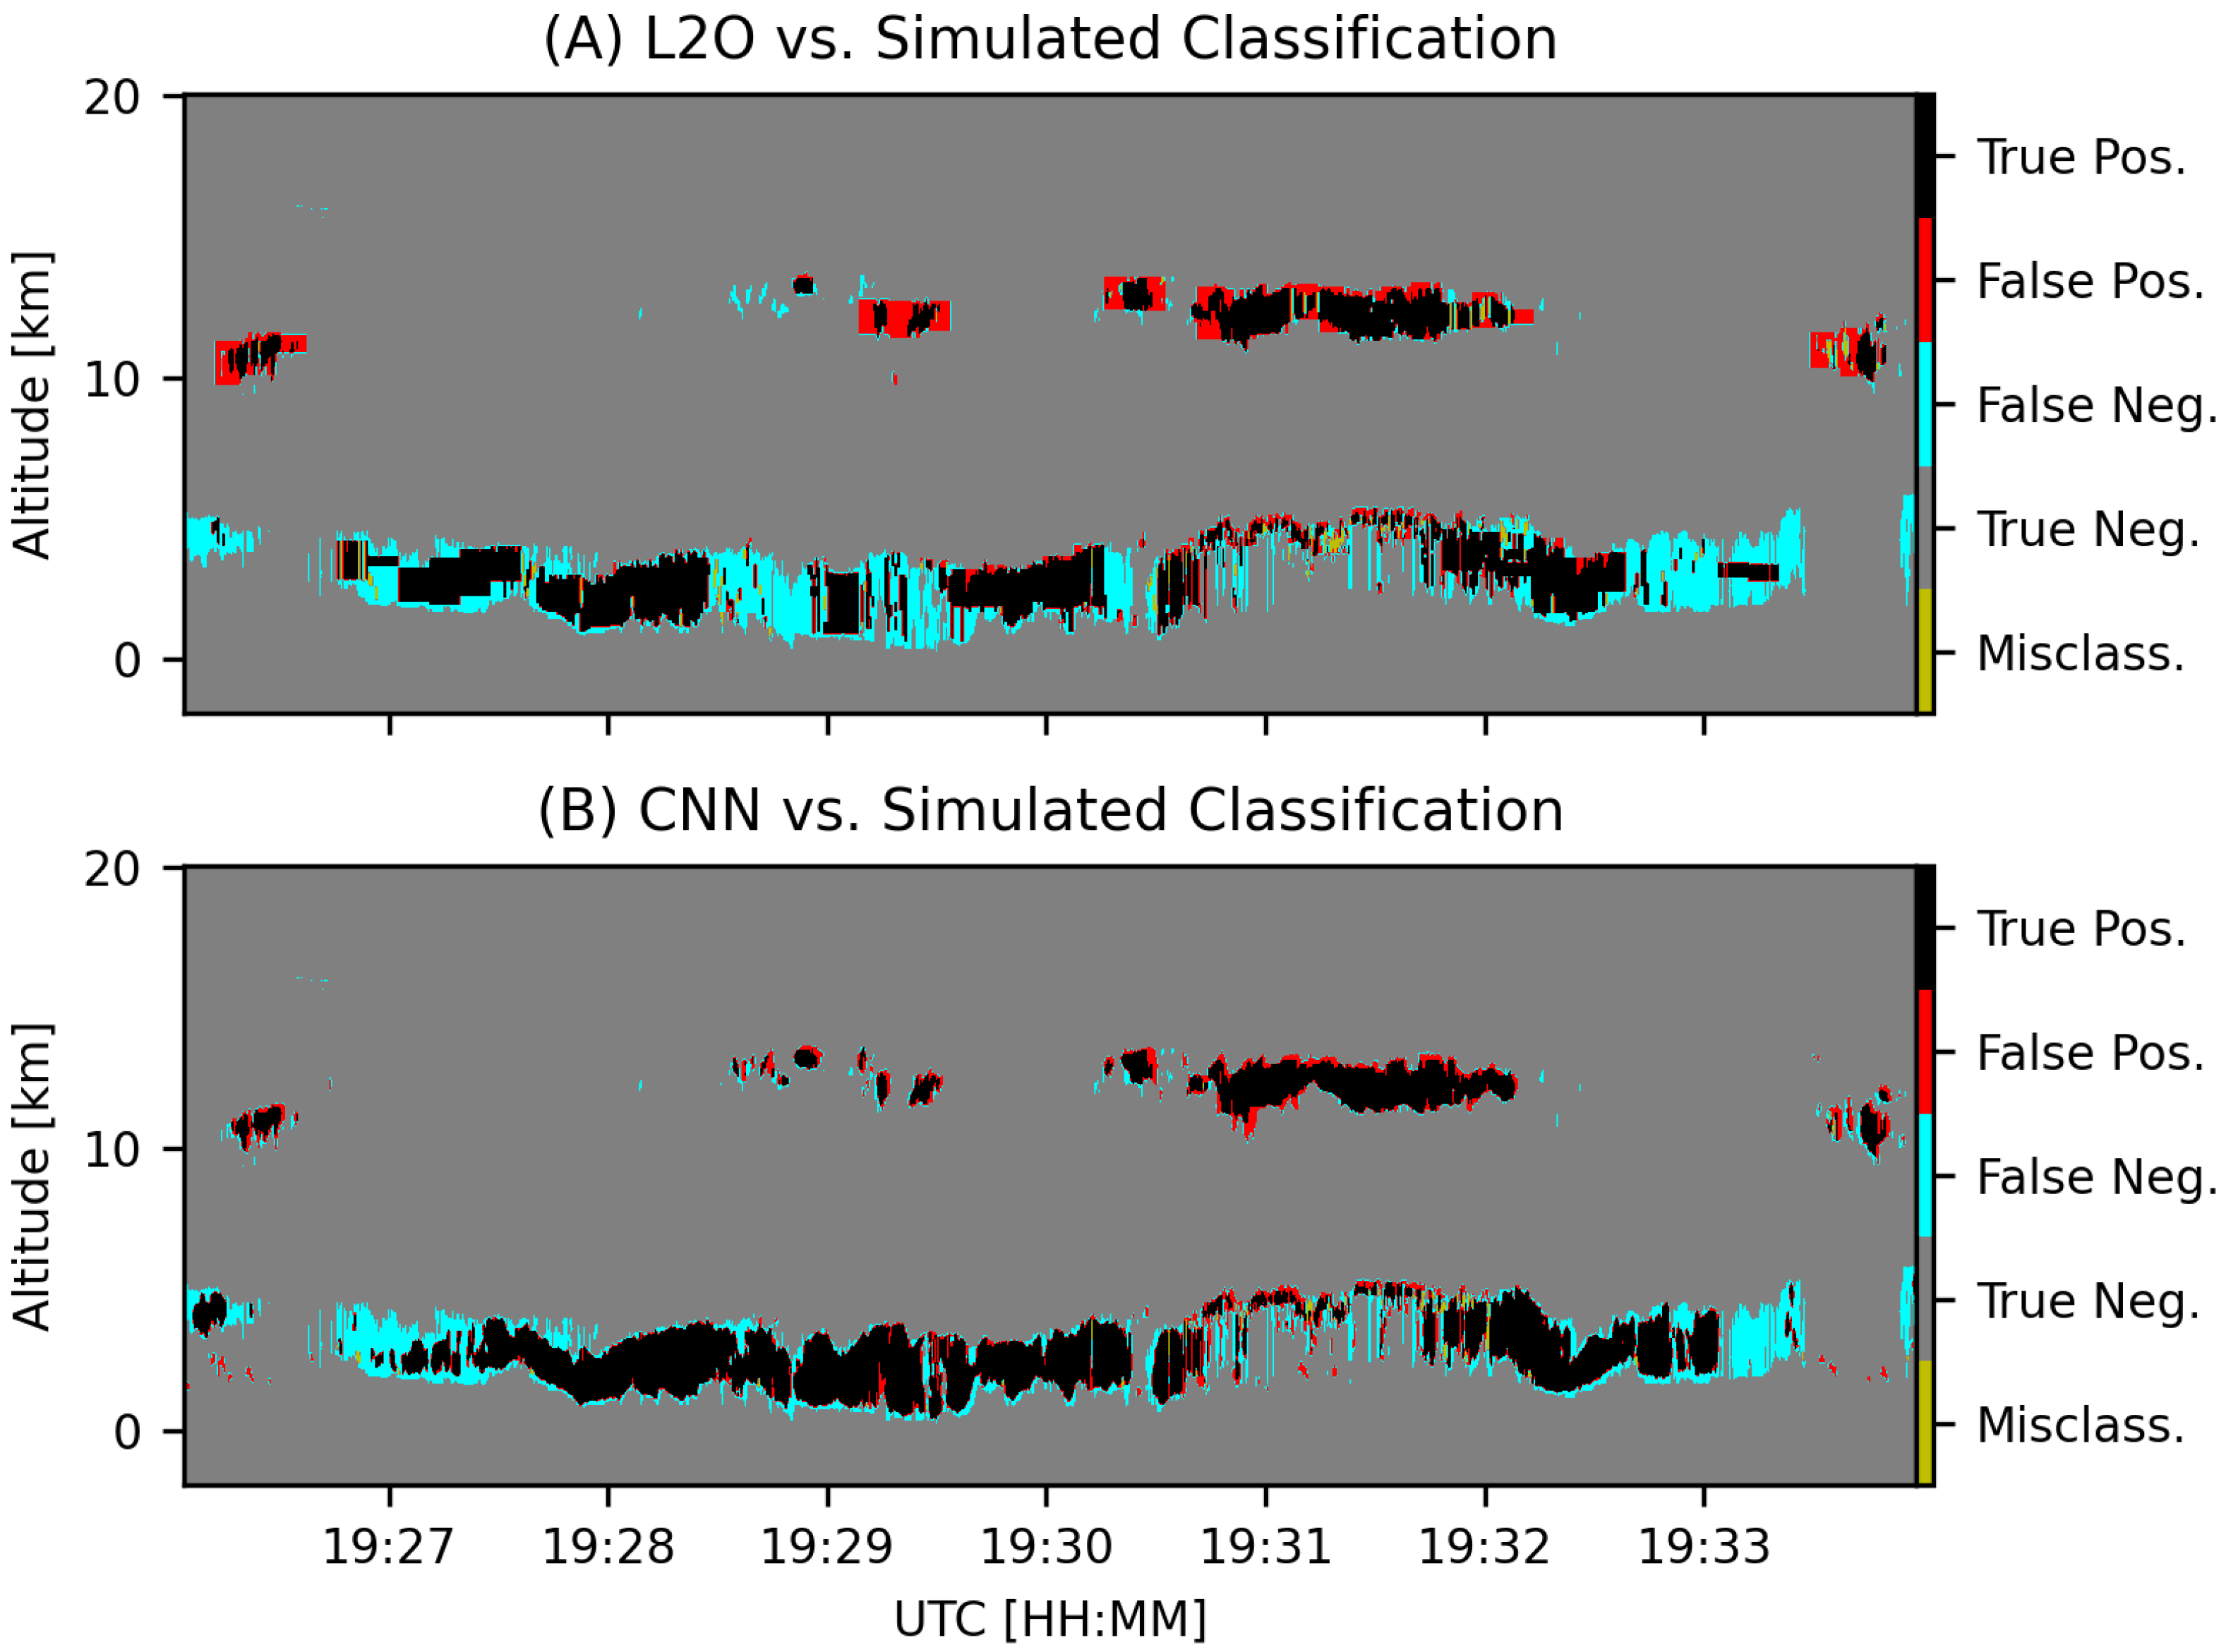
We show a class agnostic, pixel-by-pixel comparison of the two methods against the simulated ground truth in Figure 2. Here, we apply the standard definitions of T P , F P , F N , and T N to layer detection performance with modification to account for CAD: if both the L2O algorithm and CNN predict a layer and agree on CAD, the layer is considered T P and if both methods predict a layer and disagree on the CAD, the layer is considered misclassified. The clouds present at approximate altitude 10 km are found by both the operational algorithm and the CNN. Both algorithms detect the boundary layer aerosol below about 5 km. The operational algorithm, though, was unable to find parts of both the cloud and aerosol layers at the horizontal resolution of 5 km. The ‘blockiness’ indicative of layers found during the operational algorithm’s 60 km pass is clearly visible in the cloud and aerosol layers (e.g., in the clouds near 19:29 UTC and in the aerosols near 19:27 UTC). In contrast, the CNN operates purely at the native 350 m horizontal resolution and predicts fewer false positive layers, which can result from excessive horizontal averaging, and fewer false negative layers, which can result when the operational algorithm fails to detect tenuous atmospheric features.
We report a comparison of the CAD predictions made by the CATS L2O algorithm and the CNN method against the simulated ground truth data product across three simulated data scenes in terms of classification accuracy metrics in Table 2. We compute the precision, recall, and F1 score metrics for both the L2O and CNN relative to the simulated ground truth for each of the three classes in the CAD product, based on nearly 10 million atmospheric bin classifications. We observe that the L2O algorithm and CNN model perform well at layer detection when compared with the simulated ground truth, as evidenced by excellent precision and recall of the clear sky class. Across the simulated test set, we find the L2O algorithm is able to recall 80% of cloud layers present in the simulated data product, whereas the CNN method is able to recall 75% of such layers. We report a cloud precision of 60% when using the L2O algorithm, indicating that 60% of the layers identified as cloud by the L2O algorithm are assigned as cloud in the simulated ground truth dataset, and an improvement in cloud precision to 67% when using the CNN method.
The higher false positive rate of the CATS operational algorithm, which decreases its precision, may be due to its spatial averaging. The operational algorithm defaults to a 5 km horizontal resolution and includes layers identified by averaging to 60 km resolution. Averaging horizontally and applying the same label to every bin that participated in the average can inappropriately extend a layer into clear sky. The L2O record reports the spatial averaging for each bin, which allows us to calculate how many of the 130,051 false positive bins are averaged to 60 km: 62.8% of the operational algorithm false positives in the aggregated simulated data correspond to bins averaged to 60 km. The operational algorithm reports 175,966 false negatives, which affects the recall score. For completeness, the CNN reports 82,755 false positives and 144,993 false negatives computed using photon count data at native resolution. We find that the CNN method is superior to the CATS L2O algorithm for aerosol detection across the simulated dataset; we find aerosol precision and recall of 87% and 61%, respectively, using the CNN method, in comparison to aerosol precision and recall of 73% and 45%, respectively, when using the L2O algorithm. Interestingly, although the CNN method operates at native resolution without spatial averaging, we find improved recall and prediction confidence for detecting tenuous aerosol layers.

3.2. Cloud Phase Typing

In order to evaluate cloud phase typing performance of the CNN method, we selected daytime granules from the first day of each month in 2016. We selected daytime granules for the test dataset because these records have the weakest SNR. Clouds tend to have large backscatter signals at 1064 nm and typically are easy to see in the photon count data alone. With the addition of depolarization information and altitude, discerning between the two classes proved to be a simple task for the neural network to learn. Note that the CNN does not ingest midlayer temperature, which is a key component of the operational algorithm cloud phase determination.
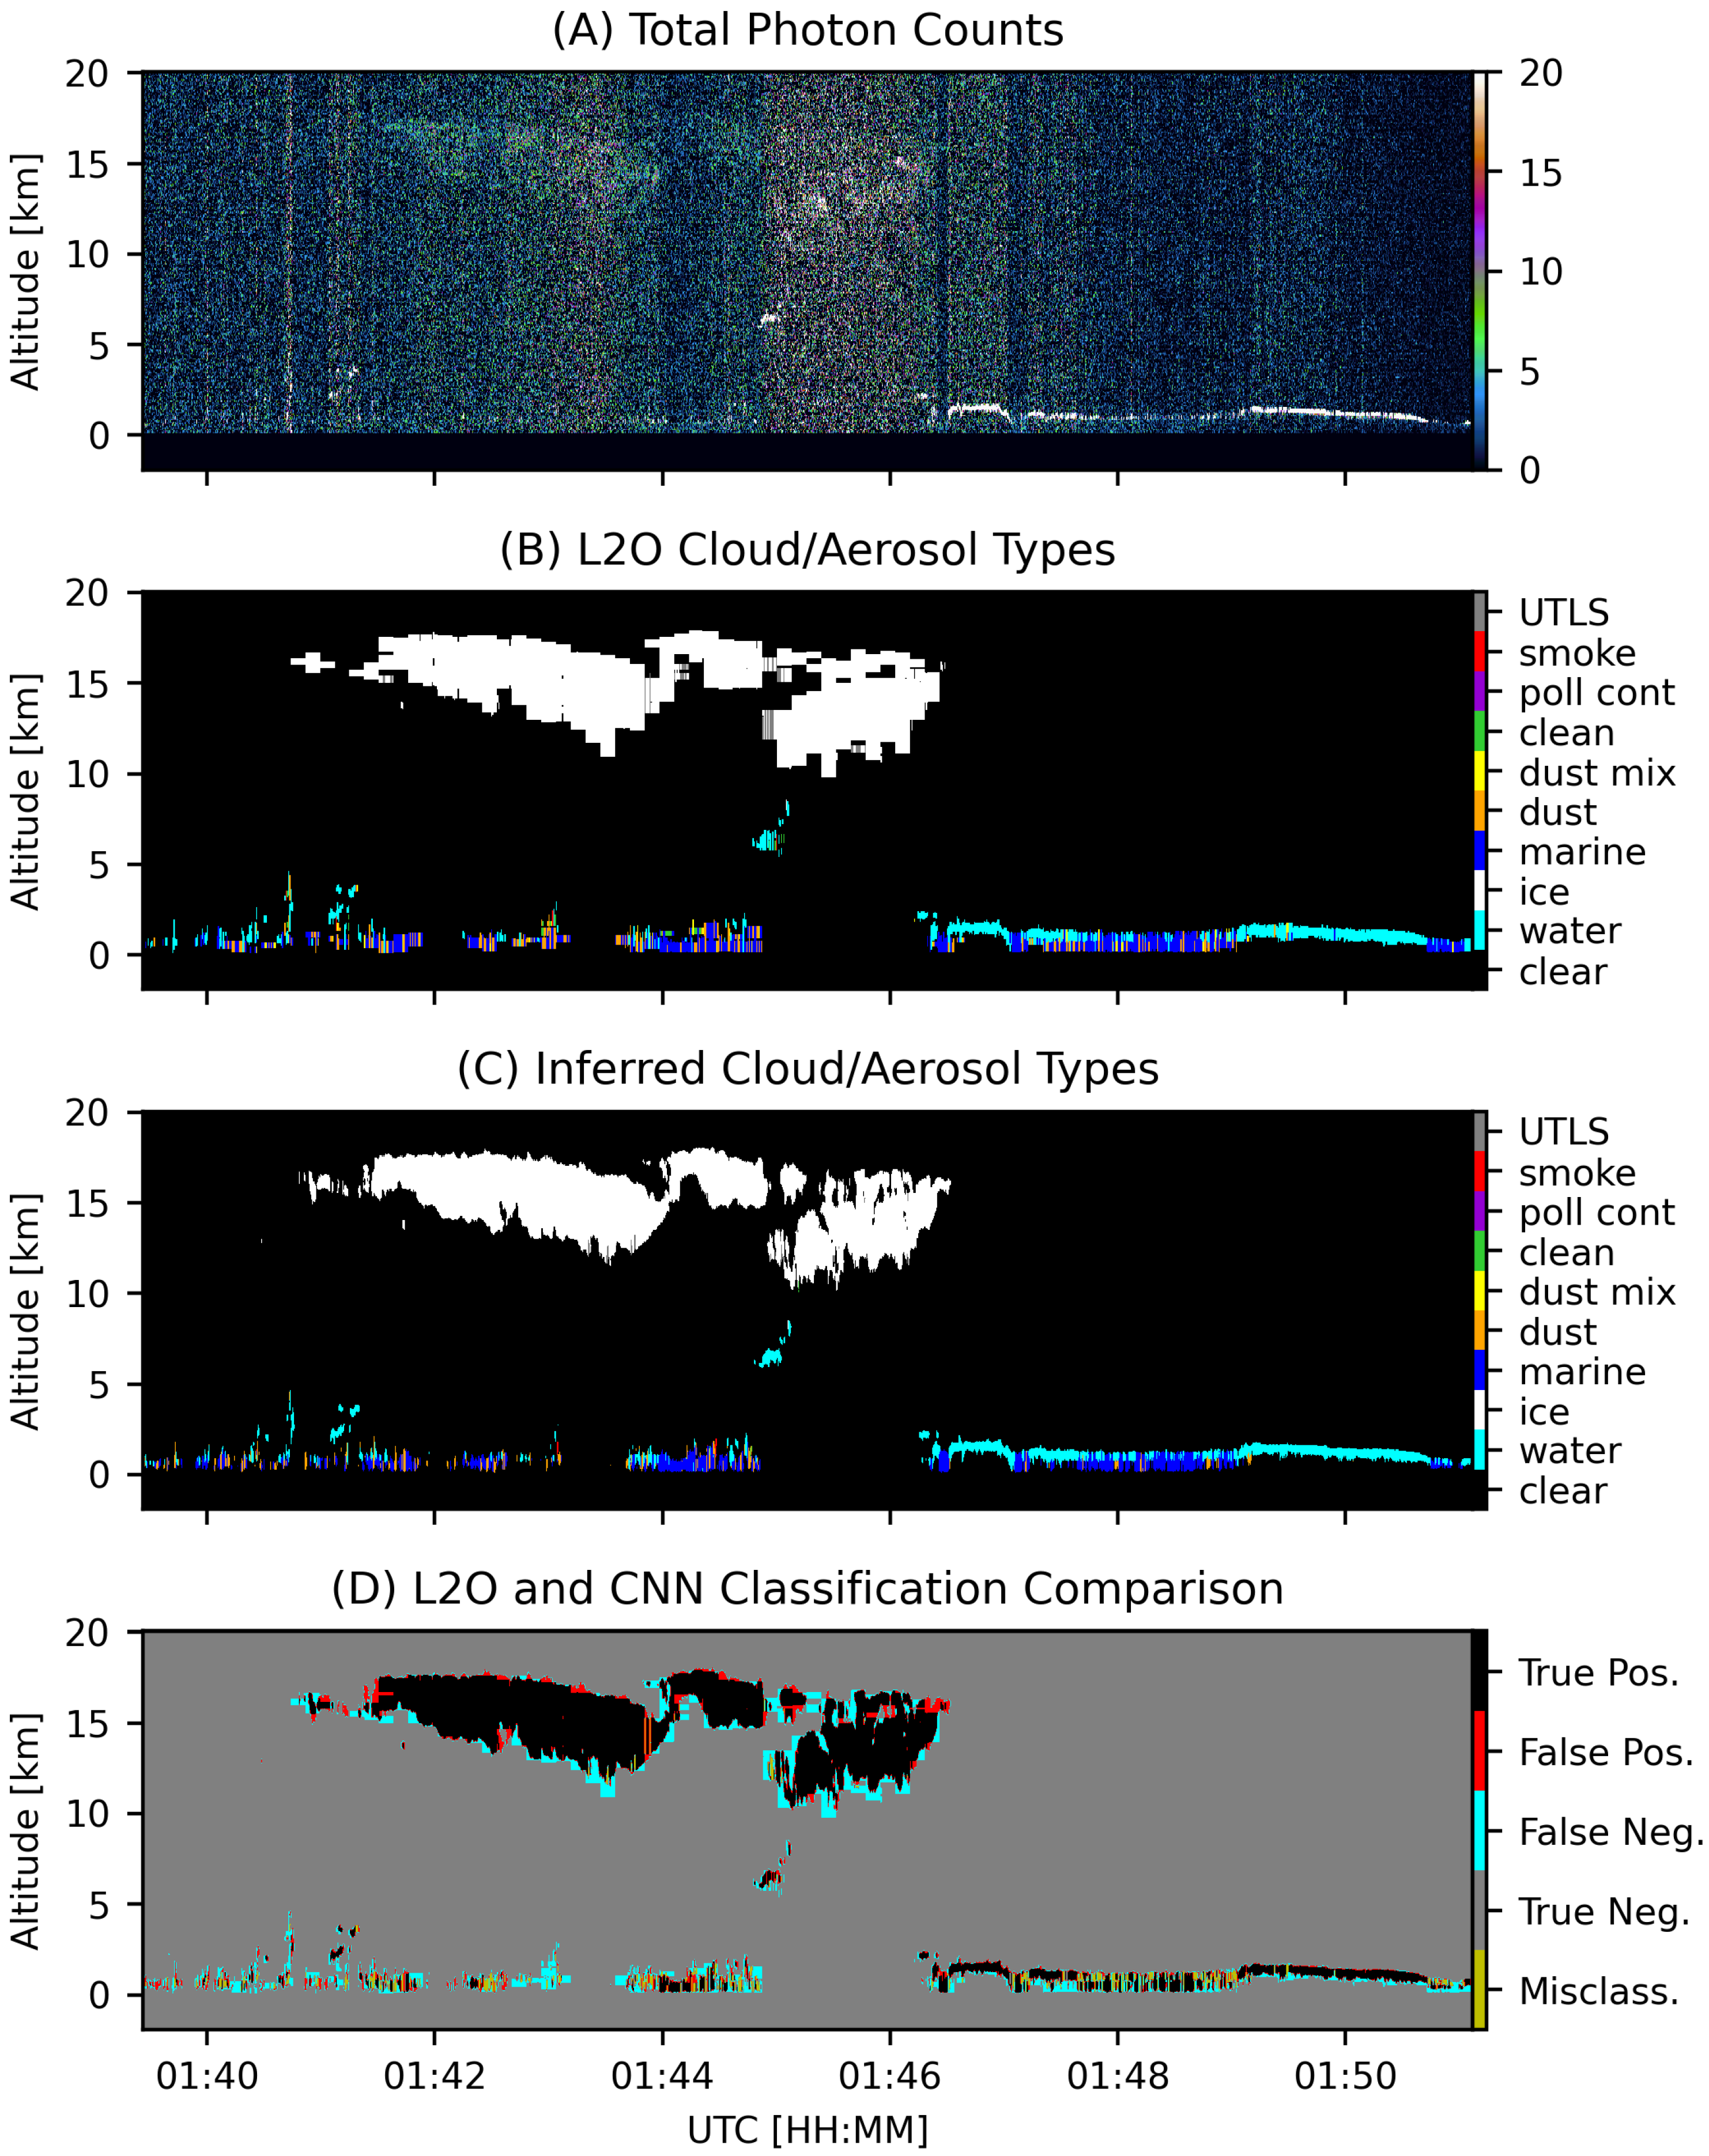
The evaluation of a granule collected on 1 February 2016 comparing the performance of the neural network and operational algorithm is shown in Figure 3. We again apply the standard definitions of T P , F P , F N , and T N to layer detection performance with modification to account for CAD and layer typing: if both the L2O algorithm and CNN predict a layer and agree on CAD and cloud or aerosol type, the layer is consider T P , and if both methods predict a layer and disagree on the CAD and cloud or aerosol type, the layer is considered misclassified. There is a large ice cloud layer above 10 km and an extended low altitude water cloud layer that begins just after 1:46 UTC in this scene. The photon count signal is fairly weak for the ice layer (typical of such a high-altitude feature), which makes a layer like this ideal for comparing the two methods at hand. We observe the ‘blocky’ layer detection artifacts the operational algorithm can create from its multiple horizontal resolutions. The operational algorithm also claims that there are some UTLS aerosols embedded in the cloud layer. In contrast, the neural network successfully finds the ice layer at native resolution and does not find UTLS aerosols embedded within the ice cloud layer. The extended water cloud layer is reasonably identified by both methods; however, the small water cloud layer near 5 km of altitude is better resolved by the CNN.
The cloud phase disagreements tend to occur at altitudes greater than 4 km, with the majority of disagreements occurring at altitudes between 6 and 8 km above sea level. Because we supply the neural network with altitude, the model learns to identify cloud phase based on altitude; we expect a majority of ice clouds to occur at the top of the atmosphere, and a majority of water clouds to appear at the bottom of the atmosphere. In the region of the atmosphere where there are opportunities to mix, or supercool liquid, the mid-layer temperature obtained by MERRA-2 reanalysis used in the CATS L2O algorithm provides an improved descriptor for discriminating cloud phase. We emphasize that our model is designed for real-time operation, and does not depend on model-based ancillary data. We find generally good agreement between our approach and the CATS L2O algorithm; in aggregate, when both the operational algorithm and the neural network agree that a layer is a cloud, they disagree about the layer’s cloud phase only about 2.2% of the time, out of about 6.2 million vertical bins in the test data that both algorithms agree are clouds.

3.3. Aerosol Typing

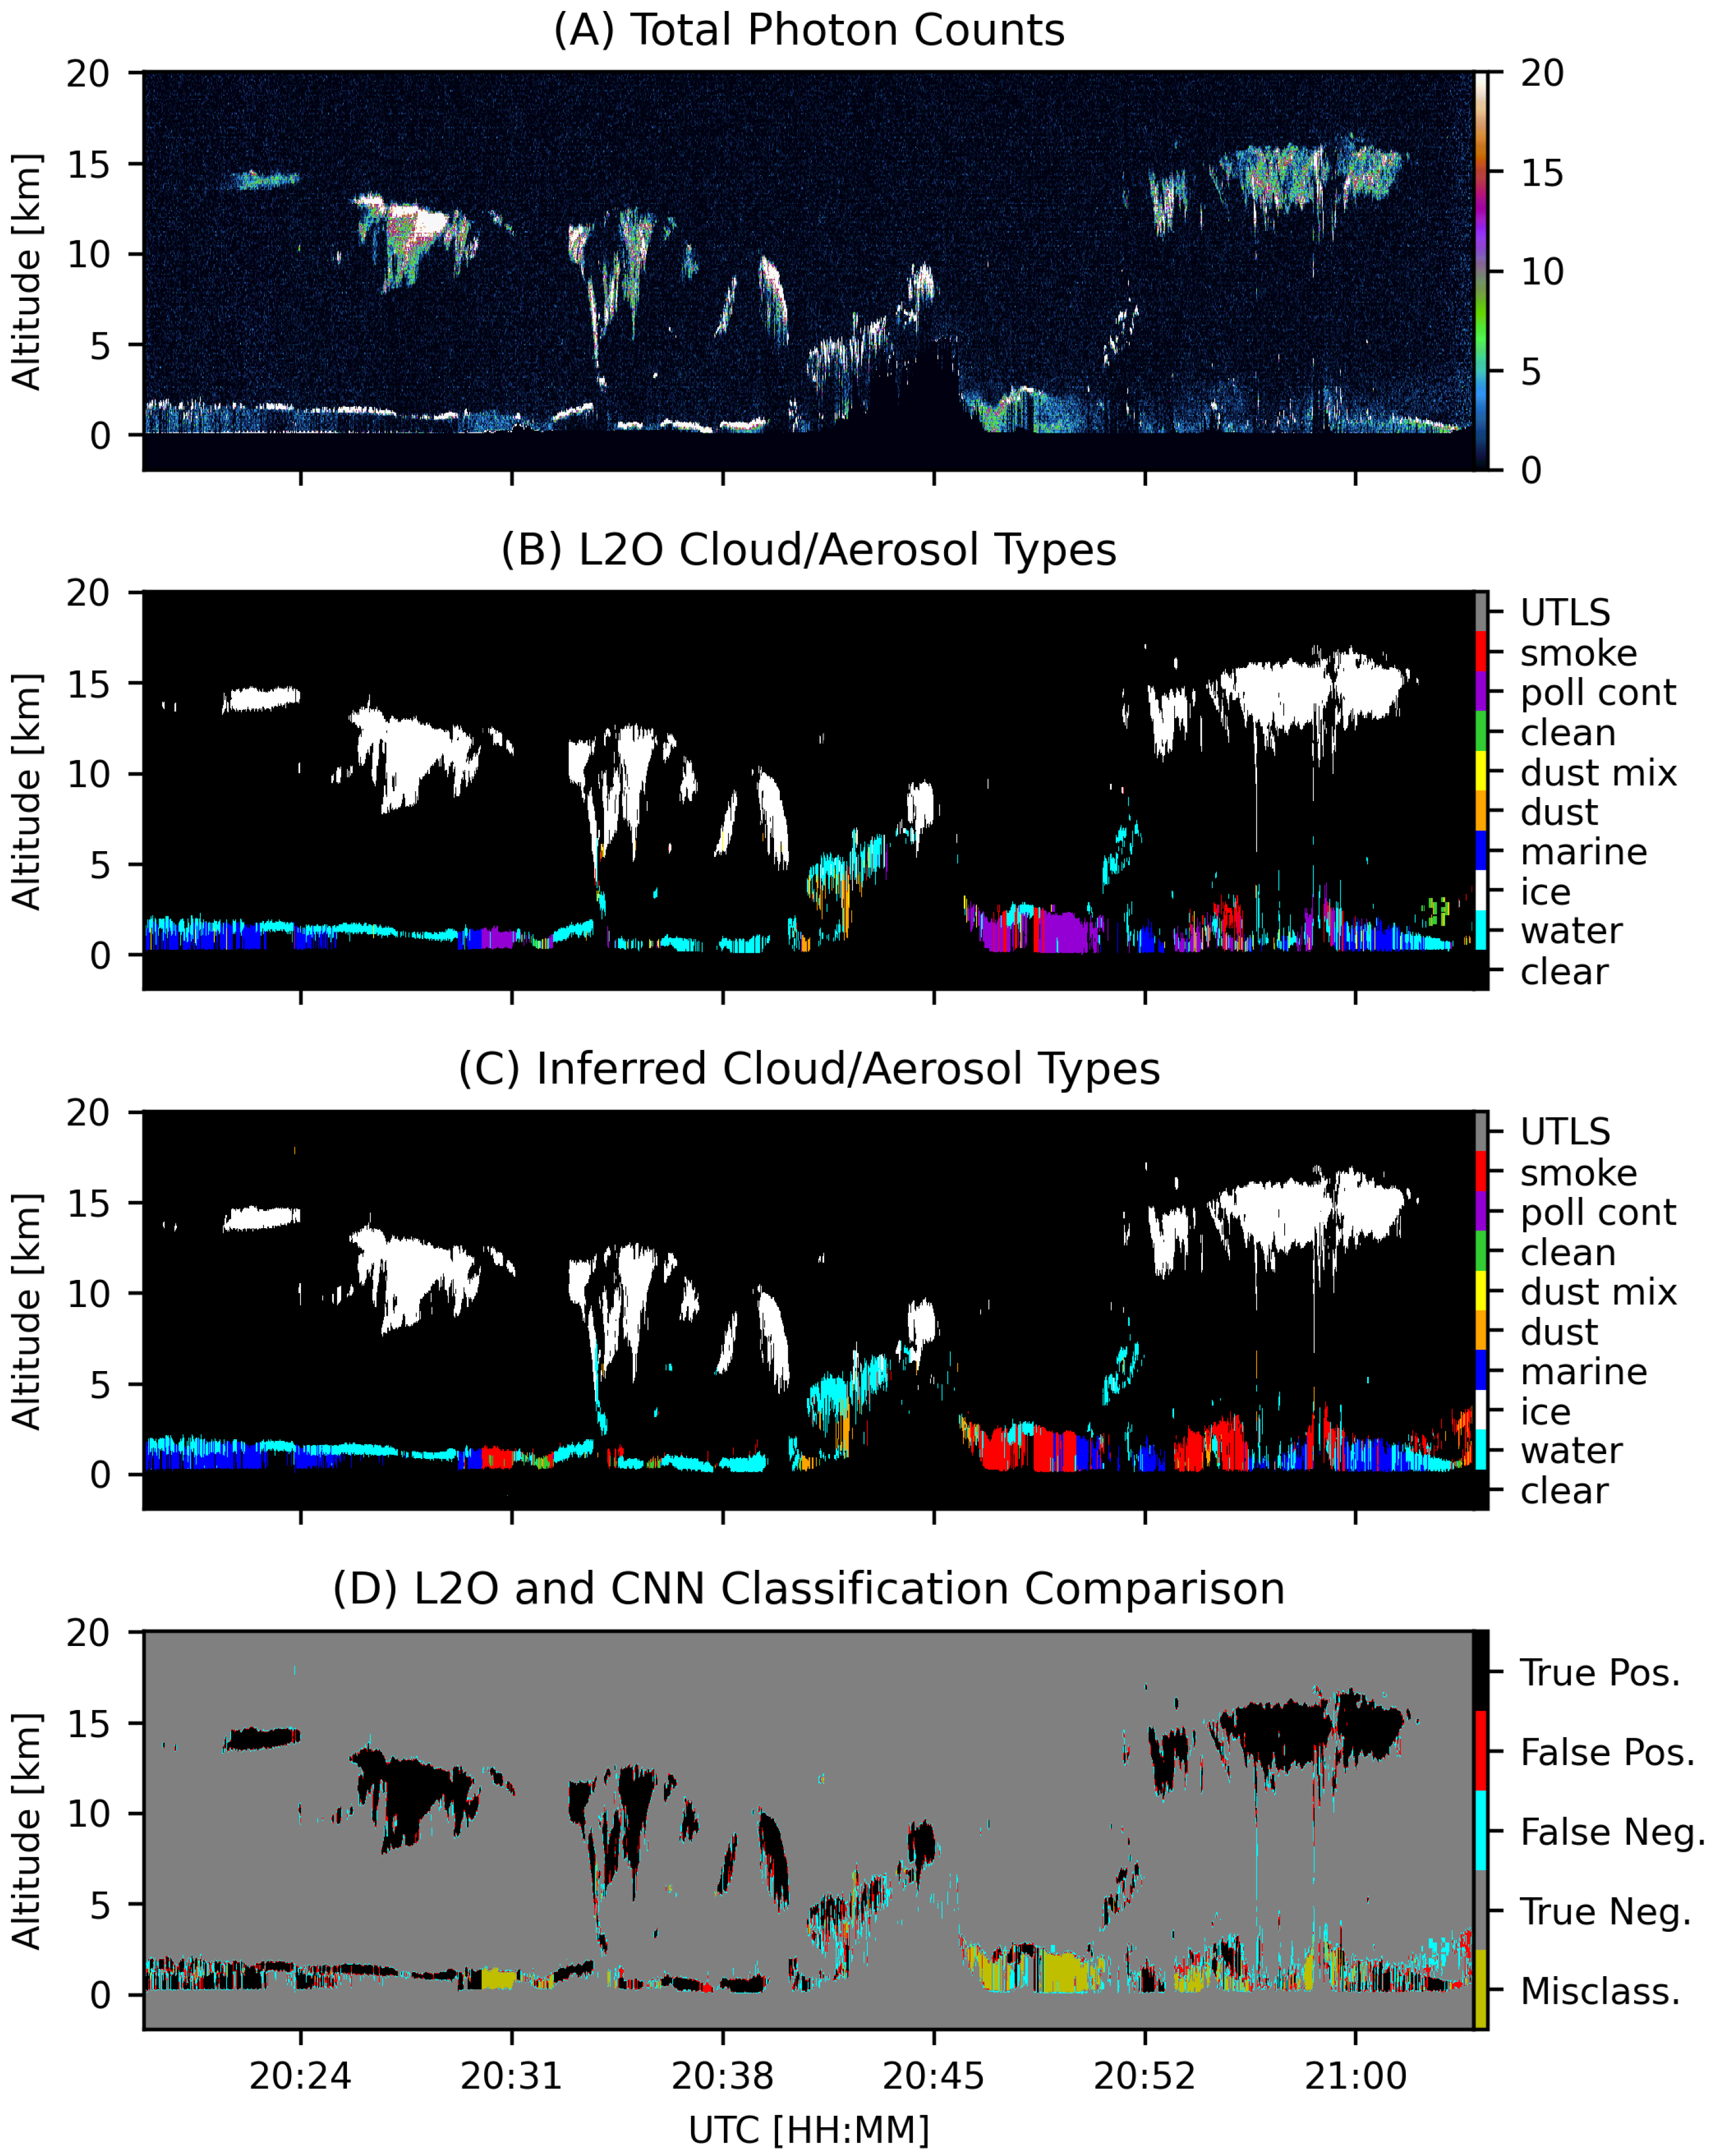
We investigate the aerosol typing task using the same daytime granule data set from the first day of each month in 2016. The CNN and the operational algorithm both perform well in typing the marine class. There are fairly concrete criteria that suggest aerosols are marine; marine aerosol layers are weakly depolarizing, have a small vertical extent, and exist over water. Weakly backscattering clean background aerosols are occasionally typed by both the operational algorithm and the CNN (e.g., in Figure 4 just after 20:52 UTC). Each of these classes have criteria that are readily discernible using the features we provide to the CNN.
Examining the test data in aggregate reveals that the neural network model does not classify any aerosol layers as dust mixture or polluted continental. This is true despite the fact that there are 1,490,380 dust mixture pixels and 867,877 polluted continental pixels in the training data. We compute a partial confusion matrix for the dust mixture and polluted continental aerosol types and present them in Table 3. The data indicate that, when both algorithms agree that there is an aerosol pixel present, polluted continental layers are typically typed as dust or smoke by the CNN, while dust mixture layers from the operational algorithm are in majority typed as marine or dust. To determine if either aerosol type class is probable but not maximally probable, we compute the top-k accuracy score. Top-k accuracy answers the question “Given a set of targets and predictions, is the correct target predicted in the top k most probable predictions?” The polluted continental class is the second most probable class, per record, about 45% of the time. On the other hand, dust mixture is not predicted in the top 5 most probable predictions.
In order to investigate aerosol typing performance further, we hand-select CATS nighttime granules containing validated aerosol typing and compare the performance between the L2O algorithm and the CNN method. We show an example nighttime granule with a large polluted continental layer in Figure 4. The polluted continental layer identified by the operational algorithm begins just after 20:45 UTC. Typing the polluted continental class with the operational algorithm requires either ancillary data from MERRA-2 reanalysis or the ratio of two laser colors’ depolarizations, neither of which are available to the CNN. The CNN types this layer as smoke, and then as marine as CATS’s view moved from over land to over water. The three classes smoke, polluted continental, and marine all represent weakly to moderately depolarizing aerosols, so it is reasonable that in the absence of ancillary information, our model types polluted continental layers from the L2O as either smoke or marine.
That said, both polluted continental and dust mixture aerosol types are frequently not identified by the CNN in the first place, as evidenced by their majority classification as clear sky by the CNN. The CNN CAD has higher cloud and aerosol precisions and F1 scores (Table 2), which indicates that its positive detections are more trustworthy than the operational algorithm’s. Since the detection is more trustworthy, the frequent clear sky reclassification of dust mixture and polluted continental pixels identified by the operational algorithm may be an improvement.
The dust mixture pixels identified by the operational algorithm, when positively detected, are in majority reclassified as marine, although a significant proportion are reclassified as water cloud, with the remainder primarily reclassified as dust. Revisiting the operational algorithm’s aerosol typing decision tree discussed in Nowottnick et al. [22] and summarized in Section 2.2 provides an interpretation for the aerosol pixel reclassifications. The dust mixture class is identified by the operational algorithm according to the rule 0.15 < δ < 0.25 . Depolarization information is encoded in the uncalibrated photon count data, but is not readily available to be used as a cutoff threshold in the manner the operational algorithm uses it. The CATS L2O algorithm assigns the dust mixture class to moderately depolarizing aerosol layers. It is, then, reasonable for the neural network to reclass dust mixture layers identified by the operational algorithm as either marine or dust, since these classes exhibit either low depolarization or high depolarization. The pixels reclassified as marine occur over water, with the majority over deep ocean. It stands to reason, then, that the CNN appears to use surface type for context when reclassifying dust mixture pixels identified by the operational algorithm. The reclassification of dust mixture as water cloud stems from the neural network’s CAD. Given that the CNN CAD is more trustworthy and its cloud determination equivalent to the operational algorithm, it is likely that low depolarization dust mixture pixels whose CAD is assigned cloud by the CNN are reclassified as water cloud.
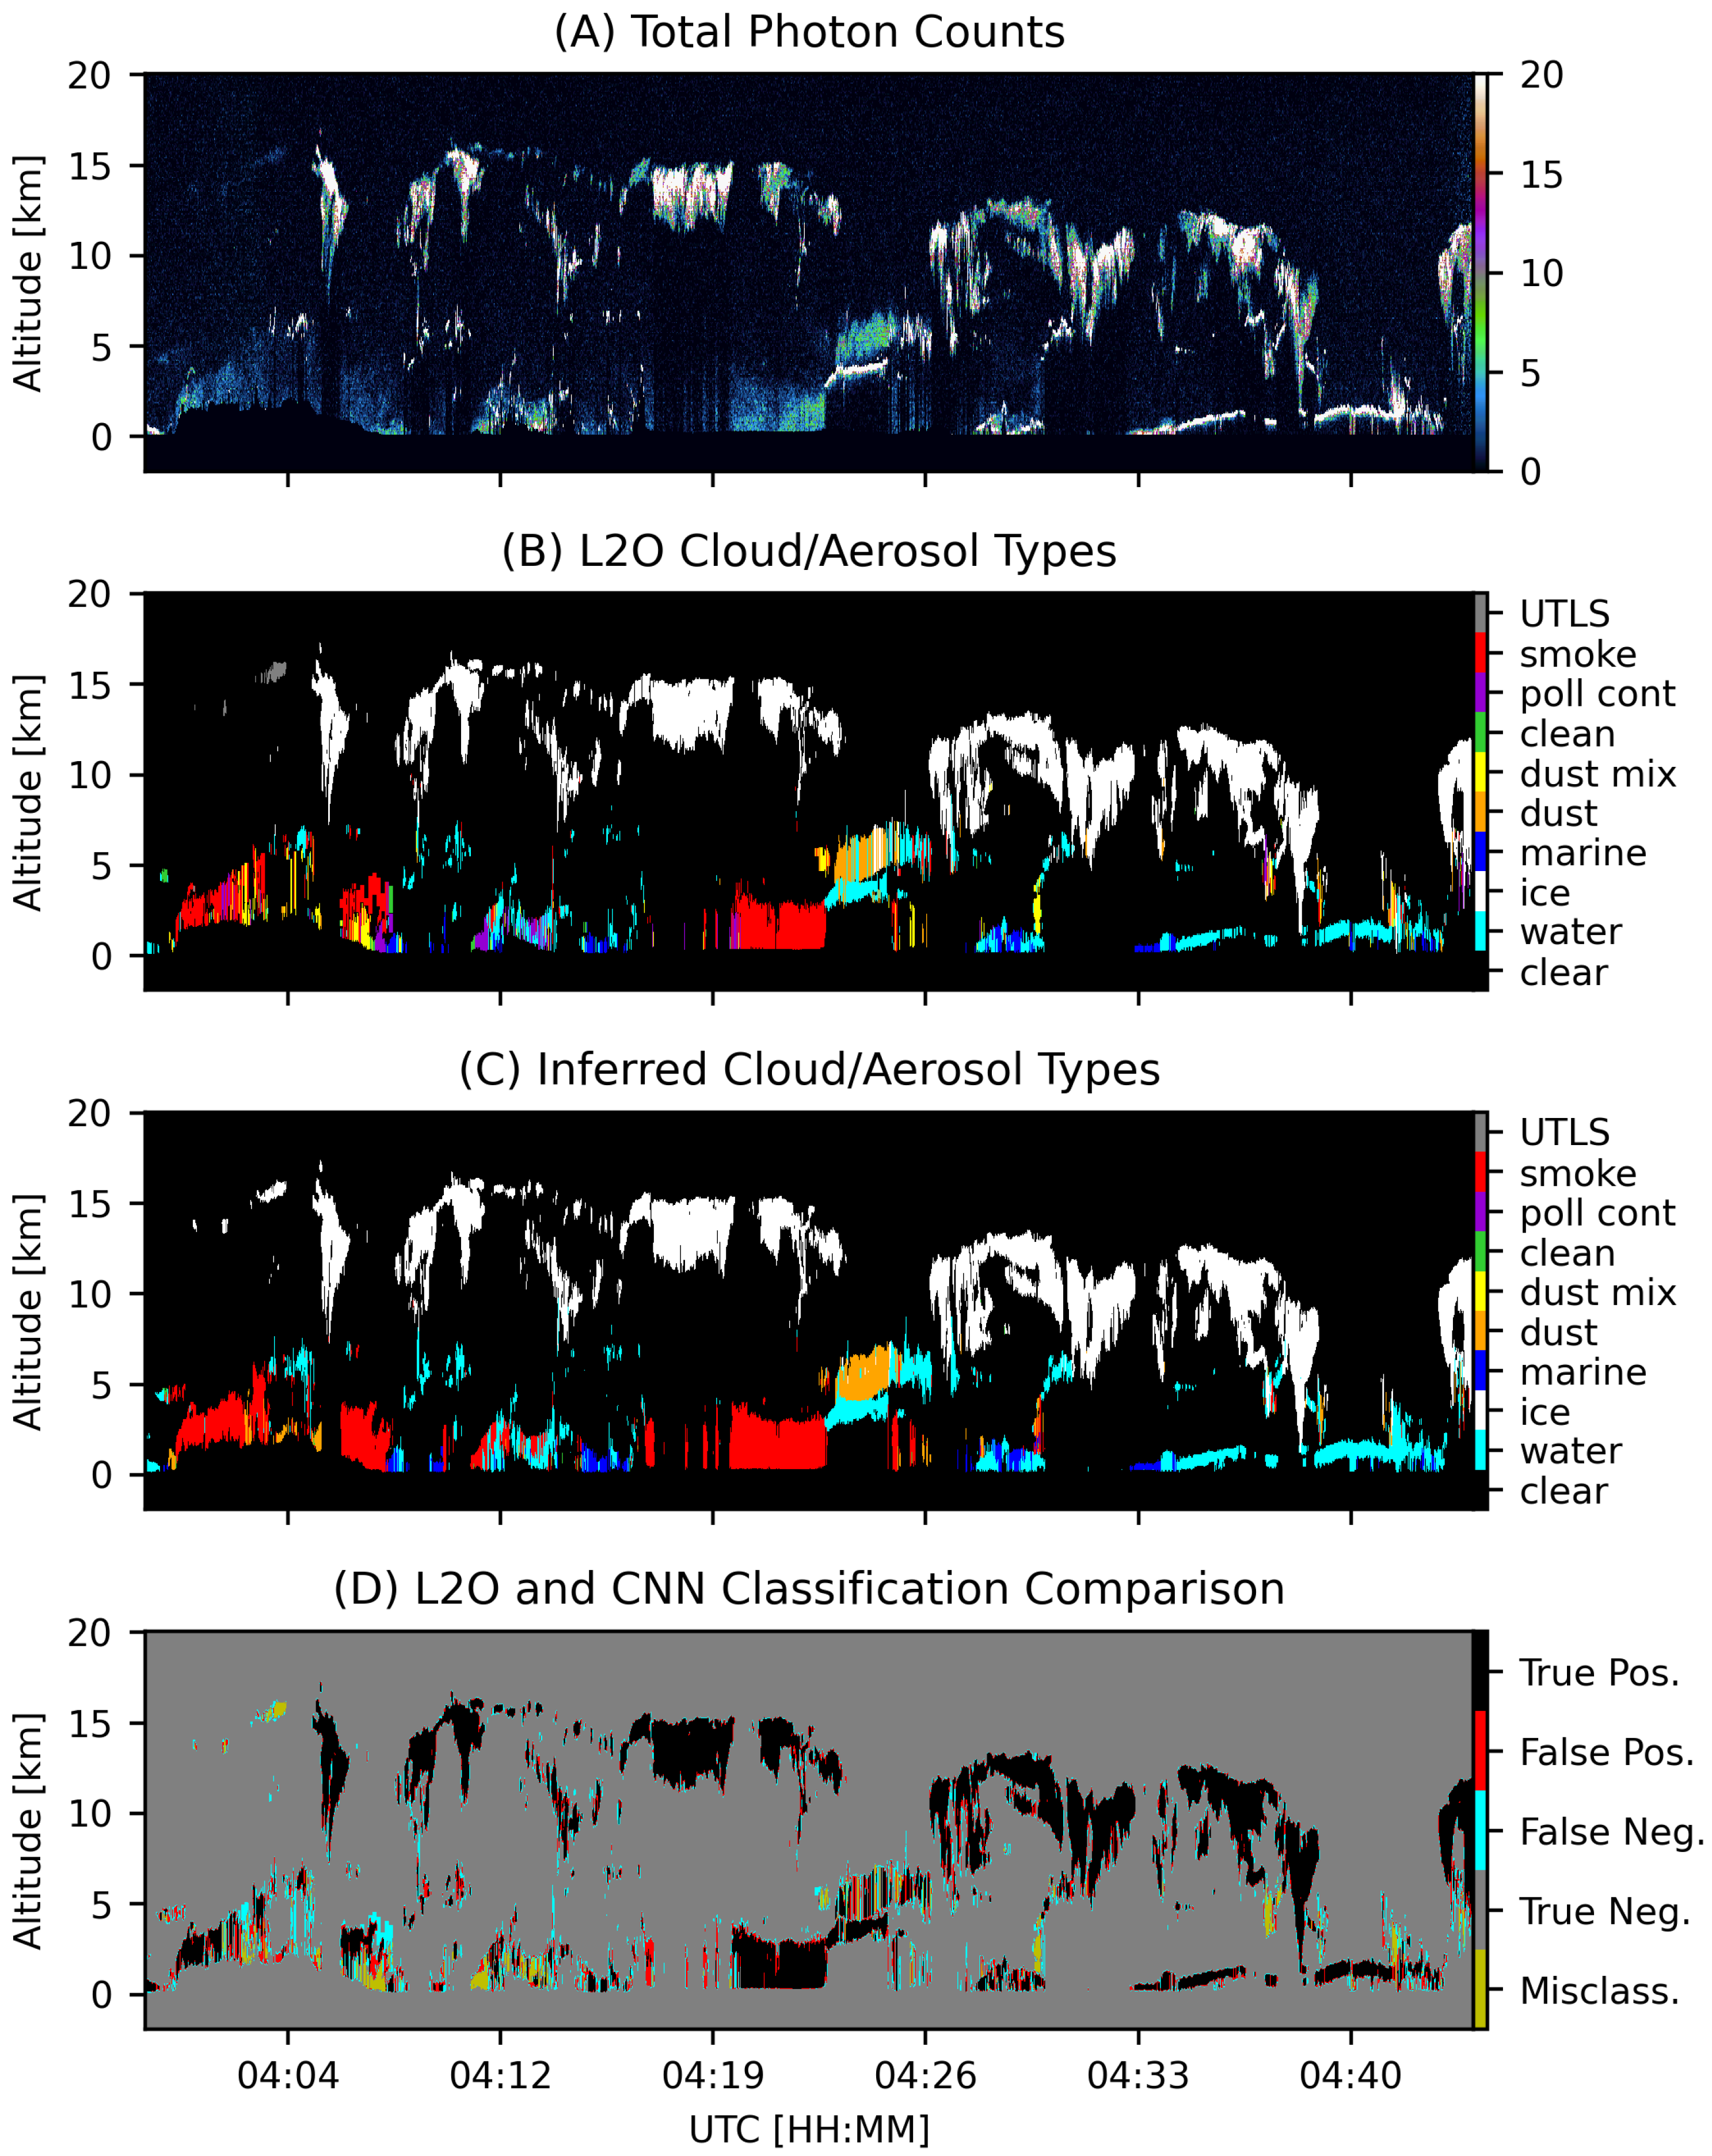
To investigate the smoke class, we show a comparison between methods of an additional nighttime scene in Figure 5. The scene begins over the Pacific Northwest of the United States and was acquired on 18 August 2015 when there were several large, actively burning wildfires in the region [38]. It is doubtful that the aerosol layer detected by CATS on this day over these fires could be anything other than majority wildfire smoke. Both the operational algorithm and the CNN find the smoke layer; however, the transported smoke after 4:04 UTC appears to be better resolved by the CNN. Another interesting feature is the aerosol layer above the water cloud layer near 4:24 UTC. The operational algorithm, profile by profile, typed the layer as dust mixture, dust, clean background, and ice cloud. According to Section 2.2, this can only be the case if, profile by profile, the operational algorithm sees layer-integrated backscatter and depolarization ratios that vary enough to type the profiles differently. The CNN sees this layer as dust.
In the absence of ancillary information, the neural network does not type the dust mixture or polluted continental classes. We do not consider this to be a limitation of the model, however. Rather, this behavior is indicative of the kind of refinement that can be achieved after many years of fine tuning a classifier. We discuss a known limitation of the model in the following section.

3.4. Current Limitations

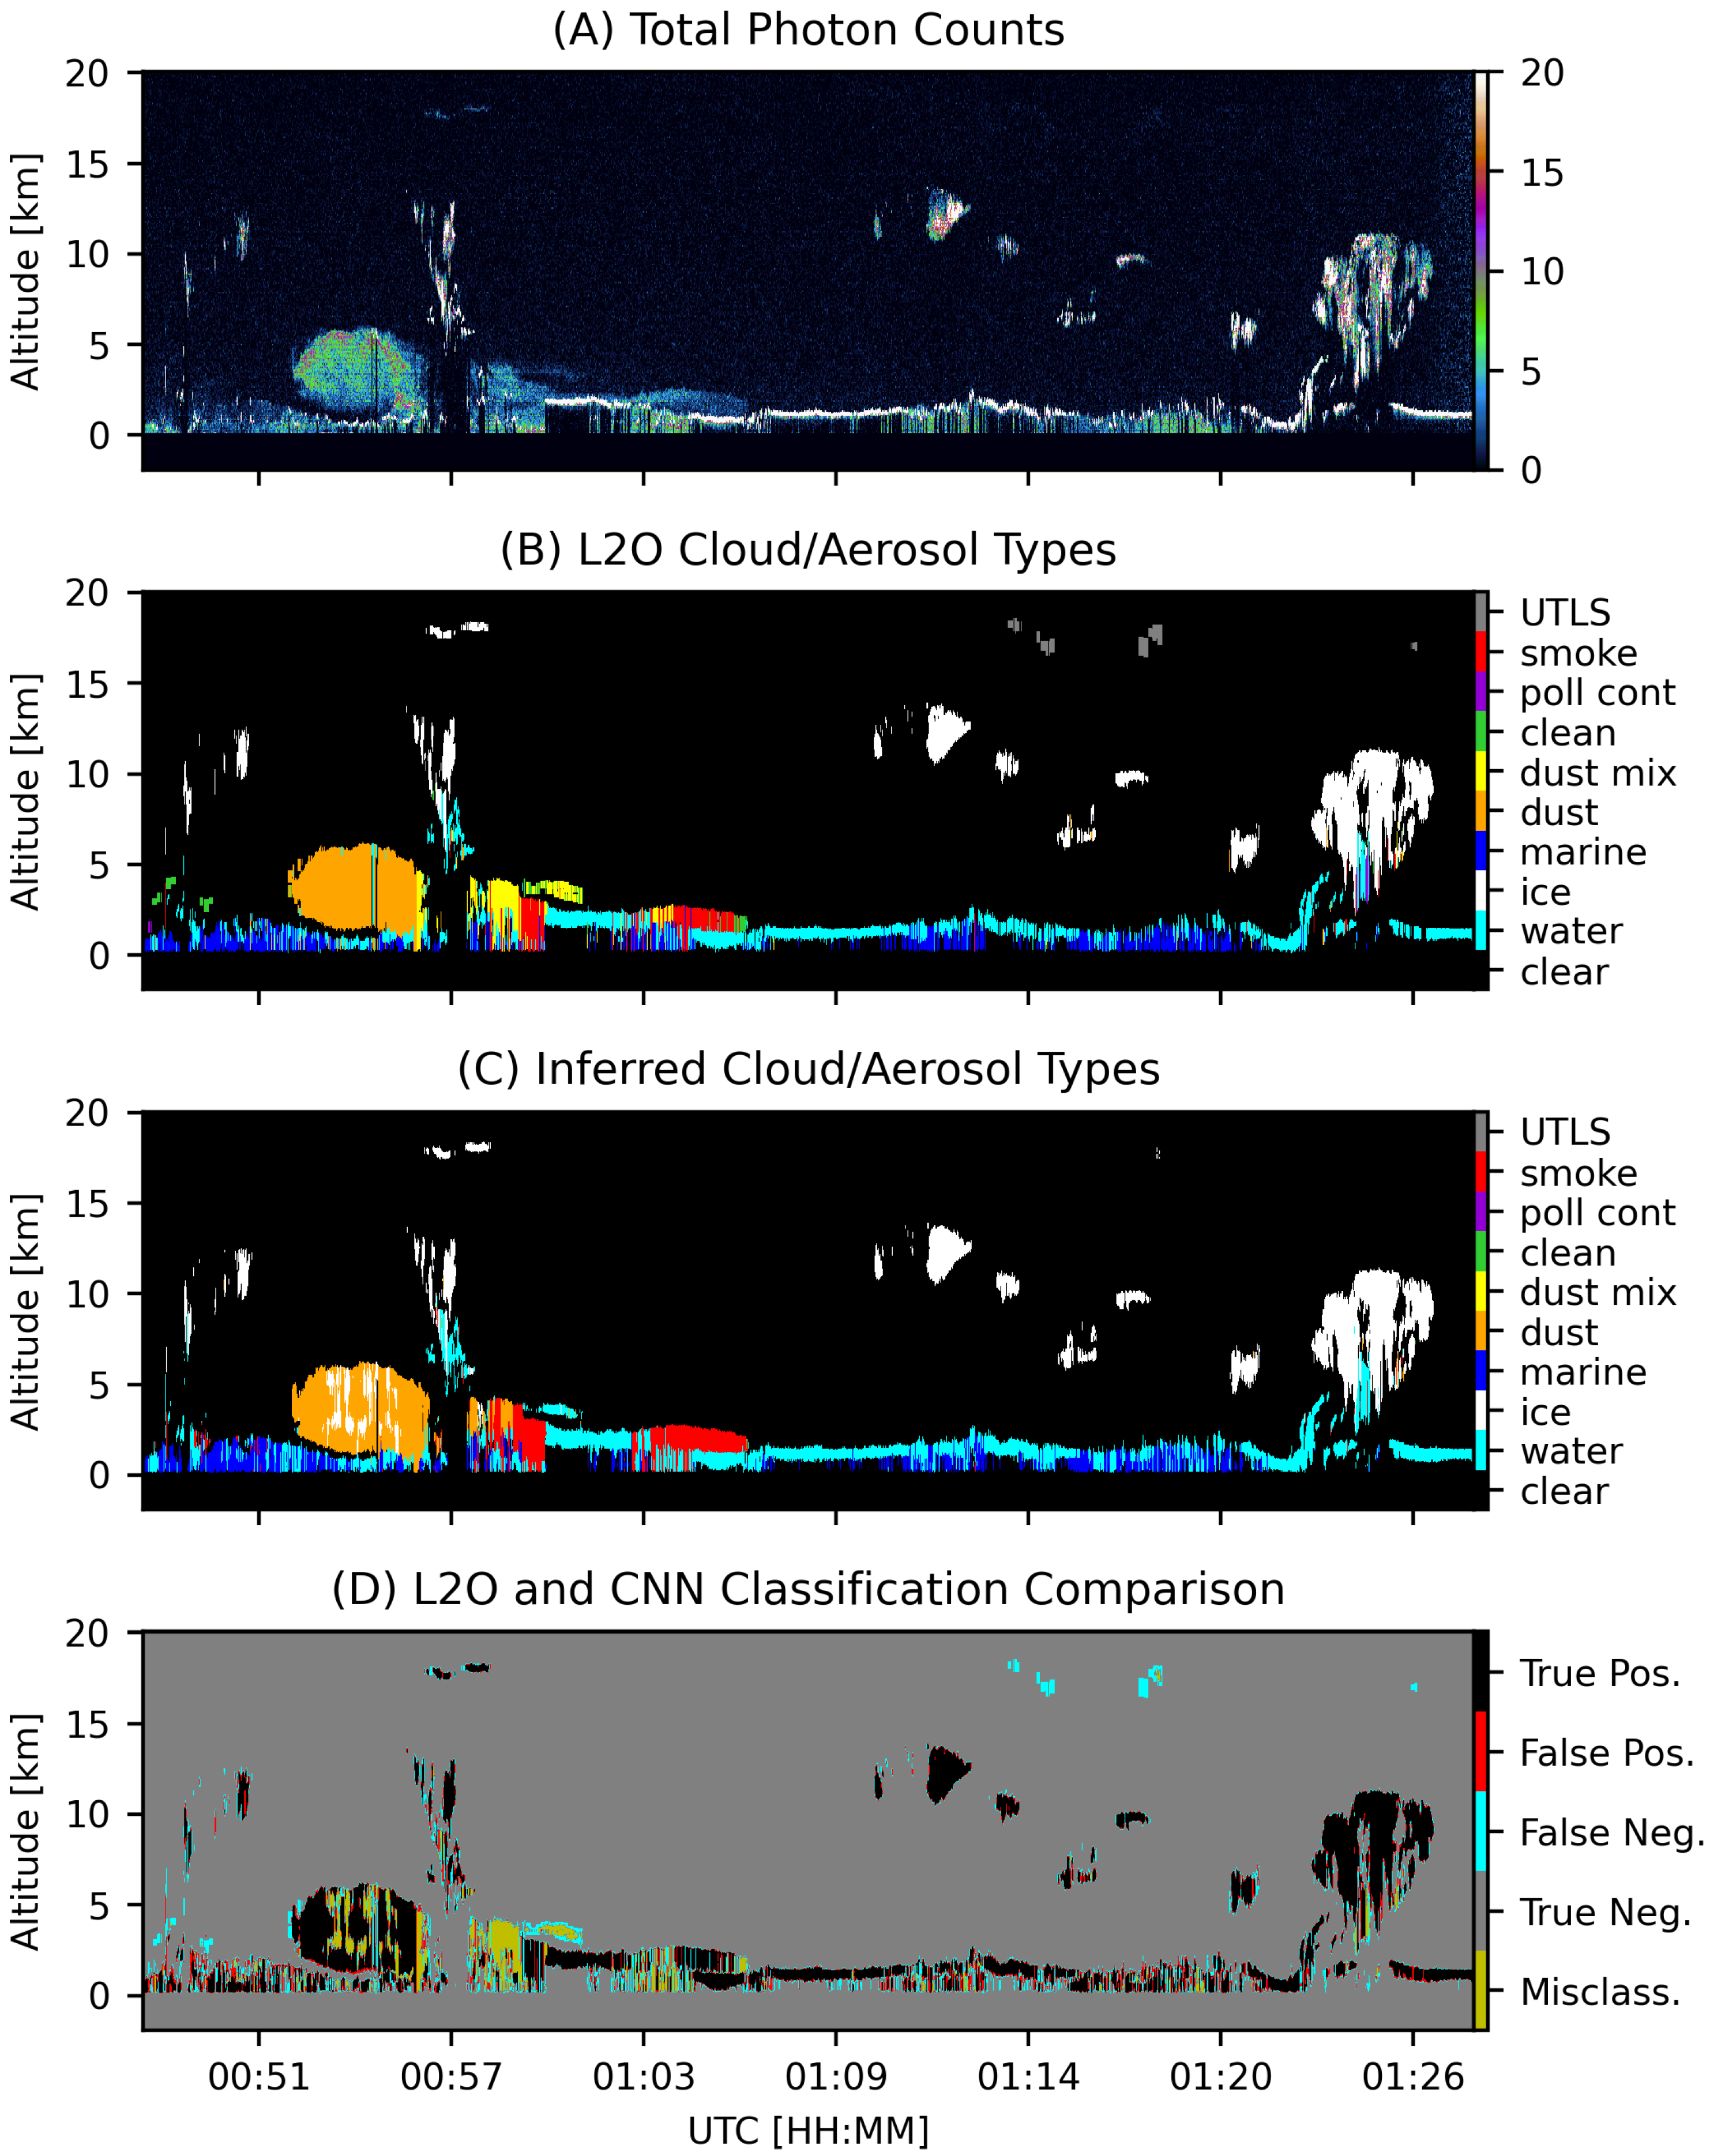
In Figure 6, we show a record that contains a large Saharan dust plume observed between 00:51 UTC and 00:57 UTC. The dust plume’s vertical extent exceeds 5 km. Material near the top of the layer, likely water clouds, attenuates the laser signal, which results in the vertical striping visible in the photon counts and both classifiers’ segmentation. After 00:57 UTC, we see operational algorithm dust mixture and clean background layers identified as dust, smoke, and water cloud by the CNN model. The CNN’s reclassifications of dust mixture here are consistent with what we discussed in the previous section and do not view these aerosol type misclassifications as a model limitation. However, the neural network claims that there are ice cloud layers embedded within the dust plume while the operational algorithm does not. These ice cloud layers are likely misclassified, given that both classifiers agree that there are nearby water cloud layers at greater altitudes.
We demonstrated in Section 3.1 that, in aggregate, the CNN layer detection and cloud–aerosol discrimination is superior to that of the operational algorithm. Both classifiers find cloud layers at the top of the Saharan dust plume, but the CNN ice cloud layers here indicate an edge case where it is likely that the CNN CAD has failed. The Saharan dust layer here is extended and diffuse, and exhibits moderate backscatter and high depolarization. Following the CAD decision tree in the operational algorithm (Figure 4 of Yorks et al. [12]), we find that a layer with a mid-layer temperature less than −20 °C and with a layer-integrated depolarization ratio δ > 0.25 is classed as ice cloud with high confidence. The ice cloud depolarization ratio requirement is identical to the dust criterion outlined in Section 2.2. Indeed, the CATS operational CAD algorithm also has difficulty distinguishing optically thin dust plumes lofted into the mid-to-upper troposphere from optically thin ice clouds. To account for this bias, the operational algorithm reclassifies any cloud layer with a γ less than 0.03 sr−1, δ greater than 0.20, and  T mid greater than 0 °C as an aerosol layer. In general, there is overlap in layer-integrated backscatter and depolarization measurements between different kinds of clouds and aerosols [39,40], which makes such interventions necessary.
Pixels identified as UTLS aerosols by the operational algorithm tend not to be identified as UTLS aerosols by the CNN. Of the 288,856 UTLS pixels in the test data, 64.3% of them are classified as clear sky and 35.0% are reclassified as ice cloud. The CATS operational algorithm CAD relies upon probability density functions derived from many CPL missions (see Section 2.2); however, there were relatively few UTLS aerosols observed by CPL. The operational algorithm intervenes in the PDF CAD determination using MERRA-2 tropopause height, γ < 0.03  sr−1, and  δ < 0.25 rules to identify UTLS pixels with high confidence [12]. In the absence of MERRA-2 ancillary data and calibrated backscatter information, the CNN must rely primarily upon total photon count returns, parallel and perpendicular photon count returns, and altitude to classify pixels as UTLS. The backscatter and depolarization criteria used by the operational algorithm to find UTLS aerosols are very similar to ice cloud characteristics. The CNN’s tendency to reclassify UTLS pixels as ice cloud is, then, understandable. Given that both methods’ negative detections are comparable and that the CNN’s positive detections are more precise (Table 2), reclassifying many UTLS pixels as clear sky is also understandable. In a case with an identified volcanic plume, however, the CNN does fail to classify it as UTLS, which renders the CNN’s UTLS discrimination suspect.

4. Results

We have demonstrated that machine-learning-based image semantic segmentation can be leveraged to streamline the analysis of photon-counting lidar data, allowing processing from raw photon counts to layer types that is faster, more reliable, and does not sacrifice spatial resolution. Our CNN algorithm is shown to outperform the operational algorithm in a few key ways. First, the CNN-based layer detection is superior to the operational algorithm in that it does not need to rely on spatial averaging to find layers, and it more accurately finds tenuous layers, as evidenced by a more than 14% increased agreement with simulated ground truth than the operational algorithm. Second, using the simulated ground truth data, we show the CNN-based CAD, particularly in the detection of aerosol layers, is superior to the operational algorithm in aggregate. Third, we find that our multitask learning strategy is effective at determining cloud phase, even without supplying the model with estimates of atmospheric temperatures.
The neural network does occasionally hallucinate the presence of ice cloud layers embedded within thick, highly backscattering dust layers. The weakly depolarizing polluted continental class is typically classed as smoke over land or marine over water by the CNN, which is reasonable given that polluted continental tends to require ancillary information to be typed. Our model also does not type dust mixture with high confidence, preferring to type dust mixture layers in the operational algorithm as marine. Finally, UTLS pixels in the L2O feature masks are not well recovered by the CNN. We have not tuned the model output or injected classification rules of the kind used by the operational algorithm outlined in Section 2.2.

5. Discussion

The loss of two aerosol classes, dust mixture and polluted continental, is acceptable in this case because their loss is outweighed by increases in spatial resolution, improved detection of tenuous layers, and the decrease in latency between initial measurement and creation of an elevated data product. Because the neural network is natively optimized to leverage GPU computing, it is capable of producing a data product in near-real time. There are embedded compute platforms that use GPU computing, which would allow for on-instrument data processing using this technique [20].
While our neural network was trained on the outputs of the CATS operational algorithm, we see a stark improvement in layer detection and different behavior in CAD and typing. We discuss potential reasons for this in Oladipo et al. [17] and summarize here. In a supervised learning context, in order to classify something, a model ingests a set of characteristics about the thing to be classified. Through the associated labels, the model learns that those characteristics determine membership to a particular label class. In the case where the labels are imperfect, a model will be asked to classify something with characteristics that point to a different class than the one that it is labeled. Such label noise has an impact, whose mitigation is an active field of work [41,42]. For an example of label noise in this work, the coarser horizontal resolution of the CATS operational algorithm, and therefore, the training data, will label pixels that should be labeled clear sky as a layer at the finer, native resolution (e.g., Figure 3). The neural network has the flexibility during training to disagree with that label if there are enough examples of correctly labeled layers and clear sky [43].
In the future, it may be possible that this style of photon-counting lidar data analysis can be fine-tuned to enable classification of other kinds of aerosols. Incorporating ancillary information in the input features, like temperature profiles, tropopause height, or simulated chemical species, may allow this style of lidar data processing to type additional aerosol classes with high confidence. There is also a strong precedent for including specific classification rules, like the kind used to correct for biases discussed in Section 2.2 or the previous section. Either strategy has the potential to improve the reliability of this technique’s data product. Finally, some lidar instruments provide measurements of backscatter and depolarization at multiple wavelengths, which provide additional physics-based probes into the characteristics of aerosols. This technique could easily be adapted to include multiple backscatter and depolarization inputs.

Author Contributions

Conceptualization, M.J.M. and J.G.; methodology, C.A.F., J.G. and P.A.S.; software, C.A.F., J.G. and P.A.S.; validation, C.A.F. and J.G.; formal analysis, C.A.F. and P.A.S.; investigation, C.A.F.; resources, M.J.M.; data curation, C.A.F. and P.A.S.; writing—original draft preparation, C.A.F.; writing—review and editing, J.G., P.A.S. and M.J.M.; visualization, C.A.F.; supervision, M.J.M. and J.G.; project administration, M.J.M.; funding acquisition, M.J.M. All authors have read and agreed to the published version of the manuscript.

Funding

This research was funded, in part, by National Aeronautics and Space Administration (NASA) grants 80NSSC23K0551 and 80NSSC23K0191.

Data Availability Statement

All CATS data products used in this paper and documents, such as the data products catalog, release notes, and algorithm theoretical basis documents (ATBDs), are available at the CATS website (https://cats.gsfc.nasa.gov) and/or the NASA Atmospheric Science Data Center Distributed Active Archive Center (DAAC; https://asdc.larc.nasa.gov/).

Acknowledgments

The authors thank our anonymous reviewers for their insightful comments that improved our work.

Conflicts of Interest

Author Patrick Selmer is employed by the company Science Systems and Applications, Inc. The remaining authors declare that the research was conducted in the absence of any commercial or financial relationships that could be construed as a potential conflict of interest.

Abbreviations

The following abbreviations are used in this manuscript:
ACATSAirborne Cloud–Aerosol Transport System
ATBDAlgorithm Theoretical Basis Document
CADCloud–Aerosol Discrimination
CATSCloud–Aerosol Transport System
CALIPSOCloud–Aerosol Lidar and Infrared Pathfinder Satellite Observation
CNNConvolutional Neural Network
CPLCloud Physics Lidar
FNfalse negative
FPfalse positive
GEOS-5NASA Goddard Earth Observing System version 5
ICESat-2Ice, Cloud, and Land Elevation Satellite-2
ISSInternational Space Station
MERRA-2Modern-Era Retrospective analysis for Research and Applications, Version 2
NRBNormalized Relative Backscatter
PDFProbability Density Function
SNRSignal-to-Noise Ratio
TNtrue negative
TPtrue positive
UTLSUpper Troposphere Lower Stratosphere
VFMVertical Feature Mask

References

  1. Hunt, W.H.; Winker, D.M.; Vaughan, M.A.; Powell, K.A.; Lucker, P.L.; Weimer, C. CALIPSO Lidar Description and Performance Assessment. J. Atmos. Ocean. Technol. 2009, 26, 1214–1228. [Google Scholar] [CrossRef]
  2. Markus, T.; Neumann, T.; Martino, A.; Abdalati, W.; Brunt, K.; Csatho, B.; Farrell, S.; Fricker, H.; Gardner, A.; Harding, D.; et al. The Ice, Cloud, and land Elevation Satellite-2 (ICESat-2): Science requirements, concept, and implementation. Remote Sens. Environ. 2017, 190, 260–273. [Google Scholar] [CrossRef]
  3. Gomez, J.L.; Allen, R.J.; Li, K.F. California wildfire smoke contributes to a positive atmospheric temperature anomaly over the western United States. Atmos. Chem. Phys. 2024, 24, 6937–6963. [Google Scholar] [CrossRef]
  4. McGraw, Z.; DallaSanta, K.; Polvani, L.M.; Tsigaridis, K.; Orbe, C.; Bauer, S.E. Severe Global Cooling After Volcanic Super-Eruptions? The Answer Hinges on Unknown Aerosol Size. J. Clim. 2024, 37, 1449–1464. [Google Scholar] [CrossRef]
  5. Vaughan, M.A.; Powell, K.A.; Winker, D.M.; Hostetler, C.A.; Kuehn, R.E.; Hunt, W.H.; Getzewich, B.J.; Young, S.A.; Liu, Z.; McGill, M.J. Fully Automated Detection of Cloud and Aerosol Layers in the CALIPSO Lidar Measurements. J. Atmos. Ocean. Technol. 2009, 26, 2034–2050. [Google Scholar] [CrossRef]
  6. Yorks, J.E.; McGill, M.J.; Palm, S.P.; Hlavka, D.L.; Selmer, P.A.; Nowottnick, E.P.; Vaughan, M.A.; Rodier, S.D.; Hart, W.D. An overview of the CATS level 1 processing algorithms and data products. Geophys. Res. Lett. 2016, 43, 4632–4639. [Google Scholar] [CrossRef]
  7. Proestakis, E.; Amiridis, V.; Marinou, E.; Binietoglou, I.; Ansmann, A.; Wandinger, U.; Hofer, J.; Yorks, J.; Nowottnick, E.; Makhmudov, A.; et al. EARLINET evaluation of the CATS Level 2 aerosol backscatter coefficient product. Atmos. Chem. Phys. 2019, 19, 11743–11764. [Google Scholar] [CrossRef]
  8. McGill, M.J.; Yorks, J.E.; Scott, V.S.; Kupchock, A.W.; Selmer, P.A. The Cloud-Aerosol Transport System (CATS): A technology demonstration on the International Space Station. In Proceedings of the Lidar Remote Sensing for Environmental Monitoring XV, San Diego, CA, USA, 9–13 August 2015; Singh, U.N., Ed.; International Society for Optics and Photonics, SPIE: Bellingham, WA, USA, 2015; Volume 9612, p. 96120A. [Google Scholar] [CrossRef]
  9. McGill, M.; Hlavka, D.; Hart, W.; Scott, V.S.; Spinhirne, J.; Schmid, B. Cloud Physics Lidar: Instrument description and initial measurement results. Appl. Opt. 2002, 41, 3725. [Google Scholar] [CrossRef]
  10. Yorks, J.E.; McGill, M.J.; Scott, V.S.; Wake, S.W.; Kupchock, A.; Hlavka, D.L.; Hart, W.D.; Selmer, P.A. The Airborne Cloud–Aerosol Transport System: Overview and Description of the Instrument and Retrieval Algorithms. J. Atmos. Ocean. Technol. 2014, 31, 2482–2497. [Google Scholar] [CrossRef]
  11. Pauly, R.M.; Yorks, J.E.; Hlavka, D.L.; McGill, M.J.; Amiridis, V.; Palm, S.P.; Rodier, S.D.; Vaughan, M.A.; Selmer, P.A.; Kupchock, A.W.; et al. Cloud-Aerosol Transport System (CATS) 1064 nm calibration and validation. Atmos. Meas. Tech. 2019, 12, 6241–6258. [Google Scholar] [CrossRef]
  12. Yorks, J.E.; Selmer, P.A.; Kupchock, A.; Nowottnick, E.P.; Christian, K.E.; Rusinek, D.; Dacic, N.; McGill, M.J. Aerosol and Cloud Detection Using Machine Learning Algorithms and Space-Based Lidar Data. Atmosphere 2021, 12, 606. [Google Scholar] [CrossRef]
  13. Minaee, S.; Boykov, Y.Y.; Porikli, F.; Plaza, A.J.; Kehtarnavaz, N.; Terzopoulos, D. Image Segmentation Using Deep Learning: A Survey. IEEE Trans. Pattern Anal. Mach. Intell. 2021, 44, 3523–3542. [Google Scholar] [CrossRef]
  14. Selmer, P.; Yorks, J.E.; Nowottnick, E.P.; Cresanti, A.; Christian, K.E. A Deep Learning Lidar Denoising Approach for Improving Atmospheric Feature Detection. Remote Sens. 2024, 16, 2735. [Google Scholar] [CrossRef]
  15. Tian, C.; Fei, L.; Zheng, W.; Xu, Y.; Zuo, W.; Lin, C.W. Deep learning on image denoising: An overview. Neural Netw. 2020, 131, 251–275. [Google Scholar] [CrossRef]
  16. Yorks, J.E.; Palm, S.P.; McGill, M.J.; Hlavka, D.L.; Hart, W.D.; Selmer, P.A.; Nowottnick, E.P. CATS Algorithm Theoretical Basis Document; Technical report; National Aeronautics and Space Administration, Goddard Space Flight Center: Greenbelt, MD, USA, 2016. [Google Scholar]
  17. Oladipo, B.; Gomes, J.; McGill, M.; Selmer, P. Leveraging Deep Learning as a New Approach to Layer Detection and Cloud–Aerosol Classification Using ICESat-2 Atmospheric Data. Remote Sens. 2024, 16, 2344. [Google Scholar] [CrossRef]
  18. Rienecker, M.M.; Suarez, M.J.; Todling, R.; Bacmeister, J.; Takacs, L.; Liu, H.C.; Gu, W.; Sienkiewicz, M.; Koster, R.D.; Gelaro, R.; et al. The GEOS-5 Data Assimilation System-Documentation of Versions 5.0.1, 5.1.0, and 5.2.0; Technical Report NASA/TM-2008-104606-VOL-27; NASA: Washington, DC, USA, 2008. [Google Scholar]
  19. Randles, C.; Da Silva, A.; Buchard, V.; Colarco, P.; Darmenov, A.; Govindaraju, R.; Smirnov, A.; Holben, B.; Ferrare, R.; Hair, J.; et al. The MERRA-2 aerosol reanalysis, 1980 onward. Part I: System description and data assimilation evaluation. J. Clim. 2017, 30, 6823–6850. [Google Scholar] [CrossRef]
  20. McGill, M.J.; Selmer, P.A.; Kupchock, A.W.; Yorks, J.E. Machine learning-enabled real-time detection of cloud and aerosol layers using airborne lidar. Front. Remote Sens. 2023, 4, 1116817. [Google Scholar] [CrossRef]
  21. CATS Data Release Notes: L1B Version 3.00, L2O Version 3.00. Available online: https://cats.gsfc.nasa.gov/media/docs/CATS_Release_Notes7.pdf (accessed on 3 April 2025).
  22. Nowottnick, E.P.; Christian, K.E.; Yorks, J.E.; McGill, M.J.; Midzak, N.; Selmer, P.A.; Lu, Z.; Wang, J.; Salinas, S.V. Aerosol Detection from the Cloud Aerosol Transport System on the International Space Station: Algorithm Overview and Implications for Diurnal Sampling. Atmosphere 2022, 13, 1439. [Google Scholar] [CrossRef]
  23. Liu, Z.; Vaughan, M.; Winker, D.; Kittaka, C.; Getzewich, B.; Kuehn, R.; Omar, A.; Powell, K.; Trepte, C.; Hostetler, C. The CALIPSO Lidar Cloud and Aerosol Discrimination: Version 2 Algorithm and Initial Assessment of Performance. J. Atmos. Ocean. Technol. 2009, 26, 1198–1213. [Google Scholar] [CrossRef]
  24. Yorks, J.E.; Hlavka, D.L.; Hart, W.D.; McGill, M.J. Statistics of cloud optical properties from airborne lidar measurements. J. Atmos. Ocean. Technol. 2011, 28, 869–883. [Google Scholar] [CrossRef]
  25. Aubry, C.; Delanoë, J.; Groß, S.; Ewald, F.; Tridon, F.; Jourdan, O.; Mioche, G. Lidar–radar synergistic method to retrieve ice, supercooled water and mixed-phase cloud properties. Atmos. Meas. Tech. 2024, 17, 3863–3881. [Google Scholar] [CrossRef]
  26. Omar, A.H.; Winker, D.M.; Vaughan, M.A.; Hu, Y.; Trepte, C.R.; Ferrare, R.A.; Lee, K.P.; Hostetler, C.A.; Kittaka, C.; Rogers, R.R.; et al. The CALIPSO automated aerosol classification and lidar ratio selection algorithm. J. Atmos. Ocean. Technol. 2009, 26, 1994–2014. [Google Scholar] [CrossRef]
  27. Gelaro, R.; McCarty, W.; Suárez, M.J.; Todling, R.; Molod, A.; Takacs, L.; Randles, C.A.; Darmenov, A.; Bosilovich, M.G.; Reichle, R.; et al. The Modern-Era Retrospective Analysis for Research and Applications, Version 2 (MERRA-2). J. Clim. 2017, 30, 5419–5454. [Google Scholar] [CrossRef] [PubMed]
  28. Buchard, V.; Randles, C.; Da Silva, A.; Darmenov, A.; Colarco, P.; Govindaraju, R.; Ferrare, R.; Hair, J.; Beyersdorf, A.; Ziemba, L.; et al. The MERRA-2 aerosol reanalysis, 1980 onward. Part II: Evaluation and case studies. J. Clim. 2017, 30, 6851–6872. [Google Scholar] [CrossRef] [PubMed]
  29. Long, J.; Shelhamer, E.; Darrell, T. Fully convolutional networks for semantic segmentation. In Proceedings of the IEEE Conference on Computer Vision and Pattern Recognition, Boston, MA, USA, 7–12 June 2015; pp. 3431–3440. [Google Scholar]
  30. Ronneberger, O.; Fischer, P.; Brox, T. U-Net: Convolutional Networks for Biomedical Image Segmentation. arXiv 2015, arXiv:1505.04597. [Google Scholar]
  31. Crawshaw, M. Multi-Task Learning with Deep Neural Networks: A Survey. arXiv 2020, arXiv:2009.09796. [Google Scholar]
  32. Loveland, T.R.; Reed, B.C.; Brown, J.F.; Ohlen, D.O.; Zhu, Z.; Yang, L.; Merchant, J.W. Development of a global land cover characteristics database and IGBP DISCover from 1 km AVHRR data. Int. J. Remote Sens. 2000, 21, 1303–1330. [Google Scholar] [CrossRef]
  33. Sudre, C.H.; Li, W.; Vercauteren, T.; Ourselin, S.; Jorge Cardoso, M. Generalised dice overlap as a deep learning loss function for highly unbalanced segmentations. In Proceedings of the Deep Learning in Medical Image Analysis and Multimodal Learning for Clinical Decision Support: Third International Workshop, DLMIA 2017, and 7th International Workshop, ML-CDS 2017, Held in Conjunction with MICCAI 2017, Québec City, QC, Canada, 14 September 2017; Proceedings 3. Springer: Cham, Switzerland, 2017; pp. 240–248. [Google Scholar]
  34. Paszke, A.; Gross, S.; Massa, F.; Lerer, A.; Bradbury, J.; Chanan, G.; Killeen, T.; Lin, Z.; Gimelshein, N.; Antiga, L.; et al. PyTorch: An imperative style, high-performance deep learning library. In Proceedings of the 33rd International Conference on Neural Information Processing Systems, Vancouver, BC, Canada, 8–14 December 2019; Curran Associates Inc.: Red Hook, NY, USA, 2019. [Google Scholar]
  35. Kingma, D.P.; Ba, J. Adam: A Method for Stochastic Optimization. In Proceedings of the 3rd International Conference on Learning Representations, ICLR 2015, San Diego, CA, USA, 7–9 May 2015. [Google Scholar]
  36. Nowottnick, E.P.; Yorks, J.E.; McGill, M.J.; Selmer, P.A.; Christian, K.E. A Simulation Capability Developed for NASA GSFC’s Spaceborne Backscatter Lidars: Overview and Projected Performance for the Upcoming AOS Mission. In Proceedings of the 30th International Laser Radar Conference, Virtual, 26 June 2022; Sullivan, J.T., Leblanc, T., Tucker, S., Demoz, B., Eloranta, E., Hostetler, C., Ishii, S., Mona, L., Moshary, F., Papayannis, A., et al., Eds.; Springer: Cham, Switzerland, 2023; pp. 675–681. [Google Scholar]
  37. Young, S.A.; Vaughan, M.A. The Retrieval of Profiles of Particulate Extinction from Cloud-Aerosol Lidar Infrared Pathfinder Satellite Observations (CALIPSO) Data: Algorithm Description. J. Atmos. Ocean. Technol. 2009, 26, 1105–1119. [Google Scholar] [CrossRef]
  38. Gutro, R. Several Washington State Fires Rage; NASA: Washington, DC, USA, 2015. [Google Scholar]
  39. Hu, Y. Depolarization ratio–effective lidar ratio relation: Theoretical basis for space lidar cloud phase discrimination. Geophys. Res. Lett. 2007, 34, L11812. [Google Scholar] [CrossRef]
  40. Illingworth, A.J.; Barker, H.W.; Beljaars, A.; Ceccaldi, M.; Chepfer, H.; Clerbaux, N.; Cole, J.; Delanoë, J.; Domenech, C.; Donovan, D.P.; et al. The EarthCARE Satellite: The Next Step Forward in Global Measurements of Clouds, Aerosols, Precipitation, and Radiation. Bull. Am. Meteorol. Soc. 2015, 96, 1311–1332. [Google Scholar] [CrossRef]
  41. Han, B.; Yao, Q.; Liu, T.; Niu, G.; Tsang, I.W.; Kwok, J.T.; Sugiyama, M. A Survey of Label-noise Representation Learning: Past, Present and Future. arXiv 2020, arXiv:2011.04406. [Google Scholar] [CrossRef]
  42. Frenay, B.; Verleysen, M. Classification in the Presence of Label Noise: A Survey. IEEE Trans. Neural Netw. Learn. Syst. 2014, 25, 845–869. [Google Scholar] [CrossRef] [PubMed]
  43. Rolnick, D.; Veit, A.; Belongie, S.; Shavit, N. Deep Learning is Robust to Massive Label Noise. arXiv 2017, arXiv:1705.10694. [Google Scholar] [CrossRef]
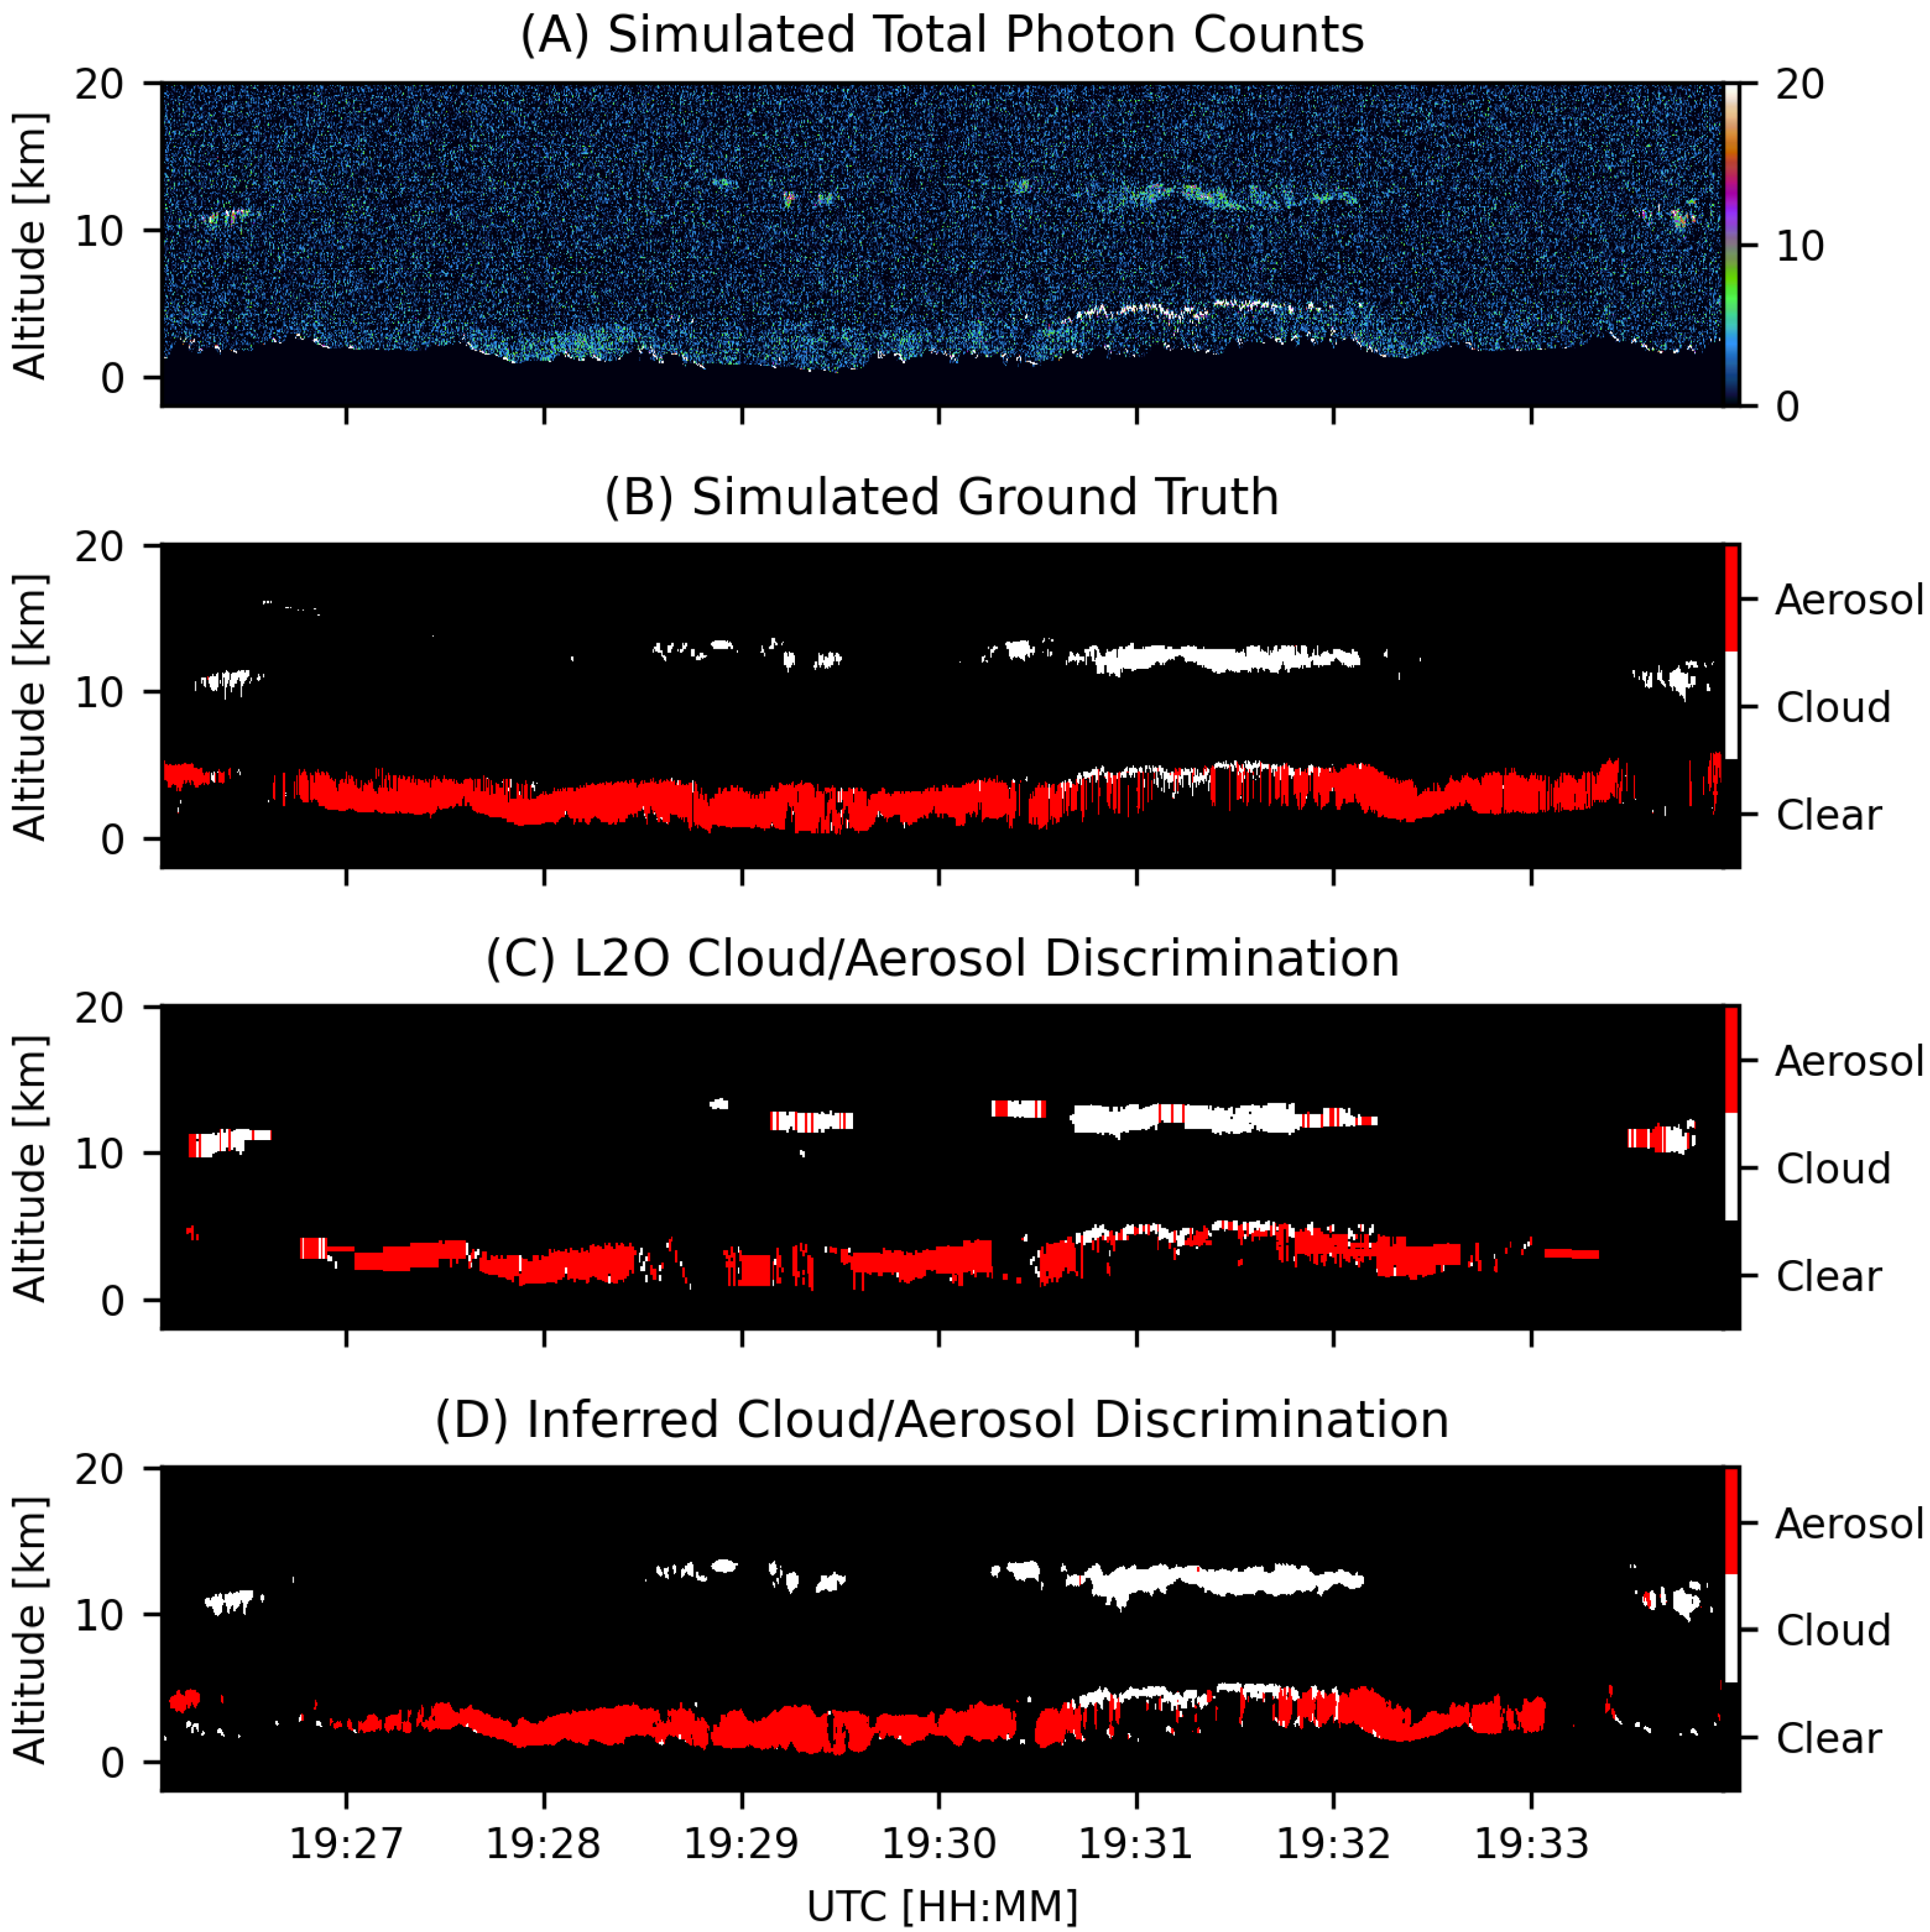
Figure 1. Curtain plots that show simulated CATS data generated from Cloud-Physics Lidar (CPL) measurements and analyzed by both the operational algorithm and our best neural network. Data are plotted altitude [km] vs. observation time [UTC]. Panel (A) shows the total photon counts, (B) the ground truth feature mask, (C) the operational algorithm’s CAD, and (D) the neural network’s CAD. The data here were originally recorded on 18 August 2015. Spatial averaging to 60 km in (C) loses detail in the cloud features near 10 km altitude and fewer aerosol pixels are correctly identified.
Remotesensing 17 02787 g001
Figure 2. (A) The pixel-by-pixel comparison of the operational algorithm’s CAD against the simulated ground truth, and (B) the same but for the neural network’s CAD. The comparison labels are defined in the text. The operational algorithm has a higher false positive rate and the neural network has a lower false negative rate, which implies that the CNN outperforms the operational algorithm’s CAD and layer detection.
Remotesensing 17 02787 g002
Figure 3. An example daytime record selected to contrast the operational algorithm and CNN cloud phase typing. The data were recorded on 1 February 2016. Panel (A) is the total photon count data with background subtracted and ground removed, (B) is the operational algorithm types, and (C) the CNN types. The polluted continental and clean background types are abbreviated poll coll and clean, respectively. Panel (D) is a pixel-by-pixel comparison of panels (B,C) with cases defined in Section 2.5. In the absence of ground truth, the comparison is arbitrary and we chose the operational algorithm to be truth. The neural network is skeptical of the operational algorithm’s layer finding, as evidenced by the False Negative and False Positive bins.
Remotesensing 17 02787 g003
Figure 4. An example nighttime record containing a low-altitude polluted continental layer identified by the operational algorithm, between 20:45 UTC and 20:52 UTC, that is typed as smoke and marine by the CNN. CATS recorded these data on 4 December 2015 near the coast of the Bay of Bengal. As the ground surface type transitioned from land to water, the CNN changed its class from smoke to marine.
Remotesensing 17 02787 g004
Figure 5. A diverse nighttime scene containing wildfire activity in the Pacific Northwest on 15 August 2015 with the same panels as Figure 3. There is a known smoke layer below 10 km and before 4:04 UTC. Strong SNR at night makes both methods’ layer detection accurate, as evidenced by the few False Negative/False Positive cases in panel (D). The aerosol layer above the water cloud layer near 4:24 UTC is typed as several kinds by the operational algorithm, but is typed as dust by the CNN.
Remotesensing 17 02787 g005
Figure 6. A nighttime record observed on 17 June 2015 that contains a large Saharan dust plume with the same panels as Figure 3. There is attenuation due to material at top of the plume that causes the vertical striping seen in the photon counts that results in no layer identified by either the operational algorithm or the neural network. The neural network determines that there are ice cloud layers embedded in the plume, whose existence is dubious.
Remotesensing 17 02787 g006
Table 1. The number, or support, of each class present in the training dataset. The dust mixture label is abbreviated as mix and the polluted continental label is abbreviated as poll. The training dataset consists of all day and night data from October of 2017.
ClearWaterIceMarineDustMixCleanPollSmokeUTLS
9.9 × 10 8 1.6 × 10 7 8.7 × 10 7 3.7 × 10 6 5.7 × 10 6 1.5 × 10 6 7.6 × 10 5 8.7 × 10 5 3.3 × 10 6 1.6 × 10 6
Table 2. Precision, recall, F1 score, and support, defined in the text, calculated for the L2O and CNN against the simulated ground truth. The better performance of the two CAD methods, or both in the case of a tie, is highlighted in bold. The three simulated scenes supply about 10 million pixels for comparison. The CNN is superior across the board, except for cloud recall, where it is comparable.
PrecisionRecallF1 ScoreSupport
Clear Sky0.980.990.989,406,732
L2OCloud0.600.800.69195,664
Aerosol0.730.450.56286,353
Clear Sky0.980.990.989,406,732
CNNCloud0.670.750.71195,664
Aerosol0.870.610.71286,353
Table 3. Non-normalized confusion calculated between the operational algorithm and the neural network classifications on the daytime test dataset. The rows represent the CNN’s classifications for the operational algorithm’s dust mixture and polluted continental aerosol classes. The CNN infers that 39,841 of the operational algorithm’s dust mixture pixels are marine, for example. The CNN does not predict dust mixture or polluted continental classes.
ClearWaterIceMarineDustMixCleanPollSmokeUTLS
mix71,76534,020405339,84110,6920148032250
poll65,148889923,505183324,75501238053721
Disclaimer/Publisher’s Note: The statements, opinions and data contained in all publications are solely those of the individual author(s) and contributor(s) and not of MDPI and/or the editor(s). MDPI and/or the editor(s) disclaim responsibility for any injury to people or property resulting from any ideas, methods, instructions or products referred to in the content.