Article

Global Aerosol Climatology from ICESat-2 Lidar Observations

1
Iowa Technology Institute, The University of Iowa, Iowa City, IA 52242, USA
2
Department of Chemical and Biochemical Engineering, The University of Iowa, Iowa City, IA 52242, USA
3
Science System and Applications, Inc., Lanham, MD 20706, USA
*
Author to whom correspondence should be addressed.
Remote Sens. 2025, 17(13), 2240; https://doi.org/10.3390/rs17132240
Submission received: 16 May 2025 / Revised: 24 June 2025 / Accepted: 26 June 2025 / Published: 30 June 2025

Abstract

This study presents a global aerosol climatology derived from six years (October 2018–October 2024) of the Ice, Cloud, and land Elevation Satellite-2 (ICESat-2) observations, using a U-Net Convolutional Neural Network (CNN) machine learning algorithm for Cloud–Aerosol Discrimination (CAD). Despite ICESat-2’s design primarily as an altimetry mission with a single-wavelength, low-power, high-repetition-rate laser, ICESat-2 effectively captures global aerosol distribution patterns and can provide valuable insights to bridge the observational gap between the Cloud–Aerosol Lidar and Infrared Pathfinder Satellite Observations (CALIPSO) and Earth Cloud, Aerosol and Radiation Explorer (EarthCARE) missions to support future spaceborne lidar mission design. The machine learning approach outperforms traditional thresholding methods, particularly in complex conditions of cloud embedded in aerosol, owing to a finer spatiotemporal resolution. Our results show that annually, between 60°S and 60°N, 78.4%, 17.0%, and 4.5% of aerosols are located within the 0–2 km, 2–4 km, and 4–6 km altitude ranges, respectively. Regional analyses cover the Arabian Sea (ARS), Arabian Peninsula (ARP), South Asia (SAS), East Asia (EAS), Southeast Asia (SEA), the Americas, and tropical oceans. Vertical aerosol structures reveal strong trans-Atlantic dust transport from the Sahara in summer and biomass burning smoke transport from the Savanna during dry seasons. Marine aerosol belts are most prominent in the tropics, contrasting with earlier reports of the Southern Ocean maxima. This work highlights the importance of vertical aerosol distributions needed for more accurate quantification of the aerosol–cloud interaction influence on radiative forcing for improving global climate models.

1. Introduction

Investigation of global aerosol climatology is essential for understanding the feedback between humans and nature and improving air quality, chemical transport, and climate models to address climate change. Anthropogenic aerosols contribute the second-largest radiative forcing to climate change after greenhouse gases, but with large uncertainty due to their short lifetime, diverse sources, and complex physical and chemical properties [1]. This uncertainty arises more from aerosol–cloud interactions (i.e., indirect radiative forcing), which alter cloud microphysics, than from direct aerosol radiative effects, which influence Earth’s radiation budget through scattering and absorption [2]. High-resolution vertical aerosol profiles with global coverage from spaceborne lidar are critical for constraining climate models and improving estimates of both direct and indirect aerosol forcing [3,4].
Global aerosol observations are primarily obtained through a combination of ground-based monitoring networks and satellite-based sensors. For example, since the 1990s, the AErosol RObotic NETwork (AERONET) has provided long-term, globally distributed measurements of aerosol optical properties, including spectral aerosol optical depth (AOD), Ångström exponent, single-scattering albedo, and particle size distribution using standardized sun photometers [5]. These measurements are valuable for characterizing aerosol optical properties of different types (e.g., [6]), evaluating climate models (e.g., [7]), and validating satellite retrievals (e.g., [8]).
In the 1970s, Total Ozone Mapping Spectrometer (TOMS), originally designed for ozone monitoring, made the first global observations of absorbing aerosols using near-UV channels [9]. Throughout the next two decades, other passive remote sensing sensors, such as Advanced Very-High-Resolution Radiometer (AVHRR), Moderate Resolution Imaging Spectroradiometer (MODIS), and Multiangle Imaging Spectroradiometer (MISR), gradually expanded aerosol observations to cover more wavelengths, multiple viewing angles, more products (e.g., AOD, fine/coarse mode fraction, aerosol type), with improved spatial resolution and accuracy [10,11,12]. However, despite their global coverage, passive sensors cannot directly retrieve vertical aerosol profiles, which are often assumed within retrieval algorithms. This limitation has led to the development of spaceborne active remote sensing systems, particularly lidars, for aerosol profiling.
Cloud–Aerosol Lidar with Orthogonal Polarization (CALIOP, 2006–2023) onboard CALIPSO was the first operational lidar designed for atmospheric studies, which measured vertical aerosol profiles at 532 and 1064 nm as well as the 532 nm depolarization [13]. CATS (Cloud–Aerosol Transport System, 2015–2017) onboard the International Space Station was another spaceborne lidar system operating at 532 and 1064 nm plus depolarization measurement capability [14,15]. CATS served primarily as a technology demonstration mission for future lidar systems, with a smaller budget and shorter mission duration than CALIOP. ATLAS (Advanced Topographic Laser Altimeter System, 2018–present) onboard the ICESat-2 satellite is another operational spaceborne lidar operating at a single wavelength of 532 nm. While its primary mission is focused on altimetry, particularly in polar regions, ATLAS also collects atmospheric backscatter data useful for aerosol studies [16]. A further introduction to the ICESat-2 lidar will be provided in Section 2.1. The most recent addition to spaceborne lidar is the EarthCARE mission (2024–present), which measures both elastic backscatter and depolarization at 355 nm [17]. Unlike its predecessors, the EarthCARE lidar uses High Spectral Resolution Lidar (HSRL) technology to separate molecular and particulate (or Mie) backscatter, enabling retrieval of lidar ratio to derive aerosol extinction coefficients more accurately [18].
The ICESat-2 lidar plays an important role in the legacy of spaceborne lidar observations. It helps bridge the one-year observational gap between the CALIPSO and EarthCARE missions by providing global aerosol and cloud height distributions. Moreover, its share wavelength (532 nm) with CALIPSO and CATS is valuable for harmonizing long-term atmospheric records of wavelength dependent variables, such as profiles of attenuated backscatter.
A global aerosol climatology derived from spaceborne lidar data has significantly advanced our understanding of various aspects of atmospheric science, particularly the vertical distribution of aerosols. For example, Yu et al. [19] compared 1.5 years of CALIOP data with the Goddard Chemistry Aerosol Radiation and Transport (GOCART) model and found that the model generally overestimated aerosol scale height, indicating more concentrated aerosols at lower altitudes. Winker et al. [13] analyzed six years of CALIOP data to characterize the seasonal variation of aerosol scale heights, providing a quantitative assessment of elevated aerosol layers along major transport pathways. Their studies also suggested increased measurement uncertainties under low aerosol loading conditions, especially in the upper troposphere, due to lidar’s detection limits. Further studies by Huang et al. [20], Shikwambana and Sivakumar [21], and Pan et al. [22] examined the seasonal variations in global aerosol vertical distributions for different aerosol types using CALIOP data, offering new perspectives on the regional and global transport of dust and smoke. In addition to climatology, Gui et al. [23] explored trends and drivers of changes in aerosol vertical profiles. Leveraging the non-sun-synchronous orbit of the CATS lidar, Lee et al. [24] and Yu et al. [25] investigated diurnal variability in global aerosol distributions, complementing seasonal cycle. Most recently, Christian et al. [26] assessed aerosol climatology derived from ICESat-2 by comparing it with MODIS and CALIOP data, offering insights into the appropriate use of ICESat-2 aerosol products.
In this study, we describe our aerosol retrieval method and apply it to six years of ICESat-2 data to analyze global aerosol layer distributions over land and ocean. Our first objective is to evaluate the retrieval method by comparing it with the conventional ICESat-2 algorithm using a large dataset. Second, we examine global aerosol climatology using ICESat-2 observations and assess the capabilities of a single-wavelength elastic lidar relative to previous studies. Finally, we identify current limitations and challenges that need to be addressed in future algorithm development.

2. Material and Methods

2.1. ICESat-2

ICESat-2 has been providing Earth observation data since October 2018, primarily for monitoring ice sheet changes, land surface topography, and vegetation height [16]. The satellite was launched to a near-polar, sun-asynchronous orbit with an inclination angle of 92°, allowing coverage up to 88°N and 88°S, and a 91-day repeat cycle. The ICESat-2 laser operates at a single wavelength of 532 nm, a pulse energy of 500 µJ, and a repetition rate of 10 kHz. The laser beam is split into six individual beams arranged in three pairs, each consisting of one strong beam and one weak beam. The pulse energy of the strong beams is approximately four times that of the weak beams (about 25 µJ/pulse) [27]. The altimetry measurements use all six laser beams while the atmospheric channel uses only the three strong beams (designated profile_1, profile_2 and profile_3). This study uses ATL09 products derived from profile_1. Within each pair, the strong and weak beams are separated by 90 m, while cross-track spacing between beam pairs is approximately 3 km. The nominal ground footprint diameter is about 17 m, with an along-track sampling interval of 0.7 m. For atmospheric profiling, backscatter signals are averaged over 400 laser shots onboard (i.e., 25 Hz) to form one profile, yielding an along-track resolution of approximately 280 m. This results in a fundamental horizontal resolution of 17 × 280 m and a vertical resolution of 30 m.
While the high repetition rate of 10 kHz is well suited to the primary altimetry mission, it introduces a challenge for atmospheric measurements. The 100 µs interval between pulses corresponds to a range of 15 km (or a 30 km round-trip), meaning the detector may misattribute photons returned from greater distances. This effect, known as “folding,” occurs when backscatter from heights above 15 km is aliased to lower altitudes (e.g., a 16 km cloud may appear at 1 km altitude); see [27] for details. This phenomenon can lead to false detections of aerosol layers, particularly in the tropics and polar regions where high-altitude clouds are common.
Another limitation of the short 15 km atmospheric range window is the difficulty in accurately estimating the background signal, especially during daytime. The background signal, which must be subtracted before retrieving aerosol parameters (e.g., extinction coefficient), includes solar background and dark counts. ICESat-2 lidar uses low-dark-current photon-counting detectors, making the solar background the dominant noise source during the daytime. In most lidar systems, the background is estimated by averaging the range window where no laser signal returns are expected [28]. However, for ICESat-2, backscatter from clouds is often present between 14 and 15 km, making background estimation more complex. Therefore, a modeled background based on solar zenith angle (SZA) is required [29], which becomes especially challenging during twilight when the SZA changes rapidly.
Additionally, ICESat-2 measurements are affected by the South Atlantic anomaly (SAA), a region of weakened geomagnetic field over southeastern South America that exposes low Earth orbit satellites to increased fluxes of energetic particles [30]. These high-energy particles increase detector dark count rates, particularly during nighttime, when solar background is low [31,32]. Despite post-processing background calibration to mitigate the SAA effects [27], we still observed a small percentage of data with abnormally enhanced backscatter during nighttime or twilight in the SAA region, leading to false aerosol classifications. These artifacts were removed manually through visual inspection.
This study employs Level-3 ATL09 version 006 ICESat-2 data acquired during both daytime and nighttime between October 2018 and October 2024. Due to the relatively weak laser output of ICESat-2, signal-to-noise ratio (SNR) during daytime is generally insufficient to detect all aerosols. Despite this, we include both daytime and nighttime observations for several reasons. First, limiting ourselves to nighttime data would overlook important climatological signals such as diurnal variability of aerosols in the planetary boundary layer (PBL), particularly over land. ICESat-2’s non-sun-synchronous orbit enables measuring diurnal changes. Second, CNN has demonstrated improved capability for ICESat-2 in resolving thin clouds embedded within aerosol layers during daytime, as shown in multiple case studies by Oladipo et al. [33]. This is consistent with findings from Yorks et al. [34], who reported that the CNN enabled 40% more atmospheric feature detections during daytime with higher horizontal resolution compared to the traditional method for CATS. Third, including both day and night data allows more direct comparison with previous studies using similar datasets (e.g., [26]). Finally, the baseline dataset produced in this study will be useful for benchmarking future denoising algorithms, which are expected to improve daytime retrievals.

2.2. ICESat-2 ATL09 CAD Algorithm

The atmospheric feature detection in ICESat-2 ATL09 products involves two main steps: layer detection and type discrimination [27]. The normalized relative backscatter (NRB) is first derived from the raw photon counts through laser energy normalization, range correction, and background subtraction. The accuracy of this correction strongly influences the quality of subsequent feature classification. To enhance the SNR, the density dimension algorithm (DDA) applies a Gaussian radial basis function to the two-dimensional NRB matrix, generating a density field. This algorithm is designed to adapt to varying solar background conditions and utilizes an auto-adaptive threshold to distinguish atmospheric features (clouds and aerosols) from background noise. DDA performs three separate density calculations (an increase from two in earlier versions), each with different parameter settings to balance sensitivity to optically thin layers with the need for accurate boundary delineation. In the latest Version 006 of ATL09, both the minimum detected layer thickness and the minimum vertical separation between layers are set to 90 m, defining a “nominal” vertical resolution of 90 m.
Following detection, layers are classified as aerosol or cloud based on a confidence factor, which is derived from probability distribution functions [35] using a combination of the attenuated backscatter coefficient, layer altitude, and modeled relative humidity (RH) [29]. However, CAD for ICESat-2 is particularly challenging due to its operation at a single wavelength (532 nm) and lack of depolarization capability, in contrast to CALIOP, which benefits from dual-wavelength (532 and 1064 nm) and polarization measurement at 532 nm, enabling more accurate feature classification. To compensate for these limitations, ICESat-2 relies heavily on external model products (e.g., Goddard Earth Observing System model, version 5, or GEOS-5) to support feature discrimination. However, the lower spatial and temporal resolution of these models compared to the lidar data can introduce additional uncertainties. Due to its weaker laser output relative to CALIOP, ICESat-2 is expected to have a lower aerosol detection rate during daytime, though cloud detection is less affected due to the generally stronger signal returns from clouds. Beyond clouds and aerosols, Version 006 of ATL09 also includes additional layer classifications such as blowing snow and diamond dust. These are identified using a separate algorithm that incorporates surface type (snow or ice) and model-derived surface wind speeds [29]. For simplicity, we hereafter refer to the traditional algorithm used to generate the ICESat-2 ATL09 layer attributes, including both the layer detection (i.e., DDA) and type discrimination processes [27], as the “ATL09 CAD”.

2.3. CNN U-Net CAD Algorithm

Machine learning algorithms have been employed in previous studies to enhance aerosol detection accuracy [34,36], improve aerosol type classification [37], and reduce data delivery latency [38].
Our CAD approach to ICESat-2 employs a CNN designed for pixel-wise semantic segmentation [33]. The CNN is built upon the widely used U-Net architecture [39], which enables efficient training on patches of ICESat-2 data and supports full-profile inference through dense, feedforward computation. The framework adopts a binary and multi-task learning strategy, where we first identify atmospheric layers and then classify them as either clouds or aerosols. Experimental results indicate that this task decoupling significantly enhances the accuracy of CAD. This two-stage deep learning model, employing different neural network operations for each task, is illustrated in Figure 1. Validation experiments reveal that the optimal depth (defined here as the receptive field, or the input window size used to predict a single bin) is 4 for layer detection and 1 for layer classification. An ensemble of these two models, each with its optimized depth, achieves superior discrimination performance at fine spatial resolution.
There are two main differences in the training process compared to that of Oladipo et al. [33]. First, SZA was included as an additional input variable for training, alongside calibrated attenuated backscatter (derived from NRB), bin altitude, and RH. While the inclusion of SZA resulted in a slight improvement in nighttime aerosol detection, it did not significantly enhance the identification of missing aerosols during daytime due to low SNR, suggesting future denoising techniques are needed. Second, the training dataset was constructed using two arbitrarily selected days (~15 granules per day) from each month of 2019 to increase the diversity of temporal and spatial sampling. In contrast, Oladipo et al. [33] trained their model on data from a single month (November 2018). Despite these changes, we observed no major differences in prediction results, aside from a slight improvement in nighttime aerosol identification and a slight reduction in training computational time.
Figure 2 presents an example comparing the classification results from the traditional ATL09 CAD algorithm with those from our CNN-based method. The data spans approximately 18 min of nighttime observations over the Atlantic Ocean. (There are two data discontinuities due to instrument adjustments.) While both algorithms agree well overall, several distinctions are evident in the details. For layer finding, the CNN model more accurately identifies thin layer features with higher vertical resolution compared to DDA (the first step defined in Section 2.2). For example, at ~44°N (labeled “1” in Figure 2), the CNN detects thin aerosol layers in the free troposphere that are largely missed by the DDA. At ~10°N (“2” in Figure 2), the CNN resolves thin clear-sky gaps embedded within aerosol layers, while the DDA often misclassifies these regions as layers or fails to capture the boundaries of thin features.
Regarding CAD, the CNN performs notably better in mixed scenes, typically within the PBL. Between 2°N and 35°N, ATL09 CAD tends to represent both aerosol and cloud layers as vertically blocky, columnar structures, while the CNN is capable of separating thin clouds from aerosols with finer vertical resolution. A clear example is at ~19°N (“3” in Figure 2), where the CNN successfully distinguishes clouds and aerosols under complex mixing conditions, while ATL09 CAD mostly assigns the entire vertical column within the PBL as either only cloud or only aerosol. The case study suggests that the CNN-based algorithm outperforms the traditional algorithm in both layer detection and feature discrimination, primarily owing to its better vertical resolving capability.
Overall, the CNN algorithm tends to identify more aerosols than the traditional algorithm in regions where cloud–aerosol mixing is frequent, such as over oceans. However, a limitation of our CNN approach lies in its dependence on the ATL09 CAD products as “ground truth” during training. These original ATL09 labels themselves contain uncertainties, which inevitably propagate into the CNN model. For example, both algorithms fail to fully capture the aerosol belt near ~44°N (“1” in Figure 2), though the CNN misses less of it. Future improvements in training data quality would lead to further enhancement in CNN accuracy.

3. Results

The single-wavelength limitation of ICESat-2 imposes constraints on aerosol property retrievals, particularly in differentiating aerosol types and estimating AOD. Without multi-wavelength or depolarization measurements, it is challenging to infer aerosol microphysical properties such as size distribution, shape, or composition, factors in determining the lidar ratio. Consequently, ICESat-2 does not currently provide aerosol extinction coefficient or aerosol type products like CALIPSO does. However, ICESat-2’s high vertical resolution and consistent global coverage still provide valuable information on aerosol layer heights and vertical distributions, which are critical for understanding aerosol transport processes and global climatology. So, we use the Frequency of Occurrence (FoO), defined as the ratio of the number of detected aerosol (or cloud) samples to the total number of samples within a specified spatial range. While this approach does not account for AOD variability associated with different aerosol types and hygroscopicity, it provides a practical metric for assessing aerosol and cloud presence. We approach the comparison between FoO and AOD with caution, as aerosol scattering generally increases with RH due to hygroscopic growth, particularly for aerosols containing water-soluble components such as sulfate and organic carbon [41].
To align with the spatial resolution of global models, the swath-level FoO data from each granule were gridded to a 1° × 1° horizontal resolution, while maintaining the native 30 m vertical resolution. For climatological analysis, we first computed monthly averages, which were then aggregated into seasonal means and ultimately annual means.
We observed that both the traditional and CNN algorithms occasionally misclassify blowing snow in the Arctic as aerosols, although they mostly identify it as clouds. This suggests that, despite the inclusion of blowing snow as a separate class in the traditional algorithm, classification uncertainties in polar regions remain noticeable. As a result, we excluded polar regions from this study due to the greater uncertainty in aerosol retrievals compared to other latitudes. Diamond dust can also be misclassified as aerosols, but its occurrence is less frequent than that of blowing snow.

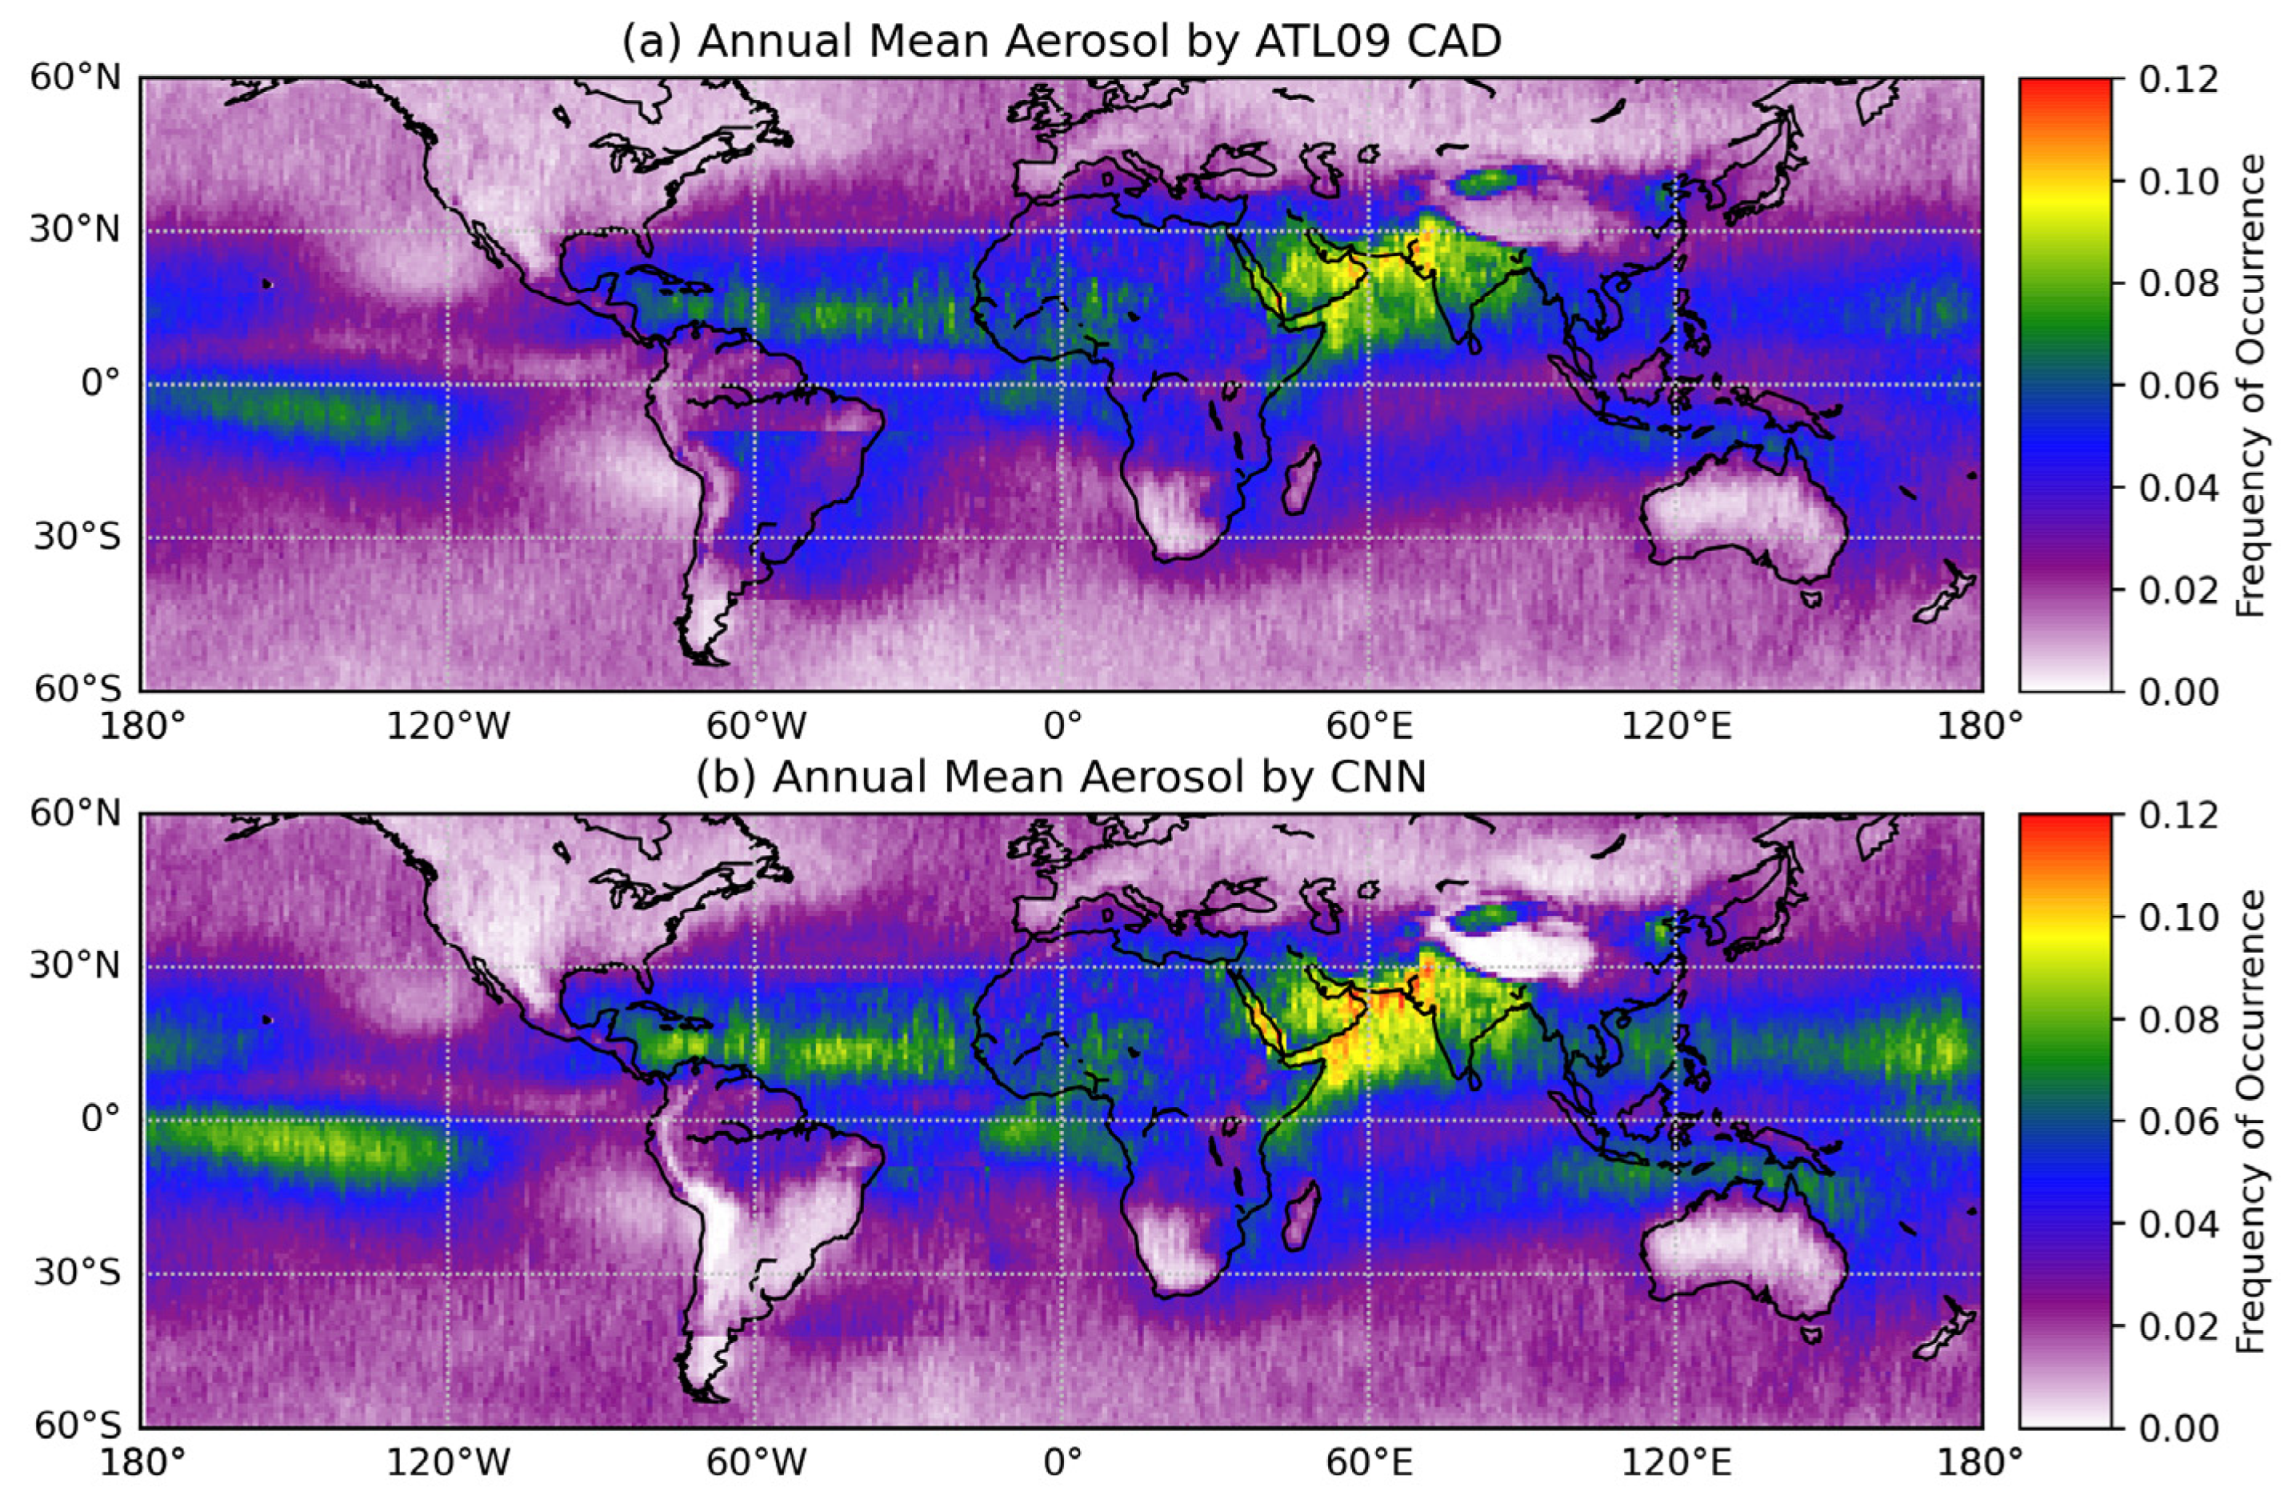
3.1. Comparison of Results by ATL09 CAD and CNN
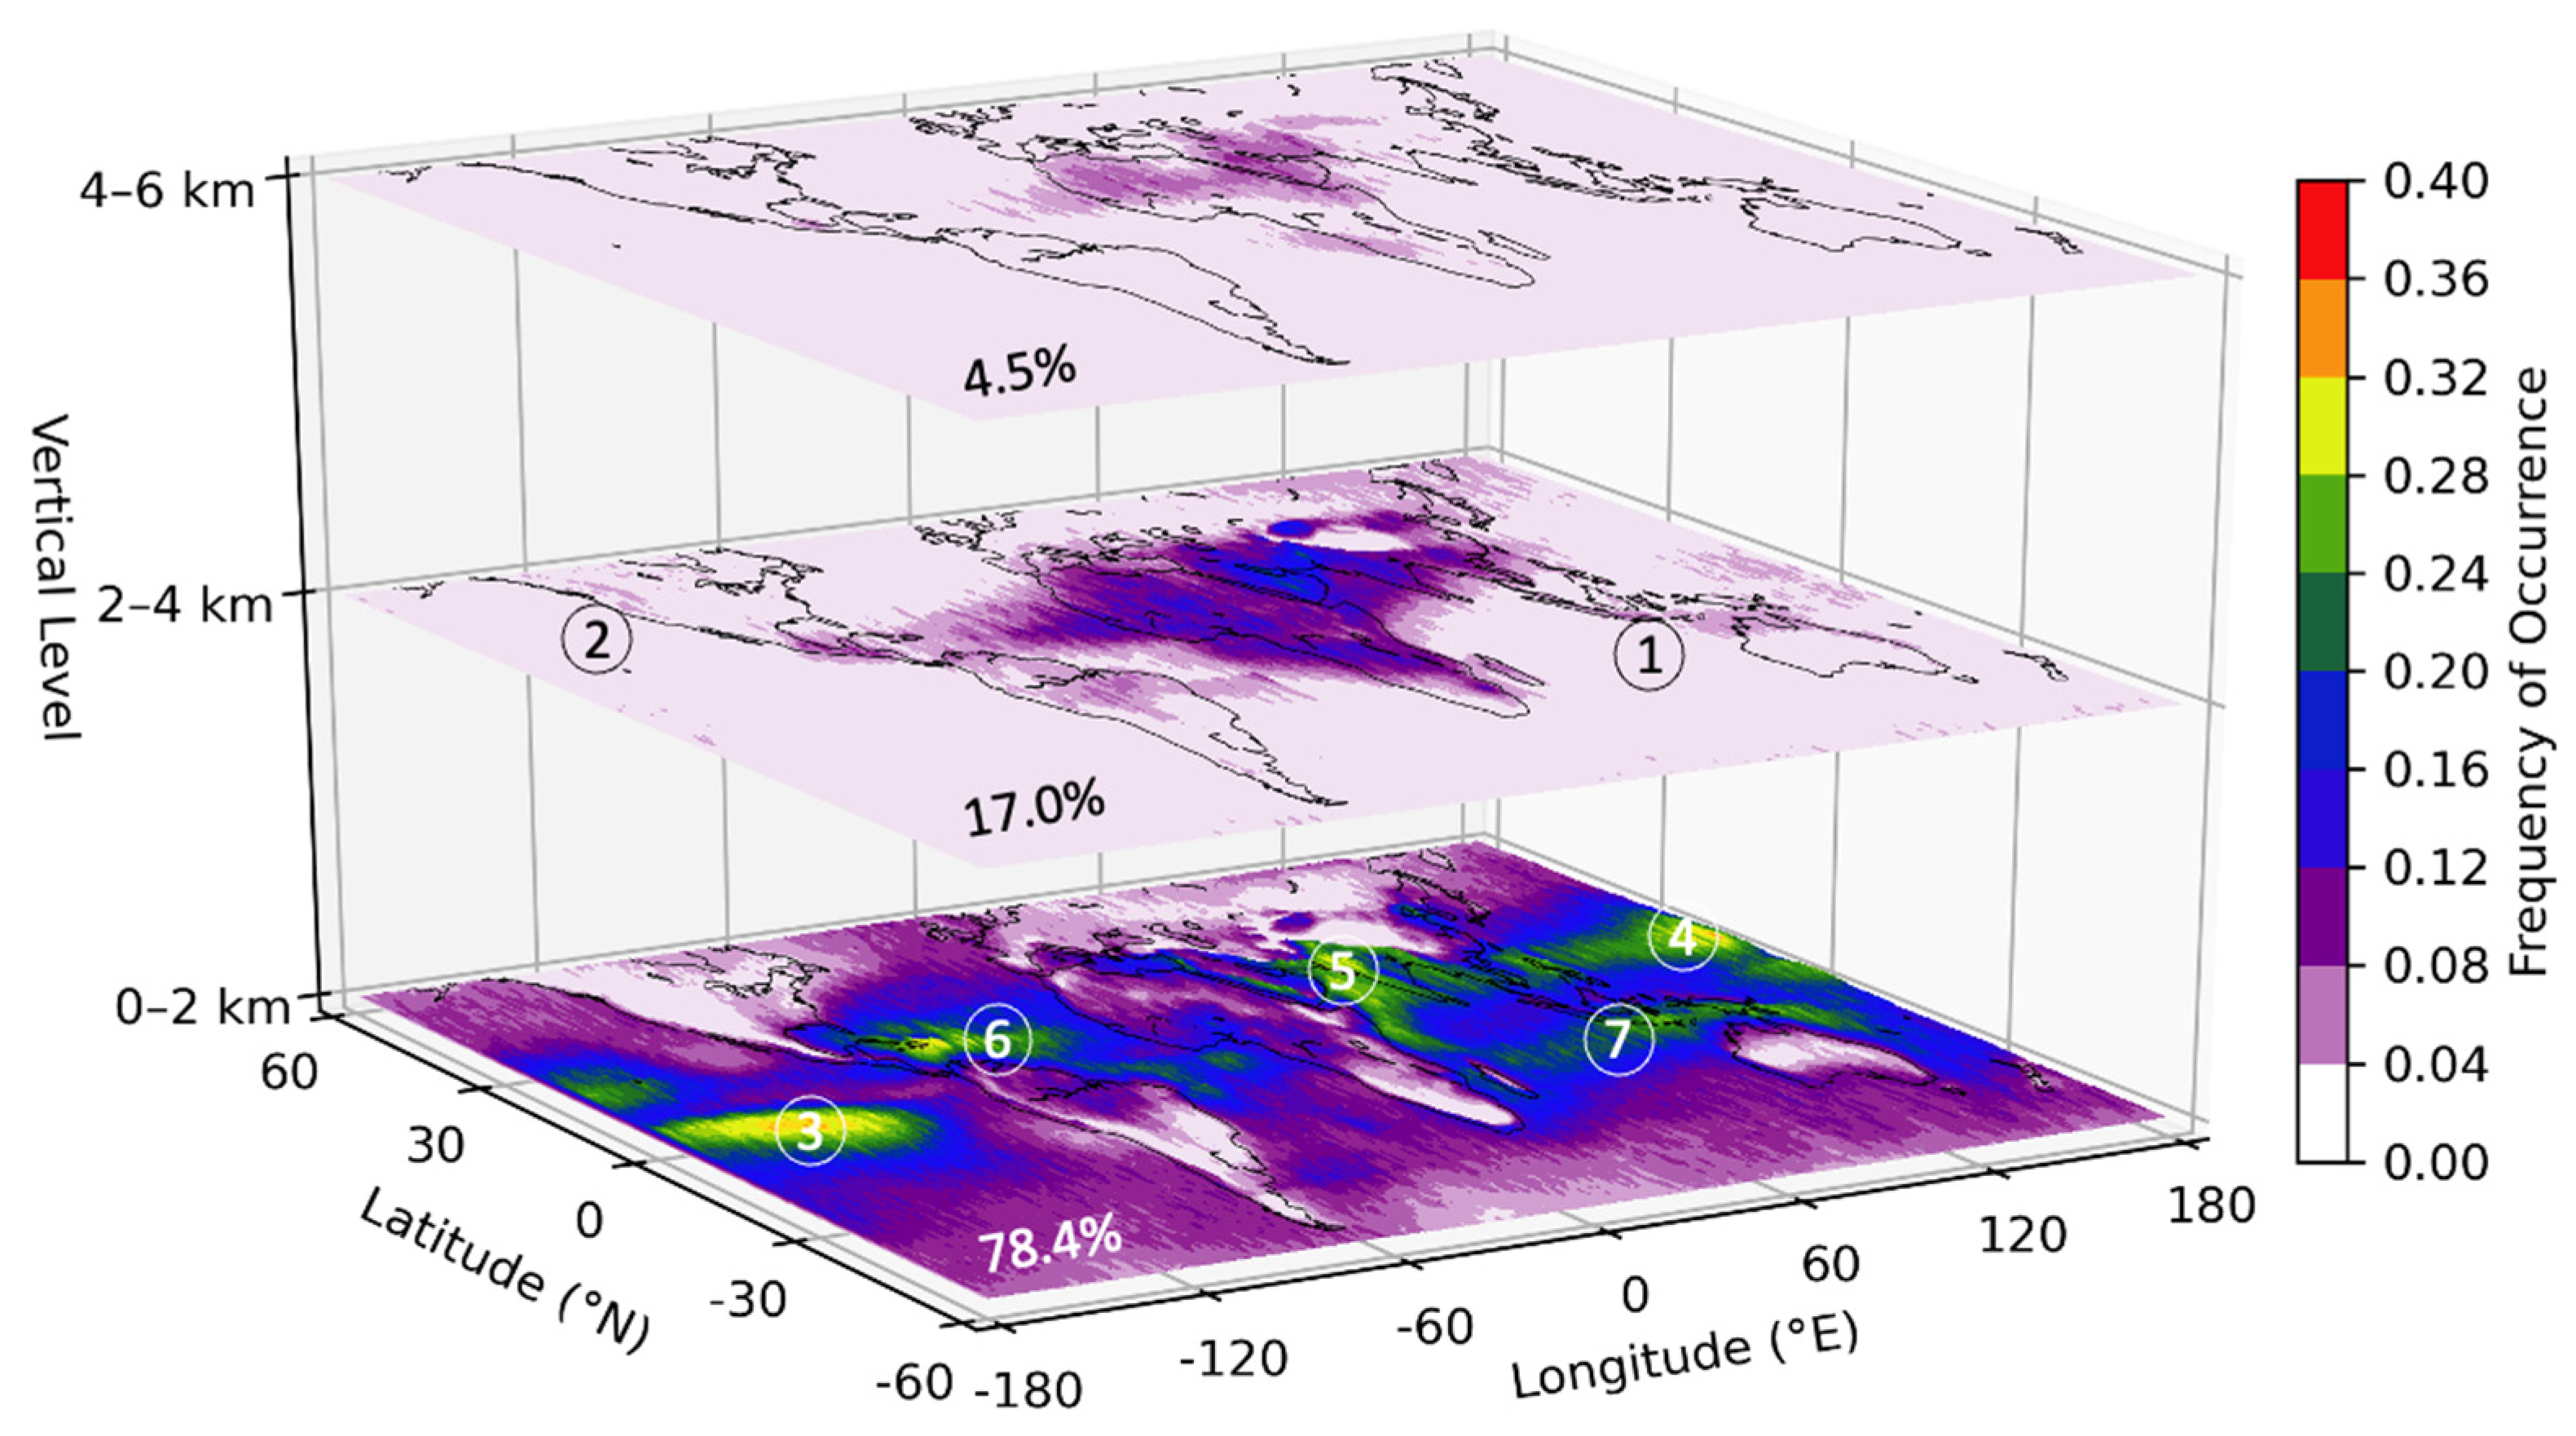
Figure 3 presents the annual FoO distributions for the 0–8 km column, comparing results from the ATL09 CAD and CNN algorithms. Overall, the CNN approach identifies more aerosols over oceans than ATL09 CAD, owing to its better discrimination capability in complex cloud–aerosol embedded environments, conditions commonly found over tropical and subtropical oceans. As discussed in Section 2.3, the traditional algorithm tends to classify cloudy pixels and their vertically adjacent aerosol bins as entirely cloud, resulting in a systematic under-detection of aerosols in mixed cloud–aerosol scenes.
Conversely, ATL09 CAD identifies slightly more aerosols over land than CNN, such as the western U.S. An extreme example is the Tibetan Plateau, one of the most pristine regions on Earth, comparable to or even cleaner than the Arctic [42]. In this region, ATL09 CAD reports significantly higher aerosol presence than CNN. Upon examining individual granules, we find that ATL09 CAD sometimes misclassifies high-altitude clouds as aerosols, a misclassification that may be negligible in polluted regions but becomes apparent in clean areas like Tibet. In contrast, the Tarim Basin, located north of the Tibetan Plateau, shows high aerosol levels identified by both algorithms, consistent with known desert dust sources. These comparisons clearly demonstrate the CNN’s accuracy in aerosol detection, attributed to its pixel-wise semantic segmentation. The CNN-based retrieval effectively captures finer spatial details and complex patterns in the data, particularly in individual granules, outperforming the traditional threshold-based technique where it struggles.
Both algorithms show an overestimate of aerosols over South America, an artifact of SAA. Aerosol detection is more sensitive to errors in background signal calibration than cloud detection, regardless of the retrieval method. Meanwhile, the annual mean cloud distributions produced by both algorithms (see Figure A1 in the Appendix A) are similar largely because clouds are more easily detected due to stronger backscatter signals compared to aerosols.

3.2. Annual Mean

Figure 3b reveals global maxima in FoO around the ARP, ARS, and SAS with a dominant source of dust aerosols according to previous studies [43,44,45]. The aerosol loading over Africa, particularly in western Africa and central Africa, is significant and associated with biomass burning in the Savanna and dust emissions from the Sahara Desert as well as their westward outflow. Enhanced aerosol signals are also observed in EAS and SEA, driven by a combination of industrial emissions and seasonal biomass burning [46]. Aerosol transport pathways over the oceans are clearly visible, reflecting the long-range movement of dust and smoke plus local emissions of sea salt aerosols. Although the FoO values in this study are generally lower than those reported from CALIOP, primarily due to ICESat-2’s lower SNR resulting in reduced aerosol detection during daytime, the global spatial patterns are broadly consistent with earlier research (e.g., [21,22,23]).
Figure 4 shows annual mean aerosol FoO at three vertical layers: 0–2 km, 2–4 km, and 4–6 km. As expected, lower-level FoO is higher than the column average due to the greater aerosol concentration near the surface. Annually, between 60°S and 60°N, there are 78.4%, 17.0%, and 4.5% of aerosols located at 0–2 km, 2–4 km, and 4–6 km, respectively. Several marine aerosol belts, such as those in the Equatorial Pacific and Caribbean, are largely confined below 2 km, indicating a predominant sea salt origin. In contrast, regions such as the ARP-ARS-SAS zone, Africa, and the Tarim Basin in China show significant aerosol presence up to 6 km, suggesting the influence of strong convective lofting. Notably, aerosol maxima over the ARP region appear primarily in the 2–4 km layer. Over inland areas of EAS and SEA, enhanced aerosol concentrations are also apparent at mid-levels (2–4 km). Further discussion of these patterns is provided in the next section.

3.3. Seasonal Variations

Figure 5 presents the column-averaged seasonal aerosols derived using the CNN algorithm, while Figure 6 provides additional details on the vertical structure. The defined climate reference regions, adopted by the IPCC [47] based on similarities in major climate variables, are shown in Figure 7. Table 1 lists the seasonal and annual aerosol FoO averages for each reference region, excluding the North and South Poles. For easier comparison with previous studies, the continental region averages are calculated using land-only areas, excluding the water portions within the polygons (Figure 7). Ocean regions are shaded in gray in Table 1.

3.3.1. Arabian Peninsula (ARP) and Arabian Sea (ARS)

The aerosol loading in ARS is the highest among all regions, including both land and ocean areas, for annual mean (8.8 ± 2.0%) and all seasons except winter (Table 1). However, for land-only regions, ARP has the highest aerosol loading in the summer and fall as well as annual mean. A closer examination of Figure 5 reveals that aerosols in ARS and southeastern ARP have a co-variation, suggesting their common influence factors. For ARS, although the 0–2 km aerosol loading peaks in winter (Figure 6a) and reaches a minimum in summer (Figure 6g), the column-averaged aerosol loading peaks in spring, followed by summer (Figure 5 and Table 1). This pattern reflects the combined influence of local sea salt emissions and dust transport over ARS. In winter, enhanced sea salt aerosol emissions, driven by stronger winds and more active wave conditions, dominate the marine PBL, while limited convective transport results in relatively clean 2–4 km and 4–6 km layers (Figure 6b,c). In spring and summer, although sea salt emissions decrease, increased convective activity leads to greater dust transport from ARP into the marine atmosphere.
Dust emissions from ARP account for about 12% of the global dust emission budget [48], making it the second highest dust source region globally (less than the Sahara Desert). Although the column-averaged aerosol loading at ARP peaks in summer due to stronger convective transport, the near-surface (0–2 km) aerosols at ARP during summer (Figure 6g) are lower than winter, especially in the southeastern part. This is in general consistent with the dust emission flux climatology from Shalaby et al. [49], which shows peak emissions during January to April. These observations suggest that the high aerosol loading over eastern and southern ARP and ARS is strongly influenced by mesoscale circulations and meteorological conditions [43,44]. In summer, the high aerosol loading across the ARP–ARS region is associated with convective transport from the PBL to the free troposphere, extending aerosol influence across the Middle East, as shown in Figure 6h,i.
The higher aerosol peaking altitude over ARP compared to ARS, as shown in Figure 7, is primarily associated with the dominance of dust aerosols over ARP, which are typically smaller and have longer residence times than marine aerosols, allowing them to be lifted to higher altitudes and transported over longer distances. This difference is also partly due to stronger convective lifting over land compared to oceans. Aerosol FoO in the PBL over ARS is highest in Figure 7, yet it exhibits the smallest seasonal standard deviation, indicating a persistently high aerosol abundance throughout the year.

3.3.2. South Asia (SAS)

SAS, including Pakistan, India, Nepal, and Bangladesh, is one of the most densely populated regions in the world, particularly the Indo-Gangetic Plain (IGP) in northern SAS, which is home to nearly one-seventh of the global population. The regional aerosol average in SAS ranks second among land regions for the annual mean in Table 1, only slightly lower than that of ARP. Aerosol FoO in SAS is highest in spring (8.9 ± 2.3%), followed by winter (7.9 ± 2.4%), fall (7.0 ± 3.1%), and summer (6.2 ± 3.2%). Although the springtime peak agrees with previous studies [50], the seasonal low in summer (Figure 5c) is inconsistent with some earlier AOD observations from passive spaceborne sensors [51,52], which indicated higher summertime aerosol loading, particularly over the IGP. Several factors could explain this discrepancy. First, AOD is significantly RH-dependent [41,53] and can be higher in summer than winter. Second, MODIS may overestimate AOD during summer and both MODIS and MISR may underestimate it during winter due to the high surface reflectance from snow [54]. Third, all spaceborne sensors face challenges with cloud interference; lidars may miss aerosols under cloud cover depending on SNR, while spectroradiometers have uncertainties in cloud screening. Fourth, the recent trend of increasing precipitation during the monsoon season [55] and the strong interannual variability of dust aerosols associated with rainfall [56] could also contribute.
In SAS, the 0–2 km aerosol FoO peaks in winter (Figure 6a) for the regional average, followed by fall, spring, and summer, while for the IGP region specifically, it peaks in fall, followed by winter, spring, and summer. Persistent high anthropogenic emissions near the surface, particularly over the IGP, drive the strong north–south gradient seen across almost every season (Figure 6a,d,g,j). Typically, anthropogenic aerosols dominate in fall and winter, due to heating with coal and biomass and post-monsoon agricultural burning, whereas westerly dust transport plays a major role during spring and summer [52,57]. This seasonal pattern is consistent with the vertical aerosol structures: widespread enhancement at 0–2 km during winter (Figure 6a) with relatively clean conditions in the 4–6 km layer due to stagnant weather and limited vertical transport. In contrast, aerosols in the 4–6 km layer maximize in spring, followed by summer, due to meteorological conditions more favorable to long-range and convective transport.
Although our findings of higher aerosols in winter and lower aerosols in summer differ from some earlier satellite-based AOD observations and model simulations, they are consistent with local measurements, such as AERONET data at multiple locations [52,58,59]. Models often fail to capture the winter peak, likely due to missing emissions or an inadequate representation of fog-related processes [52]. One additional factor that might contribute to discrepancies is the difference in optical properties between aerosol types, for instance, dust generally has a higher extinction than smoke for the same particle abundance. However, this effect is expected to be relatively minor.

3.3.3. Southeast Asia (SEA)

The SEA aerosol system is among the most complex in the world, due to its diverse emission sources, the interplay of multiple meteorological factors (e.g., intertropical convergence zone, or ITCZ, and monsoons), and the region’s complex topography and geography [46]. SEA includes both the peninsular continent and the maritime continent, along with vast ocean areas. Some maritime regions, such as Indonesia’s extensive archipelago spanning the equator, experience particularly complex seasonal precipitation cycles [60].
For a column average over all SEA land areas, Table 1 shows an aerosol peak during boreal winter, followed by spring (Figure 5). This likely reflects the influence of the peninsular continent, such as the hotspots in Thailand during winter associated with urban centers, although biomass burning, the dominant aerosol source for the maritime continent, typically peaks around September, with a secondary peak in April [61].
Annually enhanced aerosols in the 2–4 km layer over Sumatra, Borneo, and extending to New Guinea (“1” in Figure 4), which are higher than the aerosols over surrounding ocean areas, apparently reflect the influence of biomass burning activities [57,62,63]. However, because the islands in SEA are relatively narrow, it is difficult to resolve finer-scale spatial features with the current image resolution. Therefore, future work will place special focus on SEA using data products with enhanced resolution.

3.3.4. East Asia (EAS)

The column-averaged aerosol FoO in EAS peaks in winter, followed by spring, fall, and reaches its minimum in summer. Figure 5a clearly shows wintertime aerosol hotspots over northern China associated with major urban centers, along with notable enhancements over northeastern China and the Korean Peninsula. While hotspots in northern China are still visible in spring and fall, they are least pronounced during summer. Aerosol enhancements across EAS are centered over northern and eastern China, where the complex interplay of local anthropogenic emissions, dust transport, and interannual precipitation variability plays a significant role [64,65,66].
The spatial distributions and seasonal variations of aerosols in EAS from our study generally agree well with previous CALIOP [67,68] and Advanced Himawari Imager (AHI) observations [69], although some discrepancies exist when compared with MODIS [67] and MISR data [70], which suggest summertime AOD maxima over northern and eastern China, where anthropogenic emissions (mainly polluted dust) are dominant. Natural mineral dust constitutes an important component of the aerosol burden in EAS. The west-to-east transport of elevated dust from major deserts in China, such as the Taklamakan and Gobi, is evident and appears to reach its maximum during spring in both the 2–4 km and 4–6 km layers, as shown in Figure 6, consistent with earlier studies [67]. The higher FoO at elevated altitudes in EAS compared to SEA, as shown in Figure 7, is explained by the greater abundance of dust aerosols in EAS, which can be transported vertically higher than smoke. It is also worth noting that recent studies report a significant negative trend in aerosols over EAS, contrasting with a positive trend over SAS [50], despite the dense populations in both regions.

3.3.5. Africa

Africa is one of the regions with the largest seasonal aerosol variability due to dominant natural emissions that change rapidly month-to-month. Figure 5a,c show opposite aerosol enhancements across the equator in Africa, associated with biomass burning activities in different hemispheres. During boreal winter, the dry season of the Northern Hemisphere, significant fire smoke plumes originating from the northern Savanna in northern Africa extend from western Ethiopia across Guinea and into the Atlantic Ocean. Fire smoke emissions in northern Africa peak during winter, earlier than in other regions such as SEA [61], resulting in a mean FoO of 9.0 ± 2.8% in western Africa, the highest among all regions.
During June–August (austral winter), the dry season of the Southern Hemisphere, fire smoke from the southern Savanna (primarily Angola, Zambia, and southern Republic of Congo) is transported westward across the South Atlantic Ocean. The aerosol FoO peak in austral winter for southern Africa (see Table 1 for western and eastern southern Africa) is not exactly synchronized with some of previous studies [61,71], which report biomass burning peak emissions in September. Fire smoke emissions of southern Africa and northern Africa are comparable with their total contribution of about 40% to the global biomass burning budget [61].
Northern Africa is by far the most significant dust source globally, accounting for about 58% of the global dust emission budget [48]. In contrast to fire smoke, dust emissions in northern Africa peak during the wet season. Enhanced aerosols observed over northern Africa in summer (Figure 5c) are thus primarily due to natural mineral dust emissions from the Sahara Desert, bordered to the south by the northern Savanna, where aerosol concentrations are low due to abundant precipitation associated with the ITCZ. PBL heights during summer over the desert can reach up to 6 km, favoring the vertical advection of dust over cooler surrounding air. In spring, enhanced aerosols around the Sahel (Figure 5b), a transitional zone between the Sahara and Savanna, likely contain a mixture of smoke and dust, as discussed by Yang et al. [72].
The long-range transport of African aerosols across the Atlantic Ocean to the Americas, particularly the Amazon Basin, has been well documented since the 1990s [73,74,75,76]. Figure 6 suggests that aerosol transport activity across the North Atlantic (10°–30°N) is most active during summer (dominated by dust), followed by spring (a mixture of smoke and dust). Due to the seasonal shift in aerosol types transported from Africa, the smoke-to-dust ratio observed in Amazonia decreases from January to May during the wet season when local emissions are minimal [74].
Similarly, for southern Africa, although emissions are higher during austral winter, as indicated by higher aerosols at lower altitudes (Figure 6g), the westward trans-Atlantic transport (0–30°S) appears to be strongest in austral spring (Figure 6l). Southern Africa contains deserts to the west and Savanna grasslands to the east; however, fire smoke dominates the aerosol composition, resulting in higher aerosol loading during winter and greater aerosol concentrations in eastern southern Africa than western southern Africa across all seasons (Table 1), consistent with previous findings [77]. More aerosols are transported westward than eastward, influenced by prevailing meteorological conditions and greater near-range deposition on the eastern side [78].
Figure 6h,k also reveal notable aerosol layers aloft over northern South America (or Amazonia) during its dry seasons, resulting from both local biomass burning emissions and trans-Atlantic transport from southern Africa. Numerical models tend to underestimate aerosol heights during transport over oceans [75], emphasizing the importance of accurately characterizing the vertical distribution of aerosols for improving model parameterizations.
The annual mean FoO profile over the Sahara exhibits a double peak structure, with a dominant peak at ~1 km and a secondary peak at ~3.8 km, in contrast to a single peak at ~1.3 km over western and central Africa (Figure 7). The higher-altitude peak is associated with the Saharan Air Layer (SAL), a warm, dry, and well-mixed layer that typically extends up to 6 km during summer and confines desert dust [79]. Occurring from late spring through early fall, the SAL plays an important role not only in transporting Saharan dust across the Atlantic Ocean to the Americas, but also in suppressing the development and intensity of tropical cyclones [80].

3.3.6. North America and South America

For North America, Figure 3 suggests relatively high aerosol loading in southern Central America (including southern Mexico), with a peak in spring (Table 1), consistent with the seasonal biomass burning smoke emission cycle in this region [61]. The aerosol outflow toward the equatorial Pacific Ocean around 10°N is apparent during the dry seasons (Figure 5a,b). Some aerosol enhancement belts can also be seen in the western U.S. at the 2–4 km altitude range (“2” in Figure 4). Unlike southern Central America, wildfires in the U.S. are more frequent in summer and fall, resulting in greater free-tropospheric aerosol loading during these seasons compared to winter and spring (Figure 6).
For South America, aerosol enhancement is mostly concentrated in the northern part, associated with vegetation burning in the Amazon basin. Figure 6 shows more free-tropospheric aerosol hotspots south of the equator during the austral dry seasons (June–November) than during the wet seasons. Despite considerable local emissions, southern Central America and northern South America are influenced by intercontinental aerosol transport, dust from the Sahara Desert during wet seasons [81] and smoke from the Savanna fires during dry seasons (from both hemispheres). The seasonal aerosol transport pathways around the equator, as indicated by the spatial aerosol distributions at upper levels in Figure 6, are complex and governed by the migration of the ITCZ and associated meteorological circulations [82].

3.3.7. Oceans

Besides the dust and smoke aerosols transported from land to ocean discussed earlier, most marine aerosols are sea spray aerosols, consisting primarily of natural (inorganic) sea salt and a small fraction of organic compounds [83]. Sea-salt aerosols are produced when waves break and bubbles burst at the ocean surface, releasing particles into the atmosphere. Due to weaker convective lifting over oceans compared to land, owing to differences in heating capacity, sea-salt aerosols are mostly confined below 2 km altitude. Marine aerosol concentrations are generally higher in the tropics and lower at mid and high latitudes.
Several enhanced marine aerosol regions, mostly between 20°N and 20°S, are evident in Figure 6, including the equatorial Pacific Ocean (a stronger belt centered around ~165°E, 15°N, and a weaker one near ~150°W, 10°S), ARS, the Caribbean, and a belt in the southern Indian Ocean extending from the western coast of Africa to northern Australia (labeled “3–7” in Figure 4). While these aerosol belts may include outflowing smoke and dust from continents, they are predominantly composed of marine emissions, as suggested by the weak aerosol enhancement above 2 km.
Marine aerosol abundance tends to be higher in winter, driven by stronger winds and enhanced wave activity leading to increased sea-salt emissions. It is worth noting that our study identifies maximum marine aerosols in tropical oceans (Figure 4 and Figure 6), whereas earlier spaceborne passive observations from two decades ago indicated maxima in the Southern Ocean (e.g., [84]). This discrepancy may reflect recent trends of increased sea-salt emissions in tropical and subtropical oceans and a decrease in the Southern Ocean, associated with changes in sea surface temperature [85,86]. As mentioned earlier, the lidar signal “folding” problem may lead to an overestimation of aerosol detection in the PBL, particularly in the tropics where high-altitude clouds are frequent. But this uncertainty should not be significant for two reasons. First, the spatial distribution of marine aerosols in our study is highly consistent with recent results derived from CALIOP observations using the same variable [23,26]. CALIOP does not have “folding” problem due to the low repetition frequency of its lasers. Second, the aerosol spatial distribution around the tropics of our study does not mirror the cloud distribution pattern (Figure A1).

4. Conclusions

We present a global aerosol climatology analysis based on six years of ICESat-2 ATL09 (Level-3) data collected between October 2018 and October 2024. A U-Net CNN algorithm [33] was employed to distinguish aerosols from clouds with high vertical resolution, particularly in complicated mixed conditions, outperforming the traditional threshold-based ATL09 CAD algorithm (Figure 2). Due to ICESat-2’s single-wavelength design and lack of depolarization measurements, aerosol typing and consequently accurate AOD retrieval via lidar ratio is not feasible. As a result, we adopt the FoO as a proxy for aerosol abundance. The CNN approach demonstrates superior detection performance over the traditional algorithm, especially by capturing more aerosols over oceans and fewer over clean lands (Figure 3), owing to its enhanced vertical resolving capability.
We analyzed seasonal variations and vertical distributions of aerosols (Figure 5 and Figure 6), along with seasonal means across scientific regions (Table 1). Annually, between 60°S and 60°N, there are 78.4%, 17.0%, and 4.5% of aerosols located at 0–2 km, 2–4 km, and 4–6 km, respectively (Figure 4). The proportion of aerosols at higher altitudes (2–6 km) peaks during boreal summer due to strong dust emissions from the Sahara and ARP, alongside biomass burning in the southern hemisphere’s dry season over the Savanna.
ARS exhibits one of the highest aerosol loadings globally. While sea salt emissions over ARS are strongest in winter, column-integrated aerosols peak in spring, followed by summer, highlighting the role of dust transport from ARP, where emissions are pronounced in spring and winter.
SAS ranks second in land-based aerosol FoO, with a peak in spring, followed by winter, with enhancement over the IGP region across all seasons. In EAS, FoO is about half that of SAS, with a peak in winter. Northern China shows clear wintertime hotspots linked to major urban centers (Figure 5). Our data shows a summertime minimum in aerosol FoO over both SAS and EAS, consistent with some spaceborne products [67,68,69] and local measurements [58,59] but diverging from some passive sensor observations of AOD [51,52,67,70]. This discrepancy likely stems not from algorithmic limitations, such as the exclusion of blowing snow and diamond dust, which are negligible in mid latitudes, but primarily from the RH dependence of aerosol extinction. Higher humidity in summer leads to increased aerosol water uptake, thereby inflating AOD [41,53].
Africa exhibits distinct seasonal aerosol variability, driven by dust emissions during wet seasons and biomass burning in the dry seasons of both hemispheres. The well-known “dust band” from the Sahara shows peak trans-Atlantic transport during boreal summer, reaching higher altitudes and greater distances owning to SAL, compared to the “smoke bands” from the Savanna during other seasons (Figure 6).
Our analysis also identifies “sea-spray bands” of marine aerosol maxima concentrated in tropical oceans (Figure 4 and Figure 6), which contrasts with earlier findings that indicated maxima in the Southern Ocean [84]. Although our results align with recent CALIOP observations [23], further investigation is needed to reconcile these differences.
Despite limitations in ICESat-2’s instrument design for atmospheric science, this study demonstrates its value for characterizing global aerosol climatology. These results can help bridge the observational gap between CALIPSO and EarthCARE missions and inform the design of future spaceborne sensors. Validation of the ICESat-2 CNN feature classification using collocated CALIOP data is currently underway. Future improvements to classification accuracy will include daytime solar background denoising, correction for signal folding, and mitigation of SAA effects. Incorporating additional aerosol types, such as blowing snow and diamond dust, into CNN training will also be critical for extending aerosol research into polar regions.

Author Contributions

Conceptualization, S.K., M.M. and J.G.; methodology, S.K., M.M., J.G. and P.S.; software, S.K. and J.G.; formal analysis, S.K., M.M., J.G., G.F. and J.B.; writing—original draft preparation, S.K.; writing—review and editing, S.K., M.M., J.G., P.S., G.F. and J.B.; visualization, S.K., J.G. and G.F.; funding acquisition, M.M. All authors have read and agreed to the published version of the manuscript.

Funding

This research was funded by the ICESat-2 project through NASA grant #80NSSC23K0191.

Data Availability Statement

The data used in this study are available at either https://n5eil01u.ecs.nsidc.org or https://daacdata.apps.nsidc.org (last accessed on 14 March 2025).

Acknowledgments

The authors would like to thank the ICESat-2 project for supporting this work.

Conflicts of Interest

Author Patrick Selmer is employed by the company Science Systems and Applications, Inc. The remaining authors declare that the research was conducted in the absence of any commercial or financial relationships that could be construed as a potential conflict of interest.

Abbreviations

The following abbreviations are used in this manuscript:
AERONETAErosol RObotic NETwork
AODAerosol Optical Depth
ARPArabian Peninsula
ARSArabian Sea
ATLASAdvanced Topographic Laser Altimeter System
CADCloud-Aerosol Discrimination
CATSCloud-Aerosol Transport System
CALIOPCloud-Aerosol Lidar with Orthogonal Polarization
CALIPSOCloud-Aerosol Lidar and Infrared Pathfinder Satellite Observations
CNNConvolutional Neural Network
DDADensity Dimension Algorithm
EASEast Asia
EarthCAREEarth Cloud, Aerosol and Radiation Explorer
FoOFrequency of Occurrence
ICESat-2Ice, Cloud, and land Elevation Satellite-2
IGPIndo-Gangetic Plain
IPCCIntergovernmental Panel on Climate Change
ITCZIntertropical Convergence Zone
MISRMultiangle Imaging Spectroradiometer
MODISModerate Resolution Imaging Spectroradiometer
NRBNormalized Relative Backscatter
PBLPlanetary Boundary Layer
RHRelative Humidity
SASSouth Asia
SAASouth Atlantic Anomaly
SALSaharan Air Layer
SEASoutheast Asia
SNRSignal-to-Noise Ratio
SZASolar Zenith Angle

Appendix A

The spatial distributions of annual mean cloud FoO between the surface and 14 km, derived from the traditional ATL09 CAD and CNN algorithms, show broad agreement, with the main difference being higher values in polar regions reported by the CNN. This is because the CNN tends to classify most instances of blowing snow and diamond dust as clouds, whereas the traditional algorithm either separates them or misclassifies them to a lesser extent. Additionally, we observe that the influence of the SAA on cloud retrievals around South America is much smaller than its impact on aerosol detection (Figure 3). The general agreement between the two algorithms in cloud distributions is largely attributed to the higher backscatter signal of clouds, which makes them easier to detect compared to aerosols. As the primary focus of this study is on aerosols, we defer a detailed scientific interpretation of the cloud FoO patterns to future investigations.
Figure A1. Comparison of annually averaged FoO with a 1° × 1° resolution between 0 and 14 km from October 2018 to October 2024 calculated from (a) the ATL09 CAD algorithm and (b) CNN algorithm.
Remotesensing 17 02240 g0a1

References

  1. Thornhill, G.D.; Collins, W.J.; Kramer, R.J.; Olivié, D.; Skeie, R.B.; O’COnnor, F.M.; Abraham, N.L.; Checa-Garcia, R.; Bauer, S.E.; Deushi, M.; et al. Effective radiative forcing from emissions of reactive gases and aerosols—A multi-model comparison. Atmos. Chem. Phys. 2021, 21, 853–874. [Google Scholar] [CrossRef]
  2. Bellouin, N.; Quaas, J.; Gryspeerdt, E.; Kinne, S.; Stier, P.; Watson-Parris, D.; Boucher, O.; Carslaw, K.S.; Christensen, M.; Daniau, A.; et al. Bounding global aerosol radiative forcing of climate change. Rev. Geophys. 2020, 58, e2019RG000660. [Google Scholar] [CrossRef] [PubMed]
  3. Bellouin, N.; Boucher, O.; Haywood, J.; Reddy, M.S. Global estimate of aerosol direct radiative forcing from satellite measurements. Nature 2005, 438, 1138–1141. [Google Scholar] [CrossRef] [PubMed]
  4. Li, J.; Carlson, B.E.; Yung, Y.L.; Lv, D.; Hansen, J.; Penner, J.E.; Liao, H.; Ramaswamy, V.; Kahn, R.A.; Zhang, P.; et al. Scattering and absorbing aerosols in the climate system. Nat. Rev. Earth Environ. 2022, 3, 363–379. [Google Scholar] [CrossRef]
  5. Holben, B.N.; Tanré, D.; Smirnov, A.; Eck, T.F.; Slutsker, I.; Abuhassan, N.; Newcomb, W.W.; Schafer, J.S.; Chatenet, B.; Lavenu, F.; et al. An emerging ground-based aerosol climatology: Aerosol optical depth from AERONET. J. Geophys. Res. Atmos. 2001, 106, 12067–12097. [Google Scholar] [CrossRef]
  6. Eck, T.F.; Holben, B.N.; Reid, J.S.; Dubovik, O.; Smirnov, A.; O’Neill, N.T.; Slutsker, I.; Kinne, S. Wavelength dependence of the optical depth of biomass burning, urban, and desert dust aerosols. J. Geophys. Res. Atmos. 1999, 104, 31333–31349. [Google Scholar]
  7. Horowitz, H.M.; Garland, R.M.; Thatcher, M.; Landman, W.A.; Dedekind, Z.; Van der Merwe, J.; Engelbrecht, F.A. Evaluation of climate model aerosol seasonal and spatial variability over Africa using AERONET. Atmos. Chem. Phys. 2017, 17, 13999–14023. [Google Scholar] [CrossRef]
  8. Mishchenko, M.I.; Liu, L.; Geogdzhayev, I.V.; Travis, L.D.; Cairns, B.; Lacis, A.A. Toward unified satellite climatology of aerosol properties.: 3. MODIS versus MISR versus AERONET. J. Quant. Spectrosc. Radiat. Transf. 2010, 111, 540–552. [Google Scholar] [CrossRef]
  9. Torres, O.; Bhartia, P.K.; Herman, J.R.; Sinyuk, A.; Ginoux, P.; Holben, B. A long-term record of aerosol optical depth from TOMS observations and comparison to AERONET measurements. J. Atmos. Sci. 2002, 59, 398–413. [Google Scholar] [CrossRef]
  10. Kalluri, S.; Cao, C.; Heidinger, A.; Ignatov, A.; Key, J.; Smith, T. The advanced very high resolution radiometer: Contributing to earth observations for over 40 years. Bull. Am. Meteorol. Soc. 2021, 102, E351–E366. [Google Scholar] [CrossRef]
  11. Remer, L.A.; Kleidman, R.G.; Levy, R.C.; Kaufman, Y.J.; Tanré, D.; Mattoo, S.; Martins, J.V.; Ichoku, C.; Koren, I.; Yu, H.; et al. Global aerosol climatology from the MODIS satellite sensors. J. Geophys. Res. Atmos. 2008, 113, D14S07. [Google Scholar] [CrossRef]
  12. Kahn, R.A.; Gaitley, B.J.; Martonchik, J.V.; Diner, D.J.; Crean, K.A.; Holben, B. Multiangle Imaging Spectroradiometer (MISR) global aerosol optical depth validation based on 2 years of coincident Aerosol Robotic Network (AERONET) observations. J. Geophys. Res. Atmos. 2005, 110, D10S04. [Google Scholar] [CrossRef]
  13. Winker, D.M.; Tackett, J.L.; Getzewich, B.J.; Liu, Z.; Vaughan, M.A.; Rogers, R.R. The global 3-D distribution of tropospheric aerosols as characterized by CALIOP. Atmos. Chem. Phys. 2013, 13, 3345–3361. [Google Scholar] [CrossRef]
  14. McGill, M.J.; Yorks, J.E.; Scott, V.S.; Kupchock, A.W.; Selmer, P.A. The cloud-aerosol transport system (CATS): A technology demonstration on the International Space Station. In Lidar Remote Sensing for Environmental Monitoring XV; SPIE: San Diego, CA, USA, 2015; Volume 9612, pp. 34–39. [Google Scholar]
  15. Nowottnick, E.P.; Christian, K.E.; Yorks, J.E.; McGill, M.J.; Midzak, N.; Selmer, P.A.; Lu, Z.; Wang, J.; Salinas, S.V. Aerosol detection from the cloud–aerosol transport system on the international space station: Algorithm overview and implications for diurnal sampling. Atmosphere 2022, 13, 1439. [Google Scholar] [CrossRef]
  16. Abdalati, W.; Zwally, H.J.; Bindschadler, R.; Csatho, B.; Farrell, S.L.; Fricker, H.A.; Harding, D.; Kwok, R.; Lefsky, M.; Markus, T.; et al. The ICESat-2 laser altimetry mission. Proc. IEEE 2010, 98, 735–751. [Google Scholar] [CrossRef]
  17. Wehr, T.; Kubota, T.; Tzeremes, G.; Wallace, K.; Nakatsuka, H.; Ohno, Y.; Koopman, R.; Rusli, S.; Kikuchi, M.; Eisinger, M.; et al. The EarthCARE mission–science and system overview. Atmos. Meas. Tech. 2023, 16, 3581–3608. [Google Scholar] [CrossRef]
  18. Hair, J.W.; Hostetler, C.A.; Cook, A.L.; Harper, D.B.; Ferrare, R.A.; Mack, T.L.; Welch, W.; Izquierdo, L.R.; Hovis, F.E. Airborne high spectral resolution lidar for profiling aerosol optical properties. Appl. Opt. 2008, 47, 6734–6752. [Google Scholar] [CrossRef]
  19. Yu, H.; Chin, M.; Winker, D.M.; Omar, A.H.; Liu, Z.; Kittaka, C.; Diehl, T. Global view of aerosol vertical distributions from CALIPSO lidar measurements and GOCART simulations: Regional and seasonal variations. J. Geophys. Res. Atmos. 2010, 115, D00H30. [Google Scholar] [CrossRef]
  20. Huang, L.; Jiang, J.H.; Tackett, J.L.; Su, H.; Fu, R. Seasonal and diurnal variations of aerosol extinction profile and type distribution from CALIPSO 5-year observations. J. Geophys. Res. Atmos. 2013, 118, 4572–4596. [Google Scholar] [CrossRef]
  21. Shikwambana, L.; Sivakumar, V. Global distribution of aerosol optical depth in 2015 using CALIPSO level 3 data. J. Atmos. Sol.-Terr. Phys. 2018, 173, 150–159. [Google Scholar] [CrossRef]
  22. Pan, H.; Huang, J.; Kumar, K.R.; An, L.; Zhang, J. The CALIPSO retrieved spatiotemporal and vertical distributions of AOD and extinction coefficient for different aerosol types during 2007–2019: A recent perspective over global and regional scales. Atmos. Environ. 2022, 274, 118986. [Google Scholar] [CrossRef]
  23. Gui, K.; Che, H.; Zheng, Y.; Zhao, H.; Yao, W.; Li, L.; Zhang, L.; Wang, H.; Wang, Y.; Zhang, X. Three-dimensional climatology, trends, and meteorological drivers of global and regional tropospheric type-dependent aerosols: Insights from 13 years (2007–2019) of CALIOP observations. Atmos. Chem. Phys. 2021, 21, 15309–15336. [Google Scholar] [CrossRef]
  24. Lee, L.; Zhang, J.; Reid, J.S.; Yorks, J.E. Investigation of CATS aerosol products and application toward global diurnal variation of aerosols. Atmos. Chem. Phys. 2019, 19, 12687–12707. [Google Scholar] [CrossRef]
  25. Yu, Y.; Kalashnikova, O.V.; Garay, M.J.; Lee, H.; Choi, M.; Okin, G.S.; Yorks, J.E.; Campbell, J.R.; Marquis, J. A global analysis of diurnal variability in dust and dust mixture using CATS observations. Atmos. Chem. Phys. 2021, 21, 1427–1447. [Google Scholar] [CrossRef]
  26. Christian, K.E.; Palm, S.P.; Yorks, J.E.; Nowottnick, E.P. Evaluation of ICESat-2 ATL09 Atmospheric Products Using CALIOP and MODIS Space-Based Observations. Remote Sens. 2025, 17, 482. [Google Scholar] [CrossRef]
  27. Palm, S.P.; Yang, Y.; Herzfeld, U.; Hancock, D.; Hayes, A.; Selmer, P.; Hart, W.; Hlavka, D. ICESat-2 atmospheric channel description, data processing and first results. Earth Space Sci. 2021, 8, e2020EA001470. [Google Scholar] [CrossRef]
  28. Kuang, S.; Burris, J.F.; Newchurch, M.J.; Johnson, S.; Long, S. Differential absorption lidar to measure subhourly variation of tropospheric ozone profiles. IEEE Trans. Geosci. Remote Sens. 2010, 49, 557–571. [Google Scholar] [CrossRef]
  29. Palm, S.; Yang, Y.; Herzfeld, U.; Hancock, D. ATLAS/ICESat-2 L3A Calibrated Backscatter Profiles and Atmospheric Layer Characteristics, Version 6; NASA National Snow and Ice Data Center Distributed Active Archive Center: Boulder, CO, USA, 2022. [CrossRef]
  30. Anderson, P.C.; Rich, F.J.; Borisov, S. Mapping the South Atlantic Anomaly continuously over 27 years. J. Atmos. Sol.-Terr. Phys. 2018, 177, 237–246. [Google Scholar] [CrossRef]
  31. Yang, G.; Martino, A.J.; Lu, W.; Cavanaugh, J.; Bock, M.; Krainak, M.A. IceSat-2 ATLAS photon-counting receiver: Initial on-orbit performance. In Advanced Photon Counting Techniques XIII; SPIE: Baltimore, MD, USA, 2019; Volume 10978, pp. 48–55. [Google Scholar]
  32. Noel, V.; Chepfer, H.; Hoareau, C.; Reverdy, M.; Cesana, G. Effects of solar activity on noise in CALIOP profiles above the South Atlantic Anomaly. Atmos. Meas. Tech. 2014, 7, 1597–1603. [Google Scholar] [CrossRef]
  33. Oladipo, B.; Gomes, J.; McGill, M.; Selmer, P. Leveraging deep learning as a new approach to layer detection and cloud–aerosol classification using ICESat-2 atmospheric data. Remote Sens. 2024, 16, 2344. [Google Scholar] [CrossRef]
  34. Yorks, J.E.; Selmer, P.A.; Kupchock, A.; Nowottnick, E.P.; Christian, K.E.; Rusinek, D.; Dacic, N.; McGill, M.J. Aerosol and cloud detection using machine learning algorithms and space-based lidar data. Atmosphere 2021, 12, 606. [Google Scholar] [CrossRef]
  35. Liu, Z.; Vaughan, M.A.; Winker, D.M.; Hostetler, C.A.; Poole, L.R.; Hlavka, D.; Hart, W.; McGill, M. Use of probability distribution functions for discriminating between cloud and aerosol in lidar backscatter data. J. Geophys. Res. Atmos. 2004, 109, D15202. [Google Scholar] [CrossRef]
  36. Selmer, P.; Yorks, J.E.; Nowottnick, E.P.; Cresanti, A.; Christian, K.E. A Deep Learning Lidar Denoising Approach for Improving Atmospheric Feature Detection. Remote Sens. 2024, 16, 2735. [Google Scholar] [CrossRef]
  37. Choi, W.; Lee, H.; Park, J. A first approach to aerosol classification using space-borne measurement data: Machine learning-based algorithm and evaluation. Remote Sens. 2021, 13, 609. [Google Scholar] [CrossRef]
  38. McGill, M.J.; Selmer, P.A.; Kupchock, A.W.; Yorks, J.E. Machine learning-enabled real-time detection of cloud and aerosol layers using airborne lidar. Front. Remote Sens. 2023, 4, 1116817. [Google Scholar] [CrossRef]
  39. Ronneberger, O.; Fischer, P.; Brox, T. U-net: Convolutional networks for biomedical image segmentation. In Proceedings of the Medical Image Computing and Computer-Assisted Intervention–MICCAI 2015: 18th International Conference, Munich, Germany, 5–9 October 2015; Proceedings, Part III 18. Springer International Publishing: Berlin/Heidelberg, Germany, 2015; pp. 234–241. [Google Scholar]
  40. Iqbal, H. HarisIqbal88/PlotNeuralNet v1.0.0; Zenodo. 2018. Available online: https://zenodo.org/records/2526396 (accessed on 1 April 2025).
  41. Qu, W.J.; Wang, J.; Zhang, X.Y.; Wang, D.; Sheng, L.F. Influence of relative humidity on aerosol composition: Impacts on light extinction and visibility impairment at two sites in coastal area of China. Atmos. Res. 2015, 153, 500–511. [Google Scholar] [CrossRef]
  42. Pokharel, M.; Guang, J.; Liu, B.; Kang, S.; Ma, Y.; Holben, B.N.; Xia, X.; Xin, J.; Ram, K.; Rupakheti, D.; et al. Aerosol properties over Tibetan Plateau from a decade of AERONET measurements: Baseline, types, and influencing factors. J. Geophys. Res. Atmos. 2019, 124, 13357–13374. [Google Scholar] [CrossRef]
  43. Prakash, P.J.; Stenchikov, G.; Kalenderski, S.; Osipov, S.; Bangalath, H. The impact of dust storms on the Arabian Peninsula and the Red Sea. Atmos. Chem. Phys. 2015, 15, 199–222. [Google Scholar] [CrossRef]
  44. Jin, Q.; Wei, J.; Pu, B.; Yang, Z.L.; Parajuli, S.P. High summertime aerosol loadings over the Arabian Sea and their transport pathways. J. Geophys. Res. Atmos. 2018, 123, 10–568. [Google Scholar] [CrossRef]
  45. Banerjee, T.; Anchule, A.; Sorek-Hamer, M.; Latif, M.T. Vertical stratification of aerosols over South Asian cities. Environ. Pollut. 2022, 309, 119776. [Google Scholar] [CrossRef]
  46. Reid, J.S.; Hyer, E.J.; Johnson, R.S.; Holben, B.N.; Yokelson, R.J.; Zhang, J.; Campbell, J.R.; Christopher, S.A.; Di Girolamo, L.; Giglio, L.; et al. Observing and understanding the Southeast Asian aerosol system by remote sensing: An initial review and analysis for the Seven Southeast Asian Studies (7SEAS) program. Atmos. Res. 2013, 122, 403–468. [Google Scholar] [CrossRef]
  47. Iturbide, M.; Gutiérrez, J.M.; Alves, L.M.; Bedia, J.; Cerezo-Mota, R.; Cimadevilla, E.; Cofiño, A.S.; Di Luca, A.; Faria, S.H.; Gorodetskaya, I.V.; et al. An update of IPCC climate reference regions for subcontinental analysis of climate model data: Definition and aggregated datasets. Earth Syst. Sci. Data 2020, 12, 2959–2970. [Google Scholar] [CrossRef]
  48. Tanaka, T.Y.; Chiba, M. A numerical study of the contributions of dust source regions to the global dust budget. Glob. Planet. Change 2006, 52, 88–104. [Google Scholar] [CrossRef]
  49. Shalaby, A.; Rappenglueck, B.; Eltahir, E.A.B. The climatology of dust aerosol over the arabian peninsula. Atmos. Chem. Phys. Discuss. 2015, 15, 1523–1571. [Google Scholar]
  50. Jin, S.; Ma, Y.; Huang, Z.; Huang, J.; Gong, W.; Liu, B.; Wang, W.; Fan, R.; Li, H. A comprehensive reappraisal of long-term aerosol characteristics, trends, and variability in Asia. Atmos. Chem. Phys. 2023, 23, 8187–8210. [Google Scholar] [CrossRef]
  51. Mhawish, A.; Sorek-Hamer, M.; Chatfield, R.; Banerjee, T.; Bilal, M.; Kumar, M.; Sarangi, C.; Franklin, M.; Chau, K.; Garay, M.; et al. Aerosol characteristics from earth observation systems: A comprehensive investigation over South Asia (2000–2019). Remote Sens. Environ. 2021, 259, 112410. [Google Scholar] [CrossRef]
  52. Pan, X.; Chin, M.; Gautam, R.; Bian, H.; Kim, D.; Colarco, P.R.; Diehl, T.L.; Takemura, T.; Pozzoli, L.; Tsigaridis, K.; et al. A multi-model evaluation of aerosols over South Asia: Common problems and possible causes. Atmos. Chem. Phys. 2015, 15, 5903–5928. [Google Scholar] [CrossRef]
  53. Malm, W.C.; Day, D.E. Estimates of aerosol species scattering characteristics as a function of relative humidity. Atmos. Environ. 2001, 35, 2845–2860. [Google Scholar] [CrossRef]
  54. Prasad, A.K.; Singh, R.P. Comparison of MISR-MODIS aerosol optical depth over the Indo-Gangetic basin during the winter and summer seasons (2000–2005). Remote Sens. Environ. 2007, 107, 109–119. [Google Scholar] [CrossRef]
  55. Jana, S.; Gogoi, M.M.; Babu, S.S. Change in precipitation pattern over South Asia in response to the trends in regional warming and free-tropospheric aerosol loading. Sci. Rep. 2024, 14, 14528. [Google Scholar] [CrossRef]
  56. Gautam, R.; Liu, Z.; Singh, R.P.; Hsu, N.C. Two contrasting dust-dominant periods over India observed from MODIS and CALIPSO data. Geophys. Res. Lett. 2009, 36, L06813. [Google Scholar] [CrossRef]
  57. Banerjee, T.; Shitole, A.S.; Mhawish, A.; Anand, A.; Ranjan, R.; Khan, F.; Srithawirat, T.; Latif, M.T.; Mall, R.K. Aerosol climatology over South and Southeast Asia: Aerosol types, vertical profile, and source fields. J. Geophys. Res. Atmos. 2021, 126, e2020JD033554. [Google Scholar] [CrossRef]
  58. Singh, N.; Mhawish, A.; Deboudt, K.; Singh, R.S.; Banerjee, T. Organic aerosols over Indo-Gangetic Plain: Sources, distributions and climatic implications. Atmos. Environ. 2017, 157, 59–74. [Google Scholar] [CrossRef]
  59. Villalobos, A.M.; Amonov, M.O.; Shafer, M.M.; Devi, J.J.; Gupta, T.; Tripathi, S.N.; Rana, K.S.; Mckenzie, M.; Bergin, M.H.; Schauer, J.J. Source apportionment of carbonaceous fine particulate matter (PM2. 5) in two contrasting cities across the Indo–Gangetic Plain. Atmos. Pollut. Res. 2015, 6, 398–405. [Google Scholar] [CrossRef]
  60. Chang, C.P.; Wang, Z.; McBride, J.; Liu, C.H. Annual cycle of Southeast Asia—Maritime Continent rainfall and the asymmetric monsoon transition. J. Clim. 2005, 18, 287–301. [Google Scholar] [CrossRef]
  61. Duncan, B.N.; Martin, R.V.; Staudt, A.C.; Yevich, R.; Logan, J.A. Interannual and seasonal variability of biomass burning emissions constrained by satellite observations. J. Geophys. Res. Atmos. 2003, 108, ACH 1-1–ACH 1-22. [Google Scholar] [CrossRef]
  62. Cohen, J.B. Quantifying the occurrence and magnitude of the Southeast Asian fire climatology. Environ. Res. Lett. 2014, 9, 114018. [Google Scholar] [CrossRef]
  63. Wang, J.; Ge, C.; Yang, Z.; Hyer, E.J.; Reid, J.S.; Chew, B.-N.; Mahmud, M.; Zhang, Y.; Zhang, M. Mesoscale modeling of smoke transport over the Southeast Asian Maritime Continent: Interplay of sea breeze, trade wind, typhoon, and topography. Atmos. Res. 2013, 122, 486–503. [Google Scholar] [CrossRef]
  64. Liang, Y.; Gui, K.; Che, H.; Li, L.; Zheng, Y.; Zhang, X.; Zhang, X.; Zhang, P.; Zhang, X. Changes in aerosol loading before, during and after the COVID-19 pandemic outbreak in China: Effects of anthropogenic and natural aerosol. Sci. Total Environ. 2023, 857, 159435. [Google Scholar] [CrossRef]
  65. Yang, Y.; Ren, L.; Wu, M.; Wang, H.; Song, F.; Leung, L.R.; Hao, X.; Li, J.; Chen, L.; Li, H.; et al. Abrupt emissions reductions during COVID-19 contributed to record summer rainfall in China. Nat. Commun. 2022, 13, 959. [Google Scholar] [CrossRef]
  66. Zhang, L.; Liao, H.; Li, J. Impacts of Asian summer monsoon on seasonal and interannual variations of aerosols over eastern China. J. Geophys. Res. Atmos. 2010, 115, D00K05. [Google Scholar] [CrossRef]
  67. Gui, L.; Tao, M.; Wang, Y.; Wang, L.; Chen, L.; Lin, C.; Tao, J.; Wang, J.; Yu, C. Climatology of aerosol types and their vertical distribution over East Asia based on CALIPSO lidar measurements. Int. J. Climatol. 2022, 42, 6042–6054. [Google Scholar] [CrossRef]
  68. Guo, J.; Liu, H.; Wang, F.; Huang, J.; Xia, F.; Lou, M.; Wu, Y.; Jiang, J.H.; Xie, T.; Zhaxi, Y.; et al. Three-dimensional structure of aerosol in China: A perspective from multi-satellite observations. Atmos. Res. 2016, 178, 580–589. [Google Scholar] [CrossRef]
  69. Zhang, Y.; Wu, W.; Li, Y.; Li, Y. An investigation of PM2. 5 concentration changes in Mid-Eastern China before and after COVID-19 outbreak. Environ. Int. 2023, 175, 107941. [Google Scholar] [CrossRef]
  70. Gui, K.; Che, H.; Zheng, Y.; Wang, Y.; Zhang, L.; Zhao, H.; Li, L.; Zhong, J.; Yao, W.; Zhang, X. Seasonal variability and trends in global type-segregated aerosol optical depth as revealed by MISR satellite observations. Sci. Total Environ. 2021, 787, 147543. [Google Scholar] [CrossRef]
  71. Queface, A.J.; Piketh, S.J.; Eck, T.F.; Tsay, S.C.; Mavume, A.F. Climatology of aerosol optical properties in Southern Africa. Atmos. Environ. 2011, 45, 2910–2921. [Google Scholar] [CrossRef]
  72. Yang, Z.; Wang, J.; Ichoku, C.; Hyer, E.; Zeng, J. Mesoscale modeling and satellite observation of transport and mixing of smoke and dust particles over northern sub-Saharan African region. J. Geophys. Res. Atmos. 2013, 118, 12–139. [Google Scholar] [CrossRef]
  73. Swap, R.; Garstang, M.; Greco, S.; Talbot, R.; Kållberg, P. Saharan dust in the Amazon Basin. Tellus B 1992, 44, 133–149. [Google Scholar] [CrossRef]
  74. Baars, H.; Ansmann, A.; Althausen, D.; Engelmann, R.; Artaxo, P.; Pauliquevis, T.; Souza, R. Further evidence for significant smoke transport from Africa to Amazonia. Geophys. Res. Lett. 2011, 38, L20802. [Google Scholar] [CrossRef]
  75. Das, S.; Harshvardhan, H.; Bian, H.; Chin, M.; Curci, G.; Protonotariou, A.P.; Mielonen, T.; Zhang, K.; Wang, H.; Liu, X. Biomass burning aerosol transport and vertical distribution over the South African-Atlantic region. J. Geophys. Res. Atmos. 2017, 122, 6391–6415. [Google Scholar] [CrossRef]
  76. Prospero, J.M.; Barkley, A.E.; Gaston, C.J.; Gatineau, A.; Campos y Sansano, A.; Panechou, K. Characterizing and quantifying African dust transport and deposition to South America: Implications for the phosphorus budget in the Amazon Basin. Glob. Biogeochem. Cycles 2020, 34, e2020GB006536. [Google Scholar] [CrossRef]
  77. Hersey, S.P.; Garland, R.M.; Crosbie, E.; Shingler, T.; Sorooshian, A.; Piketh, S.; Burger, R. An overview of regional and local characteristics of aerosols in South Africa using satellite, ground, and modeling data. Atmos. Chem. Phys. 2015, 15, 4259–4278. [Google Scholar] [CrossRef] [PubMed]
  78. Tyson, P.D.; Garstang, M.; Swap, R.; Kallberg, P.; Edwards, M. An air transport climatology for subtropical southern Africa. Int. J. Climatol. 1996, 16, 265–291. [Google Scholar] [CrossRef]
  79. Tsamalis, C.; Chédin, A.; Pelon, J.; Capelle, V. The seasonal vertical distribution of the Saharan Air Layer and its modulation by the wind. Atmos. Chem. Phys. 2013, 13, 11235–11257. [Google Scholar] [CrossRef]
  80. Dunion, J.P.; Velden, C.S. The impact of the Saharan air layer on Atlantic tropical cyclone activity. Bull. Am. Meteorol. Soc. 2004, 85, 353–366. [Google Scholar] [CrossRef]
  81. Nowottnick, E.; Colarco, P.; da Silva, A.; Hlavka, D.; McGill, M. The fate of saharan dust across the atlantic and implications for a central american dust barrier. Atmos. Chem. Phys. 2011, 11, 8415–8431. [Google Scholar] [CrossRef]
  82. Edwards, D.P.; Emmons, L.K.; Gille, J.C.; Chu, A.; Attié, J.; Giglio, L.; Wood, S.W.; Haywood, J.; Deeter, M.N.; Massie, S.T.; et al. Satellite-observed pollution from Southern Hemisphere biomass burning. J. Geophys. Res. Atmos. 2006, 111, D14312. [Google Scholar] [CrossRef]
  83. Vignati, E.; Facchini, M.C.; Rinaldi, M.; Scannell, C.; Ceburnis, D.; Sciare, J.; Kanakidou, M.; Myriokefalitakis, S.; Dentener, F.; O’Dowd, C.D. Global scale emission and distribution of sea-spray aerosol: Sea-salt and organic enrichment. Atmos. Environ. 2010, 44, 670–677. [Google Scholar] [CrossRef]
  84. Kaufman, Y.J.; Tanré, D.; Boucher, O. A satellite view of aerosols in the climate system. Nature 2002, 419, 215–223. [Google Scholar] [CrossRef]
  85. Jaeglé, L.; Quinn, P.K.; Bates, T.S.; Alexander, B.; Lin, J.T. Global distribution of sea salt aerosols: New constraints from in situ and remote sensing observations. Atmos. Chem. Phys. 2011, 11, 3137–3157. [Google Scholar] [CrossRef]
  86. Wang, Y.; Zhang, P.; Li, J.; Liu, Y.; Zhang, Y.; Li, J.; Han, Z. An updated aerosol simulation in the Community Earth System Model (v2. 1.3): Dust and marine aerosol emissions and secondary organic aerosol formation. Geosci. Model Dev. Discuss. 2024, 17, 7995–8021. [Google Scholar] [CrossRef]
Figure 1. CNN U-Net segmentation schematic on a (upper) depth-4 model for cloud–aerosol layer finding and (lower) a depth-1 model for their discrimination. On the output image of the depth-4 model, black represents clear sky and white presents atmospheric layers. On the output image of the depth-1 model, red represents aerosols and white presents clouds. The image is drawn by PlotNeuralNet v1.0.0 [40].
Remotesensing 17 02240 g001
Figure 2. An example of ICESat-2 (a) lidar attenuated backscatter and (b) the classification by the ATL09 CAD algorithm compared to (c) the discrimination by the CNN algorithm. The CNN algorithm performs better at “1”, “2”, and “3”; see explanations in context. Data is from 19 April 2024, granule ATL09_20240419044755_04822301_006_01.h5.
Remotesensing 17 02240 g002
Figure 3. Comparison of annually averaged FoO with 1° × 1° resolution between 0 and 8 km from October 2018 to October 2024 calculated from (a) the ATL09 CAD algorithm and (b) the CNN algorithm.
Remotesensing 17 02240 g003
Figure 4. Annual average aerosol FoO derived from the CNN algorithm for three vertical layers: 0–2 km, 2–4 km, and 4–6 km. The percentage shown at the bottom left of each panel indicates the global mean FoO for that layer as a fraction of the total column. Less than 0.1% of aerosols are detected above 6 km. Numbers “1–7” mark several locations of aerosol enhancement, discussed in the text.
Remotesensing 17 02240 g004
Figure 5. Seasonal aerosol FoO below 8 km derived by the CNN algorithm using the ICESat-2 ATL09 data between October 2018 and October 2024 for boreal (a) winter, (b) spring, (c) summer, and (d) fall.
Remotesensing 17 02240 g005
Figure 6. Seasonal aerosol FoO derived by the CNN algorithm for boreal (ac) winter, (df) spring, (gi) summer, and (jl) fall and three vertical levels: (a,d,g,j) 0–2 km, (b,e,h,k) 2–4 km, and (c,f,i,l) 4–6 km. The latitude range is from 60°S to 60°N. The number at the bottom left of each sub figure represents the fraction of global-averaged FoO for each vertical level against the whole vertical column for each season.
Remotesensing 17 02240 g006
Figure 7. Vertical profiles of the annual mean aerosol FoO in representative regions. The mean values are over land only, except for ARS. The region divisions follow the climate reference regions (version 4) adopted in the Sixth Assessment Report (AR6) of the IPCC [47]. See Table 1 for the definitions of the regional abbreviations.
Remotesensing 17 02240 g007
Table 1. Annual and seasonal aerosol FoO of the regional mean between 0 and 8 km in percentage (%). The seasons are based on boreal calendar. Please see Figure 7 for the region specification. Except for ocean regions (in grey shading), the regions are land only for aerosol averaging calculation.
Region NameAbbreviationWinterSpringSummerFallAnnual Mean
Greenland/IcelandGIC1.1 ± 0.70.4 ± 0.30.1 ± 0.10.6 ± 0.40.6 ± 0.6
N.W.North-AmericaNWN1.7 ± 0.80.7 ± 0.30.6 ± 0.31.0 ± 0.41.0 ± 0.6
N.E.North-AmericaNEN2.4 ± 0.90.9 ± 0.40.4 ± 0.31.1 ± 0.41.2 ± 0.9
W.North-AmericaWNA0.5 ± 0.40.5 ± 0.40.8 ± 0.50.9 ± 0.60.7 ± 0.5
C.North-AmericaCNA0.7 ± 0.30.6 ± 0.41.3 ± 0.81.0 ± 0.60.9 ± 0.6
E.North-AmericaENA0.9 ± 0.50.7 ± 0.61.1 ± 0.61.0 ± 0.51.0 ± 0.6
N.Central-AmericaNCA0.9 ± 0.91.5 ± 1.41.3 ± 1.01.2 ± 1.01.2 ± 1.1
S.Central-AmericaSCA3.7 ± 1.45.3 ± 1.23.2 ± 1.62.7 ± 0.93.7 ± 1.7
CaribbeanCAR5.7 ± 1.14.8 ± 0.95.5 ± 1.43.7 ± 0.54.9 ± 1.3
N.W.South-AmericaNWS2.7 ± 1.82.4 ± 1.61.5 ± 1.02.0 ± 1.02.1 ± 1.4
N.South-AmericaNSA3.4 ± 1.13.1 ± 1.12.2 ± 1.03.9 ± 1.23.1 ± 1.3
N.E.South-AmericaNES2.0 ± 1.21.8 ± 0.91.6 ± 1.22.7 ± 2.12.0 ± 1.5
South-American-MonsoonSAM1.8 ± 1.01.4 ± 1.02.5 ± 1.92.1 ± 1.31.9 ± 1.4
S.W.South-AmericaSWS1.1 ± 0.81.0 ± 0.71.0 ± 0.81.0 ± 0.81.0 ± 0.8
S.E.South-AmericaSES0.8 ± 0.40.7 ± 0.50.6 ± 0.40.7 ± 0.40.7 ± 0.4
S.South-AmericaSSA0.7 ± 0.51.0 ± 0.71.1 ± 0.81.0 ± 0.61.0 ± 0.7
N.EuropeNEU1.4 ± 0.40.7 ± 0.40.5 ± 0.31.0 ± 0.40.9 ± 0.5
West&Central-EuropeWCE1.2 ± 0.51.2 ± 0.51.0 ± 0.51.2 ± 0.51.2 ± 0.5
E.EuropeEEU1.4 ± 0.50.9 ± 0.40.6 ± 0.30.8 ± 0.30.9 ± 0.5
MediterraneanMED2.2 ± 1.42.3 ± 1.63.7 ± 2.13.1 ± 1.82.8 ± 1.8
SaharaSAH3.1 ± 1.25.8 ± 1.86.7 ± 1.84.4 ± 1.65.0 ± 2.1
Western-AfricaWAF9.0 ± 2.87.2 ± 1.63.5 ± 1.44.1 ± 1.15.9 ± 2.9
Central-AfricaCAF5.6 ± 2.95.7 ± 1.84.8 ± 3.03.3 ± 0.94.9 ± 2.5
N.Eastern-AfricaNEAF6.6 ± 1.95.4 ± 1.63.9 ± 2.53.9 ± 1.64.9 ± 2.2
S.Eastern-AfricaSEAF3.9 ± 2.63.0 ± 1.95.0 ± 1.73.7 ± 1.63.9 ± 2.1
W.Southern-AfricaWSAF1.1 ± 0.70.9 ± 0.73.7 ± 2.82.0 ± 1.31.9 ± 2.0
E.Southern-AfricaESAF2.3 ± 1.32.5 ± 1.54.9 ± 1.74.4 ± 2.03.5 ± 2.0
MadagascarMDG2.2 ± 0.82.0 ± 0.82.2 ± 1.13.5 ± 0.92.5 ± 1.1
Russian-ArcticRAR3.1 ± 0.91.1 ± 0.40.5 ± 0.31.5 ± 0.41.5 ± 1.1
W.SiberiaWSB1.8 ± 0.70.9 ± 0.30.7 ± 0.30.9 ± 0.31.1 ± 0.6
E.SiberiaESB2.5 ± 1.30.9 ± 0.50.9 ± 0.61.1 ± 0.51.4 ± 1.1
Russian-Far-EastRFE2.6 ± 1.00.9 ± 0.41.0 ± 0.51.2 ± 0.41.4 ± 0.9
W.C.AsiaWCA2.5 ± 1.72.8 ± 1.95.0 ± 3.24.4 ± 2.73.7 ± 2.6
E.C.AsiaECA3.2 ± 2.23.0 ± 2.21.7 ± 1.73.1 ± 2.42.7 ± 2.2
Tibetan-PlateauTIB1.1 ± 2.21.2 ± 2.40.7 ± 1.51.2 ± 2.41.0 ± 2.2
E.AsiaEAS4.3 ± 2.13.5 ± 1.92.5 ± 1.43.2 ± 1.73.4 ± 1.9
Arabian-PeninsulaARP6.7 ± 1.68.0 ± 1.78.8 ± 2.87.8 ± 1.97.8 ± 2.2
S.AsiaSAS7.9 ± 2.48.9 ± 2.36.2 ± 3.27.0 ± 3.17.5 ± 3.0
S.E.AsiaSEA5.4 ± 1.65.0 ± 1.83.7 ± 1.44.2 ± 1.24.6 ± 1.7
N.AustraliaNAU4.5 ± 1.61.9 ± 1.31.3 ± 1.32.4 ± 1.62.5 ± 1.9
C.AustraliaCAU1.2 ± 0.70.7 ± 0.50.6 ± 0.60.7 ± 0.60.8 ± 0.6
E.AustraliaEAU1.9 ± 1.01.4 ± 0.91.0 ± 0.61.8 ± 1.11.5 ± 1.0
S.AustraliaSAU1.9 ± 0.62.1 ± 0.61.9 ± 0.81.7 ± 0.61.9 ± 0.7
New-ZealandNZ1.1 ± 0.51.5 ± 0.61.5 ± 0.81.3 ± 0.61.4 ± 0.7
N.Pacific-OceanNPO4.4 ± 2.23.0 ± 2.02.4 ± 1.83.3 ± 1.43.3 ± 2.0
Equatorial.Pacific-OceanEPO5.8 ± 2.34.8 ± 1.34.6 ± 2.34.6 ± 2.35.0 ± 2.2
S.Pacific-OceanSPO2.4 ± 1.42.8 ± 1.22.9 ± 1.32.4 ± 1.32.6 ± 1.3
N.Atlantic-OceanNAO3.9 ± 1.83.2 ± 2.23.6 ± 2.93.6 ± 1.73.6 ± 2.2
Equatorial.Atlantic-OceanEAO5.6 ± 1.85.9 ± 1.85.3 ± 1.94.1 ± 1.35.2 ± 1.8
S.Atlantic-OceanSAO2.1 ± 0.82.7 ± 0.93.0 ± 1.12.1 ± 0.92.5 ± 1.0
Arabian-SeaARS7.9 ± 0.810.0 ± 1.29.4 ± 2.77.8 ± 1.88.8 ± 2.0
Bay-of-BengalBOB7.1 ± 1.38.5 ± 1.95.8 ± 1.04.4 ± 1.06.5 ± 2.0
Equatorial.Indic-OceanEIO4.6 ± 1.64.8 ± 1.44.1 ± 1.34.3 ± 1.24.4 ± 1.4
S.Indic-OceanSIO3.2 ± 1.34.1 ± 1.44.0 ± 1.23.4 ± 1.53.7 ± 1.4
Southern-OceanSOO1.0 ± 0.51.8 ± 0.62.3 ± 0.71.4 ± 0.61.6 ± 0.8
Disclaimer/Publisher’s Note: The statements, opinions and data contained in all publications are solely those of the individual author(s) and contributor(s) and not of MDPI and/or the editor(s). MDPI and/or the editor(s) disclaim responsibility for any injury to people or property resulting from any ideas, methods, instructions or products referred to in the content.

