1. Introduction
Wildfires have profound and multifaceted impacts on ecosystem services, including air quality [
1,
2,
3], human and wildlife health [
4,
5], water quality [
6,
7,
8], the hydrological cycle and soil erosion [
9,
10], and long-term capacity for carbon storage and sequestration [
11,
12]. Altered fire regimes have forced federal agencies to increasingly divert budgets towards fire suppression, compromising their ability to address other resource needs [
13,
14,
15]. This scenario highlights the urgent need to build effective capacity in prevention, preparedness, response, and recovery in the context of wildfires, involving land management agencies, first responders, and communities to mitigate both the ecological and financial impacts of severe wildfires.
It is understood that fuel management can significantly reduce fire risk, requiring site-specific data on vegetation structure and composition to support goal-oriented planning and prioritize areas for treatment [
16,
17]. However, escalating costs, reduced workforce capacity, and the expanding scale of planning and implementation often render data from direct field measurements unattainable. In recent years, remote sensing platforms have gained popularity among managers and decision-makers as they enhance information capabilities, particularly for describing vegetation structure at landscape scales [
18]. At the same time, since the understory vegetation may vary significantly at submeter scales [
19], there is a need for finer-scale fuel and fire measurements to improve understanding of potential fuel–fire interactions.
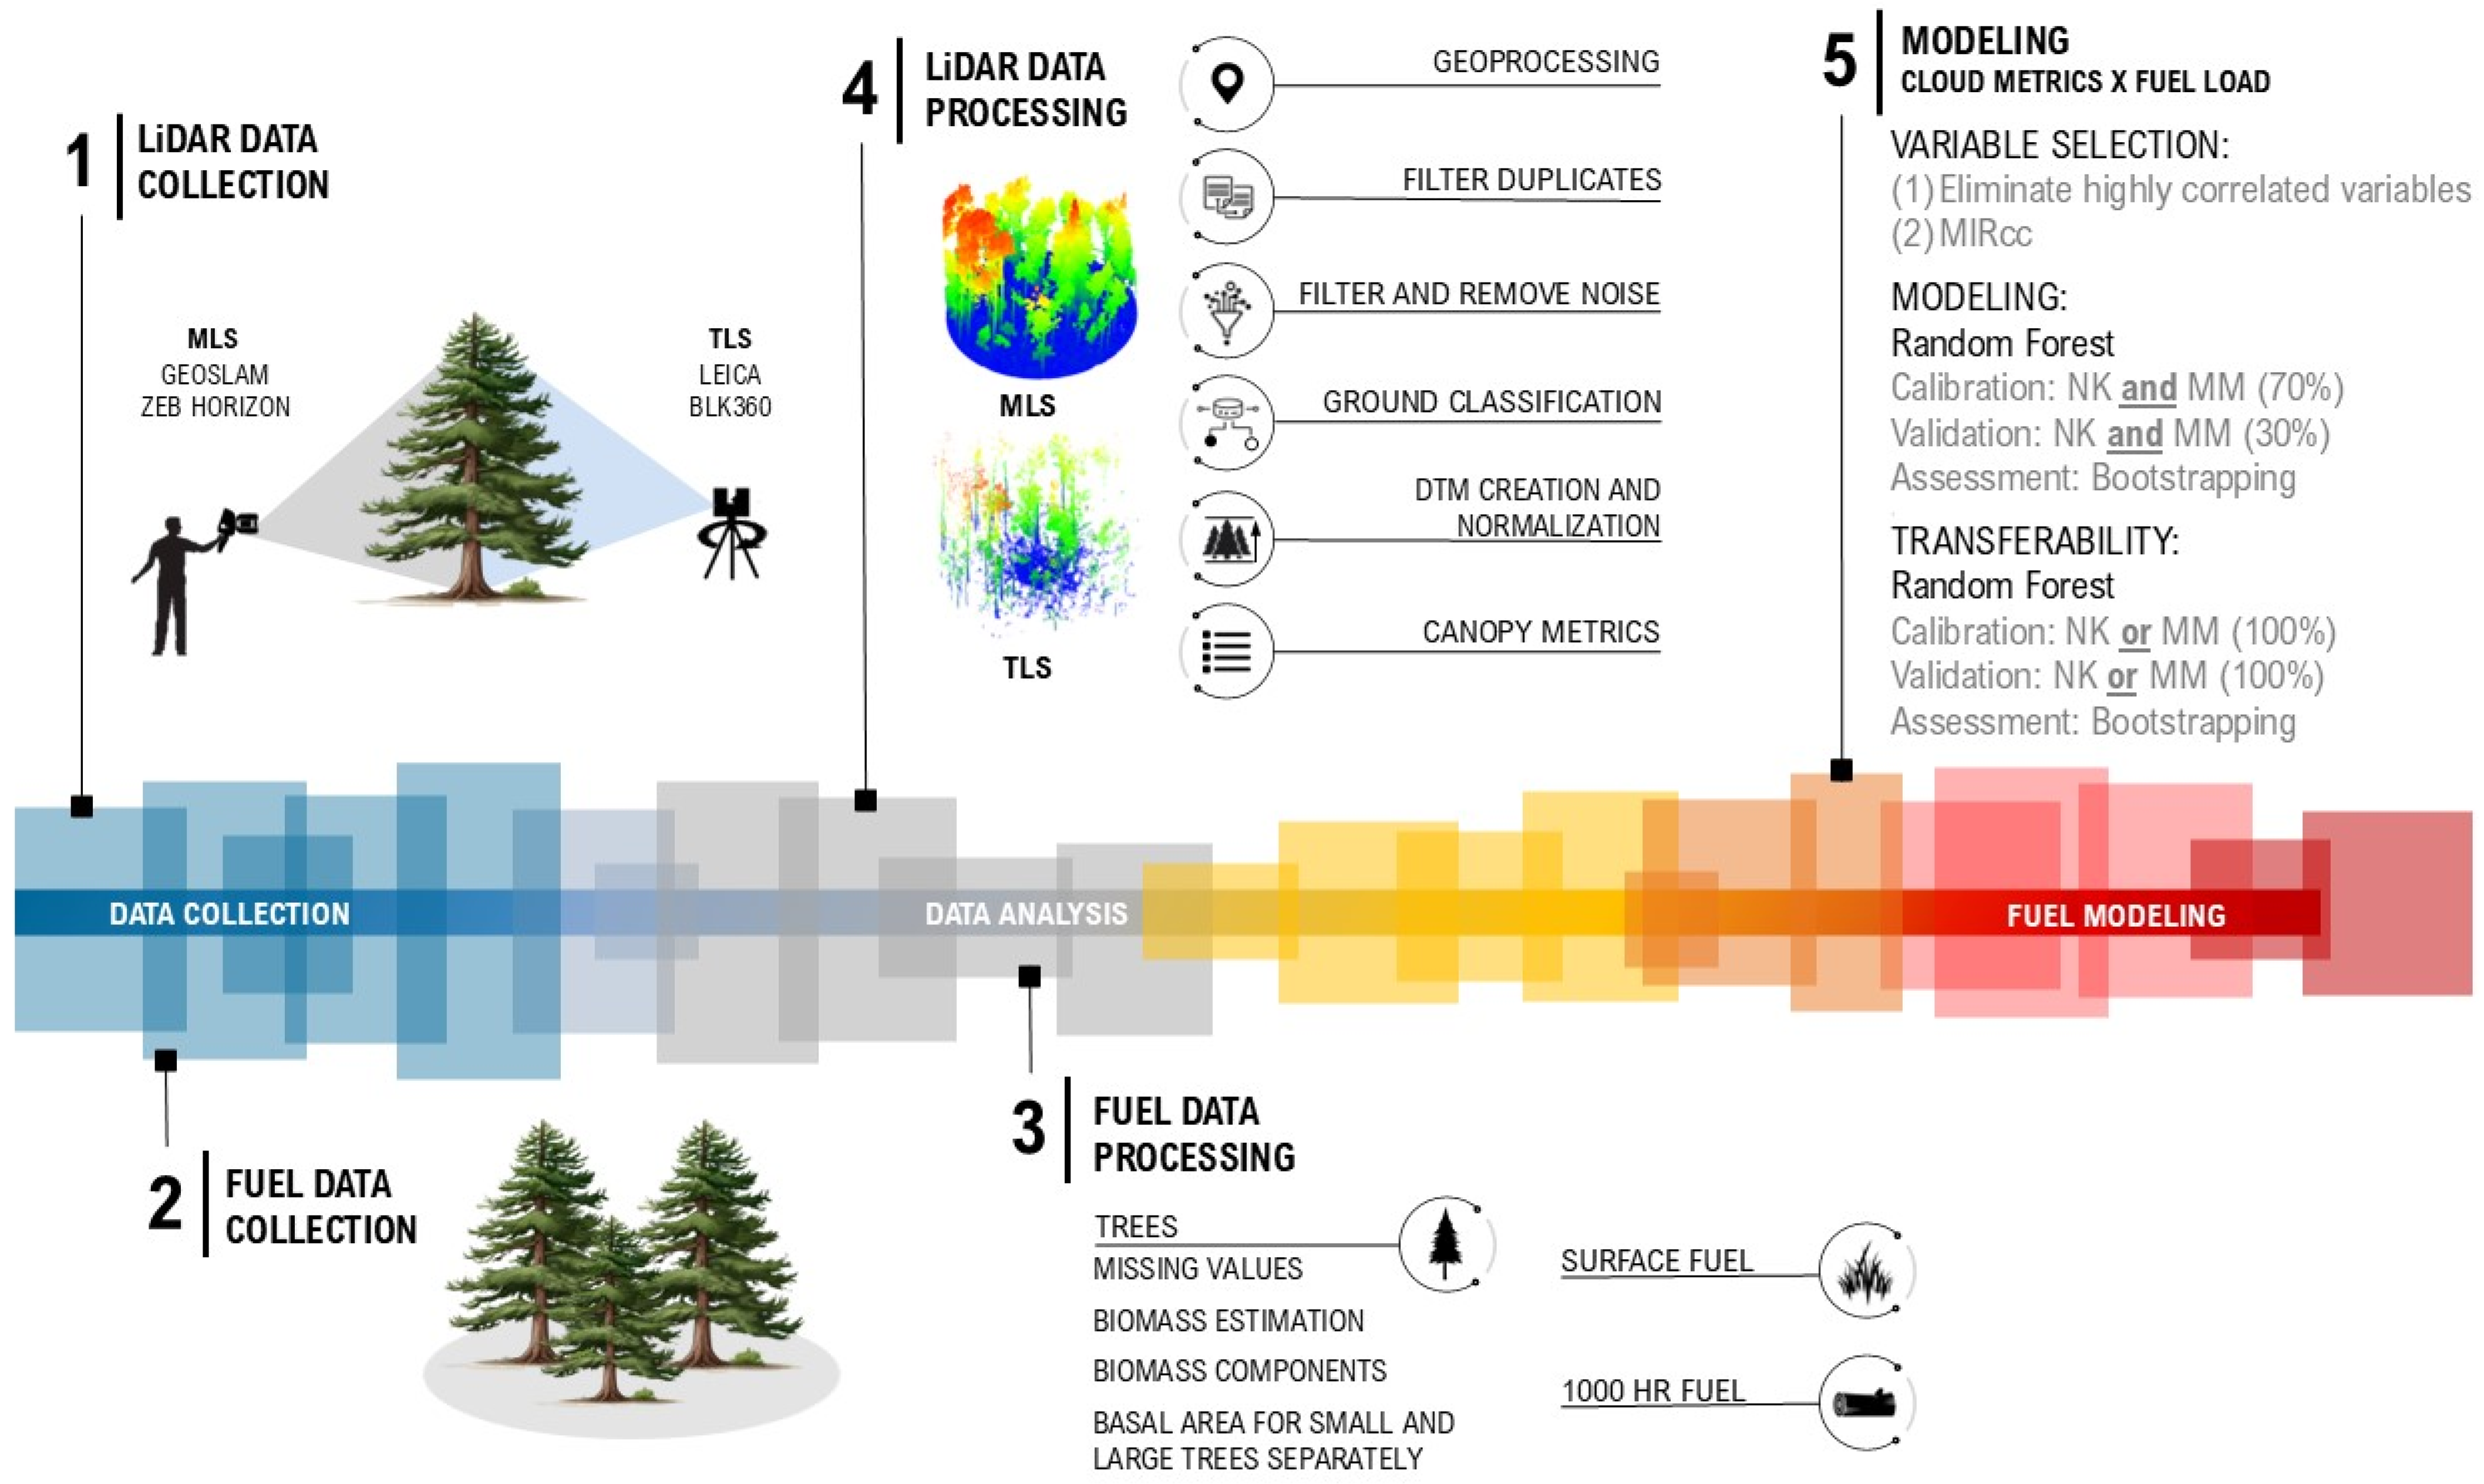
Light Detection and Ranging (LiDAR) data have emerged as valuable tools for estimating fuel loads across multiple spatial scales. For example, spaceborne LiDAR (e.g., GEDI) can support regional to continental assessments, airborne laser scanning (ALS) enables landscape-level mapping, and terrestrial or mobile laser scanning (TLS/MLS) provides detailed plot-level data suitable for model training and validation [
20,
21,
22,
23]. Terrestrial laser scanning (TLS) collects dense point clouds representing the three-dimensional structure of terrain and vegetation from a typically horizontal ground-level view perspective [
24,
25], as opposed to typically nadir views using airborne laser scanning (ALS). TLS is a powerful tool that can alleviate the time and labor demands of traditional plot-based manual sampling while potentially offering highly detailed representations of fuel structure [
26,
27]. It can be divided into two categories: static and mobile laser scanning. Static laser scanning, referred to here as TLS, involves setting up a tripod-mounted laser scanner in one or more fixed locations and scanning the surrounding environment to capture high-resolution data [
28,
29]. MLS, on the other hand, involves a laser scanner mounted on a mobile platform such as a vehicle, drone, backpack, or being held by hand (a hand-held scanner) [
30]. The MLS scanner can capture 3D data of the environment as the platform moves through the area, allowing for quick and efficient data capture [
31]. Both TLS and MLS have their advantages and limitations. TLS offers high positional accuracy of laser points, making it well-suited for capturing detailed information within an area of interest [
28,
32]. However, when scanned from a single viewpoint, the data may contain greater overall occlusion from proximal vegetation or terrain obstructions [
33]. MLS, on the other hand, may decrease overall occlusion, but the absolute positional accuracy of points collected with MLS is generally lower than TLS, due to error accumulation during scan registrations, even though MLS employs localization algorithms like Simultaneous Localization and Mapping (SLAM) [
28,
32,
33,
34].
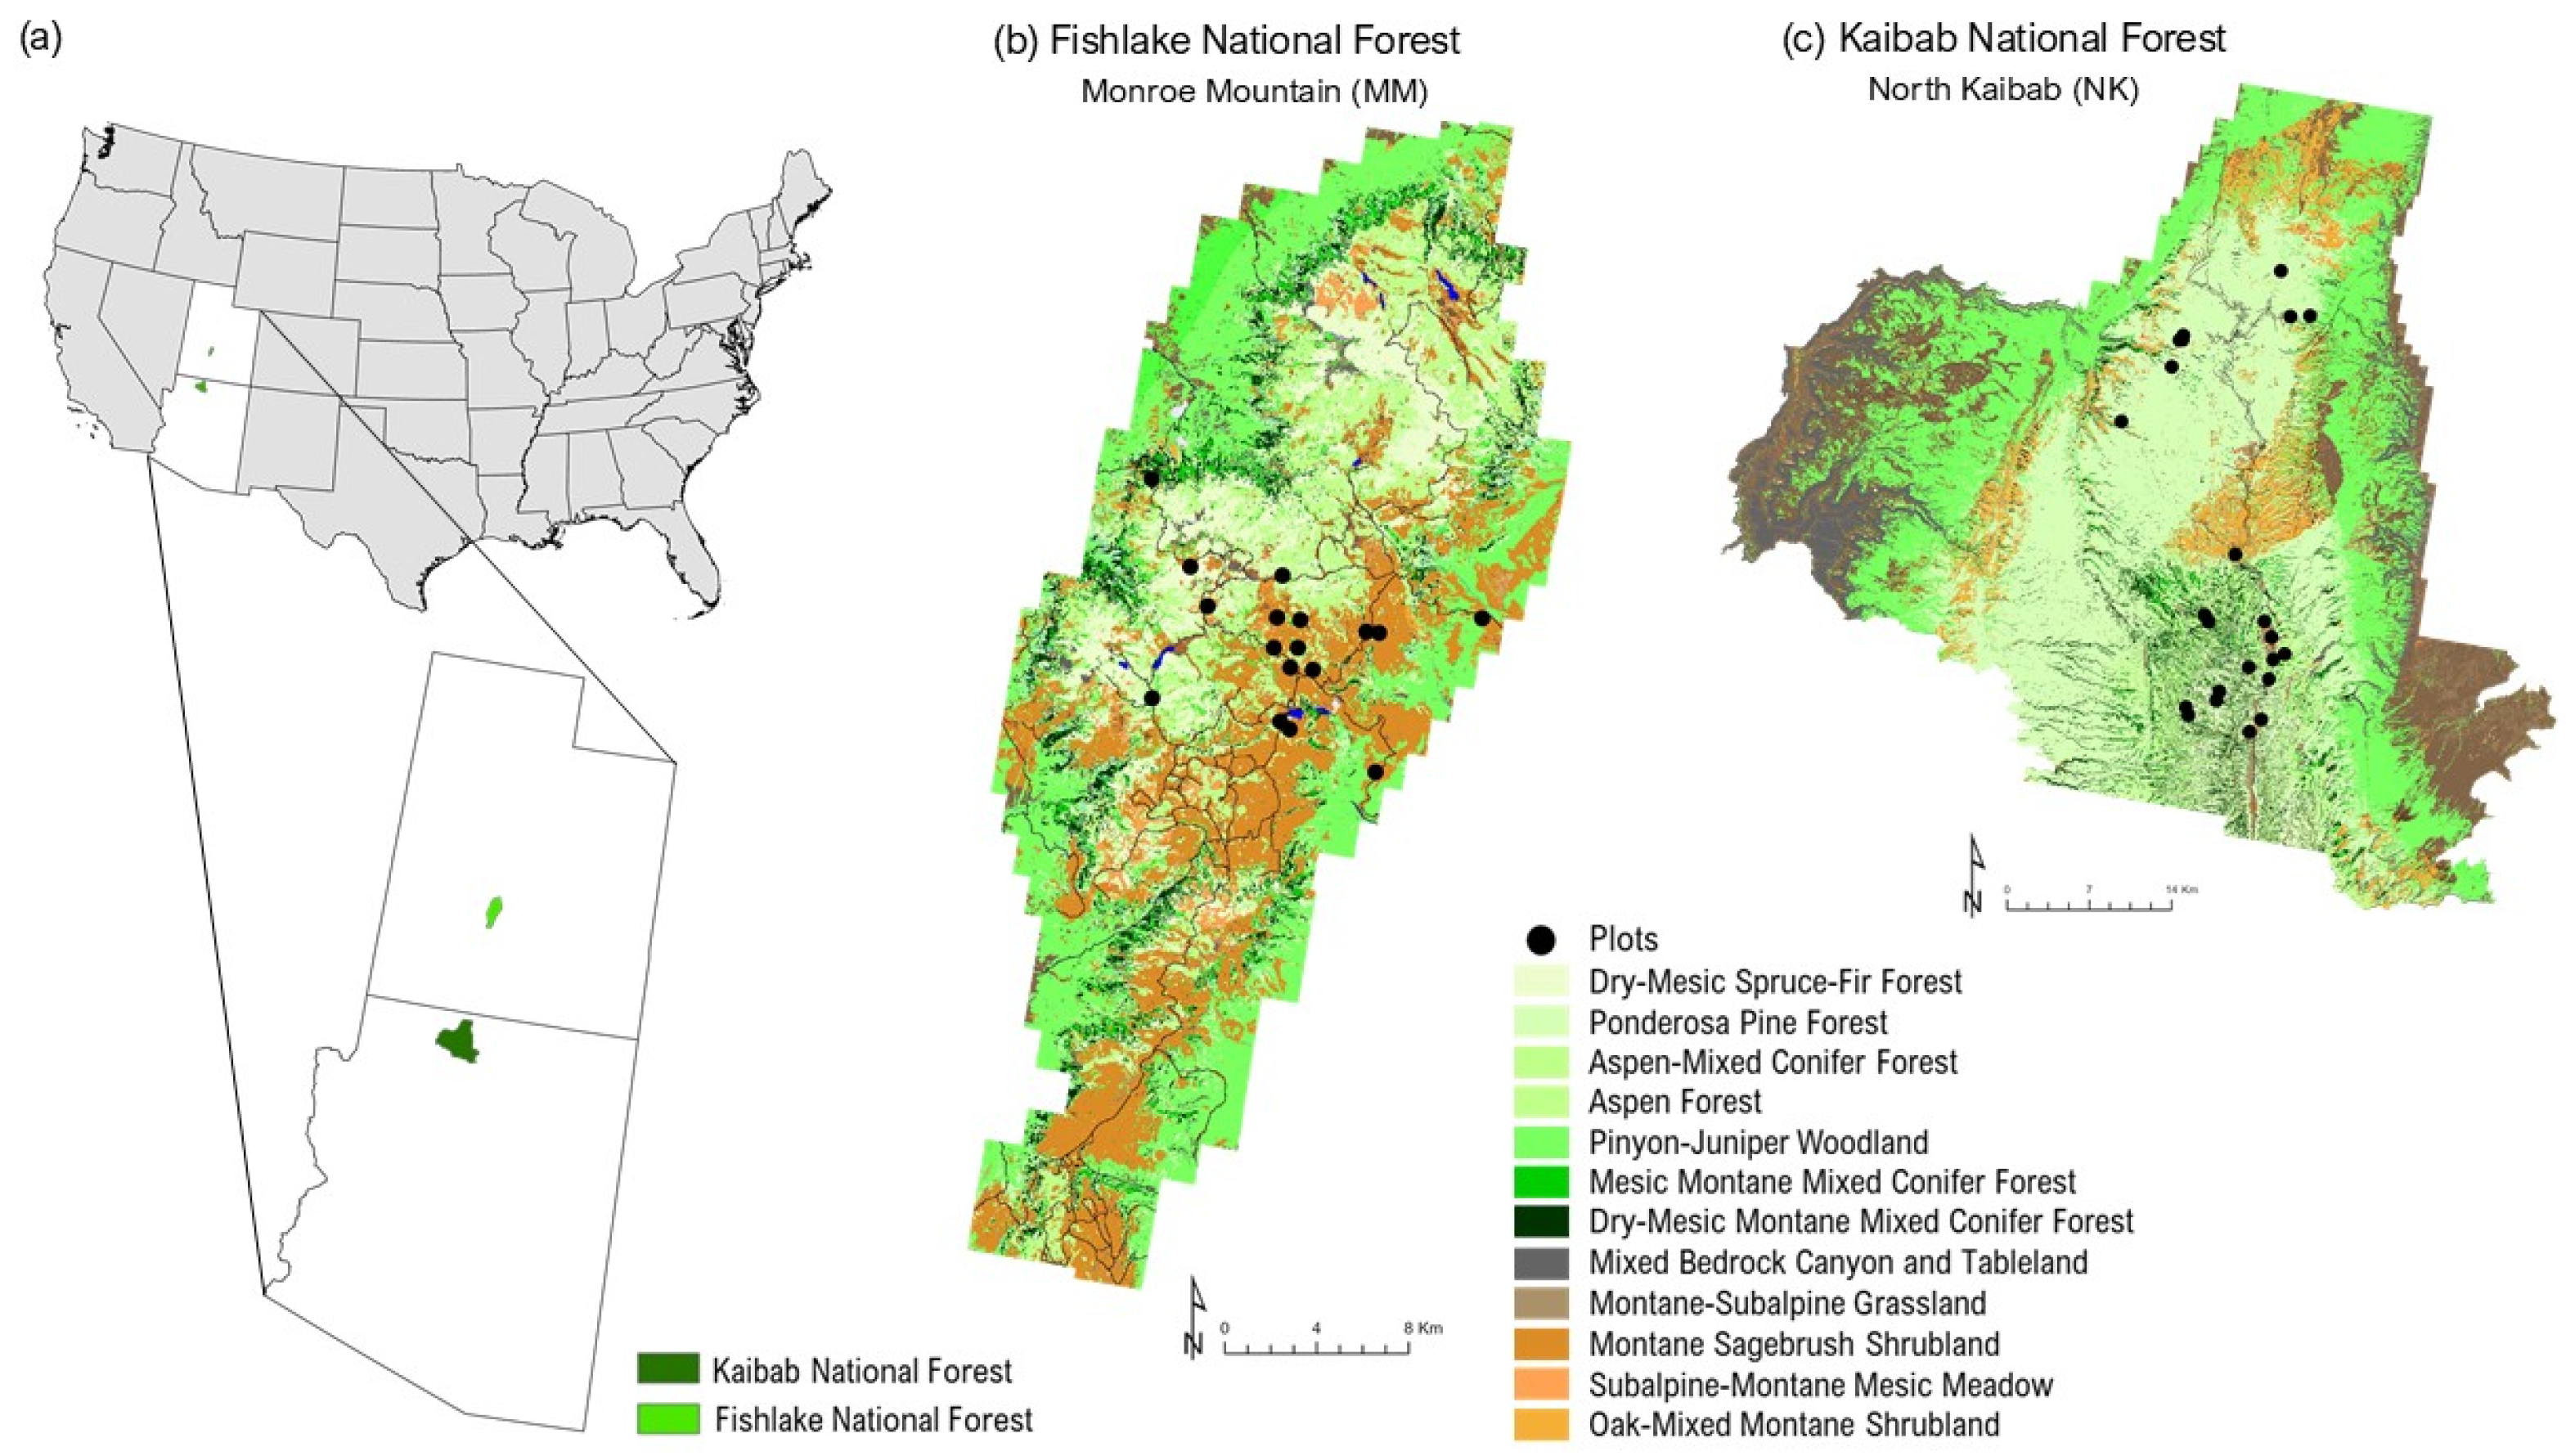
The differences in performance across scanning systems raise important questions about model transferability, as each system’s effectiveness may vary depending on environmental conditions and vegetation structures. This issue is central to our study, which places a strong emphasis on model accuracy and transferability in LiDAR-based approaches for fuel load estimation. Model transferability refers to the ability of a model developed in one environment to perform effectively in other ecological settings. While prior studies have explored LiDAR-based fuel modeling, few have directly assessed how predictive models perform when transferred between ecologically distinct sites, particularly when comparing mobile and terrestrial platforms under standardized conditions. By comparing MLS with a simplified single-scan TLS approach, we sought to evaluate how well these methods capture fuel load variability across multiple vegetation strata and environmental conditions. Our study advances this field by providing a systematic, cross-platform evaluation of model robustness and generalizability across contrasting forest landscapes. Ensuring that models are both robust and adaptable is essential, particularly as fuel management increasingly depends on scalable remote sensing technologies to meet landscape-level demands. Through rigorous testing across two distinct sites in Arizona and Utah, we assessed each system’s strengths and limitations in producing reliable models, underscoring the importance of developing adaptable fuel estimation models that deliver accurate predictions across diverse landscapes.
3. Results
3.1. Selection of LiDAR Metrics
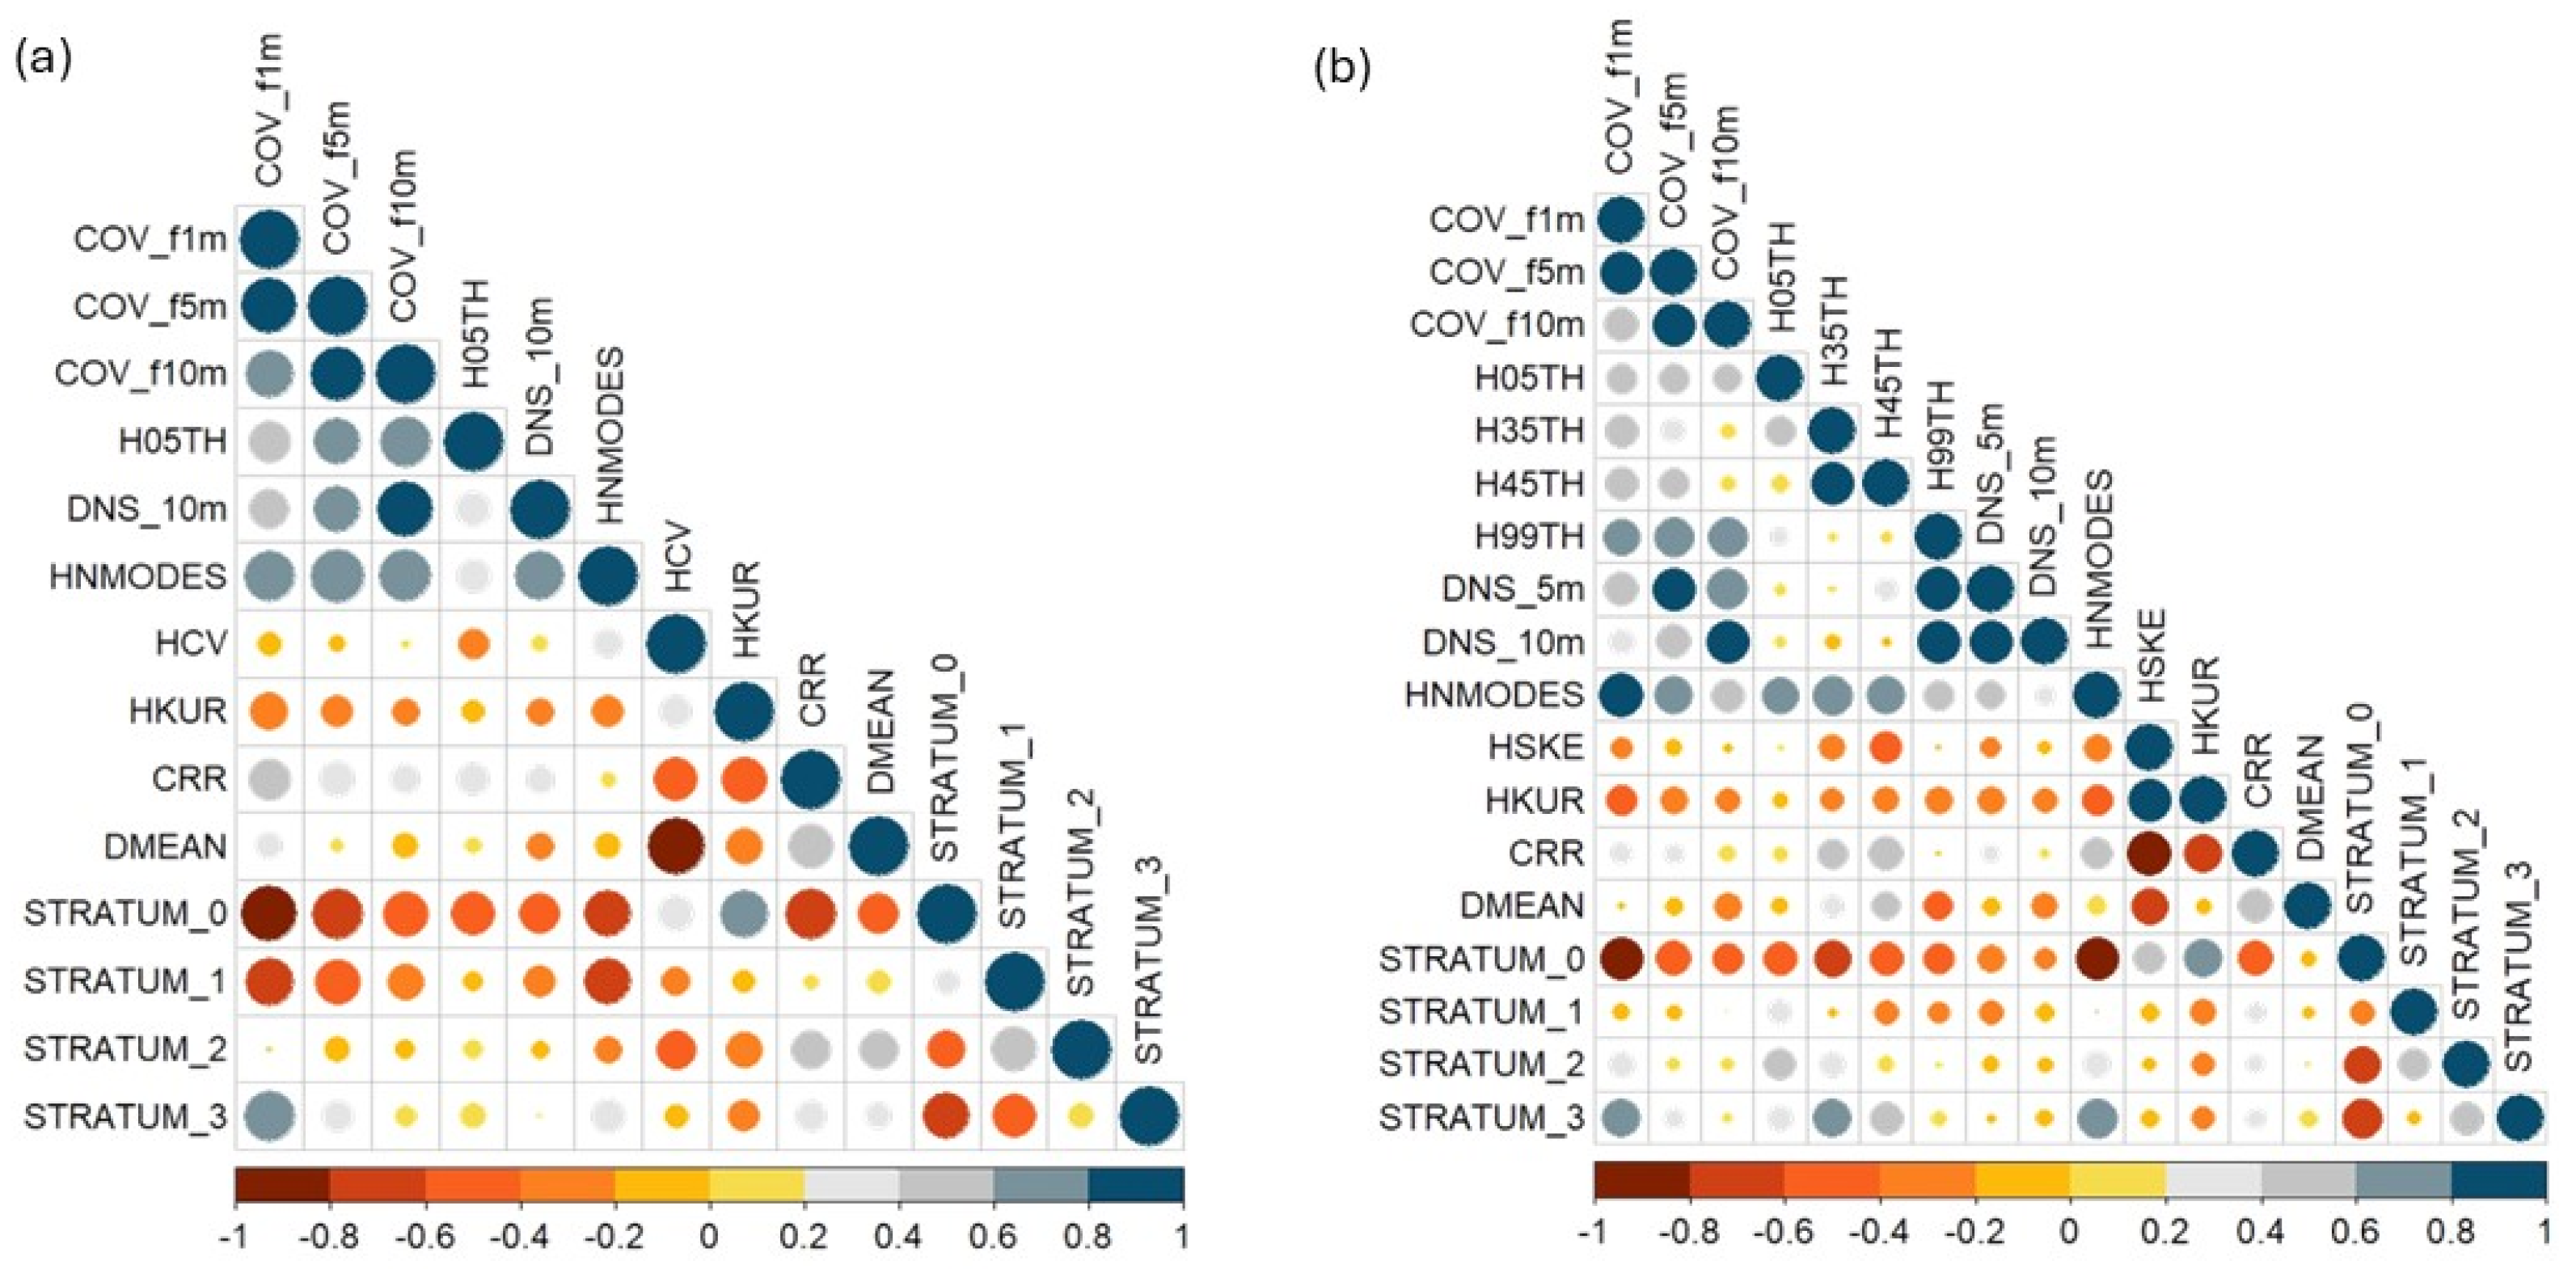
The first stage of the variable selection process, which was based on Pearson correlation, reduced the number of candidate metrics from 56 to 14 for MLS and to 18 for TLS (
Figure 6). Out of the selected metrics, ten density metrics (COV_f1m, COV_f5m, COV_f10m, DNS_10m, CRR, DMEAN, STRATUM0, STRATUM1, STRATUM2, STRATUM3) and three height metrics (H05TH, HNMODES, HKUR) were common to both MLS and TLS models.
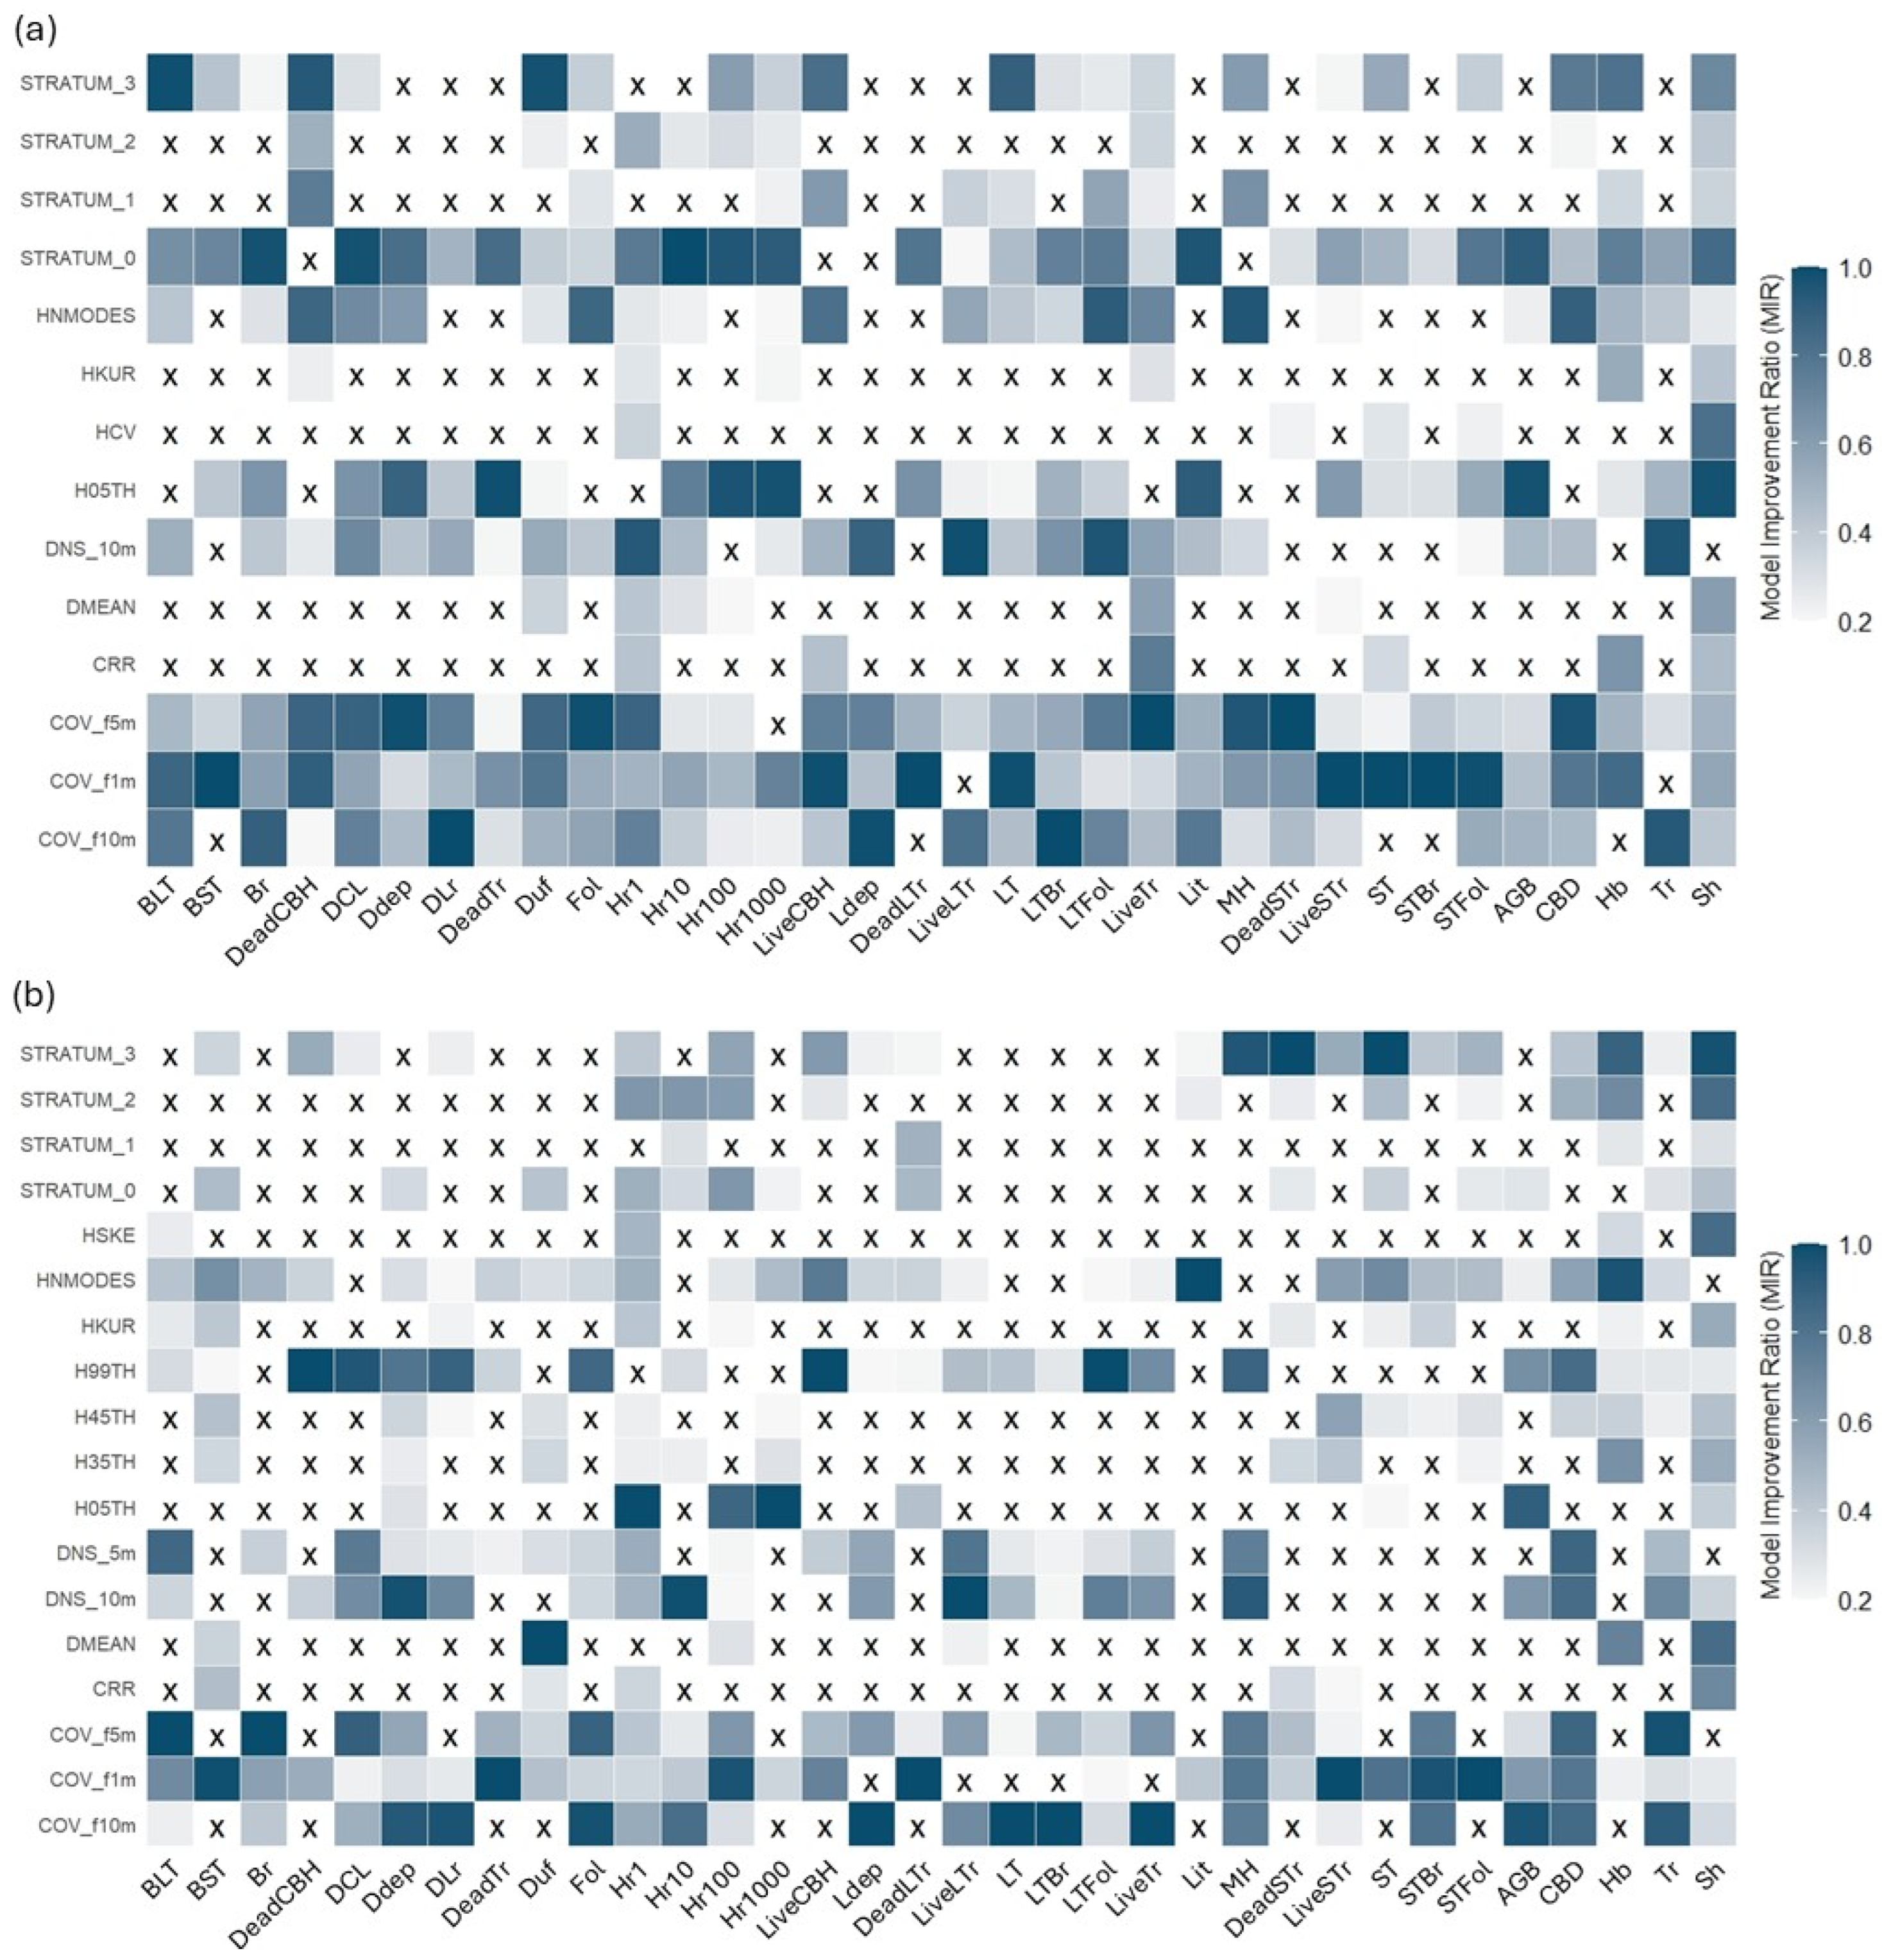
The second stage of the variable selection process involved applying the MIR method (
Figure 7). Across both sensors, there is a notable predominance of metrics related to vegetation cover and density, such as cover fractions at 5 m and 10 m and canopy density at 10 m. These metrics frequently appear across the models for various fuel components, suggesting that they are crucial for understanding the spatial structure of fuel loads, regardless of the sensor being used.
3.2. Model Assessment
Paired
t-tests comparing model performance across fuel attributes showed that MLS models significantly outperformed TLS models in terms of R
2 (mean difference = 0.08, 95% CI: 0.047–0.113,
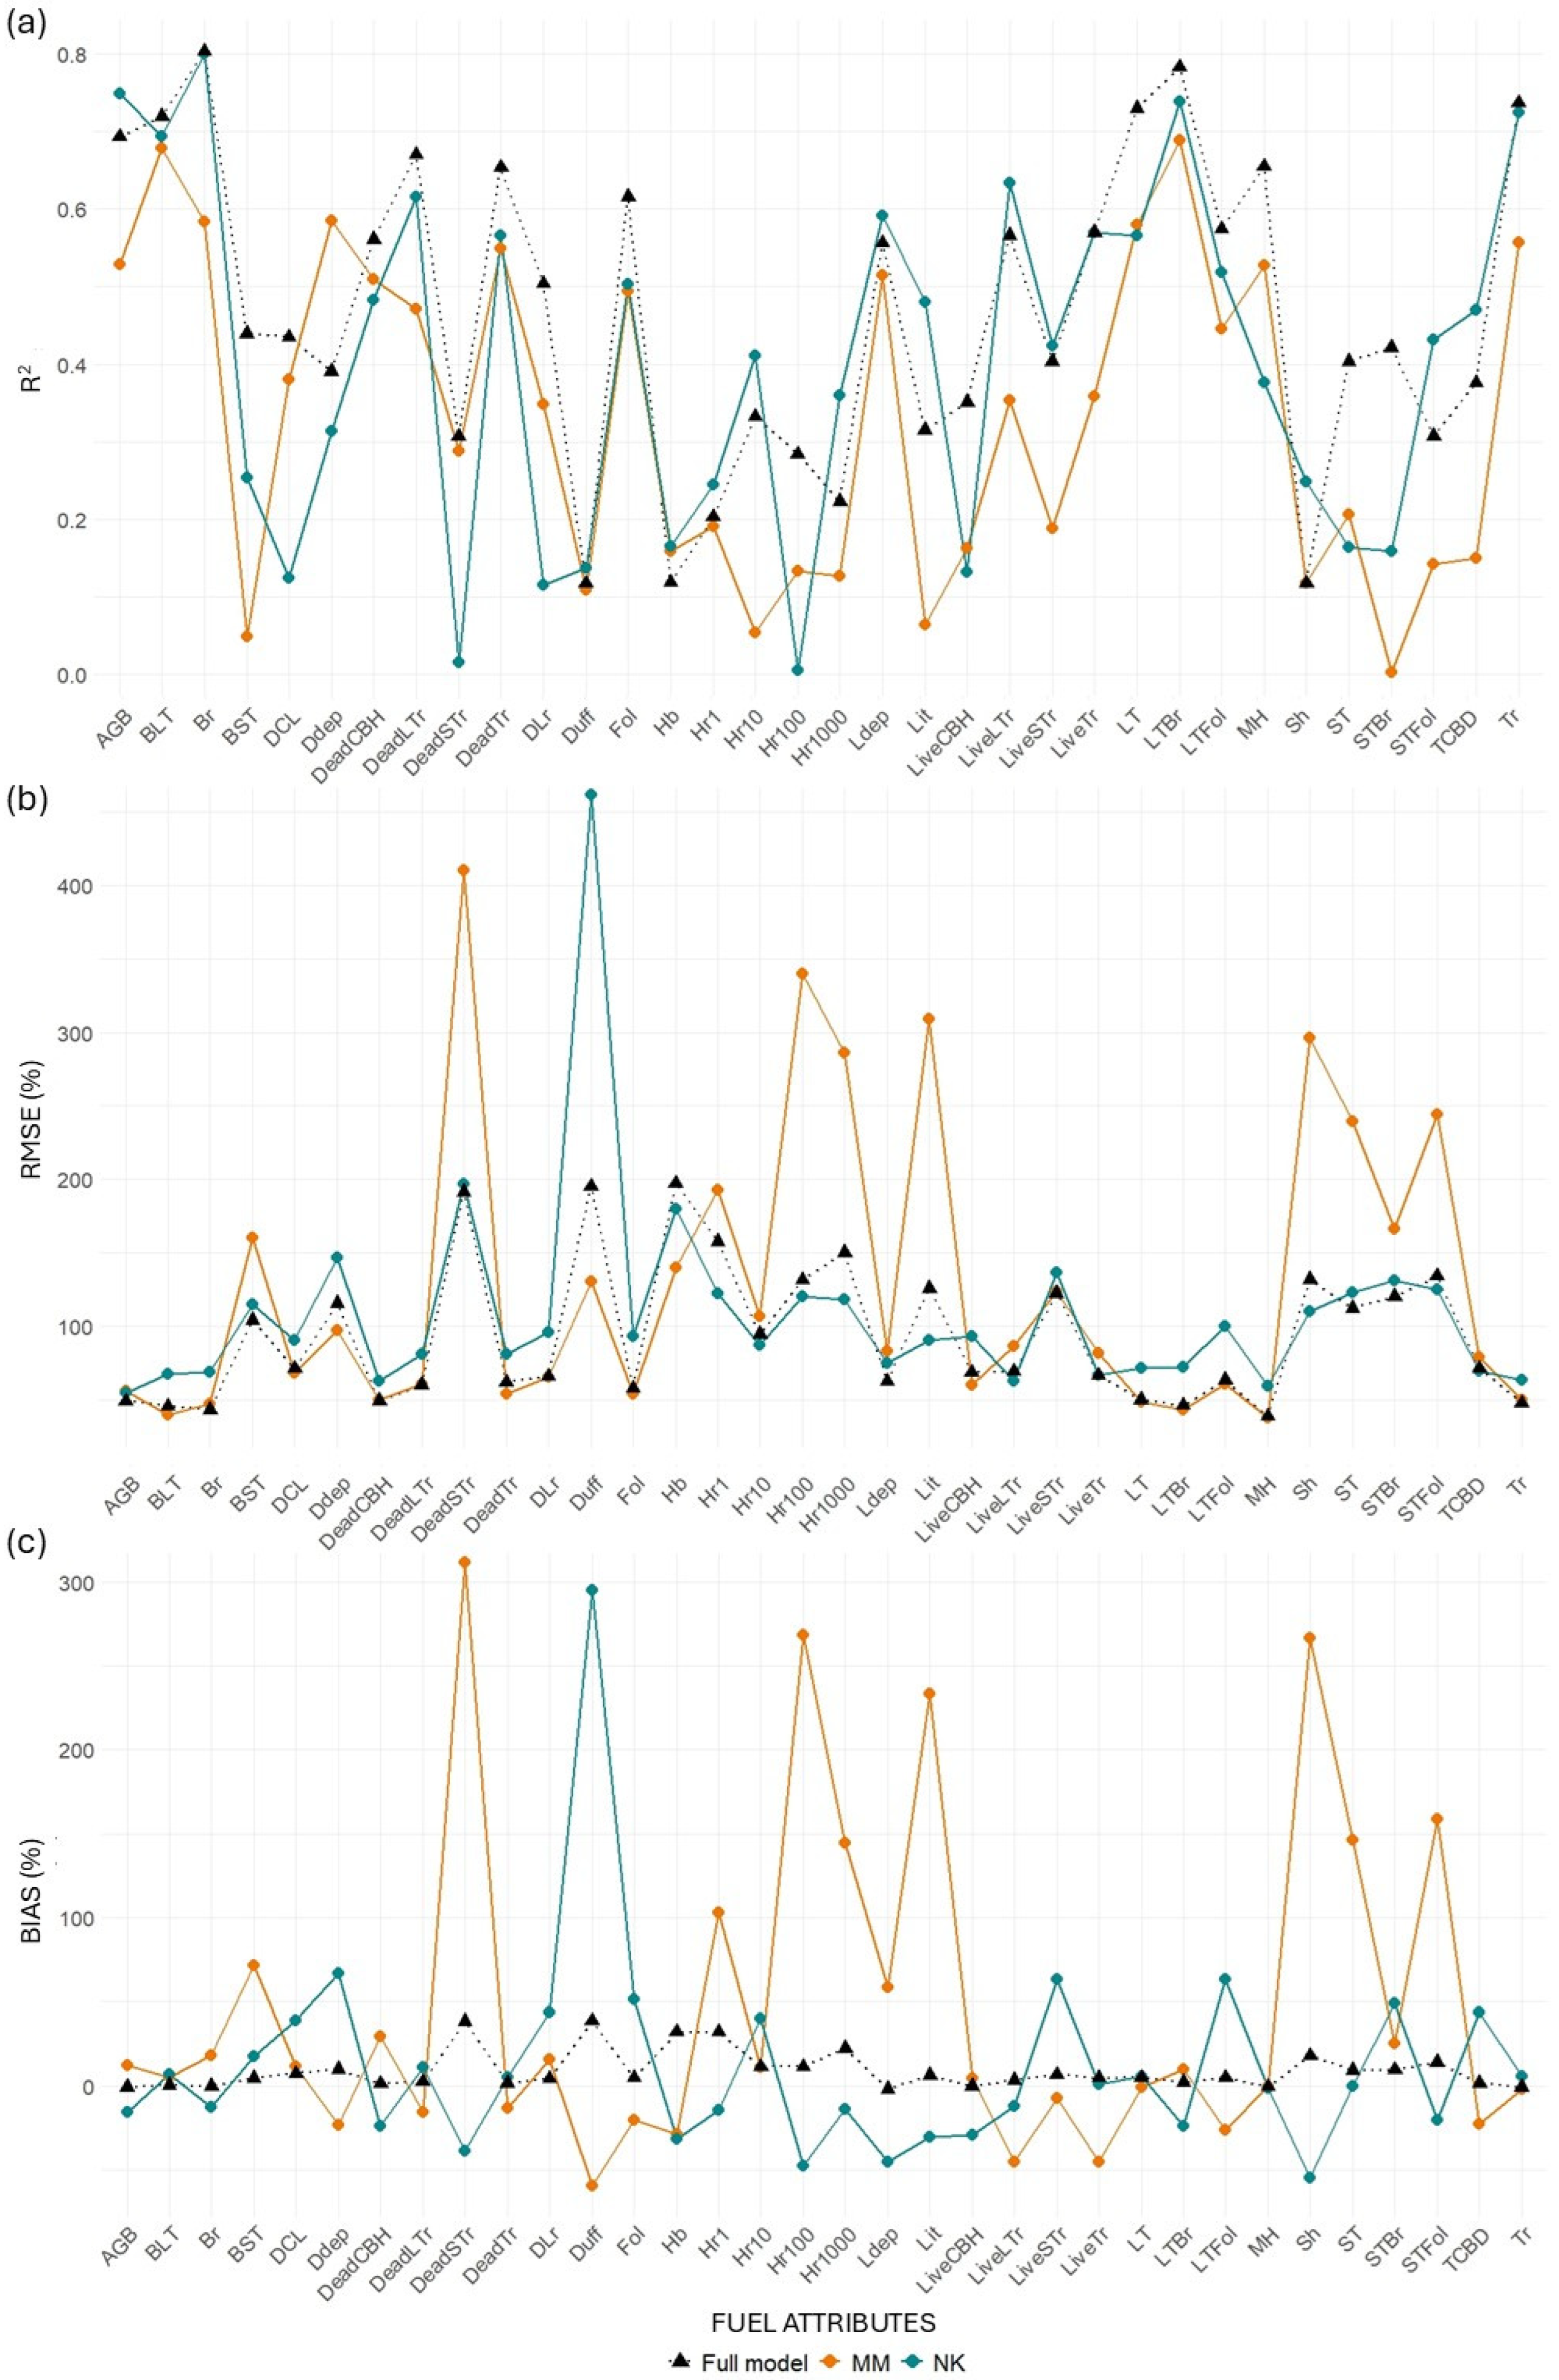
p < 0.001). These results confirm the consistent advantage of MLS over single-scan TLS configuration (
Figure 8,
Table A6). In this group, MLS achieved a higher average R
2 (0.55) compared to TLS (0.45), and a lower average %RMSE (76.66% vs. 90.76%), indicating more accurate predictions. Bias values were also lower for MLS (mean = 5.42%) than for TLS (mean = 4.19%), though variability remained.
For surface fuel components, including downed wood (1 h, 10 h, 100 h, 1000 h), litter, and litter depth, the MLS models again showed improved performance, with higher average R2 (0.30 vs. 0.25 for TLS) and slightly higher %RMSE (129.18% vs. 122.63%). Notably, bias levels remained similar between the two platforms (MLS = 16.27%, TLS = 16.56%), suggesting both models struggled similarly with these more variable and spatially heterogeneous fuels.
In contrast, ground fuels such as herbaceous biomass (Hb) and shrub biomass (Sh) were poorly predicted by both platforms, with low R2 values (0.11 for TLS, 0.12 for MLS) and high %RMSE (160.95% for TLS, 164.67% for MLS). These results highlight the challenges of modeling fine-scale surface components using airborne or terrestrial laser scanning.
When considering total aboveground biomass (AGB), the MLS model again demonstrated better predictive power (R2 = 0.69; %RMSE = 49.11%) compared to TLS (R2 = 0.57; %RMSE = 54.64%), with MLS also producing lower bias.
3.3. Transferability Model Performance
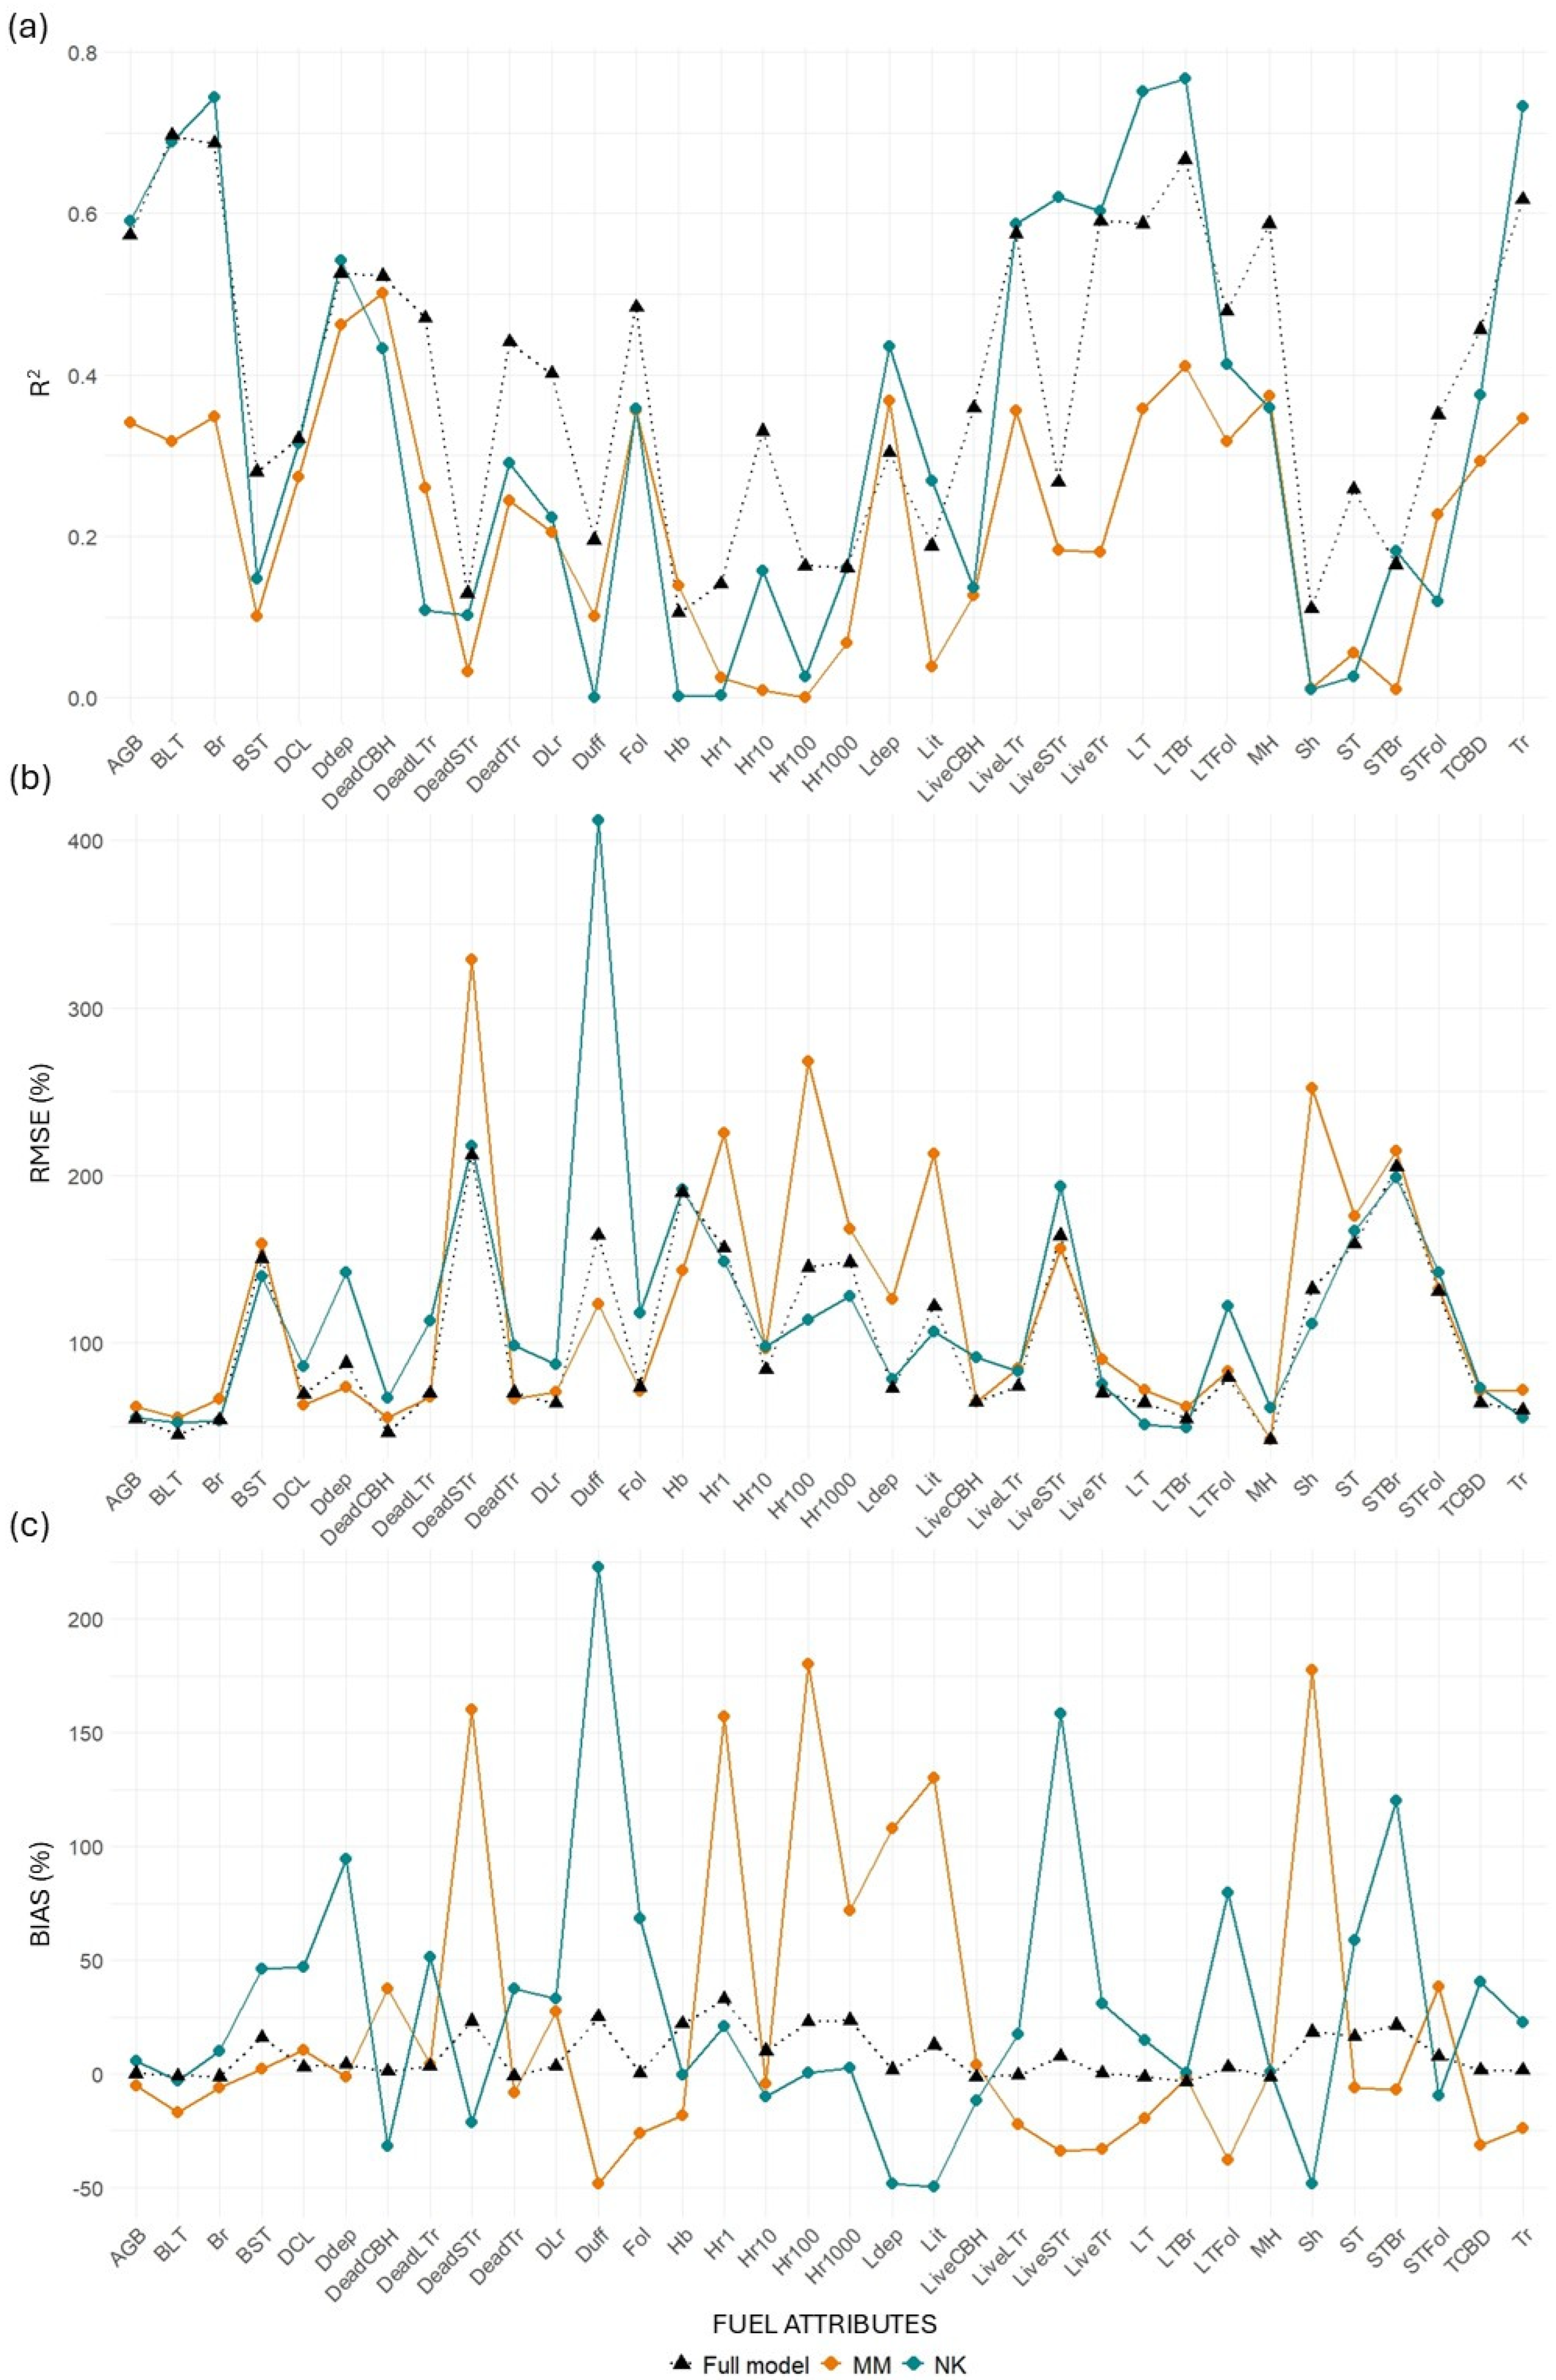
Table A7 and
Table A8 summarize the predictive performance of MLS and TLS models when transferred between sites from NK to MM and vice versa (
Figure 9 and
Figure 10).
Table A9 presents the percent change in R
2 after model transfer, with positive values indicating improved performance and negative values reflecting a decline.
MLS models for canopy-related variables retained relatively good performance when transferred from NK to MM, with minor losses in R2 for key metrics such as BLT (−3.49%), Br (−0.53%), and Tr (−1.75%). Some variables even improved, including LiveLTr (+12.01%), CBD (+24.98%), and STFol (+40.20%). However, when transferred from MM to NK, losses were more substantial across the board (e.g., Br: −27.36%; LiveLTr: −37.55%; STBr: −99.43%). This asymmetry suggests that models trained in the more structurally diverse NK site may generalize better than those trained in MM. TLS models performed worse than MLS in both directions and showed extreme declines in some metrics when transferred from MM to NK (e.g., BLT: −54.35%, STBr: −93.6%).
Surface fuel models were the most inconsistent. MLS models showed surprising gains when transferred from NK to MM (mean R2 change = +75.25%), largely due to strong positive responses in Sh (+111.32%) and Hb (+39.17%). However, in the reverse direction (MM to NK), the average R2 gain was more modest (+17.03%), and TLS models performed poorly in both directions, particularly from NK to MM (−94.40%).
Ground fuels exhibited high variability. MLS models again showed better transferability from NK to MM (mean = +7.89%), with gains in metrics such as Lit (+52.21%), Hr10 (+23.62%), and Hr1 (+20.34%). The transfer from MM to NK was much less successful, with an average decline of 28.83%, including large losses in Hr10 (−83.68%) and Lit (−79.44%). TLS models suffered significant performance losses in both directions, especially from MM to NK (−57.07%).
Total AGB also reflected the general trend. MLS models showed a performance gain of 8.13% when transferred from NK to MM and a decline of 23.68% from MM to NK. TLS models had lower overall transferability, with a small gain (+2.93%) in the NK to MM direction, but a marked loss (−40.61%) when transferred from MM to NK.
4. Discussion
4.1. Model Performance Analysis
Consistent with the findings of Bienert et al. (2018), our results confirm the superior performance of MLS models, which consistently outperformed TLS across most fuel attributes, especially for canopy fuels and standing woody biomass [
32]. These attributes are especially relevant for understanding the vertical distribution of vegetation layers, which strongly influences fire behavior. Denser or taller canopies increase fuel availability and the potential for fire propagation.
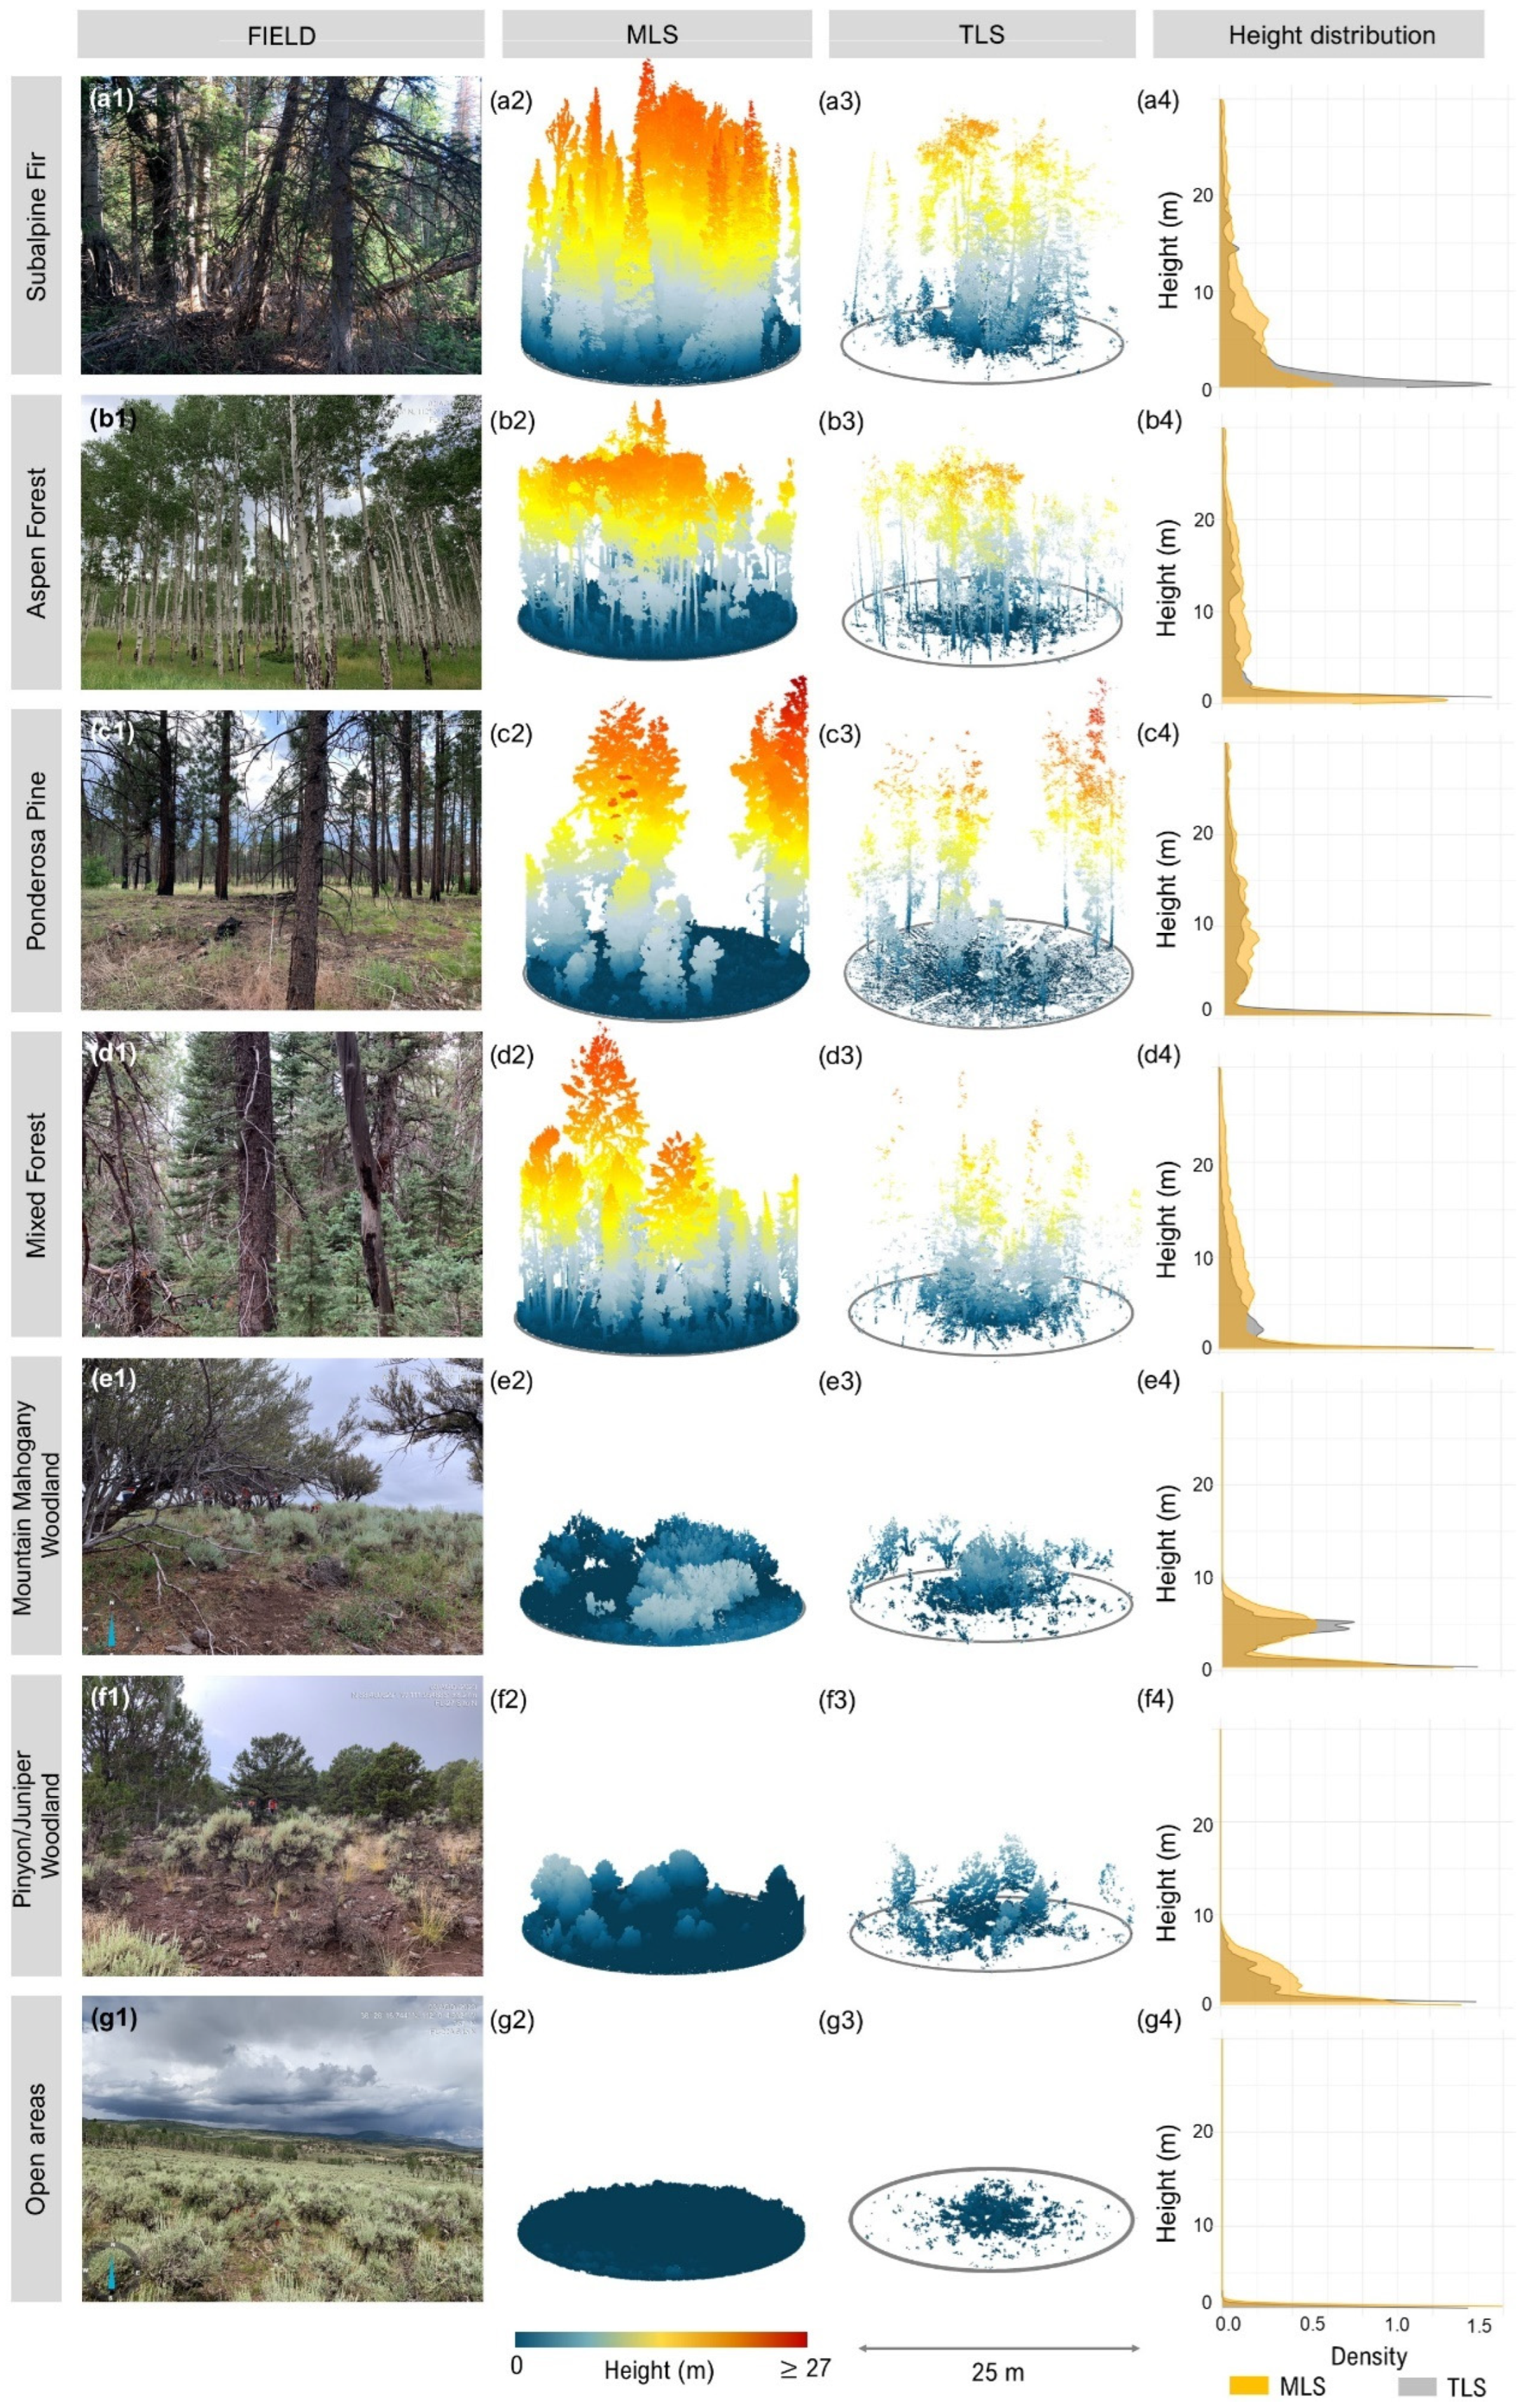
One key difference between the sensors lies in their data acquisition strategies. The MLS sensor, moving through the plot, has the potential to collect data from a broader range of viewing angles, which can improve structural characterization, especially near the ground. However, its ability to detect fine surface fuels, such as grass and litter, is still limited by factors like sensor ranging accuracy, vegetation occlusion, and SLAM drift. In our models, MLS more frequently selected lower-stratum metrics such as Stratum_0, suggesting better relative sensitivity to near-ground structure compared to TLS. However, both MLS and TLS performed poorly in predicting surface and ground fuel attributes, including fine fuels (1 h, 10 h, litter depth), and coarser downed woody classes (100 h and 1000 h). This highlights the persistent challenge of using LiDAR to estimate understory and ground-level fuel components.
The challenges with TLS performance are likely due to occlusion effects. In this study, only one scan per plot was acquired from a fixed position at plot center, limiting visibility, especially of understory and ground-level fuels farther from the scanner. Although TLS remains appealing due to its operational simplicity and affordability, its limitations are clear in this configuration. A multi-scan approach could mitigate occlusion and improve model quality, but this would require more expertise and time, potentially surpassing the complexity of MLS systems, which benefit from automated SLAM-based registration. Future work should explore flexible TLS scanning protocols. Designing scan arrangements adapted to varying forest types could help balance data quality, field efficiency, and ease of processing, especially in dense or multi-layered forests.
4.2. Transferability of Model Performance
Model transferability varied across fuel types, LiDAR platforms, and transfer directions. Canopy-related attributes, such as total tree biomass (Tr) and aboveground biomass (AGB), showed the highest transferability, particularly in MLS models. For instance, an AGB model trained in NK and applied to MM even improved slightly (+8.13% in R2), while the reverse direction experienced a moderate decline (−23.68%). In contrast, surface and ground fuel metrics—especially 1, 10, 100, and 1000 h fuels, duff, and litter—transferred poorly, often showing R2 drops greater than 80%, particularly when using TLS. These patterns reflect the inherent difficulty of predicting fine fuels even within a single site, likely due to both their ecological variability and the limitations of sensor sensitivity to ground-level signals.
Several factors help explain the observed asymmetry in transfer performance between NK and MM. NK plots featured a larger sample size, more structural heterogeneity, and greater canopy complexity, which likely provided more robust training data and improved generalization capacity. In contrast, MM plots were more structurally homogeneous, and four plots lacked any trees, limiting the diversity and applicability of training data. Additionally, differences in species composition, understory density, and terrain between sites may have influenced the sensitivity of LiDAR metrics, especially for strata close to the ground, where occlusion and clutter are more problematic.
Methodological choices also shaped transferability outcomes. TLS data were collected from a single fixed-position scan per plot, which restricted the sensor’s ability to detect understory and ground fuels due to occlusion, especially in denser stands. While this protocol was efficient and cost-effective, it reduced spatial coverage and may explain the poorer performance and generalization of TLS-based models. In contrast, MLS scanning benefited from dynamic movement and automated SLAM registration, enabling broader plot coverage and more complete representation of vegetation structure. This advantage was reflected in the overall higher robustness of MLS models across transfer scenarios. Future studies may improve TLS model performance by adopting multi-scan or rotating station protocols that increase spatial resolution without compromising field efficiency.
Interestingly, some transferred models outperformed their full-model counterparts. In certain cases, models trained at one site and applied to another yielded higher predictive accuracy than those trained on pooled data from both sites. This suggests that combining data from ecologically distinct areas may introduce noise or lead to overfitting of site-specific patterns, reducing generalizability. Targeted models, therefore, may offer better performance for particular forest structures or fuel components, despite lacking broader applicability.
While the statistical comparisons between TLS and MLS models revealed significant differences in performance (p < 0.001), the mean R2 difference was approximately 0.08 in favor of MLS—an effect size with practical relevance, particularly for fuel mapping in operational contexts. This performance gap was more pronounced for canopy-related metrics than for surface fuels, indicating that MLS is better suited to capturing vertical structure relevant to aboveground biomass and tree-based attributes.
One important limitation of our modeling framework is the exclusion of environmental covariates. To isolate the performance of LiDAR-derived structural metrics, we deliberately omitted predictors such as elevation, slope, aspect, or species identity. While this simplification allowed for a direct comparison between platforms, it likely contributed to the poor transferability of fine fuel and surface attributes, which are often strongly influenced by microtopography and ecological gradients. Future work should consider incorporating such covariates to improve predictive accuracy and interpretability.
From an applied perspective, model scalability remains a central challenge. Although our analysis focused on plot-level estimates, landscape-scale fuel mapping requires spatially explicit data. A promising direction for upscaling involves calibrating ground-based LiDAR models with spaceborne LiDAR and multispectral imagery to generate continuous maps of fuel structure. Such integration would enhance the operational utility of LiDAR-based fuel models for fire risk assessment, fuel treatment planning, and ecosystem monitoring across diverse forest types.
4.3. Ecological Considerations and Fire Management Implications
We demonstrated that MLS models were highly effective in predicting key structural and canopy fuel attributes critical for modeling crown fire initiation and propagation. These include canopy base height (live and dead), canopy bulk density, dead crown length, mean canopy height, and crown foliage and branch biomass, all of which are essential for determining vertical fuel continuity, ignition potential, and canopy fire spread dynamics. Such attributes are fundamental for fire behavior models and play a central role in fire management strategies aimed at reducing the risk of high-severity wildfires. Species like spruce and fir, which have highly flammable low branches, introduce a significant dynamic in fire ecology [
55]. These species are notably vulnerable to fire events, often being seriously affected. Their survival depends heavily on post-fire regeneration, and without successful regeneration, any competitive advantage these species might have gained through fire adaptation is lost. The ability of a forest to regenerate after fire events is vital, as species that successfully regenerate can significantly alter forest composition and fuel availability for future fires [
56]. In this context, the improved performance that MLS offers over the TLS single scan in representing these structural elements provides a clearer understanding of the conditions that influence fire risk.
Conversely, the prediction of surface fuels, which play a key role in fire spread, was challenging for both MLS and TLS. A key limitation is the underrepresentation of fine surface fuels such as litter and duff, which are inherently difficult to detect due to their fine structure and low vertical separation from the ground. While understory occlusion can affect the detection of larger surface elements, the inability to resolve fine fuels is primarily due to LiDAR’s limited capacity to penetrate and distinguish such elements. Even MLS, which reduces occlusion by capturing data dynamically [
57], suffers from increased SLAM-related noise and lower ranging accuracy, further limiting its ability to quantify fine surface fuels. As a result, accurate surface fuel characterization in dense forests may still require complementary ground-based or alternative remote sensing methods.
The flammability of dead material also presents a dynamic that evolves over time. Initially, trees with intact dead branches and needles are highly flammable due to their low moisture content. These fine fuels ignite easily, contributing significantly to fire spread to and throughout the canopy. However, as the needles and smaller branches drop, the flammability of standing trees decreases. Although the larger branches and boles remain consumable during fire events, they play a reduced role in propagating fire. This shift is essential for fire management, highlighting the need to assess standing trees not only for their immediate fire risk but also for their long-term contribution to fuel loads. The dead/live ratio, which was accurately predicted by MLS models in our study, is a key indicator of this balance. Fire managers may need to prioritize the removal or treatment of trees with intact fine fuels, as they are more likely to contribute to rapid fire spread compared to trees with dropped fine fuels.
From a fire management perspective, our findings provide actionable insights for selecting LiDAR platforms based on specific operational goals. MLS is recommended for canopy-focused assessments—such as estimating total biomass, canopy base height, and canopy bulk density—especially when working across heterogeneous or large-scale landscapes where model generalization is critical. TLS, while more limited in spatial coverage due to occlusion and fixed-position constraints, may be more cost-effective and suitable for site-specific inventories, particularly when used with enhanced scanning protocols (e.g., multi-position scans).
Operational decisions should weigh cost, accuracy, and logistics. MLS systems offer faster data collection and broader coverage but require higher investment and technical expertise. TLS is less expensive and simpler to deploy but may demand more time in the field and produce lower model transferability. A hybrid strategy may be most effective: using MLS for regional fuel mapping and TLS for targeted verification or detailed analysis in priority zones.
Finally, the limited transferability of fine fuel predictions suggests that LiDAR alone may be insufficient for accurate surface fuel assessment in all contexts. Fire managers should consider integrating ecological covariates or complementary field sampling methods when surface fuel characterization is critical to decision-making.
4.4. Limitations and Future Directions
Despite the valuable insights gained from this comparative analysis, several limitations must be acknowledged. First, seasonal variation in vegetation structure, such as changes in leaf phenology, moisture content, or herbaceous layer density, may have affected LiDAR returns, particularly in surface and understory layers. Our data were collected within a limited seasonal window, but phenological stage can influence occlusion, reflectance, and biomass estimates, especially in deciduous or mixed systems.
Second, understory vegetation likely contributed to occlusion effects, especially for TLS, which relies on a single fixed scan position. Dense shrubs and grasses can obscure lower fuel layers and affect the accuracy of structural metrics derived. While MLS partially overcomes this with dynamic scanning paths, both systems remain limited in capturing fully occluded or low-contrast vegetation elements.
Third, both MLS and TLS struggled to accurately characterize fine surface fuels (e.g., litter, duff, herbaceous biomass), which are challenging to detect due to their small size, proximity to the ground, and low point cloud contrast. This limitation restricts the use of ground-based LiDAR alone for complete fuel profiling, suggesting a need for complementary data sources or enhanced scanning protocols.
Future work should explore seasonal data acquisition, flexible TLS configurations, and integration with multispectral or hyperspectral data to improve fuel detection across strata and fuel types.
5. Conclusions
In conclusion, this study highlights the effectiveness of both TLS and MLS in estimating plot-level fuel loads across different vegetation strata, offering valuable guidance for selecting LiDAR metrics in predictive modeling. Our findings show that MLS consistently outperformed TLS, particularly for canopy-related attributes, due to its ability to capture structural information from multiple angles as it moves through the plot.
However, the TLS system used here relied on a single-scan setup, which, while operationally efficient and cost-effective, introduced significant occlusion, especially in complex or dense vegetation. This limited its ability to accurately detect fuels in lower strata and contributed to its overall lower performance. Still, TLS demonstrated potential as a practical tool, particularly for users with limited budgets or those seeking simpler field protocols.
With the adoption of multi-scan TLS strategies, which help reduce occlusion and improve structural detail, the predictive capacity of TLS could be substantially enhanced, though this comes at the cost of greater field effort and processing complexity. For forest managers and practitioners, TLS remains a viable option, especially when workflows are adapted to balance efficiency and data quality.
Ultimately, by recognizing the trade-offs between mobility, coverage, and resolution across LiDAR platforms, future studies can build on these findings to refine data collection strategies, improve model performance, and strengthen the role of LiDAR in fire ecology and forest management.
