Article

Dynamic Evolution and Triggering Mechanisms of the Simutasi Peak Avalanche in the Chinese Tianshan Mountains: A Multi-Source Data Fusion Approach

1
College of Civil Engineering and Architecture, Xinjiang University, Urumqi 830046, China
2
Xinjiang Key Laboratory for Safety and Health of Transportation Infrastructure in Alpine and High-Altitude Mountainous Areas, Urumqi 830006, China
3
Xinjiang Transport Planning Survey and Design Institute Co., Ltd., Urumqi 830006, China
4
Xinjiang Uygur Autonomous Region Traffic Construction Administration, Urumqi 830049, China
*
Author to whom correspondence should be addressed.
Remote Sens. 2025, 17(16), 2755; https://doi.org/10.3390/rs17162755
Submission received: 14 July 2025 / Revised: 6 August 2025 / Accepted: 7 August 2025 / Published: 8 August 2025

Abstract

Avalanches occur frequently in mountainous areas and pose significant threats to roads and infrastructure. Clarifying how terrain conditions influence avalanche initiation and movement is critical to improving hazard assessment and response strategies. This study focused on a wet-snow slab avalanche that occurred on 26 March 2024, in the Simutas region of the northern Tianshan Mountains, Xinjiang, China. The authors combined remote sensing imagery, high-resolution meteorological station observations, field investigations, and numerical simulations (RAMMS::Avalanche) to analyze the avalanche initiation mechanism, dynamic behavior, and path recurrence characteristics. Results indicated that persistent heavy snowfall, rapid warming, and substantial daily temperature fluctuations triggered this avalanche. The predominant southeasterly (SE) winds and the northwest-facing (NW) shaded slopes created favorable leeward snow deposition conditions, increasing snowpack instability. High-resolution meteorological observations provided detailed wind, temperature, and precipitation data near the avalanche release zone, clearly capturing snowpack evolution and meteorological conditions before avalanche initiation. Numerical simulations showed a maximum avalanche flow velocity of 19.22 m/s, maximum flow depth of 12.42 m, and peak dynamic pressure of 129.3 kPa. The simulated avalanche deposition area and depth closely matched field observations. Multi-temporal remote sensing images indicated that avalanche paths in this area remained spatially consistent over time, with recurrence intervals of approximately 2–3 years. The findings highlight the combined role of local meteorological processes and terrain factors in controlling avalanche initiation and dynamics. This research confirmed the effectiveness of integrating remote sensing data, high-resolution meteorological observations, and dynamic modeling, providing scientific evidence for avalanche risk assessment and disaster mitigation in mountain regions.

1. Introduction

Avalanches are typical geological hazards occurring frequently in mountainous regions, posing significant threats to human safety and transportation infrastructure [1,2,3,4]. Among various avalanche types, slab avalanches generally exhibit greater destructive potential. These avalanches typically initiate from structural failures within weak snowpack layers, driven by complex interactions between local meteorological conditions and terrain characteristics [5,6,7]. Identifying critical factors influencing slab avalanche initiation and understanding their dynamic processes and deposition patterns is essential for improving early warning capabilities and risk assessments in mountainous areas.
Significant advances have been made in avalanche research, particularly in remote sensing identification, meteorological diagnostics, and dynamic modeling [8,9,10,11,12]. High-resolution satellite imagery and unmanned aerial vehicle (UAV) data are widely applied to determine avalanche extents and analyze their historical evolution [12,13,14]. Statistical analyses based on meteorological and terrain factors currently provide an essential foundation for regional avalanche hazard assessments [15,16,17]. Additionally, physically based numerical models such as RAMMS demonstrate robust capabilities for simulating avalanche dynamics [18,19]. However, existing studies typically adopted isolated approaches, wherein remote sensing analysis, meteorological assessments, and dynamic modeling were conducted independently. Few studies, particularly in the Tianshan region, have systematically integrated timely field investigations, high-resolution meteorological observations, high-accuracy UAV-derived digital elevation models (DEMs), and remote sensing data into a unified analytical framework to comprehensively characterize avalanche initiation mechanisms, dynamic evolution, and deposition processes, supported by rigorous spatial quantitative validation. Thus, developing an integrated analytical approach combining remote sensing, field measurements, and dynamic modeling not only strengthens the robustness and physical consistency of simulation results but also enhances their practical interpretability. Such an approach can provide important scientific support for precise avalanche risk assessment and effective disaster management in high-risk mountain areas.
The northern Tianshan region in Xinjiang, China, is characterized by rugged terrain, dense gullies, and abundant snowfall, making it particularly susceptible to avalanche hazards [20,21,22]. As a result, repeated large-scale avalanche events in this area have posed persistent threats to transportation corridors and critical infrastructure [23,24]. This study focused on a typical wet-snow slab avalanche event that occurred on 26 March 2024, in the Simutas area. This event featured typical triggering conditions, including suitable slope angles, significant leeward snow deposition driven by prevailing southeasterly winds coupled with northwest-facing shaded slopes, and meteorological factors characterized by rapid temperature rise following heavy snowfall. Moreover, the avalanche deposition path closely overlapped with historical avalanche trajectories, emphasizing the spatial stability and recurrence of avalanche paths. Therefore, this event provided an important case study for comprehensively examining avalanche triggering mechanisms, path stability, and recurrence patterns under complex meteorological and topographic interactions.
This study integrated multi-source data and analytical methods, including remote sensing interpretation, field investigations, high spatiotemporal resolution meteorological observations, high-precision UAV-derived digital elevation models (DEMs), and RAMMS::Avalanche dynamic simulations, to systematically investigate the triggering conditions, evolution processes, and path stability of the avalanche event occurring in Simutas area in March 2024. First, satellite imagery, UAV aerial photography, and field surveys were combined to accurately identify avalanche release and deposition zones, and these results were further analyzed with data from multiple automated weather stations to reveal meteorological driving mechanisms. Subsequently, a high-resolution DEM derived from UAV imagery was used to extract key terrain parameters such as slope angle and aspect. The RAMMS model was then applied to quantitatively simulate the avalanche’s velocity, flow height, and dynamic pressure distributions. Finally, simulation results were validated against field measurements and historical avalanche paths derived from satellite imagery to examine path recurrence and terrain dependency. This integrated analytical approach, encompassing “remote sensing identification–meteorological and terrain diagnostics–dynamic modeling–field verification,” provides scientific insights and methodological support for quantitative avalanche hazard analysis and risk assessment in mountainous regions characterized by complex terrain. Furthermore, by advancing the methodological framework for avalanche process reconstruction, this approach offers actionable insights applicable to transportation corridor risk management and facilitates the development of early-warning strategies in high-risk alpine environments.

2. Study Area and Field Investigation

2.1. Study Area

The study area is located in the Simutasi Peak region of the northern Tianshan Mountains in western Xinjiang, China (Figure 1). Simutasi Peak is situated at 44°30′48″N, 80°42′02″E, with an elevation of 2882 m above sea level. The study area lies within the Central Asian fold belt, characterized by rugged topography and steep relief. The regional climate is primarily influenced by mid-latitude westerlies and orographic uplift, which result in significant snowfall, especially on northwest-facing slopes and in alpine valleys. The snow season typically lasts from October to April, with an annual snow water equivalent reaching up to 600 mm, representing a typical cold and dry continental snow climate.
The northern Tianshan Mountains are among the most avalanche-prone regions in China. During the spring warming period (March–April), wet slab avalanches and wet loose avalanches frequently occur. The study area exemplifies a typical continental alpine avalanche terrain, providing an ideal setting for investigating avalanche dynamics and triggering mechanisms. Several automatic weather stations have been deployed in the area, and high-resolution remote sensing imagery is available to support environmental monitoring and avalanche process reconstruction.

2.2. Field Investigation

An avalanche occurred on 26 March 2024, in the study area. Field investigations commenced the following day, with multiple surveys conducted between 27 March and 15 April 2024. The primary objectives were to delineate the avalanche trajectory, measure snowpack physical properties, and characterize avalanche deposit parameters, thereby providing critical data for dynamic modeling and validation. The methods employed included unmanned aerial vehicle (UAV) surveys, visual interpretation, and in situ snowpack measurements.
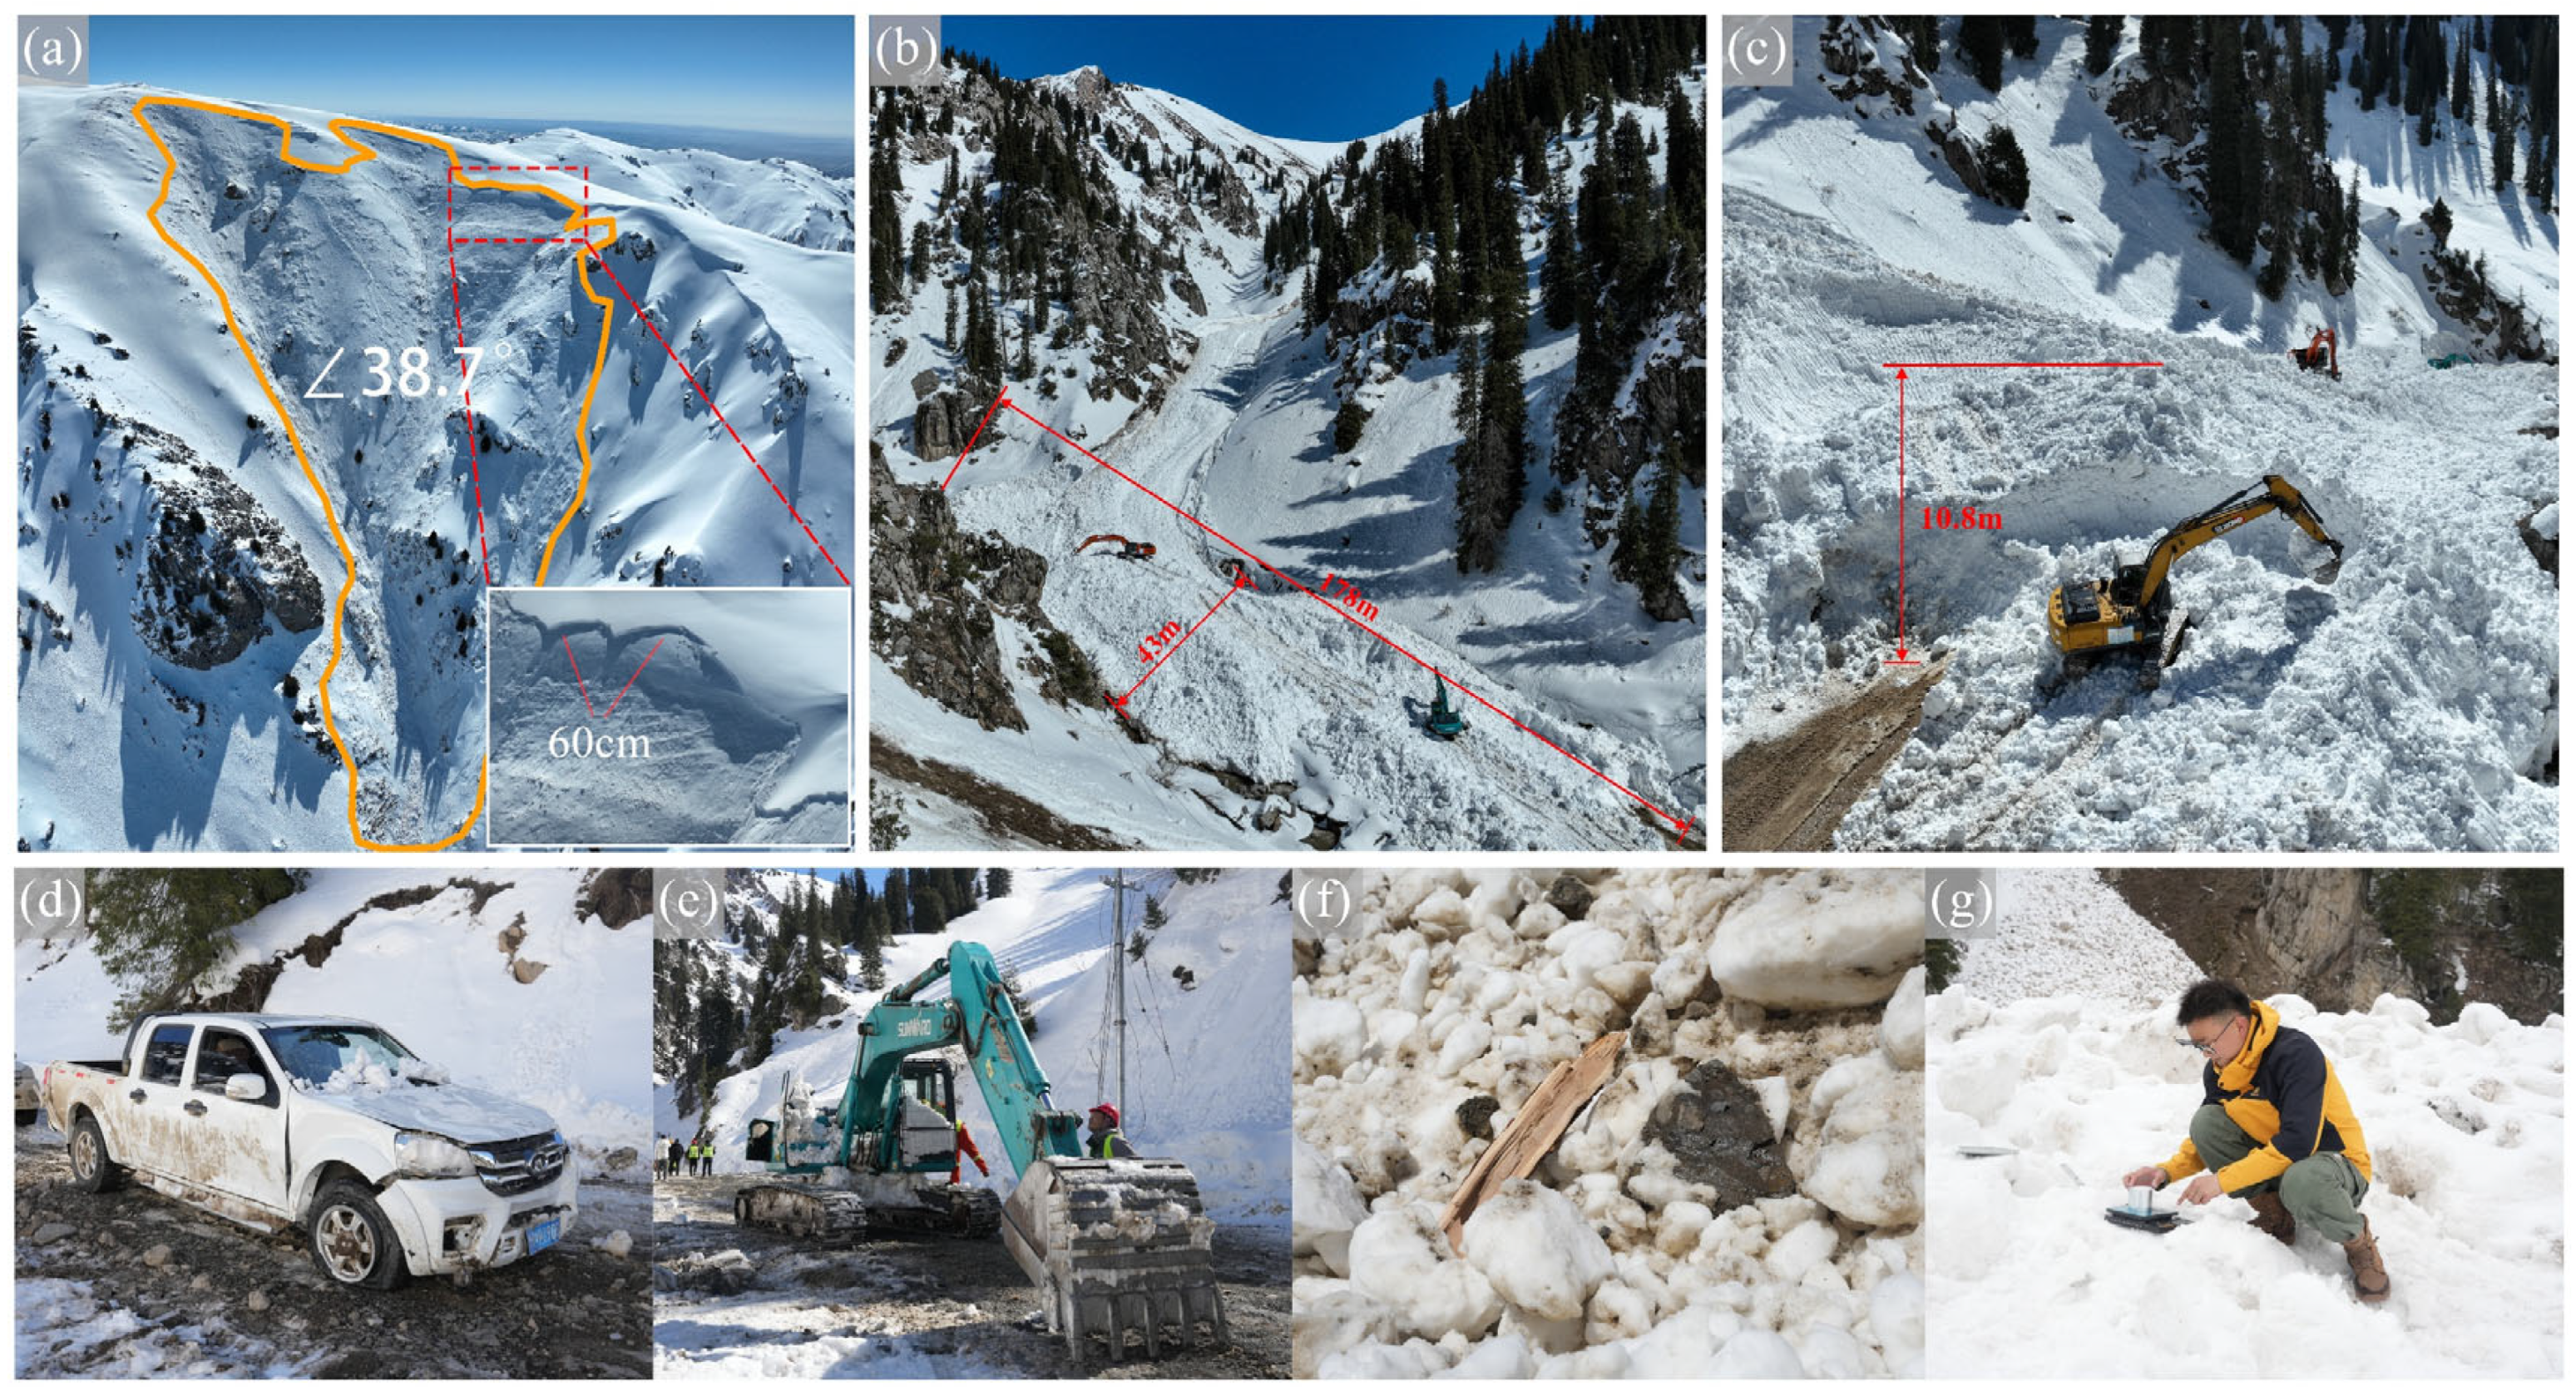
The avalanche release area was delineated using UAV imagery, acquired the day following the event. This timely survey allowed for the precise identification of the release zone, with an average crown depth of approximately 60 cm and an average slope angle of 38.7° (Figure 2a), highlighting the advantage of capturing detailed data shortly after the avalanche. The deposition zone was approximately 178 m long and 43 m wide (Figure 2b), with a maximum deposit thickness exceeding 10.8 m (Figure 2c). Two construction vehicles were found buried beneath avalanche debris, resulting in injuries to four individuals (Figure 2d,e), indicating the substantial scale and severity of the event. Numerous tree fragments and rocks were observed within the deposits (Figure 2f), suggesting considerable material entrainment during avalanche propagation. Snow samples collected during field surveys were analyzed for density, grain size distribution, and moisture content (Figure 2g), providing essential parameters for model calibration and avalanche classification.

3. Materials and Methods

This study integrates multiple data sources to analyze the avalanche event that occurred on 26 March 2024, at Sımutasi Peak. The dataset comprises automatic weather station observations, satellite and UAV imagery, and field investigation records. A temporally and spatially coherent data framework was established to capture key pre- and post-event conditions and to support dynamic modeling and process interpretation.

3.1. Data

3.1.1. Meteorological Data

To monitor snowpack evolution and assess meteorological triggers for avalanche events, five automatic weather stations (AWS; Beijing Huayi Ruike Technology Co., Ltd., Beijing, China) were installed in October 2023 at various locations across the study area. Since installation, these stations have continuously recorded wind speed, wind direction, air temperature, relative humidity, snow depth, and precipitation type and amount at 10 min intervals. All observations were synchronized to Beijing Standard Time (UTC+8).
Meteorological conditions in mountainous areas exhibit significant spatial heterogeneity due to the complex effects of terrain. Stations located at varying distances or elevations often fail to fully represent the local meteorological characteristics. This spatial variability is particularly evident in snow depth, which is substantially influenced by local slope, aspect, and wind patterns. Consequently, our AWS network was strategically distributed across diverse terrain types, including ridge tops, mid-slopes, and valley bottoms, with elevations ranging from 2014 m to 2901 m, to effectively capture regional snow dynamics.
For the avalanche event on 26 March 2024, we further evaluated the horizontal distances and elevation differences between each weather station and the avalanche release area. Although AWS-4 was located approximately 8.7 km horizontally from the avalanche release point, it had the smallest elevation difference (~11 m), making it the most representative station for this analysis. Despite the greater horizontal distance, AWS-4’s minimal elevation difference rendered its meteorological data more representative of the release zone conditions than those of AWS-3, which is situated closer horizontally (~2.3 km) but with a substantially larger elevation difference (~445 m). Nevertheless, we acknowledge that localized wind effects in complex mountainous terrain could still introduce uncertainties to the representativeness of AWS-4 data. AWS-3 served as a secondary reference station, and data from the remaining stations were used to provide supplementary validation, ensuring the robustness of the meteorological analysis.
All meteorological data underwent standardized quality control procedures, including numerical range checks, spike filtering, and temporal consistency analysis. Missing data, which accounted for less than 3% of observations, were interpolated using time-weighted linear methods. The detailed coordinates, elevations, and spatial relationships between each AWS and the avalanche release zone are provided in Table 1.

3.1.2. Satellite and UAV Data Sources

Due to the high frequency and short recurrence interval of avalanche activity in the study area, multi-source remote sensing imagery was employed to support snow cover analysis and spatial reconstruction of the 2024 avalanche event. The dataset includes high-resolution optical satellite images from Gaofen-1 (GF-1), Jilin-1, and GE01, covering multiple winter seasons. These data were utilized to analyze historical avalanche trajectories and seasonal snow cover evolution.
Imagery, acquired on 2 March 2024, was used to characterize pre-avalanche snow cover, and a UAV-based low-altitude aerial survey was conducted on 27 March 2024, to capture ultra-high-resolution optical images of the avalanche release, track, and run-out zones. The UAV imagery also contributed to the creation of a high-resolution DEM, as detailed in Section 3.2.1. A summary of the satellite platforms, spatial resolution, acquisition dates, and data sources is provided in Table 2.

3.2. Methods

3.2.1. UAV Image Processing and High-Resolution DEM Generation

To acquire high-precision terrain data of the study area, a DJI Mavic 3E multi-rotor UAV (SZ DJI Technology Co., Ltd., Shenzhen, China) equipped with a high-resolution RGB camera was employed. The flight altitude was set to 150 m above ground level, with 80% forward and 70% side overlap. Multiple flight paths were mosaicked to ensure complete coverage of the avalanche track and upstream snow accumulation zones. In areas with complex topography, terrain-following mode was used to maintain consistent ground resolution and improve model accuracy. The aerial survey was conducted on 10 April 2024, under clear weather conditions and wind speeds below 5 m/s. A total of over 800 images were captured, which were sufficient for dense point cloud reconstruction and the generation of a sub-meter resolution DEM.
The imagery was processed in Agisoft Metashape (version 2.2.0; Agisoft LLC, St. Petersburg, Russia) using Structure-from-Motion (SfM) photogrammetry and dense point cloud reconstruction. To ensure geometric accuracy, a set of Ground Control Points (GCPs) and independent Checkpoints were established using GNSS-RTK surveying, achieving horizontal and vertical accuracy better than ±5 cm. With RTK-constrained adjustment, a DEM at 0.2 m spatial resolution and a corresponding orthomosaic (DOM) were generated. This high-precision terrain dataset serves as a fundamental input for avalanche path mapping and RAMMS::Avalanche dynamic simulation.

3.2.2. Dynamics Modeling

This study utilizes the RAMMS::Avalanche model (version 1.8.27; WSL Institute for Snow and Avalanche Research SLF, Davos, Switzerland) to perform dynamic numerical simulations of the snow avalanche event that occurred in the study area in March 2024. Developed by the WSL Institute for Snow and Avalanche Research SLF, RAMMS is a snow avalanche simulation tool widely used to predict avalanche paths, deposition zones, and impact pressures.
The RAMMS::Avalanche model is based on the two-parameter Voellmy–Salm–Gruber friction law, which divides basal resistance into two components: a dry Coulomb friction term, proportional to the normal stress N and governed by the friction coefficient μ, and a velocity-squared turbulent drag term characterized by the turbulence coefficient ξ, which accounts for energy dissipation during high-speed flow. To account for the cohesive strength of snow, the model incorporates a yield stress parameter N0, analogous to the yield criterion of ideal plastic materials. Additionally, the normal stress term, N, is modified to include centrifugal forces induced by terrain curvature, thereby enhancing the model’s ability to simulate avalanche dynamics under complex topographic conditions.
The frictional resistance is described by the following equation:
S = μ N + ρ g u 2 ξ + ( 1 μ ) N 0 ( 1 μ ) N 0 e N N 0
where S is the total frictional resistance (Pa); μ is the dry friction coefficient; ρ is the snow density (kg/m3); g is the gravitational acceleration (m/s2); u is the flow velocity (m/s); ξ is the turbulence coefficient; N is the normal stress (Pa); and N0 is the yield stress (Pa), representing the internal cohesion of snow.
The simulation process involves three main steps: input data preprocessing, model parameter configuration, and output of simulation results. The previously mentioned high-resolution DEM is used as the terrain basis for the computational domain. Based on field survey data, the location, area, and average snow depth of the release zone are identified to define the initial release volume. Subsequently, a set of friction parameters appropriate for wet snow avalanches is selected (Table 3). The RAMMS model parameters listed in Table 3 were determined based on initial field measurements (snow density, depth), recommendations from the RAMMS user manual, literature references for similar wet-snow avalanche events, and further calibrated against field-observed deposition extent and depth to ensure accurate representation of avalanche dynamics.

4. Results

4.1. Meteorological and Terrain Factors Governing Avalanche Initiation

Meteorological and terrain factors are critical drivers of avalanche occurrence. Specific climatic conditions and topographic features play a decisive role in avalanche initiation. This section analyzes the influence of precipitation, temperature, wind speed, and direction, as well as slope angle and aspect, on avalanche dynamics.

4.1.1. Meteorological Factors

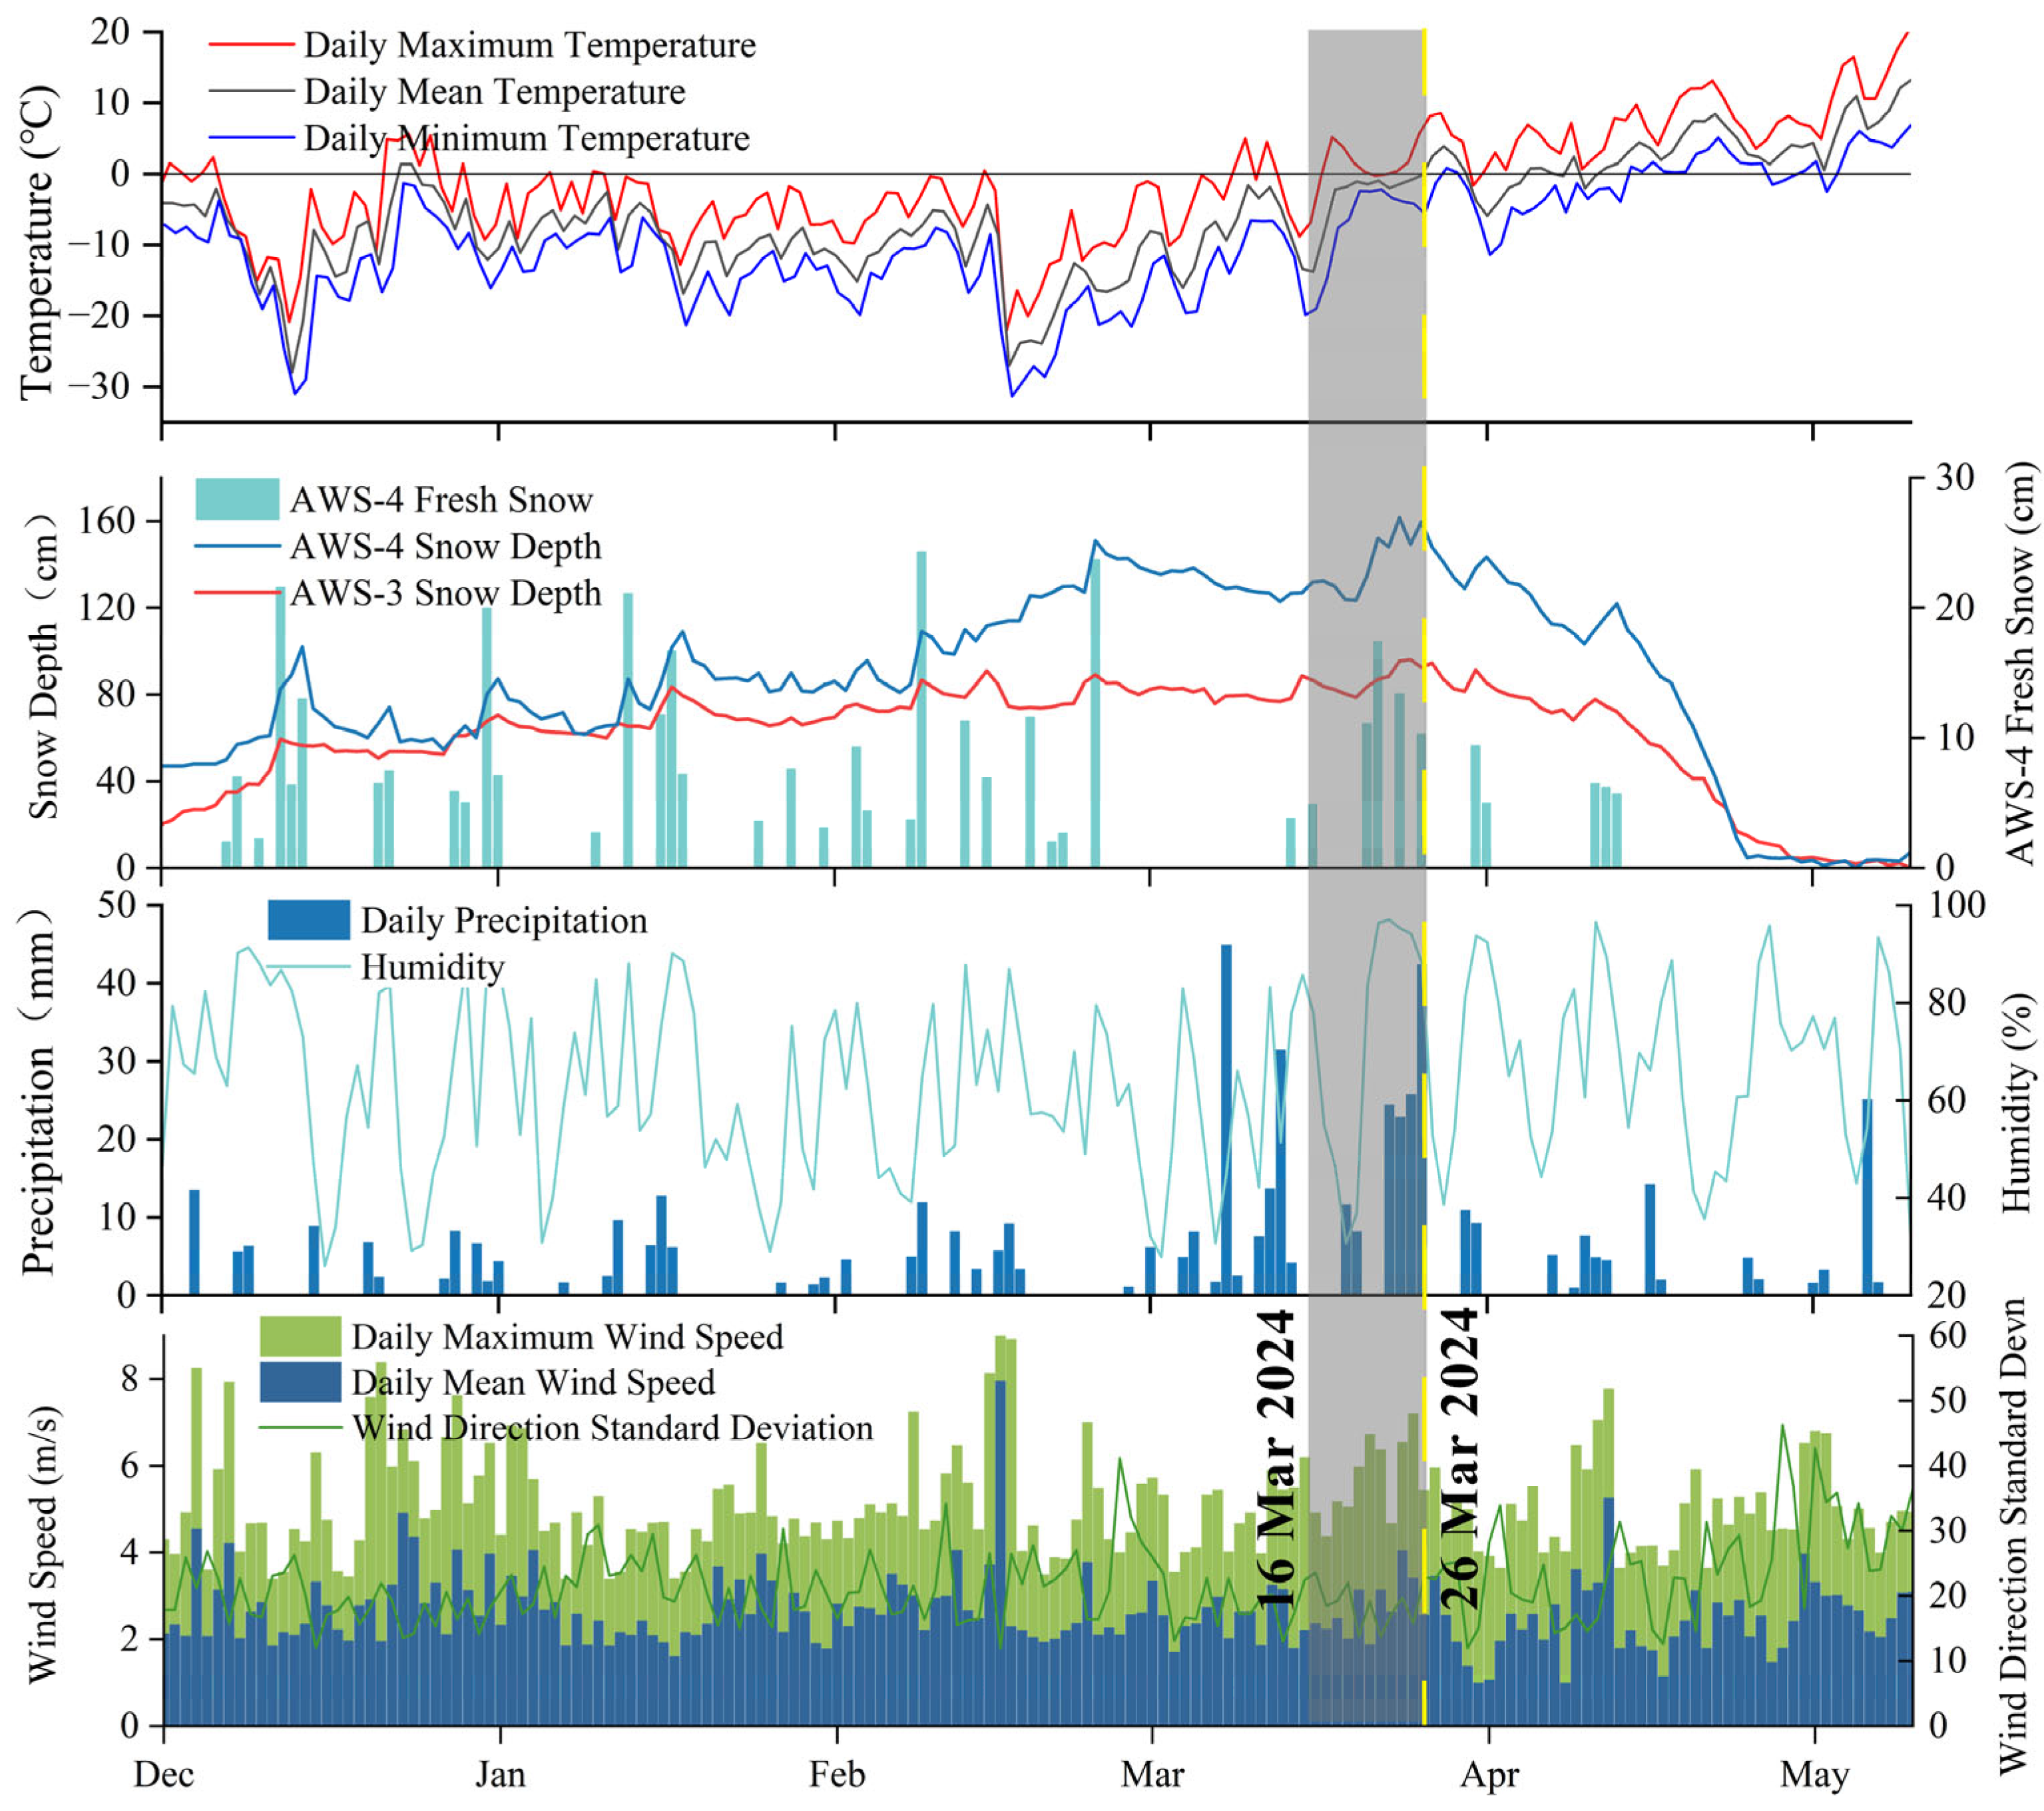
To analyze the triggering conditions of the avalanche event on 26 March 2024, meteorological time-series data recorded by AWS-4 and AWS-3 from December 2023 to May 2024 were examined. The analysis focused on critical meteorological parameters, including air temperature, precipitation (snowfall and rainfall), relative humidity, wind speed, wind direction, and snow depth (Figure 3). These parameters are crucial for revealing snowpack evolution processes and potential triggering mechanisms. Meteorological data indicate that the snow season in the study area generally begins in early October and continues until late April of the following year, which aligns with snow cover analysis results based on remote sensing data described in Section 4.2. Snow accumulation occurred progressively in early winter, reaching a maximum depth of approximately 120 cm by late February. Subsequently, snow depth gradually decreased due to persistent warming, forming an unstable snowpack structure leading up to the avalanche event.
The critical period preceding the avalanche event (16–25 March 2024) is marked by shaded areas in Figure 3. Temperature variations during this period indicate a pronounced warming process. On 16 March, the diurnal temperature variation reached 12 °C (maximum temperature −9 °C), followed by a continuous increase in temperature, with the daily maximum temperature rising to 6 °C by 19 March, corresponding to an average warming rate of 3.75 °C/day. Between 20 and 23 March, daily temperature fluctuations narrowed to less than 2 °C, and temperatures briefly stabilized around 0 °C. However, temperatures rose sharply again after 23 March, and by 26 March, the diurnal variation increased to 15 °C (maximum temperature 9 °C, minimum temperature −6 °C). The warming rate during this latter period was similar to the previous one, and the daily mean temperature exceeded 0 °C for the first time, indicating substantial thermal disturbances within the snowpack approaching structural instability thresholds. Large diurnal temperature variations combined with rapid warming intensified temperature gradients within the snowpack, facilitating freeze–thaw interfaces near the surface and promoting the formation of structurally weak layers, such as depth hoar, resulting from vapor recrystallization at greater depths. These weak layers significantly reduced the overall mechanical stability of the snowpack and increased the risk of potential sliding surfaces.
Significant precipitation changes were also observed. Snowfall occurred from 20 March, intensifying to moderate-to-heavy snowfall from 23 to 26 March, with cumulative weekly precipitation (snow-water equivalent) reaching 132 mm. Correspondingly, AWS-4 recorded an increase in snow depth of approximately 20 cm, while AWS-3 showed an increase of around 10 cm. Although total precipitation intensity was considerable, snow accumulation at specific sites might have been underestimated due to wind redistribution effects. Wind speed analysis indicated an average wind speed of approximately 4 m/s during this period, with a maximum wind speed reaching 7 m/s. The small standard deviation in wind direction demonstrated a stable and dominant regional wind field, likely resulting in localized snowdrift accumulations on leeward slopes, further exacerbating snowpack instability.
In summary, this avalanche event was closely related to the combined effects of multiple meteorological factors. Preceding heavy snowfall rapidly increased snowpack depth, laying the foundation for unstable snowpack structures. Subsequent sustained warming facilitated rapid heating and intensified thermal disturbances within shallow snow layers, significantly weakening snowpack structures. Additionally, substantial diurnal temperature variations coupled with high moisture conditions promoted surface melt-freeze cycling and deep-layer depth hoar development, further reducing snowpack stability. Moreover, persistent, moderate-to-high wind speeds during this period not only triggered snowdrift accumulation effects, creating heterogeneous snow thicknesses on specific slopes but also disturbed snowpack structures, enhancing localized stress concentrations. Ultimately, under the background of rapid warming on the afternoon of 26 March, combined instability conditions reached a critical threshold, triggering this typical slab avalanche event.

4.1.2. Interaction of Meteorological and Terrain Factors

To evaluate the influence of interactions between wind regimes and terrain characteristics on avalanche formation, wind speed and direction data recorded by four automatic weather stations (AWS-2, AWS-3, AWS-4, and AWS-5) during the snow season (November 2023 to May 2024) were analyzed. These data were combined with slope angle and aspect information derived from the high-resolution DEM, resampled to 2 m resolution. Obtained via UAV imagery as described in Section 3.2.1.
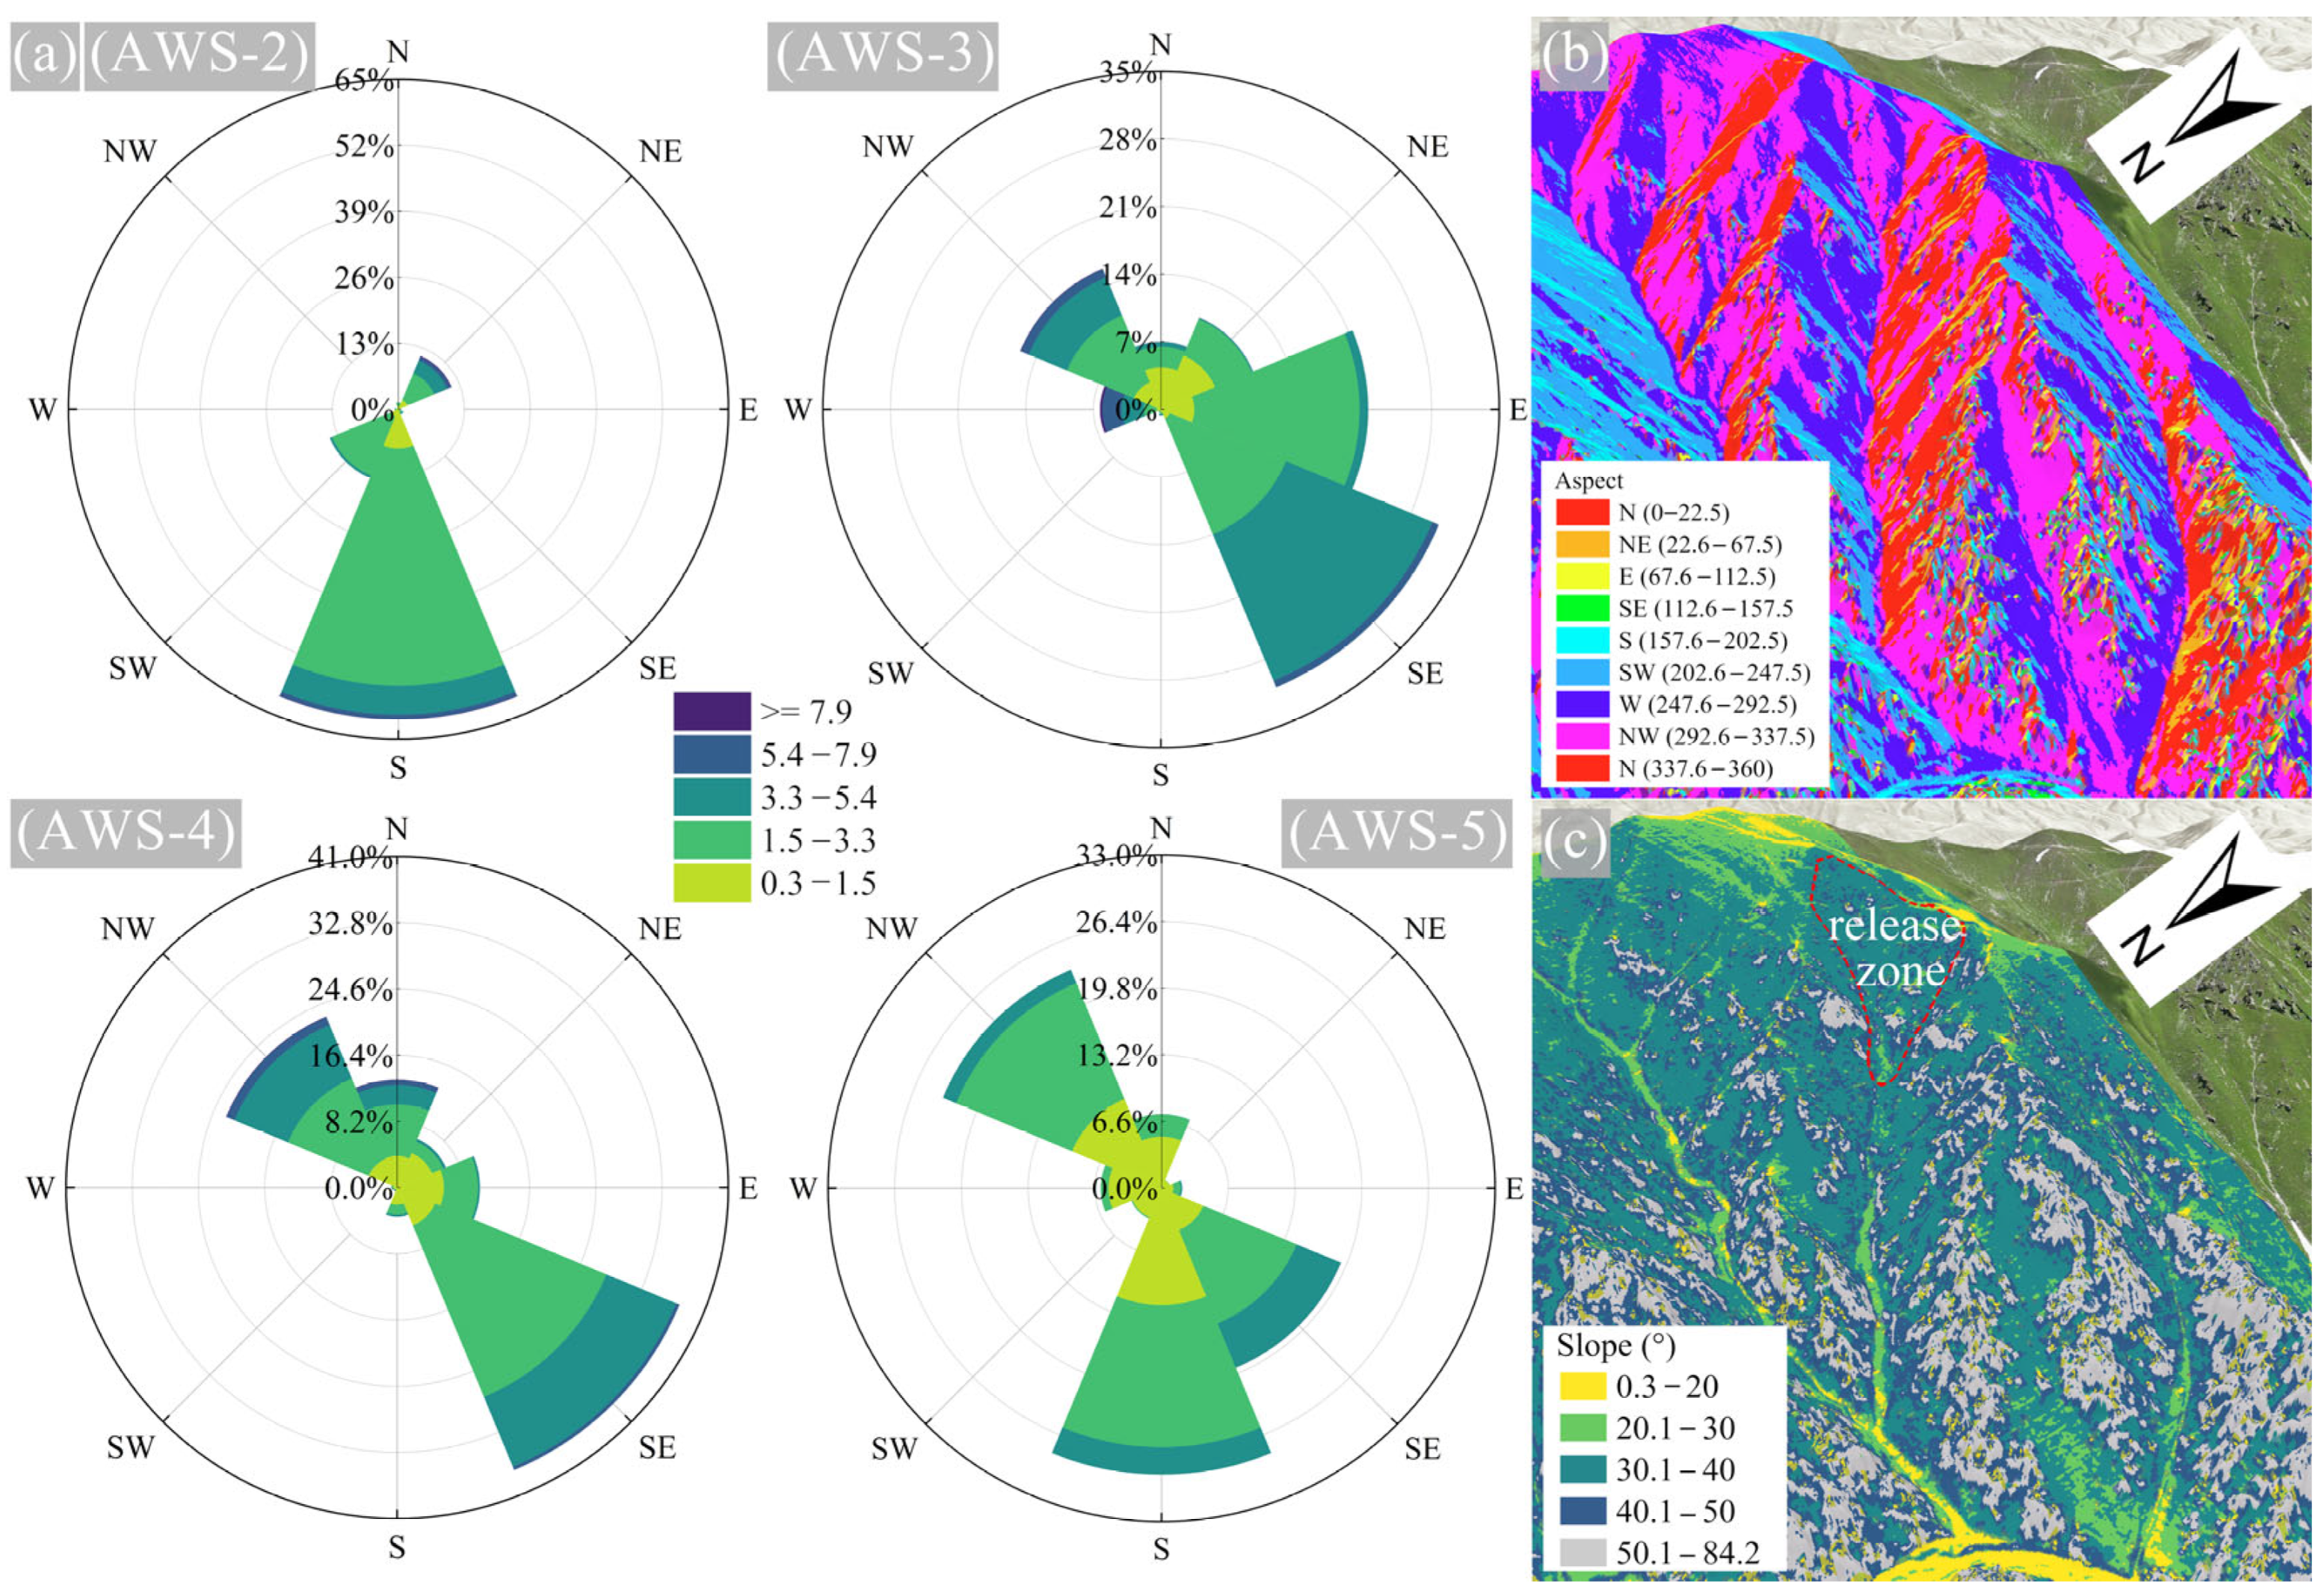
Wind rose analyses (Figure 4a) indicate that southerly (S) and southeasterly (SE) winds dominated the study area, accounting for approximately 30–60% of wind observations across the four AWS sites. AWS-4, situated only 11 m in elevation difference from the avalanche release zone, frequently recorded wind speeds exceeding 5.4 m/s (equivalent to Level 4–5 winds according to China Meteorological Administration standards), predominantly from the southeast direction. Given the minimal elevation difference, AWS-4 wind characteristics effectively represent conditions on the slope of the avalanche initiation area. These prevailing high-speed winds, interacting with local terrain features, significantly enhanced snow particle transport and deposition processes, promoting snowdrift accumulation on the leeward slopes.
Terrain factor analysis showed that the avalanche initiation zone lies immediately below the ridge of Simutasi Peak, primarily oriented to the northwest (NW) (Figure 4b). As clearly indicated in Figure 4a,b, the dominant southeasterly wind direction resulted in pronounced snow accumulation on the northwest-facing slopes, precisely where the avalanche initiated, thus validating the leeward loading mechanism. This slope orientation, combined with the prevailing southeasterly (SE) winds, created ideal conditions for snowdrift accumulation on leeward slopes, resulting in heterogeneous and densely structured wind slabs characterized by weak interlayer bonding. Slope angle data (Figure 4c) revealed that the avalanche initiation area predominantly encompasses slopes ranging from 30° to 40°, a critical slope range where wind-deposited snow layers readily accumulate and approach instability.
In summary, the coupling of dominant wind directions and slope orientations resulted in localized snowdrift accumulation, which, combined with moderate slope angles and complex terrain, facilitated the spatial evolution of unstable snowpack structures, thus providing essential physical conditions for avalanche initiation.

4.2. Remote Sensing-Based Avalanche Identification

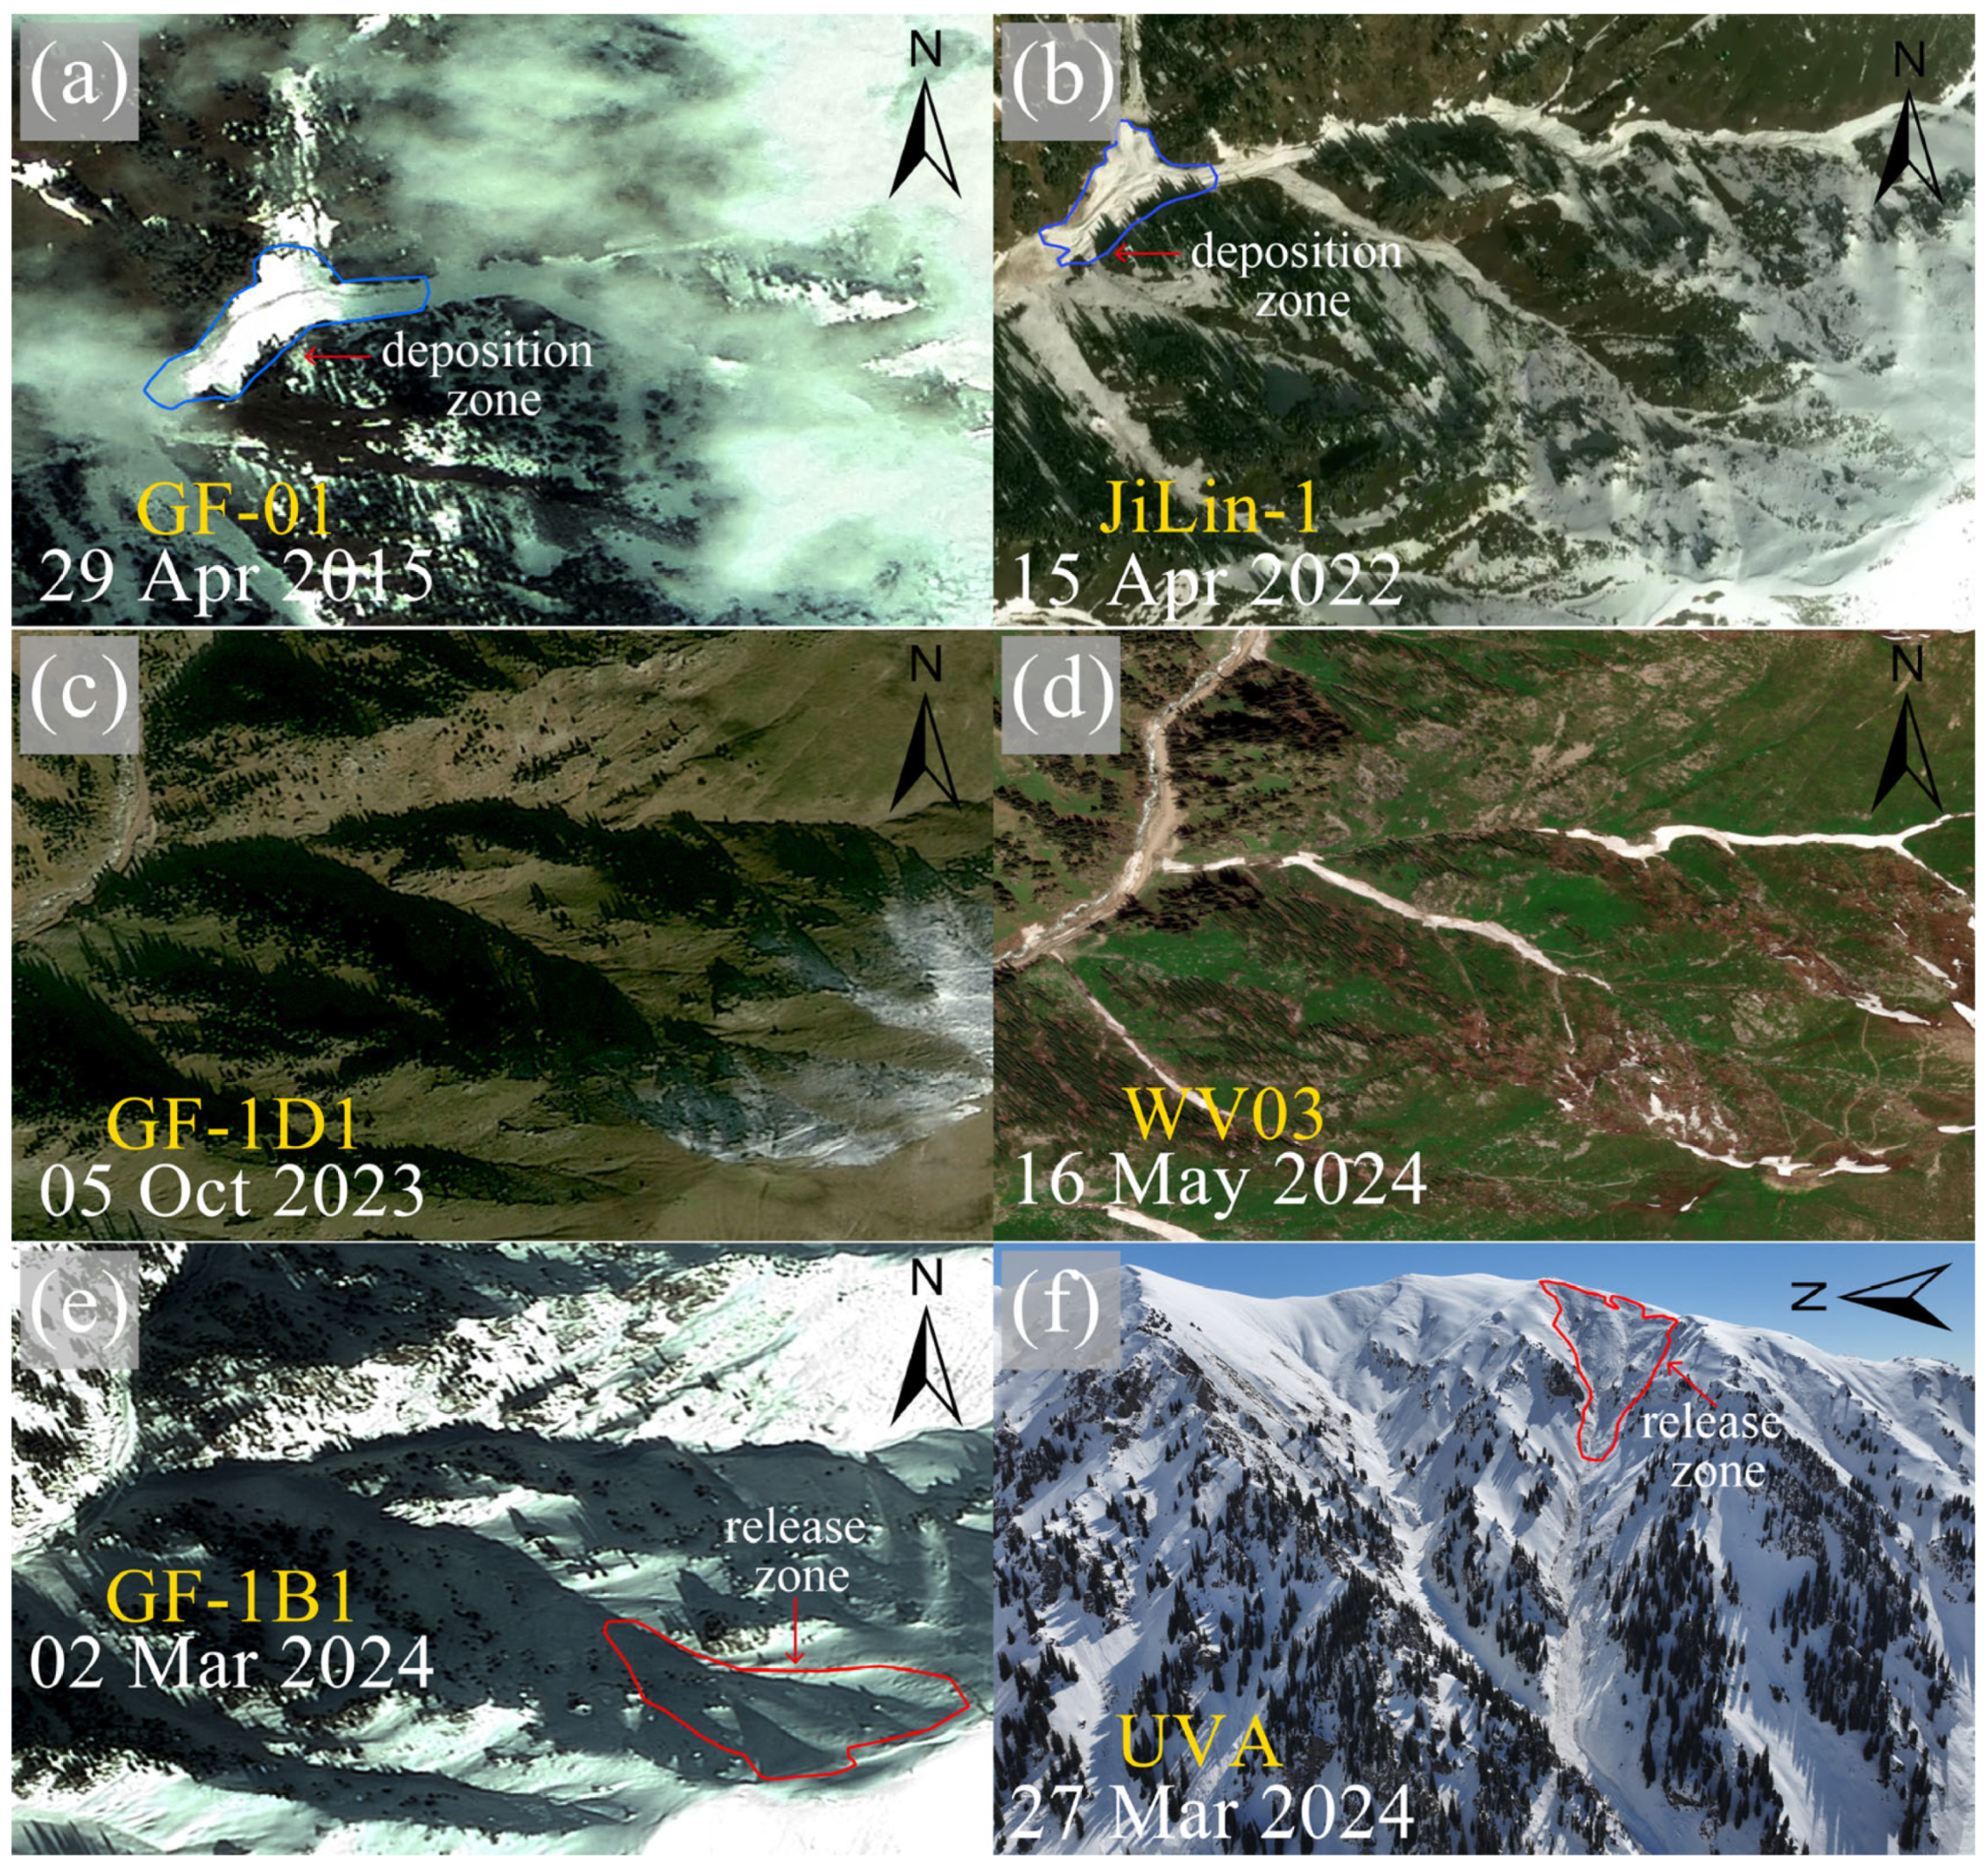
This study integrates multi-source satellite and UAV imagery to identify historical avalanche events, analyze seasonal snow accumulation patterns, and accurately delineate the release and deposition zones of the 26 March 2024, avalanche event. High-resolution satellite images from Gaofen-1 (GF-01) and Jilin-1 captured deposition characteristics of previous avalanche occurrences in the study area (Figure 5a,b), demonstrating that this region frequently experiences avalanche activity. Some historical avalanche tracks significantly overlap with the 2024 event trajectory, highlighting notable recurrence patterns primarily driven by terrain characteristics. Analysis of avalanche activity data from the past decade reveals a typical recurrence interval of approximately 2 to 3 years, underscoring the persistent hazard avalanches pose to transportation infrastructure, including threats to road connectivity, vehicle safety, and pedestrian accessibility. The frequent avalanche occurrence is strongly linked to specific terrain conditions, notably steep slopes and significant wind-induced snow accumulation.
Analysis of satellite imagery from 5 October 2023, and 16 May 2024 (Figure 5c,d), facilitated identification of the onset and end dates of the snow season in the study area. Results indicate that snow cover generally commences in early October and persists through mid-May of the following year, consistent with meteorological observations and seasonal temperature patterns. This temporal alignment supports robust quantitative analysis of snow accumulation processes.
Pre-avalanche satellite imagery from 2 March 2024 (Figure 5e), showed continuous, undisturbed snow cover conditions in the release zone. In contrast, UAV imagery acquired on 27 March 2024, one day after the avalanche (Figure 5f), clearly documented the snow-free release area boundaries, avalanche trajectory, and extent of deposition. These comparative analyses provided critical spatial data essential for detailed avalanche delineation and precise calibration of spatial parameters used in subsequent RAMMS modeling.
Although the current study provides a valuable estimate of avalanche recurrence interval based on multi-temporal satellite imagery, extending this analysis through the incorporation of longer-term optical and SAR satellite archives would enhance temporal reliability. Such an expanded inventory could significantly contribute to improved regional-scale avalanche hazard mapping and risk assessment efforts.

4.3. Numerical Simulation by RAMMS::Avalanche Modeling

The RAMMS::Avalanche model was employed to comprehensively analyze the spatiotemporal evolution of the avalanche event, from initiation and acceleration through main flow dynamics to final deposition. By examining variations in flow velocity, dynamic pressure distribution, and deposition patterns, the simulation elucidated the regulatory influence of terrain conditions on avalanche dynamics and identified the primary evolutionary processes governing avalanche behavior.

4.3.1. Analysis of the Simulation Results

Figure 6 illustrates the spatial distribution of maximum flow velocity (Figure 6a), flow height (Figure 6b), and dynamic pressure (Figure 6c) simulated by the RAMMS::Avalanche model. The avalanche originated on a northwest-facing slope below the ridge and accelerated downslope along a gully. After passing through a narrow flow constriction, the flow underwent two directional changes accompanied by localized deceleration. As the terrain slope gradually decreased, the avalanche front further decelerated and began to deposit, expanding laterally downslope. Ultimately, the avalanche crossed and completely buried the valley road, forming a terrain-controlled deposition pattern.
The simulation results show a maximum flow velocity of 19.22 m/s near point A, corresponding to the main acceleration section. The maximum flow height reached 12.42 m near point D in the deposition zone, indicating substantial snow accumulation. The peak dynamic pressure reached 129.3 kPa and was concentrated in the high-velocity corridor near point A. The spatial distribution of dynamic pressure closely matched that of flow velocity, consistent with the Voellmy–Salm–Gruber rheology implemented in RAMMS, where dynamic pressure is proportional to the square of velocity.
Overall, the simulation reliably reproduced the spatial evolution of the avalanche, providing a quantitative basis for identifying impact zones and deposition areas. The modeled deposition extent and morphology were in good agreement with field observations, including the buried section of the road.
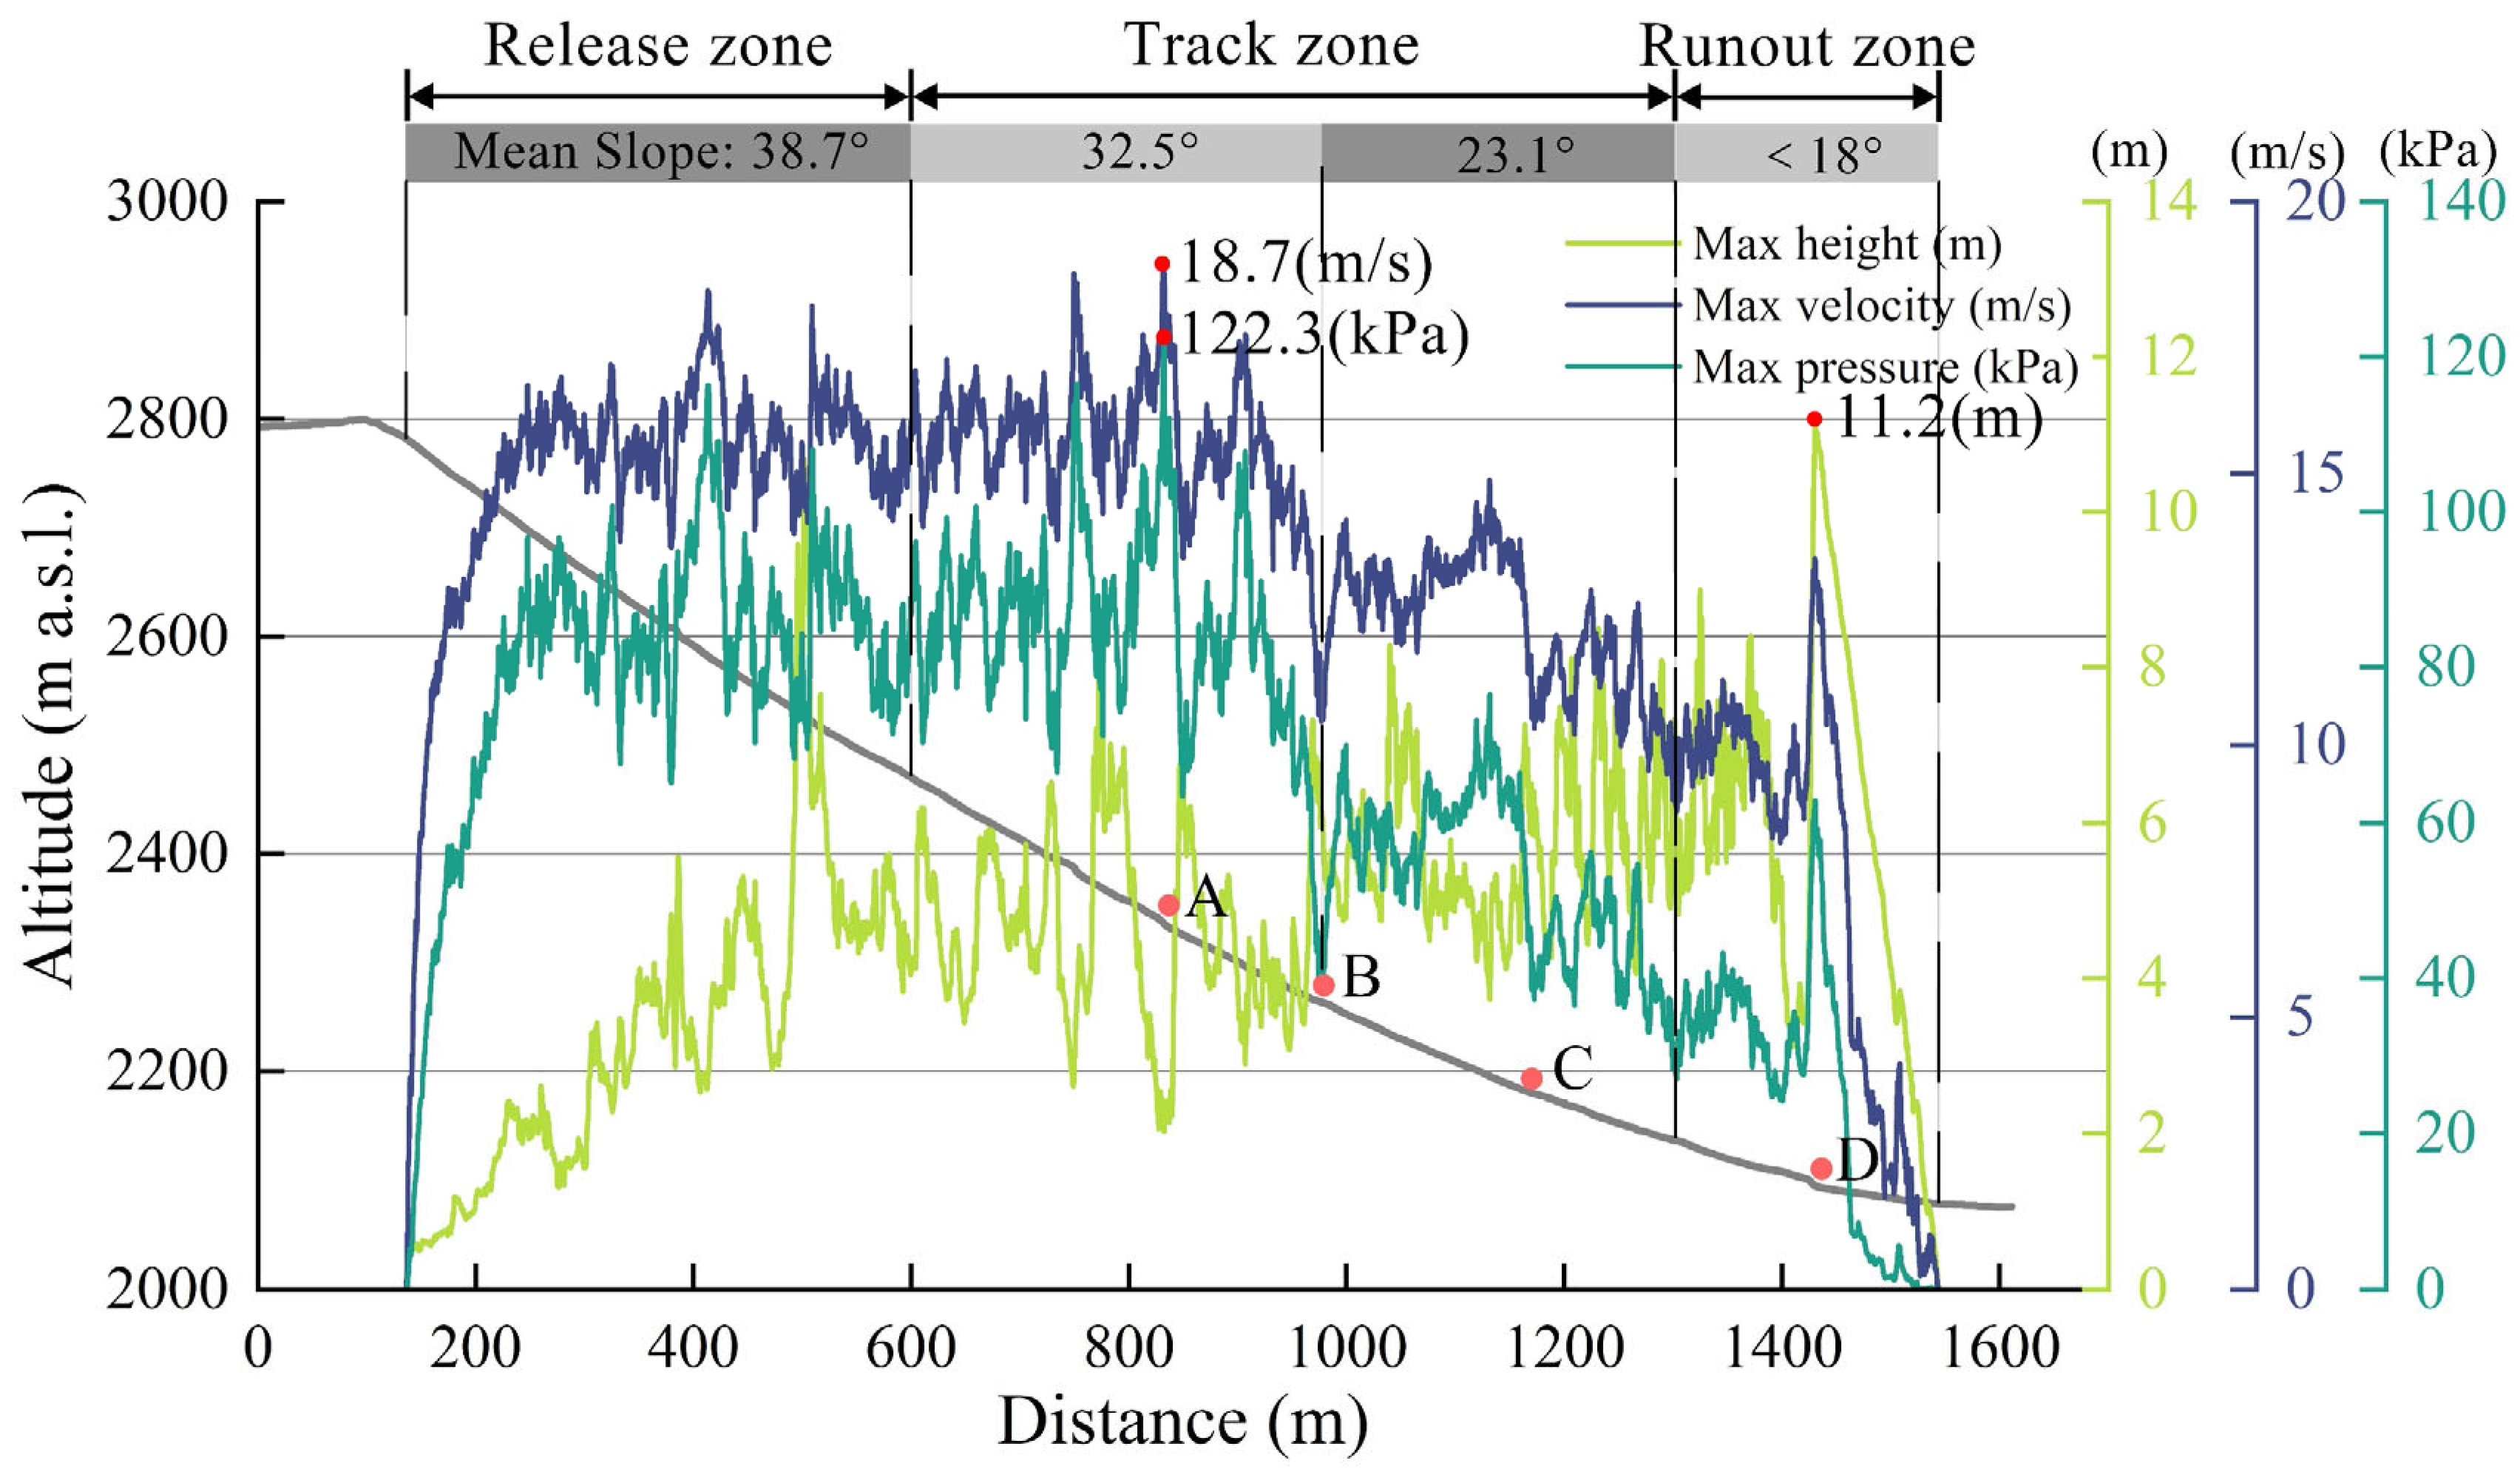
To further characterize dynamic responses along the avalanche path, a longitudinal profile was extracted along the main flowline shown in Figure 6a. Figure 7 presents the variation in maximum flow velocity, flow height, and dynamic pressure along this profile. The flowline spans approximately 1400 m in horizontal distance with a vertical drop of about 700 m, resulting in an average slope of 29.2°. Based on terrain slope and flow characteristics, the profile was divided into three zones: the release zone, the main flow zone, and the deposition zone. The release zone, with an average slope of 38.7°, represents the critical segment for initial instability and acceleration.
The simulation indicates that the snow mass rapidly gained kinetic energy after release, reaching a velocity of 15 m/s early in the path and continuing to accelerate as it concentrated into the main channel. Near point A on the profile, the avalanche attained its peak velocity of 18.7 m/s and a dynamic pressure of 122.3 kPa, representing the highest energy segment of the flow. At point B, the flow encountered a bend in the gully and decelerated to around 10 m/s, accompanied by a drop in dynamic pressure. Upon entering a lower-gradient segment, the velocity briefly increased but then decreased again near point C due to another bend and terrain interference. In the final section of the path, the avalanche entered a deposition transition zone with an average slope of approximately 20°, where velocity gradually decreased. At point D, the gully terminates abruptly above the valley road with a vertical drop of about 4 m. Upon impact, the flow re-accelerated locally, resulting in a sudden increase in flow height to a maximum of 11.2 m and a corresponding rise in dynamic pressure. The snow mass ultimately deposited in the valley road area, forming a termination zone characterized by high thickness and elevated dynamic energy.
It should be noted that slight discrepancies exist between these values (18.7 m/s and 122.3 kPa) and those reported in Figure 6 (19.22 m/s and 129.3 kPa). This is because the values shown in Figure 7 were extracted along a specific 1D longitudinal profile, which do not necessarily capture the maximum values across the full 2D simulation domain.

4.3.2. Time Series Analysis of Avalanche Flow Height and Field Validation

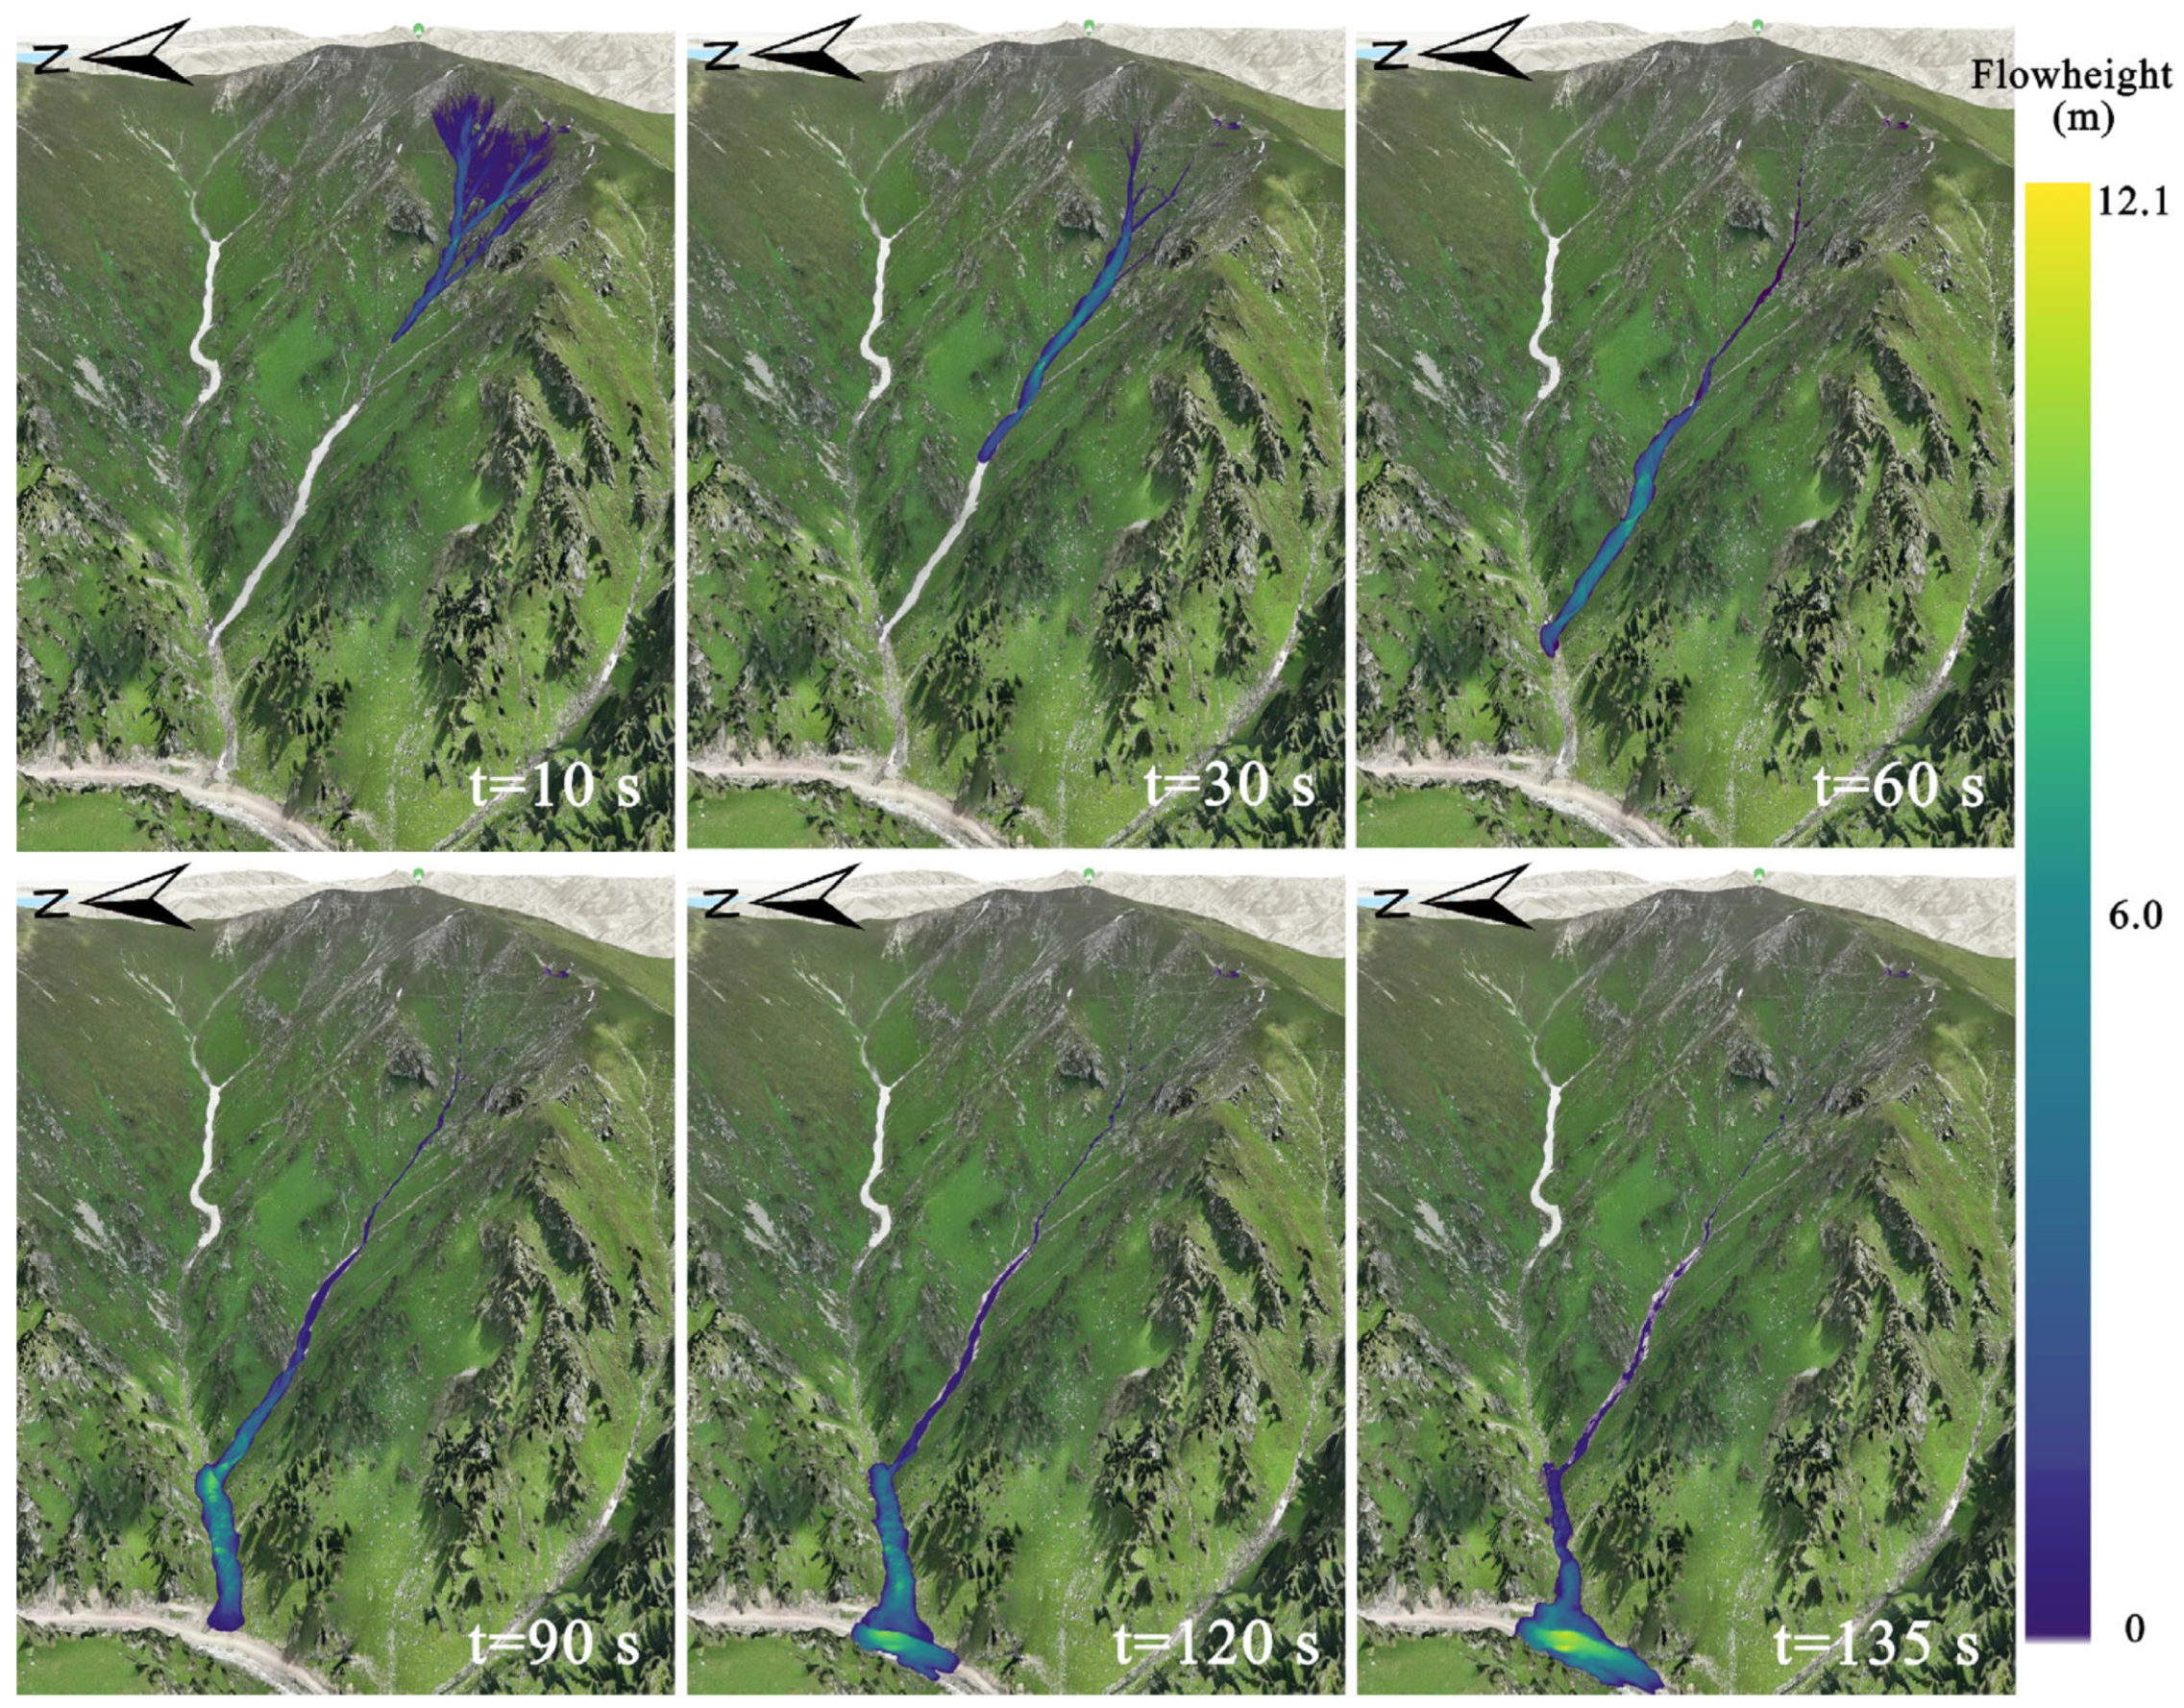
Figure 8 presents the time series of avalanche flow height derived from the RAMMS::Avalanche simulation, covering a total duration of 135 s. The avalanche was initiated at t = 0 s in the release zone, and by t = 10 s, the majority of the snow mass had entered the main flow channel. At t = 30 s, the avalanche reached point B, accelerating over a slope of approximately 30°, advancing roughly 200 m in just 10 s. By t = 60 s, the avalanche arrived at point C, where a gully bend and channel constriction induced local deceleration and partial deposition, resulting in an increase in flow height to approximately 8 m. However, this localized obstruction was insufficient to halt the downslope movement, and the avalanche continued to propagate. At t = 90 s, the avalanche front impacted the valley road at point D and subsequently advanced across to the opposite slope. By t = 135 s, the flow had completely ceased, with deposition covering the valley floor, including road and river sections, forming a classic terrain-controlled avalanche deposit. The simulated deposition height and extent showed strong agreement with field measurements obtained during post-event investigations (see Figure 2b,c), thereby validating the accuracy and reliability of the RAMMS model. Additionally, the spatial extent of the simulated deposits closely overlapped with historical avalanche traces identified in satellite imagery (Figure 5a,b), confirming the spatial recurrence of avalanche paths under similar topographic and meteorological conditions.
Flow height was selected as the primary variable for time-series analysis due to its direct physical significance in representing deposition processes and its comparability with field-observed snow depth and accumulation extent. In contrast, dynamic parameters such as flow velocity and impact pressure exhibit high spatial variability and are strongly influenced by local terrain interactions, making their validation particularly challenging without real-time or in situ monitoring data. Unfortunately, no direct instrumental observations were available during this avalanche event, thus constraining the quantitative validation of these dynamic outputs. Consequently, the validation presented here focuses specifically on flow height to ensure robust interpretability and practical applicability of the simulation results. To overcome this limitation, future research could benefit significantly from integrating real-time avalanche monitoring systems (e.g., seismic, radar, or geophone sensors) within high-risk avalanche corridors. Such integration would provide direct observational data for comprehensive validation of dynamic parameters, thereby improving the reliability and predictive capacity of avalanche modeling efforts.

5. Discussion

5.1. Meteorological and Topographic Controls on Avalanche Release

This study identified the primary triggering factors of the avalanche event of 26 March 2024, as the combined influence of snowfall intensity, temperature fluctuations, wind regime, and terrain configuration, particularly slope angle and aspect. Meteorological data indicated that cumulative precipitation reached 132 mm in the week preceding the event, accompanied by a maximum daily temperature range of 15 °C and the first recorded daily mean temperature above 0 °C. This combination of intense snowfall followed by rapid warming is widely recognized as a typical trigger condition for wet slab avalanches [5,25,26,27]. McClung and Schaerer [25] emphasized that rapid snow accumulation during sustained snowfall events, followed by a sharp rise in temperature, leads to significant weakening of snowpack stability by promoting the formation of weak layers and glide surfaces. The findings of this study corroborate these classical mechanisms, reaffirming the high sensitivity of snowpack mechanical stability to short-term meteorological variability.
Furthermore, both simulation results and wind rose analyses demonstrated a pronounced leeward loading effect driven by dominant southeasterly (SE) winds interacting with northwest-facing (NW) slopes. This terrain–wind coupling facilitated preferential snow deposition in leeward zones—conditions known to promote thick, dense wind slabs prone to weak bonding at lower interfaces [5,17,28]. Field surveys and UAV imagery confirmed that the release zone corresponded precisely to such a leeward slope, reinforcing the presence of structurally unstable snowpack configurations. The slope angle of the release area was concentrated around 38.7°, aligning with previous findings that avalanches most frequently occur on slopes between 30° and 45° [16,29,30,31]. This range is considered optimal for both snow accumulation and gravitational force generation sufficient to initiate failure. Notably, this study also documented unusually high diurnal temperature variability (up to 15 °C) in the week before the avalanche, a value exceeding typical climatic oscillations in the northern Tianshan region. Such anomalous thermal fluctuations may have accelerated surface melt–refreeze cycles and enhanced the development of deeper weak layers. Similar dynamics have been reported by Eckerstorfer and Christiansen [32], who attributed internal snowpack instability to intense thermal gradients induced by large daily temperature shifts.
In summary, the triggering mechanism of this event aligns well with classical wet slab avalanche processes while also exhibiting region-specific meteorological anomalies and wind–terrain interaction patterns. These insights contribute to the refinement of avalanche hazard models in the northern Tianshan region and offer a scientific foundation for risk assessment and early-warning strategies in similar alpine environments.

5.2. Spatiotemporal Characteristics and Recurrence Analysis of Avalanche Paths

This study demonstrates that the flow path and deposition zone of the avalanche, occurring on 26 March 2024, exhibit significant spatial consistency with historical events, showing clear spatial stability and recurrence characteristics. Remote sensing imagery analysis reveals that at least several similar-scale avalanche events occurred in the study area over the past decade, primarily in late March and early April, specifically in 2017, 2020, and 2024. The recurrence interval of approximately 2–3 years indicates a clear temporal regularity and periodicity of avalanche activity in the region, consistent with previous studies on the periodic recurrence of avalanche paths in mountainous areas [7,33,34,35]. For instance, Bühler [36] pointed out that avalanche paths in high mountain regions typically exhibit marked periodic recurrence, significantly influenced by terrain factors.
Further analysis of avalanche path stability found that it is primarily controlled by a combination of slope, aspect, and local gully topography. DEM analysis shows that the slope in the release zone is concentrated between 30° and 40°, a range considered highly sensitive for avalanche initiation. In addition, the release zone faces northwest (NW), which is a shaded slope with weaker solar radiation and shorter exposure duration, thus inhibiting rapid snowmelt [2,5,37,38]. This shaded terrain condition effectively prolongs snow retention time, increasing the risk of instability during the spring warming period (March–April). Particularly under conditions of heavy snowfall and rapid temperature rise, snow stability is significantly reduced, leading to weak layer formation and avalanche initiation.
Furthermore, the gully-like terrain in the study area plays a significant role in guiding avalanche flow. RAMMS model simulations further confirm the substantial impact of this topographic feature on avalanche paths. The location and extent of the deposition zone predicted by the model closely match the historical avalanche traces identified from remote sensing imagery, confirming the decisive role of terrain in shaping avalanche paths and further emphasizing the spatiotemporal regularity of avalanche activity under specific topographic and meteorological conditions.
In summary, this study shows that the spatiotemporal characteristics and recurrence of avalanche paths are influenced by multiple factors, particularly slope, aspect, terrain features, and meteorological conditions. The integration of remote sensing imagery and simulation analysis has revealed the high recurrence and terrain control of avalanche paths in the study area, providing important theoretical support for future avalanche risk assessment and early warning system development.

6. Conclusions

In this study, a major avalanche event that occurred on 26 March 2024, in the Sumtas region of the northern Tianshan Mountains, Xinjiang, China, is analyzed. By integrating remote sensing imagery, field surveys, and RAMMS::Avalanche dynamic simulations, the triggering mechanisms, dynamic evolution, and the spatiotemporal stability of the avalanche path were systematically examined. The key findings are as follows:
(1)
Based on high-resolution remote sensing imagery and field survey data, the release zone, flow path, and deposition area of the avalanche were accurately identified. The results show that the avalanche path in the study area demonstrates significant spatial stability. The trajectories of previous avalanches closely coincide with that of the current event, indicating a recurrence interval of approximately 2 to 3 years.
(2)
The avalanche was triggered by a combination of meteorological and topographical factors. Continuous heavy snowfall, rapid warming, and significant diurnal temperature fluctuations resulted in a marked weakening of the snowpack structure. The stable southeast (SE) wind direction and northwest (NW) lee-slope topography formed a pronounced snow accumulation effect, enhancing the heterogeneity of snow thickness and increasing structural instability. The evolution of meteorological factors and the rapid growth of the snowpack were closely synchronized, indicating that this event was a typical wet snow slab avalanche driven by local meteorological-topographic coupling mechanisms.
(3)
The RAMMS model simulation results were highly consistent with the field survey data. The simulated deposition area and flow height were in good agreement with the observed data, with a maximum flow velocity of 19.22 m/s, a maximum flow height of 12.42 m, and a peak dynamic pressure of 129.3 kPa. The simulated deposition zone was in high accordance with historical avalanche traces identified through remote sensing imagery, further validating the spatial recurrence and strong topographical dependence of avalanche paths in this region.
This study realized the integrated application of remote sensing observation, meteorological monitoring, field surveys, and numerical simulations, and established a quantitative analysis framework applicable to complex mountainous avalanche events. The results contribute to a deeper understanding of the spatiotemporal evolution and disaster mechanisms of avalanches in the northern Tianshan Mountains, providing theoretical support and scientific evidence for avalanche risk assessment, early warning, and mitigation strategies in critical regions such as alpine transportation corridors.

Author Contributions

Conceptualization, X.Q. and J.L.; Methodology, X.Q., J.H. and J.L.; Software, X.Q., J.H. and Z.Y.; Validation, X.Q.; Investigation, X.Q., J.H. and B.W.; Resources, J.H., Q.G. and J.L.; Data curation, J.H. and Z.Y.; Writing—original draft, X.Q.; Writing—review & editing, J.H. and Z.Y.; Supervision, Q.G., B.W. and J.L.; Project administration, Q.G., B.W. and J.L.; Funding acquisition, Q.G. and J.L. All authors have read and agreed to the published version of the manuscript.

Funding

This research was supported by the Key Technology Research and Development Program of Ministry of Transport of China (Grant No. 2022-ZD6-090); the Science and Technology Project for Transportation Industry of Xinjiang Transportation Department (Grant No. 2022-ZD-006); and the Xinjiang Transportation Design Institute Science and Technology R&D Project (Grant No. KY2022041101).

Data Availability Statement

The original contributions presented in this study are included in the article. Further inquiries can be directed to the corresponding author.

Conflicts of Interest

Xiaowen Qiang, Jichen Huang, Zhiwei Yang, Bin Wang and Jie Liu are employees of Xiniiang Transport Planning Survey and Design Institute Co., Ltd. The paper reflects the views of the scientists and not the company. The remaining authors declare that the research was conducted in the absence of any commercial or financial relationships that could be construed as a potential conflict of interest.

References

  1. Mayer, S.; Hendrick, M.; Michel, A.; Richter, B.; Schweizer, J.; Wernli, H.; van Herwijnen, A. Impact of Climate Change on Snow Avalanche Activity in the Swiss Alps. Cryosphere 2024, 18, 5495–5517. [Google Scholar] [CrossRef]
  2. Jamieson, B. Formation of Refrozen Snowpack Layers and Their Role in Slab Avalanche Release. Rev. Geophys. 2006, 44, RG2001. [Google Scholar] [CrossRef]
  3. Schweizer, J. On Recent Advances in Avalanche Research. Cold Reg. Sci. Technol. 2017, 144, 1–5. [Google Scholar] [CrossRef]
  4. Schweizer, J.; Bartelt, P.; van Herwijnen, A. Chapter 12—Snow Avalanches. In Snow and Ice-Related Hazards, Risks, and Disasters, 2nd ed.; Haeberli, W., Whiteman, C., Eds.; Hazards and Disasters Series; Elsevier: Amsterdam, The Netherlands, 2021; pp. 377–416. ISBN 978-0-12-817129-5. [Google Scholar]
  5. Snow Avalanche Formation—Schweizer—2003—Reviews of Geophysics—Wiley Online Library. Available online: https://agupubs.onlinelibrary.wiley.com/doi/full/10.1029/2002RG000123 (accessed on 14 July 2025).
  6. Timing and Identification of Potential Snow Avalanche Types: A Case Study of the Central Tianshan Mountains|Landslides. Available online: https://link.springer.com/article/10.1007/s10346-021-01766-7 (accessed on 14 July 2025).
  7. Climate Change Impacts on Snow Avalanche Activity and Related Risks|Nature Reviews Earth & Environment. Available online: https://www.nature.com/articles/s43017-024-00540-2 (accessed on 14 July 2025).
  8. Christen, M.; Kowalski, J.; Bartelt, P. RAMMS: Numerical Simulation of Dense Snow Avalanches in Three-Dimensional Terrain. Cold Reg. Sci. Technol. 2010, 63, 1–14. [Google Scholar] [CrossRef]
  9. Eckerstorfer, M.; Malnes, E.; Müller, K. A Complete Snow Avalanche Activity Record from a Norwegian Forecasting Region Using Sentinel-1 Satellite-Radar Data. Cold Reg. Sci. Technol. 2017, 144, 39–51. [Google Scholar] [CrossRef]
  10. Huo, F.; Guo, F.; Shi, P.; Gao, Z.; Zhao, Y.; Wang, Y.; Meng, X.; Yue, D. The Application of Remote Sensing Technology in Post-Disaster Emergency Investigations of Debris Flows: A Case Study of the Shuimo Catchment in the Bailong River, China. Remote Sens. 2024, 16, 2817. [Google Scholar] [CrossRef]
  11. Liu, Y.; Chen, X.; Qiu, Y.; Hao, J.; Yang, J.; Li, L. Mapping Snow Avalanche Debris by Object-Based Classification in Mountainous Regions from Sentinel-1 Images and Causative Indices. Catena 2021, 206, 105559. [Google Scholar] [CrossRef]
  12. Frigo, B.; Bartelt, P.; Chiaia, B.; Chiambretti, I.; Maggioni, M. A Reverse Dynamical Investigation of the Catastrophic Wood-Snow Avalanche of 18 January 2017 at Rigopiano, Gran Sasso National Park, Italy. Int. J. Disaster Risk Sci. 2021, 12, 40–55. [Google Scholar] [CrossRef]
  13. Eckerstorfer, M.; Malnes, E. Manual Detection of Snow Avalanche Debris Using High-Resolution Radarsat-2 SAR Images. Cold Reg. Sci. Technol. 2015, 120, 205–218. [Google Scholar] [CrossRef]
  14. Cheng, Q.; Liu, J.; Guo, Q.; Liu, J.; Yang, Z.; Hu, C. Identification and Assessment of Avalanche Hazards in Aerxiangou Section of Duku Expressway in TianShan Mountainous Region Based on Unmanned Aerial Vehicle Photography. Res. Cold Arid Reg. 2025, 17, 145–158. [Google Scholar] [CrossRef]
  15. Massive Collapse of Two Glaciers in Western Tibet in 2016 After Surge-Like Instability|Nature Geoscience. Available online: https://www.nature.com/articles/s41561-017-0039-7 (accessed on 14 July 2025).
  16. Maggioni, M.; Gruber, U. The Influence of Topographic Parameters on Avalanche Release Dimension and Frequency. Cold Reg. Sci. Technol. 2003, 37, 407–419. [Google Scholar] [CrossRef]
  17. Guy, Z.M.; Birkeland, K.W. Relating Complex Terrain to Potential Avalanche Trigger Locations. Cold Reg. Sci. Technol. 2013, 86, 1–13. [Google Scholar] [CrossRef]
  18. Zhang, T.; Yin, Y.; Li, B.; Liu, X.; Wang, M.; Gao, Y.; Wan, J.; Kaushal, K.R. Characteristics and Dynamic Analysis of the February 2021 Long-Runout Disaster Chain Triggered by Massive Rock and Ice Avalanche at Chamoli, Indian Himalaya. J. Rock Mech. Geotech. Eng. 2023, 15, 296–308. [Google Scholar] [CrossRef]
  19. Ortner, G.; Bründl, M.; Kropf, C.M.; Röösli, T.; Bühler, Y.; Bresch, D.N. Large-Scale Risk Assessment on Snow Avalanche Hazard in Alpine Regions. Nat. Hazards Earth Syst. Sci. 2023, 23, 2089–2110. [Google Scholar] [CrossRef]
  20. Hao, J.; Huang, F.; Liu, Y.; Amobichukwu, C.A.; Li, L. Avalanche Activity and Characteristics of Its Triggering Factors in the Western Tianshan Mountains, China. J. Mt. Sci. 2018, 15, 1397–1411. [Google Scholar] [CrossRef]
  21. Yang, J.; He, Q.; Liu, Y. Winter–Spring Prediction of Snow Avalanche Susceptibility Using Optimisation Multi-Source Heterogeneous Factors in the Western Tianshan Mountains, China. Remote Sens. 2022, 14, 1340. [Google Scholar] [CrossRef]
  22. Liu, J.; Zhang, T.; Hu, C.; Wang, B.; Yang, Z.; Sun, X.; Yao, S. A Study on Avalanche-Triggering Factors and Activity Characteristics in Aerxiangou, West Tianshan Mountains, China. Atmosphere 2023, 14, 1439. [Google Scholar] [CrossRef]
  23. Hao, J.; Mind’je, R.; Zhang, X.; Wang, Y.; Zhou, H.; Li, L. Implementation of an Early Warning for Snowfall-Triggered Avalanche to Road Safety in the Tianshan Mountains. Cold Reg. Sci. Technol. 2022, 204, 103675. [Google Scholar] [CrossRef]
  24. Yanlong, W.; Maohuan, H. An Outline of Avalanches in China. Cold Reg. Sci. Technol. 1986, 13, 11–18. [Google Scholar] [CrossRef]
  25. McClung, D.; Schaerer, P.A. The Avalanche Handbook; The Mountaineers Books: Seattle, WA, USA, 2006; ISBN 978-0-89886-809-8. [Google Scholar]
  26. Castebrunet, H.; Eckert, N.; Giraud, G.; Durand, Y.; Morin, S. Projected Changes of Snow Conditions and Avalanche Activity in a Warming Climate: The French Alps over the 2020–2050 and 2070–2100 Periods. Cryosphere 2014, 8, 1673–1697. [Google Scholar] [CrossRef]
  27. Schweizer, J. Review of Dry Snow Slab Avalanche Release. Cold Reg. Sci. Technol. 1999, 30, 43–57. [Google Scholar] [CrossRef]
  28. Vionnet, V.; Martin, E.; Masson, V.; Guyomarc’h, G.; Naaim-Bouvet, F.; Prokop, A.; Durand, Y.; Lac, C. Simulation of Wind-Induced Snow Transport and Sublimation in Alpine Terrain Using a Fully Coupled Snowpack/Atmosphere Model. Cryosphere 2014, 8, 395–415. [Google Scholar] [CrossRef]
  29. Empirical Calculations of Snow–Avalanche Run–out Distance Based on Topographic Parameters|Journal of Glaciology|Cambridge Core. Available online: https://www.cambridge.org/core/journals/journal-of-glaciology/article/empirical-calculations-of-snowavalanche-runout-distance-based-on-topographic-parameters/661F331BA0C1E067BB1C9FAB2106EC8A (accessed on 14 July 2025).
  30. Full Article: Snow Avalanches in Forested Terrain: Influence of Forest Parameters, Topography, and Avalanche Characteristics on Runout Distance. Available online: https://www.tandfonline.com/doi/full/10.1657/1938-4246-44.4.509 (accessed on 14 July 2025).
  31. Sharma, S.S.; Ganju, A. Complexities of Avalanche Forecasting in Western Himalaya—An Overview. Cold Reg. Sci. Technol. 2000, 31, 95–102. [Google Scholar] [CrossRef]
  32. Eckerstorfer, M.; Christiansen, H.H. Relating Meteorological Variables to the Natural Slab Avalanche Regime in High Arctic Svalbard. Cold Reg. Sci. Technol. 2011, 69, 184–193. [Google Scholar] [CrossRef]
  33. Reardon, B.A.; Pederson, G.T.; Caruso, C.J.; Fagre, D.B. Spatial Reconstructions and Comparisons of Historic Snow Avalanche Frequency and Extent Using Tree Rings in Glacier National Park, Montana, USA. Arct. Antarct. Alp. Res. 2008, 40, 148–160. [Google Scholar] [CrossRef]
  34. Eckert, N.; Parent, E.; Kies, R.; Baya, H. A Spatio-Temporal Modelling Framework for Assessing the Fluctuations of Avalanche Occurrence Resulting from Climate Change: Application to 60 Years of Data in the Northern French Alps. Clim. Change 2010, 101, 515–553. [Google Scholar] [CrossRef]
  35. Schweizer, J.; Kronholm, K.; Wiesinger, T. Verification of Regional Snowpack Stability and Avalanche Danger. Cold Reg. Sci. Technol. 2003, 37, 277–288. [Google Scholar] [CrossRef]
  36. Bühler, Y.; Kumar, S.; Veitinger, J.; Christen, M.; Stoffel, A.; Snehmani. Automated Identification of Potential Snow Avalanche Release Areas Based on Digital Elevation Models. Nat. Hazards Earth Syst. Sci. 2013, 13, 1321–1335. [Google Scholar] [CrossRef]
  37. Peitzsch, E.H.; Hendrikx, J.; Fagre, D.B.; Reardon, B. Examining Spring Wet Slab and Glide Avalanche Occurrence along the Going-to-the-Sun Road Corridor, Glacier National Park, Montana, USA. Cold Reg. Sci. Technol. 2012, 78, 73–81. [Google Scholar] [CrossRef]
  38. Denissova, N.; Nurakynov, S.; Petrova, O.; Daumova, G.; Chepashev, D.; Alpysbay, M.; Chettykbayev, R. Dependence of Avalanche Risk on Slope Insolation Level and Albedo. Atmosphere 2025, 16, 556. [Google Scholar] [CrossRef]
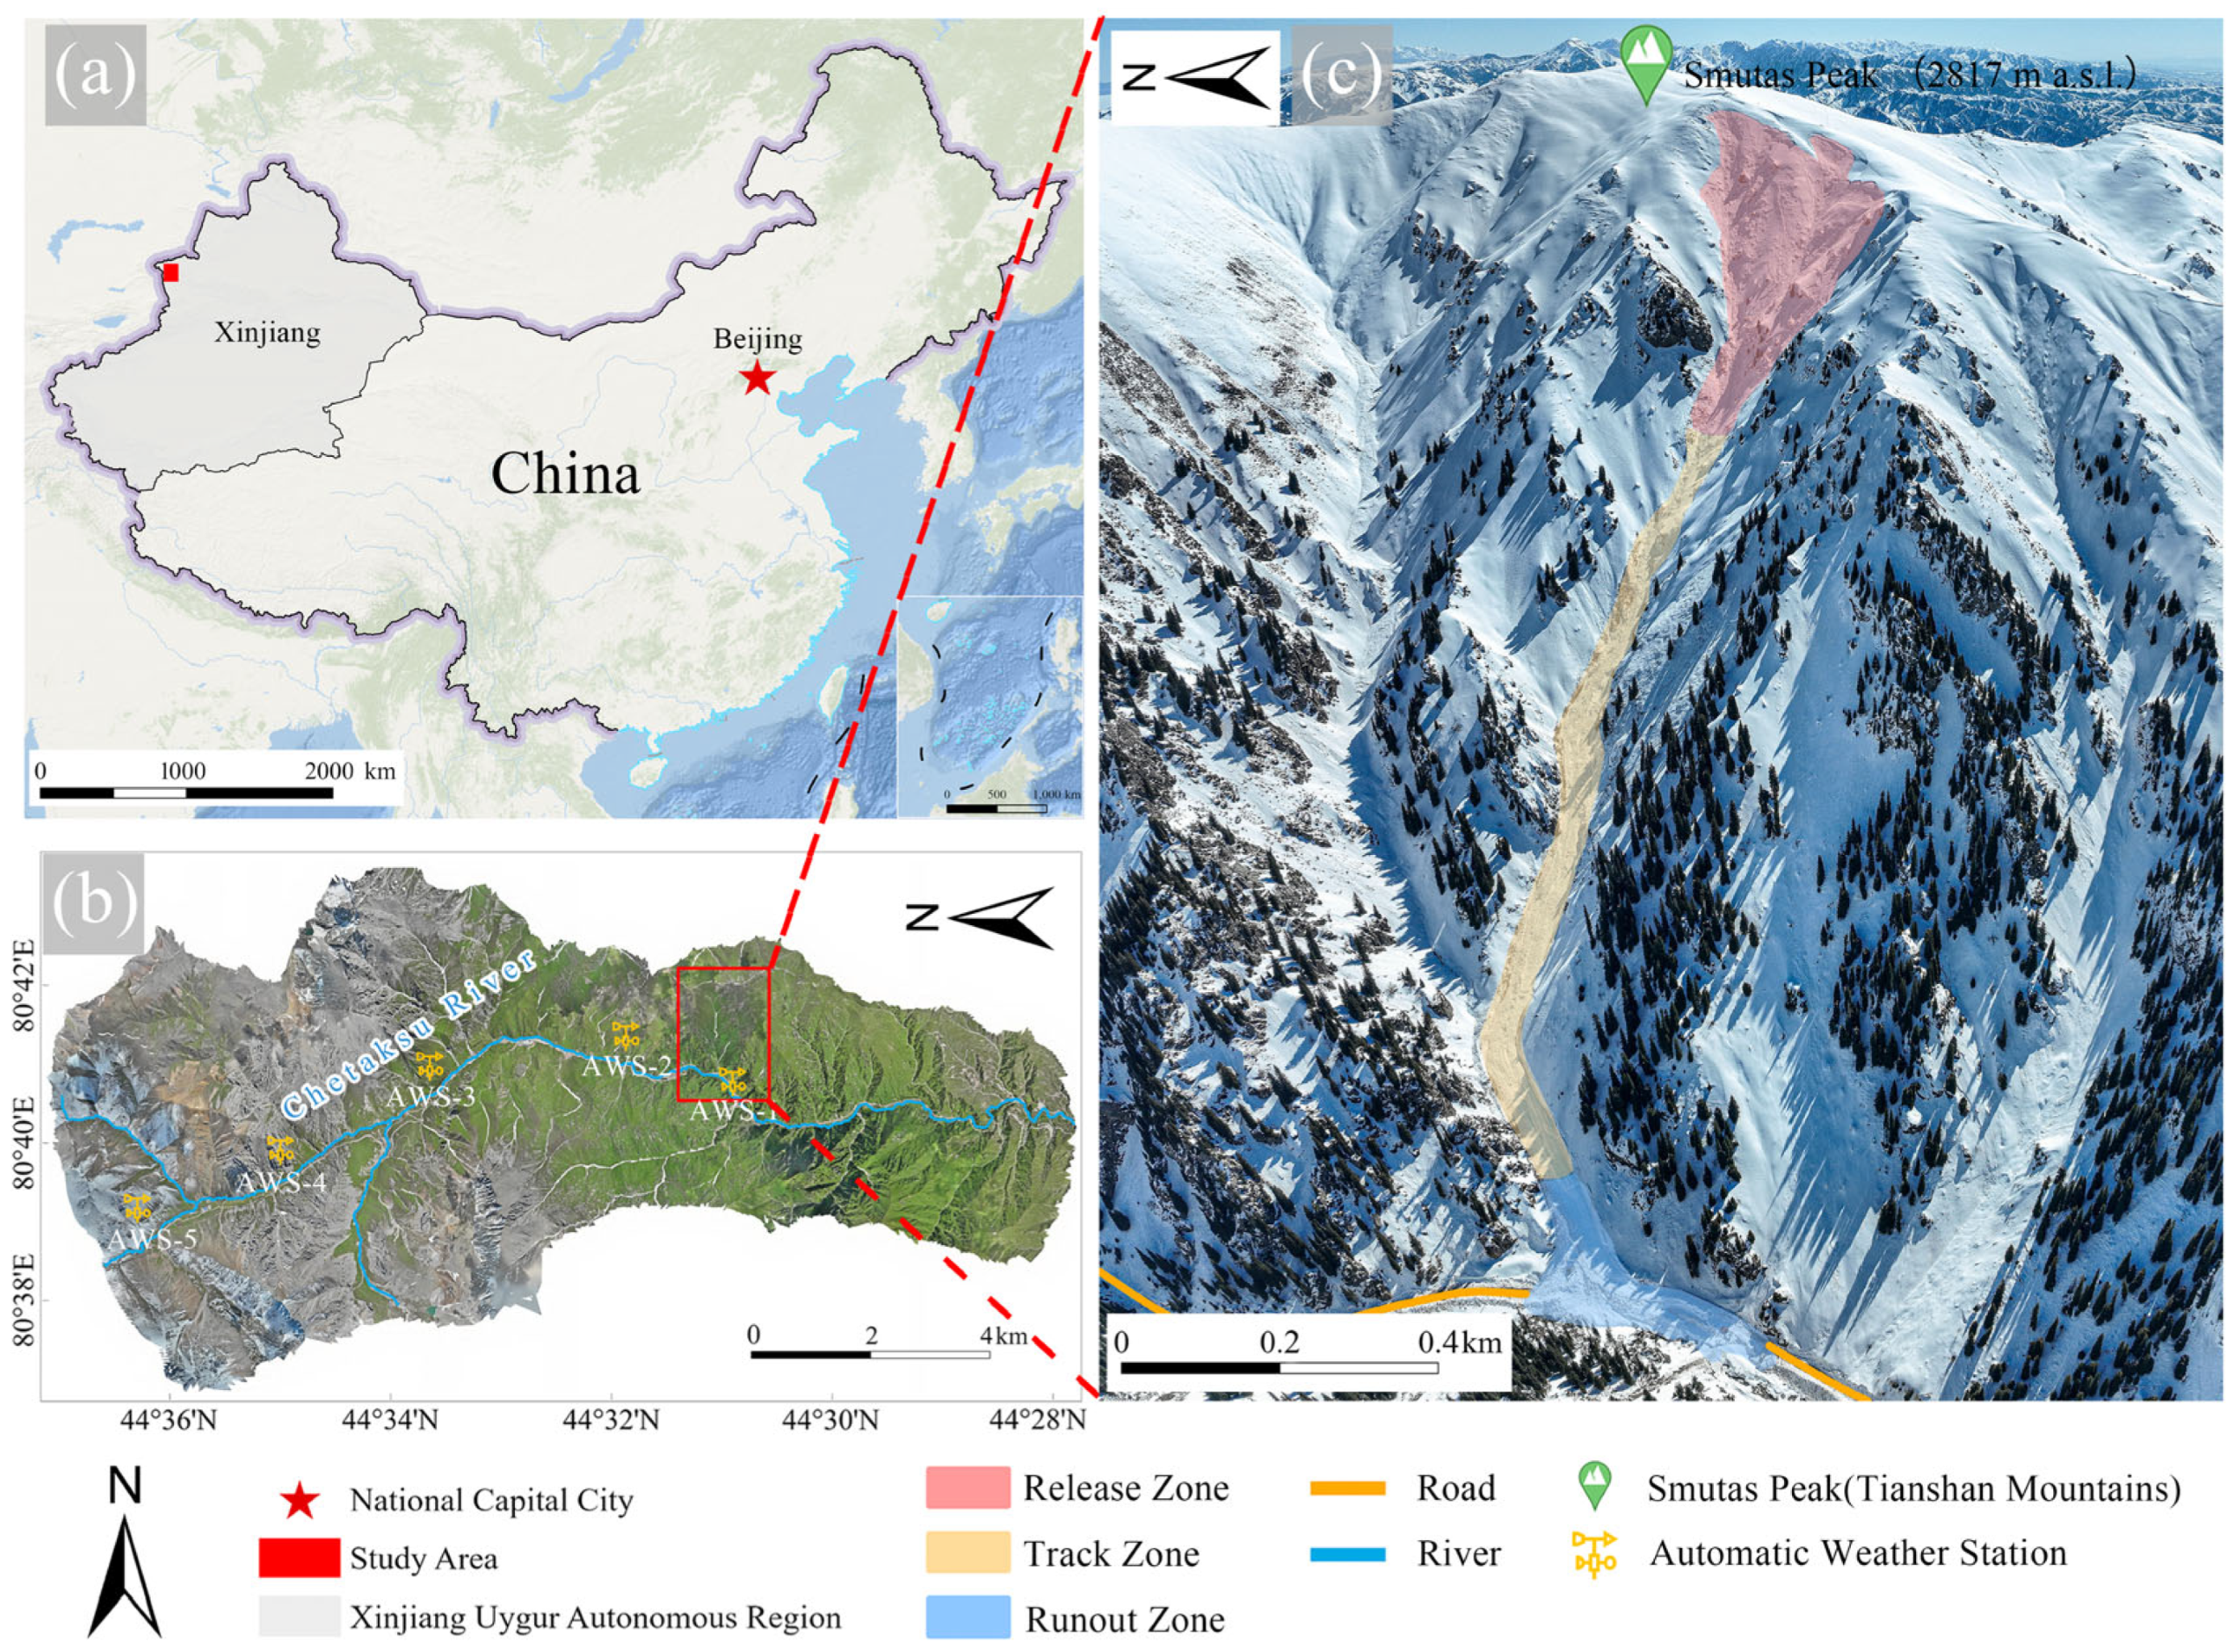
Figure 1. Location and avalanche terrain of the study area: (a) Geographical location of the study area in Xinjiang, China; (b) Distribution of weather stations and study area boundary; (c) Oblique UAV imagery captured after the avalanche event.
Remotesensing 17 02755 g001
Figure 2. Field investigation images: (a) Delineation of release area; (b) Planar extent of deposition zone; (c) Deposition thickness; (d,e) Buried construction vehicles; (f) Entrained debris including tree fragments and rocks; (g) In situ measurements of snow physical properties.
Remotesensing 17 02755 g002
Figure 3. Meteorological conditions from December 2023 to 10 May 2024, including air temperature, snow depth, precipitation, relative humidity, wind speed, and wind direction variability.
Remotesensing 17 02755 g003
Figure 4. Wind and terrain characteristics of the avalanche release area: (a) wind rose diagram; (b) slope aspect; (c) slope angle.
Remotesensing 17 02755 g004
Figure 5. Satellite and UAV imagery for avalanche history and snow season analysis: (a,b) historical avalanche deposits; (c,d) snow cover at the start and end of the season; (e) pre-avalanche snowpack; (f) post-avalanche UAV imagery.
Remotesensing 17 02755 g005
Figure 6. Spatial distribution of avalanche dynamics simulated by RAMMS: (a) maximum velocity; (b) maximum height; (c) maximum dynamic pressure. Points A–D indicate key locations along the avalanche main flow path used for longitudinal profile analysis (Figure 7), and the red line marks the main avalanche flow path extracted from the simulation results.
Remotesensing 17 02755 g006
Figure 7. Longitudinal profile of avalanche dynamics along the main flow path: variation in maximum velocity, flow height, and dynamic pressure.
Remotesensing 17 02755 g007
Figure 8. Simulated temporal progression of avalanche flow height and terrain-controlled deposition from t = 0 to 135 s.
Remotesensing 17 02755 g008
Table 1. Geographic coordinates, elevations, and spatial relation to the avalanche release point for the five deployed AWSs.
Station IDLongitude (°E)Latitude (°N)Elevation (m)Distance to Release (km)Elevation Difference (m)
AWS-180.675244.513420141.7−714
AWS-280.684844.531522832.3−445
AWS-380.675344.563325485.7−180
AWS-480.658844.584727398.7+11
AWS-580.647544.6055290112.7+173
Table 2. Satellite and UAV Data Overview.
SatelliteImage Acquisition DateSpatial Resolution (m)Data Source and Availability
GF-0129 April 20152.0 mNon-open source;
Commercial purchase
Jilin-115 April 20222.0 mOpen-access; Jilin-1 Satellite Data Platform (https://www.jl1mall.com/)
CF-1D15 October 20232.0 mNon-open source
WV0316 May 20241.2 mOpen-access; Google Earth
CF-1B12 March 20242.0 mNon-open source
UAV27 March 20240.1 mDJI Mavic 3E
Table 3. RAMMS model parameter value.
Parameter CategoryParameter NameSymbolValueUnit
TerrainDEM0.4m
Release ZoneInitial snow depth0.6m
Snow densityρ350kg/m3
Release volume60,681.72m3
Friction ModelDry friction coefficientμ0.28
Turbulence coefficientξ1750m/s2
CohesionN0100Pa
SimulationTime step2s
Max simulation time300s
Output interval5s
Disclaimer/Publisher’s Note: The statements, opinions and data contained in all publications are solely those of the individual author(s) and contributor(s) and not of MDPI and/or the editor(s). MDPI and/or the editor(s) disclaim responsibility for any injury to people or property resulting from any ideas, methods, instructions or products referred to in the content.