Article

Improved Photosynthetic Accumulation Models for Biomass Estimation of Soybean and Cotton Using Vegetation Indices and Canopy Height

1
CommSensLab, Department of Signal Theory and Communications, Universitat Politècnica de Catalunya, E08034 Barcelona, Spain
2
Department of Agri-Food and Biosystems Engineering, Universitat Politècnica de Catalunya, E08034 Barcelona, Spain
3
Key Laboratory of Land Environment and Disaster Monitoring, MNR, China University of Mining and Technology (CUMT), Xuzhou 221116, China
4
School of Environment Science and Spatial Informatics, China University of Mining and Technology (CUMT), Xuzhou 221116, China
5
School of Health Economics and Management, Nanjing University of Chinese Medicine, Nanjing 210023, China
*
Author to whom correspondence should be addressed.
Remote Sens. 2025, 17(15), 2736; https://doi.org/10.3390/rs17152736
Submission received: 9 June 2025 / Revised: 3 August 2025 / Accepted: 5 August 2025 / Published: 7 August 2025

Abstract

Most crops accumulate above-ground biomass (AGB) through photosynthesis, inspiring the development of the Photosynthetic Accumulation Model (PAM) and Simplified PAM (SPAM). Both models estimate AGB based on time-series optical vegetation indices (VIs) and canopy height. To further enhance the model performance and evaluate its applicability across different crop types, an improved PAM model (IPAM) is proposed with three strategies. They are as follows: (i) using numerical integration to reduce reliance on dense observations, ( i i ) introduction of Fibonacci sequence-based structural correction to improve model accuracy, and ( i i i ) non-photosynthetic area masking to reduce overestimation. Results from both soybean and cotton demonstrate the strong performance of the PAM-series models. Among them, the proposed IPAM model achieved higher accuracy, with mean R 2 and RMSE values of 0.89 and 207 g/m2 for soybean and 0.84 and 251 g/m2 for cotton, respectively. Among the vegetation indices tested, the recently proposed Near-Infrared Reflectance of vegetation (NIRv) and Kernel-based normalized difference vegetation index (Kndvi) yielded the most accurate results. Both Monte Carlo simulations and theoretical error propagation analyses indicate a maximum deviation percentage of approximately 20% for both crops, which is considered acceptable given the expected inter-annual variation in model transferability. In addition, this paper discusses alternatives to height measurements and evaluates the feasibility of incorporating synthetic aperture radar (SAR) VIs, providing practical insights into the model’s adaptability across diverse data conditions.

1. Introduction

Crop above-ground biomass (AGB) refers to the total mass of all the living plant material found above the soil surface in a given area. It is a crucial medium for regulating water and energy exchange between soil, climate, and farmland [1,2]. Accurate estimation of AGB not only provides an important basis for making decisions on crop fertilization [3], irrigation, and yield management but also significantly impacts carbon sinks, thereby affecting the global carbon cycle [4]. Among major field crops, soybean and cotton are of particular importance due to their wide cultivation and economic value in many regions worldwide. Their AGB not only reflects crop productivity but also responds sensitively to environmental and management factors throughout the growing season [5]. Consequently, the evaluation of AGB has garnered extensive research attention and has become a key research topic of the International Geosphere-Biosphere Programme (IGBP) [6] and the ESA-funded HydroSoil measurement campaign (https://earth.esa.int/eogateway/campaigns/hydrosoil, accessed on 4 August 2025).
Remote sensing (RS) techniques have been widely used to estimate AGB. They can broadly be classified into two categories [2,7]. The first is based on direct spectral data analysis and regression, whereas the second uses models to integrate RS and auxiliary data. Specifically, the former is a statistical analysis method based on spectral information or its derivatives.
For multispectral or hyperspectral data, distinct spectral responses to crop biological parameters enable the formation of various vegetation indices (VIs) [8]. Subsequently, simple regression or advanced deep learning can be employed to identify the relationships between spectral information (or VIs) and AGB [9,10].
Unlike multispectral data, synthetic aperture radar (SAR) data remain unaffected by cloud cover. Its backscattering coefficient, volume scattering information derived from polarization decomposition, etc., have varying sensitivity to crop AGB. Many scholars use these characteristics for regression analysis to estimate AGB [11,12]. Furthermore, crop structure, such as height, represents an additional variable for model adjustment [13]. Unmanned aerial vehicles can determine the height of the crop through crop surface models [14]. Light Detection and Ranging technology (LIDAR) [15] and the Random Volume over Ground model (RVoG) derived from SAR data are also effective methods for estimating crop height [16,17]. It is worth noting that some tuning tasks involve estimating specific parameters within models, such as the water-cloud model. The models then use the estimated parameters to compute AGB [18,19]. Although this method has achieved remarkable results in different crops, its accuracy and generalizability depend heavily on the number of samples. Furthermore, saturation and nonlinear behavior in the response of spectral and SAR data to crop parameters restrict their accuracy [20,21].
The second strategy for estimating AGB involves merging RS and auxiliary data with models. The representative ones are based on Net Primary Productivity (NPP) [22] or Crop Growth Models (CGMs) [23]. The former uses cumulative NPP and different models during the growing period to estimate AGB. The latter integrates CGMs with RS and auxiliary data through a data assimilation technique to derive AGB. Although some advances have been achieved in specific areas, they often rely on extensive auxiliary data, such as light intensity, temperature, water, and nutrient quantity [24]. This reliance on high-cost supplementary data limits the large-scale application of these models [25]. To address this issue, scholars have developed an innovative Photosynthetic Accumulation Model (PAM) based on photosynthetic accumulation theory. This model estimates AGB using only time-series VIs and canopy height, thereby significantly reducing the dependence on auxiliary data [26,27,28]. To balance the accuracy of AGB retrieval with the amount of RS data required, a simplified one (SPAM) was also proposed [28].
PAM has been demonstrated to accurately estimate the AGB of rice in previous studies [28]. According to its core formulation, the accuracy of AGB estimation is influenced by the data volume and the reliability of Leaf Area Index ( L A I ) estimation. To further improve estimation performance and evaluate the applicability of PAM series across different crop types, an improved PAM (IPAM) is proposed and comparatively tested in this paper. The main areas for improvement are shown as follows: (i) a numerical integration method replacing geometric area approximation in PAM and SPAM, reducing dependency on data quantity; ( i i ) introduction of Fibonacci sequence-based structural correction for a more accurate approximation of L A I ; and ( i i i ) incorporating a non-photosynthetic area mask into the model, minimizing erroneous contributions from areas that cannot perform photosynthesis.
Based on experiments with eight optical VIs applied to soybean in Barcelona and cotton in Georgia, IPAM consistently outperforms both PAM and SPAM in overall model performance. In addition, this paper discusses alternatives to in situ height measurements and examines the compatibility of SAR VIs, offering guidance for applying the model across diverse data environments.
This paper is organized as follows. Section 2 gives detailed information on the study areas, equipment, and ancillary data collected. The complete process of the proposed algorithm is presented in Section 3. Section 4 shows the results and demonstrates the model’s superiority. The discussion and conclusions are presented in Section 5 and Section 6, respectively.

2. Materials

2.1. Test Site 1: Soybean

The first test site is the experimental field of the ESA-funded HydroSoil project [29,30,31]. The main objective of HydroSoil was to demonstrate the feasibility of soil moisture and vegetation parameter retrieval in an agricultural field under controlled conditions using a ground-based fully polarimetric SAR (GB-PolSAR) and multispectral data. The test site is located at the Barcelona School of Agricultural Engineering (EEABB), Universitat Politècnica de Catalunya (UPC), situated at 41°16′36″N, 1°59′11″E coordinates. The field size is 22 m × 60 m (width and length), located 25 m away from the facade of the EEABB building. Three different cultivation campaigns were carried out until the end of 2023, barley from March 2020 to June 2020, corn from July 2020 to November 2020, and soybean from May 2023 to September 2023. However, only the soybean campaign includes multispectral data. The planting density of the soybean campaign was around 36 plants/m2. The field was divided into six sections, where crop parameters, such as height and AGB, were randomly sampled (Figure 1). The crop height was measured by averaging the heights of 20 randomly selected plants per section. For AGB measurements, crop elements were cut, placed in sealed bags, and weighed before and after drying in a temperature-controlled oven. More detailed information is presented in Table 1.
Multispectral data were acquired using a Red-Edge MX® camera (Figure 1c), with a ground pixel size of 3 cm. As the experimental site is located near Barcelona airport, airspace regulations made obtaining drone flight permissions impossible. To ensure consistent image acquisition, a custom 3D-printed holder was mounted on the rooftop, positioning the camera at a fixed oblique angle of 55.3° (Figure 1e).
As shown in Figure 2, the acquired optical raw data underwent a series of preprocessing steps using the open-source code provided by MicaSense (MicaSense Inc., Seattle, WA, USA). (https://github.com/micasense/imageprocessing, accessed on 4 August 2025). Specifically, raw multispectral images from each band were first converted to radiance using calibration coefficients and exposure metadata extracted from the original images. Radiance was then converted to surface reflectance using measurements from the reflectance panel (Figure 1d) to correct for ambient lighting. Band alignment was performed using RigRelatives metadata extracted from the original data, which defines the relative positions of the spectral bands.
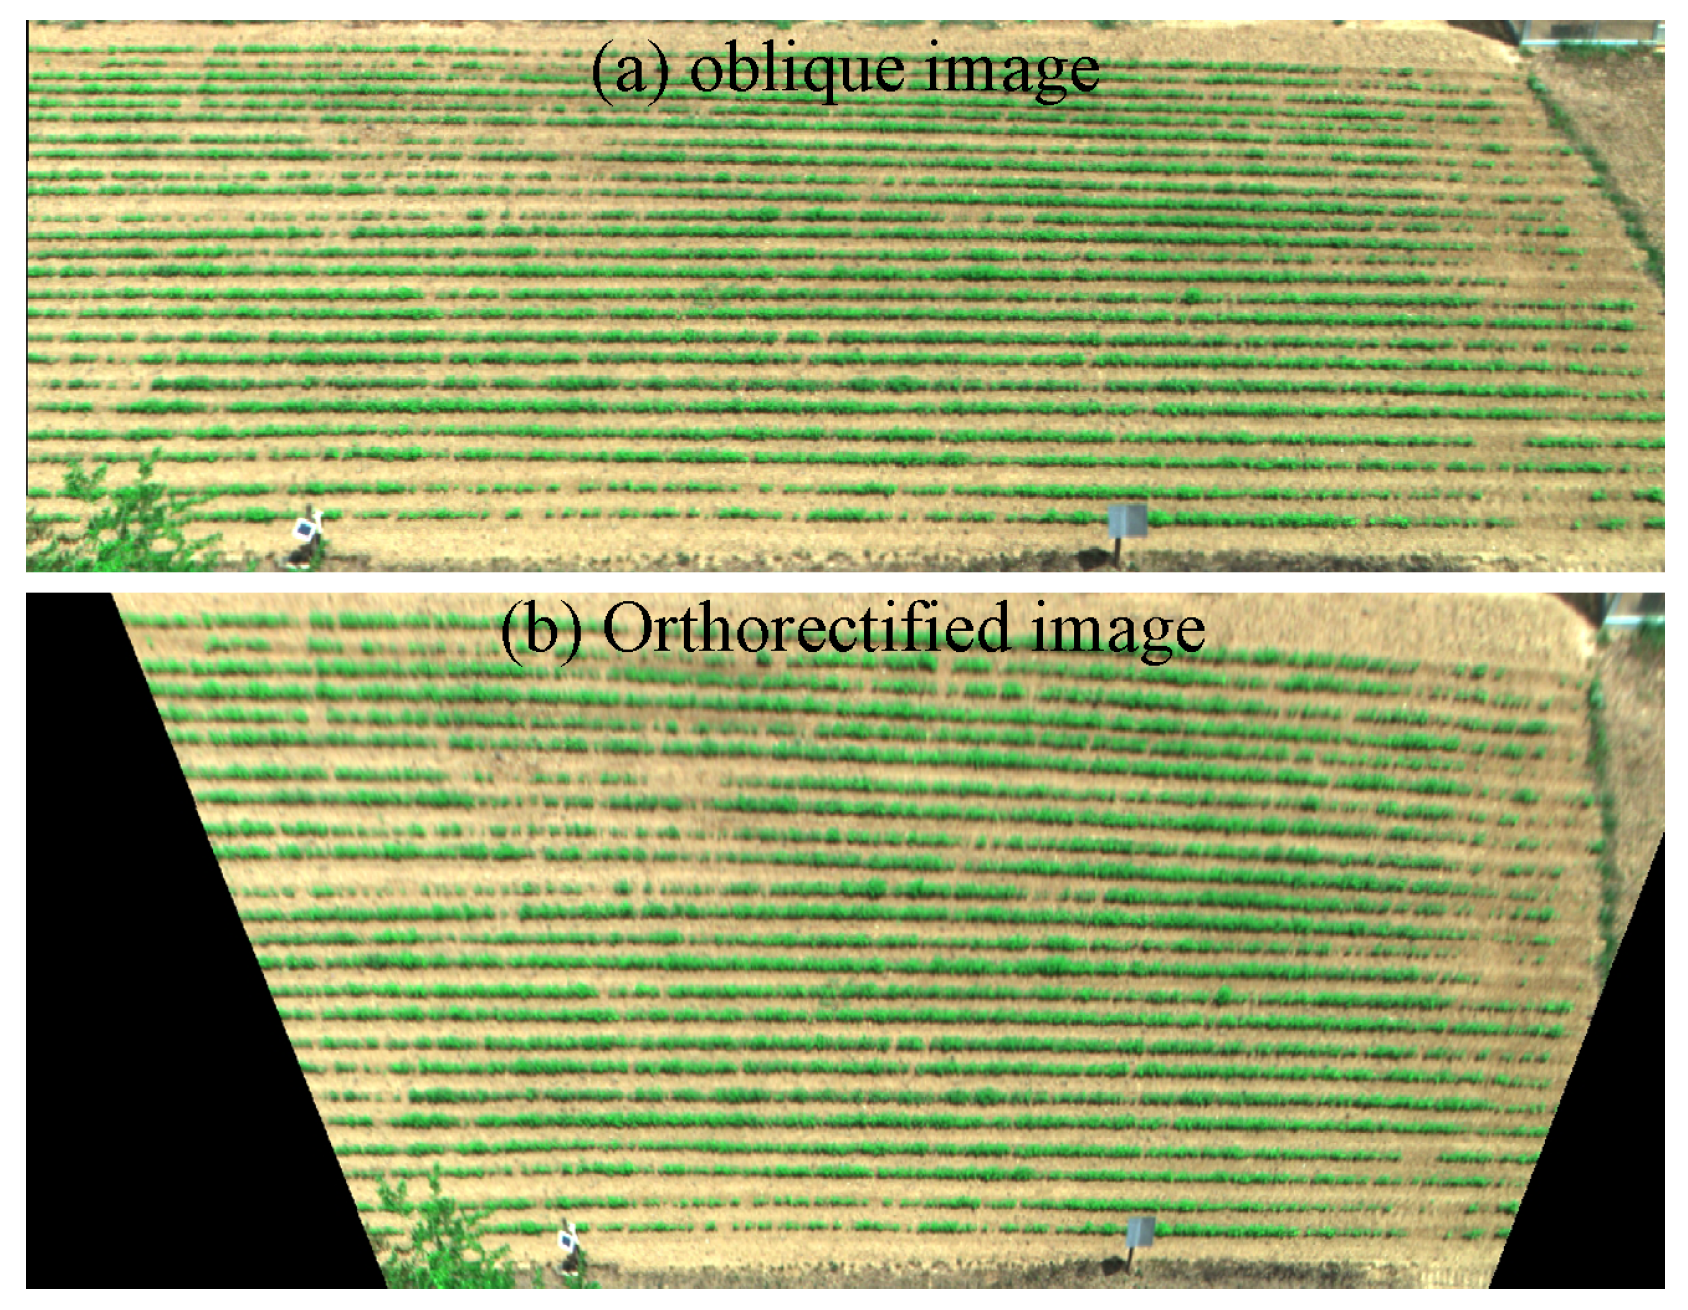
In addition, to correct the oblique shooting angle of the camera, the preprocessed images were orthorectified and projected into UTM coordinates using ground control points distributed throughout the experimental field (Figure 1a). Each control point’s geographic coordinate was paired with its corresponding pixel location in the image to compute a geometric transformation function. The corrected orthorectified images are shown in Figure 3.
To increase the number of validation samples, two multispectral acquisitions were paired with ground measurements taken within a three-day interval, while all other datasets were acquired on the same day. The dates of multispectral data acquisition are summarized in Table 1.
The feasibility of SAR-derived VIs from GB-PolSAR data in IPAM is explored in Section 5.3. The data were collected using a C-band ground-based fully polarimetric SAR system developed by the CommSensLab team at UPC. The system captured images every 10 min at a spatial resolution of approximately 1 m2, covering nearly the entire crop growth cycle [29,30].

2.2. Test Site 2: Cotton

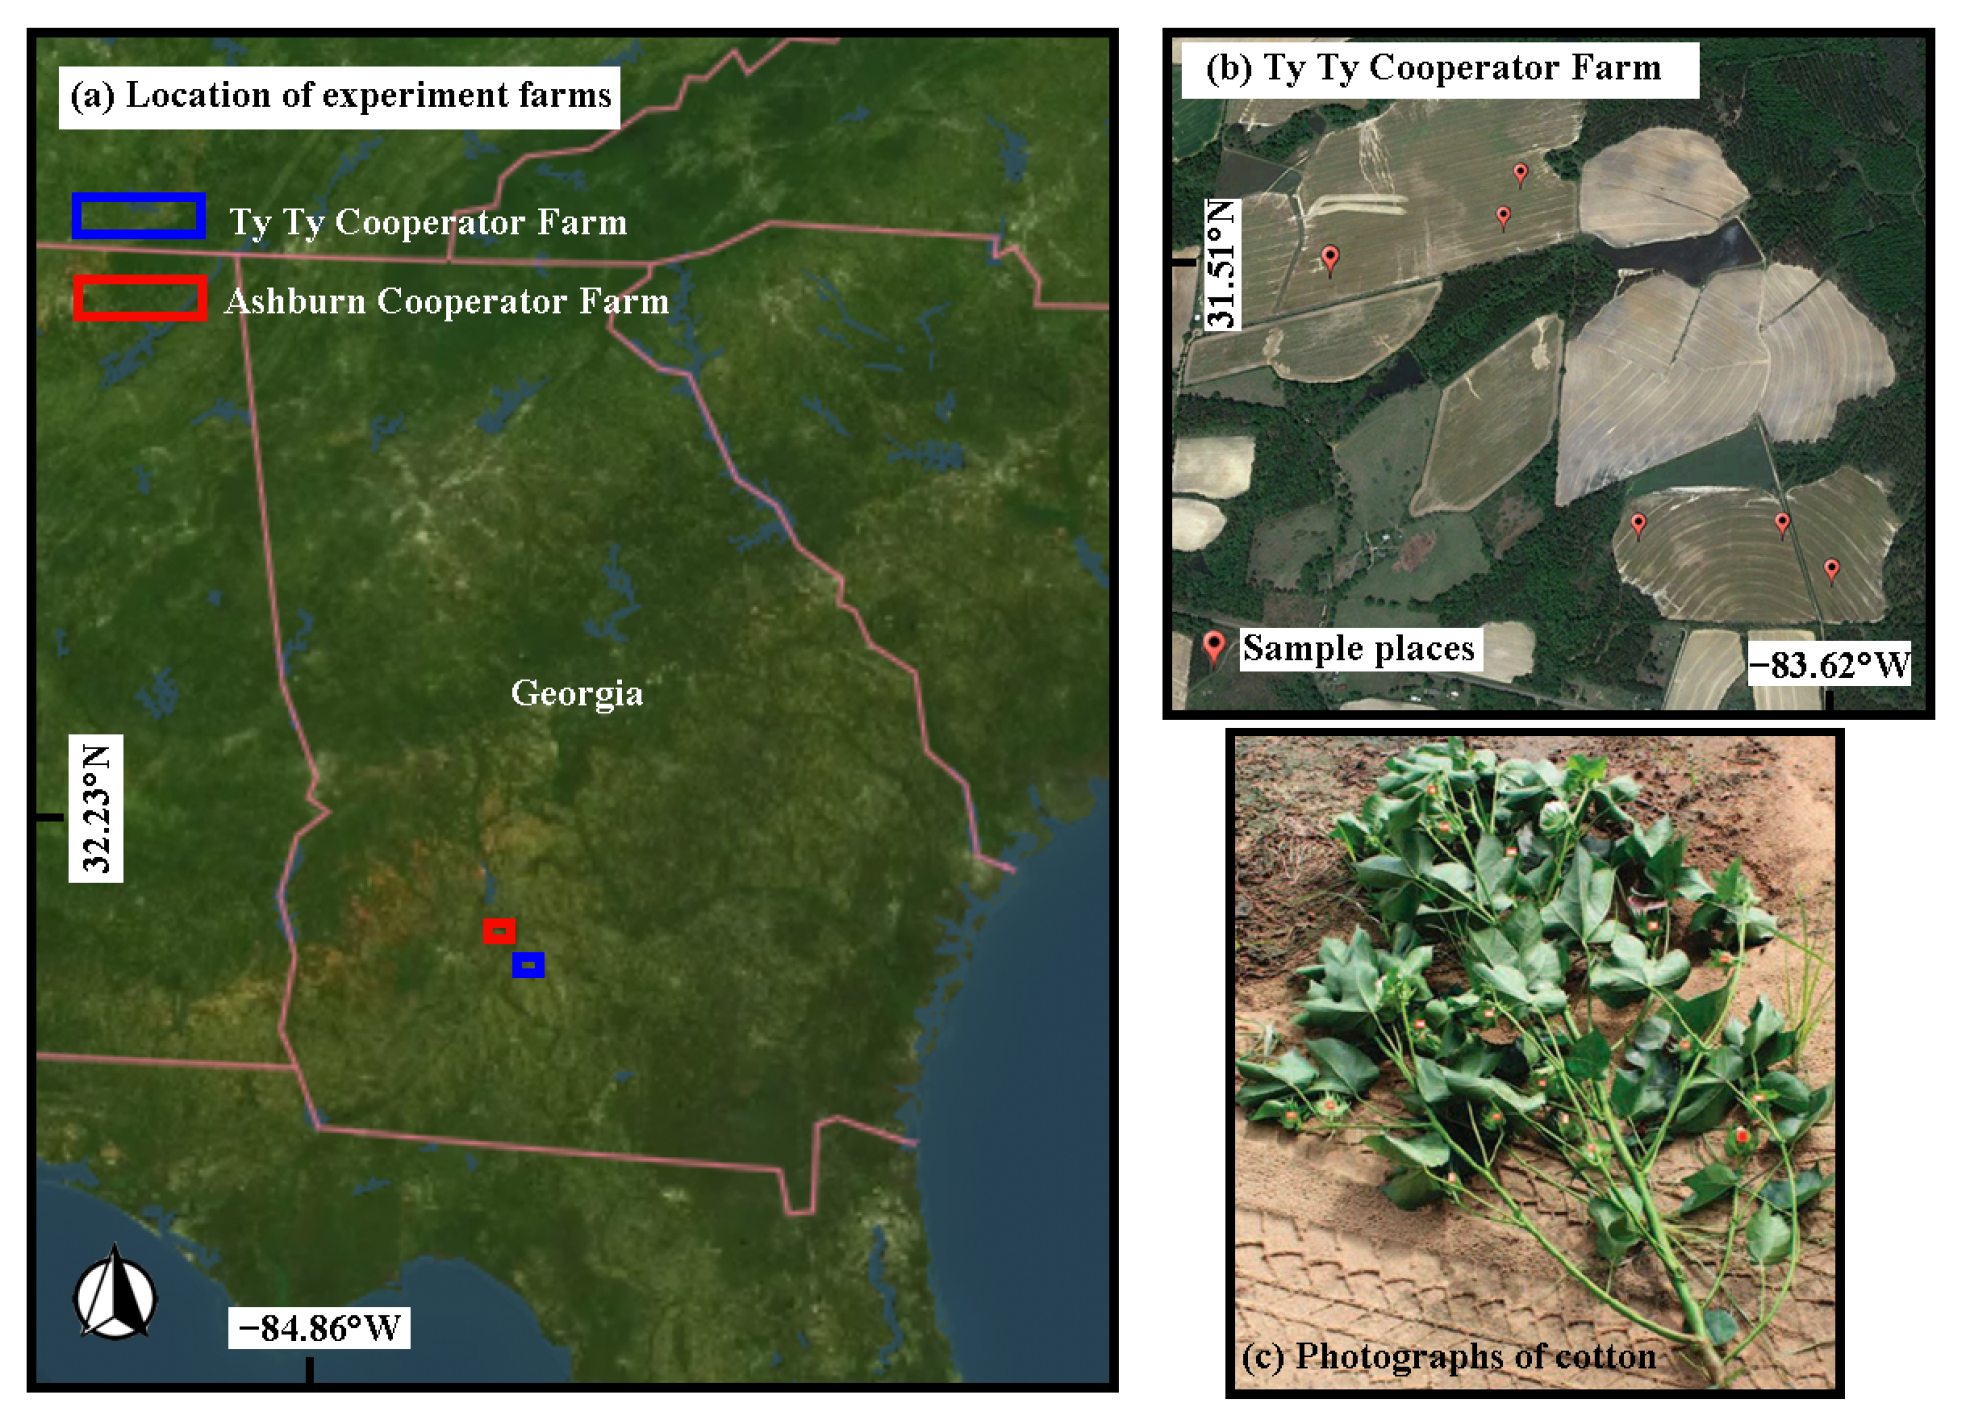
The second test site belongs to the Southeast Watershed Research Laboratory (SEWRL) in Tifton, Georgia, USA [32]. The SEWRL provides data and technical support for various international projects, such as the Conservation Effects Assessment Project (CEAP; https://www.ars.usda.gov/anrds/ceap/ceap-home/, accessed on 4 August 2025) and the Joint Experiment for Crop Assessment and Monitoring (JECAM; https://jecam.org/documents/, accessed on 4 August 2025). The test site is part of the Little River Experimental Watershed (LREW) led by the SEWRL. Two farms within the LREW basin cultivated cotton in 2018 and 2019, with extensive data collection conducted during these periods. These farms (Figure 4a) are the Asbhurn Cooperator Farm (ACF), located near Asbhurn, Georgia (31°42′24″N, 83°43′35″W), and the Ty Ty Cooperator Farm (TCF) in Ty Ty, Georgia (31°30′41″N, 83°37′00″W).
Due to frequent cloud cover in the LREW basin, valid optical images were only obtained in the TCF area during the cotton growth cycle of 2019. The specific sampling locations at TCF are indicated by paddles in Figure 4b, while Figure 4c shows an image of a cotton plant from the farm. The acquisition dates of the Sentinel-2 images (resolution: 10 m) and in-field ancillary data are detailed in Table 1.

3. Methods

3.1. Introduction of Optical VIs

The model used in this paper needs optical VIs, leveraging canopy reflectance differences across various bands to better monitor changes in crop parameters. Eight different optical VIs are listed in Table 2 and their mathematical functions. Each V I has specific advantages. Normalized Difference Vegetation Index (NDVI) is a general V I highly sensitive to chlorophyll content [33]. Enhanced Vegetation Index (EVI) reduces atmospheric and soil influences, making it well-suited for dense vegetation by mitigating the effect of saturation [34]. By combining the green band, Green Normalized Difference Vegetation Index (GNDVI) can assess chlorophyll content in crops during their early stages of growth [35]. Soil Adjusted Vegetation Index (SAVI) and Modified SAVI (MSAVI) effectively reduce soil interference, improving the monitoring of dispersed crops [36]. Photochemical Reflectance Index (PRI), in particular, is sensitive to photosynthetic efficiency [37]. The more recently developed VIs, Near-Infrared Reflectance of vegetation (NIRv) and Kernel-based normalized difference vegetation index (Kndvi), can address the nonlinear issues in the spectral response to some extent, offering significant potential for the precise estimation of crop parameters [38,39]. All VIs used in this paper are normalized to values ranging from 0 to 1.

3.2. Photosynthesis-Based AGB Modeling in the PAM Framework

Crop biomass encompasses all organic material throughout the plant growth cycle, and the vast majority of this organic matter (dry matter) is produced through the accumulation of photosynthesis [27]. The Photosynthetic Accumulation Model (PAM) builds upon this physiological principle to estimate AGB. Specifically, photosynthesis efficiency is a critical indicator of the rate of dry matter production. It is commonly expressed as Net Assimilation Rate ( N A R , g m 2 day 1 ), defined as the increase in plant dry mass per unit of leaf area per unit of time. NAR reflects the net carbon gain of the plant, accounting for the balance between photosynthetic carbon fixation and respiratory carbon loss [26] (Equation (1)).
N A R = 1 L A I · d W d t
In Equation (1), L A I is the Leaf Area Index, defined as the total leaf area per unit ground area, and is therefore dimensionless. W ( g / m 2 ) is the dry matter and its time derivative is the production rate, where t is time. By transforming Equation (1), the total dry matter can be obtained by integrating the product of N A R and L A I over time. This relationship can be expressed in both continuous and discrete forms, as shown in Equation (2).
W ( t ) = 0 t N A R ( t ) · L A I ( t ) d t i = 1 n N A R ( t i ) · L A I ( t i ) · ( t i t i 1 ) , i = 1 , 2 , , n
Many VIs obtained from RS data can effectively reflect the chlorophyll content of green vegetation and are highly correlated with the photosynthesis efficiency [40]. Consequently, a normalized V I sensitive to chlorophyll content can approximate the Net Assimilation Rate.
L A I is approximated using a semi-empirical approach that combines optical VIs and canopy height (referred to as the VIH algorithm). This method is based on the principle that L A I represents the vertical integral of leaf area density (LAD) [28], and that the maximum LAD is strongly correlated with canopy cover [41]. Since VIs are effective indicators of canopy cover [8], the product of VIs and height is used as a practical approximation of L A I (Equation (3)). Although this relationship may introduce uncertainty during early growth stages, previous studies have shown that it can provide reasonably accurate estimates under various conditions [28,42,43].
L A I _ V I H ( t i ) V I ( t i ) · H ( t i )
By substituting N A R with V I [28] and expressing L A I using Equation (3), Equation (2) can be further reformulated to approximate dry matter as the time integration of V I 2 · H . The continuous and discrete formulations are presented in Equation (4) and Equation (5), respectively:
W ( t 0 ) 0 t 0 V I 2 ( t ) · H ( t ) d t
W ( t i ) i = 1 n V I 2 ( t i ) · H ( t i ) · ( t i t i 1 ) , i = 1 , 2 , , n
where t 0 is the integration period since sowing. t i represents the days after the sowing of each data sample.
Building on Equation (5), scholars have developed PAM-based algorithms for AGB estimation [28], which have demonstrated good performance in the case of rice.

3.3. PAM Implementation and IPAM Improvements

This subsection presents the implementation of the basic PAM-series and its improvements in IPAM. It covers the numerical integration approach, the Fibonacci sequence-based structural correction, and the non-photosynthetic area masking procedure. The evaluation metrics used to assess model performance are also introduced.

3.3.1. Numerical Integration

Following Equation (5), PAM involves cumulatively summing the rectangular areas defined by a height of V I 2 · H and a width of Δ t . The accumulated values of each sample are then linearly regressed against in-situ AGB measurements to construct an empirical model.
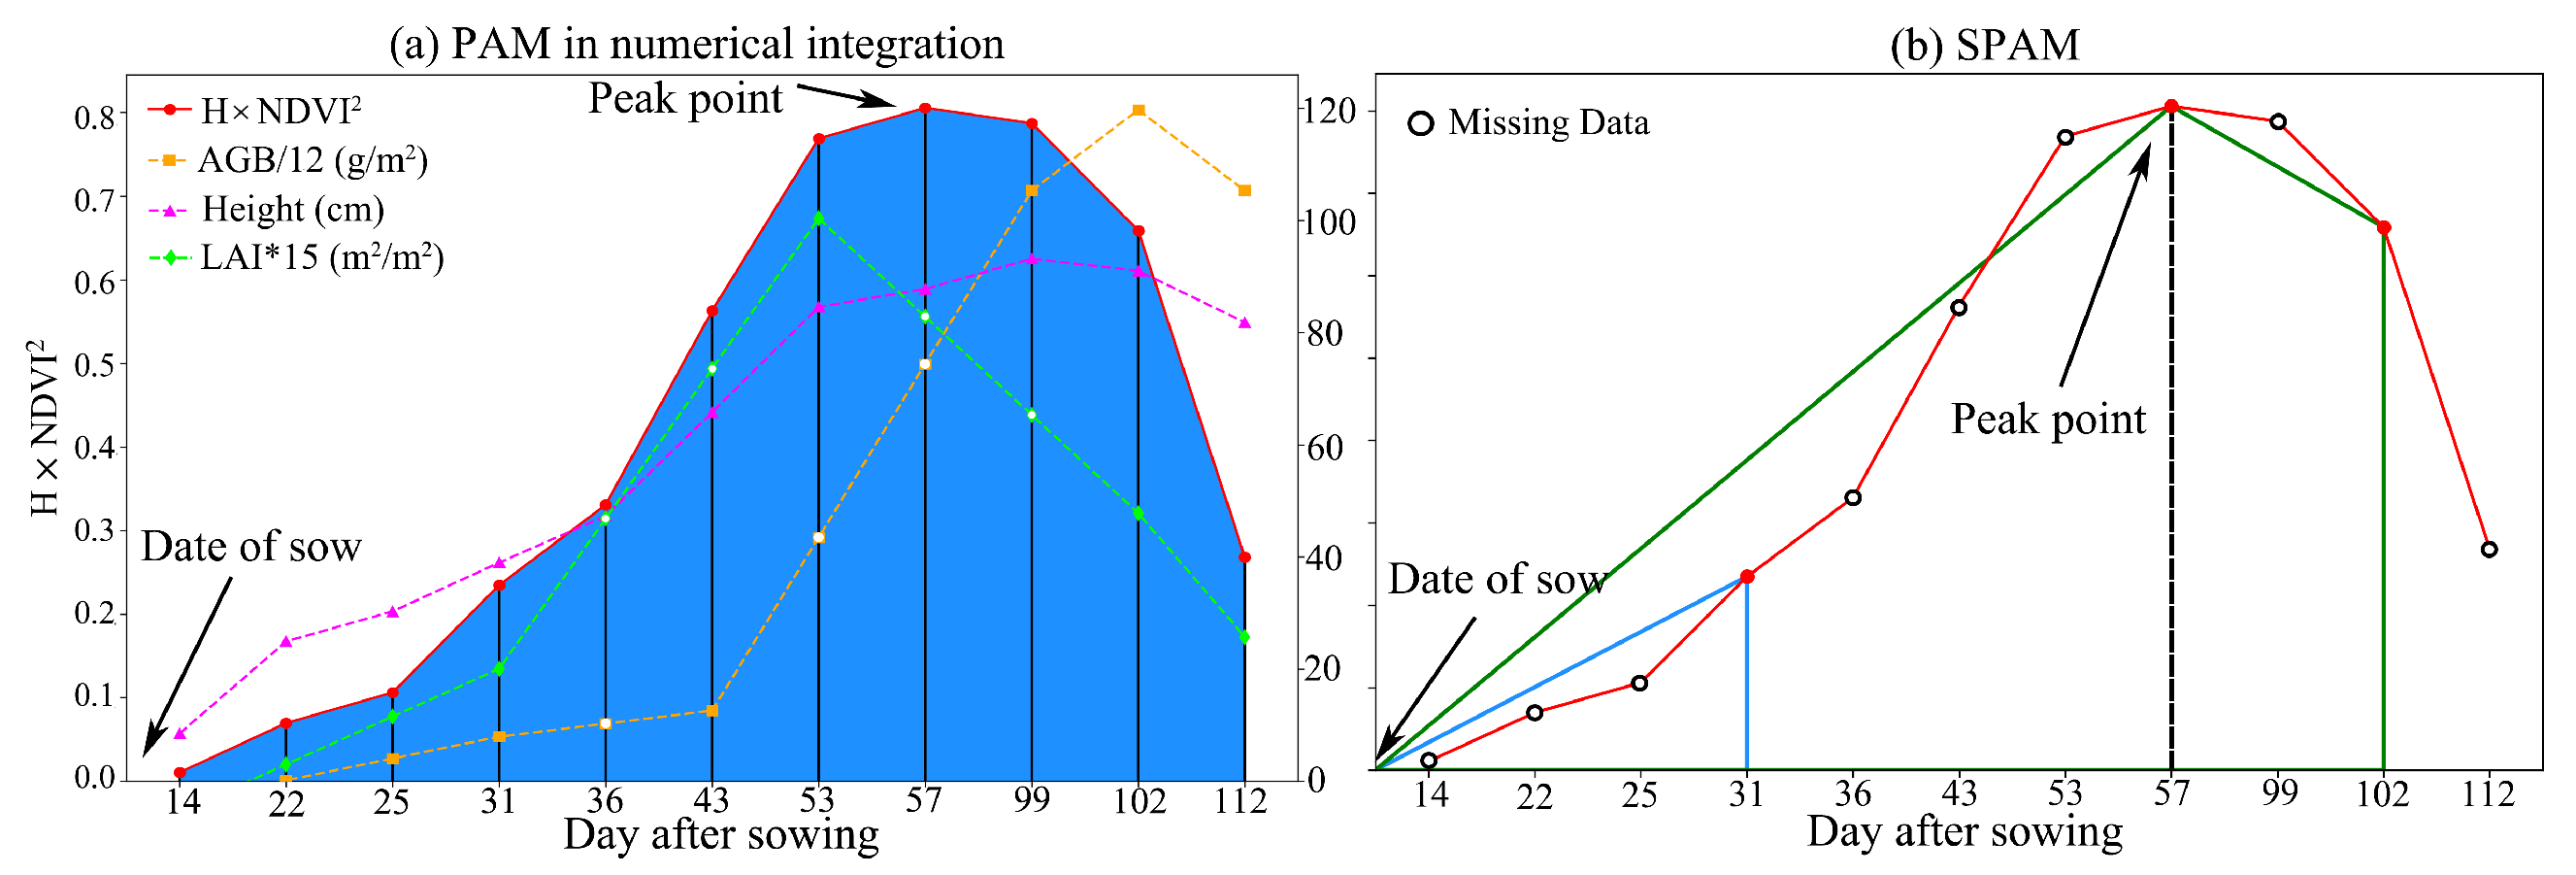
However, based on fundamental mathematical principles, numerical integration following the trapezoidal rule provides a more accurate estimation of the area under the curve (e.g., the curve of V I 2 · H ) than the rectangular geometric approximation. This method better captures the shape of the curve between data points, especially when the observations are sparse or irregular (Figure 5a) [44]. Therefore, subsequent calculations of PAM and IPAM employ numerical integration for AGB estimation as shown in Equation (4). IPAM incorporates an extra correction step to refine the results.
Considering the proportional nature of Equation (refIntegral-W), the proportional coefficient ( α ) is determined using only 30% of the in-situ AGB samples and their corresponding integrated values, as defined in Equation (6). This method better aligns with the theoretical foundation of PAM and further reduces the dependency on extensive field measurements. The potential inter-annual uncertainty in α and its implications for model transferability are further discussed in Section 5.1.
W integral α · 0 t V I 2 ( t ) · H ( t ) d t
In addition, scholars also introduced a simplified PAM, termed SPAM [28], as outlined in Equation (7). Figure 5b can help to understand it intuitively.
W V I 2 · H · t t 0 2 , t T 1 V I T 1 2 · H T 1 · T 1 t 0 2 + V I 2 · H + V I T 1 2 · H T 1 · t T 1 2 , t > T 1
In Equation (7), T 1 represents the days of the heading stage after sowing, as defined in [28]. This stage typically coincides with the peak of the V I 2 · H curve. Since phenological stages differ across crop types and some crops do not exhibit a distinct heading stage, this paper generalizes the heading stage as the time point at which V I 2 · H reaches its maximum, hereafter referred to as the peak point.
SPAM estimates the cumulative value by calculating the area of triangles before the peak point (e.g., the blue triangle in Figure 5b) and the combined area of trapezoids and triangles after the peak point (e.g., the green quadrilateral in Figure 5b). Essentially, SPAM serves as a simplified version of PAM that uses the same proportional coefficient to estimate AGB, striving to achieve reasonable results with minimal input. It was designed to address data-limited scenarios, such as cloud interference or the high cost of super-resolution imagery. However, SPAM relies on the critical assumption that data from the heading stage (peak point) is available.
The effects of data sampling frequency and the resulting deviation from the actual peak point of V I 2 · H will be elaborated on in the Discussion Section.

3.3.2. Fibonacci Sequence Correction Method

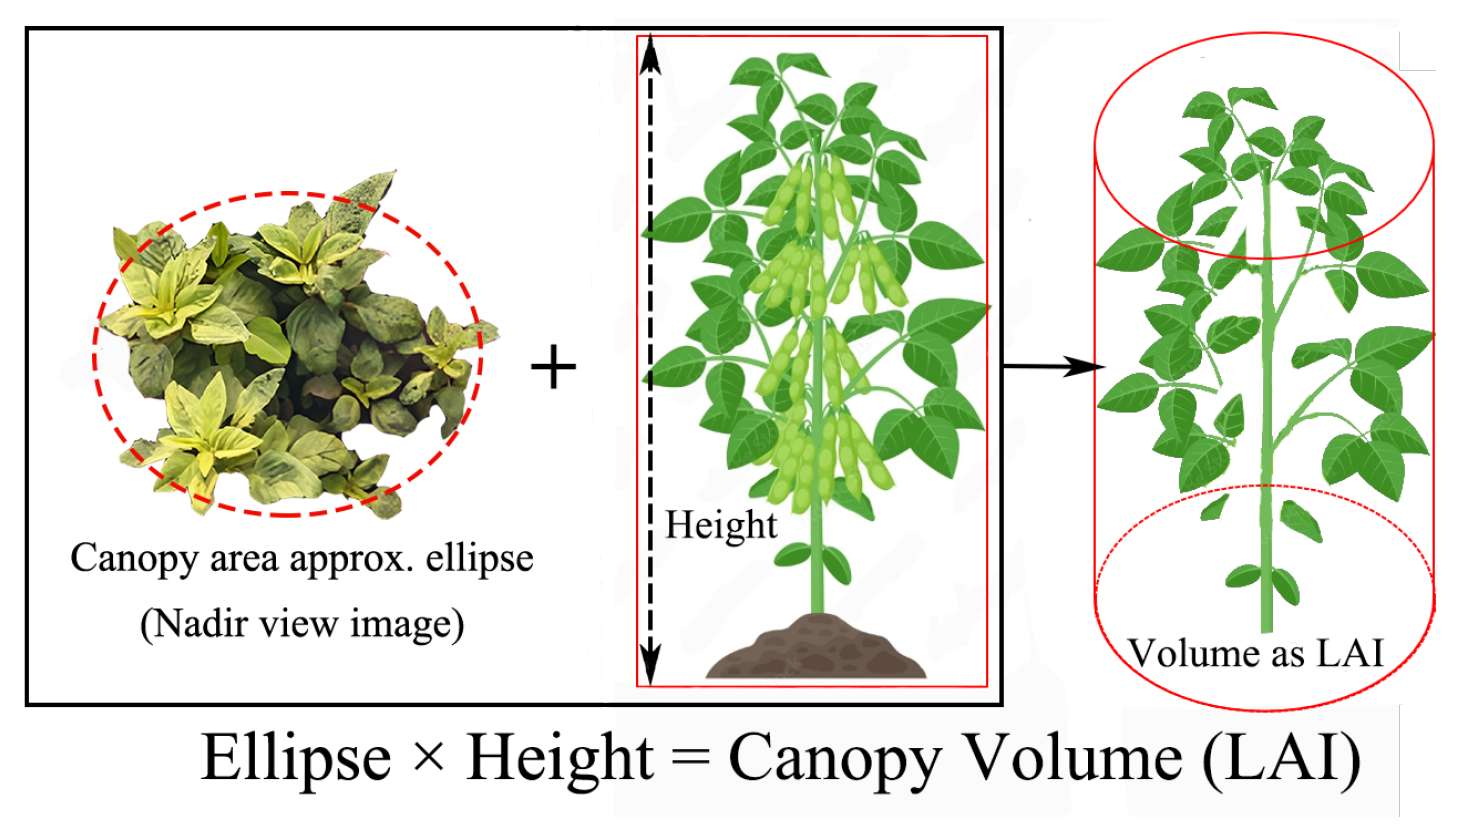
The VIH algorithm approximates LAI by integrating VIs values along the canopy height. When VI values approach 1, this process effectively corresponds to calculating the canopy volume (Figure 6). After proportional scaling, this volume is then treated as the total photosynthetically active leaf area. However, in practice, only a portion of this scaled volume corresponds to actual LAI. Since PAM estimates AGB by integrating the product of VI and LAI (i.e., canopy volume), this assumption inevitably leads to AGB overestimation during the mid-to-late growth stages.
Fortunately, many crops’ structures like branches, leaves, etc. satisfy the Fibonacci Sequence [45], which can be derived with Equation (8).
F n = F 0 = 0 , F 1 = 1 F n 1 + F n 2
Here, F n denotes the n-th element in the Fibonacci Sequence.
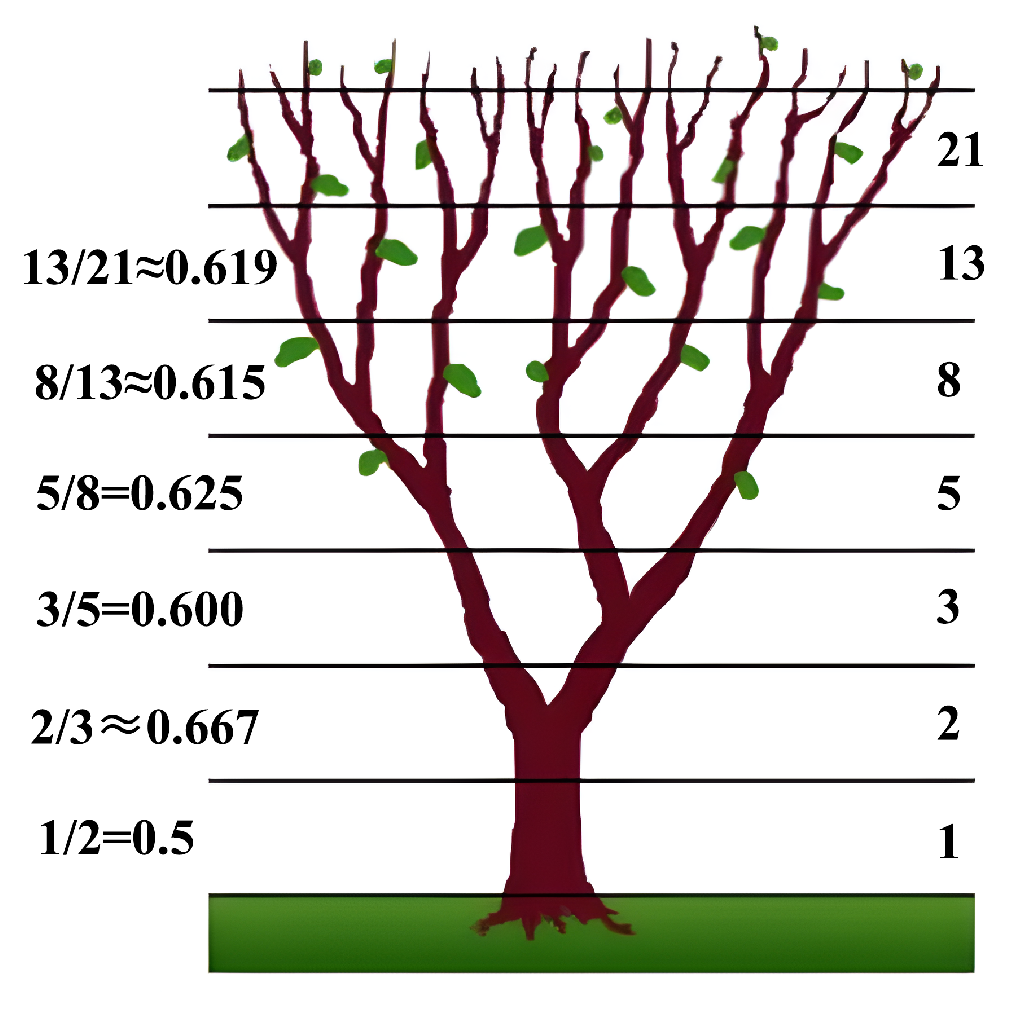
The sequence is characterized by each number being the sum of the two preceding ones, starting with 1 and 2. For instance, the branch of a crop starts from the bottom with 1, followed by 2, 3, 5, etc., as illustrated in Figure 7. This results from natural selection, favoring crop configurations that are structurally stable, wind-resistant, and capable of maximizing sunlight exposure of more leaves. Additionally, the ratio between consecutive Fibonacci Sequence at the end stage of crops approaches the golden ratio (0.618) as the crop grows (see Figure 7). Given the crop structure parameters comply with the golden section, multiplying the canopy volume (Figure 6) by 0.618 will produce a better LAI approximation. Such correction will make the estimated AGB derived from the PAM series models more consistent with the actual situation. However, it should be noted that crops must develop to a late stage before they comply with the Fibonacci Sequence law. This paper determines the peak point of V I 2 · H as a dividing line to apply the Fibonacci Sequence correction through experimental validation and related literature [45,46].

3.3.3. Non-Photosynthesis Area Mask

The PAM-based models estimate the area below the curve of V I 2 · H to estimate AGB. The principle is that VI can be approximated to the net assimilation rate, and V I · H , as described in Section 3.2, serves as a simplified proxy for LAI. Accordingly, the product V I 2 · H describes the total leaf capacity to photosynthesize at VI at a given time. As a result, any value of VI can contribute to the AGB estimate once V I 2 · H is not 0, inevitably leading to potential estimation inaccuracies.
More specifically, for NDVI, many studies point out that bare soil results in low values (e.g., 0.1), and sparse vegetation such as shrubs and grasslands or senescing crops often fall around 0.45 (values ranging from 0.2 to 0.5) [33,47]. As a result, areas with exposed soil during early growth stages and with withered leaves near harvest will be incorrectly treated as photosynthetically active ( V I 2 · H is not 0), leading to overestimation. This issue is further exacerbated in late stages when crop height are typically high, amplifying the overestimation effect.
To mitigate this error, a non-photosynthetic area (NPA) mask is applied based on [48], retaining only pixels identified as photosynthetically active canopy:
NPA = ( green blue ) · ( green red ) > 0 AND NDVI > 0.5
This masking operation combines spectral differences, such as ( green blue ) and ( green red ) , with a threshold on NDVI to exclude pixels likely dominated by soil, dry vegetation, or shadows [49].
It is worth noting that the effectiveness of this masking approach may be reduced when applied to coarse-resolution imagery, as sub-pixel heterogeneity can limit the accurate identification of non-photosynthetic components.
To numerically evaluate and compare the performance of the model, 70% of the in-situ AGB measurements were used for validation. Three evaluation metrics were employed: the coefficient of determination ( R 2 ), the root mean square error (RMSE), and the relative root mean square error (rRMSE) [28]. The closer R 2 to 1 and the smaller RMSE and rRMSE, the better the model’s accuracy in predicting AGB.

4. Results

4.1. Soybean AGB Result from PAM, SPAM, and IPAM

Before analyzing the AGB results, the accuracy of L A I estimation derived from Equation (3) in the PAM series was assessed with and without the application of the Fibonacci sequence (FS) correction. Results showed that the FS-corrected L A I exhibited improved performance, with the ( R 2 ) increasing by 0.19 and the RMSE decreasing by 0.36. Furthermore, the overestimation was substantially reduced from 0.56 to 0.04, indicating that the FS-based correction can enhance the accuracy of crop parameter estimation.
Based on 30% of the in situ AGB samples and their corresponding integrated values derived from eight different optical VIs, the average proportional coefficient in Equation (6) was determined to be 36 for soybean. Using this coefficient, the three models were applied to estimate AGB. The results show that, with multispectral data, IPAM consistently outperforms both PAM and SPAM in terms of estimation accuracy.
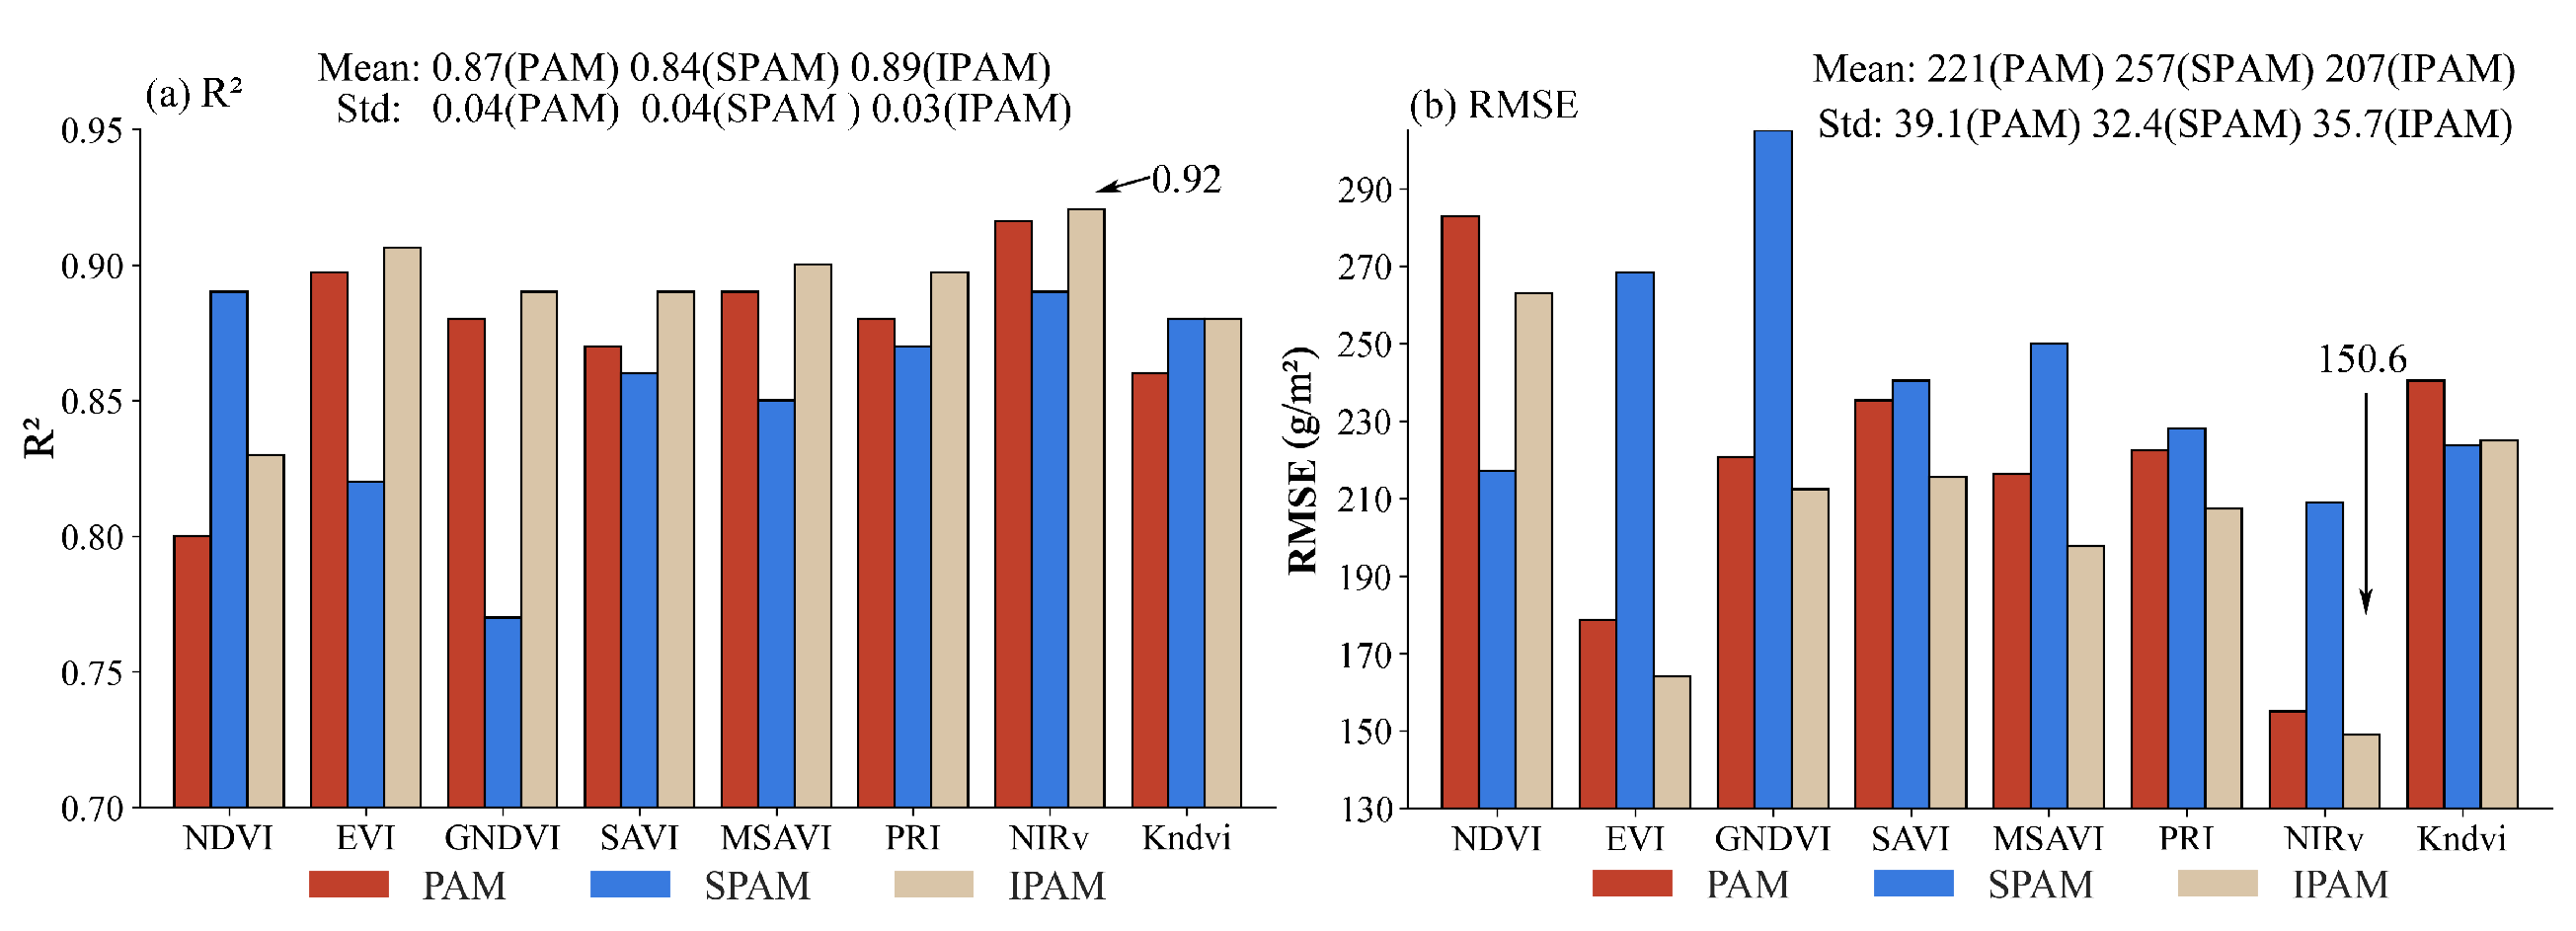
Figure 8a and Figure 8b are the statistical results of R 2 and RMSE, respectively. Figure 8a reveals that the R 2 values for the AGB estimations of the three models are positive across all indices, with mean values of 0.87 and 0.84 for PAM and SPAM, which are lower than that of 0.89 for IPAM. Similarly, the RMSE statistics (Figure 8b) mirror this ranking of model performance. The mean value of the RMSE for IPAM is 207 g/m2, which is lower than that of 221 g/m2 and 257 g/m2 for PAM and SPAM. In particular, NIRv demonstrates the most accurate estimation results for PAM and IPAM, particularly for IPAM, with an R 2 of 0.92 and an RMSE of 150.6 g/m2. It is worth noting that although NDVI is theoretically linked to chlorophyll content and net assimilation rate, its practical performance is often limited by saturation effects, nonlinear responses, and background sensitivity [39]. These limitations may explain why NDVI-based models exhibit higher RMSE values compared to NIRv and Kndvi, which are specifically designed to mitigate such issues.
The NIRv estimation results for SPAM are less accurate. To specifically analyze the reasons behind this disparity, the scatter plots shown in Figure 9 illustrate the NIRv estimation results for the three models.
From Figure 9, the estimated AGB of PAM and IPAM is distributed around the 1:1 fitting line, with only a small offset, indicative of slight overestimations or underestimations. However, most AGB estimates from SPAM during the later growth stages are significantly overestimated. This discrepancy arises from SPAM’s approach, which estimates AGB by calculating the area of triangles or polygons depending on whether they are before or after the peak point (see Figure 5b). Given that the curve of V I 2 · H will exhibit an upward trend before the peak point, the areas of these geometric shapes tend to exceed those delineated by the corresponding curves and the X-axis, leading to an overestimation of AGB. Further examination of Figure 9 reveals that the main differences between the scatter plots of PAM and IPAM are concentrated around the black rectangles. The average error of the data covered in this area is 236 g/m2 for PAM and 197 g/m2 for IPAM, indicating a 39 g/m2 reduction. Meanwhile, the overestimation phenomenon in PAM is reduced, with statistical analysis of IPAM showing an approximately 26 g/m2 reduction for NIRv. Across different VIs, the overestimation errors have decreased within a 14–42 g/m2 range. This observation aligns with the analysis in the Methods Section, demonstrating the necessity of non-photosynthetic areas and Fibonacci sequence corrections for the PAM-based model to improve the accuracy, particularly in the late-stage AGB estimation of crops.

4.2. Cotton AGB Results from PAM, SPAM, and IPAM

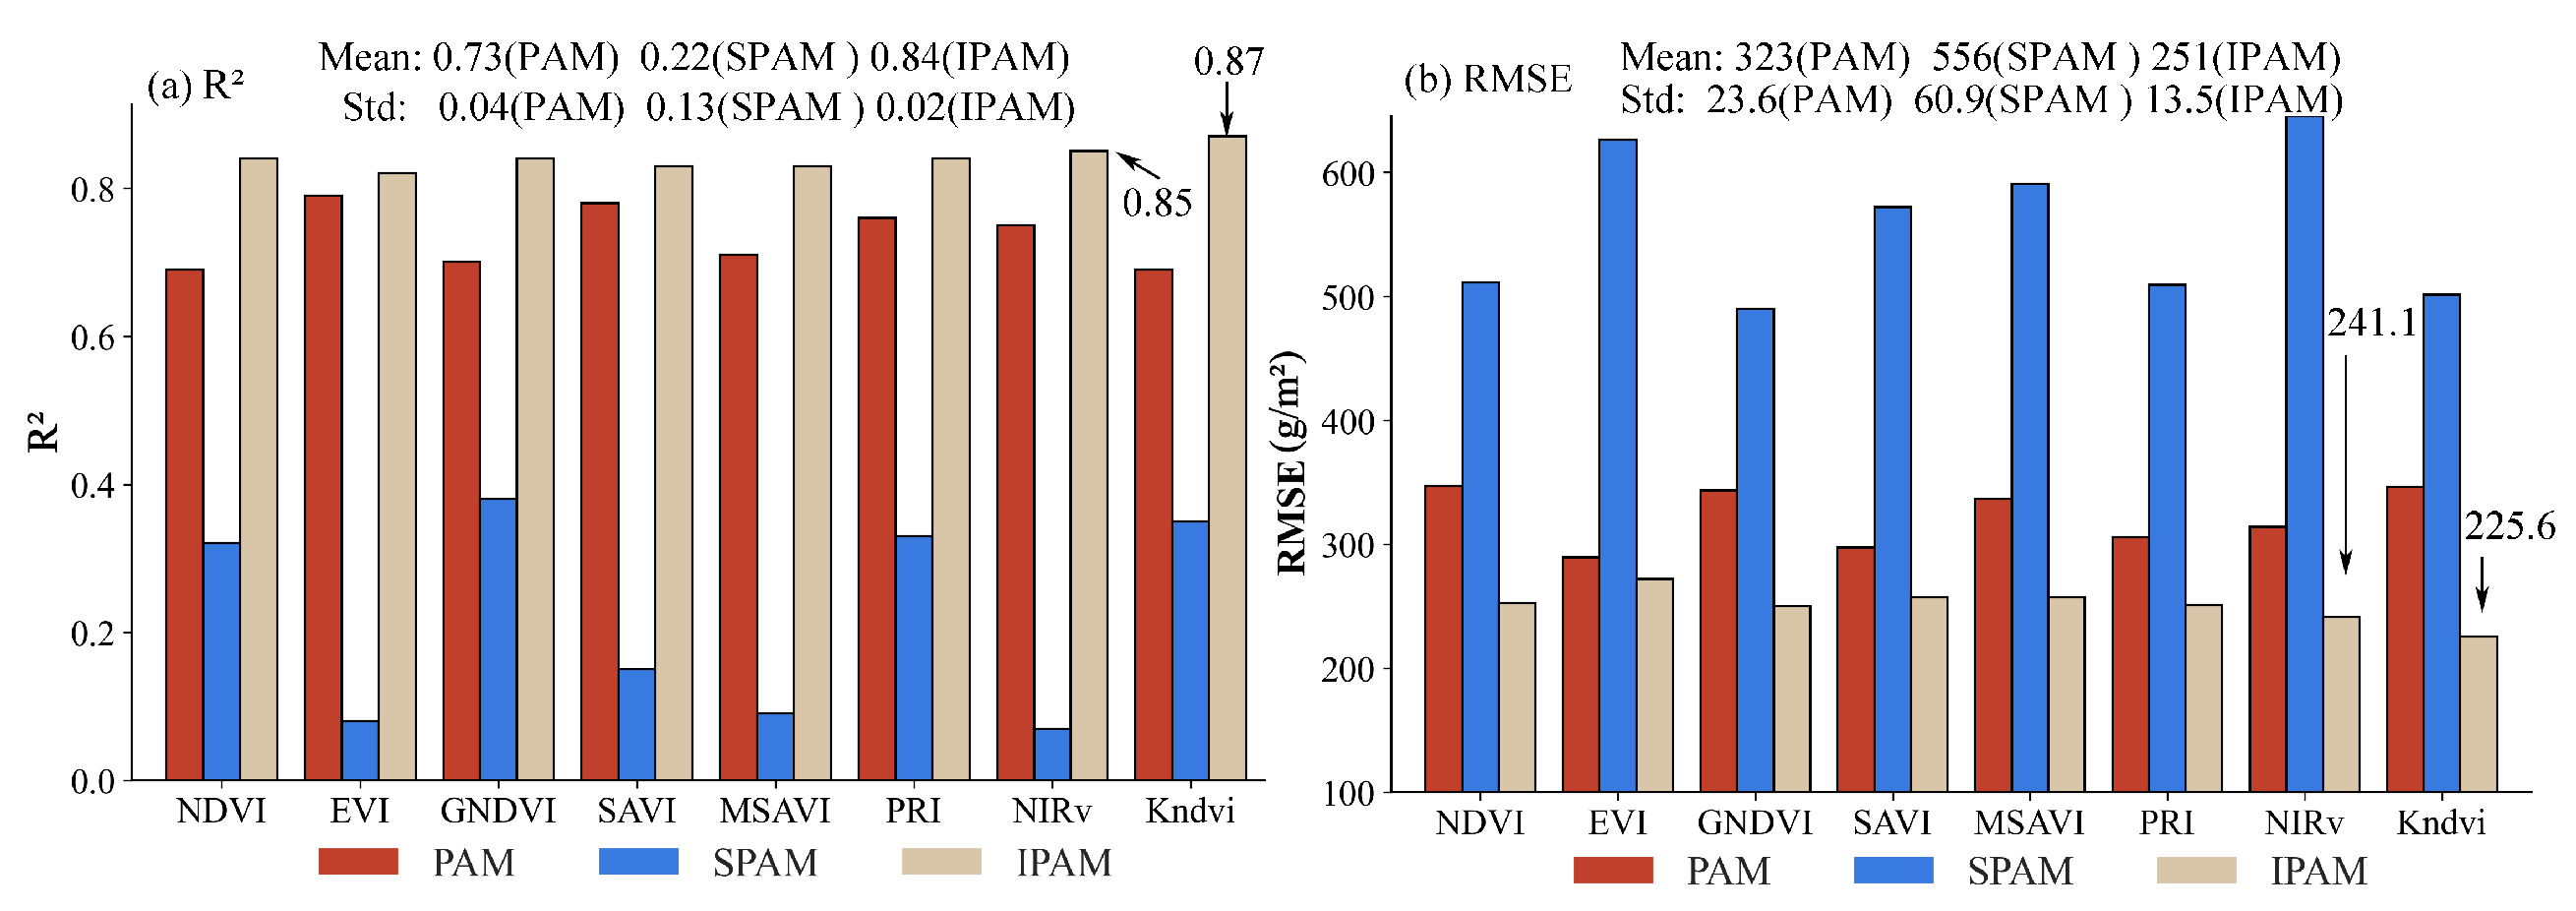
Using Sentinel-2 data, the average proportional coefficient in Equation (6) was determined to be 20 for cotton. The three models were applied to estimate cotton AGB using the eight different VIs, with the results for R 2 and RMSE presented in Figure 10. Notice that IPAM still outperforms the other two models. Specifically, IPAM achieves an average R 2 of 0.84, significantly higher than PAM’s 0.73 and SPAM’s 0.22. The average RMSE for PAM and SPAM are 323 g/m2 and 556 g/m2, respectively, whereas IPAM shows a much lower value of 251 g/m2, with a smaller standard deviation as well.
Performance discrepancies among the models are more pronounced for cotton AGB than soybean AGB. This is primarily due to the limited availability of Sentinel-2 data caused by cloud cover and low resolution. The lack of data during the real cotton peak point results in worse AGB estimates with SPAM. In contrast, PAM and IPAM, which use more data, are less dependent on the data acquisition dates, resulting in a smaller decline in the estimation accuracy. Both R 2 and RMSE indicate that AGB estimates derived from Kndvi and NIRv are the two best-performing VIs, with Kndvi being the best. To further illustrate the differences in Kndvi’s performance across models, scatter plots have been created for comparison (Figure 11).
Figure 11 shows that SPAM performs poorly in estimating AGB, with an R 2 of only 0.35 and an RMSE as high as 501.3 g/m2. This issue is particularly evident in the later stages of crop growth, where estimation errors range between 800 g/m2 and 1000 g/m2, primarily because of missing data during the real peak point. PAM exhibits a noticeable overestimation of AGB, resulting in an R 2 of 0.70 and an RMSE of 343.7 g/m2. However, with the correction of the Fibonacci sequence and a non-photosynthetic mask in IPAM, the model achieves an R 2 of 0.87 and an RMSE of 225.6 g/m2, with a significant error reduction. Within the black rectangles in Figure 11, the average error decreases from 364.3 g/m2 for PAM to 218.6 g/m2 for IPAM, while the reduction in overestimation error is more substantial (210 g/m2). Across different VIs, overestimation errors have decreased within the range of 167–272 g/m2.

5. Discussion

5.1. Deviation Analysis of IPAM

IPAM needs VIs, crop height data acquired at different dates, and a proportionality coefficient α to estimate AGB (Equation (6)). The dates for orbital data are tied to the sensor revisit time.
To quantify the overall uncertainty of IPAM, a Monte Carlo simulation first generated an AGB confidence interval driven solely by VIs and height fluctuations. This confidence range was then scaled to reflect the additional influence of proportionality coefficient α variability.
In this simulation, the amplitude fluctuations of input variables were assumed to be proportional to their values, simulating potential variations under realistic conditions. Specifically, each was assumed to follow a normal distribution with a mean of zero and a standard deviation proportional to its actual value. VIs are restricted from 0 to 1 to ensure their physical validity. Crop heights are positive and increase chronologically.
According to [50], V I fluctuations of the retrieved parameters typically range between 10% and 30%, while fluctuations for the measured crop heights are approximately 10%. Therefore, the standard deviation percentages used in the Monte Carlo simulation were set to 20% for VIs and 10% for crop height. The uncertainty range of α was determined based on the coefficient of variation (CV) of multi-year AGB observations. The CV values were computed separately from the datasets provided in [32,51], yielding 18% for soybean and 27% for cotton. The upper and lower bounds of the simulated AGB were multiplied by 1 ± C V to obtain the total uncertainty of IPAM. This strategy accounts for both measurement noise and potential inter-annual variation in model transferability.
In addition to the simulation, a theoretical error propagation analysis was conducted in this paper. Following the Taylor expansion method [52], the theoretical error of Equation (6) was derived by partial differentiation with respect to V I and H, as shown in Equation (10):
σ f 2 = α 2 · f V I 2 σ V I 2 + f H 2 σ H 2 + 2 · f V I · f H · Cov ( V I , H ) = α 2 · 2 · V I · H 2 σ V I 2 + V I 2 2 σ H 2 + 2 · 2 · H · V I 3 · Cov ( V I , H )
where σ f 2 denotes the variance of Equation (6), while σ V I 2 and σ H 2 are the variances of V I and crop height. The term Cov ( V I , H ) refers to the covariance between V I and H, which reflects the degree of their linear relationship.
Assuming that V I and H have a low correlation, as supported by previous studies [53], Equation (10) can be simplified to Equation (11).
σ AGB α · 4 · V I 2 · H 2 · σ V I 2 + V I 4 · σ H 2 d t α · 4 · V I 2 · H 2 · ( k V I · V I ) 2 + V I 4 · ( k H · H ) 2 d t α · ( 4 · k V I 2 + k H 2 ) · V I 4 · H 2 d t
where σ AGB represents the standard deviation of the theoretically estimated AGB and k V I and k H are proportionality constants defined as σ V I = k V I · V I and σ H = k H · H , respectively.
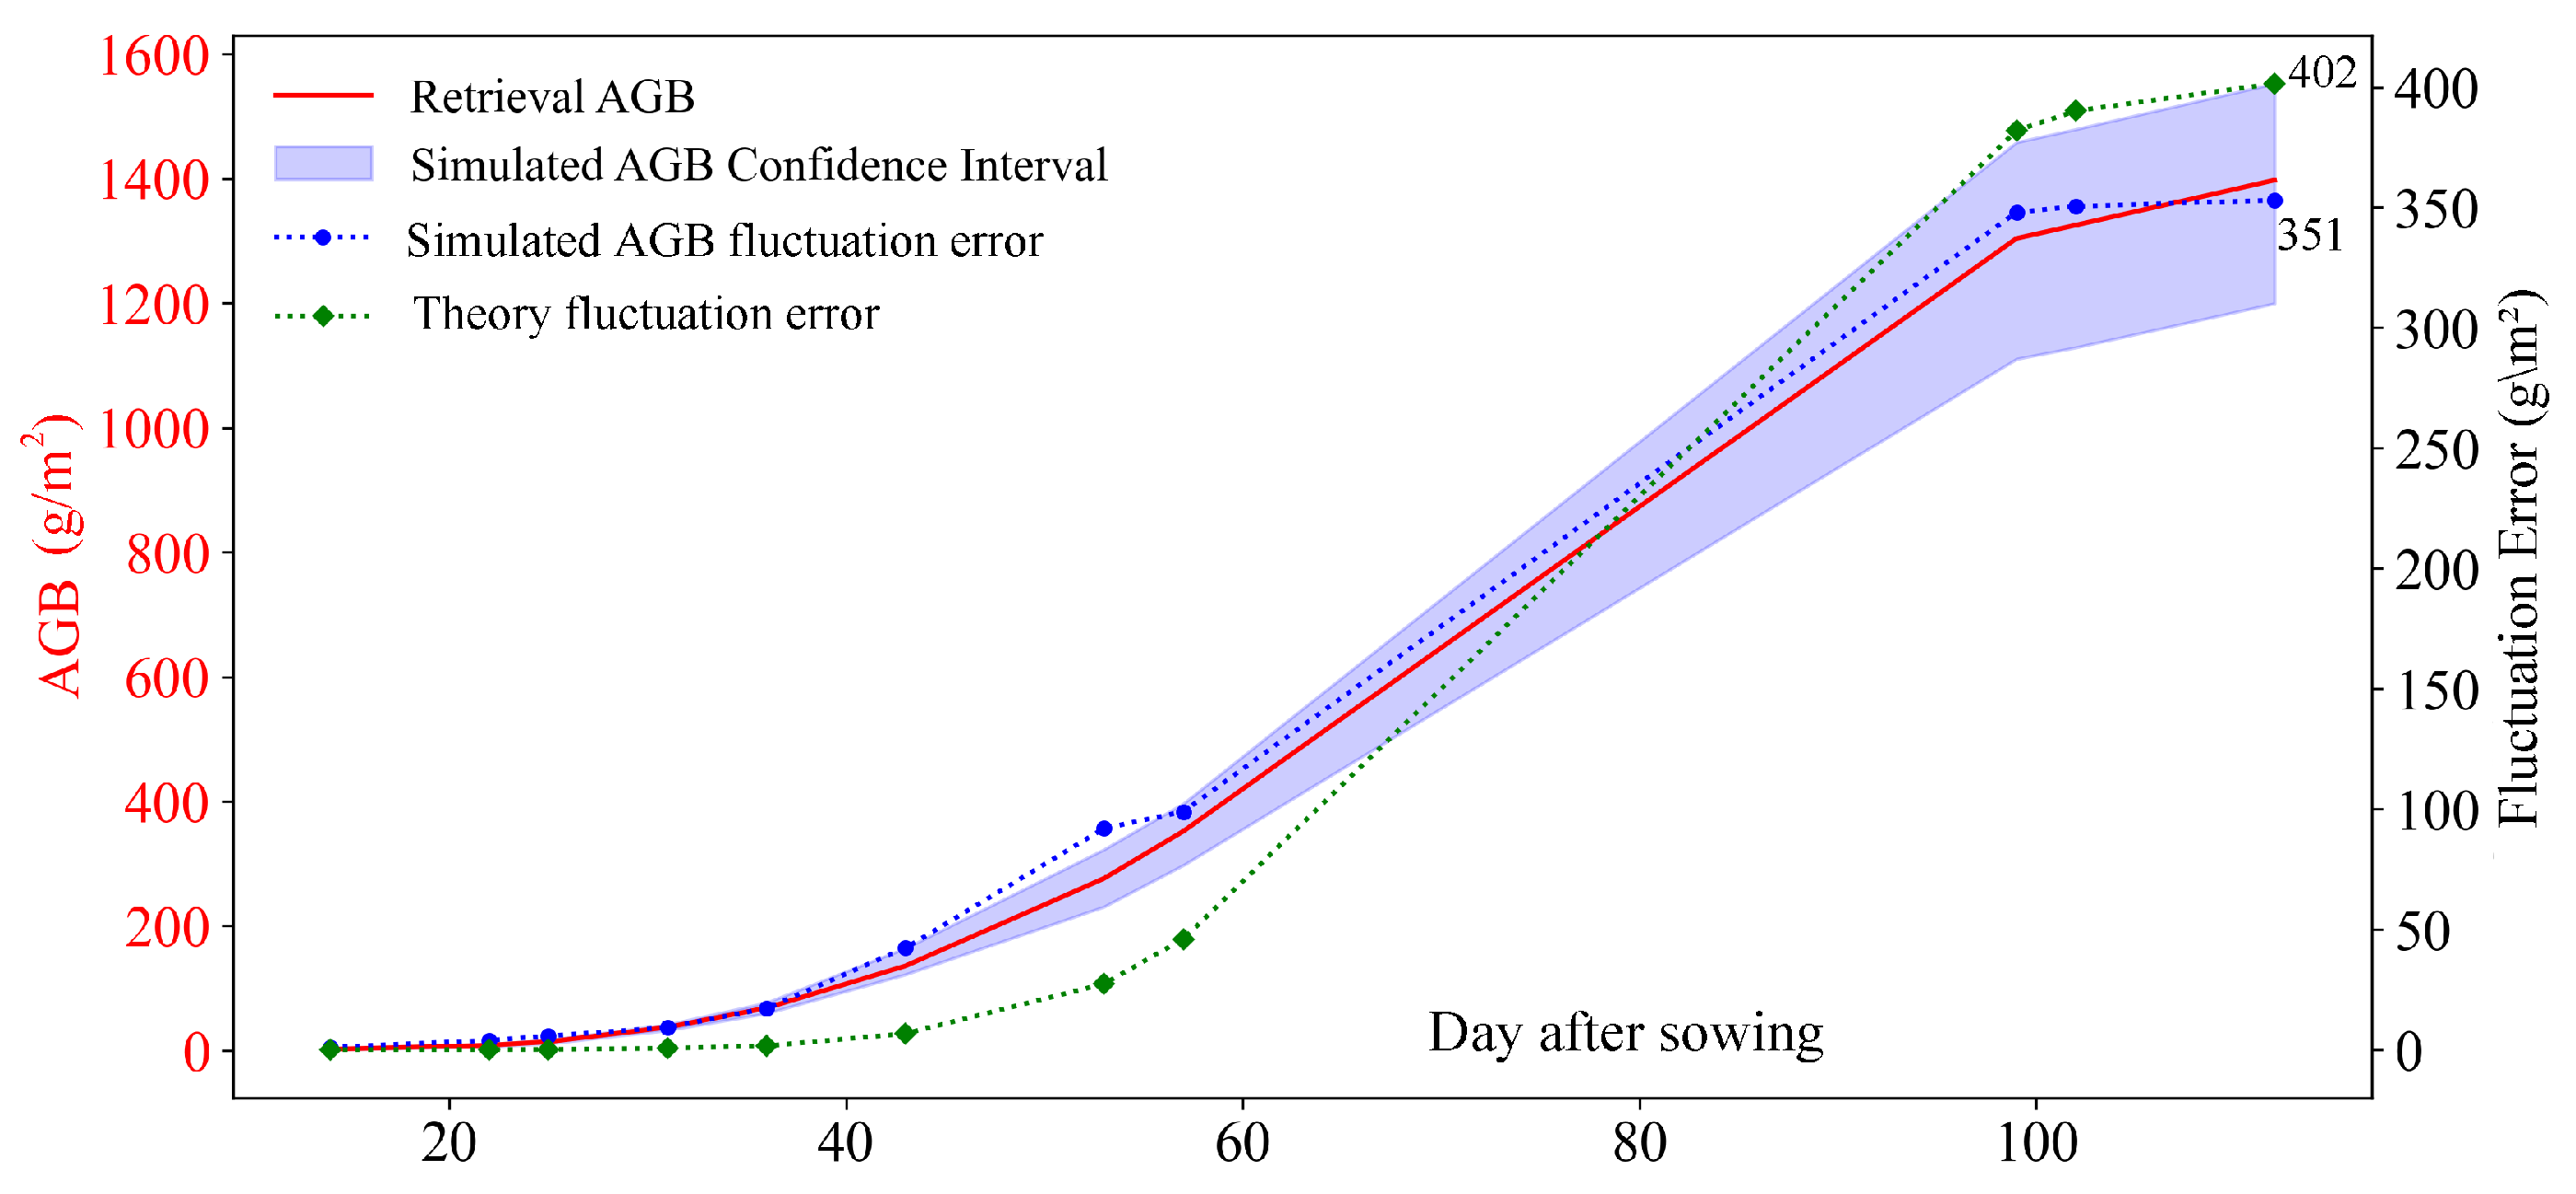
In Figure 12, the soybean AGB derived using real NIRv and height data is depicted by the red curve, while the confidence interval range is calculated from simulated data as the blue dashed line. This range illustrates the potential fluctuation in AGB in response to changes in the variables. The blue and green dashed lines represent the simulated and theoretical fluctuation errors, respectively. Both are expressed as twice the standard deviation, further adjusted by the CV of α . It can be observed that the difference between the simulated and theoretical errors is minimal, with a maximum discrepancy of 51 g/m2. This indicates that the theoretical error formula (Equation (11)) accurately expressed the uncertainty in AGB. The maximum change range in the simulation is 351 g/m2. Notably, fluctuations in AGB are more pronounced in the later stages of crop growth compared to the early stages. This is partly due to the accumulation of integration errors over time and partly due to higher H values at later growth stages, which amplify variations in the simulated H. The same strategy has been used to assess the deviations for cotton, finding maximum fluctuation ranges of 424 g/m2. Dividing the maximum fluctuation value by the respective real maximum AGB, the percentage of deviation relative to real AGB can be calculated, which amounted to approximately 22% and 24% for soybean and cotton, respectively.

5.2. Data Reduction Impact on Model Performance

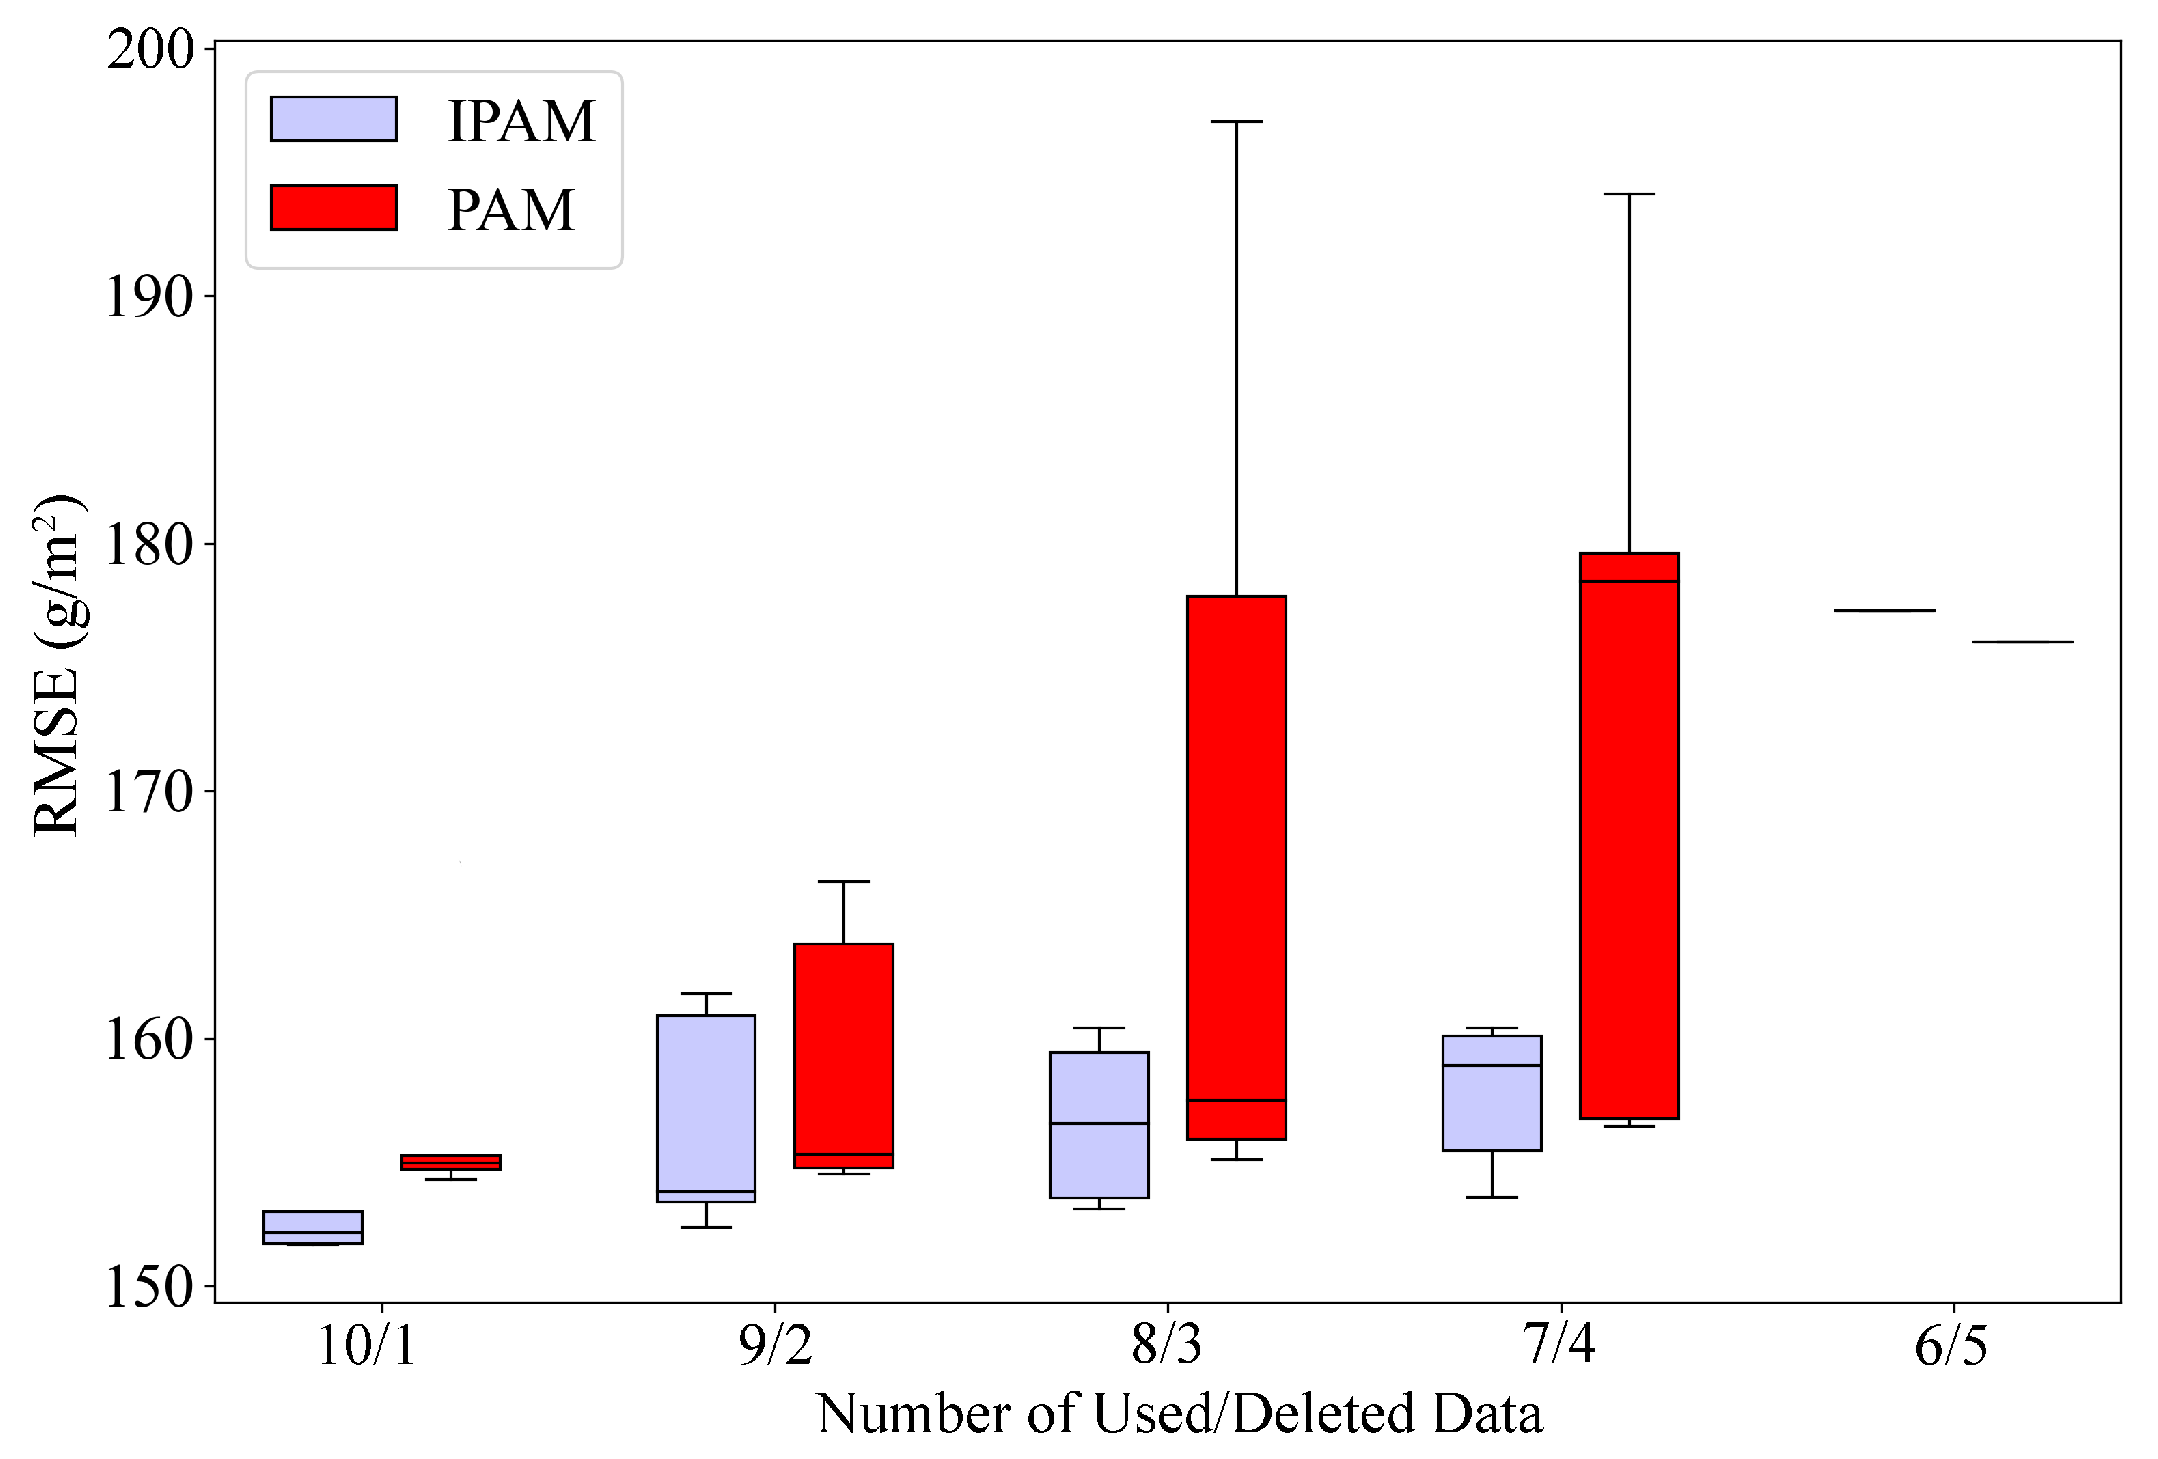
Data quantity and sampling have varying effects on the accuracy of AGB estimation for PAM and IPAM, as discussed in Section 3.3. Given the abundance of additional data available for the soybean crop, this analysis will use this dataset to illustrate the impact of data reduction on the performance of the two models.
For the soybean dataset, plant heights and V I data were available on 11 different days, but AGB measurements were only available on 6 of them (see Table 1). For the 5 days without measured AGB, all possible combinations of removing them (from 1 to 5 data takes) were generated. After each removal, the remaining data were used to estimate AGB, which was then compared with the measured AGB to calculate the RMSE.
Figure 13 presents boxplots that illustrate the data reduction impact on RMSE for PAM and IPAM. The plot reveals that as the amount of data decreases, PAM’s RMSE increases slightly faster than IPAM’s and exhibits much higher variability, especially when three or four data points are removed. Furthermore, IPAM consistently achieves a lower RMSE compared to PAM, indicating that data reduction has a smaller impact on IPAM and highlighting its strong stability. Additional statistical analysis indicated that combinations of missing observations involving later growth stages, where the average plant height was higher, had a stronger negative impact on estimation accuracy. This trend is consistent with the IPAM integration mechanism, which emphasizes the contribution of high V I 2 · H values to cumulative AGB estimation.
SPAM necessitates three specific data takes, acquired around the initial germination time, the AGB estimation period, and the peak point time. It serves as a simplified version of PAM with only three data points, designed to address data-limited scenarios while striving to achieve reasonable results with minimal input. However, data from the real peak point are critically important. To evaluate its impact on AGB estimation, the peak point data for soybean was removed and replaced with data from the closest available time point. This substitution resulted in a significant increase in RMSE of 25.2 g/m2 for SPAM, with errors increasing as the replacement data point moved further away from the peak point. In contrast, the peak point data removal had a much smaller effect on PAM and IPAM, with RMSE increases of only 4.3 g/m2 and 3.0 g/m2, respectively.
The above analysis indicates that IPAM is the least sensitive approach to data quantity reduction and is minimally affected by the absence of imagery from the peak point.

5.3. Feasibility of IPAM for Height-Free and Data-Limited Scenarios

In practice, in situ canopy height measurements are not always available. Their representativeness may be limited across large-scale or heterogeneous agricultural landscapes. To address these limitations, several RS-based approaches have been developed for estimating canopy height without relying on in situ measurements. These include UAV-derived surface models [28], stereophotogrammetry [54], LIDAR [55], and interferometric SAR-based models such as RVoG [56]. Each method offers different trade-offs between spatial resolution, coverage, cost, and sensitivity to crop structure. While this paper does not exhaustively evaluate these techniques, they offer viable alternatives for supporting the implementation of IPAM under varying data conditions.
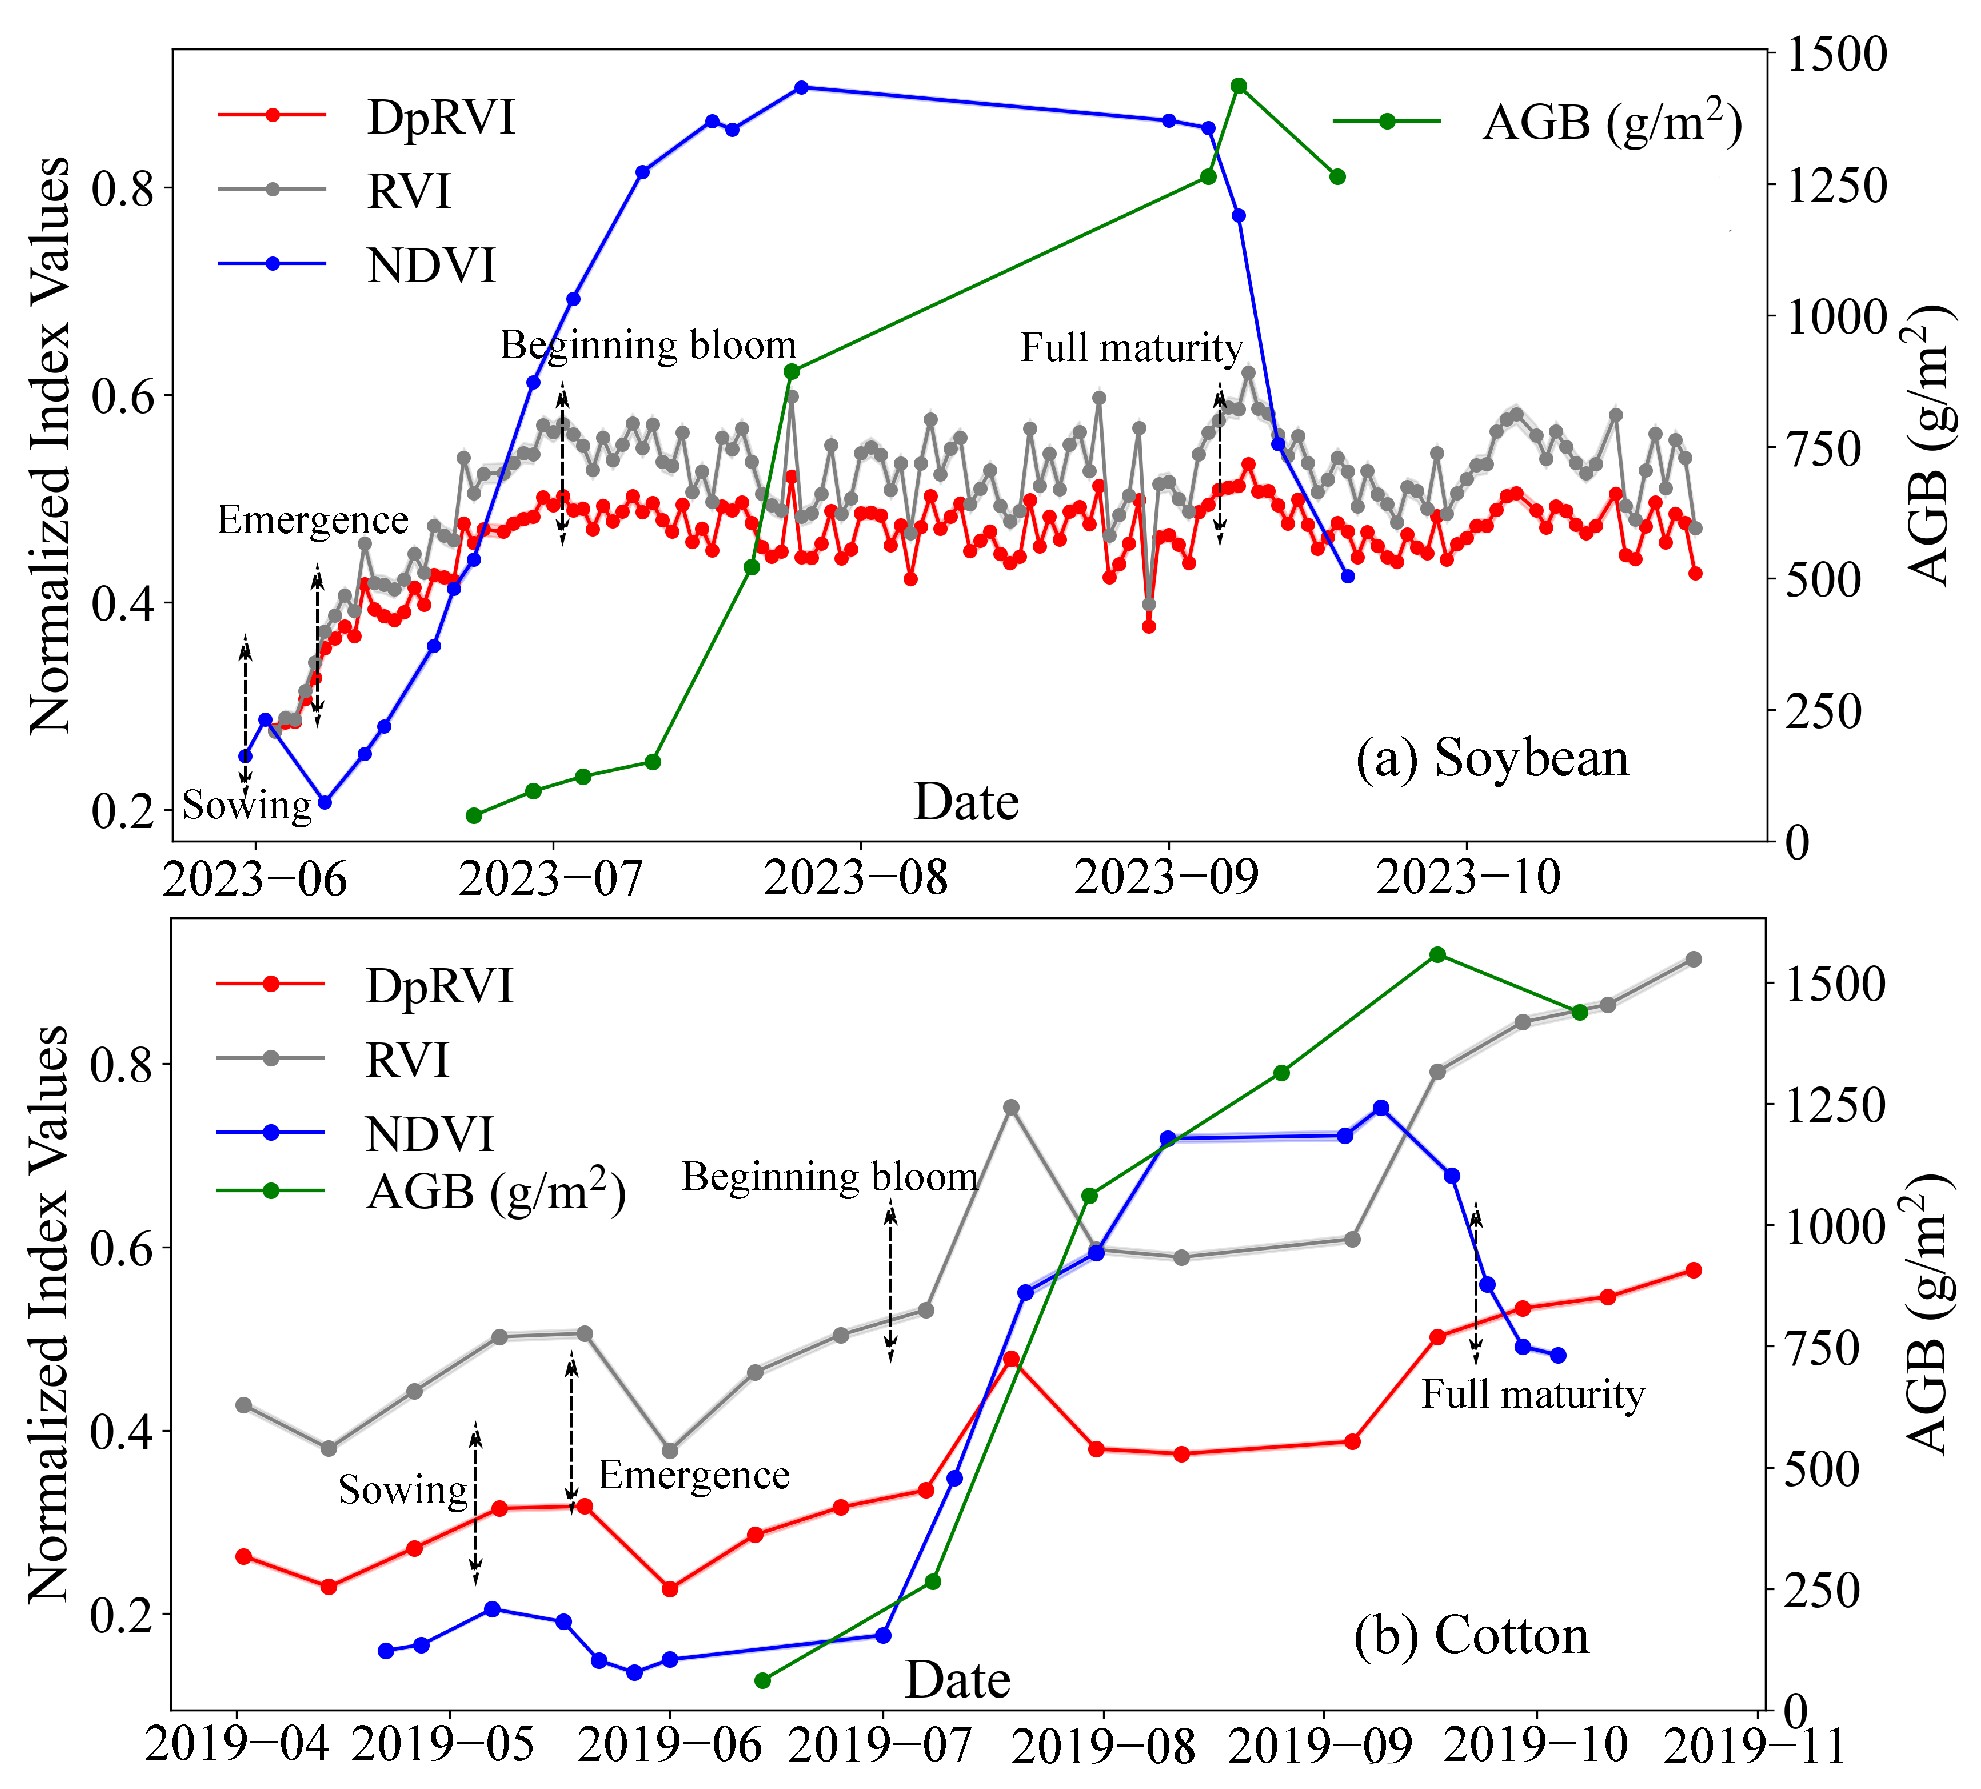
To mitigate data loss caused by the cloud effect in optical imagery, this paper further evaluates the feasibility of incorporating SAR VIs within the IPAM framework by comparing time-series SAR and optical VIs (Figure 14). Two representative SAR VIs are considered, including the widely used Radar Vegetation Index (RVI) [57] and the recently proposed DpRVI [58]. The core principle of SAR VIs is based on the high sensitivity of cross- and co-polarization radar response to crop characteristics. RVI is formulated as 4 q / ( 1 + q ) and DpRVI as q ( q + 3 ) / ( q + 1 ) 2 , where q = σ H V / σ V V denotes the ratio of HV to VV backscattering. For optical VIs, the classical NDVI is selected as a baseline.
Optical VIs have been widely demonstrated to correlate well with photosynthetic efficiency [28]. They typically exhibit a characteristic rise–plateau–decline pattern from emergence to maturity, with only a short period of saturation. These features are also reflected in Figure 14, supporting their biophysical consistency with the photosynthesis-driven principles underlying IPAM.
In contrast, Figure 14 shows that both SAR VIs tend to saturate prematurely and fail to track physiological dynamics during most stages of crop development. Specifically, SAR V I values for both crops gradually increase from emergence to the beginning bloom stage, indicating some capacity to monitor crop status and showing trends similar to those of optical VIs. However, beyond the beginning bloom stage, both SAR VIs exhibit early saturation and do not show the typical decline observed during crop senescence. Although previous studies have reported a certain degree of similarity between SAR and optical VIs [59], the early saturation and weak physiological relevance of SAR VIs show their limited compatibility with the photosynthesis-driven logic of IPAM. Nonetheless, the potential of more advanced SAR VIs, particularly those derived from polarimetric decomposition, remains to be explored within this modeling framework [60,61].
In summary, the implementation of IPAM is recommended with optical VIs as the primary input, while canopy height can be measured or estimated using alternative methods depending on data availability.

6. Conclusions

Based on the Photosynthetic Accumulation Model (PAM) and Simplified PAM (SPAM), an improved PAM (IPAM) was introduced to estimate AGB in this paper. The model incorporates a refined integration method, the Fibonacci sequence, and masking operations of non-photosynthesis areas. By estimating soybean AGB in the experiment field of Barcelona and cotton AGB in Georgia farms, PAM demonstrated strong performance across different crop types. However, IPAM further improved estimation accuracy and effectively mitigated overestimation issues observed in the original models. For soybean, IPAM achieves the best R2/RMSE of 0.92/150.6 g/m2, compared to 0.91/164.8 g/m2 and 0.89/180.2 g/m2 for PAM and SPAM, respectively. For cotton, the best R2/RMSE with IPAM is 0.87/225.6 g/m2, while PAM and SPAM show 0.70/343.7 g/m2 and 0.35/501.34 g/m2, respectively. A comparison of eight different VIs for AGB estimation shows that the innovative NIRv and Kndvi more effectively capture the biological situations of the crop, leading to improved results.
Compared to PAM and SPAM, IPAM is less affected by any reduction in data-taking sampling, demonstrating the stability of the model. Monte Carlo simulations and the theoretical error propagation analyses confirm the error fluctuation range of IPAM. The maximum deviation percentages for the two crops are approximately 20%, which is considered acceptable given the expected inter-annual variation in model transferability. In addition, evaluation of SAR VIs reveals issues of early saturation and weak physiological relevance, suggesting their limited compatibility with IPAM. Therefore, IPAM is best applied when optical data are available, and canopy height information can be obtained either through field measurements or via remote sensing-based height retrieval algorithms, as discussed. Future research should explore the applicability of the Fibonacci sequence correction across different crop types and assess how specific phenological stages influence model accuracy.

Author Contributions

Conceptualization: J.L. (Jinglong Liu), J.J.M. and F.Z.; methodology: J.L. (Jinglong Liu) and J.J.M.; formal analysis: J.L. (Jinglong Liu); investigation: J.J.M., A.A., X.F. and A.B.; resources: A.A. and J.L. (Jordi Llop); data curation: A.A. and J.L. (Jordi Llop); writing—original draft preparation: J.L. (Jinglong Liu); writing—review and editing: J.L. (Jinglong Liu), J.J.M., A.A., X.F., A.B., M.M., F.Z. and Y.W.; visualization: J.L. (Jinglong Liu); supervision: J.J.M. All authors have read and agreed to the published version of the manuscript.

Funding

This work was supported in part by the Spanish Ministry of Science and Innovation (State Agency of Research, AEI), the European Funds for Regional Development (ERFD) under Project PID 2020-117303GB-C21, in part by the National Natural Science Foundation of China (Grant No. 42474018), in part by the National Key R&D Program of China (Grant No. 2022YFE0102600), and in part by the Construction Program of Space-Air-Ground-Well Cooperative Awareness Spatial Information Project (B20046).

Data Availability Statement

The original contributions presented in this study are included in the article. Further inquiries can be directed to the corresponding author.

Acknowledgments

The authors also express their sincere gratitude to our colleagues and staff from the EEABB school who conducted crop cultivation and verification data measurements in their experimental fields.

Conflicts of Interest

The authors declare no conflicts of interest.

References

  1. Prasad, A.K.; Chai, L.; Singh, R.P.; Kafatos, M. Crop yield estimation model for Iowa using remote sensing and surface parameters. Int. J. Appl. Earth Obs. Geoinf. 2006, 8, 26–33. [Google Scholar] [CrossRef]
  2. Chao, Z.; Liu, N.; Zhang, P.; Ying, T.; Song, K. Estimation methods developing with remote sensing information for energy crop biomass: A comparative review. Biomass Bioenergy 2019, 122, 414–425. [Google Scholar] [CrossRef]
  3. Claverie, M.; Demarez, V.; Duchemin, B.; Hagolle, O.; Ducrot, D.; Marais-Sicre, C.; Dejoux, J.F.; Huc, M.; Keravec, P.; Béziat, P.; et al. Maize and sunflower biomass estimation in southwest France using high spatial and temporal resolution remote sensing data. Remote Sens. Environ. 2012, 124, 844–857. [Google Scholar] [CrossRef]
  4. She, W.; Wu, Y.; Huang, H.; Chen, Z.; Cui, G.; Zheng, H.; Guan, C.; Chen, F. Integrative analysis of carbon structure and carbon sink function for major crop production in China’s typical agriculture regions. J. Clean. Prod. 2017, 162, 702–708. [Google Scholar] [CrossRef]
  5. G. Poley, L.; J. McDermid, G. A systematic review of the factors influencing the estimation of vegetation aboveground biomass using unmanned aerial systems. Remote Sens. 2020, 12, 1052. [Google Scholar] [CrossRef]
  6. Steffen, W.; Richardson, K.; Rockström, J.; Schellnhuber, H.J.; Dube, O.P.; Dutreuil, S.; Lenton, T.M.; Lubchenco, J. The emergence and evolution of Earth System Science. Nat. Rev. Earth Environ. 2020, 1, 54–63. [Google Scholar] [CrossRef]
  7. Sishodia, R.P.; Ray, R.L.; Singh, S.K. Applications of remote sensing in precision agriculture: A review. Remote Sens. 2020, 12, 3136. [Google Scholar] [CrossRef]
  8. Zeng, Y.; Hao, D.; Huete, A.; Dechant, B.; Berry, J.; Chen, J.M.; Joiner, J.; Frankenberg, C.; Bond-Lamberty, B.; Ryu, Y.; et al. Optical vegetation indices for monitoring terrestrial ecosystems globally. Nat. Rev. Earth Environ. 2022, 3, 477–493. [Google Scholar] [CrossRef]
  9. Anderson, G.L.; Hanson, J.D.; Haas, R.H. Evaluating Landsat Thematic Mapper derived vegetation indices for estimating above-ground biomass on semiarid rangelands. Remote Sens. Environ. 1993, 45, 165–175. [Google Scholar] [CrossRef]
  10. Liao, C.; Wang, J.; Dong, T.; Shang, J.; Liu, J.; Song, Y. Using spatio-temporal fusion of Landsat-8 and MODIS data to derive phenology, biomass and yield estimates for corn and soybean. Sci. Total Environ. 2019, 650, 1707–1721. [Google Scholar] [CrossRef] [PubMed]
  11. Yu, Y.; Saatchi, S. Sensitivity of L-band SAR backscatter to aboveground biomass of global forests. Remote Sens. 2016, 8, 522. [Google Scholar] [CrossRef]
  12. Mandal, D.; Kumar, V.; Ratha, D.; Dey, S.; Bhattacharya, A.; Lopez-Sanchez, J.M.; McNairn, H.; Rao, Y.S. Dual polarimetric radar vegetation index for crop growth monitoring using sentinel-1 SAR data. Remote Sens. Environ. 2020, 247, 111954. [Google Scholar] [CrossRef]
  13. Walter, J.D.; Edwards, J.; McDonald, G.; Kuchel, H. Estimating biomass and canopy height with LiDAR for field crop breeding. Front. Plant Sci. 2019, 10, 473161. [Google Scholar] [CrossRef]
  14. Colomina, I.; Molina, P. Unmanned aerial systems for photogrammetry and remote sensing: A review. ISPRS J. Photogramm. Remote Sens. 2014, 92, 79–97. [Google Scholar] [CrossRef]
  15. Anderson, K.E.; Glenn, N.F.; Spaete, L.P.; Shinneman, D.J.; Pilliod, D.S.; Arkle, R.S.; McIlroy, S.K.; Derryberry, D.R. Estimating vegetation biomass and cover across large plots in shrub and grass dominated drylands using terrestrial lidar and machine learning. Ecol. Indic. 2018, 84, 793–802. [Google Scholar] [CrossRef]
  16. Li, N.; Lopez-Sanchez, J.M.; Fu, H.; Zhu, J.; Han, W.; Xie, Q.; Hu, J.; Xie, Y. Rice crop height inversion from TanDEM-X PolInSAR data using the RVoG model combined with the logistic growth equation. Remote Sens. 2022, 14, 5109. [Google Scholar] [CrossRef]
  17. Romero-Puig, N.; Marino, A.; Lopez-Sanchez, J.M. Application of the trace coherence to HH-VV PolInSAR TanDEM-X data for vegetation height estimation. IEEE Trans. Geosci. Remote Sens. 2021, 60, 4404210. [Google Scholar] [CrossRef]
  18. Liu, Y.; Gong, W.; Xing, Y.; Hu, X.; Gong, J. Estimation of the forest stand mean height and aboveground biomass in Northeast China using SAR Sentinel-1B, multispectral Sentinel-2A, and DEM imagery. ISPRS J. Photogramm. Remote Sens. 2019, 151, 277–289. [Google Scholar] [CrossRef]
  19. Ghosh, S.M.; Behera, M.D. Aboveground biomass estimates of tropical mangrove forest using Sentinel-1 SAR coherence data-The superiority of deep learning over a semi-empirical model. Comput. Geosci. 2021, 150, 104737. [Google Scholar] [CrossRef]
  20. Becker-Reshef, I.; Vermote, E.; Lindeman, M.; Justice, C. A generalized regression-based model for forecasting winter wheat yields in Kansas and Ukraine using MODIS data. Remote Sens. Environ. 2010, 114, 1312–1323. [Google Scholar] [CrossRef]
  21. Zhao, K.; Valle, D.; Popescu, S.; Zhang, X.; Mallick, B. Hyperspectral remote sensing of plant biochemistry using Bayesian model averaging with variable and band selection. Remote Sens. Environ. 2013, 132, 102–119. [Google Scholar] [CrossRef]
  22. Chi, D.; Wang, H.; Li, X.; Liu, H.; Li, X. Assessing the effects of grazing on variations of vegetation NPP in the Xilingol Grassland, China, using a grazing pressure index. Ecol. Indic. 2018, 88, 372–383. [Google Scholar] [CrossRef]
  23. Huang, J.; Gómez-Dans, J.L.; Huang, H.; Ma, H.; Wu, Q.; Lewis, P.E.; Liang, S.; Chen, Z.; Xue, J.H.; Wu, Y.; et al. Assimilation of remote sensing into crop growth models: Current status and perspectives. Agric. For. Meteorol. 2019, 276, 107609. [Google Scholar] [CrossRef]
  24. Perry, E.M.; Morse-McNabb, E.M.; Nuttall, J.G.; O’Leary, G.J.; Clark, R. Managing wheat from space: Linking MODIS NDVI and crop models for predicting australian dryland wheat biomass. IEEE J. Sel. Top. Appl. Earth Obs. Remote Sens. 2014, 7, 3724–3731. [Google Scholar] [CrossRef]
  25. Jin, X.; Kumar, L.; Li, Z.; Feng, H.; Xu, X.; Yang, G.; Wang, J. A review of data assimilation of remote sensing and crop models. Eur. J. Agron. 2018, 92, 141–152. [Google Scholar] [CrossRef]
  26. Watson, D. The dependence of net assimilation rate on leaf-area index. Ann. Bot. 1958, 22, 37–54. [Google Scholar] [CrossRef]
  27. Heyneke, E.; Fernie, A.R. Metabolic regulation of photosynthesis. Biochem. Soc. Trans. 2018, 46, 321–328. [Google Scholar] [CrossRef] [PubMed]
  28. Yang, K.; Mo, J.; Luo, S.; Peng, Y.; Fang, S.; Wu, X.; Zhu, R.; Li, Y.; Yuan, N.; Zhou, C.; et al. Estimation of rice aboveground biomass by UAV imagery with photosynthetic accumulation models. Plant Phenomics 2023, 5, 0056. [Google Scholar] [CrossRef]
  29. Aguasca, A.; Broquetas, A.; Biscamps, J.; Fàbregas, X.; Llop, J.; Mallorquí, J.J.; Mas, M.; Palacio, H. Hydrosoil Campaign Final Report. 2021. Available online: https://earth.esa.int/eogateway/documents/d/earth-online/hydrosoil-campaign-final-report-pdf (accessed on 4 August 2025).
  30. Mas, M.; Aguasca, A.; Broquetas, A.; Fàbregas, X.; Mallorquí, J.J.; Llop, J.; Lopez-Sanchez, J.M.; Kubanek, J. Facility for continuous agricultural field monitoring with a GB-PolSAR. IEEE J. Sel. Top. Appl. Earth Obs. Remote Sens. 2024, 17, 11866–11876. [Google Scholar] [CrossRef]
  31. Aguasca, A.; Broquetas, A.; Lopez-Sanchez, J.M.; Fàbregas, X.; Mallorquí, J.J.; Mas, M. Assessment of the impact of long integration time in Geosynchronous SAR imagery of agricultural fields by means of GB-SAR data. IEEE J. Sel. Top. Appl. Earth Obs. Remote Sens. 2023, 17, 1338–1347. [Google Scholar] [CrossRef]
  32. Coffin, A.W.; Cosh, M.H.; Pisarello, K. Two Years of Cotton (Gossypium hirsutum L.) Data from the Georgia Coastal Plain, USA. Sci. Data 2024, 11, 1037. [Google Scholar] [CrossRef] [PubMed]
  33. Carlson, T.N.; Ripley, D.A. On the relation between NDVI, fractional vegetation cover, and leaf area index. Remote Sens. Environ. 1997, 62, 241–252. [Google Scholar] [CrossRef]
  34. Kim, J.; Hogue, T.S. Improving spatial soil moisture representation through integration of AMSR-E and MODIS products. IEEE Trans. Geosci. Remote Sens. 2011, 50, 446–460. [Google Scholar] [CrossRef]
  35. Bannari, A.; Khurshid, K.S.; Staenz, K.; Schwarz, J.W. A comparison of hyperspectral chlorophyll indices for wheat crop chlorophyll content estimation using laboratory reflectance measurements. IEEE Trans. Geosci. Remote Sens. 2007, 45, 3063–3074. [Google Scholar] [CrossRef]
  36. Zhen, Z.; Chen, S.; Qin, W.; Yan, G.; Gastellu-Etchegorry, J.P.; Cao, L.; Murefu, M.; Li, J.; Han, B. Potentials and limits of vegetation indices with brdf signatures for soil-noise resistance and estimation of leaf area index. IEEE Trans. Geosci. Remote Sens. 2020, 58, 5092–5108. [Google Scholar] [CrossRef]
  37. Berni, J.A.; Zarco-Tejada, P.J.; Suárez, L.; Fereres, E. Thermal and narrowband multispectral remote sensing for vegetation monitoring from an unmanned aerial vehicle. IEEE Trans. Geosci. Remote Sens. 2009, 47, 722–738. [Google Scholar] [CrossRef]
  38. Badgley, G.; Field, C.B.; Berry, J.A. Canopy near-infrared reflectance and terrestrial photosynthesis. Sci. Adv. 2017, 3, e1602244. [Google Scholar] [CrossRef]
  39. Camps-Valls, G.; Campos-Taberner, M.; Moreno-Martínez, Á.; Walther, S.; Duveiller, G.; Cescatti, A.; Mahecha, M.D.; Muñoz-Marí, J.; García-Haro, F.J.; Guanter, L.; et al. A unified vegetation index for quantifying the terrestrial biosphere. Sci. Adv. 2021, 7, eabc7447. [Google Scholar] [CrossRef]
  40. Li, D.; Chen, J.M.; Zhang, X.; Yan, Y.; Zhu, J.; Zheng, H.; Zhou, K.; Yao, X.; Tian, Y.; Zhu, Y.; et al. Improved estimation of leaf chlorophyll content of row crops from canopy reflectance spectra through minimizing canopy structural effects and optimizing off-noon observation time. Remote Sens. Environ. 2020, 248, 111985. [Google Scholar] [CrossRef]
  41. Wang, D.; Fahad, S.; Saud, S.; Kamran, M.; Khan, A.; Khan, M.N.; Hammad, H.M.; Nasim, W. Morphological acclimation to agronomic manipulation in leaf dispersion and orientation to promote “Ideotype” breeding: Evidence from 3D visual modeling of “super” rice (Oryza sativa L.). Plant Physiol. Biochem. 2019, 135, 499–510. [Google Scholar] [CrossRef] [PubMed]
  42. Lu, Z.; Deng, L.; Lu, H. An improved LAI estimation method incorporating with growth characteristics of field-grown wheat. Remote Sens. 2022, 14, 4013. [Google Scholar] [CrossRef]
  43. Zhang, J.; Wang, C.; Yang, C.; Xie, T.; Jiang, Z.; Hu, T.; Luo, Z.; Zhou, G.; Xie, J. Assessing the effect of real spatial resolution of in situ UAV multispectral images on seedling rapeseed growth monitoring. Remote Sens. 2020, 12, 1207. [Google Scholar] [CrossRef]
  44. Burden, R.L.; Faires, J.D. Numerical Analysis, 10th ed.; Cengage Learning: Boston, MA, USA, 2015. [Google Scholar]
  45. Thompson, D.W. On Growth and Form, 2nd ed.; Dover Publications: Mineola, NY, USA, 1992; p. 1116. [Google Scholar]
  46. Boman, B.M.; Dinh, T.; Decker, K.; Emerick, B.; Raymond, C.; Schleiniger, G. Why do fibonacci numbers appear in patterns of growth in nature. Fib. Q. 2017, 55, 30–41. [Google Scholar] [CrossRef]
  47. Maselli, F.; Gilabert, M.A.; Conese, C. Integration of high and low resolution NDVI data for monitoring vegetation in Mediterranean environments. Remote Sens. Environ. 1998, 63, 208–218. [Google Scholar] [CrossRef]
  48. Qiao, L.; Gao, D.; Zhao, R.; Tang, W.; An, L.; Li, M.; Sun, H. Improving estimation of LAI dynamic by fusion of morphological and vegetation indices based on UAV imagery. Comput. Electron. Agric. 2022, 192, 106603. [Google Scholar] [CrossRef]
  49. Qiao, L.; Gao, D.; Zhang, J.; Li, M.; Sun, H.; Ma, J. Dynamic influence elimination and chlorophyll content diagnosis of maize using UAV spectral imagery. Remote Sens. 2020, 12, 2650. [Google Scholar] [CrossRef]
  50. Meiyan, S.; Mengyuan, S.; Qizhou, D.; Xiaohong, Y.; Baoguo, L.; Yuntao, M. Estimating the maize above-ground biomass by constructing the tridimensional concept model based on UAV-based digital and multi-spectral images. Field Crop. Res. 2022, 282, 108491. [Google Scholar] [CrossRef]
  51. Gaso, D.V.; de Wit, A.; Berger, A.G.; Kooistra, L. Predicting within-field soybean yield variability by coupling Sentinel-2 leaf area index with a crop growth model. Agric. For. Meteorol. 2021, 308, 108553. [Google Scholar] [CrossRef]
  52. Heuvelink, G.B.; Burrough, P.A.; Stein, A. Propagation of errors in spatial modelling with GIS. Int. J. Geogr. Inf. Syst. 1989, 3, 303–322. [Google Scholar] [CrossRef]
  53. Xie, T.; Li, J.; Yang, C.; Jiang, Z.; Chen, Y.; Guo, L.; Zhang, J. Crop height estimation based on UAV images: Methods, errors, and strategies. Comput. Electron. Agric. 2021, 185, 106155. [Google Scholar] [CrossRef]
  54. Fei, S.; Xiao, S.; Li, Q.; Shu, M.; Zhai, W.; Xiao, Y.; Chen, Z.; Yu, H.; Ma, Y. Enhancing leaf area index and biomass estimation in maize with feature augmentation from unmanned aerial vehicle-based nadir and cross-circling oblique photography. Comput. Electron. Agric. 2023, 215, 108462. [Google Scholar] [CrossRef]
  55. Zhang, L.; Grift, T.E. A LIDAR-based crop height measurement system for Miscanthus giganteus. Comput. Electron. Agric. 2012, 85, 70–76. [Google Scholar] [CrossRef]
  56. Lopez-Sanchez, J.M.; Vicente-Guijalba, F.; Erten, E.; Campos-Taberner, M.; Garcia-Haro, F.J. Retrieval of vegetation height in rice fields using polarimetric SAR interferometry with TanDEM-X data. Remote Sens. Environ. 2017, 192, 30–44. [Google Scholar] [CrossRef]
  57. Trudel, M.; Charbonneau, F.; Leconte, R. Using RADARSAT-2 polarimetric and ENVISAT-ASAR dual-polarization data for estimating soil moisture over agricultural fields. Can. J. Remote Sens. 2012, 38, 514–527. [Google Scholar]
  58. Bhogapurapu, N.; Dey, S.; Mandal, D.; Bhattacharya, A.; Karthikeyan, L.; McNairn, H.; Rao, Y. Soil moisture retrieval over croplands using dual-pol L-band GRD SAR data. Remote Sens. Environ. 2022, 271, 112900. [Google Scholar] [CrossRef]
  59. Gonenc, A.; Ozerdem, M.S.; Acar, E. Comparison of NDVI and RVI vegetation indices using satellite images. In Proceedings of the 2019 8th International Conference on Agro-Geoinformatics (Agro-Geoinformatics), Istanbul, Turkey, 16–19 July 2019; IEEE: Piscataway, NJ, USA, 2019; pp. 1–4. [Google Scholar]
  60. Mandal, D.; Kumar, V.; Ratha, D.; Lopez-Sanchez, J.M.; Bhattacharya, A.; McNairn, H.; Rao, Y.S.; Ramana, K. Assessment of rice growth conditions in a semi-arid region of India using the Generalized Radar Vegetation Index derived from RADARSAT-2 polarimetric SAR data. Remote Sens. Environ. 2020, 237, 111561. [Google Scholar] [CrossRef]
  61. Hu, X.; Li, L.; Huang, J.; Zeng, Y.; Zhang, S.; Su, Y.; Hong, Y.; Hong, Z. Radar vegetation indices for monitoring surface vegetation: Developments, challenges, and trends. Sci. Total Environ. 2024, 945, 173974. [Google Scholar] [CrossRef]
Figure 1. Study area, regional sampling, and instruments. Red points indicate control points used for geometric transformation. (a) Overview of the soybean field and (b) field division into different sections for ancillary data sampling. FR and NR stand for Far Range and Near Range relative to the EEABB building. (c) Picture of the multispectral camera used in the soybean campaign. (d) Reflectance panel. (e) The camera holder.
Remotesensing 17 02736 g001
Figure 2. Workflow of multispectral image preprocessing and orthorectification.
Remotesensing 17 02736 g002
Figure 3. Visual comparison of the image before and after orthorectification.
Remotesensing 17 02736 g003
Figure 4. (a) Map showing the location of the two experiment farms near Tifton, Georgia, USA. (b) Sampling places of Ty Ty Cooperator Farm in 2019. (c) Image of a cotton plant from the farm.
Remotesensing 17 02736 g004
Figure 5. Examples of PAM-series cumulative values used for AGB modeling. The red line shows the VI2 · H curve derived from NDVI of soybean. (a) PAM numerically integrates the curve to obtain cumulative values. The unfilled data points represent interpolated measured data. (b) SPAM calculates the area of triangles before the peak point, e.g., the blue triangle represents the cumulative value of the fourth image, and calculates the area of quadrangles after the peak point, e.g., the green quadrangle corresponds to the results of the 10th image. The peak point is defined as the time at which the V I 2 · H curve reaches its maximum.
Remotesensing 17 02736 g005
Figure 6. Geometric diagram of crop volume calculation. Plant pictures from https://es.dreamstime.com, accessed on 1 June 2025.
Remotesensing 17 02736 g006
Figure 7. Fibonacci Sequence and the golden section in crop branches. Plant picture from https://kobaweb.ei.st.gunma-u.ac.jp/news/pdf/2018/Number20181006pm4.pdf (accessed on 4 August 2025).
Remotesensing 17 02736 g007
Figure 8. R 2 (a) and RMSE (b) histogram comparison chart for three models for soybean for 8 different VIs.
Remotesensing 17 02736 g008
Figure 9. AGB scatter plot of NIRv for soybean based on the three models. (a) PAM, (b) SPAM, and (c) IPAM.
Remotesensing 17 02736 g009
Figure 10. R 2 (a) and RMSE (b) histogram comparison chart for three models for cotton for 8 different VIs.
Remotesensing 17 02736 g010
Figure 11. AGB scatter plot of Kndvi for cotton based on the three models. (a) PAM, (b) SPAM, and (c) IPAM.
Remotesensing 17 02736 g011
Figure 12. Soybean deviation analysis of simulated and theoretical AGB. The red curve represents AGB derived using real NIRv and height data. The blue and green dashed lines show the simulated and theoretical fluctuation errors, respectively. Both are expressed as twice the standard deviation, further adjusted by the CV of α . Dashed lines correspond to the right Y-axis, while others refer to the left Y-axis.
Remotesensing 17 02736 g012
Figure 13. Impact of data quantity on AGB estimation of soybean. The X-axis represents the number of data points used/removed. Since removing five data points results in only a single RMSE value, there are no quartile lines in the boxplot.
Remotesensing 17 02736 g013
Figure 14. Comparison of time-series SAR and optical VIs for soybean and cotton. (a) Shows SAR VIs for soybean retrieved from daily ground-based fully polarimetric C-band SAR data [30]. (b) Shows SAR VIs for cotton obtained from Sentinel-1 data [58]. All index values have been normalized to the range of 0–1.
Remotesensing 17 02736 g014
Table 1. Data collection summary for each crop. Acquisition times are defined as days after sowing. MS data are multispectral data.
TimeType of CropDataData Acquisition Time
30 May 2023–September 2023SoybeanMS Data14, 22, 25, 31, 36, 43, 49, 53, 58, 99, 102, 112
Height14, 16, 22, 25, 31, 36, 43, 49, 53, 57, 60, 99, 102, 112
LAI16, 25, 31, 46, 53, 60, 102, 112
AGB25, 31, 43, 46, 60, 99, 102, 112
13 May 2019–October 2019CottonSentinel 2 Data34, 59, 79, 109, 129, 149
AGB, Height32, 56, 78, 105, 127, 147
Table 2. Vegetation indices and their formulas.
VIsFormula
NDVI nir red nir + red
EVI 2.5 × ( nir red ) nir + 6 × red 7.5 × blue + 1
GNDVI nir green green + nir
SAVI ( nir red ) × 1.5 nir + red + 0.5
MSAVI 0.5 × ( 2 × nir + 1 ( 2 × nir + 1 ) 2 8 × ( nir red ) )
PRI red _ edge red red _ edge + red
NIRv ( ndvi 0.08 ) × nir
Kndvi tanh ( ( nir red nir + red ) 2 )
Disclaimer/Publisher’s Note: The statements, opinions and data contained in all publications are solely those of the individual author(s) and contributor(s) and not of MDPI and/or the editor(s). MDPI and/or the editor(s) disclaim responsibility for any injury to people or property resulting from any ideas, methods, instructions or products referred to in the content.