Abstract
Synthetic aperture radar (SAR) images suffer from speckle noise due to their imaging mechanism, which deteriorates image interpretability and hinders subsequent tasks like target detection and recognition. Traditional denoising methods fall short of the demands for high-quality SAR image processing, and deep learning approaches trained on synthetic datasets exhibit poor generalization because noise-free real SAR images are unattainable. To solve this problem and improve the quality of SAR images, a speckle noise suppression method based on subaperture decomposition and non-local low-rank tensor approximation is proposed. Subaperture decomposition yields azimuth-frame subimages with high global structural similarity, which are modeled as low-rank and formed into a 3D tensor. The tensor is decomposed to derive a low-dimensional orthogonal basis and low-rank representation, followed by non-local denoising and iterative regularization in the low-rank subspace for data reconstruction. Experiments on simulated and real SAR images demonstrate that the proposed method outperforms state-of-the-art techniques in speckle suppression, significantly improving SAR image quality.
1. Introduction
Synthetic aperture radar (SAR) is an all-day and all-weather imaging system, unaffected by factors like weather and clouds. It sends signals to the ground and obtains the target’s scattering information from the echoes. SAR employs electromagnetic waves which, unlike visible light, have stronger penetration and are less affected by atmospheric scattering. This enables target observation in various weather and lighting conditions. This property endows SAR with extensive application potential in multiple fields, including military reconnaissance, civilian detection, environmental monitoring, and geological mapping. Nevertheless, due to the special coherent imaging mechanism, SAR images are plagued by speckle noise. Unlike the Gaussian additive noise in optical images, speckle noise is multiplicative. It significantly reduces the interpretability of the images and impacts subsequent processing tasks such as SAR image registration, target detection, and recognition [1,2]. The core challenge of SAR despeckling stems from the inherent trade-off between noise suppression and feature preservation: over-aggressive denoising tends to blur critical structural details, ultimately compromising the reliability of downstream applications. Hence, developing a method that can effectively balance speckle suppression and structural detail preservation is crucial for truly improving the practical value of SAR images.
In recent years, researchers worldwide have conducted extensive studies on speckle noise suppression in SAR images [3,4,5,6,7]. The main denoising methods can be categorized into four types: spatial-domain filtering methods, transform-domain filtering methods, non-local optimization-based denoising methods, and data-driven deep learning methods.
Spatial-domain filtering methods, such as the Lee filter, Kuan filter, and Frost filter [8,9,10], are founded on the speckle noise model. They utilize the spatial correlation among pixels in the filtering window and perform adaptive filtering based on the minimum mean-square-error criterion. Nevertheless, for image regions with abundant texture details that deviate from the statistical model, such methods may cause significant information loss. Consequently, researchers turned to transform-domain filtering methods, which leverage the spectral characteristics of signals for denoising. Transform-domain filtering methods like wavelet transform can effectively eliminate high-frequency noise. However, they may introduce the false Gibbs effect due to the loss of high-dimensional features [11,12,13]. Currently, scholars have also achieved promising results in denoising methods based on non-local optimization models [14]. The non-local methods suppress noise by exploiting the similarity between image patches. They fully utilize the statistical properties of the entire image, estimating the actual value through the weighted combination of similar patches. Representative algorithms include the Probabilistic Patch-Based algorithm (PPB) and the SAR block-matching 3D algorithm (SAR-BM3D) [15,16]. Notably, these methods are highly sensitive to the size of the search window and pixel blocks. Moreover, in the presence of severe noise, the denoising performance deteriorates. Through training, data-driven deep learning methods can learn complex image features that are difficult to model mathematically [17]. In the context of suppressing speckle noise in SAR images, several relevant studies have been conducted. Most of these methods use image datasets composed of a large number of paired noisy and noise-free images for learning and training, such as ID-CNN [18], MONet [19], and SAR-CAM [20]. Such methods can achieve high-quality denoising results. However, since they rely on synthetic data, significant feature disparities exist between the synthetic noisy images and real SAR images, thus compromising their generalization ability. Overall, data-driven deep learning methods have demonstrated great potential in SAR image denoising. Nevertheless, continuous research is required to overcome their limitations in terms of generalization, long training time, and data demands [21,22,23,24,25].
In this paper, we propose a method based on subaperture decomposition and non-local low-rank tensor approximation to suppress speckle noise in SAR images. Firstly, based on the imaging mechanism of SAR images, several subaperture images with extremely high similarity to the original image are obtained through subaperture decomposition. The original image and its subaperture counterparts are stacked into a 3D tensor to exploit their structural similarity. Considering the global low-rank property shared by the subaperture images and the original image, the three-dimensional tensor is decomposed into a low-dimensional orthogonal basis and the reduced image tensor. The reduced image tensor is introduced into the non-local means filtering framework for block matching, obtaining several similar tensor groups. Non-local similarity regularization is applied to the tensor groups, achieving simultaneous noise reduction and feature preservation. The denoised tensor groups are recombined with the low-dimensional orthogonal basis to acquire the denoised SAR image. Through continuous iteration, the final denoised image is obtained. By fully exploiting global image similarity, the proposed method enables accurate estimation of target pixel values, effectively suppressing speckle noise while preserving structural features such as edges and textures. The main novelties and contributions are summarized as follows:
- (1)
- We introduce a novel speckle suppression paradigm that utilizes subaperture images as auxiliary information to perform denoising on full-aperture images. Unlike conventional multi-look processing that inherently trades resolution for noise reduction, the proposed method preserves high-resolution details by constructing a coherent denoising basis through optimized subaperture decomposition.
- (2)
- A non-local low-rank tensor approximation algorithm is developed, incorporating 3D similarity modeling, non-local denoising regularization, and edge-preserving regularization. This multi-constrained optimization approach strikes a balance between reducing speckle noise and maintaining the integrity of structural details.
- (3)
- The proposed method demonstrates consistent superiority across both simulated and real data. Comprehensive evaluations demonstrate enhanced performance across key metrics. Experiments on simulated data show improved structural fidelity and noise suppression (quantified by the structural similarity index, SSIM, and peak signal-to-noise ratio, PSNR), while real-data validations achieve superior equivalent number of looks (ENL) performance with well-preserved edge integrity. The proposed method consistently outperforms other advanced techniques.
The structure of this paper is as follows: Section 2 introduces the related research work. Section 3 elaborates on the proposed denoising method in detail. Section 4 validates the effectiveness of the proposed method through experiments and conducts a comparative analysis with other methods. Section 5 discusses the reasons for selecting certain parameters, along with corresponding analyses, and carries out ablation experiments on different regularization terms to verify their effects. Section 6 summarizes the work of this paper and puts forward the future research directions.
2. Related Work
2.1. Subaperture Decomposition
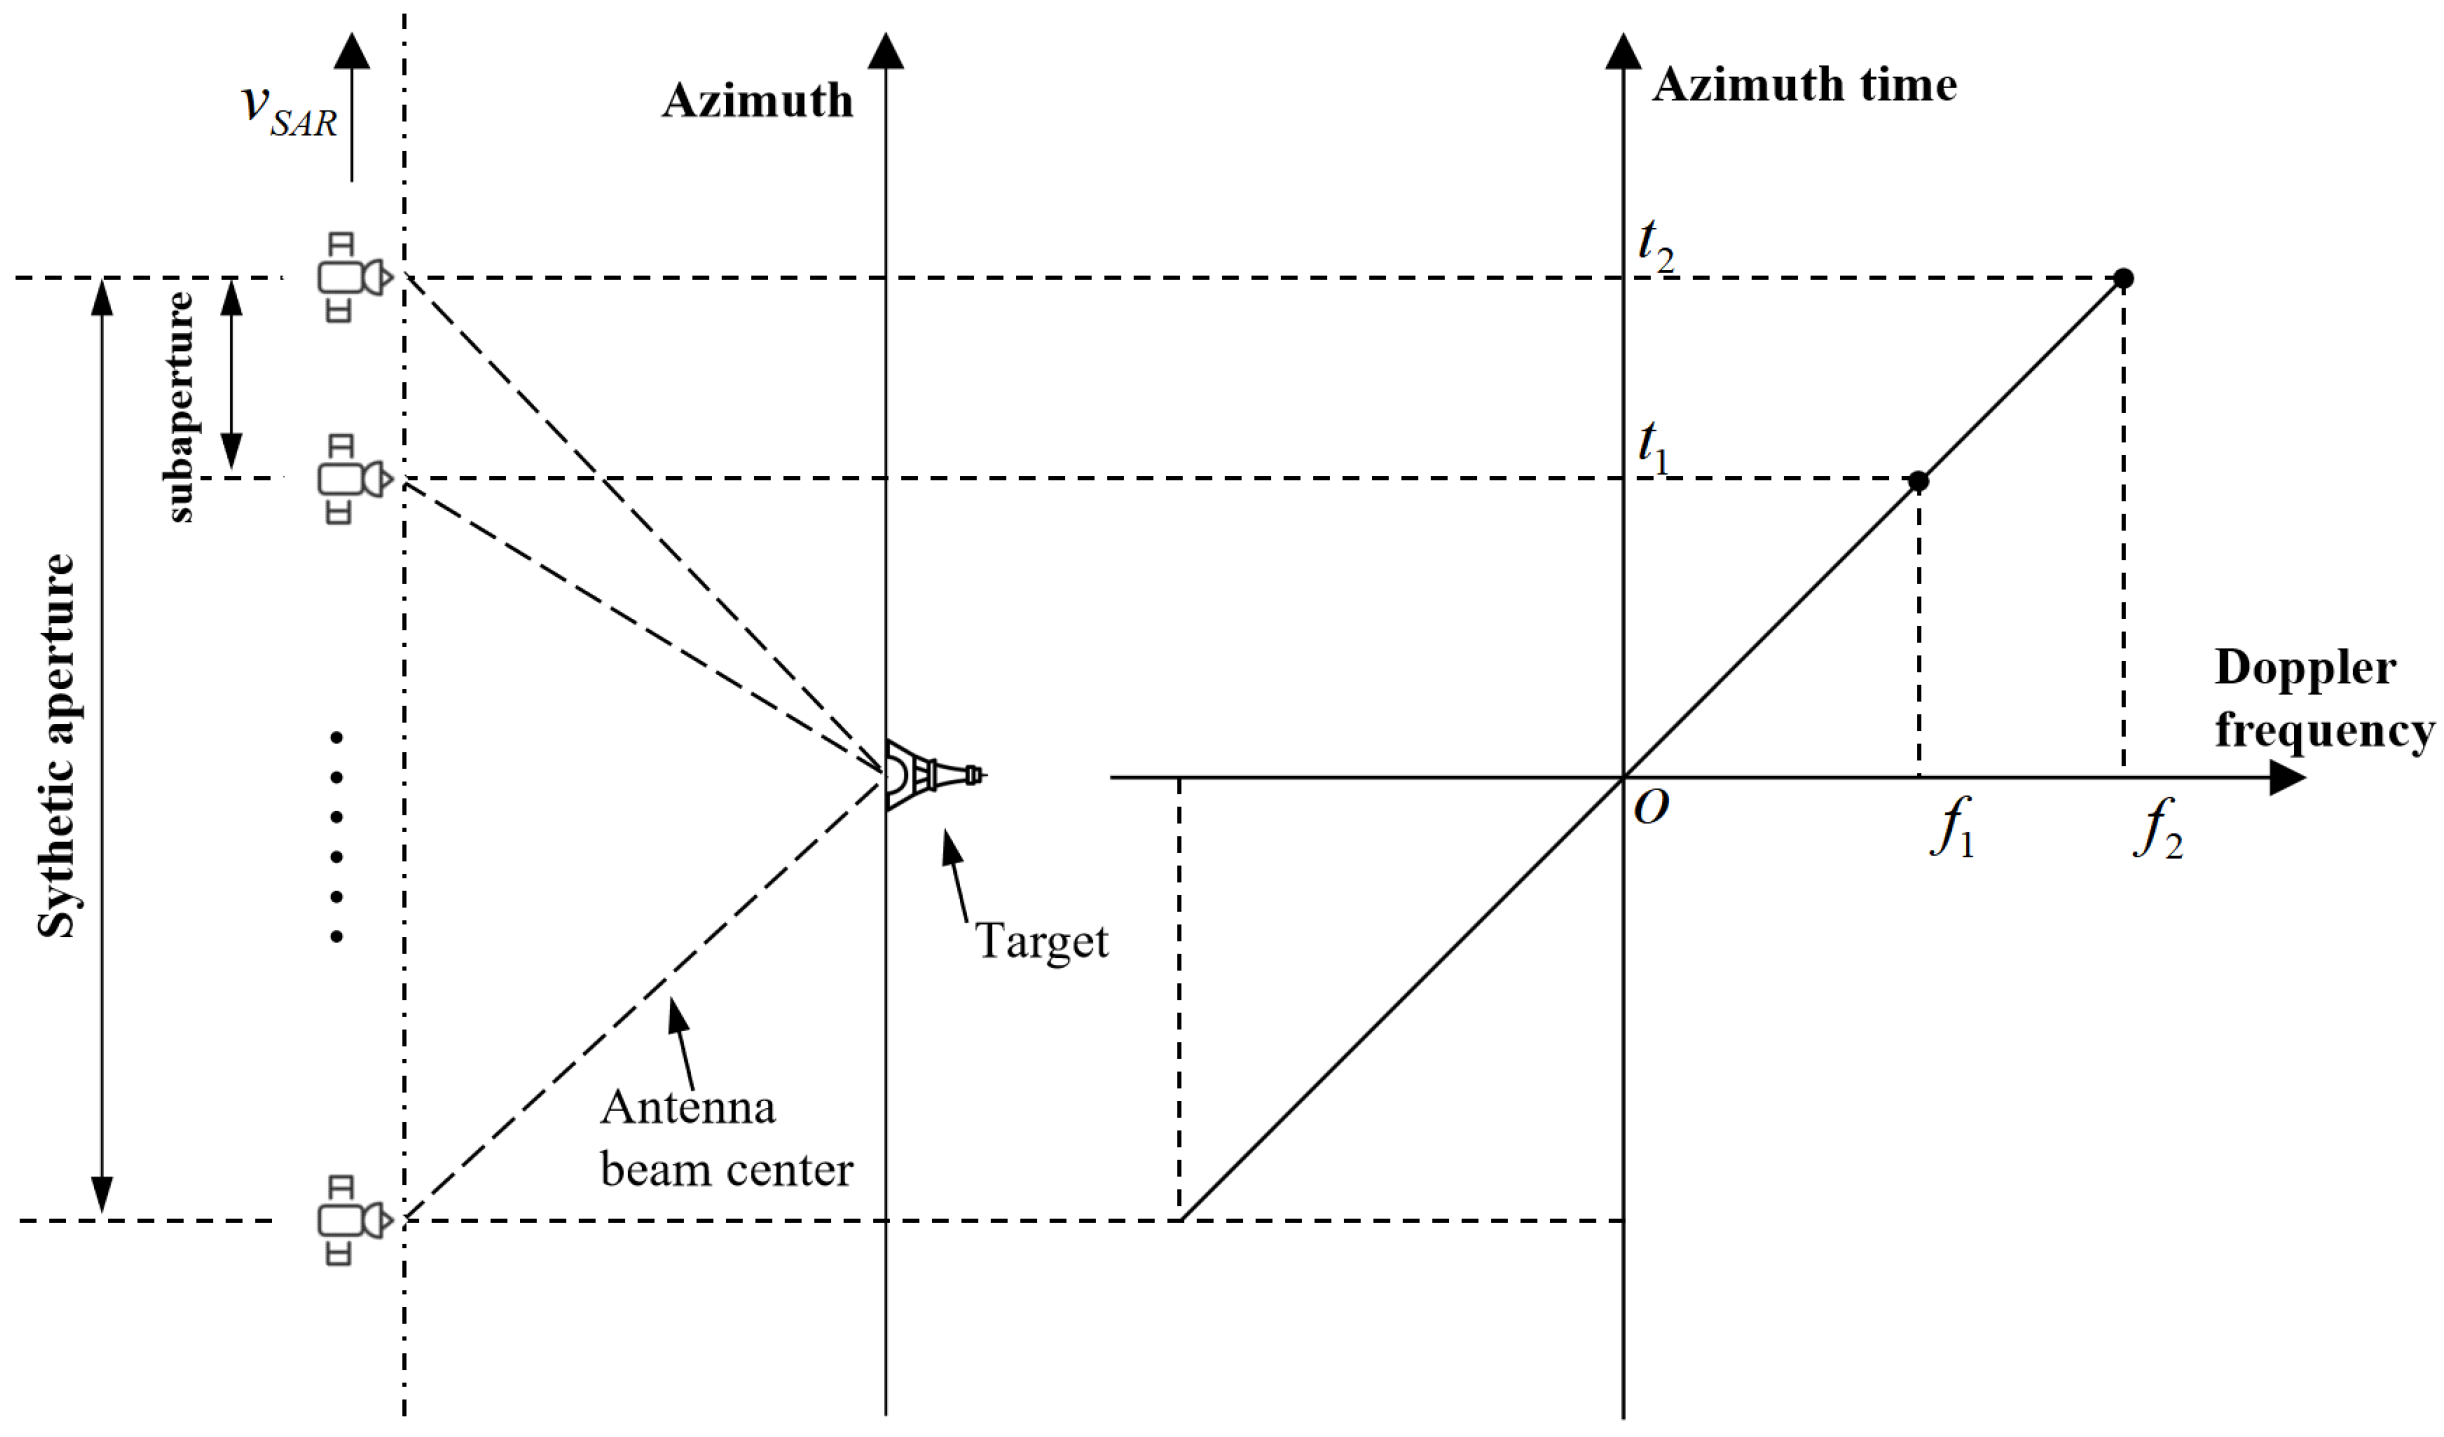
In SAR imaging, for targets within a general swath, the azimuth observation angles of different targets at the imaging center time are similar. After imaging processing, the bandwidths of the targets in the same scene are basically coincident in the frequency domain position. There is a one-to-one correspondence between the Doppler frequency band and the synthetic aperture time of the target, and accordingly, it also corresponds one-to-one with the azimuth observation angle, as shown in Figure 1.
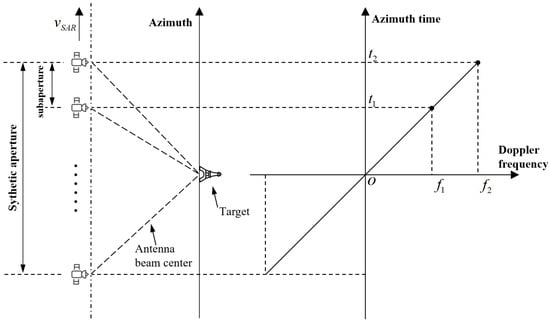
Figure 1.
Schematic diagram of the relationship between azimuth frame and frequency band.
By slicing the SAR image spectrum, the imaging results of the target under different observation angles can be obtained. Specifically, this methodology generates a series of subaperture images through division of the full Doppler bandwidth, where each resultant subaperture image corresponds to partial bandwidth segments extracted from the complete aperture spectrum [26]. It is noteworthy that these subaperture images, while sharing an identical imaging area, exhibit a lower resolution compared to the original image. The resolution degradation is directly proportional to the ratio between the reduced bandwidth of the subaperture image and the full bandwidth of the original image.
At present, subaperture decomposition technology has been extensively applied to diverse processing tasks of SAR images, including ship detection, target classification, and so on [27,28,29,30,31]. In image processing, researchers often employ multi-look processing to stack multiple subaperture images. This approach reduces speckle noise, thereby significantly enhancing the signal-to-noise ratio (SNR) of image. However, this comes at the cost of the image resolution. Since each subaperture image only holds a fraction of the original bandwidth, the resolution decreases proportionally to the reduction in bandwidth. Consequently, while multi-look processing offers certain advantages in noise reduction, its adverse effect on spatial resolution is quite notable, especially in high-resolution image applications. When applying subaperture decomposition to SAR image tasks, it is essential to reach a balance between the noise reduction effect and resolution loss. This balance is particularly critical in scenarios demanding high resolution.
2.2. Non-Local and Low-Rank Theory
The non-local theory posits that natural information in images, such as textures and structures, is repetitive. Thus, one can filter the current block by searching for similar blocks within the image. For every pixel block in a noisy image, search for similar blocks across the entire image. Then, estimate the true value of this pixel block based on the weighted average of these similar blocks, where the weights are determined by the similarity degree between the blocks.
The low-rank theory’s core idea suggests that many natural images can be approximated as low-rank matrices or tensors under a specific transformation. Through low-rank decomposition, an image is separated into a low-rank part and a sparse noise part, thereby achieving noise separation and removal. When handling SAR images, the low-rank model can capture the image’s global structural information, such as large-scale smooth areas or regions with similar features. It represents these as low-rank structures, effectively removing noise.
Recent studies have combined non-local and low-rank theories for SAR denoising [32,33]. These studies primarily focuses on exploiting the self-similarity of natural scenes and the low-rank characteristics of image patches. By identifying similar patches across the image non-locally, a patch group matrix is constructed. Then, low-rank approximation techniques are applied to this matrix to separate the low-rank signal component from the noise and outliers. This approach makes use of the redundancy and structural information in the image, thereby enhancing the robustness of the denoising process. It is worth noting that such 2D patch-based methods fail to exploit the cross-view structural correlations inherent in SAR imaging systems. This limitation motivates the exploration of multi-dimensional tensor modeling in this study.
3. Methodology
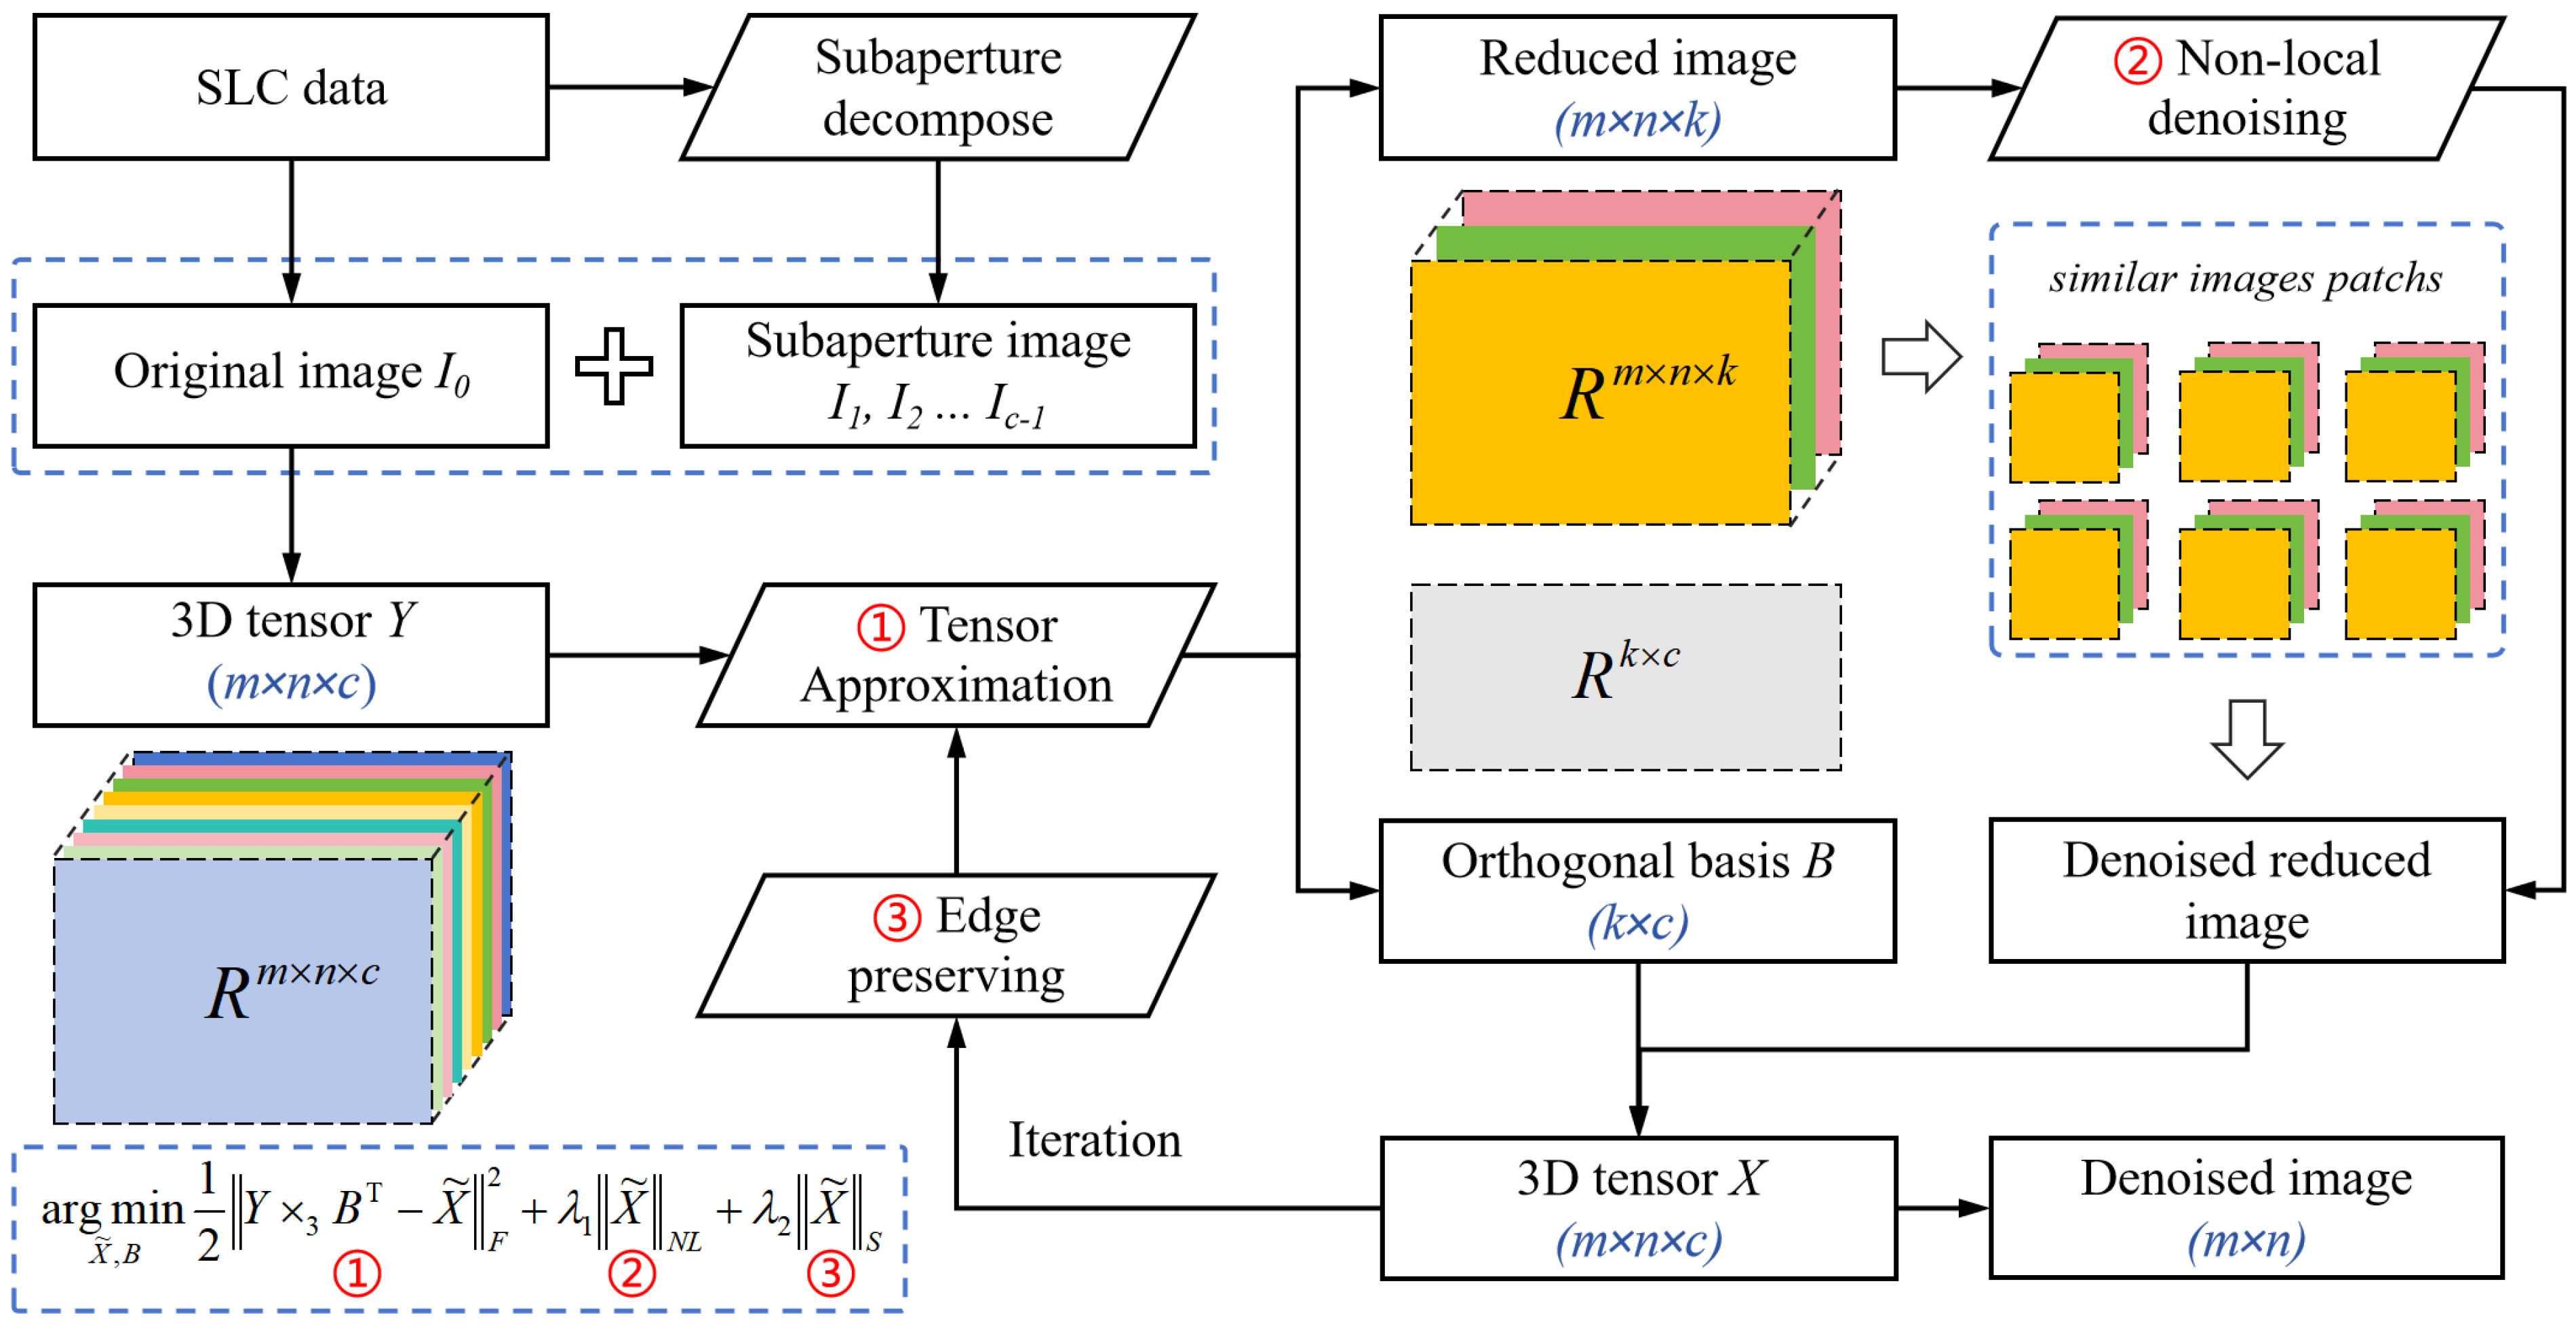
In this section, a novel method for suppressing speckle noise in SAR images is presented. We perform subaperture segmentation based on the SAR imaging mechanism to acquire subaperture images highly similar to the original one and then integrate these images into a three-dimensional tensor. Leveraging the global low-rank properties of the subaperture and original images, we apply low-rank decomposition and non-local regularization to eliminate speckle noise. This approach fully exploits the global similarity of the image, effectively suppressing speckle noise, as depicted in Figure 2.
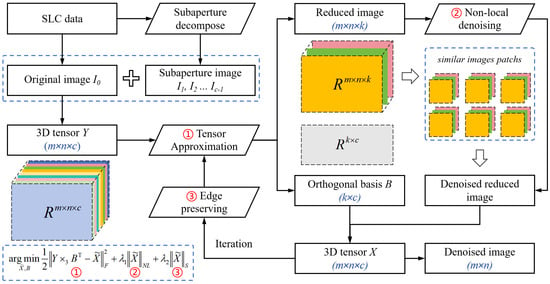
Figure 2.
Procedure of the proposed despeckling method based on subaperture decomposition and non-local low-rank tensor approximation.
Conventional speckle suppression approaches typically operate directly on SAR imagery through scattering analysis or neural architectures, while neglecting to exploit the unique SAR imaging mechanism. Although both multi-look processing and our method employ subaperture decomposition, multi-look processing significantly degrades image resolution, which is undesirable for many subsequent tasks. In contrast, the proposed method utilizes subaperture images as auxiliary information to perform denoising on full-aperture images, thereby relatively maintaining higher resolution.
3.1. Subaperture Image Acquisition
In this study, we implement a subaperture decomposition method. The objective is to obtain a series of subaperture images, which, despite having reduced resolutions due to Doppler bandwidth loss during the decomposition, possess unique characteristics suitable for further analysis and specific applications in the context of our research. The data employed are single look complex (SLC) data.
SAR imaging involves coherent integration of low-resolution target echoes acquired across varying squint angles during extended synthetic aperture intervals. These echoes, distinguished by Doppler frequency histories, collectively synthesize the final full-resolution image through azimuth compression. Therefore, each image pixel does not correspond to a singular observation geometry but rather aggregates signals across multiple azimuth frame. This angular diversity enables the decomposition of the full Doppler spectrum into discrete subbands, thereby generating a sequence of low-resolution subaperture images that preserve the original scene coverage. This constitutes the fundamental principle of subaperture decomposition. In broadside mode, the beam of radar is perpendicular to the satellite flight direction, and the Doppler frequency of the target response can be denoted as follows:
where represents the Doppler frequency, denotes the moving speed of the SAR, is the wavelength of the electromagnetic wave emitted by the SAR, indicates the shortest distance between the SAR and the target, and stands for the azimuth time. The time instant is defined as the moment when the line of sight between the sensor and the target is perpendicular to the direction of flight.
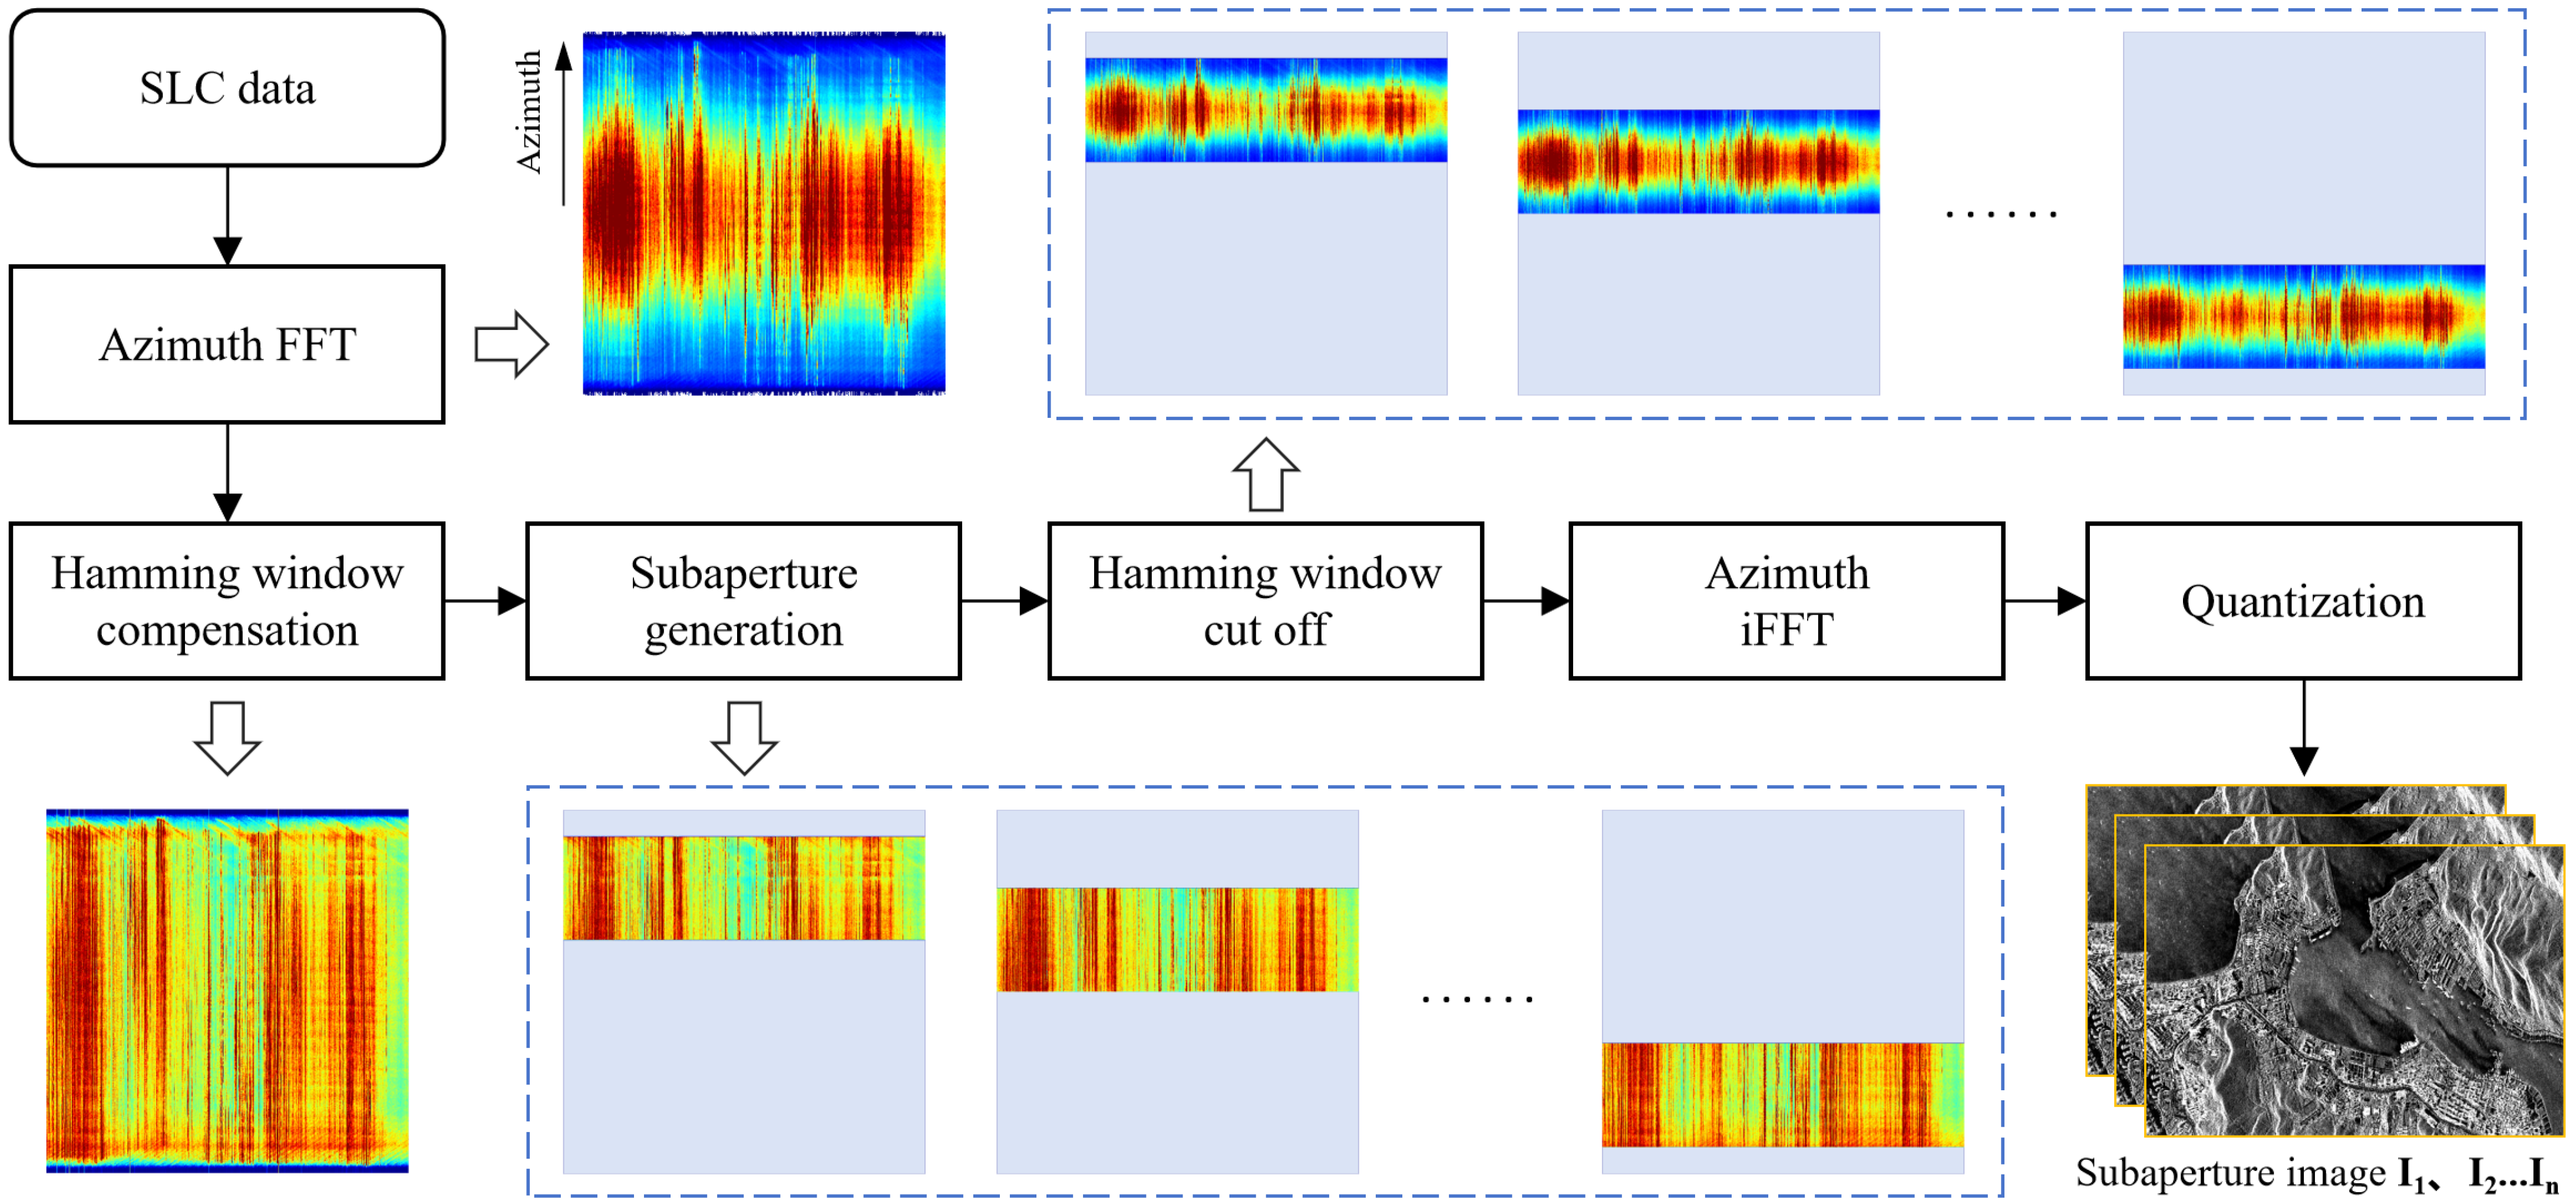
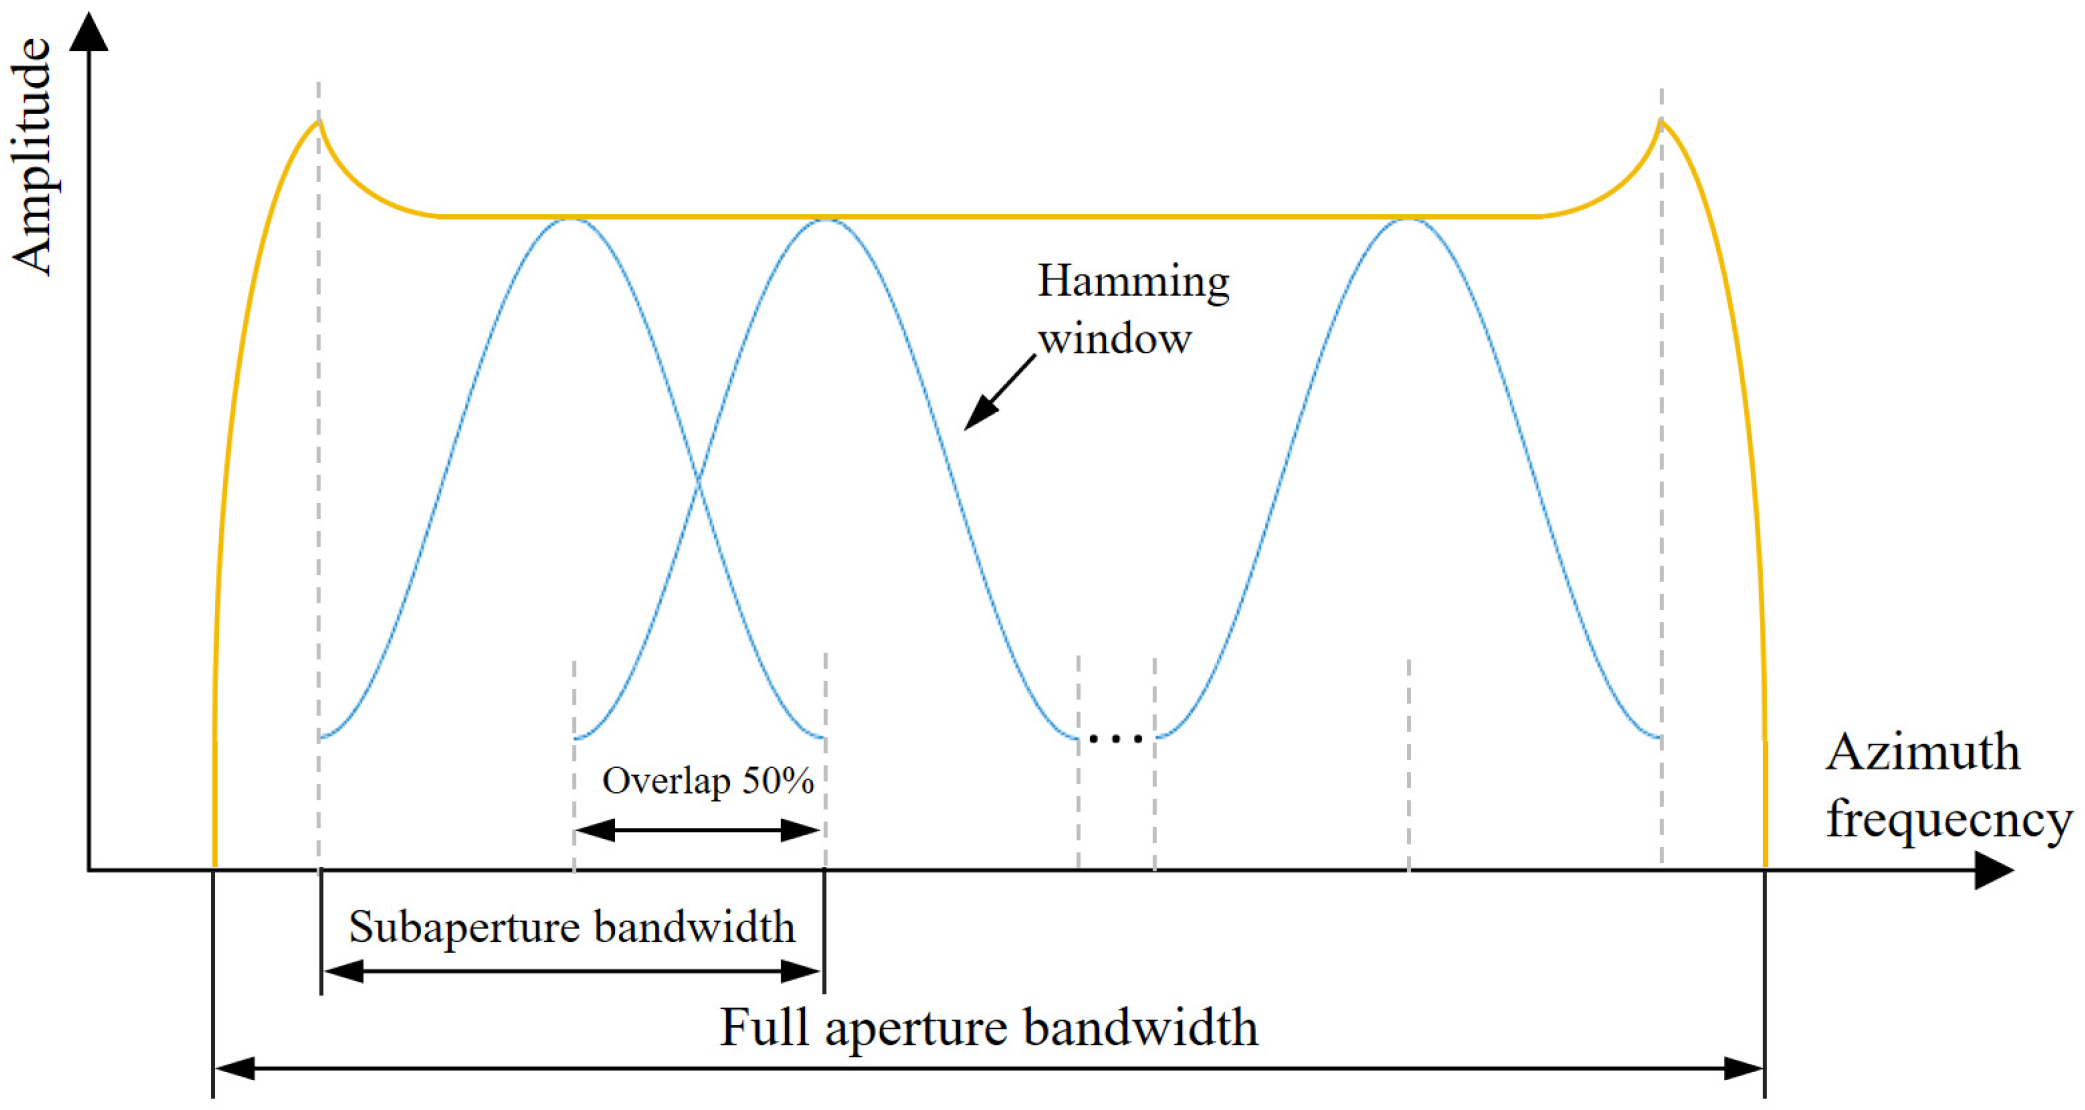
The subaperture decomposition procedure is implemented through the following workflow: First, the SAR image is transformed into the range-Doppler domain via Fourier transform along the azimuth direction. In this domain, Hamming window compensation is applied to mitigate weighting effects, ensuring energy consistency across subapertures. Subsequent spectral segmentation is performed by partitioning the Doppler spectrum into designated subbands with Hamming window truncation, effectively suppressing sidelobe interference in point target responses. The partitioned spectral segments are then inversely transformed to the spatial domain through inverse Fourier transform, yielding multiple subaperture images via image quantization. The complete processing procedure is illustrated in Figure 3. Notably, adjacent subaperture spectra in this study are intentionally overlapped by half of the subaperture bandwidth, as shown in Figure 4. This overlapping design generates more subaperture images compared to non-overlapping decomposition schemes while reducing inter-subaperture coherence due to attenuated energy at spectral edges.
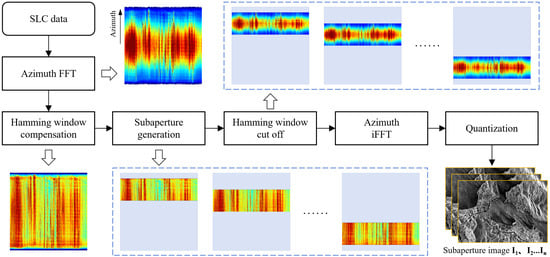
Figure 3.
Procedure of subaperture decomposition in the paper.
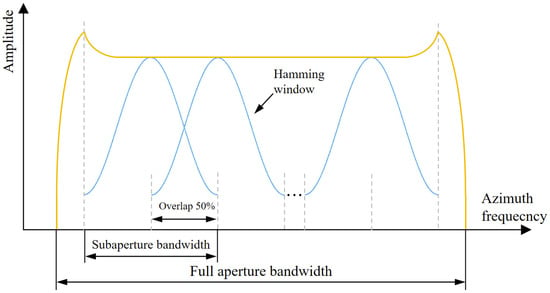
Figure 4.
Schematic diagram of the subaperture bandwidth.
In the validation phase, considering data volume and subsequent denoising, we find that an optimal effect could be achieved when the number of subapertures is within a specific range. In this experiment, the number of subaperture images is 5. For the specific analysis of the number of subapertures, please refer to Section 5.2. Considering the same synthetic aperture bandwidth and consistent noise models, we can consider the obtained series of subaperture images as multiple noisy images on the same original image, with the noise following the same distribution. For subsequent processing, let denote the original SAR image, which is decomposed into multiple subaperture images . We construct a three-dimensional tensor by stacking the original image along with these subaperture images, resulting in a tensor of dimensions , where , , and represent the number of rows, columns, and channels, respectively. This enables us to leverage its three-dimensional structure for subsequent processing.
3.2. Mathematical Model
During SAR image speckle suppression, traditional models typically consider that the intensity image contains speckle noise following a gamma distribution and presenting as multiplicative noise. The classical form of this model can be expressed as follows:
where represents the observed image, denotes the noise-free image in the ideal state, and stands for the noise. This multiplicative noise model captures the characteristics of SAR image noise to some extent [34,35]. In many algorithms, a homomorphic transformation is often applied later to convert it into an additive noise model for easier mathematical processing and analysis. The homomorphic transformation applies a logarithmic function, which is shown as follows:
The original SAR image and its subaperture images exhibit strong spatial global similarity. Despite the influence of speckle noise, the three-dimensional tensor they form generally has low-rank characteristics. This low-rank property implies that the data can be approximated by a lower-dimensional subspace in a high-dimensional space. In the absence of noise, an ideal SAR image would exhibit an even lower rank, while the presence of noise increases the rank. Let and represent the transformed observed tensor and latent clean tensor, respectively, where corresponds to the number of Overlay image layers. This implies the data approximately resides in a lower-dimensional subspace, formally expressed as follows:
where encapsulates both speckle noise and residual errors. , , . denotes the low-dimensional orthogonal basis of the 3D tensor, while represents the reduced image tensor. This decomposition step exploits the structural correlation among SAR images at different levels to reduce data complexity. Given that the images are extracted from the same data, ideally, should equal 1. In this case, corresponds to the desired denoised image. Furthermore, considering both the spatial non-local similarity and the discontinuous nature of strong scattering characteristic of SAR images, we introduce two regularization terms: non-local denoising regularization and edge-preserving regularization.
- (1)
- Non-local denoising regularizationGiven the non-local similarity within the subapertures of SAR images, where similar regions or structures may appear repeatedly at different locations, we introduce a non-local regularization to capture this characteristic. Specifically, this regularization is designed to suppress speckle noise by leveraging relationships among similar image patches. Similar patches are first identified within the subaperture images. Then, based on the relationships among these similar patches, we suppress the speckle noise while enhancing the structures in the image.
- (2)
- Edge-preserving regularizationTo balance the relationships among image details, strong scattering points, and speckle noise removal, we introduce an edge-preserving regularization. We apply special weight treatment to the edges so that they can maintain relatively high intensity values during the denoising process. This reduces the likelihood of over-smoothing or deletion, better retaining fine structures and target features in the final image.
In summary, the proposed objective function consists of three regularization terms:
where is the orthogonal basis matrix and needs to satisfy . and are abstract coefficients representing the regulatory balance between non-local denoising regularization and edge-preserving regularization, rather than fixed numerical values. They are used to balance the contributions of the two regularization terms in the objective function. Here, and denote the optimal solutions that minimize the objective function, representing the expected ideal states in this optimization process.
3.3. Algorithm Implementation
The simultaneous presence of variables and in the objective function introduces coupling effects, rendering direct optimization intractable. To resolve this interdependence, we adopt an alternating minimization strategy, where and are iteratively updated until convergence. The algorithm flow is shown in Algorithm 1.
| Algorithm 1 SAR images speckle removal based on non-local low-rank tensor |
| Required: 3D tensor overlaid by subaperture images |
| 1: Set the amount of dimensionality reduction equal to the number of iterations, that is, k = iter; |
| 2: for i =1,2,···iter do |
| /* Tensor Approximation*/ |
| 3: Perform SVD on to obtain and the reduced images ; |
| /* Non-Local Denoising */ |
| 4: Divide the reduced images into different image block groups according to local similarity; |
| 5: Denoise the image block groups using WNNM algorithm; |
| 6: Restore the denoised image blocks to the original image, that is, ; |
| /* Iterative Refinement */ |
| 7: Calculate the edge weight ; |
| 8: Calculate the edge enhanced map; |
| 9: Update the coefficient, that is, k = iter − i + 1; |
| 10: end for |
| 11: Return reduced denoised images ; |
Drawing on the methodologies from [36,37], we refine the first objective function by incorporating a relaxation term. This adjustment accommodates the progressive noise reduction achieved through iterative regularization; it is relaxed, as follows:
In Equation (5), the mode-3 unfolding of is subjected to singular value decomposition, that is, , where , . In this way, the complex optimization problem can be simplified to singular value decomposition, thus simplifying the calculation.
The non-local denoising regularization primarily serves to eliminate noise. After the previous stage, the reduced image is obtained, which then requires noise removal. Specifically, the image is partitioned into blocks, the similarity between each block and others is computed, and the blocks are grouped into different sets based on similarity. Subsequently, each non-local block group is denoised using the weighted nuclear norm minimization (WNNM) method. This approach applies weights to similar image blocks and then minimizes the nuclear norm of the weighted block matrix to achieve denoising. The underlying principle is the similarity of these blocks in the low-rank structure, enabling effective noise removal [38].
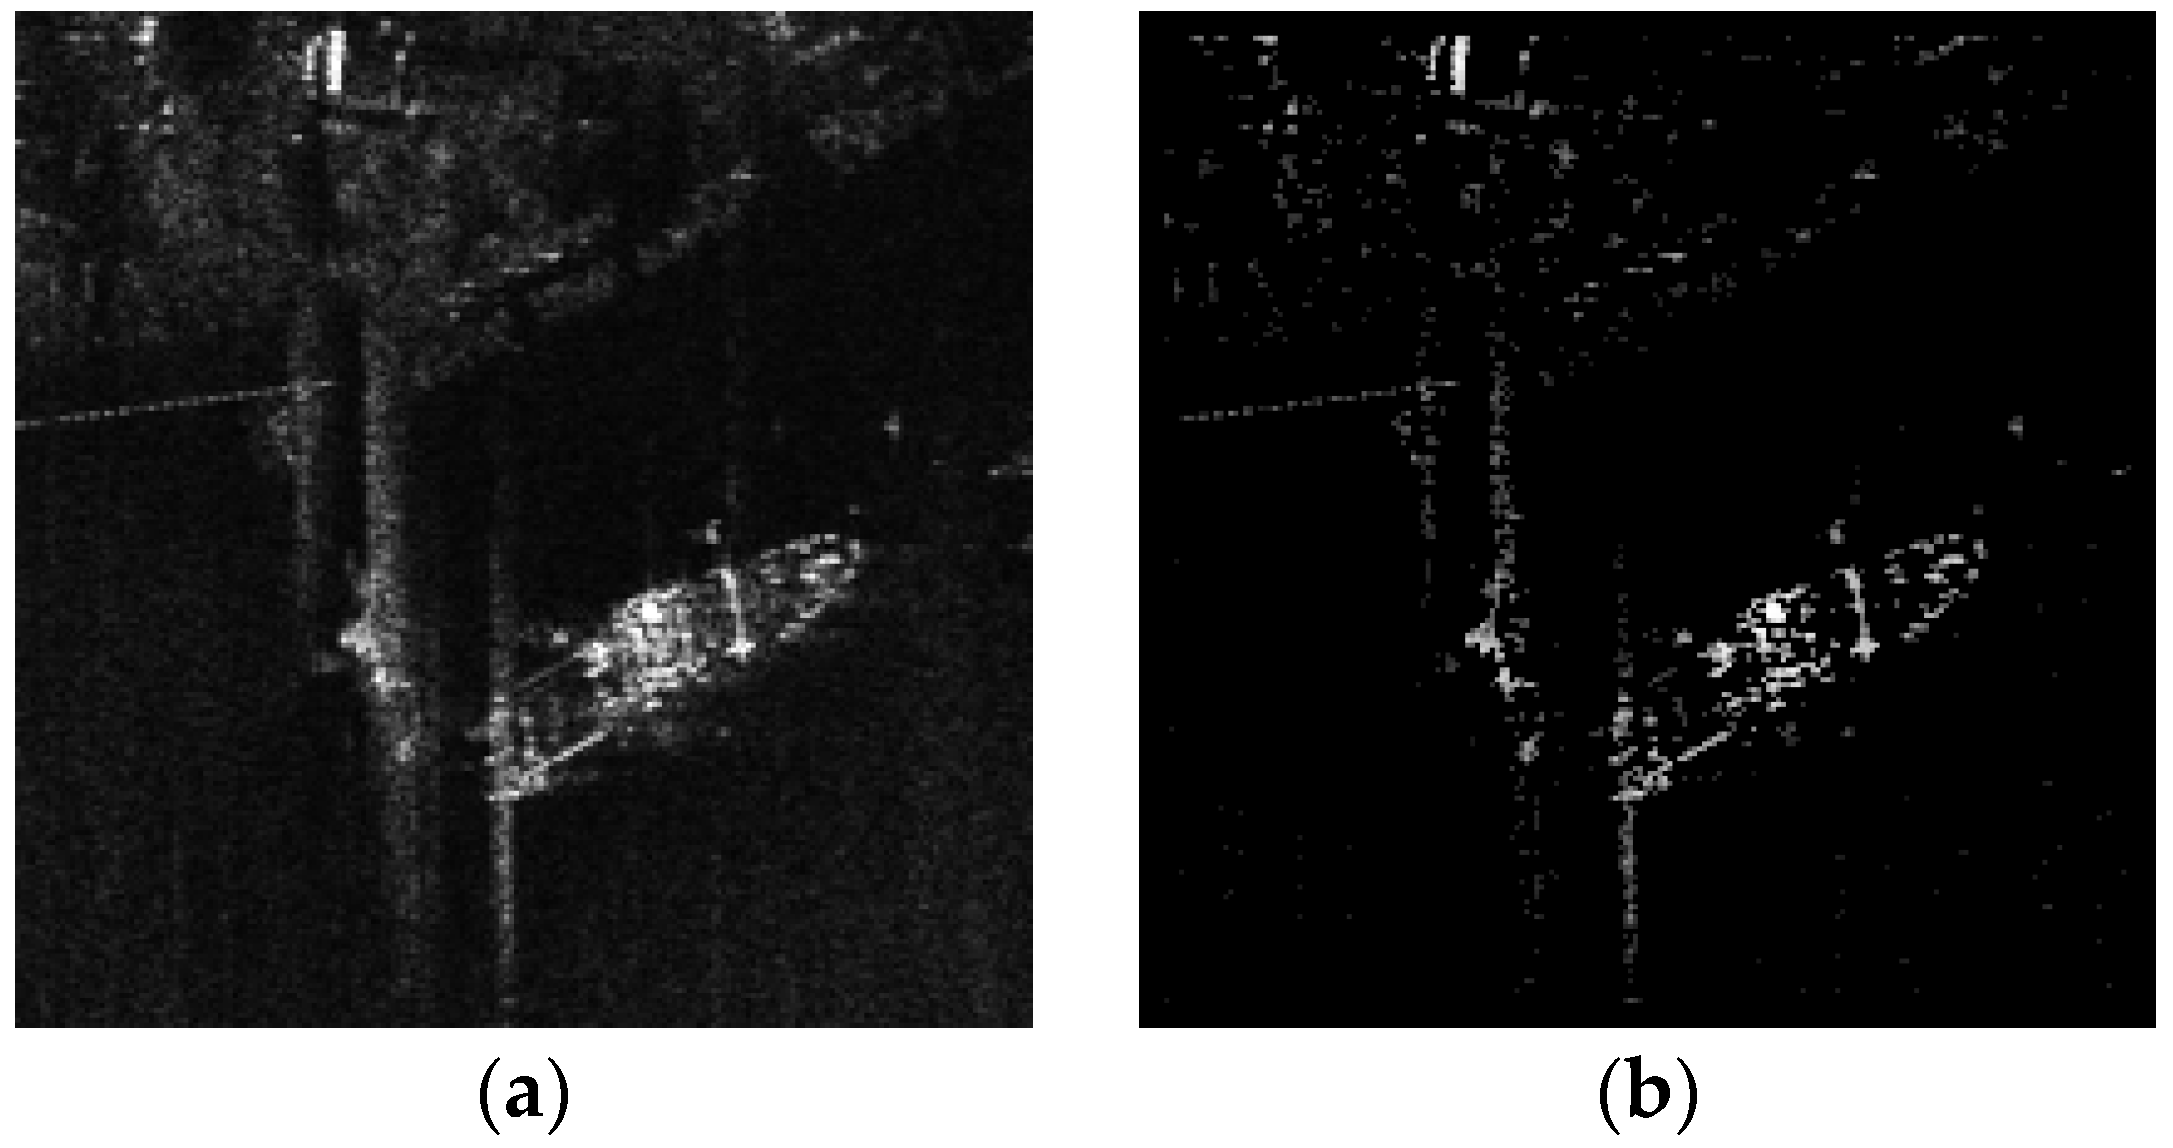
The edge-preserving regularization is implemented after non-local denoising. Its purpose is to preserve edge information, avoid over-smoothing, and retain strong scattering points to some degree. Specifically, different weights are assigned according to the distribution of neighboring pixel values in the denoised image to generate an edge map. Then, regularization is performed on the denoised image, the original image, and the edge map to obtain the final result. The formula for edge preserving regularization is calculated as follows:
where represents the image before denoising, represents the image after denoising, and represents the image input for the next iteration. Here, are the coordinates of a pixel in the image. denotes a window area centered at the pixel . and are edge regularization weights, and is the weight threshold. is the average value of the pixel values within the area , and is the attenuation coefficient. The specific manifestation is shown in Figure 5.
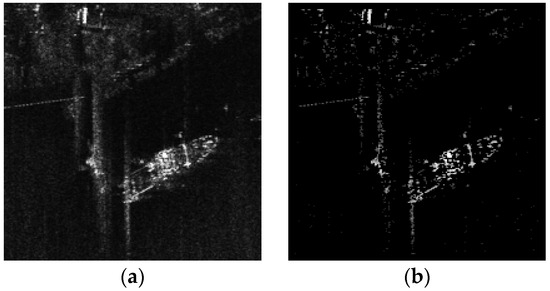
Figure 5.
The edge-preserving regularization term: (a) original image; (b) extracted edge map.
Larger regularization weights are assigned to the edge regions, while smaller ones are given to the non-edge regions. Through this iterative regularization, a better balance can be achieved between preserving edge features and removing noise.
3.4. Iterative Refinement
The core idea of iterative denoising is to gradually approximate the true signal of an image through repeated operations. For SAR images, due to the complexity of speckle noise, a single denoising operation can hardly completely remove the noise and restore the true signal. As the iteration progresses, the algorithm can fully utilize the non-local similarity among SAR subaperture images to remove speckle noise more accurately.
It is worth noting that, according to the model proposed in this paper, the ideal noise-free images of all subaperture images can be regarded as the same image. Therefore, the purpose of denoising is to obtain an ideal noise-free image with a dimension of 1. As iterative denoising proceeds, the noise is gradually removed, redundant information is compressed, and the effective information in the image gradually concentrates in a low-dimensional space. When the dimensionality is reduced to 1, it indicates that the effective information in the image has been extracted and compressed to the greatest extent, and the noise has also been removed to the greatest extent. In the experimental operation, the number of iterations is chosen to be 2. For the specific analysis of the iterative times, please refer to Section 5.2.
4. Experimental Results
This section conducts a series of experiments on synthetic and real images for the proposed method. To verify the superiority of the proposed method, six classic SAR denoising methods are selected for comparison, including two types of denoising methods: PPB [15], SAR-BM3D [16], MuLoG [39], FANS [40], SAR-Transformer [41], and SAR-CAM [20]. Among them, PPB, SAR-BM3D, MuLoG, and FANS are traditional methods, while SAR-Transformer and SAR-CAM are deep learning methods. The codes of the above mentioned methods can be downloaded according to the addresses provided in the papers.
4.1. Experimental Setting
For the four traditional SAR denoising methods, their parameters are set according to those recommended in the relevant articles. Since both SAR-Transformer and SAR-CAM are data-driven deep learning methods and require training on a large amount of data, a synthetic dataset is constructed by referring to the method of SAR-CAM. The training configuration is kept consistent with that of the original paper, and it is ensured that the two deep learning methods are trained on the same dataset until convergence. The specific dataset setting will be introduced in Section 4.3.
Implementation-wise, the proposed method and four conventional despeckling methods are developed in MATLAB 2021a, whereas the two deep learning methods leverage PyTorch 1.8.0 frameworks. All the codes are run on a laptop equipped with an Intel (R) Core (TM) i7-13700H CPU, 64GB of memory, and a NVIDIA RTX 4060 GPU.
4.2. Quantitative Evaluation
In this paper, we use three evaluation metrics, SSIM, PSNR, and ENL, to quantitatively evaluate the performance of denoising methods. Specifically, both SSIM and PSNR demand the noise-free image as a reference, whereas ENL does not. In simulated data experiment, SSIM and PSNR will be adopted to evaluate the image-denoising performance. For real data experiments, ENL serves to assess the denoising effect.
- (1)
- SSIM (Structural Similarity Index)
SSIM quantifies the resemblance between two images. A higher SSIM value implies greater similarity between the denoised and the original image, with a maximum value of 1. The formula is as follows:
where and denote the noise-free and the noisy images, respectively. and represent the means of the noise-free and the noisy images, and are their variances, is the cross-covariance in and , and and are stabilization constants.
- (2)
- PSNR (Peak Signal to Noise Ratio)
PSNR, defined as the ratio of the maximum signal energy to the noise energy, necessitates a pixel-by-pixel comparison between the reference image and the denoised one. A larger PSNR value indicates a more effective denoising algorithm. The formula is as follows:
- (3)
- ENL (Equivalent Numbers of Looks)
ENL quantifies the smoothness of homogeneous regions in SAR images. It is defined as the ratio of the square of the mean pixel intensity within a region to its variance. Typically, multiple regions of interest are selected in the image, and the average ENL of these regions is computed to represent the overall ENL of the entire image. A higher ENL value indicates lower noise in the region. The formula is as follows:
where is the mean pixel value in the region and is the standard deviation of pixel values in the region.
4.3. Simulated Data Experiment
In order to comprehensively assess the denoising performance, this study constructs two groups of datasets following the method of SAR-CAM. We add single speckle noise and mixed speckle noise to the same set of noise-free reference images, respectively, with the intention of verifying the denoising performance and generalization ability of the proposed method. The UC Merced land-use dataset is chosen as the noise-free data source. This dataset encompasses 21 scene categories, and each image has a size of 256 × 256. From each scene, 70 images are randomly chosen as reference images, amounting to a total of 1470 images. These images are divided into a training set, a validation set, and a test set at a ratio of 7:2:1. The training set and the validation set are utilized in the training process of the SAR-Transformer and SAR-CAM models. After the model training is completed, all subsequent test metrics are calculated and analyzed based on the processing results of the test set. The difference between the two datasets lies in the fact that the number of looks of the synthetic speckle noise added to the single-dataset is set to 1, while the mixed-dataset has speckle noise with three different numbers of looks, namely 1, 2, and 4, in equal proportion. This setup enables a more comprehensive examination of the method’s performance under various noise conditions. Notably, the proposed method processes a 3D tensor composed of multiple subaperture images; thus, the input in the simulation experiment was a 3D tensor generated by stacking five synthetic images.
Table 1 presents the average quantitative results of all comparative methods on the two synthetic datasets, evaluated using SSIM and PSNR metrics. The best and second-best results are highlighted in red and blue, respectively. Additionally, single-image processing time, independent of dataset type, is included for computational efficiency comparison. The processing time was calculated by averaging the total denoising duration across the test dataset divided by the number of images, with all experiments conducted under identical hardware configurations. The results demonstrate that the proposed method outperforms all other speckle suppression methods in terms of numerical performance. Compared to the second-best method (SAR-CAM), the proposed method achieves an average improvement of 0.076 in SSIM and 2.03 dB in PSNR. In addition, while both SAR-Transformer and SAR-CAM are deep learning speckle suppression algorithms, the former exhibits a performance decline on mixed datasets compared to single datasets, whereas the latter demonstrates an improvement. This suggests that SAR-Transformer has relatively weaker generalization performance.

Table 1.
Average quantitative result of the simulated dataset.
In computational efficiency, deep learning methods (SAR-Transformer at 0.32 s; SAR-CAM at 0.07 s) are fastest, benefiting from GPU acceleration. Among non-deep learning approaches, FANS (0.95 s) and MuLoG (4.84 s) show moderate speed, while PPB (11.24 s) and SAR-BM3D (11.73 s) are slower due to iterative operations. The proposed method processes images in 7.25 s, outperforming SAR-BM3D in both speed and denoising performance: it achieves +0.143 SSIM and +3.78 dB PSNR on the mixed dataset. Though slightly slower than MuLoG, it significantly improves noise suppression with +0.181 SSIM and +5.5 dB PSNR on the mixed dataset, balancing efficiency and effectiveness better than classical non-local methods.
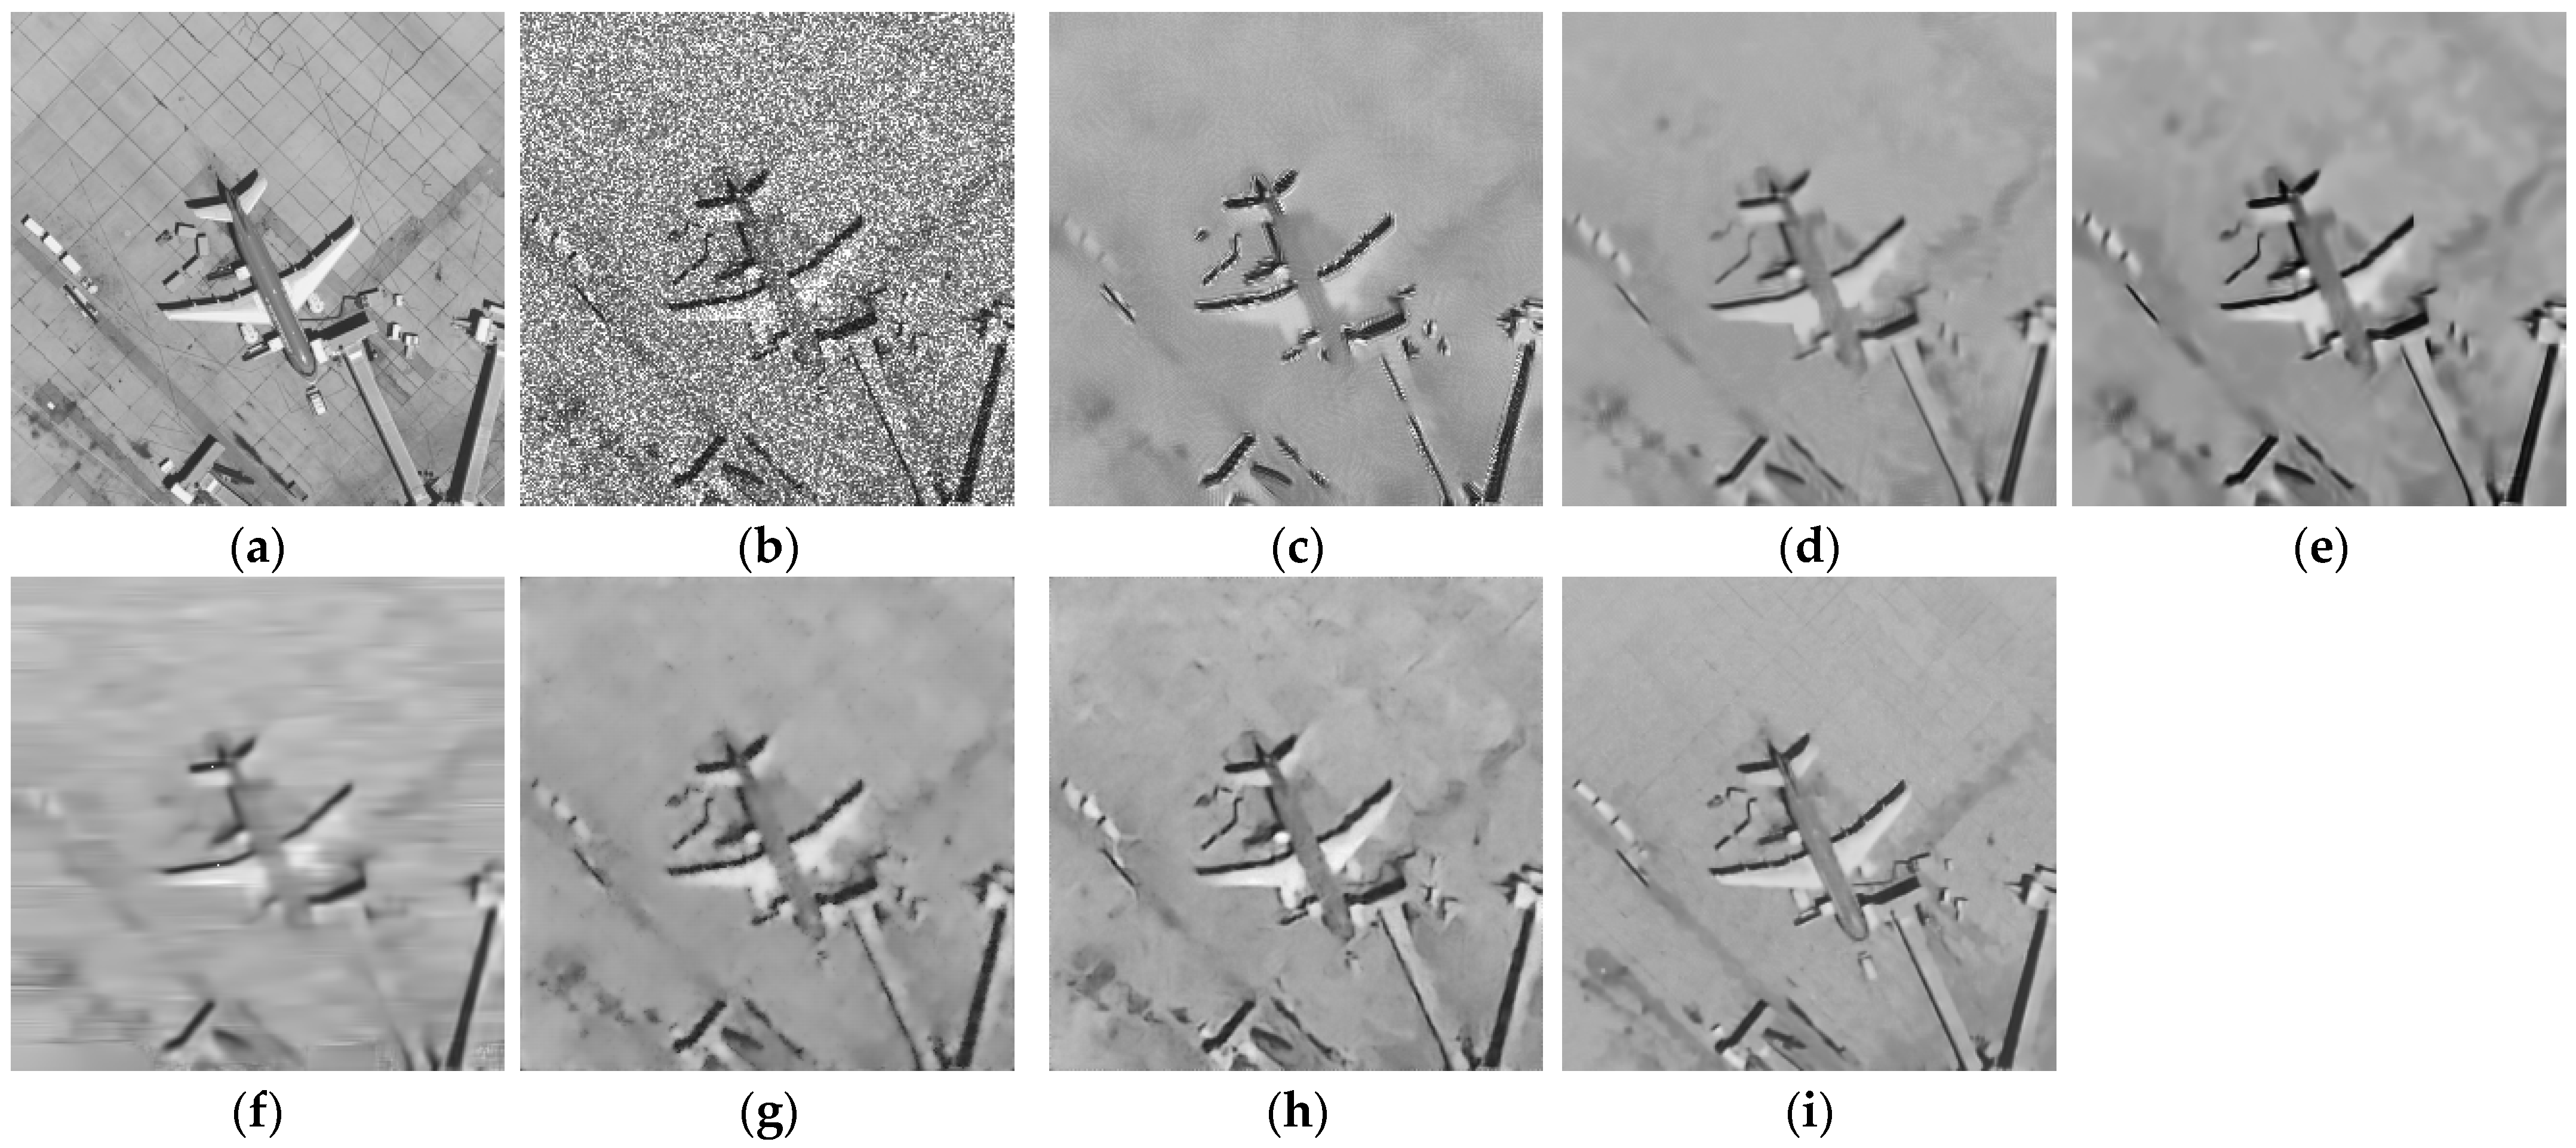
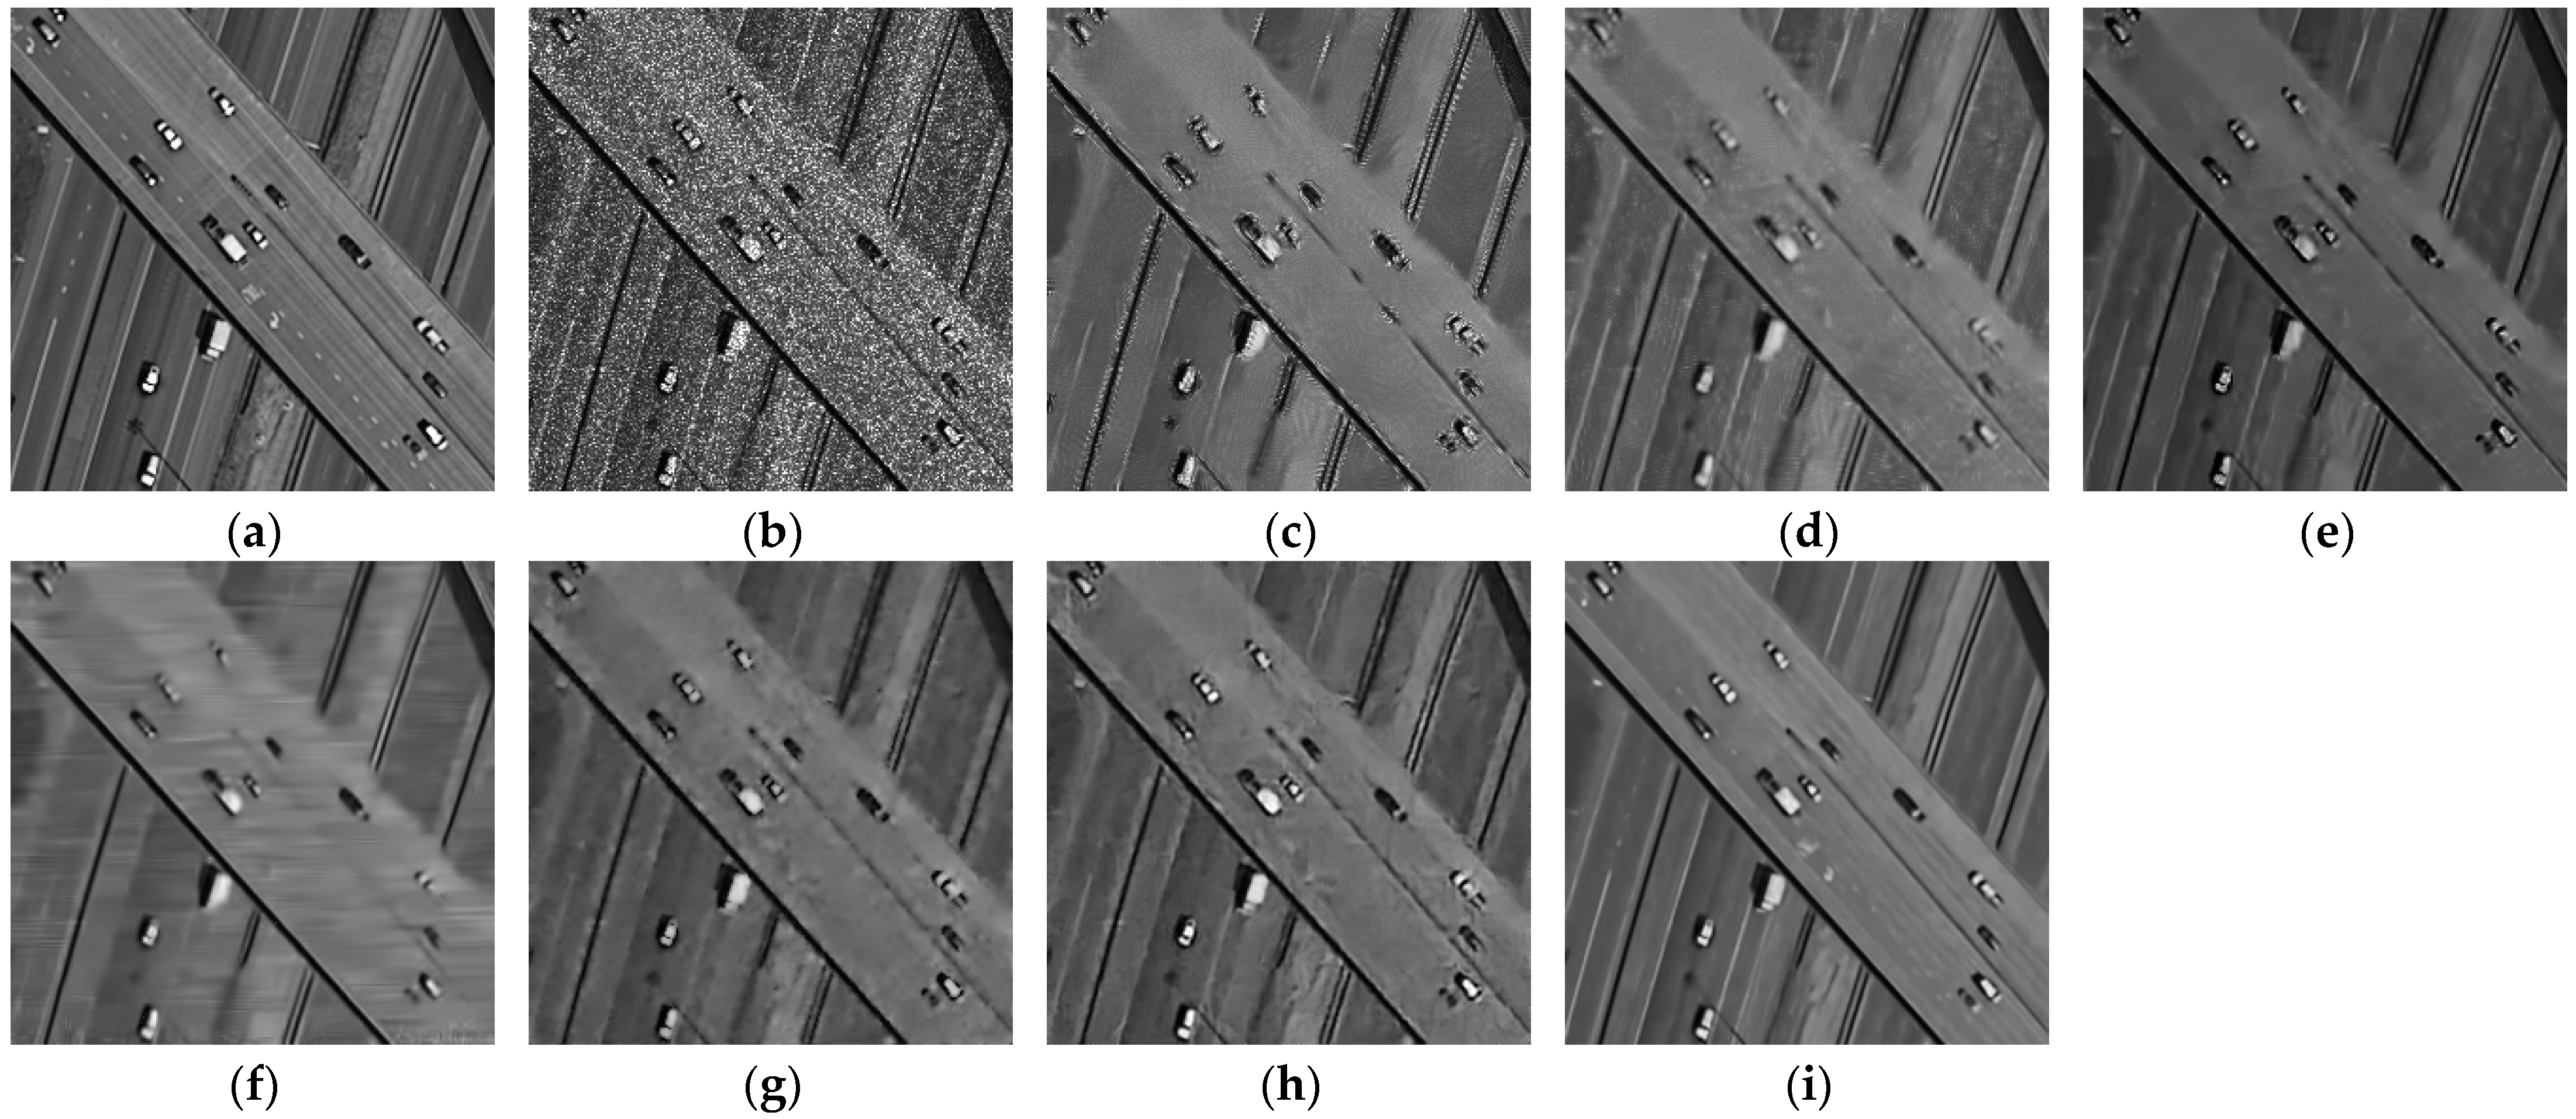
To better illustrate the capabilities of the proposed method in speckle suppression and target preservation, two scenes, airport and highway, were selected for visual representation.
Figure 6 shows the denoising effects of different methods on the airport scene under L = 1 noise level. Although FANS does not exhibit the lowest numerical performance, its visual quality is the poorest, showing horizontal artifacts and significant loss of image details. PPB remove noise but introduce blurred textures at the edges of airplanes and terminals. The denoising results of MuLoG are stronger in image contrast compared to other methods, but its denoising effect on the background is limited. SAR-BM3D significantly reduces noise but suffers from over-smoothing at certain airplane edges. SAR-Transformer and SAR-CAM perform better in preserving details, with clearer edges of airplanes and ground facilities, but the background appears insufficiently smooth. The proposed denoising method successfully removes noise while preserving the structural information of all targets, demonstrating superior visual performance that is closer to the original image.
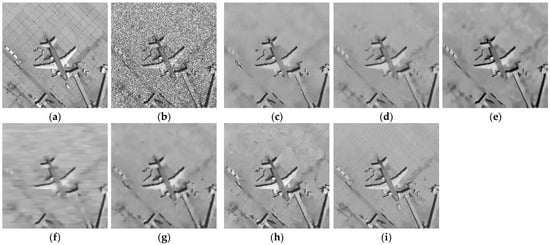
Figure 6.
Results for airport image of different methods in single-noise dataset: (a) reference; (b) noisy image; (c) PPB; (d) SAR-BM3D; (e) MuLoG; (f) FANS; (g) SAR-Transformer; (h) SAR-CAM; (i) proposed method.
Figure 7 shows the denoising effects of different methods on the highway scene under L = 1 noise level. PPB exhibits shape distortions at road edges and on car targets. Other methods also exhibit shortcomings, failing to balance noise removal and target structure preservation. SAR-Transformer and SAR-CAM, as deep learning methods, perform well in preserving target structures but introduce undesirable wrinkle-like artifacts near the targets. In contrast, the proposed method effectively removes speckle noise, restores fine textures and edges, and preserves the clearest road edges and car structures.
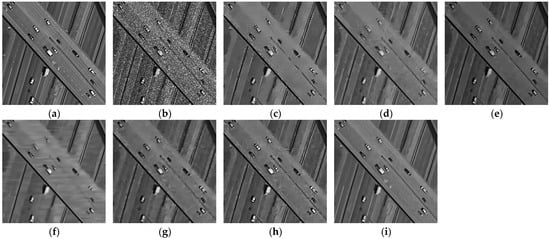
Figure 7.
Results for highway image of different methods in single-noise dataset: (a) Reference; (b) Noisy image; (c) PPB; (d) SAR-BM3D; (e) MuLoG; (f) FANS; (g) SAR-Transformer; (h) SAR-CAM; (i) Proposed method.
4.4. Real SAR Data Experiment
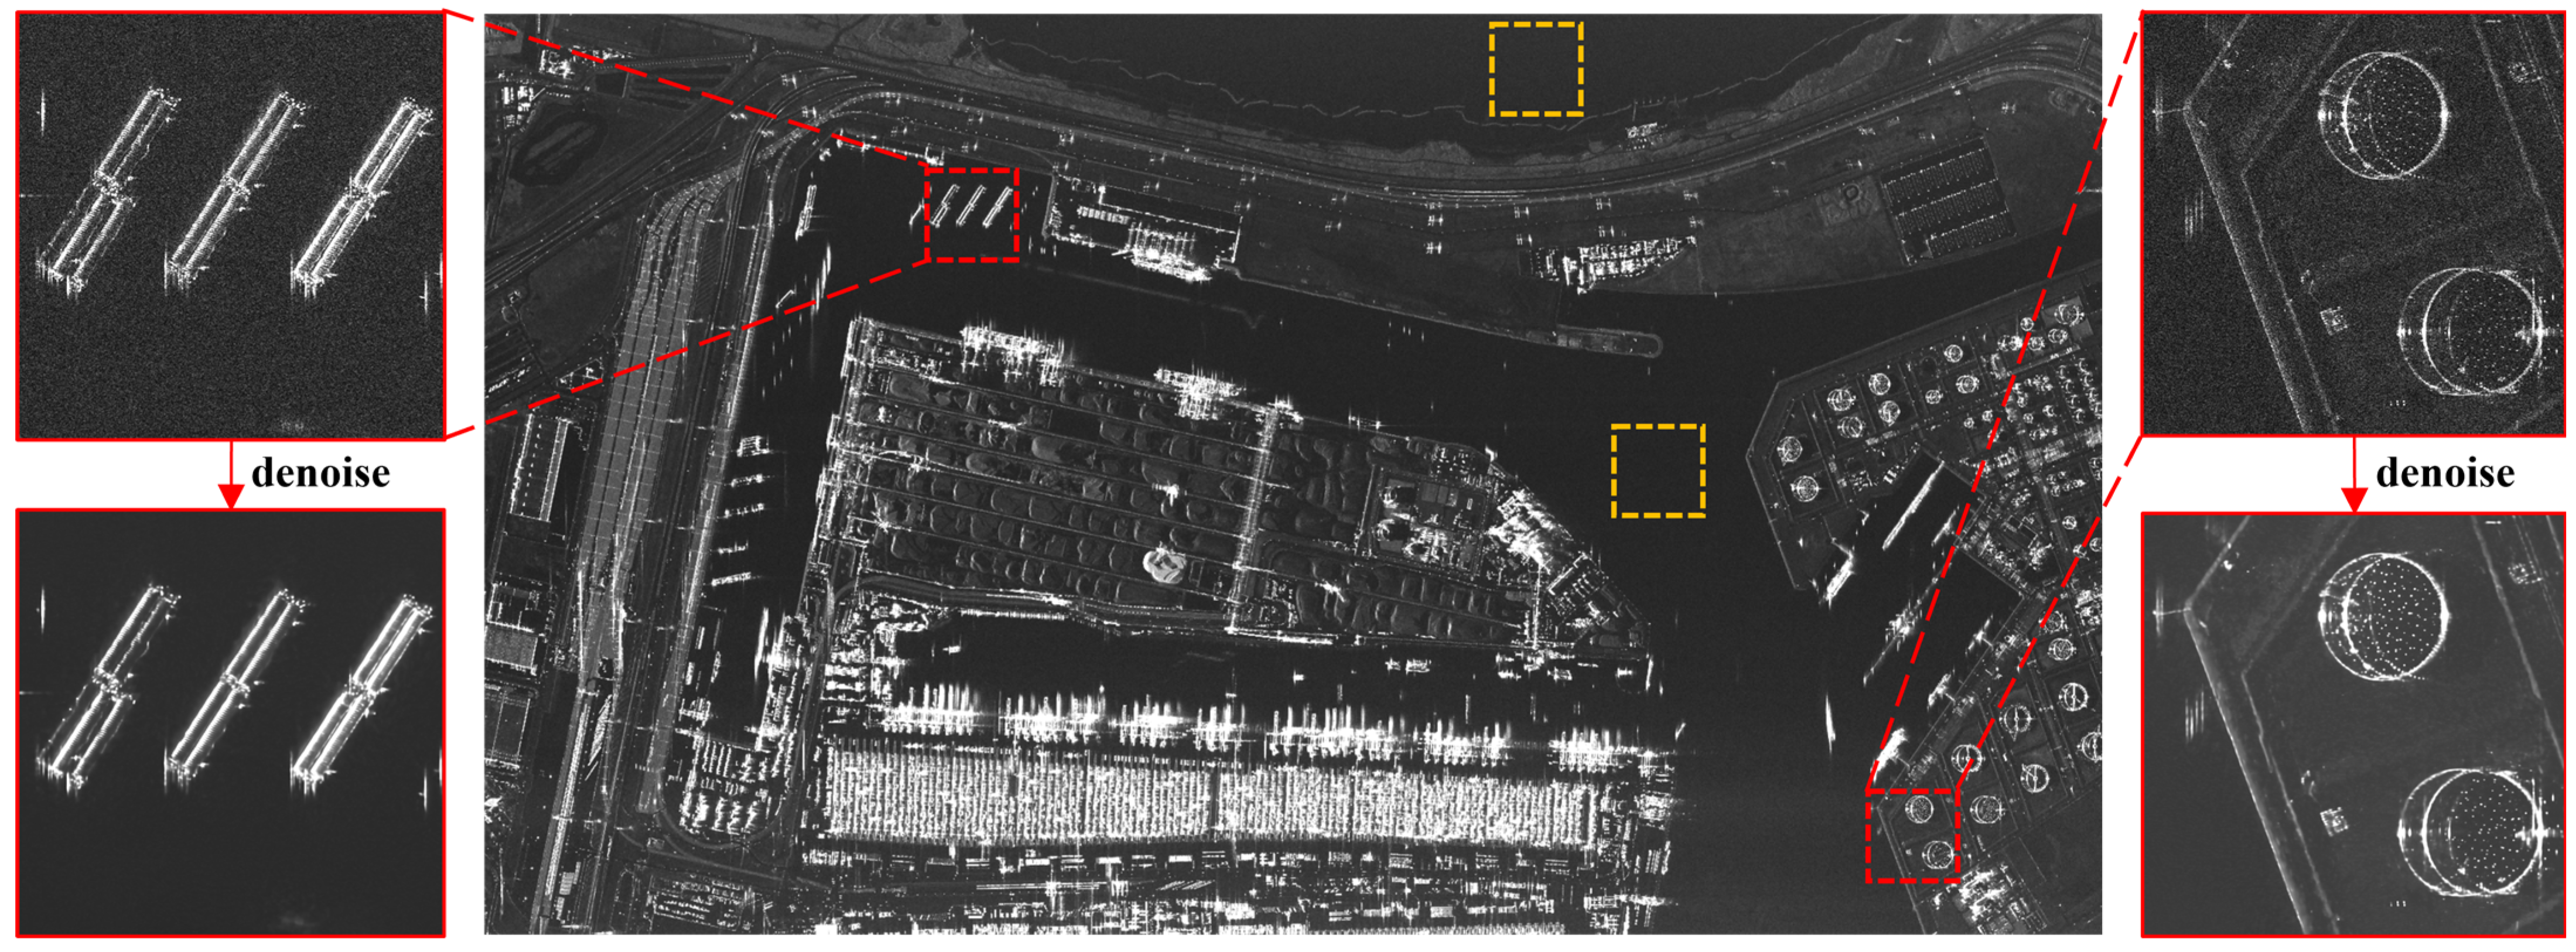
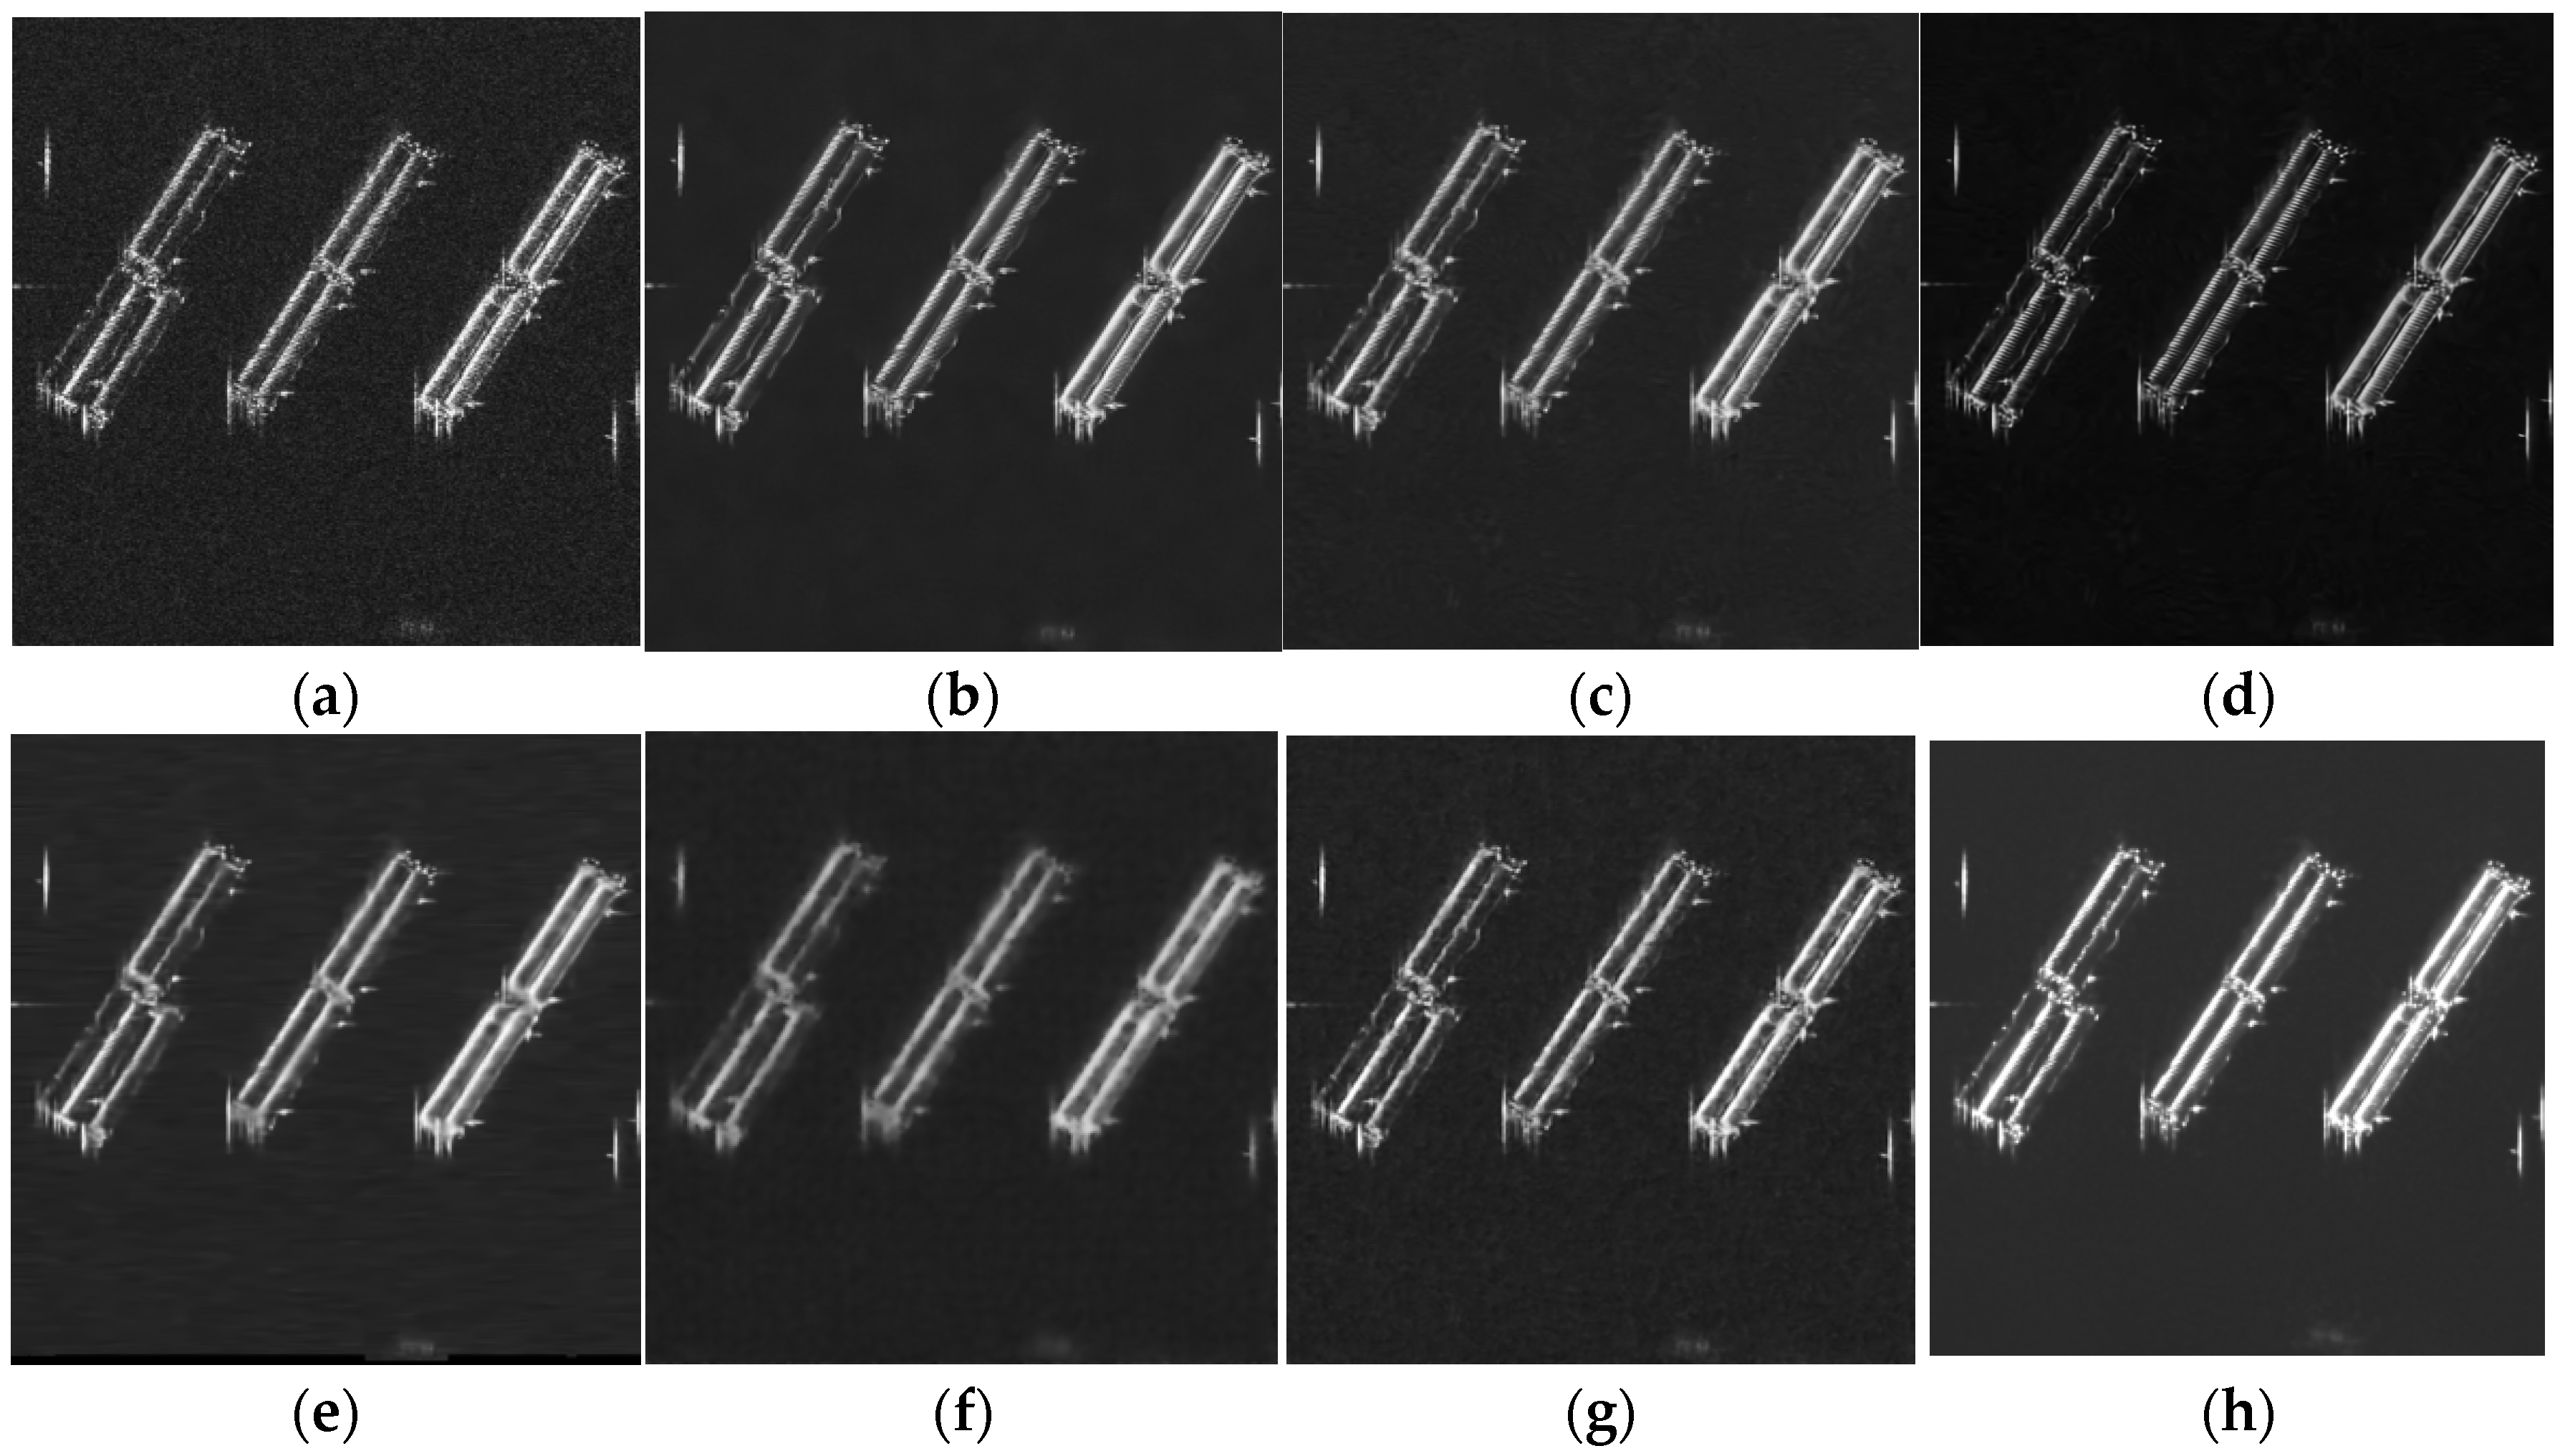
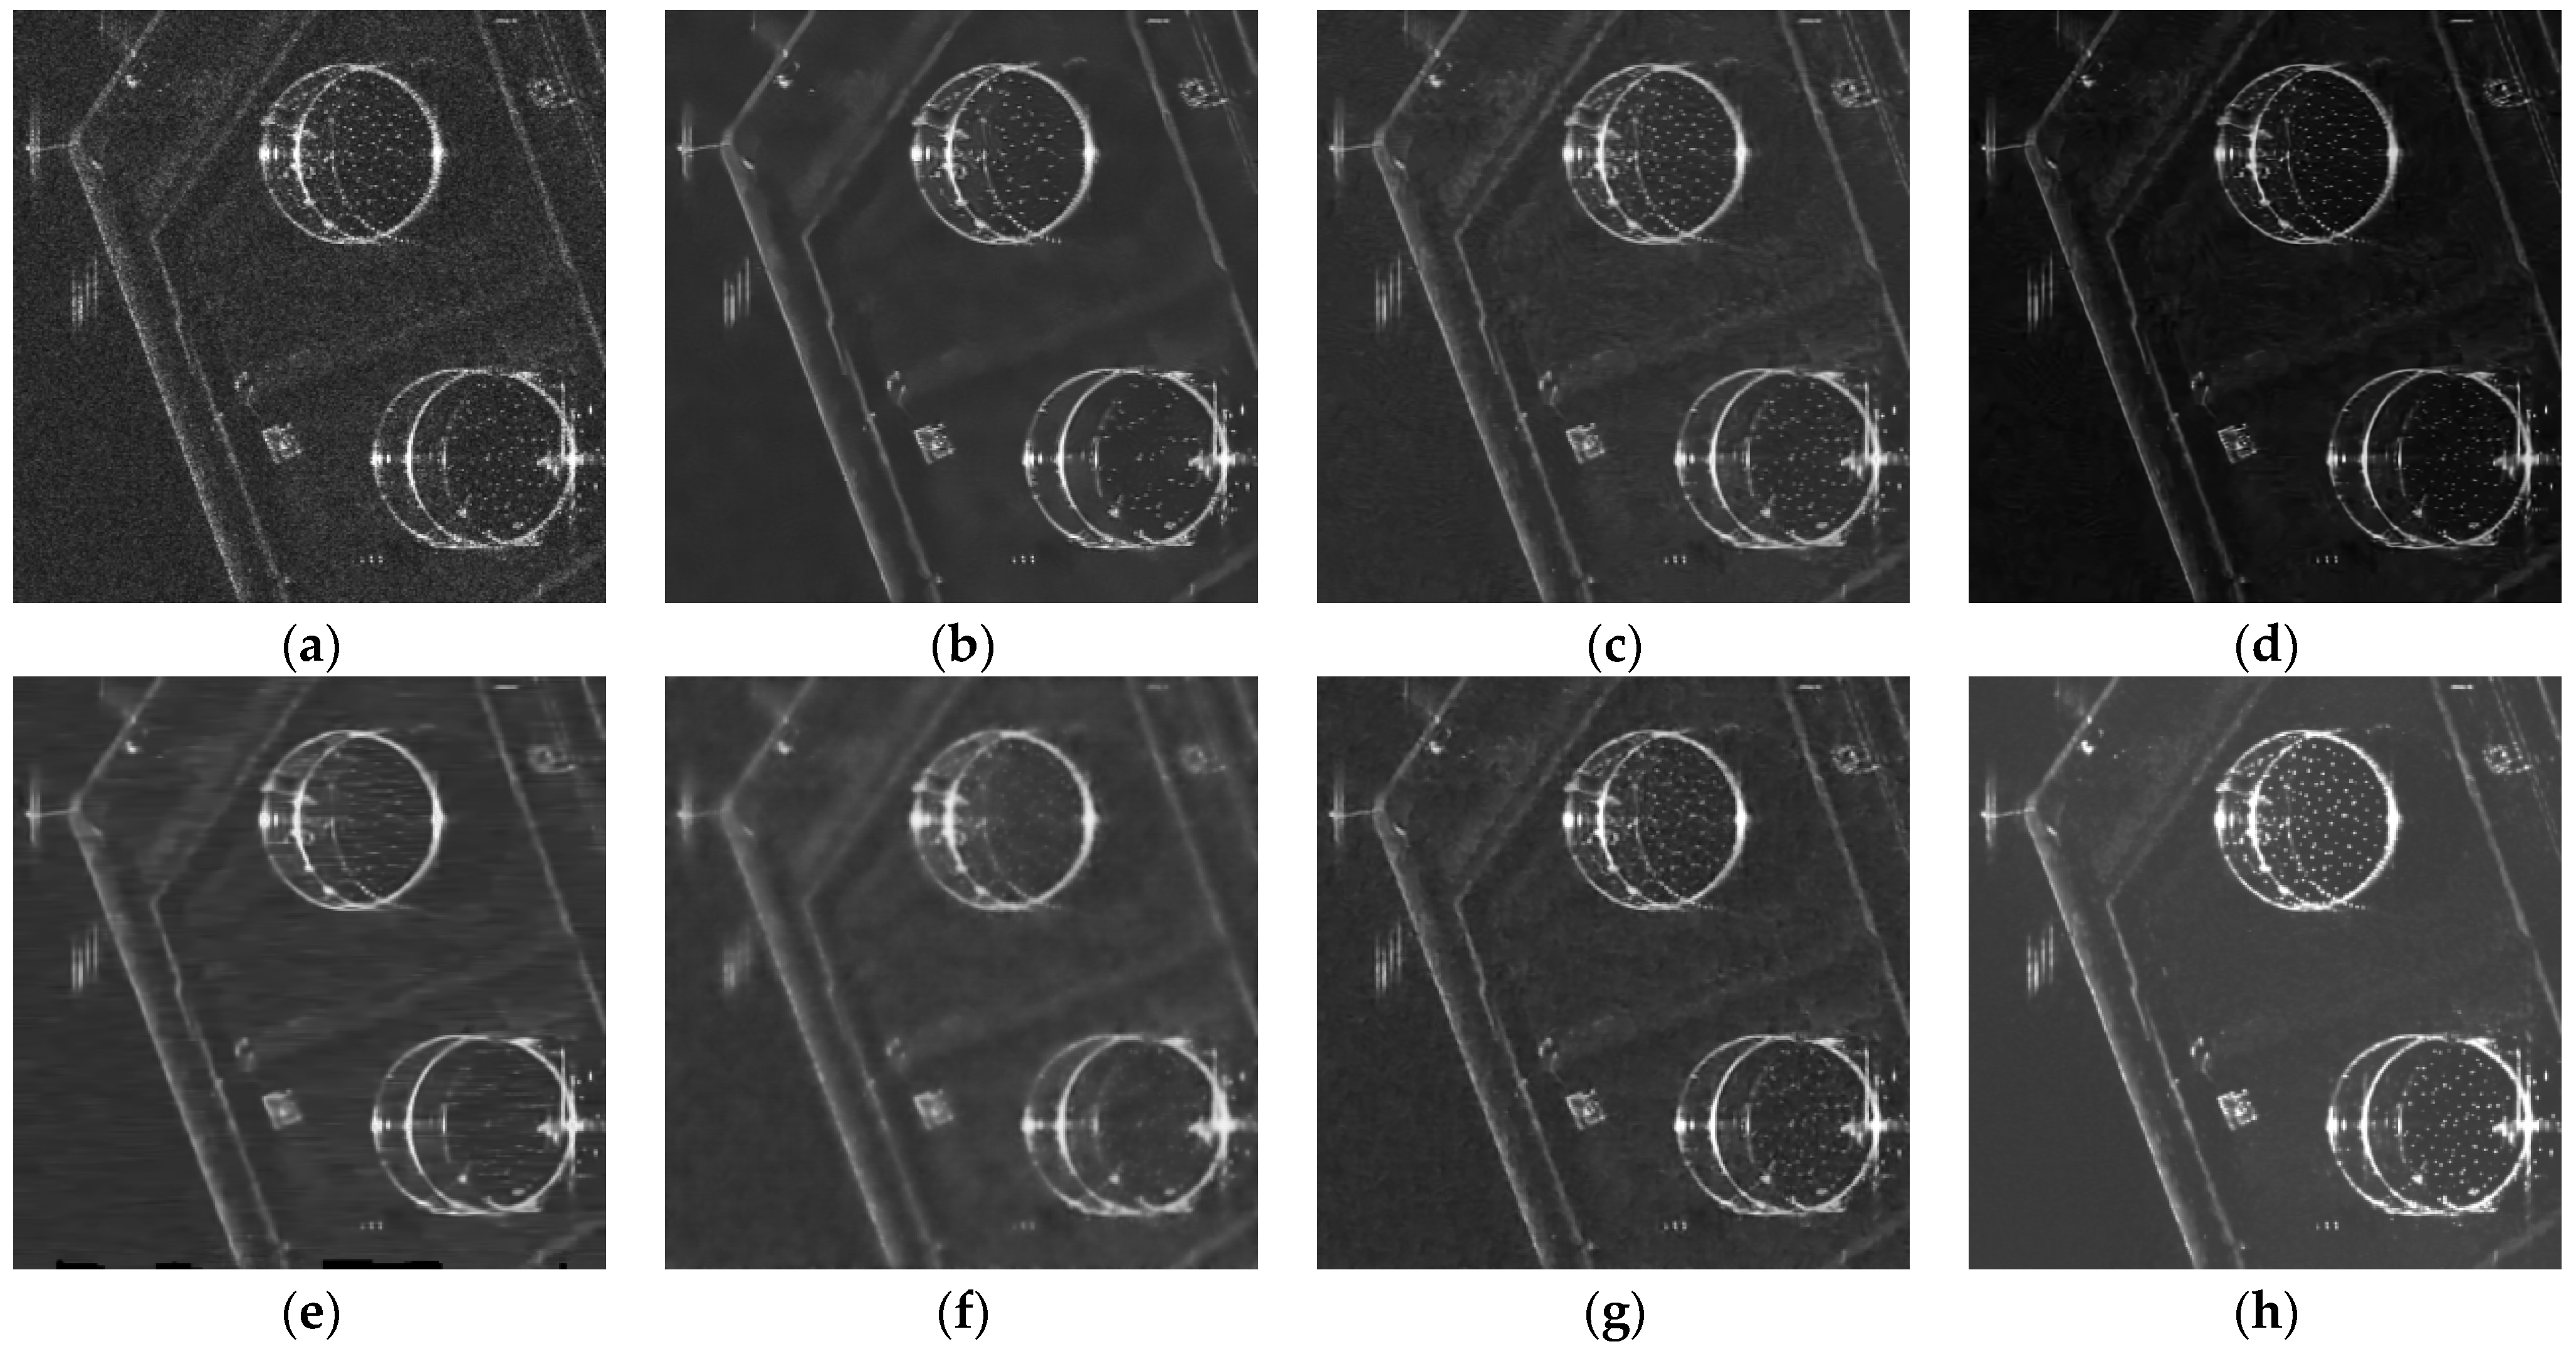
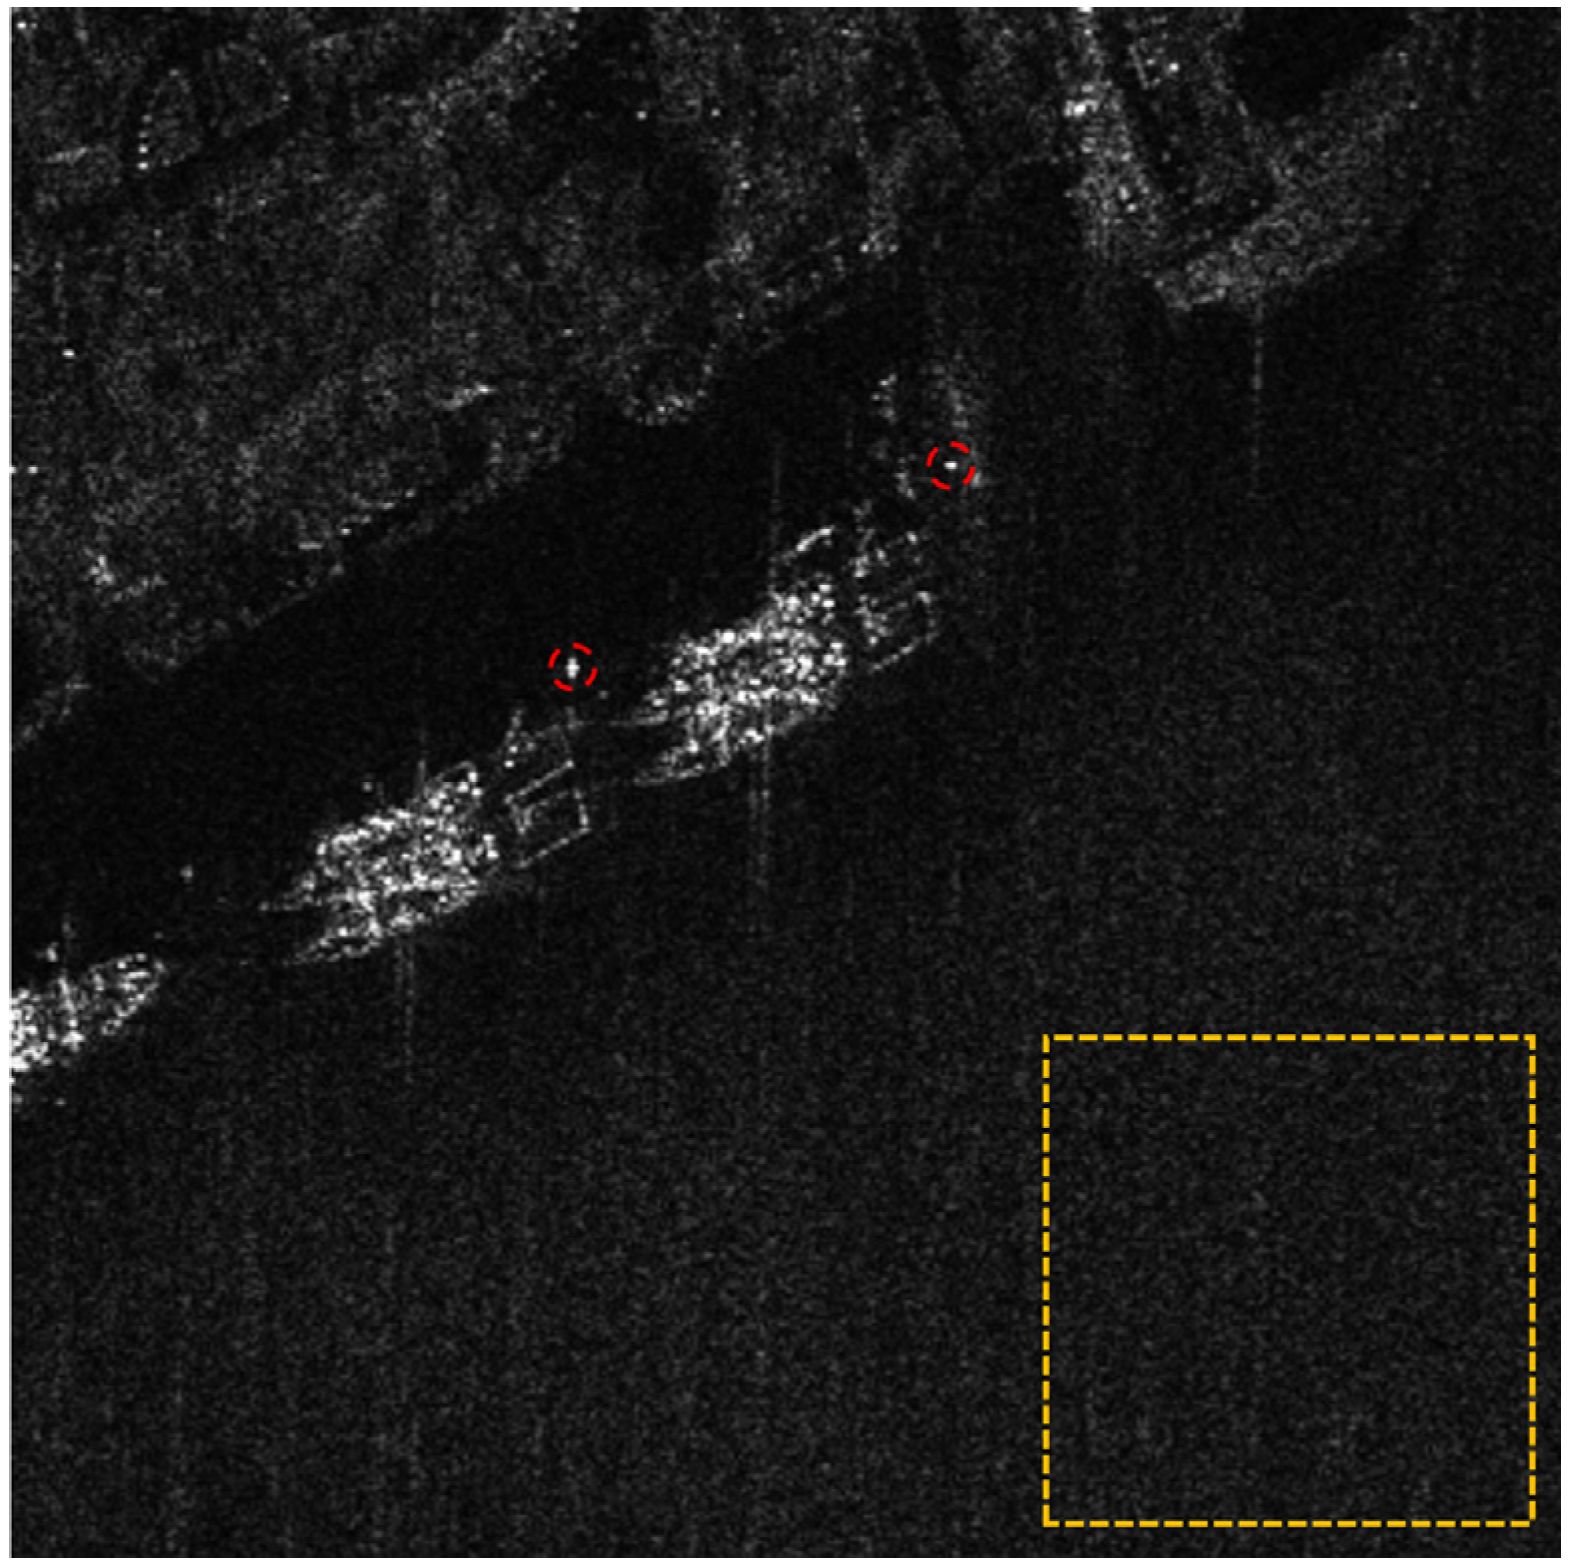
Figure 8 shows a real SAR image and selects some regions for denoising analysis. As shown in Figure 9 and Figure 10, various methods exhibit distinct limitations when processing an SAR image of a port scene. The PPB method reduces speckle noise but at the cost of losing some structural details. At the edges of targets such as oil tanks, certain features and textures become blurred and difficult to discern. Both SAR-BM3D and MuLoG methods introduce artifacts in stable background regions. For instance, irregular textures appear in the water surface after processing, interfering with the observation and analysis of the background. The FANS method introduces horizontal artifacts, manifesting as stripes inconsistent with the orientation of targets or background textures. SAR-Transformer and SAR-CAM, trained on simulated images, face challenges due to the gap between simulated and real SAR images. Consequently, they fail to achieve a balance between noise removal and target feature preservation in practical applications. When processing the real SAR images, they either over-suppress noise, leading to the loss of target features, or retain excessive noise, reducing target discernibility.
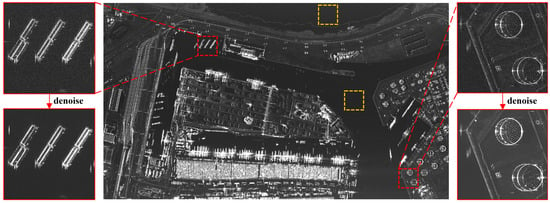
Figure 8.
Real SAR image used in the paper (the yellow area is used to calculate ENL, and the red area is used to display the noise reduction effect).
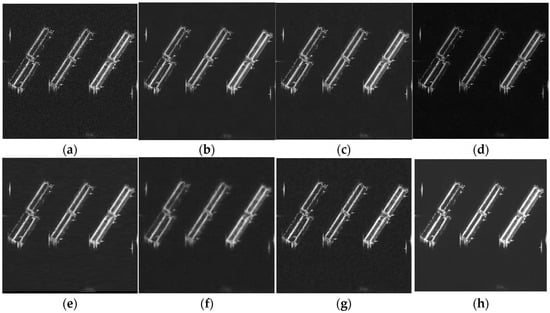
Figure 9.
Results for a ship image using different methods on a real SAR image: (a) noisy image; (b) PPB; (c) SAR-BM3D; (d) MuLoG; (e) FANS; (f) SAR-Transformer; (g) SAR-CAM; (h) proposed method.
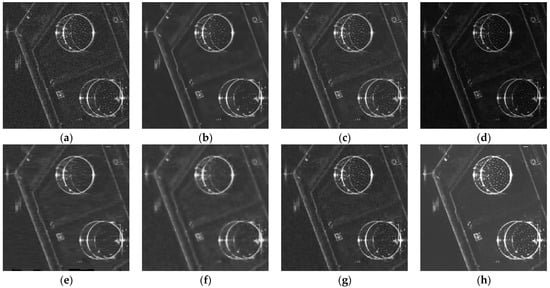
Figure 10.
Results for an oil tank image using different methods on a real SAR image: (a) noisy image; (b) PPB; (c) SAR-BM3D; (d) MuLoG; (e) FANS; (f) SAR-Transformer; (g) SAR-CAM; (h) proposed method.
In contrast, the proposed method based on subaperture decomposition and non-local low-rank tensor approximation demonstrates exceptional performance. It effectively suppresses speckle noise while precisely preserving the detailed features of primary targets such as cargo ships and oil tanks. As shown in Figure 9 and Figure 10, the processed images exhibit clear target contours and intact fine structures. In stable background regions, no artifacts are introduced, maintaining consistency and purity. Combined with the ENL values in Table 2, the proposed method achieves significantly higher ENL values than other methods, further validating its superior speckle suppression capability in homogeneous regions. These results comprehensively confirm the effectiveness and advancement of the proposed method in SAR image despeckling task.

Table 2.
Average quantitative result of the real dataset.
5. Discussion
5.1. Ablation Experiment
Ablation experiments were performed to verify the effectiveness of each component in the proposed method, with their design aligned with the objective function (Equation (5)). It should be noted that the first term in the equation corresponds to tensor decomposition, which functions as a data preprocessing step rather than a denoising-specific module. Thus, it was not included as an independent variable in the ablation analysis. Instead, subaperture decomposition was treated as an integrated unit in the experiments, where the denoising result of standalone subaperture decomposition is equivalent to multi-look processing. The specific experimental groups and their corresponding configurations are detailed in Table 3.

Table 3.
Ablation experiment.
Figure 11 presents the processing results, with yellow regions indicating homogeneous areas for quantitative evaluation using ENL. In Figure 11b, compared with the noisy image, speckle noise is moderately reduced and visual quality is improved to a certain extent. However, residual noise remains noticeable, indicating that multi-look processing alone cannot achieve sufficient denoising. In Figure 11c, after combining subaperture decomposition with non-local denoising, the noise suppression effect is significantly enhanced, leading to a higher ENL value. Nevertheless, some detailed features in the top-left building area are blurred or lost, as non-local filtering tends to over-smooth edge structures. In Figure 11d, by incorporating the edge-preserving regularization term, the over-smoothing issue is effectively alleviated. The top-left building edges are well-preserved, while the noise suppression effect in the bottom-right homogeneous area remains robust. This demonstrates that the edge-preserving regularization term successfully balances noise reduction and detail retention.

Figure 11.
Results of ablation experiments, where the yellow area is used to calculate ENL. (a) Noisy image; (b) subaperture decomposition; (c) subaperture decomposition and non-local denoising; (d) proposed method.
5.2. Analysis of Iteration Times and Subaperture Quantity
The proposed method, based on subaperture decomposition and non-local low-rank tensor approximation, aims to suppress speckle noise in SAR images. In the proposed method, two variable parameters influence the resolution and texture structure of the denoised image: the number of subaperture images and the number of iterations. This section experimentally determines the optimal values for and the iteration count, accompanied by in-depth analyses.
Firstly, regarding the analysis of iterations times. Each iteration involves a denoising operation that progressively reduces image structural details. Figure 12 compares denoising results under identical conditions but with varying iteration counts. As the number of iterations increases, visible degradation in the structural integrity and resolution of ship targets is observed. Experiments on simulated images reveal that setting the iteration count to 2 achieves the optimal balance between noise suppression and structural preservation, as quantitatively shown in Table 4.

Figure 12.
The denoising results for different iteration numbers; (a–e) correspond to iteration numbers from 1 to 5.

Table 4.
Indicators under different iteration times.
The following is an analysis of subaperture quantity. As quantified in Table 5, both azimuth resolution and ENL exhibit dependency on the subaperture configuration. The relative resolution metric, derived from the averaged 3 dB width of point spread functions for dual isolated scattering reference points (marked by red circles in Figure 13), follows the established evaluation protocol in [42]. This approach ensures measurement robustness against localized speckle variations.

Table 5.
Relative resolution and ENL corresponding to different numbers of subapertures.
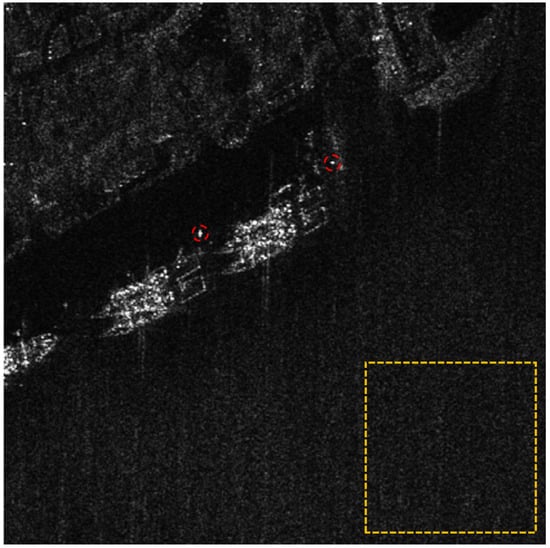
Figure 13.
Two strong scattering points in the red area are used to calculate relative resolution, while the yellow area is used to calculate ENL.
Experimental results demonstrate a non-linear relationship between subaperture quantity and denoising performance. Initially, as increases from 3 to 5, the relative azimuth resolution exhibits minimal degradation (1.12 to 1.09), retaining near-original image sharpness. Beyond this threshold, however, resolution deteriorates markedly, reaching 1.81 at —an 81% loss compared to the original image. The Equivalent Number of Looks (ENL) initially improves with increasing , peaking at 30.97 for , but subsequently declines to 27.15 at . This behavior stems from two competing effects:
- (1)
- Resolution–noise interplay:
Higher subaperture counts inherently reduce individual subimage resolution due to narrowed Doppler bandwidths. While moderate values (3–5) preserve sufficient resolution for effective speckle estimation, excessive decomposition () introduces severely degraded subaperture images where noise dominates scattering signatures
- (2)
- Information utility limit:
Limited subapertures () provide complementary angular observations that enhance noise suppression, whereas overly decompositions () generate redundant low-resolution references contaminated by amplified speckle residuals.
The optimal balance occurs at , achieving high ENL (30.97) while maintaining 91% of the original resolution. This configuration ensures robust speckle suppression without significant loss of critical scattering details.
6. Conclusions
In this paper, we propose a speckle suppression method based on subaperture decomposition and non-local low-rank tensor approximation to address the challenge of speckle noise in SAR images. The proposed method establishes a novel despeckling paradigm that leverages subaperture images as auxiliary information. By capitalizing on the global structural similarity among subaperture images for speckle noise elimination, it circumvents the severe resolution reduction issue inherent in multi-look processing. Regarding problem modeling, we propose non-local denoising and edge-preserving regularization terms to achieve a better balance between noise suppression and detail retention. Experimental results demonstrate that, across both synthetic and real SAR image, the proposed method surpasses six other speckle suppression methods, including SAR-BM3D and SAR-CAM, in evaluation metrics such as SSIM, PSNR, and ENL. Visual comparisons further reveal that our method can precisely preserve target structures and background details while effectively removing noise in diverse scenes, thus overcoming problems like artifacts, edge blurring, and target-feature loss that plague other methods. In summary, the method proposed in this paper offers a fresh perspective on SAR image speckle noise suppression and showcases remarkable performance in enhancing SAR image quality.
Future research will focus on optimizing low-rank tensor decomposition by exploring dynamic relationships between subapertures, integrating deep learning modules to improve computational efficiency while retaining generalization, and extending the framework to time-series SAR images for broader remote sensing applications.
Author Contributions
Conceptualization, X.A. and H.Z.; methodology, X.A.; software, X.A.; validation, X.A., H.Z. and Z.L.; formal analysis, X.A. and Y.L.; investigation, X.A. and Z.L.; resources, X.A.; data curation, X.A.; writing—original draft preparation, X.A.; writing—review and editing, all authors; visualization, X.A.; supervision, W.Y. and W.X.; project administration, W.Y. and W.X.; funding acquisition, W.Y. All authors have read and agreed to the published version of the manuscript.
Funding
This research was supported in part by the National Key Research and Development Program of China under grant No. 2023YFB3904901.
Data Availability Statement
The original satellite data used in this study can be obtained from the European Space Agency (ESA).
Conflicts of Interest
The authors declare no conflicts of interest.
References
- Yuan, J.; Lv, X.; Li, R. A Speckle Filtering Method Based on Hypothesis Testing for Time-Series SAR Images. Remote Sens. 2018, 10, 1383. [Google Scholar] [CrossRef]
- Wu, Y.; Suo, Y.; Meng, Q.; Dai, W.; Miao, T.; Zhao, W.; Yan, Z.; Diao, W.; Xie, G.; Ke, Q.; et al. FAIR-CSAR: A Benchmark Dataset for Fine-Grained Object Detection and Recognition Based on Single-Look Complex SAR Images. IEEE Trans. Geosci. Remote Sens. 2025, 63, 5201022. [Google Scholar] [CrossRef]
- Argenti, F.; Lapini, A.; Bianchi, T.; Alparone, L. A Tutorial on Speckle Reduction in Synthetic Aperture Radar Images. IEEE Geosci. Remote Sens. Mag. 2013, 1, 6–35. [Google Scholar] [CrossRef]
- Dalsasso, E.; Denis, L.; Tupin, F. SAR2SAR: A self-supervised despeckling algorithm for SAR images. J. Sel. Top. Appl. Earth Observ. Remote Sens. 2021, 14, 4321–4329. [Google Scholar] [CrossRef]
- Dalsasso, E.; Yang, X.; Denis, L.; Tupin, F.; Yang, W. SAR Image Despeckling by Deep Neural Networks: From a Pre-Trained Model to an End-to-End Training Strategy. Remote Sens. 2020, 12, 2636. [Google Scholar] [CrossRef]
- Li, C.; Yu, Z.; Chen, J. Overview of Techniques for Improving High—Resolution Spaceborne SAR Imaging and Image Quality. J. Radars 2019, 8, 717–731. [Google Scholar] [CrossRef]
- Hu, R.; Lin, H.; Lu, Z.; Xia, J. Despeckling Representation for Data-Efficient SAR Ship Detection. IEEE Geosci. Remote Sens. Lett. 2024, 22, 4002005. [Google Scholar] [CrossRef]
- Lee, J.-S. A Simple Speckle Smoothing Algorithm for Synthetic Aperture Radar Images. IEEE Trans. Syst. Man Cybern.-Syst. 1983, SMC-13, 85–89. [Google Scholar] [CrossRef]
- Kuan, D.; Sawchuk, A.; Strand, T.; Chavel, P. Adaptive Restoration of Images with Speckle. IEEE Trans. Acoust. Speech Signal Process. 1987, 35, 373–383. [Google Scholar] [CrossRef]
- Frost, V.S.; Stiles, J.A.; Shanmugan, K.S.; Holtzman, J.C. A Model for Radar Images and Its Application to Adaptive Digital Filtering of Multiplicative Noise. IEEE Trans. Pattern Anal. Machine Intell. 1982, PAMI-4, 157–166. [Google Scholar] [CrossRef] [PubMed]
- Pan, Y.; Zhong, L.; Chen, J.; Li, H.; Zhang, X.; Pan, B. SAR Image Despeckling Based on Denoising Diffusion Probabilistic Model and Swin Transformer. Remote Sens. 2024, 16, 3222. [Google Scholar] [CrossRef]
- Jain, V.; Shitole, S.; Rahman, M. Performance evaluation of DFT based speckle reduction framework for synthetic aperture radar (SAR) images at different frequencies and image regions. Remote Sens. Appl. Soc. Environ. 2023, 31, 101001. [Google Scholar] [CrossRef]
- Argenti, F.; Alparone, L. Speckle Removal from SAR Images in the Undecimated Wavelet Domain. IEEE Trans. Geosci. Remote Sens. 2002, 40, 2363–2374. [Google Scholar] [CrossRef]
- Xu, L.; Liu, P.; Jin, Y.-Q. A New Nonlocal Iterative Trilateral Filter for SAR Images Despeckling. IEEE Trans. Geosci. Remote Sens. 2024, 62, 5213319. [Google Scholar] [CrossRef]
- Deledalle, C.-A.; Denis, L.; Tupin, F. Iterative Weighted Maximum Likelihood Denoising with Probabilistic Patch-Based Weights. IEEE Trans. Image Process. 2009, 18, 2661–2672. [Google Scholar] [CrossRef]
- Parrilli, S.; Poderico, M.; Angelino, C.V.; Verdoliva, L. A Nonlocal SAR Image Denoising Algorithm Based on LLMMSE Wavelet Shrinkage. IEEE Trans. Geosci. Remote Sens. 2012, 50, 606–616. [Google Scholar] [CrossRef]
- Bo, F.; Ma, X.; Hu, S.; An, G.; Li, Y.; Cen, Y. Speckle-Driven Unsupervised Despeckling for SAR Images. IEEE J. Sel. Top. Appl. Earth Obs. Remote Sens. 2025, 18, 13023–13034. [Google Scholar] [CrossRef]
- Yang, X.; Denis, L.; Tupin, F.; Yang, W. SAR Image Despeckling Using Pre-trained Convolutional Neural Network Models. In Proceedings of the 2019 Joint Urban Remote Sensing Event (JURSE), Vannes, France, 22–24 May 2019; pp. 1–4. [Google Scholar] [CrossRef]
- Vitale, S.; Ferraioli, G.; Pascazio, V. Multi-Objective CNN-Based Algorithm for SAR Despeckling. IEEE Trans. Geosci. Remote Sens. 2021, 59, 9336–9349. [Google Scholar] [CrossRef]
- Ko, J.; Lee, S. SAR Image Despeckling Using Continuous Attention Module. IEEE J. Sel. Top. Appl. Earth Observ. Remote Sens. 2022, 15, 3–19. [Google Scholar] [CrossRef]
- Molini, A.B.; Valsesia, D.; Fracastoro, G.; Magli, E. Speckle2Void: Deep Self-Supervised SAR Despeckling With Blind-Spot Convolutional Neural Networks. IEEE Trans. Geosci. Remote Sens. 2022, 60, 5204017. [Google Scholar] [CrossRef]
- Vitale, S.; Ferraioli, G.; Pascazio, V. Analysis on the Building of Training Dataset for Deep Learning SAR Despeckling. IEEE Geosci. Remote Sens. Lett. 2022, 19, 4015005. [Google Scholar] [CrossRef]
- Yu, J.; Pan, B.; Yu, Z.; Li, C.; Wu, X. Collaborative Optimization for SAR Image Despeckling With Structure Preservation. IEEE Trans. Geosci. Remote Sens. 2025, 63, 5201712. [Google Scholar] [CrossRef]
- Vitale, S.; Ferraioli, G.; Pascazio, V.; Deniz, L.G. Enhanced Deep Learning SAR Despeckling Networks Based on SAR Assessing Metrics. IEEE Geosci. Remote Sens. Lett. 2025, 22, 4009305. [Google Scholar] [CrossRef]
- Amao-Oliva, J.; Foix-Colonier, N.; Sica, F. Joint compression and despeckling by SAR representation learning. ISPRS J. Photogramm. Remote Sens. 2025, 220, 524–534. [Google Scholar] [CrossRef]
- Wang, R.; Wang, Z.; Chen, Y.; Kang, H.; Luo, F.; Liu, Y. Target Recognition in SAR Images Using Complex-Valued Network Guided with Sub-Aperture Decomposition. Remote Sens. 2023, 15, 4031. [Google Scholar] [CrossRef]
- Marino, A.; Sanjuan-Ferrer, M.J.; Hajnsek, I.; Ouchi, K. Ship Detection with Spectral Analysis of Synthetic Aperture Radar: A Comparison of New and Well-Known Algorithms. Remote Sens. 2015, 7, 5416–5439. [Google Scholar] [CrossRef]
- Wang, Z.; Fu, X.; Xia, K. Target Classification for Single-Channel SAR Images Based on Transfer Learning With Subaperture Decomposition. IEEE Geosci. Remote Sens. Lett. 2022, 19, 4003205. [Google Scholar] [CrossRef]
- Ristea, N.-C.; Anghel, A.; Datcu, M.; Chapron, B. Guided Deep Learning by Subaperture Decomposition: Ocean Patterns from SAR Imagery. In Proceedings of the 2022 IEEE International Geoscience and Remote Sensing Symposium, Kuala Lumpur, Malaysia, 17–22 July 2022; pp. 6825–6828. [Google Scholar] [CrossRef]
- Ristea, N.-C.; Anghel, A.; Datcu, M.; Chapron, B. Guided Unsupervised Learning by Subaperture Decomposition for Ocean SAR Image Retrieval. IEEE Trans. Geosci. Remote Sens. 2023, 61, 5207111. [Google Scholar] [CrossRef]
- Yang, Z.; Fang, L.; Shen, B.; Liu, T. PolSAR Ship Detection Based on Azimuth Sublook Polarimetric Covariance Matrix. IEEE J. Sel. Top. Appl. Earth Observ. Remote Sens. 2022, 15, 8506–8518. [Google Scholar] [CrossRef]
- Guan, D.; Xiang, D.; Tang, X.; Kuang, G. SAR Image Despeckling Based on Nonlocal Low-Rank Regularization. IEEE Trans. Geosci. Remote Sens. 2019, 57, 3472–3489. [Google Scholar] [CrossRef]
- Chen, G.; Li, G.; Liu, Y.; Zhang, X.-P.; Zhang, L. SAR Image Despeckling Based on Combination of Fractional-Order Total Variation and Nonlocal Low Rank Regularization. IEEE Trans. Geosci. Remote Sens. 2020, 58, 2056–2070. [Google Scholar] [CrossRef]
- Xing, X.; Chen, Q.; Yang, S.; Liu, X. Feature-Based Nonlocal Polarimetric SAR Filtering. Remote Sens. 2017, 9, 1043. [Google Scholar] [CrossRef]
- Choi, H.; Jeong, J. Speckle Noise Reduction Technique for SAR Images Using Statistical Characteristics of Speckle Noise and Discrete Wavelet Transform. Remote Sens. 2019, 11, 1184. [Google Scholar] [CrossRef]
- He, W.; Yao, Q.; Li, C.; Yokoya, N.; Zhao, Q. Non-Local Meets Global: An Integrated Paradigm for Hyperspectral Denoising. In Proceedings of the IEEE Conference on Computer Vision and Pattern Recognition (CVPR), Long Beach, CA, USA, 15–20 June 2019; pp. 6861–6870. [Google Scholar] [CrossRef]
- He, W.; Yao, Q.; Li, C.; Yokoya, N.; Zhao, Q.; Zhang, H.; Zhang, L. Non-Local Meets Global: An Iterative Paradigm for Hyperspectral Image Restoration. IEEE Trans. Pattern Anal. Machine Intell. 2022, 44, 2089–2107. [Google Scholar] [CrossRef]
- Gu, S.; Zhang, L.; Zuo, W.; Feng, X. Weighted Nuclear Norm Minimization with Application to Image Denoising. In Proceedings of the IEEE Conference on Computer Vision and Pattern Recognition (CVPR), Columbus, OH, USA, 23–28 June 2014; pp. 2862–2869. [Google Scholar] [CrossRef]
- Deledalle, C.-A.; Denis, L.; Tabti, S.; Tupin, F. MuLoG, or How to Apply Gaussian Denoisers to Multi-Channel SAR Speckle Reduction? IEEE Trans. Image Process. 2017, 26, 4389–4403. [Google Scholar] [CrossRef]
- Cozzolino, D.; Parrilli, S.; Scarpa, G.; Poggi, G.; Verdoliva, L. Fast Adaptive Nonlocal SAR Despeckling. IEEE Geosci. Remote Sens. Lett. 2014, 11, 524–528. [Google Scholar] [CrossRef]
- Perera, M.V.; Bandara, W.G.C.; Valanarasu, J.M.J.; Patel, V.M. Transformer-Based SAR Image Despeckling. In Proceedings of the 2022 IEEE International Geoscience and Remote Sensing Symposium, Kuala Lumpur, Malaysia, 17–22 July 2022; pp. 751–754. [Google Scholar] [CrossRef]
- Suo, Y.; Wu, Y.; Miao, T.; Diao, W.; Sun, X.; Fu, K. Adaptive SAR Image Enhancement for Aircraft Detection via Speckle Suppression and Channel Combination. IEEE Trans. Geosci. Remote Sens. 2024, 62, 5219415. [Google Scholar] [CrossRef]
Disclaimer/Publisher’s Note: The statements, opinions and data contained in all publications are solely those of the individual author(s) and contributor(s) and not of MDPI and/or the editor(s). MDPI and/or the editor(s) disclaim responsibility for any injury to people or property resulting from any ideas, methods, instructions or products referred to in the content. |
© 2025 by the authors. Licensee MDPI, Basel, Switzerland. This article is an open access article distributed under the terms and conditions of the Creative Commons Attribution (CC BY) license (https://creativecommons.org/licenses/by/4.0/).

