
Tectonic Rift-Related Manganese Mineralization System and Its Geophysical Signature in the Nanpanjiang Basin

Abstract

1. Introduction
2. Geological Background and Mineralization of the Nanpanjiang Basin
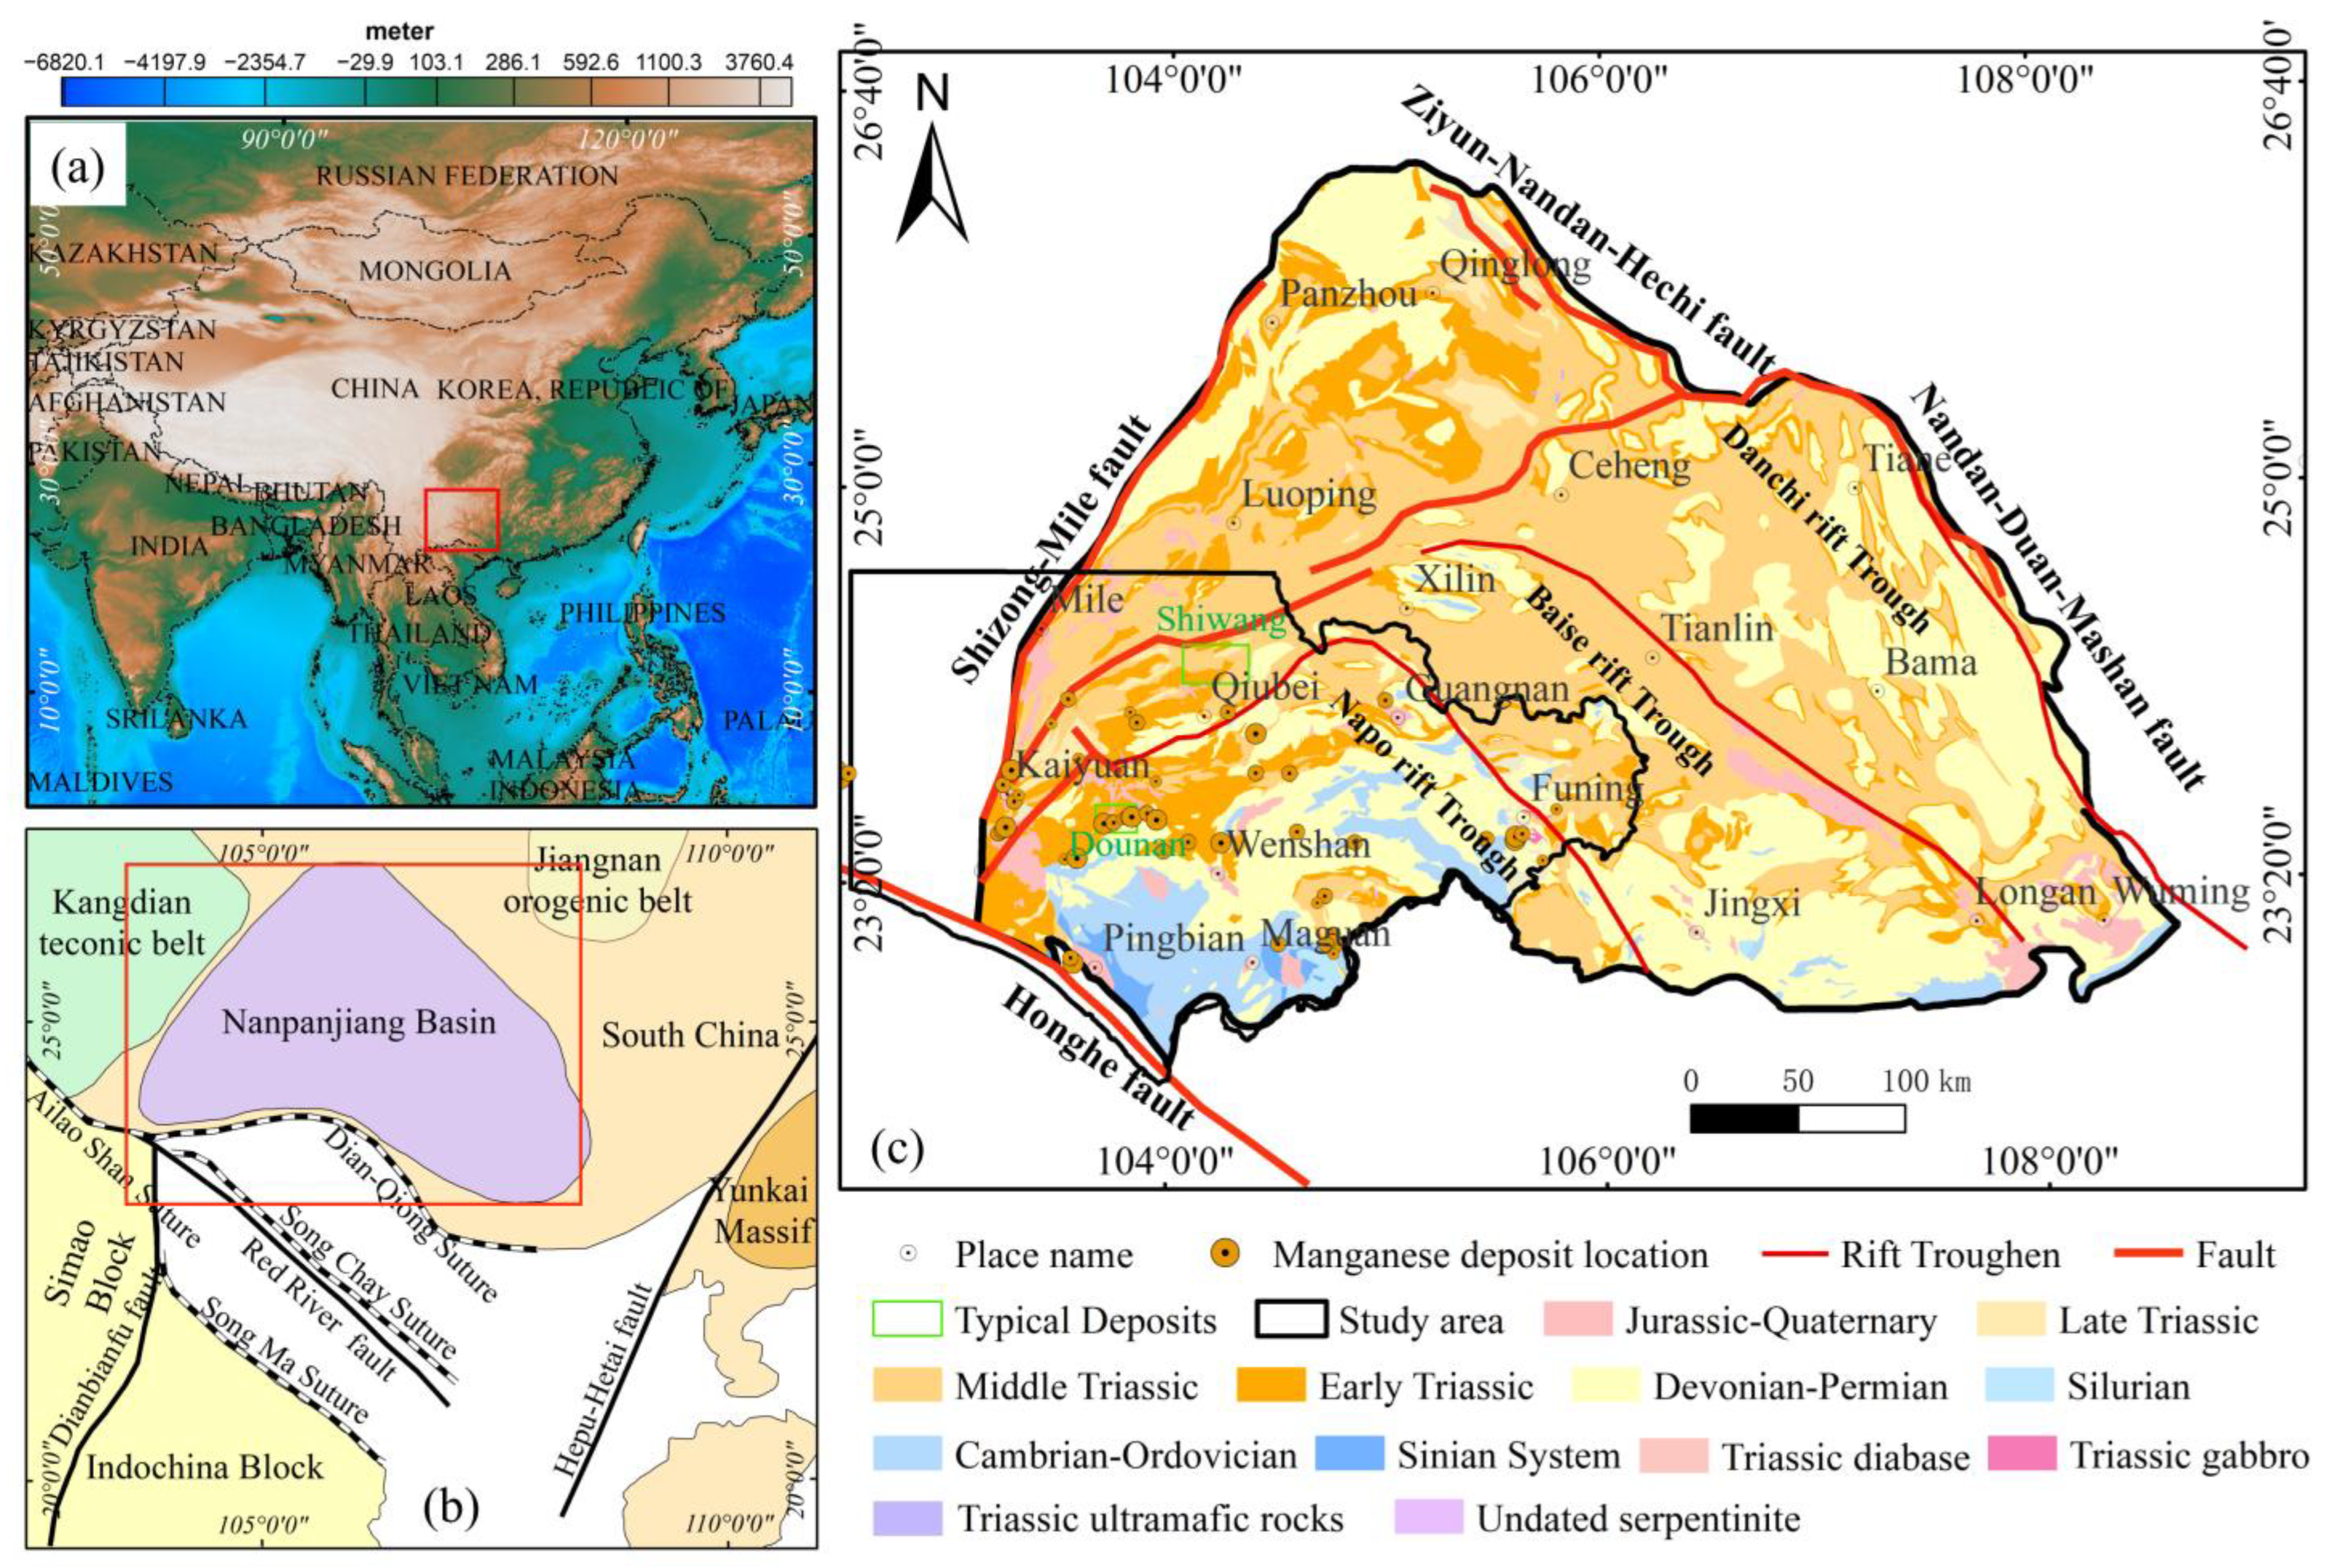
2.1. Regional Geological Setting
2.2. Deposit Geology
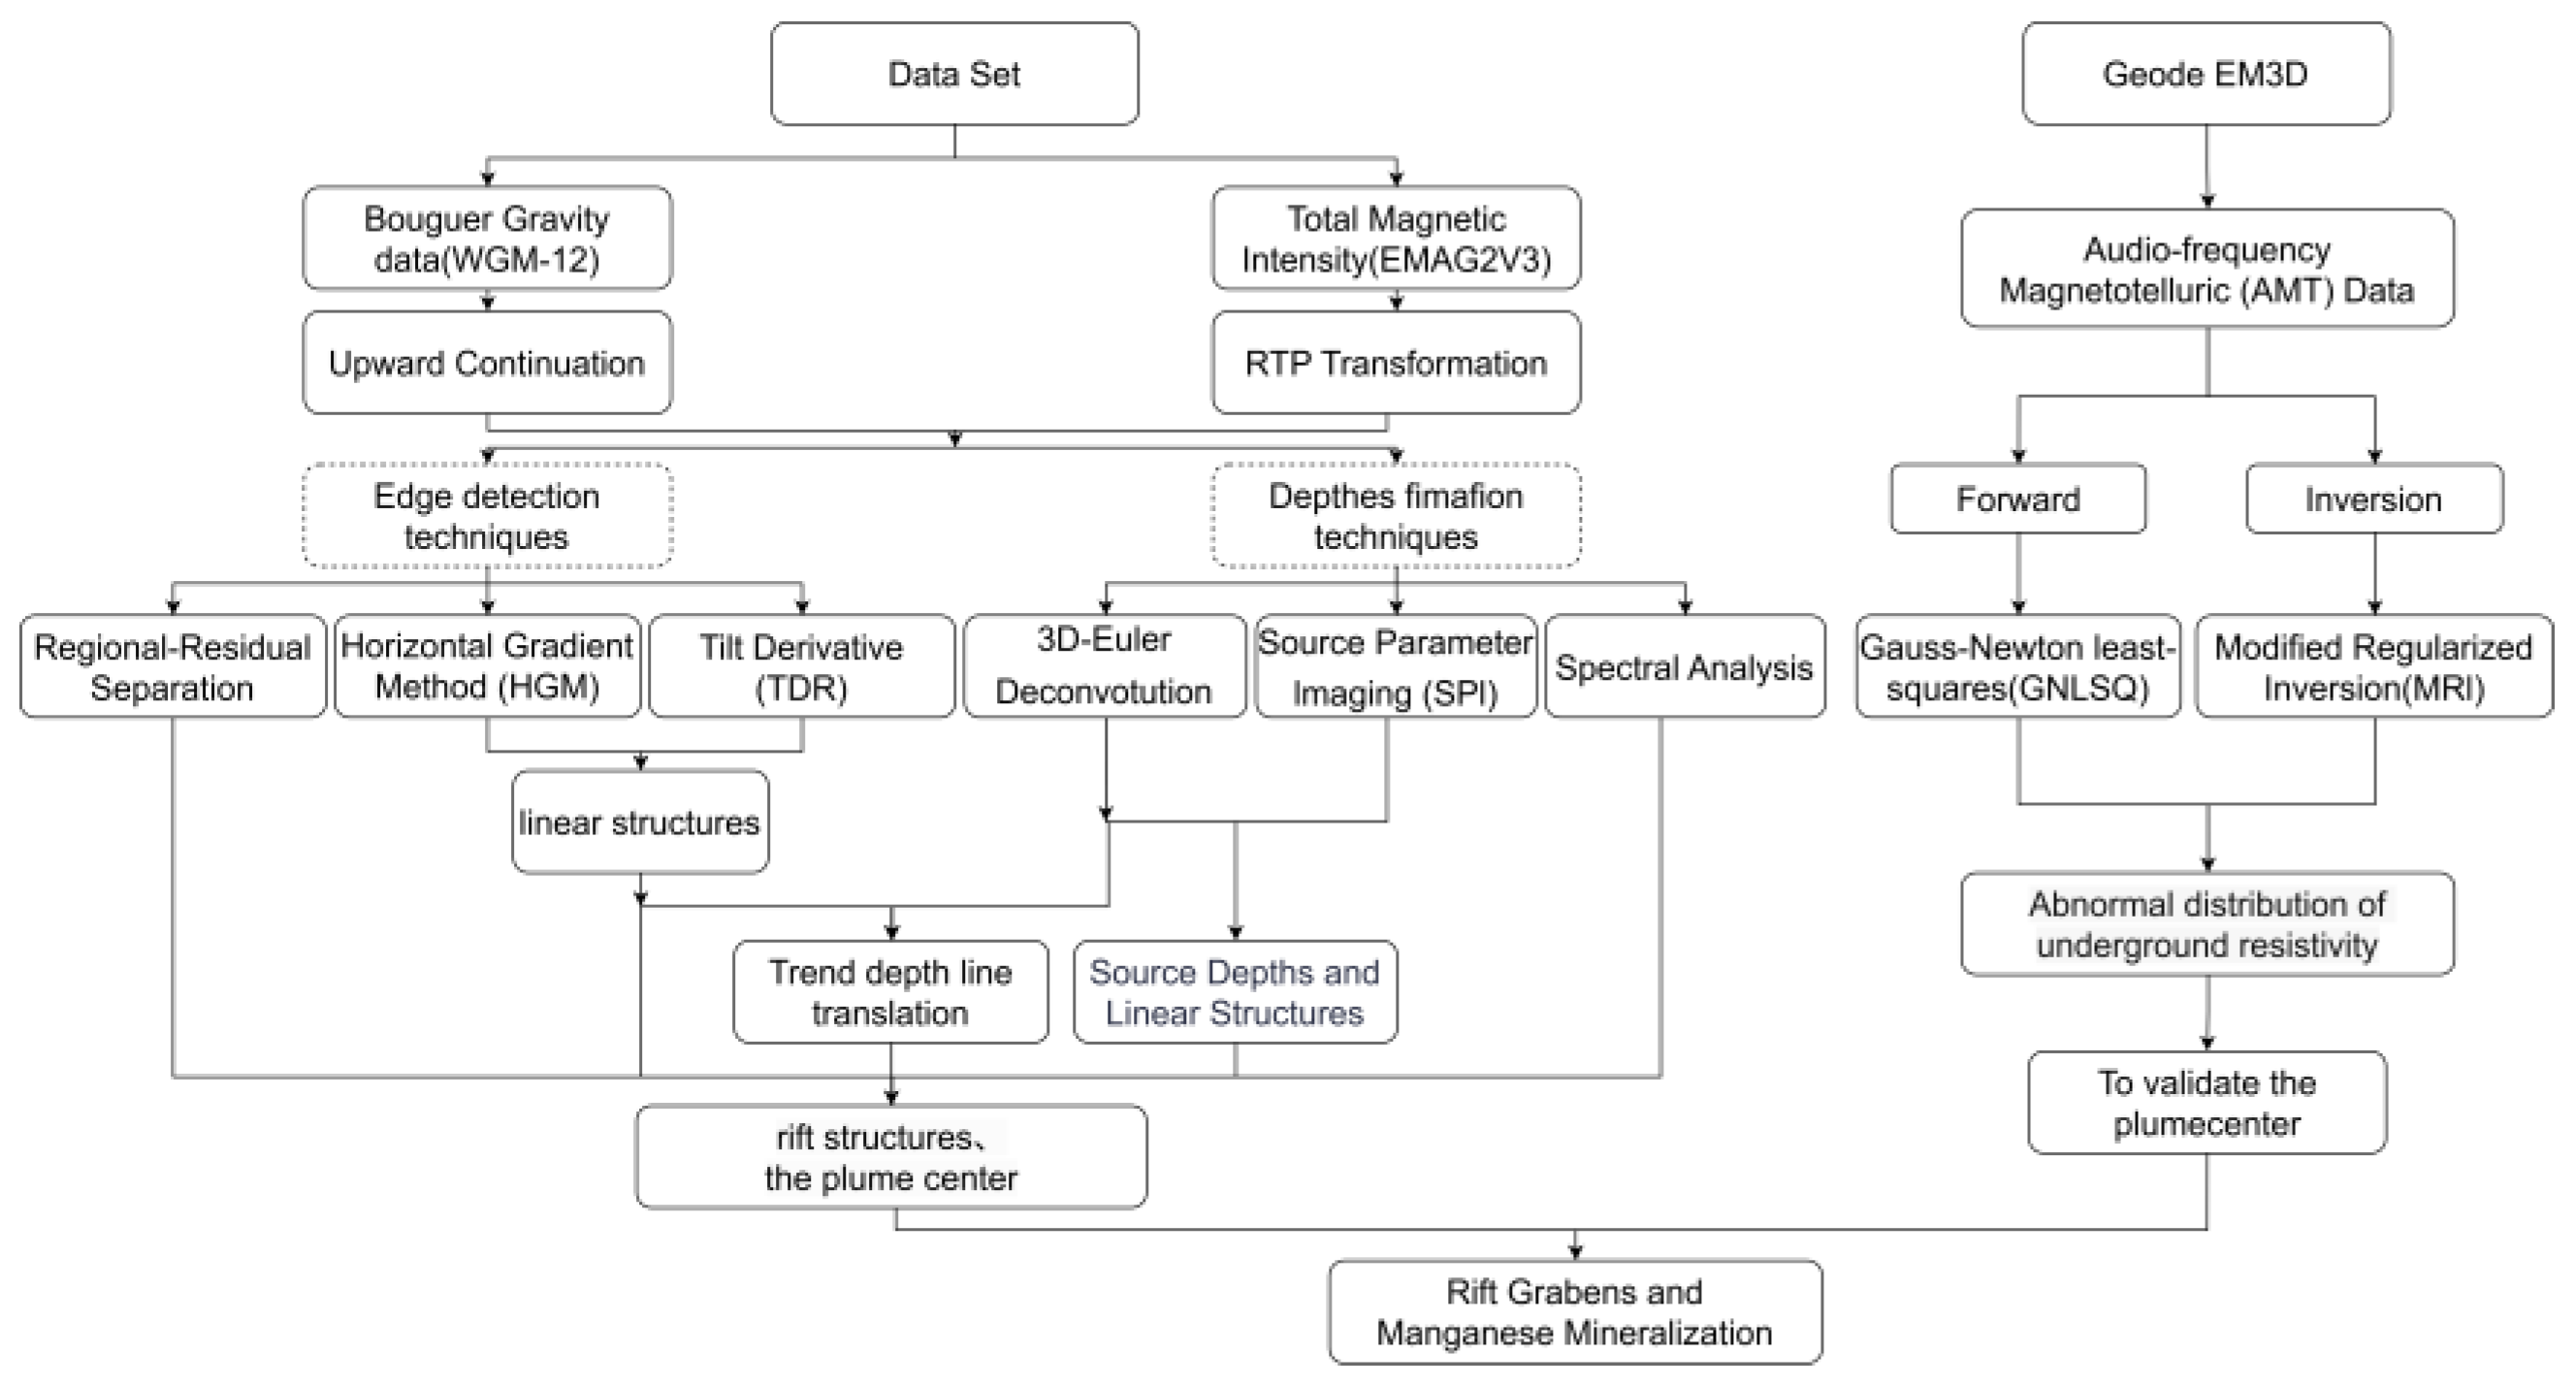
3. Data and Methods
3.1. Gravity and Magnetic Data
3.2. Data Analysis Methods
3.2.1. Reduction to the Pole (RTP) of Aeromagnetic Data
3.2.2. Upward Continuation Processing
3.2.3. Edge Detection Techniques
Horizontal Gradient Method (HGM)
Tilt Derivative (TDR) Method
Residual/Regional Separation
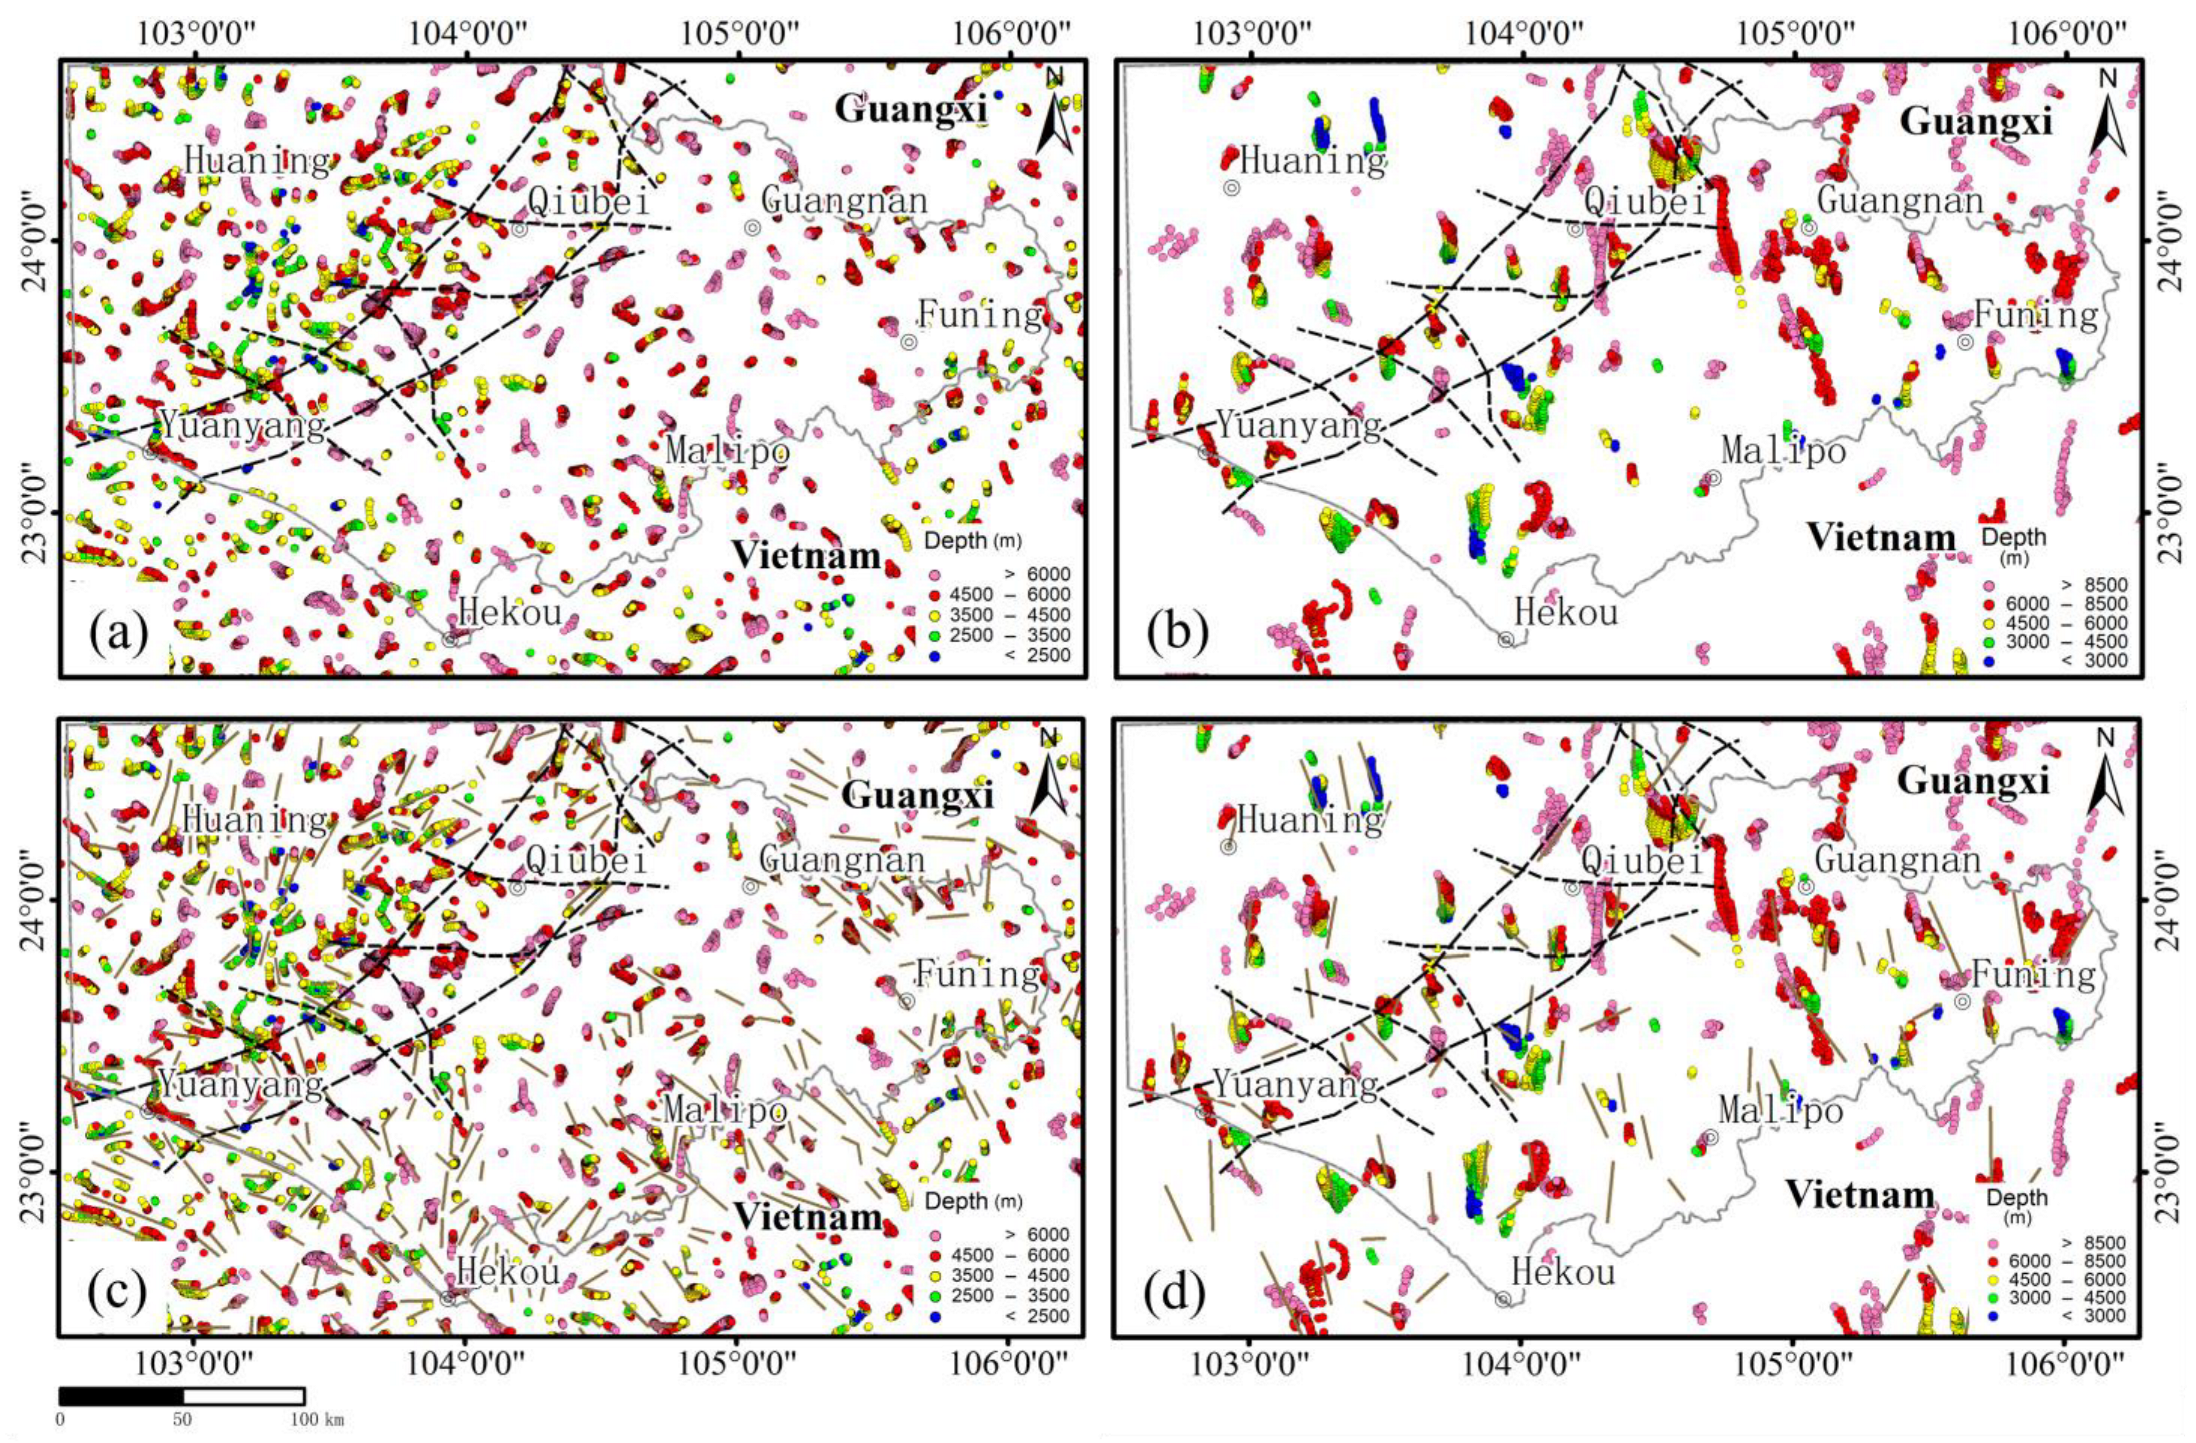
3.2.4. Depth Estimation
Euler Deconvolution (Euler3D)
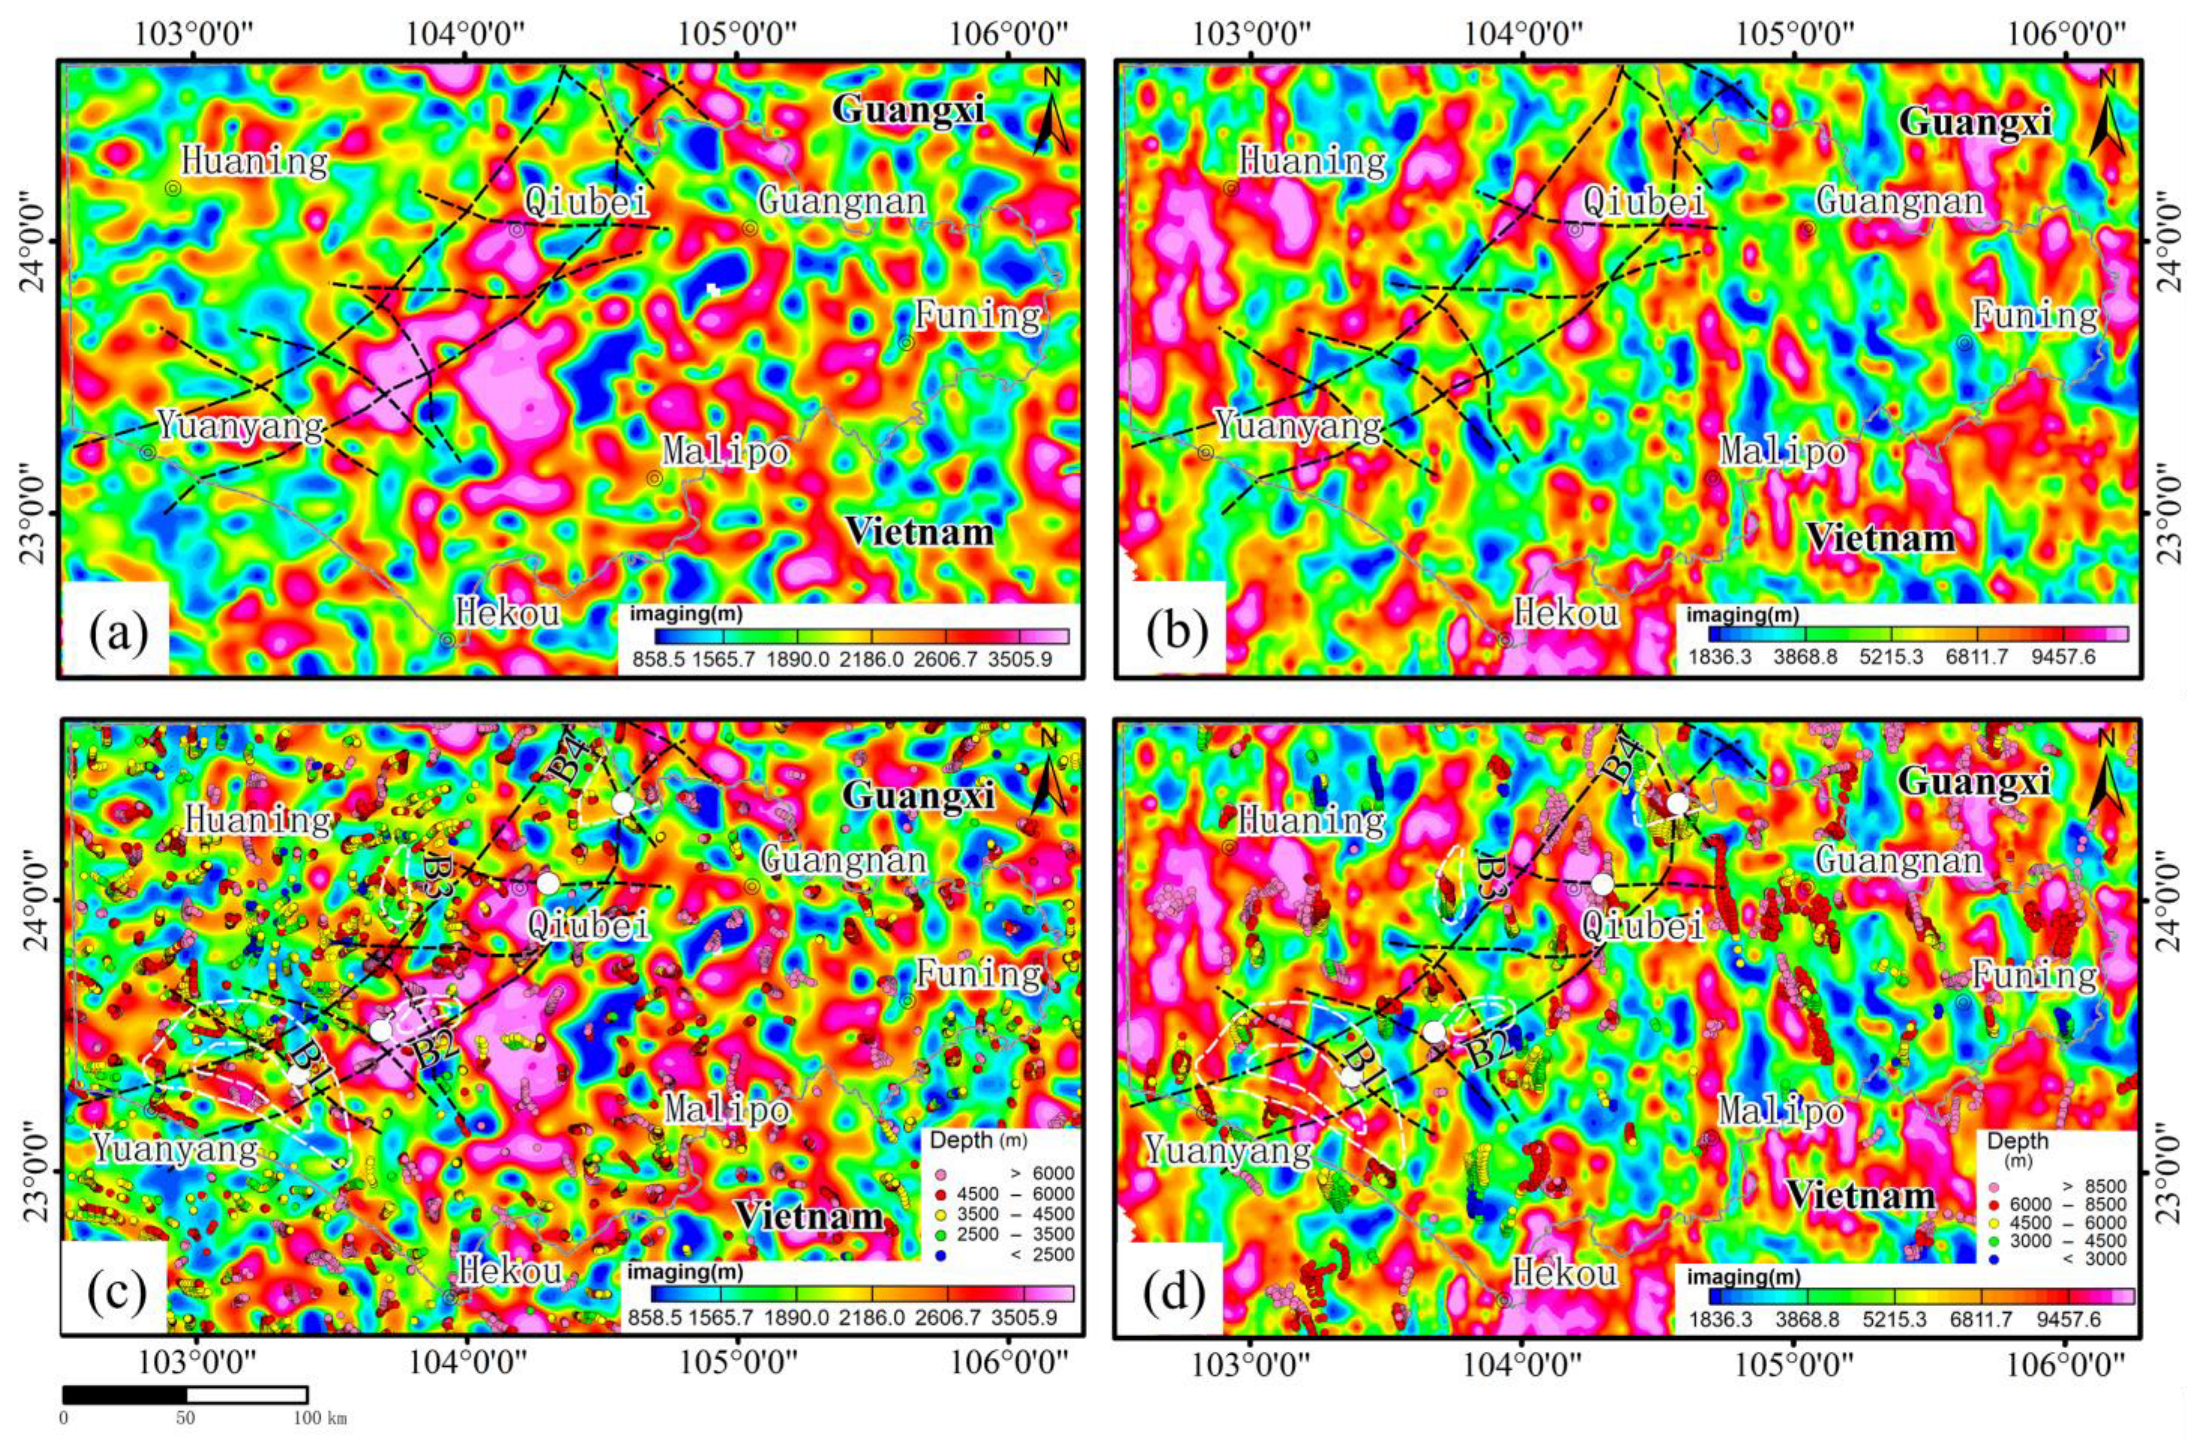
Source Parameter Imaging (SPI)
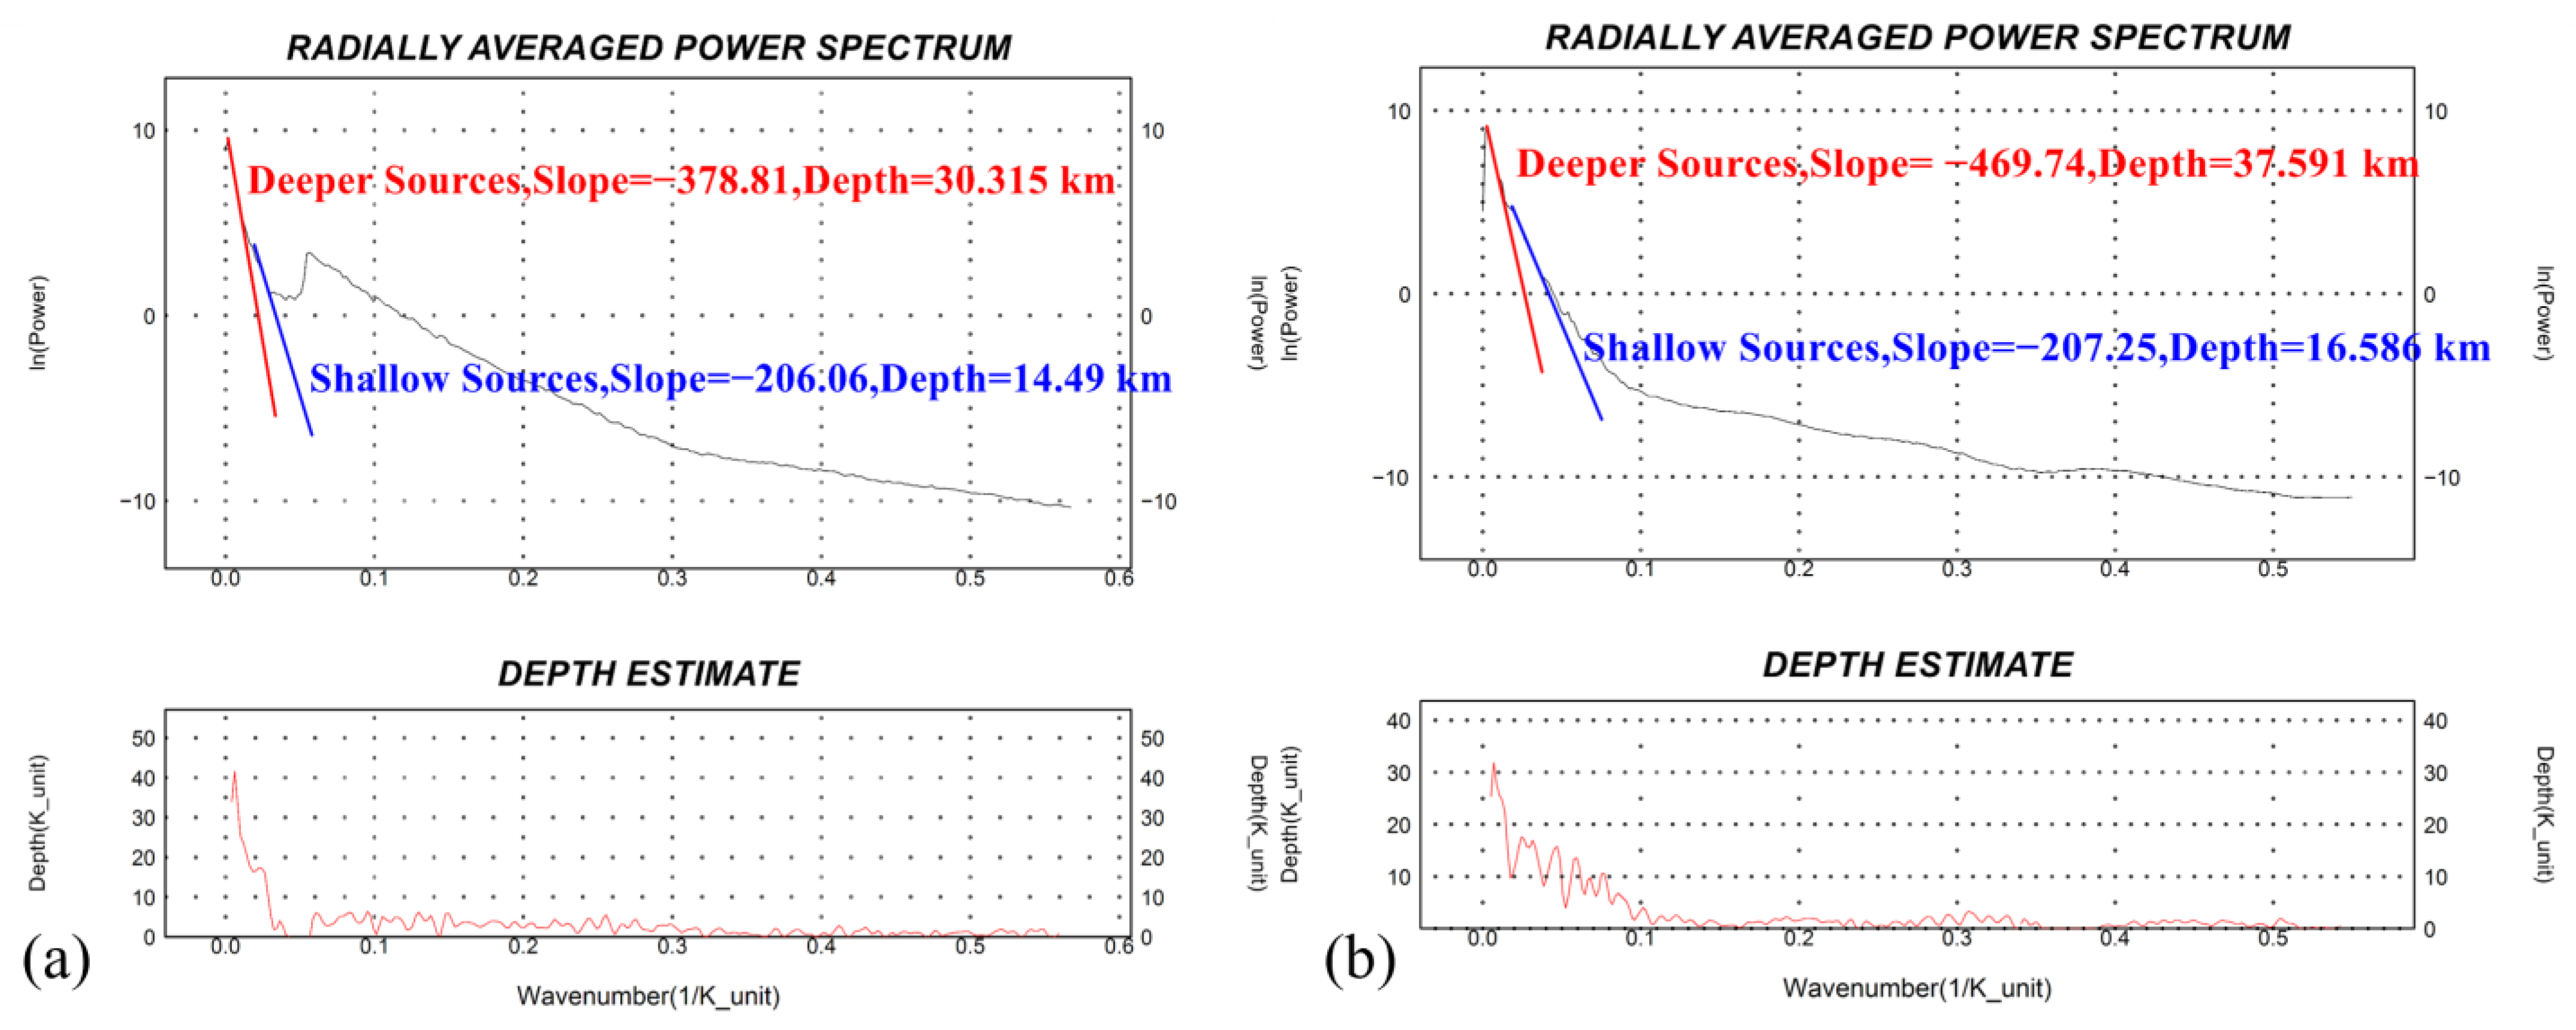
Spectral Analysis
3.3. Audio-Frequency Magnetotelluric (AMT) Data Acquisition and Processing
3.3.1. AMT Data Acquisition
3.3.2. Audio-Frequency Magnetotelluric Data Processing
4. Results
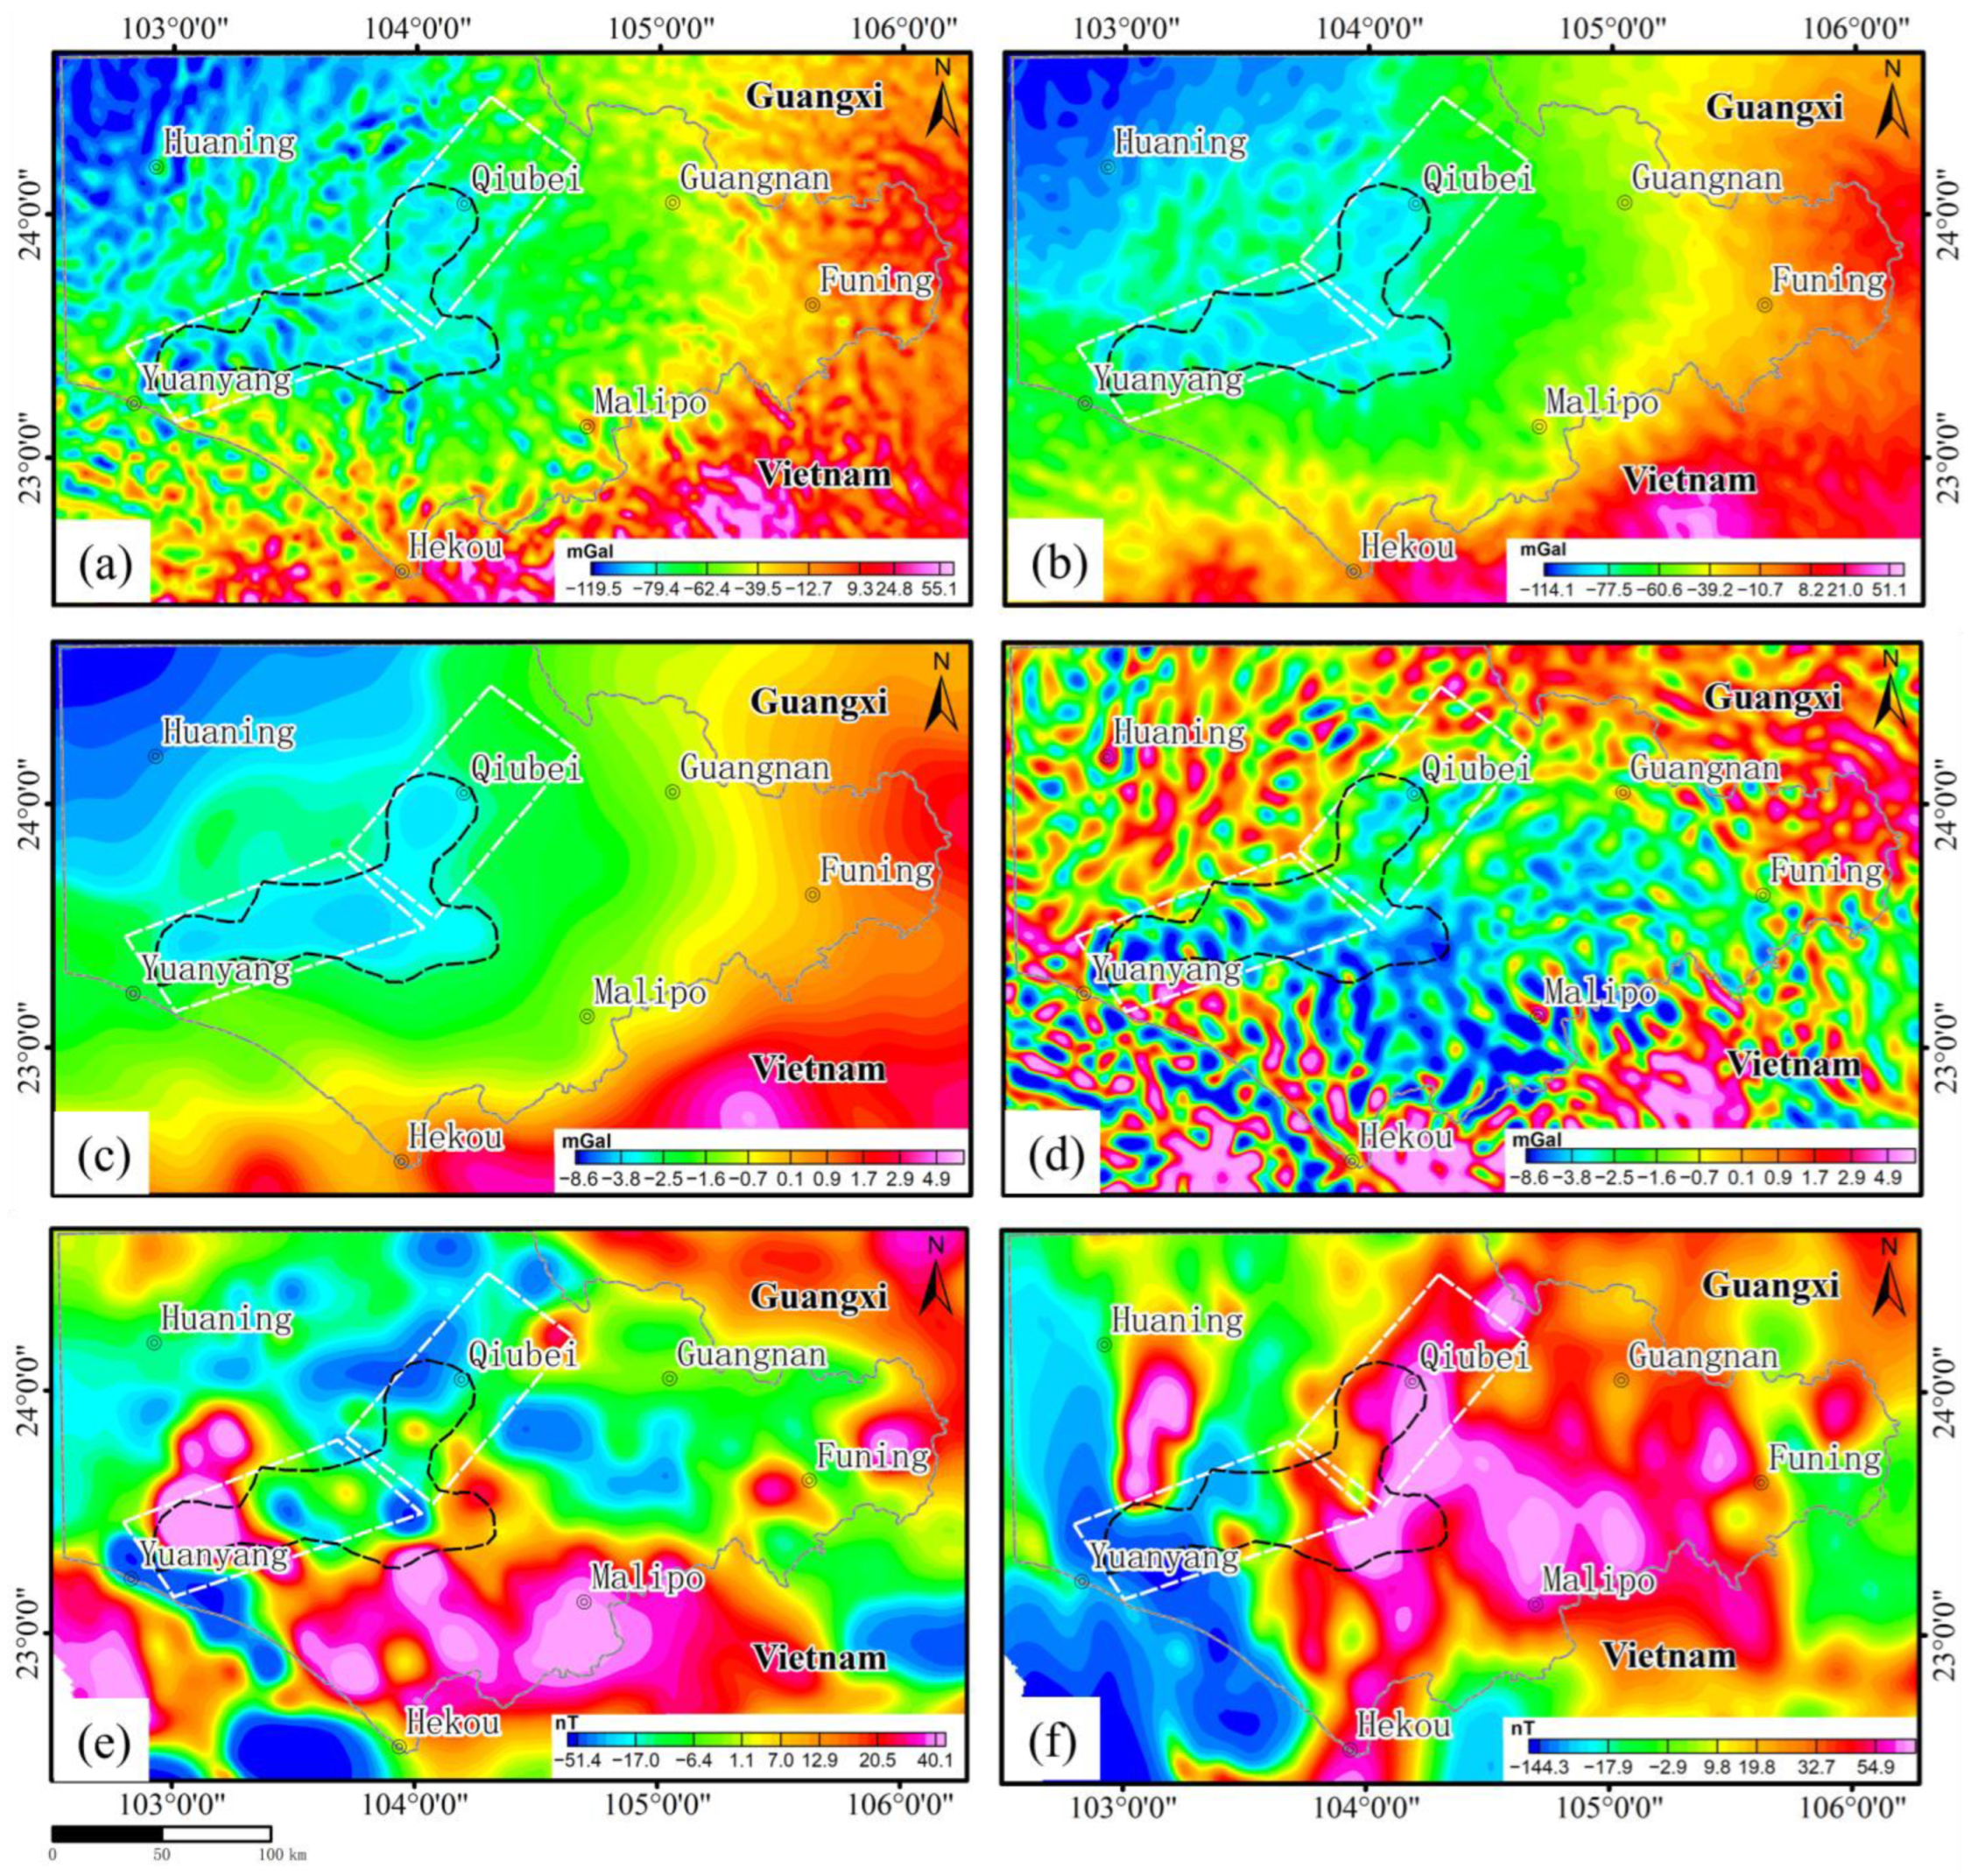
4.1. Gravity and Magnetic Anomaly Characteristics of the Study Area
4.2. Audio-Frequency Magnetotelluric (AMT) Data
4.2.1. Dounan Mining District
4.2.2. Shiwang Mine Area
5. Discussion
5.1. Rift Graben and Hydrothermal Vent Centers
5.2. Rift Grabens and Manganese Mineralization
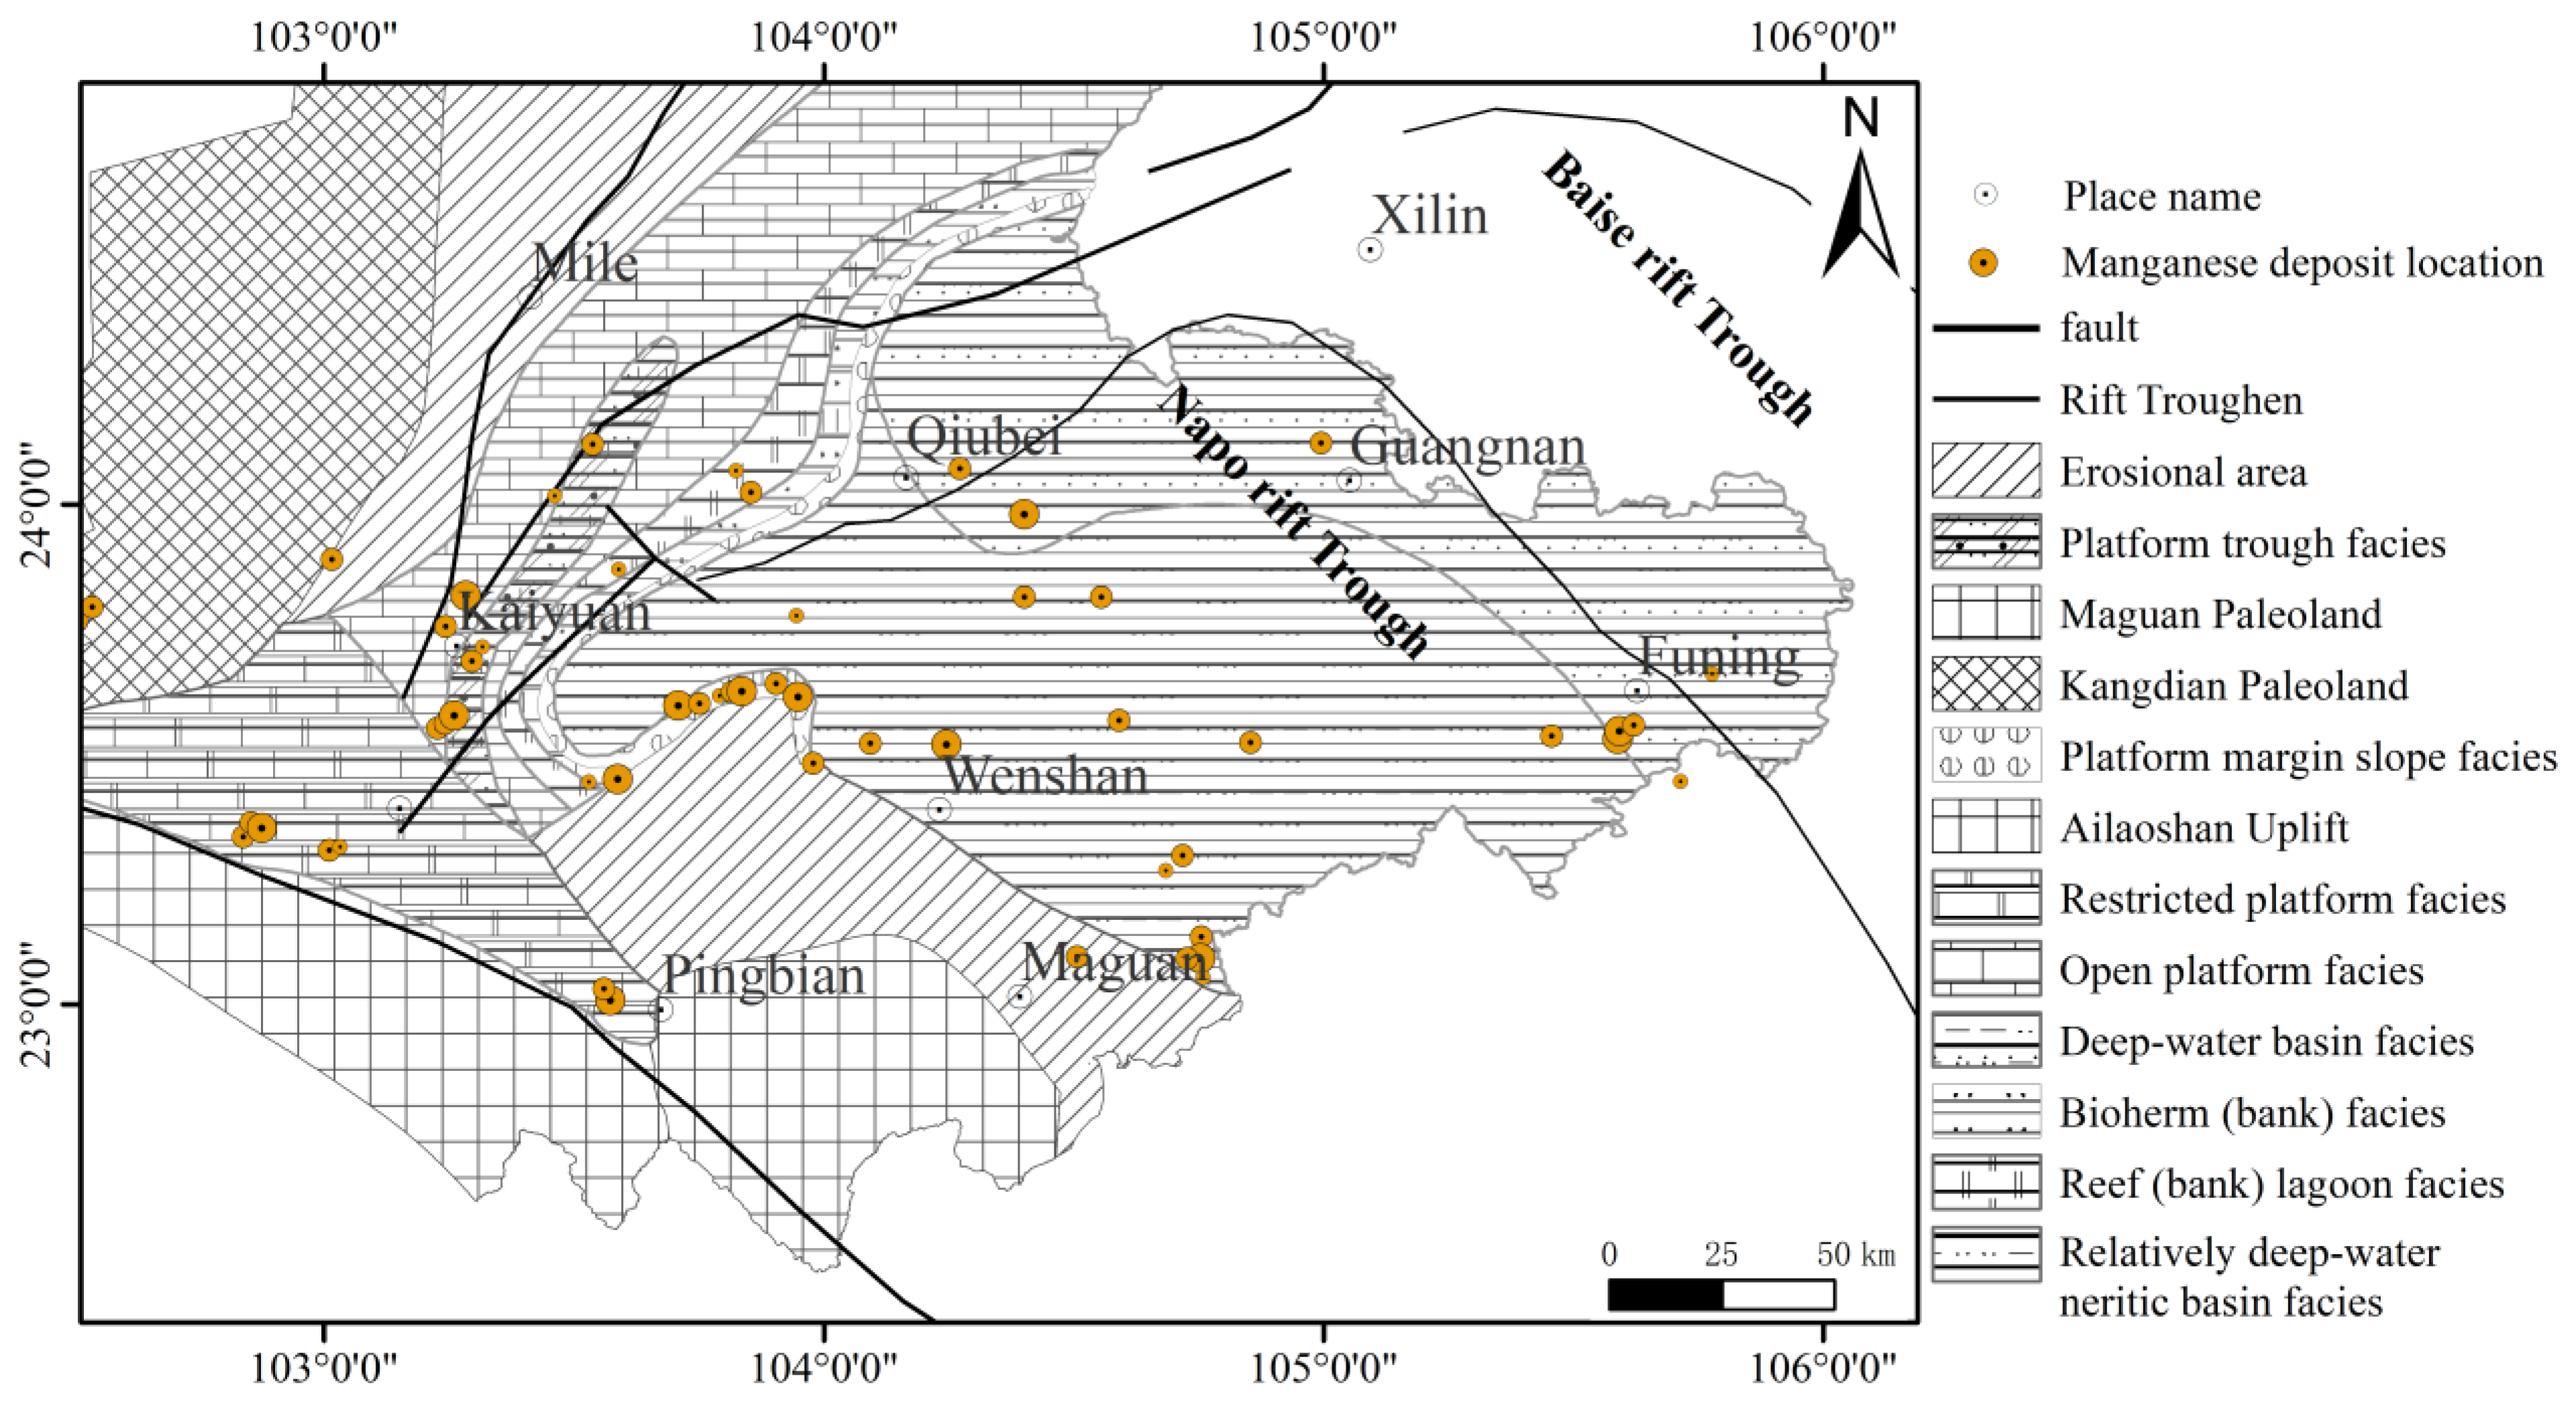
5.2.1. Tectonic Control on Mineralization
5.2.2. Hydrothermal Ore Transport
5.2.3. Sedimentary Enrichment
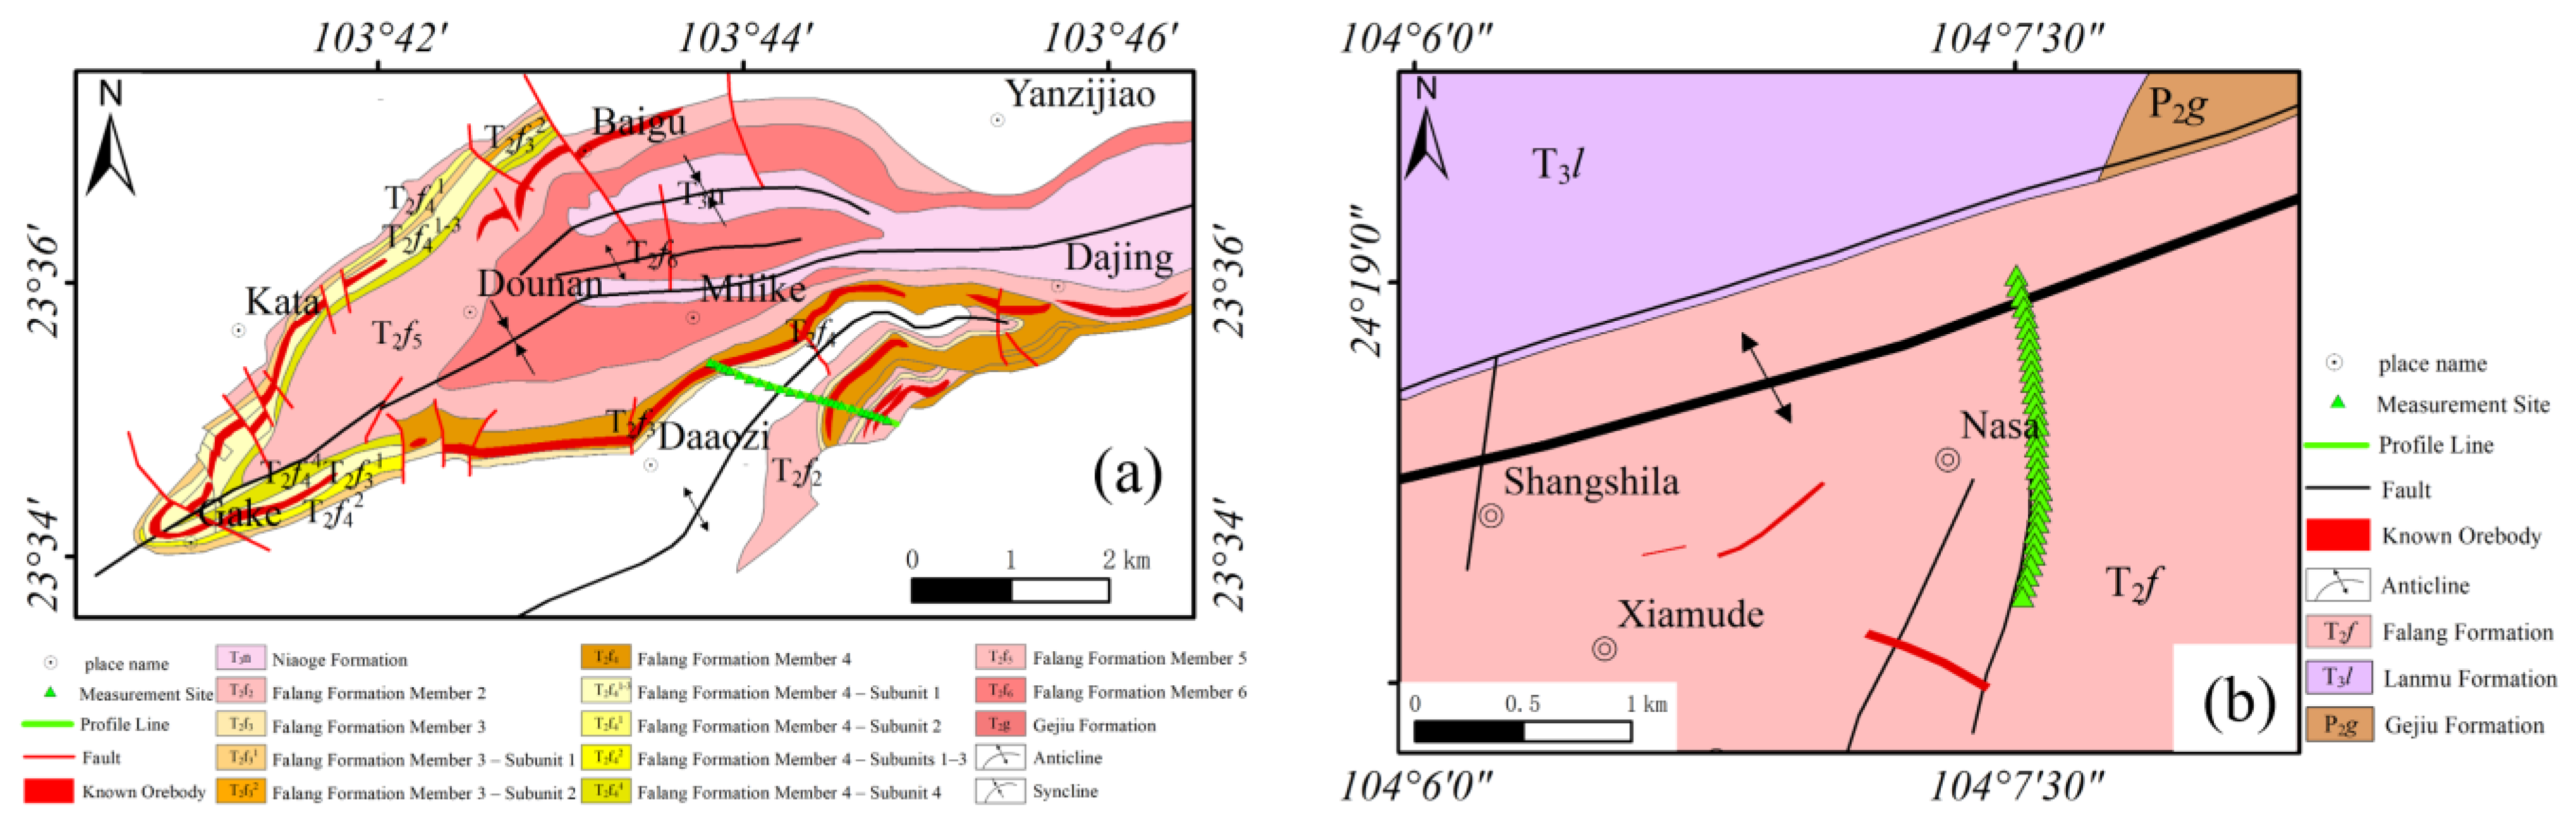
5.3. Case Study of Typical Deposits
5.4. The Directions for Further Research
6. Conclusions
Author Contributions
Funding
Data Availability Statement
Acknowledgments
Conflicts of Interest
Abbreviations
| WGM2012 | The World Gravity Model |
| EMAG2v3 | The global magnetic anomaly dataset |
| AMT | Audio-frequency magnetotelluric |
| ELIP | Emeishan Large Igneous Province |
| TMI | Total magnetic intensity |
| RTP | Reduced to the pole |
| IGRF | The International Geomagnetic Reference Field |
| HGM | Horizontal gradient magnitude |
| TDR | Tilt derivative |
| SPI | Source parameter imaging |
| GNLSQ | The Gauss–Newton least-squares |
| REE | Rare earth element |
| TCPL | Rift Plume Center |
References
- Said, S.M. Fault control and timing of manganese deposits at Abu Ramad, South Egyptian margin of the Red Sea. Int. Geol. Rev. 2022, 65, 2256–2268. [Google Scholar] [CrossRef]
- Xu, H.; Peng, X.; Ta, K.; Liu, S. Fluid-related manganese deposits at the incoming plate of the Southern Mariana subduction zone. Chem. Geol. 2024, 663, 122294. [Google Scholar] [CrossRef]
- Xu, Y.; Yang, M.; Yu, W.; Du, Y.; Wang, P.; Liu, C.; Liu, H. Controls on the formation of Mn carbonates in mudrocks of the Datangpo Formation, Northern Margin Rift Basin, Yangtze Block. Palaeogeogr. Palaeoclimatol. Palaeoecol. 2024, 641, 112125. [Google Scholar] [CrossRef]
- Duan, L.; Meng, Q.-R.; Wu, G.-L.; Yang, Z.; Wang, J.; Zhan, R. Nanpanjiang basin: A window on the tectonic development of south China during Triassic assembly of the southeastern and eastern Asia. Gondwana Res. 2020, 78, 189–209. [Google Scholar] [CrossRef]
- Wang, Q.; Yang, L.; Xu, X.; Santosh, M.; Wang, Y.; Wang, T.; Chen, F.; Wang, R.; Gao, L.; Liu, X. Multi-stage tectonics and metallogeny associated with Phanerozoic evolution of the South China Block: A holistic perspective from the Youjiang Basin. Earth Sci. Rev. 2020, 211, 103405. [Google Scholar] [CrossRef]
- Zhou, Q.; Du, Y.; Qin, Y. Ancient natural gas seepage sedimentary-type manganese metallogenic system and ore-forming model: A case study of Datangpo type manganese deposits formed in rift basin of Nanhua Period along Guizhou-Hunan-Chongqing border area. Miner. Depos. 2013, 32, 457–466. [Google Scholar]
- Basantaray, A.K.; Mandal, A. Interpretation of gravity–magnetic anomalies to delineate subsurface configuration beneath east geothermal province along the Mahanadi rift basin: A case study of non-volcanic hot springs. Geotherm. Energy 2022, 10, 6. [Google Scholar] [CrossRef]
- Nigussie, W.; Alemu, A.; Mickus, K.; Keir, D.; Demissie, Z.; Muhabaw, Y.; Muluneh, A.A.; Corti, G.; Yehualaw, E. Subsurface structural control of geothermal resources in a magmatic rift: Gravity and magnetic study of the Tulu Moye geothermal prospect, Main Ethiopian Rift. Front. Earth Sci. 2023, 11, 1181533. [Google Scholar] [CrossRef]
- Salawu, N.B.; Omosanya, K.O.L.; Fournier, D. The Middle Niger Basin in Nigeria Has a Rift Origin, as Revealed by the Inversion and Modeling of Gravity and Magnetic Data. Earth Space Sci. 2024, 11, e2023EA003025. [Google Scholar] [CrossRef]
- Saada, S.A.; Mickus, K.; Eldosouky, A.M.; Ibrahim, A. Insights on the tectonic styles of the Red Sea rift using gravity and magnetic data. Mar. Pet. Geol. 2021, 133, 105253. [Google Scholar] [CrossRef]
- Shaban, S.N.; Kolawole, F.; Scholz, C.A. The deep basin and underlying basement structure of the Tanganyika Rift. Tectonics 2023, 42, e2022TC007726. [Google Scholar] [CrossRef]
- Ebbing, J.; Haas, P.; Ferraccioli, F.; Pappa, F.; Szwillus, W.; Bouman, J. Earth tectonics as seen by GOCE-Enhanced satellite gravity gradient imaging. Sci. Rep. 2018, 8, 16356. [Google Scholar] [CrossRef]
- Simon, W.; David, G.; Joanne, W.; Maria, S. Magnetization of Oceanic Lithosphere from Modeling of Satellite Observations. J. Geophys. Res. Solid Earth 2025, 130, e2024JB030370. [Google Scholar] [CrossRef]
- Green, C.; Fletcher, K.; Cheyney, S.; Dawson, G.; Campbell, S. Satellite gravity–enhancements from new satellites and new altimeter technology. Geophys. Prospect. 2019, 67, 1611–1619. [Google Scholar] [CrossRef]
- Pavlis, N.K.; Holmes, S.A.; Kenyon, S.C.; Factor, J.K. The development and evaluation of the Earth Gravitational Model 2008 (EGM2008). J. Geophys. Res. Solid Earth 2012, 117, B04406. [Google Scholar] [CrossRef]
- Maus, S.; Barckhausen, U.; Berkenbosch, H.; Bournas, N.; Brozena, J.; Childers, V.; Dostaler, F.; Fairhead, J.; Finn, C.; von Frese, R.R. EMAG2: A 2–arc min resolution Earth Magnetic Anomaly Grid compiled from satellite, airborne, and marine magnetic measurements. Geochem. Geophys. Geosyst. 2009, 10, Q08005. [Google Scholar] [CrossRef]
- Alken, P.; Maus, S.; Chulliat, A.; Manoj, C. NOAA/NGDC candidate models for the 12th generation International Geomagnetic Reference Field. Earth Planets Space 2015, 67, 68. [Google Scholar] [CrossRef]
- Chulliat, A.M.S.; Alken, P.; Beggan, C.; Nair, M.; Hamilton, B.; Woods, A.; Ridley, V.; Maus, S.; Thomson, A. The US/UK World Magnetic Model for 2015–2020; National Geophysical Data Center: Boulder, CO, USA, 2015. [Google Scholar] [CrossRef]
- Dyment, J.; Choi, Y.; Hamoudi, M.; Lesur, V.; Thébault, E. Global equivalent magnetization of the oceanic lithosphere. Earth Planet. Sci. Lett. 2015, 430, 54–65. [Google Scholar] [CrossRef]
- Lesur, V.; Hamoudi, M.; Choi, Y.; Dyment, J.; Thébault, E. Building the second version of the world digital magnetic anomaly map (WDMAM). Earth Planets Space 2016, 68, 27. [Google Scholar] [CrossRef]
- Omietimi, E.J.; Chouhan, A.K.; Lenhardt, N.; Yang, R.; Bumby, A.J. Structural interpretation of the south-western flank of the Anambra Basin (Nigeria) using satellite-derived WGM 2012 gravity data. J. Afr. Earth Sci. 2021, 182, 104290. [Google Scholar] [CrossRef]
- Meyer, B.; Chulliat, A.; Saltus, R. Derivation and error analysis of the earth magnetic anomaly grid at 2 arc min resolution version 3 (EMAG2v3). Geochem. Geophys. Geosyst. 2017, 18, 4522–4537. [Google Scholar] [CrossRef]
- Duan, J.; Fu, Y.; Zhang, Z.; Xiao, J.; Wu, C. Genesis of the Dounan manganese deposit of southeast Yunnan, China: Constraints from the mineralogy and geochemistry of micronodules. J. Geochem. Explor. 2020, 214, 106541. [Google Scholar] [CrossRef]
- Gan, C.; Wang, Y.; Barry, T.L.; Zhang, Y.; Qian, X. Late Jurassic high-Mg andesites in the Youjiang Basin and their significance for the southward continuation of the Jiangnan Orogen, South China. Gondwana Res. 2020, 77, 260–273. [Google Scholar] [CrossRef]
- Gan, C.; Wang, Y.; Zhang, Y.; Qian, X. Petrogenesis of Late Cretaceous granites and implications for W-Sn mineralization in the Youjiang Basin, South China. Ore Geol. Rev. 2022, 144, 104846. [Google Scholar] [CrossRef]
- Xu, X. Late triassic to middle Jurassic tectonic evolution of the South China block: Geodynamic transition from the paleo-tethys to the paleo-pacific regimes. Earth Sci. Rev. 2023, 241, 104404. [Google Scholar] [CrossRef]
- Cai, J.-X.; Zhang, K.-J. A new model for the Indochina and South China collision during the Late Permian to the Middle Triassic. Tectonophysics 2009, 467, 35–43. [Google Scholar] [CrossRef]
- Chen, F.; Wang, Q.; Yang, S.; Zhang, Q.; Liu, X.; Chen, J.; Carranza, E.J.M. Space-time distribution of manganese ore deposits along the southern margin of the South China Block, in the context of Palaeo-Tethyan evolution. Int. Geol. Rev. 2018, 60, 72–86. [Google Scholar] [CrossRef]
- Ma, Y.; Chen, H.; Wang, G.L.; Guo, T.; Tian, J.; Liu, W.; Xu, X.; Zheng, R.; Mou, C.; Hou, M. Sequence Stratigraphy and Paleogeography of South China; Science Press: Beijing, China, 2009. (In Chinese) [Google Scholar]
- Zeng, X.; Guan-qiang, Z.; Shun-lie, Y. Genetic Types and Ore-Controlling Factors of Manganese Deposits in Yunnan. Yunnan Geol. 2024, 43, 125–131. [Google Scholar]
- Bonvalot, S.; Balmino, G.; Vales, N.; Briais, A. World Gravity Map; CGMW: Paris, France, 2012. [Google Scholar]
- Montaj, G.O. Software for Earth Science Mapping and Processing; Geosoft Incorporation Ltd.: Toronto, ON, Canada, 2013. [Google Scholar]
- Blakely, R.J. Potential Theory in Gravity and Magnetic Applications; Cambridge University Press: Cambridge, UK, 1996. [Google Scholar]
- Finlay, C.C.; Maus, S.; Beggan, C.; Bondar, T.N.; Chambodut, A.; Chernova, T.; Chulliat, A.; Golovkov, V.; Hamilton, B.; Hamoudi, M. International geomagnetic reference field: The eleventh generation. Geophys. J. Int. 2010, 183, 1216–1230. [Google Scholar] [CrossRef]
- Kebede, H.; Alemu, A.; Fisseha, S. Upward continuation and polynomial trend analysis as a gravity data decomposition, case study at Ziway-Shala basin, central Main Ethiopian rift. Heliyon 2020, 6, e03292. [Google Scholar] [CrossRef]
- Li, Y.; Tang, H.; Shi, L. Constraining the crustal structure under the central and western Tian Shan based on teleseismic receiver functions and gravity anomalies. Earthq. Sci. 2023, 36, 1–14. [Google Scholar] [CrossRef]
- Cordell, L.; Grauch, V. Mapping basement magnetization zones from aeromagnetic data in the San Juan Basin, New Mexico. In The Utility of Regional Gravity and Magnetic Anomaly Maps; Society of Exploration Geophysicists: Tulsa, OK, USA, 1985; pp. 181–197. [Google Scholar]
- Hinze, W.J.; Von Frese, R.R.; Von Frese, R.; Saad, A.H. Gravity and Magnetic Exploration: Principles, Practices, and Applications; Cambridge University Press: Cambridge, UK, 2013. [Google Scholar]
- Salem, A.; Williams, S.; Fairhead, D.; Smith, R.; Ravat, D. Interpretation of magnetic data using tilt-angle derivatives. Geophysics 2008, 73, L1–L10. [Google Scholar] [CrossRef]
- Sarma, B.; Krishna Rao, M. Basement structure of Godavari basin, India–Geophysical modelling. Curr. Sci. 2005, 88, 1172–1175. [Google Scholar]
- Reid, A.B.; Allsop, J.; Granser, H.; Millett, A.t.; Somerton, I. Magnetic interpretation in three dimensions using Euler deconvolution. Geophysics 1990, 55, 80–91. [Google Scholar] [CrossRef]
- Thompson, D. EULDPH: A new technique for making computer-assisted depth estimates from magnetic data. Geophysics 1982, 47, 31–37. [Google Scholar] [CrossRef]
- Thurston, J.B.; Smith, R.S. Automatic conversion of magnetic data to depth, dip, and susceptibility contrast using the SPI (TM) method. Geophysics 1997, 62, 807–813. [Google Scholar] [CrossRef]
- Spector, A.; Grant, F. Statistical models for interpreting aeromagnetic data. Geophysics 1970, 35, 293–302. [Google Scholar] [CrossRef]
- Lai, W.H.; Kek, S.L.; Tay, K.G. Solving nonlinear least squares problem using Gauss-Newton method. Int. J. Innov. Sci. Eng. Technol. 2017, 4, 258–262. [Google Scholar]
- Wu, W. The Gravity and Aeromagnetic Anomalies Interpretation in SE Yunnan. Master’s Thesis, China University of Geosciences (Wuhan), Wuhan, China, 2009. (In Chinese). [Google Scholar]
- Hoa, T.T.; Izokh, A.; Polyakov, G.; Borisenko, A.; Anh, T.T.; Balykin, P.; Phuong, N.T.; Rudnev, S.; Van, V.V.; Nien, B.A. Permo-Triassic magmatism and metallogeny of Northern Vietnam in relation to the Emeishan plume. Russ. Geol. Geophys. 2008, 49, 480–491. [Google Scholar] [CrossRef]
- Su, W.; Dong, W.; Zhang, X.; Shen, N.; Hu, R.; Hofstra, A.H.; Cheng, L.; Xia, Y.; Yang, K. Carlin-Type Gold Deposits in the Dian-Qian-Gui “Golden Triangle” of Southwest China; GeoScienceWorld: McLean, VA, USA, 2018. [Google Scholar]
- Chen, J.; Huang, Z.-L.; Yang, R.-D.; Du, L.-J.; Liao, M.-Y. Gold and antimony metallogenic relations and ore-forming process of Qinglong Sb (Au) deposit in Youjiang basin, SW China: Sulfide trace elements and sulfur isotopes. Geosci. Front. 2021, 12, 605–623. [Google Scholar] [CrossRef]
- Chen, J.; Yang, R.-D.; Du, L.-J.; Gao, J.-B.; Zheng, L.-L.; Huang, Z.-L. Multistage fluid sources and evolution of Qinglong Sb-(Au) deposit in northern margin of Youjiang basin, SW China: REE geochemistry and Sr-HO isotopes of ore-related jasperoid, quartz and fluorite. Ore Geol. Rev. 2020, 127, 103851. [Google Scholar] [CrossRef]
- Yang, Q.; Liu, W.; Zhang, J.; Wang, J.; Zhang, X. Formation of Pb–Zn deposits in the Sichuan–Yunnan–Guizhou triangle linked to the Youjiang foreland basin: Evidence from Rb–Sr age and in situ sulfur isotope analysis of the Maoping Pb–Zn deposit in northeastern Yunnan Province, southeast China. Ore Geol. Rev. 2019, 107, 780–800. [Google Scholar] [CrossRef]
- Fang, W.; Zhang, H.; Jia, R. Dynamics of Triassic back-arc rift basin and its metallogenic sequence in Gejiu of Yunnan Province to Napo of Guangxi Zhuang Autonomous Region, China. Geotecton. Metallog. 2011, 35, 552–566. [Google Scholar]
- Chen, C.; Shi, X. Sedimentary and tectonic evolution of Late Paleozoic deep-water strata in the Youjiang basin. Geol. China 2006, 33, 436–443. [Google Scholar]
- Fang, W.; Hu, R.; Xie, G.; Su, W. On characteristics of the metallogenic systems of continental dynamics and metallogenic series as well as prospecting orientations at the southern margin of the Yangtze massif and its vicinities. Acta Mineral. Sin. 2001, 21, 561–570. [Google Scholar]
- Huang, H.; Du, Y.; Huang, Z.; Yang, J.; Huang, H.; Xie, C.; Hu, L. Depositional chemistry of chert during late Paleozoic from western Guangxi and its implication for the tectonic evolution of the Youjiang Basin. Sci. China Earth Sci. 2013, 56, 479–493. [Google Scholar] [CrossRef]
- Lehrmann, D.J.; Donghong, P.; Enos, P.; Minzoni, M.; Ellwood, B.B.; Orchard, M.J.; Jiyan, Z.; Jiayong, W.; Dillett, P.; Koenig, J. Impact of differential tectonic subsidence on isolated carbonate-platform evolution: Triassic of the Nanpanjiang Basin, south China. AAPG Bull. 2007, 91, 287–320. [Google Scholar] [CrossRef]
- Duan, J.; Fu, Y.; Zhang, Z.; Ma, X.; Xiao, J. The metallogenic environment of the Dounan manganese deposit, Southeast Yunnan, China: Evidence from geochemistry and Mössbauer spectroscopic. Acta Geochim. 2019, 38, 78–94. [Google Scholar] [CrossRef]
- Wang, Q.; Deng, J.; Li, C.; Li, G.; Yu, L.; Qiao, L. The boundary between the Simao and Yangtze blocks and their locations in Gondwana and Rodinia: Constraints from detrital and inherited zircons. Gondwana Res. 2014, 26, 438–448. [Google Scholar] [CrossRef]
- Mclennan, S.M. Rare earth elements in sedimentary rocks: Influence of provenance and sedimentary processes. In Geochemistry and Mineralogy of Rare Earth Elements; De Gruyter: Berlin, Germany, 2018; pp. 169–200. [Google Scholar]
- Pack, A.; Russell, S.S.; Shelley, J.M.G.; Van Zuilen, M. Geo-and cosmochemistry of the twin elements yttrium and holmium. Geochim. Cosmochim. Acta 2007, 71, 4592–4608. [Google Scholar] [CrossRef]
- Sugahara, H.; Sugitani, K.; Mimura, K.; Yamashita, F.; Yamamoto, K. A systematic rare-earth elements and yttrium study of Archean cherts at the Mount Goldsworthy greenstone belt in the Pilbara Craton: Implications for the origin of microfossil-bearing black cherts. Precambrian Res. 2010, 177, 73–87. [Google Scholar] [CrossRef]
- Du, Q.; Yi, H.; Hui, B.; Li, S.; Xia, G.; Yang, W.; Wu, X. Recognition, genesis and evolution of manganese ore deposits in southeastern China. Ore Geol. Rev. 2013, 55, 99–109. [Google Scholar] [CrossRef]
- Madison, A.S.; Tebo, B.M.; Mucci, A.; Sundby, B.; Luther, G.W., III. Abundant porewater Mn (III) is a major component of the sedimentary redox system. Science 2013, 341, 875–878. [Google Scholar] [CrossRef]
- Hem, J.D.; Lind, C.J. Nonequilibrium models for predicting forms of precipitated manganese oxides. Geochim. Cosmochim. Acta 1983, 47, 2037–2046. [Google Scholar] [CrossRef]
- Tang, Y.f.; Yi, H.s. Mineral phase changes and depositional model of sedimentary manganese deposits in Dounan area of southeastern Yunnan. Geol. China 2011, 38, 451–461. [Google Scholar]
- Morgan, J. Chemical equilibria and kinetic properties of manganese in natural water. In Principles and Applications of Water Chemistry; Wiley: New York, NY, USA, 1967; pp. 561–623. [Google Scholar]
- Hou, Z.-J.; Chen, H.-D.; Tian, J.-C. Genesis of sequence boundary and basin evolution in Youjiang Basin during the Devonian to the Middle Triassic. Acta Sedimentol. Sin. 2000, 18, 205–209. [Google Scholar]
- Liu, H.; Xue, Y. Sedimentology of Triassic Dounan-type manganese deposits, western margin, Yangtze Platform, China. Ore Geol. Rev. 1999, 15, 165–176. [Google Scholar] [CrossRef]
- Durogbitan, A.; Fadakinte, S.E.I.; Ibekwe, C. 3D Basin Architecture Using Gravity and Magnetic Data Closes a Structural Gap in Petroleum Systems Modeling. NAPE Bull. 2021, 31, 58–65. [Google Scholar]
- Chouhan, A.K. Structural fabric over the seismically active Kachchh rift basin, India: Insight from world gravity model 2012. Environ. Earth Sci. 2020, 79, 316. [Google Scholar] [CrossRef]


Disclaimer/Publisher’s Note: The statements, opinions and data contained in all publications are solely those of the individual author(s) and contributor(s) and not of MDPI and/or the editor(s). MDPI and/or the editor(s) disclaim responsibility for any injury to people or property resulting from any ideas, methods, instructions or products referred to in the content. |
© 2025 by the authors. Licensee MDPI, Basel, Switzerland. This article is an open access article distributed under the terms and conditions of the Creative Commons Attribution (CC BY) license (https://creativecommons.org/licenses/by/4.0/).
Share and Cite
Cui, D.; Zhao, Z.; Liu, W.; Yang, H.; Liu, Y.; Liu, J.; Shi, B. Tectonic Rift-Related Manganese Mineralization System and Its Geophysical Signature in the Nanpanjiang Basin. Remote Sens. 2025, 17, 2702. https://doi.org/10.3390/rs17152702
Cui D, Zhao Z, Liu W, Yang H, Liu Y, Liu J, Shi B. Tectonic Rift-Related Manganese Mineralization System and Its Geophysical Signature in the Nanpanjiang Basin. Remote Sensing. 2025; 17(15):2702. https://doi.org/10.3390/rs17152702
Chicago/Turabian StyleCui, Daman, Zhifang Zhao, Wenlong Liu, Haiying Yang, Yun Liu, Jianliang Liu, and Baowen Shi. 2025. "Tectonic Rift-Related Manganese Mineralization System and Its Geophysical Signature in the Nanpanjiang Basin" Remote Sensing 17, no. 15: 2702. https://doi.org/10.3390/rs17152702
APA StyleCui, D., Zhao, Z., Liu, W., Yang, H., Liu, Y., Liu, J., & Shi, B. (2025). Tectonic Rift-Related Manganese Mineralization System and Its Geophysical Signature in the Nanpanjiang Basin. Remote Sensing, 17(15), 2702. https://doi.org/10.3390/rs17152702