Article

A Case Study on the Vertical Distribution and Correlation Between Low-Frequency Lightning Sources and Hydrometeors During a Thunderstorm

1
Nanjing Innovation Institute for Atmospheric Sciences, Chinese Academy of Meteorological Sciences–Jiangsu Meteorological Service, Nanjing 210041, China
2
Jiangsu Key Laboratory of Severe Storm Disaster Risk/Key Laboratory of Transportation Meteorology of CMA, Nanjing 210041, China
3
State Key Laboratory of Severe Weather Meteorological Science and Technology & CMA Key Laboratory of Lightning, Chinese Academy of Meteorological Sciences, Beijing 100081, China
4
Electrical and Computer Engineering Department, Duke University, Durham, NC 27708, USA
5
Key Laboratory of Big Data & Artificial Intelligence in Transportation, Ministry of Education, Beijing Jiaotong University, Beijing 100044, China
*
Author to whom correspondence should be addressed.
Remote Sens. 2025, 17(15), 2676; https://doi.org/10.3390/rs17152676
Submission received: 23 May 2025 / Revised: 26 July 2025 / Accepted: 31 July 2025 / Published: 2 August 2025

Abstract

Understanding the interplay between lightning activity and hydrometeor distribution is crucial for advancing knowledge of thunderstorm electrification processes. Using three-dimensional lightning mapping and dual-polarization radar observations, this study investigates the spatiotemporal correlations between low-frequency (LF) lightning sources and hydrometeors during a severe thunderstorm on 11 June 2014, in North Carolina, USA. The results reveal that lightning sources are predominantly observed above 6 km (near the −10 °C isotherm) and stabilize into a dual-peak vertical distribution as the storm progresses into its mature stage, with peaks located at 6–7 km (−10 °C to −15 °C) and 10–11 km (approximately −40 °C). Low-density graupel (LDG) and aggregates (AGs) dominate at lightning locations. Stronger updrafts lead to higher proportions of LDG and high-density graupel (HDG), and lower proportions of AG. LDG exhibits the strongest positive correlation with LF lightning sources, with a peak correlation coefficient of 0.65 at 9 km. During the vigorous development stage, HDG and hail (Ha) also show positive correlations with LF lightning sources, with peak correlation coefficients of 0.52 at 7 km and 0.42 at 8 km, respectively. As the storm reaches its mature phase, the correlation between LDG and lightning sources also displays a dual-peak vertical distribution, with peaks at 7–8 km and 13–14 km. Both the peak correlation coefficient and its corresponding height increase with the strengthening of updrafts, underscoring the critical role of updrafts in microphysical characteristics and driving electrification processes.

1. Introduction

Lightning activity, arising from the development of severe convective systems, plays a significant role in indicating the evolution and electrification of thunderstorms. The noninductive graupel-ice mechanism is a pivotal process in thunderstorm electrification [1,2]. This mechanism involves the interaction between graupel and ice particles in the presence of supercooled liquid water, leading to electrical charge separation. Different particles carry opposite charges in different regions of the storm, generating electric fields and ultimately resulting in lightning discharges of different types. Consequently, the relationship between lightning activity and the space–time distribution of hydrometeors is important for understanding storm microphysics and advancing knowledge of thunderstorm dynamics and electrification [3,4,5,6,7,8].
Studies have shown that lightning activity exhibits good correlations with the microphysical particle distribution within thunderstorms [7,8,9,10,11,12]. Zhang et al. analyzed the relationship between hydrometeors and lightning activity. They showed that the grid samples of ice-phase hydrometeors, such as vertically aligned ice crystals, aggregates, low-density graupel, and high-density graupel, exhibited a positive linear correlation with cloud-to-ground (CG) flash rate. The results also highlight the critical role of ice-phase hydrometeors in modulating lightning flash rates [5]. Li et al. investigated the relationships between CG flashes and the volume of ice-phase hydrometeors in a tropical hail-producing storm, which revealed a strong correlation between CG flash activity and the presence of graupel and snow particles in the cloud, with correlation coefficients of 0.8 and 0.76, respectively [7]. Additionally, Michibata demonstrated that the increased occurrence of graupel led to a 7.1% rise in global mean lightning rates from the pre-industrial period to the present day, which suggests the essential role of graupel in influencing lightning activity and underscores the importance of incorporating ice hydrometeors into models for more accurate lightning flash rate simulations and climate predictions [8]. In these correlation studies, the volume of solid hydrometeors often serves as a key parameter, given that lightning discharges predominantly occur in regions containing various types of solid hydrometeors within the mixed-phase region, which ranges from 0 °C to −40 °C [13,14,15,16].
With the advancement of three-dimensional (3D) lightning mapping techniques, the correlation between hydrometeor particles and lightning discharges has been increasingly examined from a 3D perspective. Lightning mapping array (LMA) can provide a three-dimensional mapping of lightning discharges, offering detailed insights into the high spatial and temporal dynamics of lightning activities within thunderstorms [17,18,19,20,21]. Using observations from LMA and polarimetric radar, Ribaud et al. explored the relationship between total lightning activity and microphysics in a bow-echo system. They found that 97% of flash initiation and 93% of flash propagation appeared in the convective region, with lightning flashes primarily being initiated in the regions dominated by graupel (70%) and ice particles (22%) [4]. The distribution of charge-carrying microphysical particles is complex, and a comprehensive understanding of the intricacies of thunderstorm electrification remains a significant challenge [22]. To more precisely analyze the relationship between charge-carrying microphysical particles and lightning discharges, it is essential to leverage the height information from high-resolution three-dimensional data. This refined analysis is vital for improving weather forecasting accuracy and mitigating the impacts of lightning-related hazards on human life and property [8,23,24].
The present study aims to combine 3D lightning mapping data from a low-frequency (LF) LMA system with dual-polarization radar observations to examine the spatiotemporal variations in the relationship between LF lightning sources and microphysics within an intense zonal echo system, thereby offering new insights into the evolution of lightning activity associated with microphysical processes and thunderstorm electrification. Section 2 provides a comprehensive description of the methodologies employed, including the deployment and operational specifics of the lightning and radar measurements, and Section 3 presents a concise overview of the meteorological system, highlighting the lightning sources, hydrometeor distributions, and their interrelationships.

2. Materials and Methods

In this study, lightning observations from a low-frequency near-field interferometric-time of arrival (TOA) 3D lightning mapping array (LFILMA) [25] and radar observations from the Next Generation Weather Radar (NEXRAD) were utilized. LFILMA was deployed near Duke University, incorporating waveform cross-correlation and TOA techniques typically applied in continuous broadband very high frequency (VHF) interferometer [26] and LMA [17]. LFILMA can effectively image the dynamic development of lightning discharges in 3D [21,27]. The NEXRAD system had been successfully upgraded to dual-polarization by the summer of 2013 [28,29]. This study focuses on the combined observations from the dual-polarization radar and the LFILMA during a storm that occurred on 11 June 2014, passing over the LFILMA operational area, which had good performance in locating the LF sources [30].

2.1. Lightning Data from the 3D Mapping by LFILMA

During the summers of 2014 and 2015, LFILMA was deployed around Duke University in Durham, NC, USA. Figure 1 shows the deployment of the LF sensors and a photo of the mobile sensors. This system consisted of two permanent LF sensors and five mobile LF sensors. The two permanent sensors were installed at fixed locations: Duke Forest (DF) and the roof of Hudson Hall of Duke University. Five mobile sensors were operational inside parked cars, powered by the vehicle’s DC power supply during thunderstorm hours. All sensors were synchronized by GPS receivers of the same model with a timing accuracy of 100 ns. The LF sensors had a uniform bandwidth of 1–400 kHz, with a dB/dt response from 1 to 100 kHz and a flat (B) response from 100 to 250 kHz. LF signals were recorded continuously at a sampling rate of 1 MS/s. The LFILMA system adopted cross-correlation processing to obtain the time differences in LF sources during the same time window of the radio waveforms recorded by the sensors at different sites, which allowed time differences from both discrete and continuous emissions to be extracted. Thus, both types of LF emissions can be located, which largely improves the performance and application of the LF 3D mapping systems [25,27]. A similar data processing method was also applied in recent LF 3D mapping systems, such as the Fast Antenna Lightning Mapping Array (FALMA) [31] and the Córdoba Argentina Marx Meter Array (CAMMA) [32]. More details about the LFILMA system can be found in the description of the instrumentation reported by Lyu et al. [21,25,27].
The data used in this study were recorded during a storm that occurred on 11 June 2014 (Storm-0611 hereinafter). Five sensors were running as the storm approached the LFILMA network. The location accuracy of LFILMA inside and around the network has been documented in previous studies [21,30], with an estimated accuracy of approximately 100 m in both vertical and horizontal dimensions within the LFILMA network. During an hour and a half of the storm passing over from the south to north, a total of more than 1.19 million (1,194,306) sources were located in the 50 km range from the DF site.

2.2. Weather Radar Data from the NEXRAD System

Weather radar data for this study were collected from the KRAX NEXRAD, which is located in Raleigh, NC, USA. NEXRAD comprises a network of 160 Weather Surveillance Radar-1988 Doppler (WSR-88D) or NEXRAD sites operated by the NOAA National Weather Service (NWS), the Federal Aviation Administration (FAA), and the U.S. Air Force (USAF). They are equipped with 10 cm wavelength (S-Band) dual-polarization Doppler radars operating at 2700–3000 MHz frequency range. The Level II datasets from these sites include the radar reflectivity factor at horizontal polarization Z H , differential reflectivity Z D R , specific differential phase K D P , and correlation coefficient ρ h v . Specifically, Z H provides information on the concentration and size of hydrometeors and is fundamental for identifying regions of strong convection and echo top heights; Z D R is sensitive to particle shape and orientation; K D P is sensitive to the concentration and shape; and ρ h v indicates the homogeneity. These variables are the required inputs for the hydrometeor identification (HID) algorithm applied in this analysis. Data products in this study are generated from radar scan times of 5 min periods. With a maximum detection range of 460 km and an azimuthal resolution of 0.5 degrees for reflectivity, NEXRAD enables detailed analysis of microphysical particle characteristics during storms.

2.3. Data Reprocessing and Combination of Lightning and Radar Data

Reprojecting datasets onto a unified 3D grid is necessary to enable direct spatial comparisons and quantitative analysis. Therefore, both the 3D positions of lightning sources and the radar volume data were reprocessed into new 3D-gridded coordinates. The 3D grid was centered on the DF site location with a horizontal spacing of 0.5 km (ranging from −50.0 km to 50.0 km of the DF site) and vertical spacing of 0.2 km (ranging from 0.2 km to 18.0 km). The value on each grid represents the total number of mapped LF sources within the [−250 m, 250 m] horizontal range and [−100 m, 100 m] vertical range of the grid. This gridding approach maintains the spatial integrity and physical consistency of storm structures. Given the continuous recording of LF signals, the 3D lightning data has a significantly higher temporal resolution than radar observations. Thus, the raw 3D lightning data, recorded on a microsecond timescale, were reprocessed into a gridded format on a minute timescale to facilitate analysis. Similarly, radar data were also processed using a 3D grid identical to that used for lightning data. Raw radar data, recorded approximately every five minutes, including parameters such as Z H , Z D R , K D P , and ρ h v , were formatted to match the 3D grid dimensions for consistent analysis. The gridded radar data can be used to infer the dominant hydrometeor type at each grid point. Hydrometeor identification (HID) was performed using the CSU-Radartools (v1.3) fuzzy logic HID program, available at the CSU-Radar Tools GitHub repository. The HID method requires four radar variables ( Z H , Z D R , K D P , and ρ h v ), and the vertical temperature profiles interpolated onto the radar grid from the ERA5 reanalysis dataset, which is provided by the European Centre for Medium-Range Weather Forecasts (ECMWF). The final output hydrometeor types include drizzle (DR), rain (RA), ice crystals (IC), aggregates (AG), wet snow (WS), vertical ice (VI), low-density graupel (LDG), high-density graupel (HDG), hail (Ha), and big drops (BD).
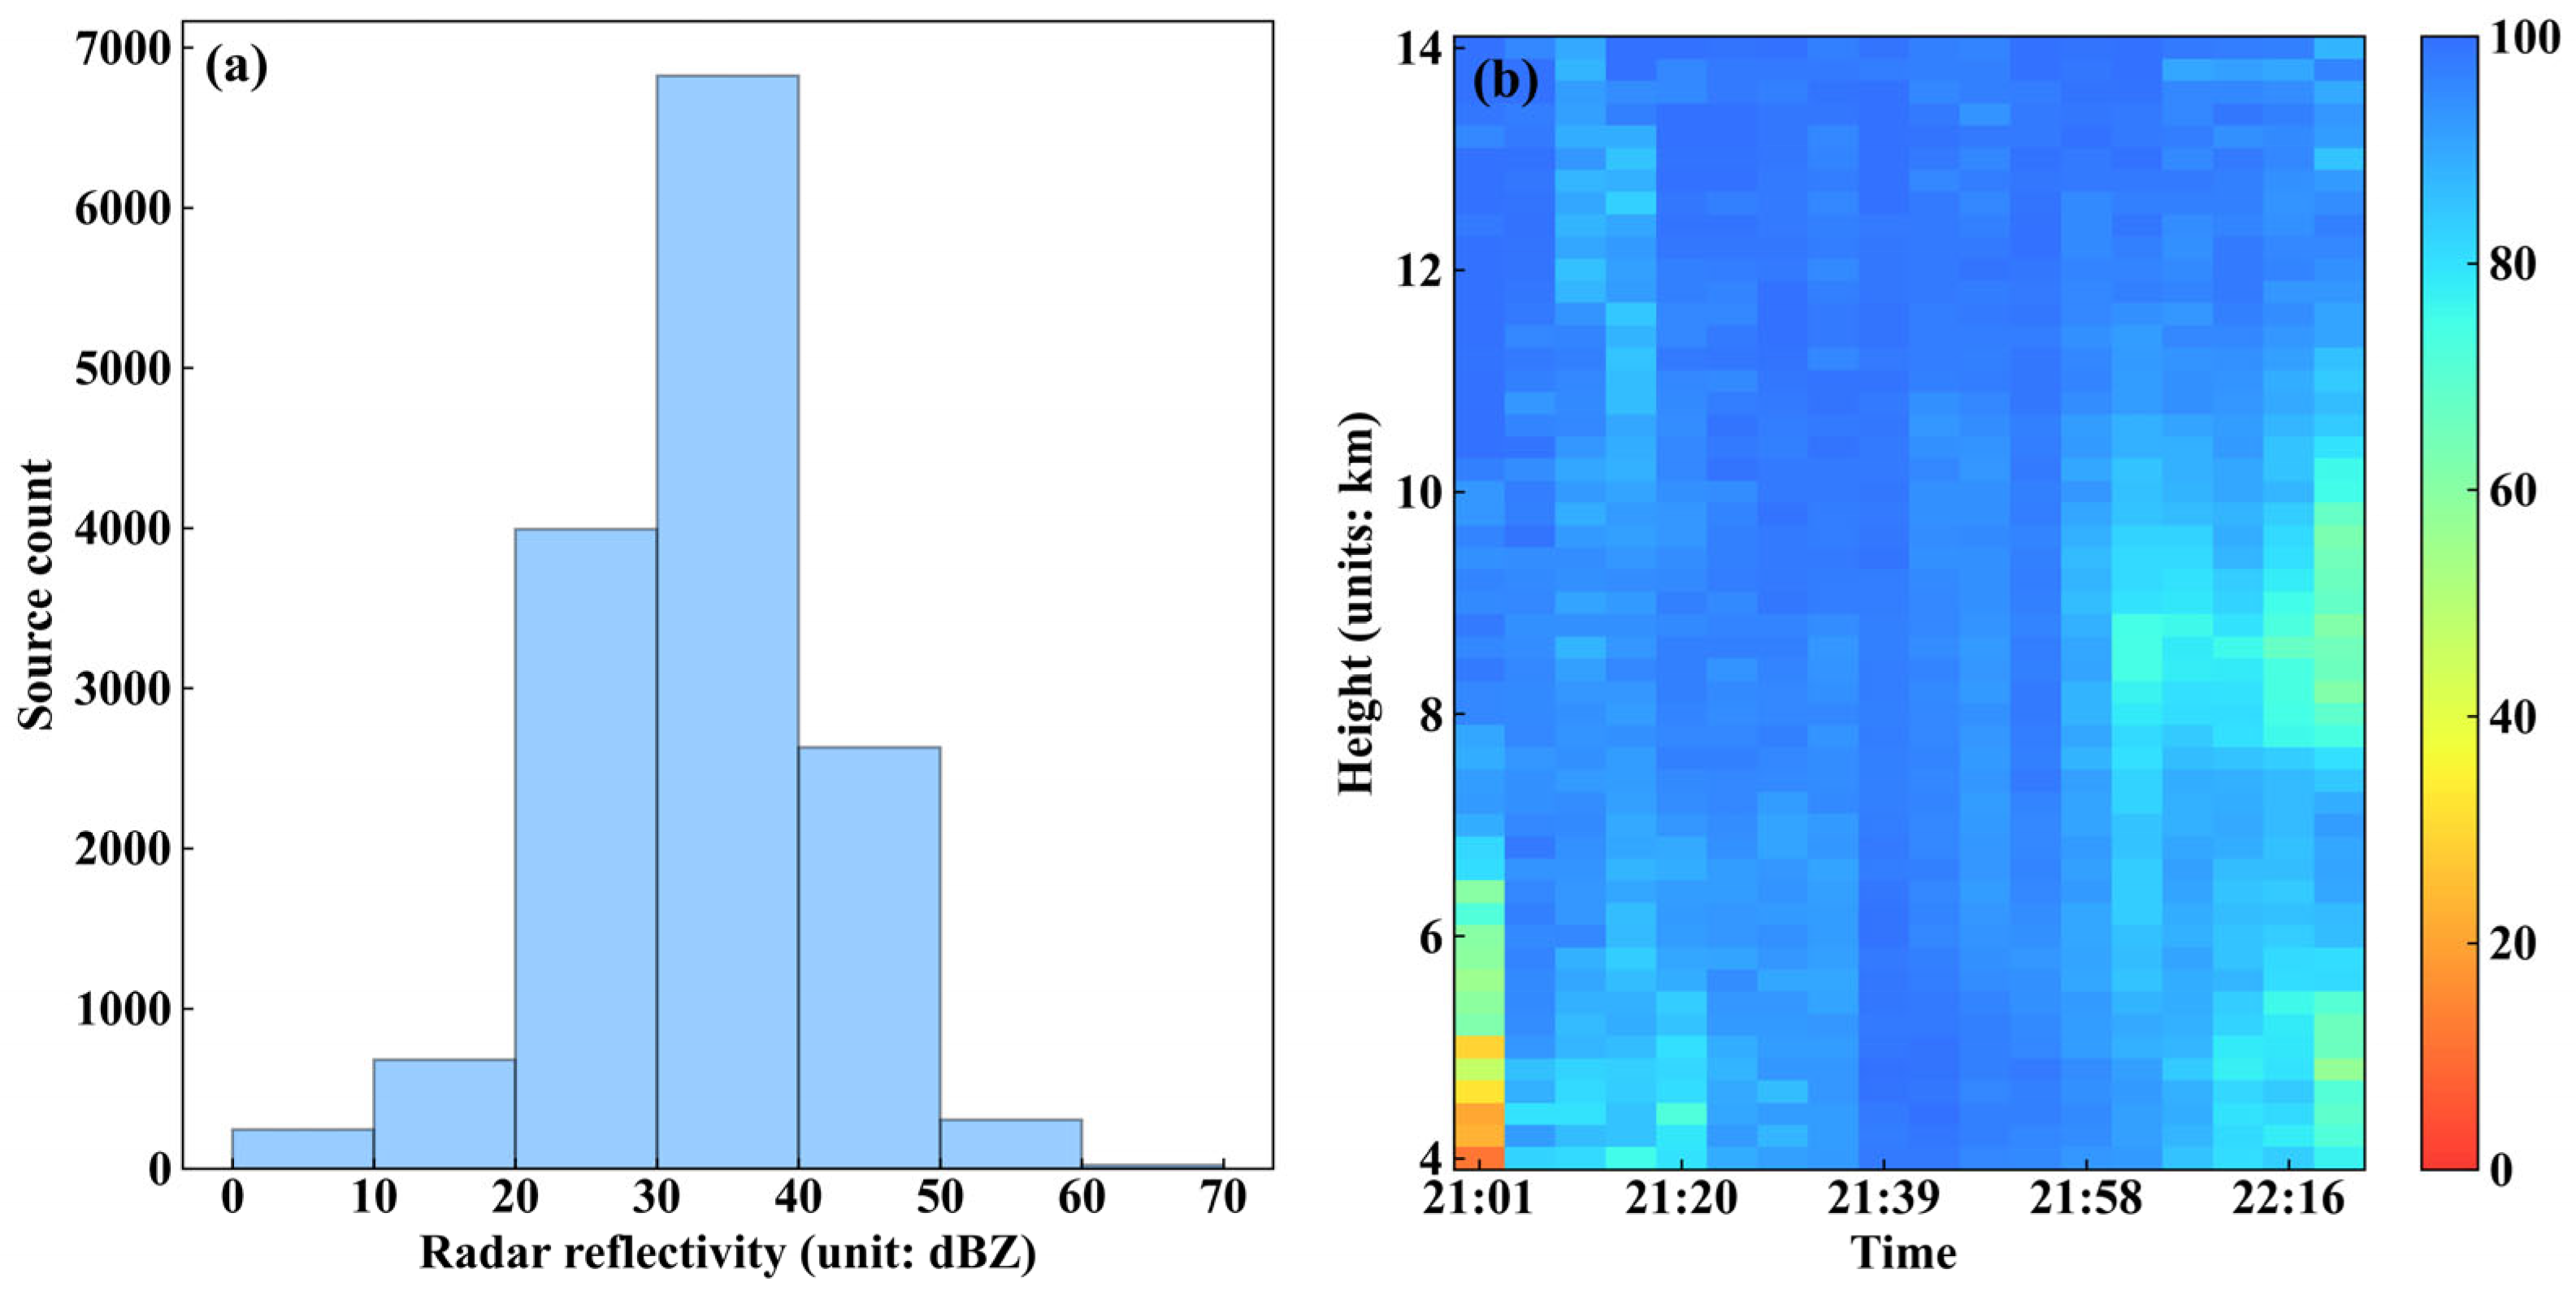
The aim of this study is to analyze the characteristics of lightning sources in relation to hydrometeors during different stages of the thunderstorm. While lightning discharges can also occur in the adjacent stratiform regions, most discharges are found within the intense convective core [5,33,34,35]. Considering that different convective cells may rapidly develop and dissipate during the evolution of the storm, and that lightning sources do not necessarily coincide with the locations of maximum reflectivity, as shown in Figure 2a, a simple yet inclusive approach is needed to identify regions that broadly capture lightning activity and facilitate the analysis of the correlation and evolution between lightning and hydrometeor particles. Statistical analysis of Storm-0611 indicated that more than 80% of the LF lightning sources appear in the region with maximum 20 dBZ echo-top heights above 8 km, as shown in Figure 2b [36]. Consequently, this region is defined as the convective core for this study.
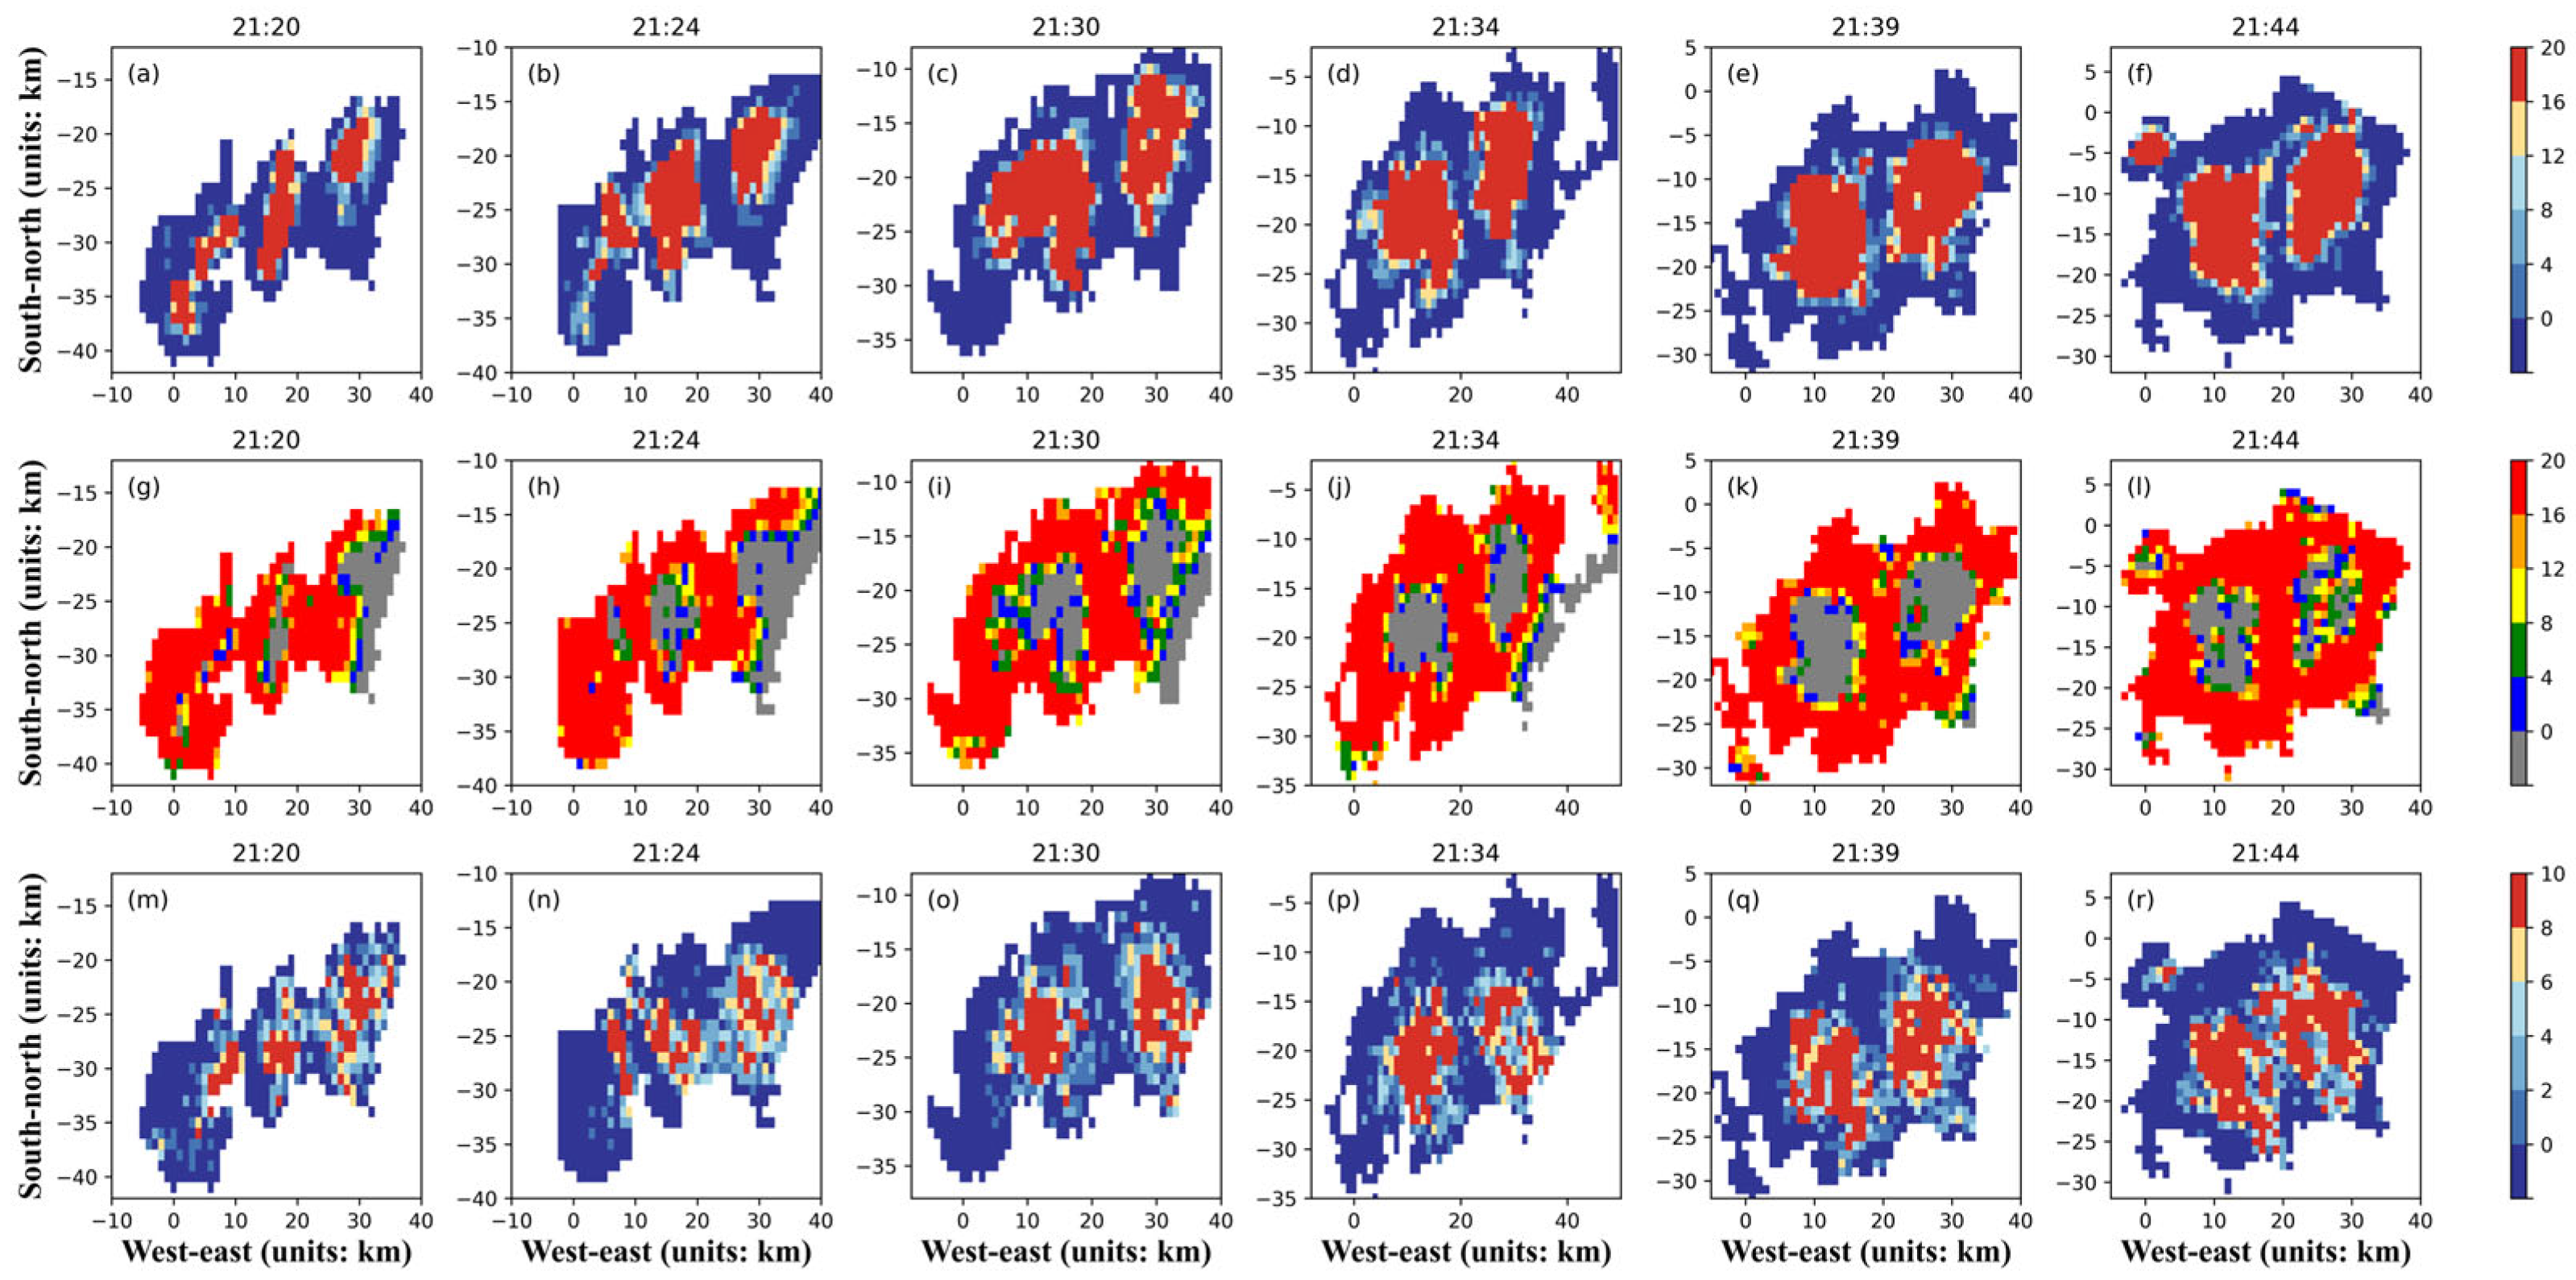
To provide more detailed vertical distributions and temporal evolution of hydrometeors and lightning sources within the convective cores, a vertical spacing of 0.2 km was adopted. However, for correlation analyses between lightning sources and hydrometeors at specific vertical levels, the original three-dimensional grid resolution of 0.5 × 0.5 × 0.2   k m 3 was coarsened to 1.0 × 1.0 × 1.0   k m 3 . In the vertical dimension, data aggregation was performed by integrating nine original height layers spanning ± 0.8   k m around each integer kilometer level (e.g., 1.0 ± 0.8   k m ), as shown in Figure 3. This aggregation method preserves the three-dimensional spatial distributions of lightning sources and hydrometeors and effectively mitigates potential uncertainties associated with radar beam broadening effects, thereby allowing a robust estimation of the correlation coefficients at specific height layers.

3. Results

3.1. Overview of the Development Stages During the Storm

The multicell convective system analyzed in this study occurred in North Carolina on 11 June 2014. Over a 90 min period, Storm-0611 moved mainly northward and exhibited a typical convective evolution, with scattered convective cores gradually merging into larger ones and eventually forming a mature convective structure characterized by intense lightning activity and high echo tops. This event was comprehensively captured by both the LFILMA and the dual-polarization radar, providing high-quality data with fine spatial and temporal resolution for both lightning and microphysical properties. The storm also underwent clear progression through the main stages of convective evolution (development, mature, and dissipation), which enabled the analysis of the correlations between lightning sources and hydrometeors that vary with height and storm evolution, thus offering valuable insights into the vertical coupling of electrification and microphysical processes throughout the storm lifecycle.
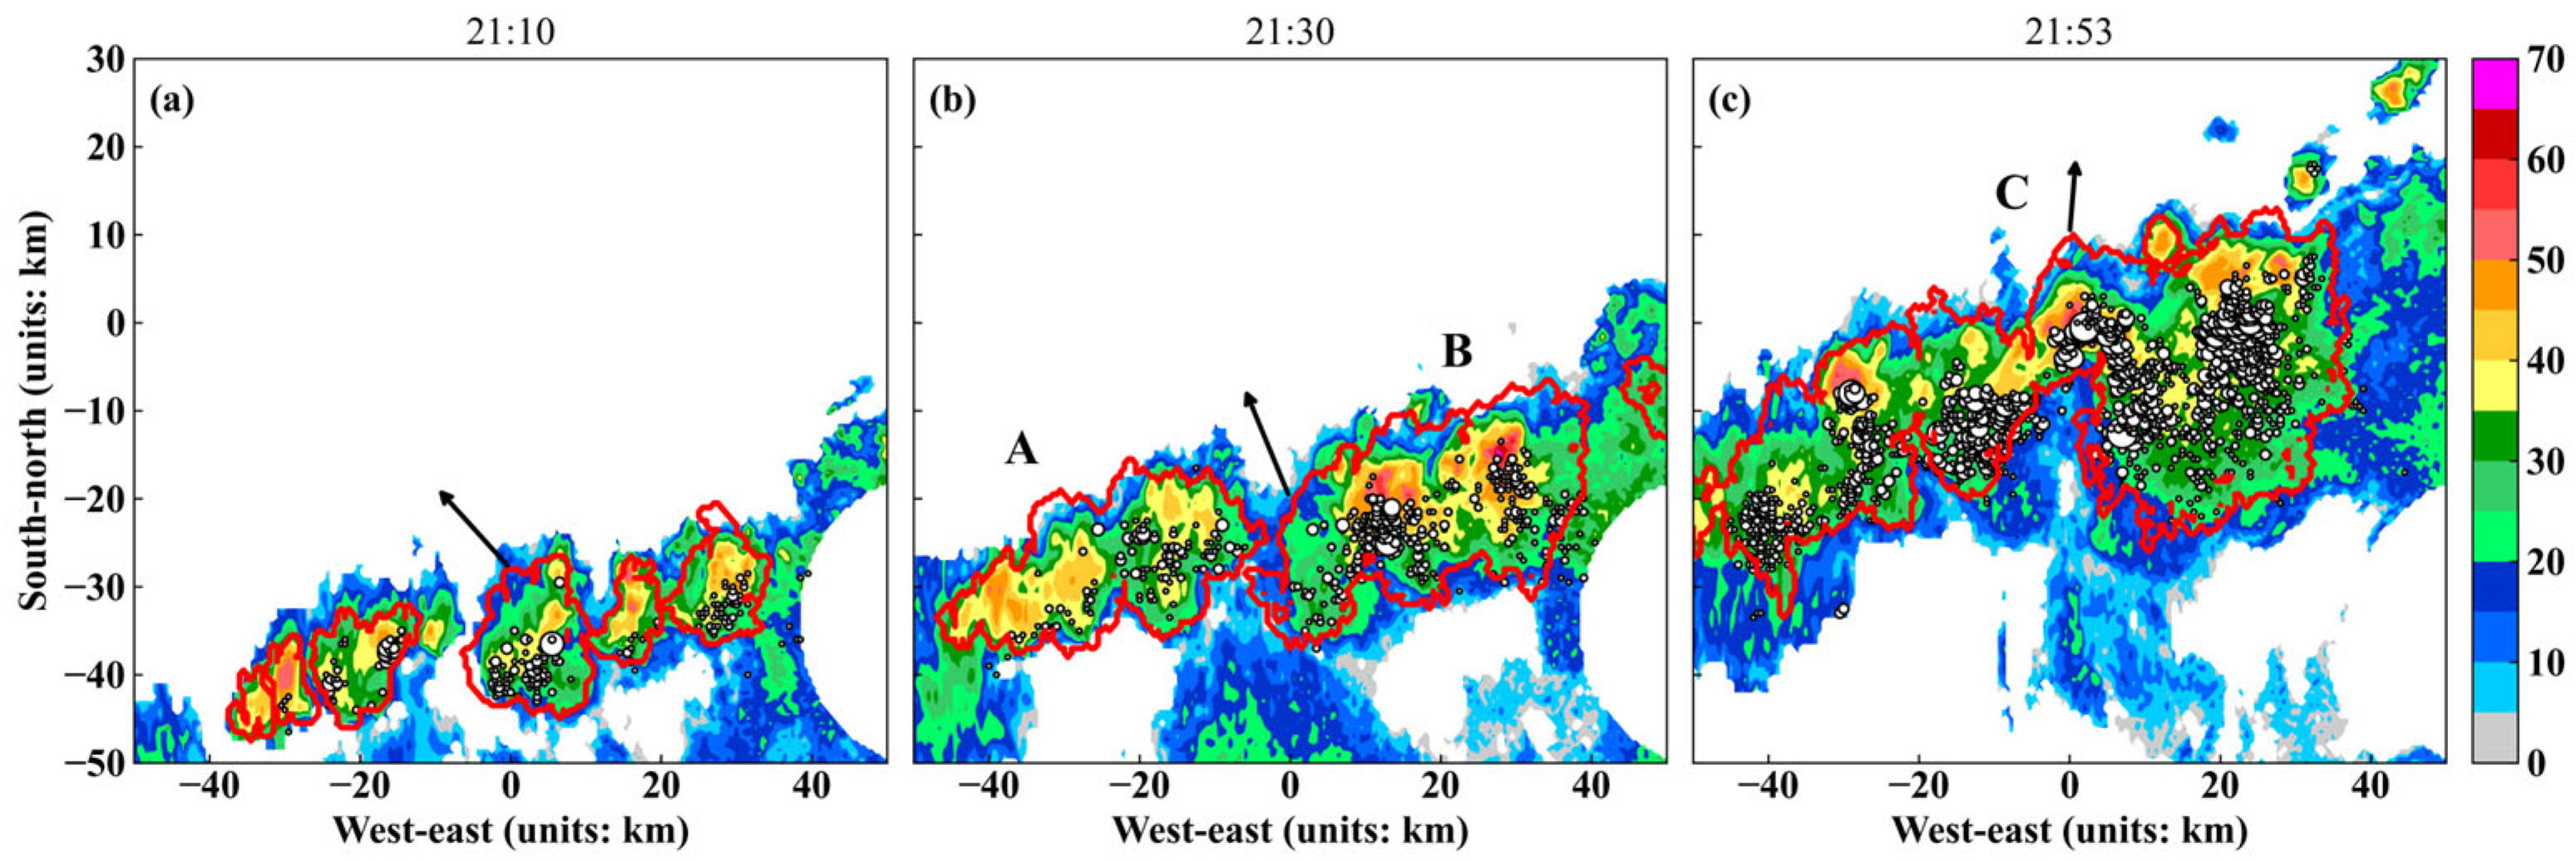
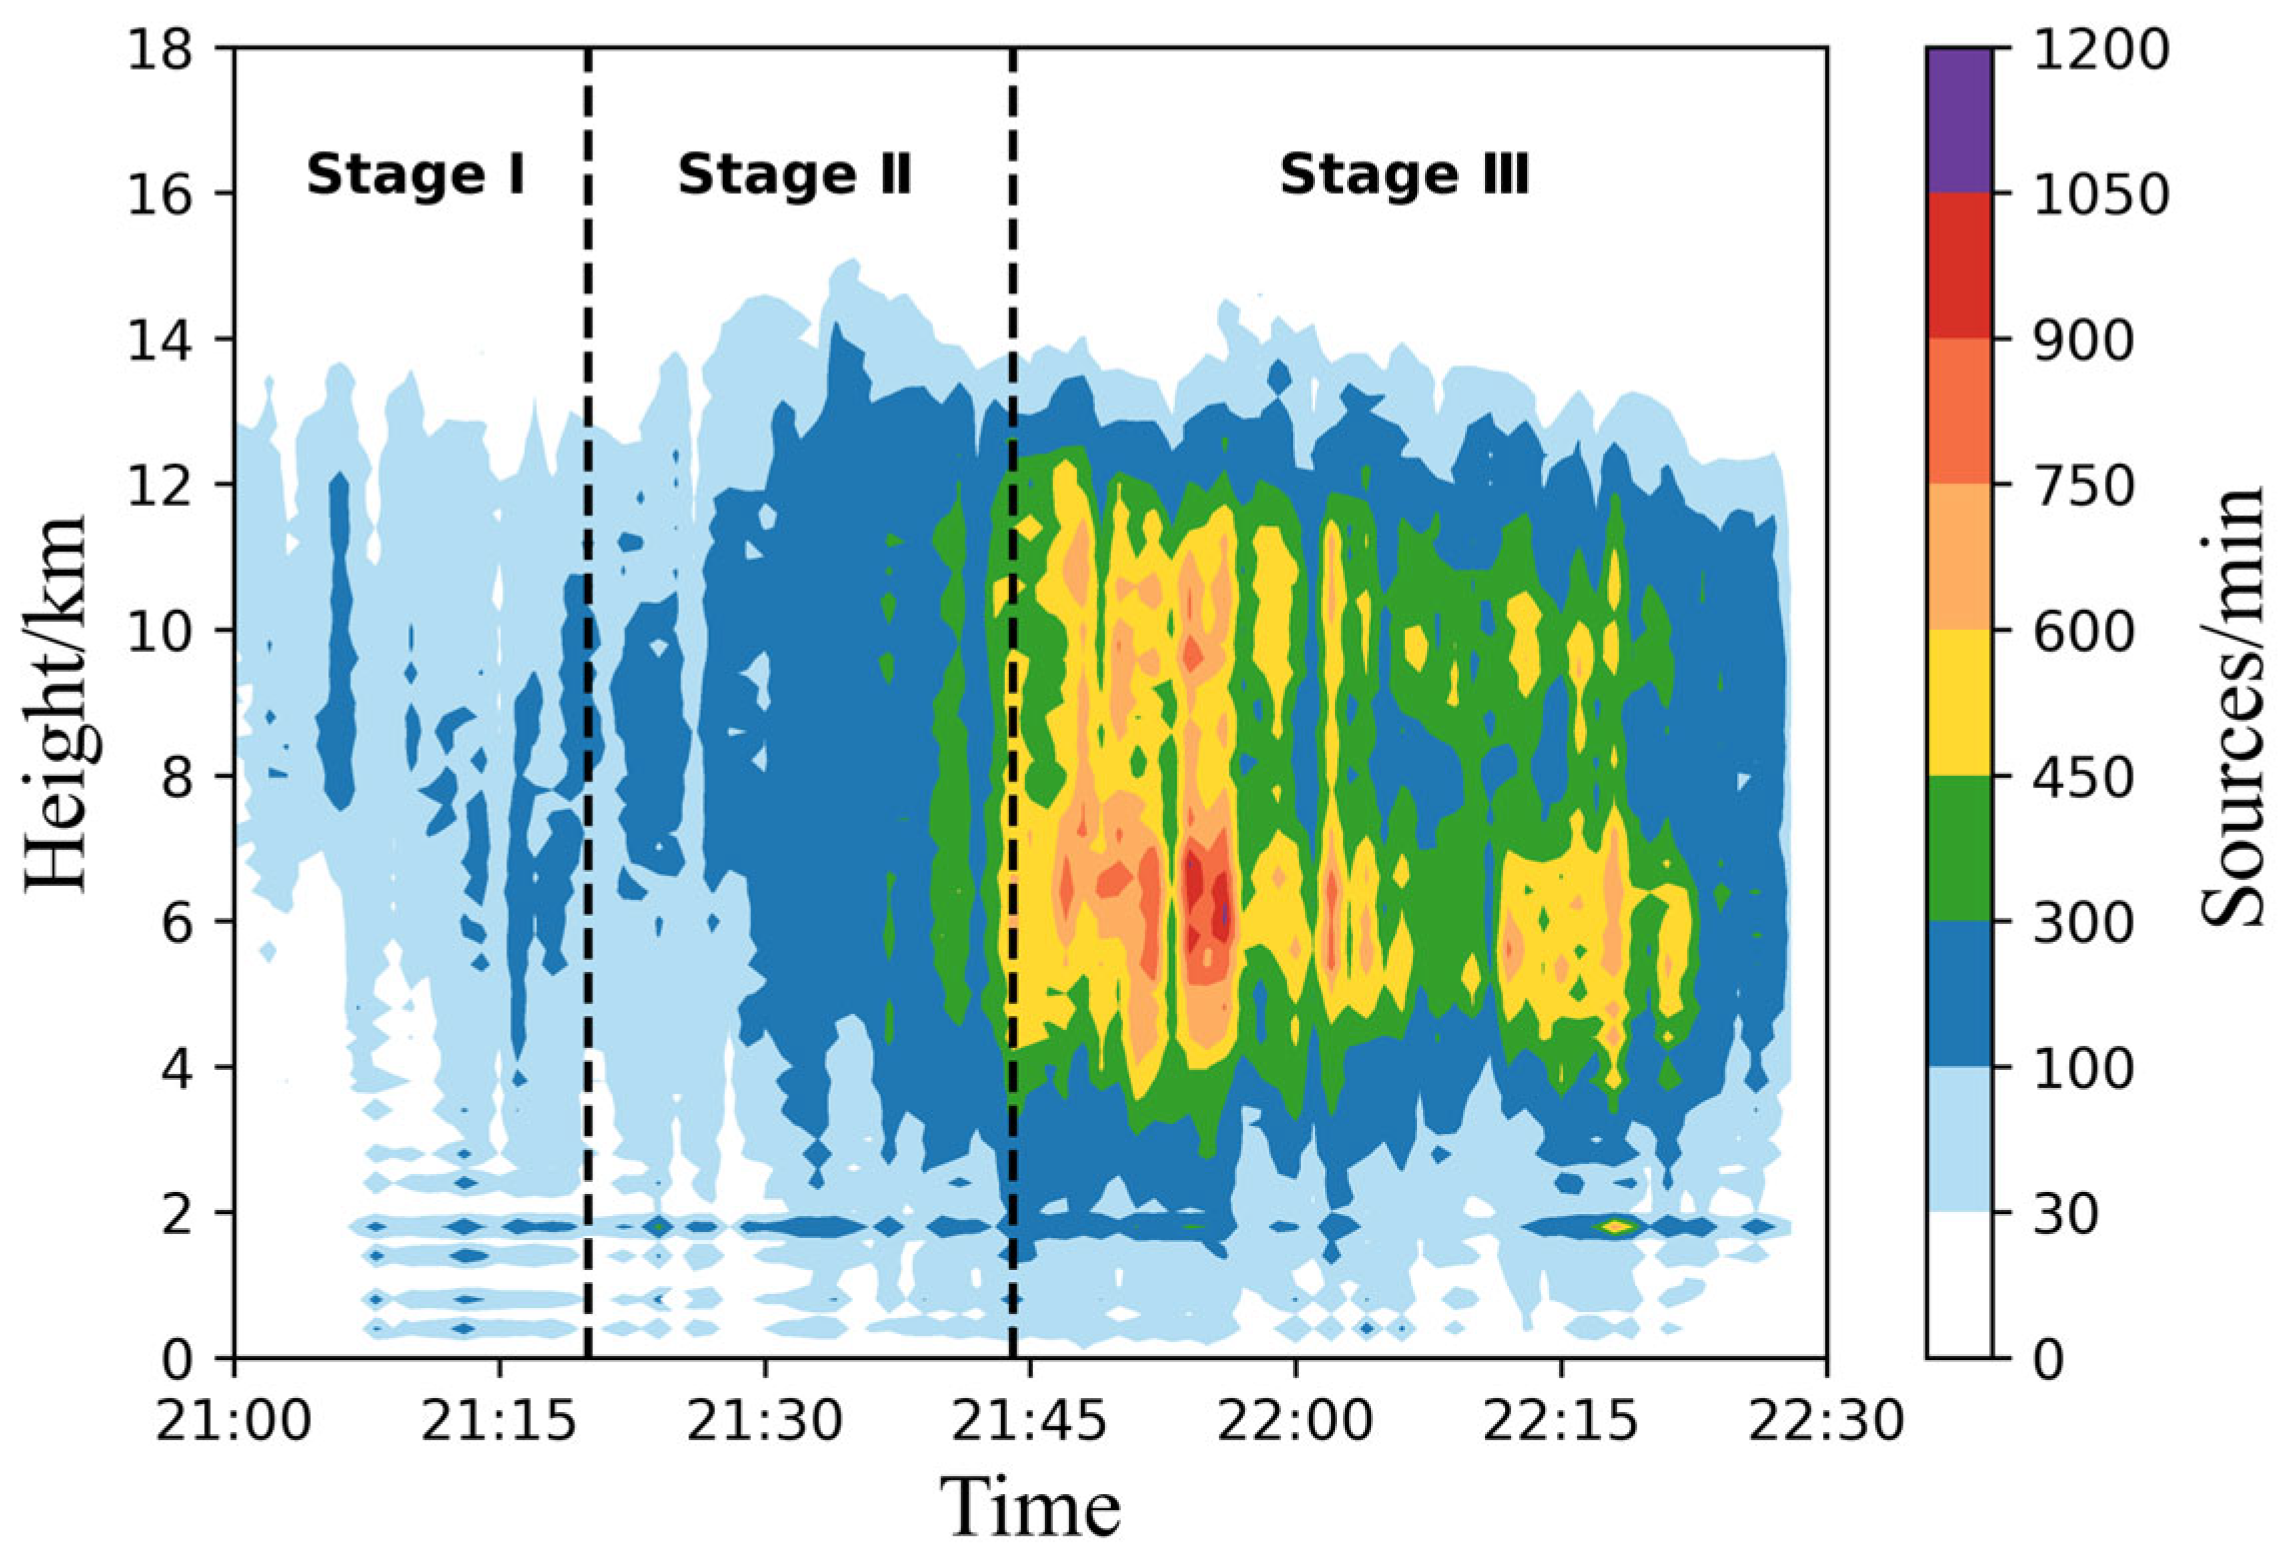
Figure 4 shows the time series of radar reflectivity at 6 km in Storm-0611, with lightning sources mapped in a 5 min window of the radar scan. The white dots represent the lightning sources, with the size of each dot proportional to the lightning source count within a five-minute window of the radar scan. The red contours represent the convective cores, identified using the method described in Section 2.3. Observations show that a zonal echo on the western side of the radar station moved approximately perpendicular to the orientation of the convective line. As the storm developed, smaller scattered convective cores gradually merged into larger convective cores, accompanied by a notable increase in the number and spatial distribution of LF lightning sources. Given the relationship between updraft intensity and echo top height, Storm-0611 was roughly divided into three stages according to the development of echo top heights, convective cores, and lightning activity, as shown in Figure 5. The early stage of Storm-0611 (Stage I) was defined from 21:00 UTC to 21:20 UTC. During this period, LF lightning source density remained relatively low, with most values below 100 sources per minute per 0.2 km layer. The convective cores exhibited dispersed and short-lived characteristics (Figure 4a), and the 40 dBZ echo top height stabilized around 10 km. As Storm-0611 evolved into its development stage between 21:20 UTC and 21:44 UTC (Stage II), the previously dispersed convective cores merged into convective cores A and B, as shown in Figure 4b. A significant increase in lightning source density and 40 dBZ echo top height was observed. Source density exceeded 300 sources per minute per 0.2 km layer, and the 40 dBZ echo top height rose significantly from 10 km to 15 km. Moreover, differences were observed between the two cores during Stage II. Both radar reflectivity and lightning source density of convective core B are higher than those of convective core A, indicating more vigorous development in convective core B. The mature and dissipating stages of Storm-0611 occurred from 21:44 UTC to 22:21 UTC (Stage III), during which the two convective cores merged into convective core C, and the most intense lightning activity was observed. This core expanded to dimensions of approximately 30–40 km in width and 90 km in length. Relative to the direction of the moving echoes, the lightning sources were predominantly concentrated in the middle and rear regions. This stage was marked by a distinct dual-peak vertical distribution of lightning sources, with the two peaks centered at 5–7 km and 9–11 km, respectively. After 22:02 UTC, both the lightning source density and the 40 dBZ echo top height began to decrease, reflecting the weakening of updraft intensity and the overall dissipation of Storm-0611.

3.2. Correlation Between Hydrometeors and Lightning Sources Within Different Convective Cores

Lightning discharges and radar-inferred microphysical characteristics within the designated convective cores were used to investigate the correlation between hydrometeors and lightning activity. As shown above, the convective cores in the early stage were dispersed and short-lived (lasting 5–10 min), with a very low density of lightning sources. From a statistical standpoint, the cores during Stage I were not included in this study. Comparatively, convective cores A, B, and C had lifetimes exceeding 24 min, higher echo top heights, and maximum heights of LDG, HDG, and Ha particles reaching above 15 km, 7 km, and 6 km, respectively. According to reanalysis data, ambient temperatures at 4.1, 6.3, 7.8, 9.2, and 10.5 km were about 0, −10, −20, −30, and −40 °C, respectively. These observed heights of ice-phase particles provide key indicators of intense updrafts in Storm-0611, especially as graupel particles are known to play a significant role in the electrification process [37,38,39]. Therefore, this study focuses primarily on the spatiotemporal evolution of microphysical characteristics and lightning discharges, as well as the correlation between hydrometeors and LF lightning sources within three convective cores, A, B, and C, during Stages II and III.

3.2.1. Convective Core A

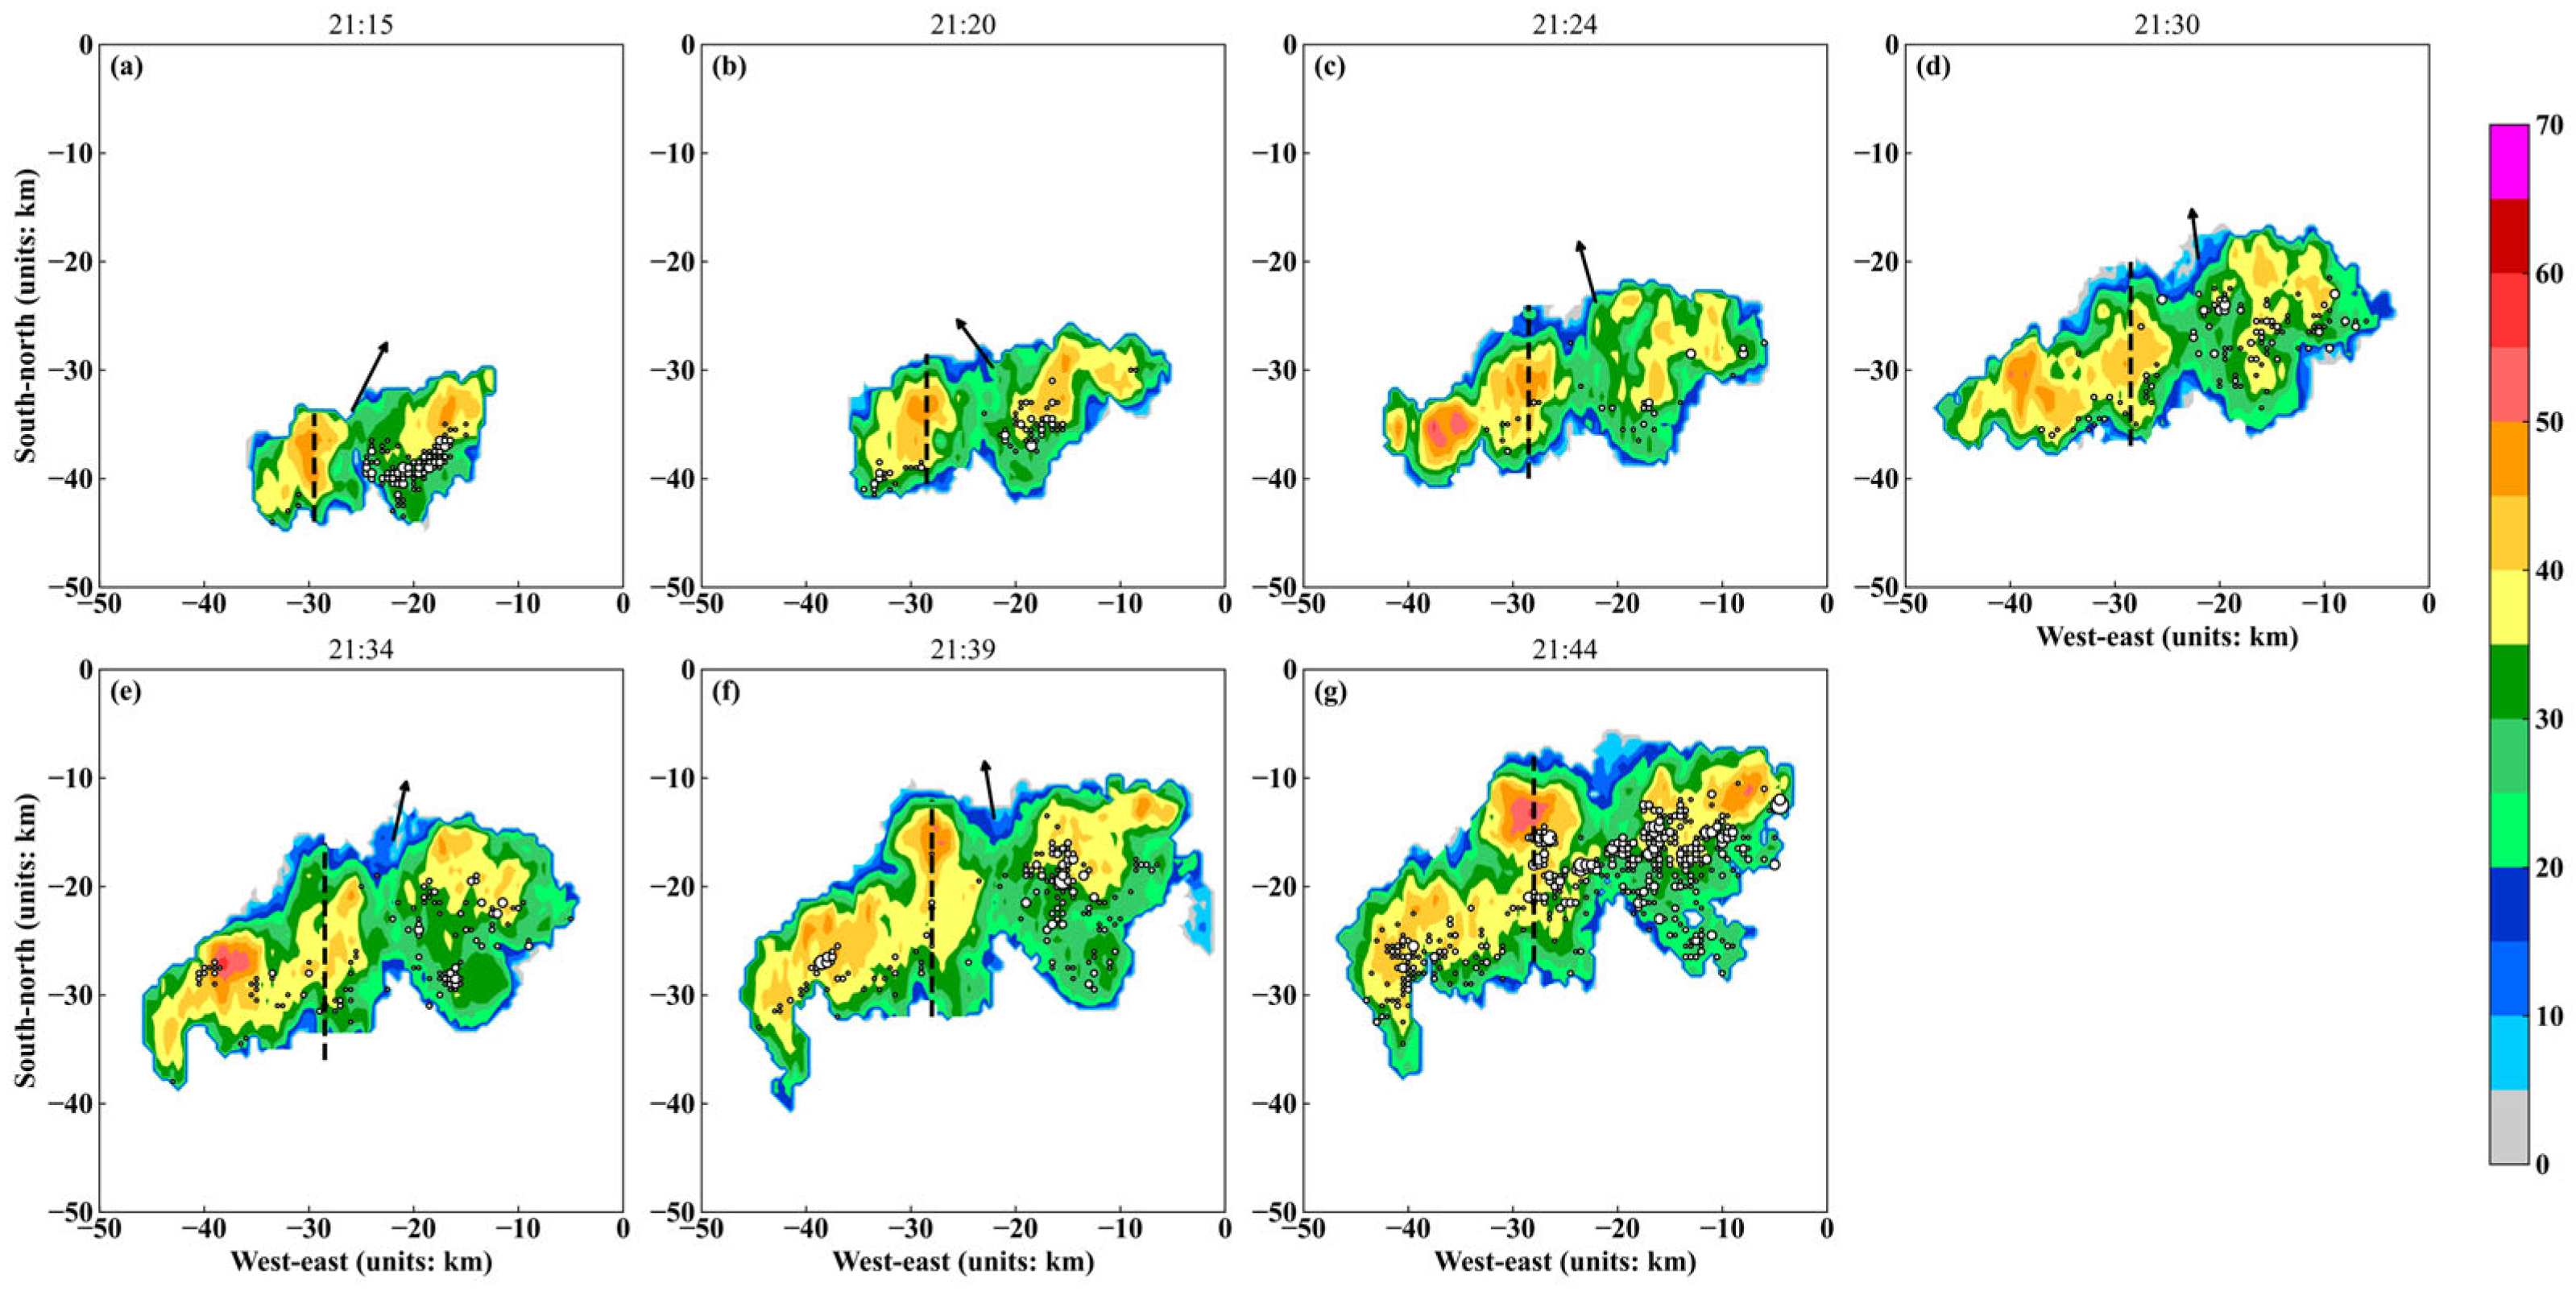
To provide an overview of the temporal evolution of convective core A, a time series of radar reflectivity at 6 km from 21:15 to 21:44 UTC is shown in Figure 6. During this period, the source count exhibited a remarkable increase from 7271 to 41,787, with a particularly sharp rise from 16,261 to 41,787 between 21:39 and 21:44 UTC. The horizontal scale of convective core A gradually increased, with the maximum echo intensity ranging from 56 to 63 dBZ. The 40 dBZ echo top height increased from 10.8 to 13.8 km from 21:15 to 21:30 UTC, then decreased to 8.8 km, suggesting a slight weakening in vertical development.
The hydrometeor classification results for convective core A, derived from radar polarization parameters and reanalysis data, are shown in Figure 7. HDG particles were identified within the temperature range of 0 to −20 °C. Before 21:39 UTC, HDG particles gradually decreased but showed a significant increase afterward. Between −10 °C and −40 °C, LDG and AG particles were dominant. Above the −40 °C level, LDG, AG, IC, and VI particles coexisted. LDG particles reached heights of up to 15 km, remaining above this level before descending to approximately 10 km (near the −40 °C level) by 21:44 UTC. LF lightning sources were primarily concentrated in regions containing LDG particles, with stratification becoming apparent after 21:34 UTC. The descent of graupel particles suggests that updrafts weakened, while the lifting of Ha and HDG particles between 0 and −20 °C after 21:34 UTC may be attributed to relatively weak and localized updrafts at the leading edge of convective core A, which provided a favorable environment for electrification below the −20 °C level. Consistent with these microphysical changes, a noticeable enhancement in K D P values was observed within the 0 °C to –20 °C layer after 21:34 UTC, indicating an increased presence of large, water-coated particles (such as HDG and Ha) aloft and further supporting the occurrence of upward transport by updrafts.
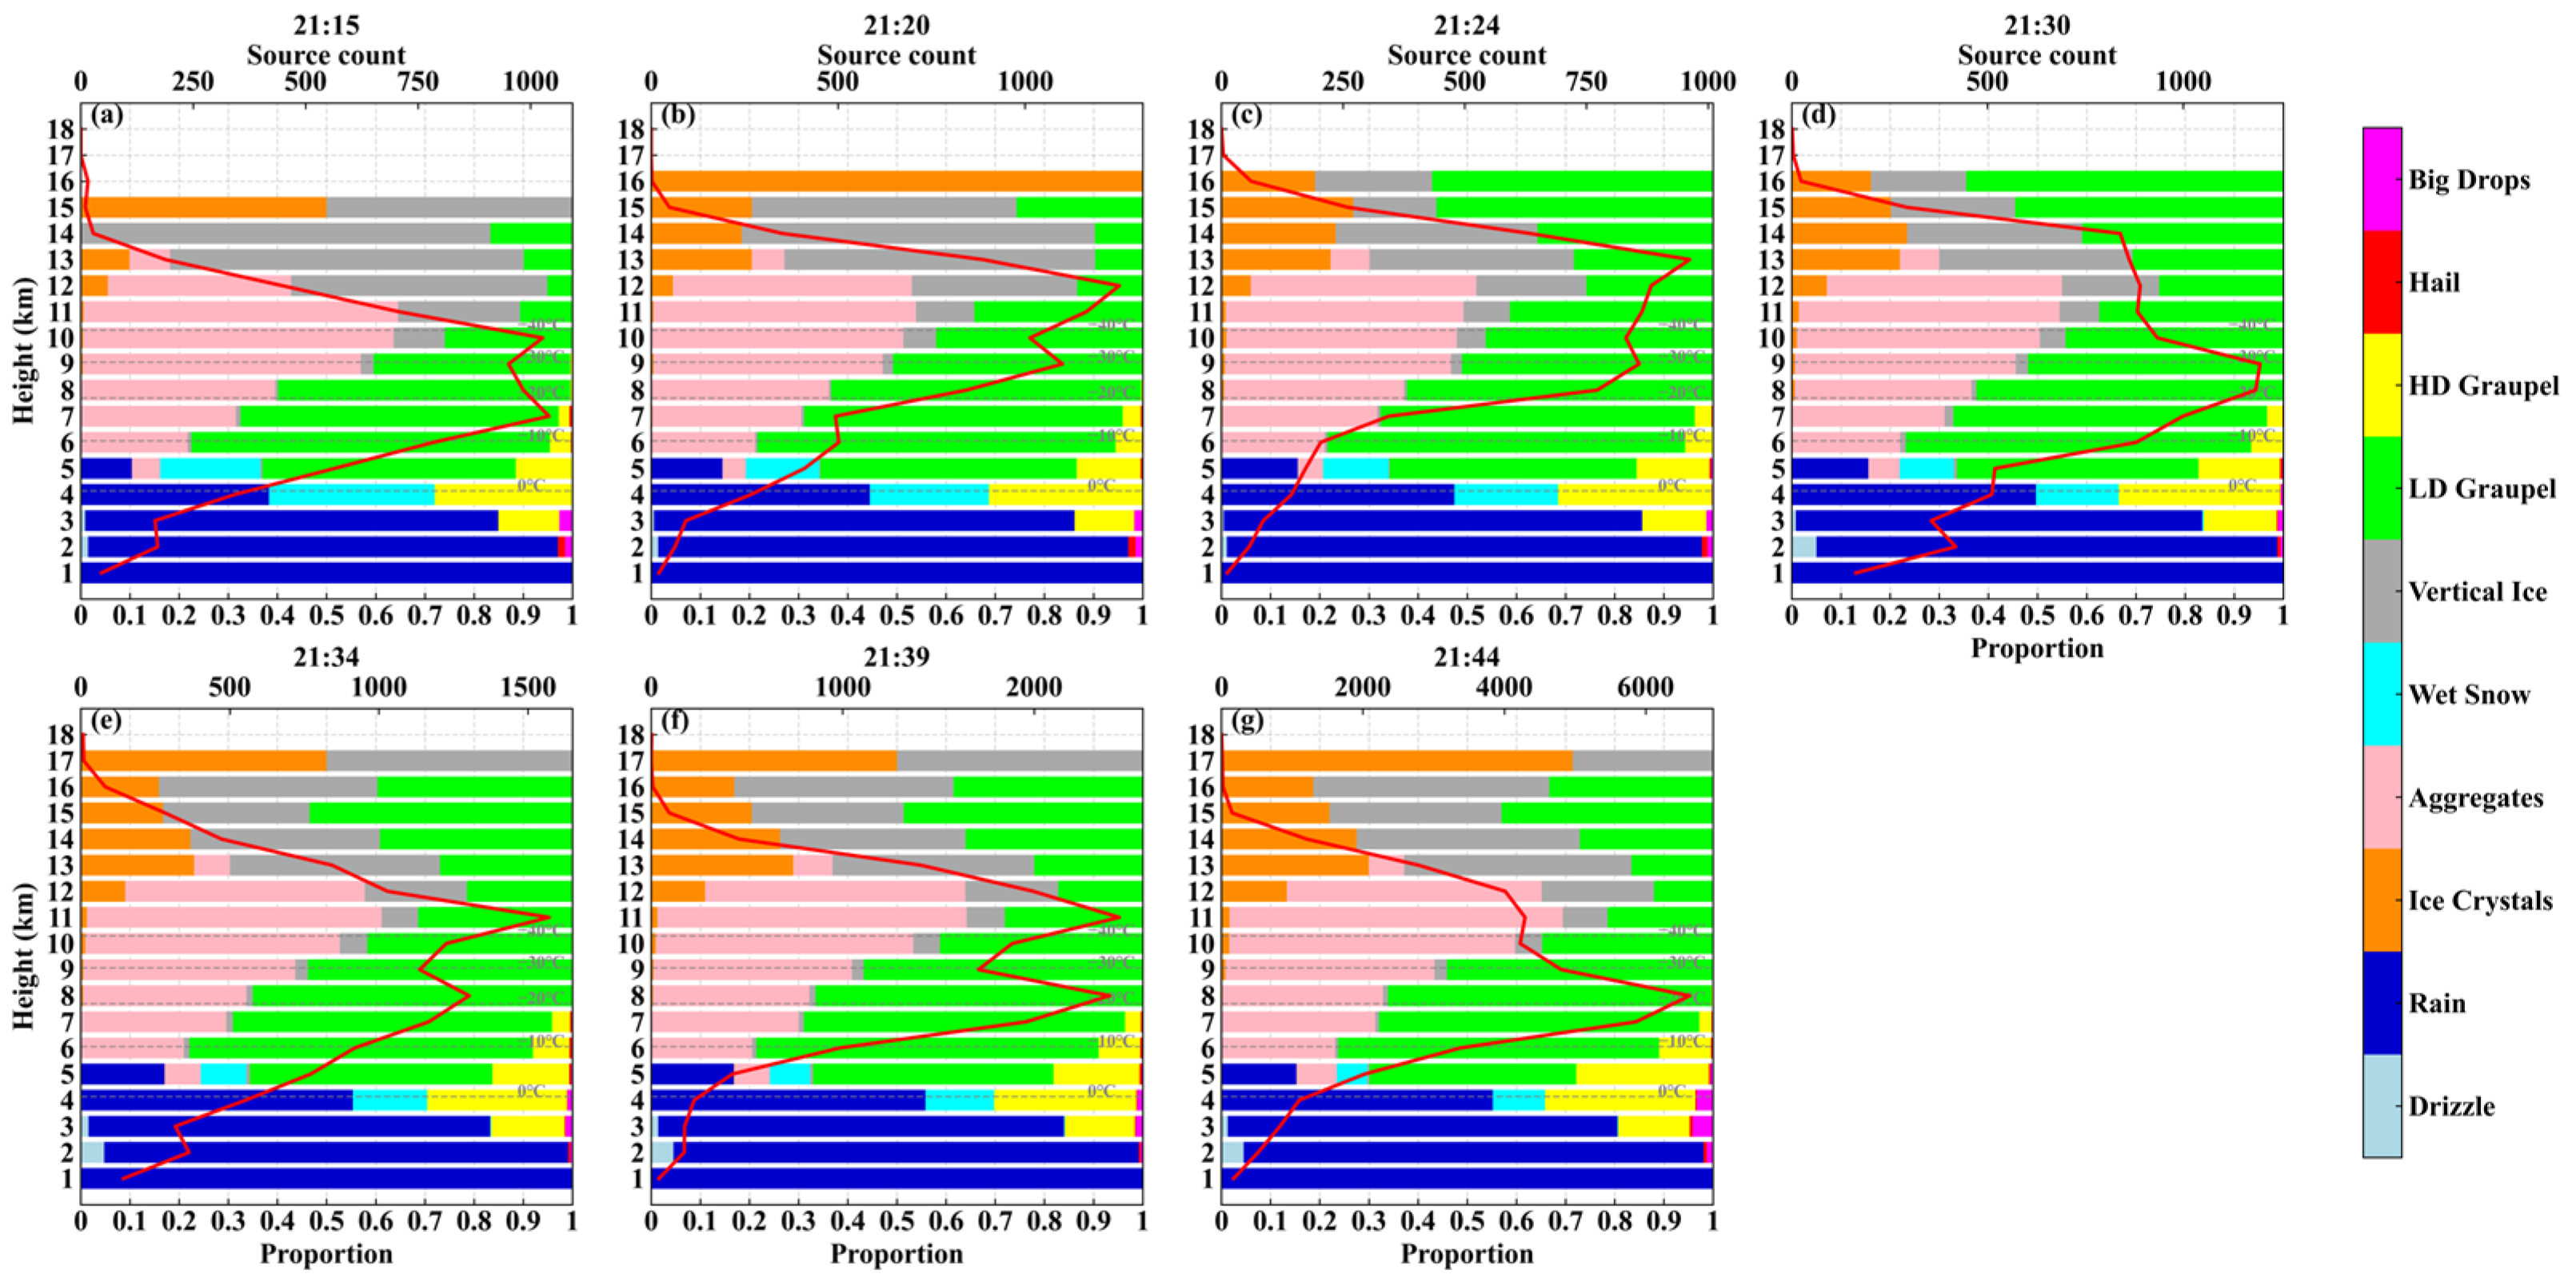
Figure 8 shows the vertical distribution of grid proportions for 10 hydrometeor types at LF lightning source locations in convective core A, and the red curve represents the variation in LF lightning sources with height. Below −10 °C, LF lightning sources were found in regions dominated by RN, HDG, WS, and BD particles. Within the −10 °C to −40 °C temperature range, LF lightning sources appeared predominantly in regions dominated by LDG and AG. Above −40 °C, LF lightning sources occurred in regions dominated by IC and VI particles, in addition to those dominated by AG and LDG particles. Overall, lightning sources were primarily located in LDG, AG, VI, and IC regions, with their respective proportions being 40%, 34%, 11%, and 6%. The main charging zone was situated above the −10 °C isotherm, highlighting the crucial role of ice-phase hydrometeors in thunderstorm electrification [1,7,12,24,40,41,42].
Before 21:34 UTC, LF lightning sources were distributed mainly above 6 km (around the −10 °C level), with the peak height continuously shifting. The proportion of lightning occurrences within the LDG region significantly increased. Frequent discharge activity at different height levels may be attributed to the ascent of electrically charged particles driven by strong updrafts. After that time, the peak heights of LF lightning sources stabilized at around 8 km and 11 km, forming a consistent dual-peak distribution. This transition suggests a weakening of the intense updrafts, which reduced the transport of charged particles to higher altitudes. As a result, the charge regions became more structured and stable, indicative of a well-developed thunderstorm electrification system.
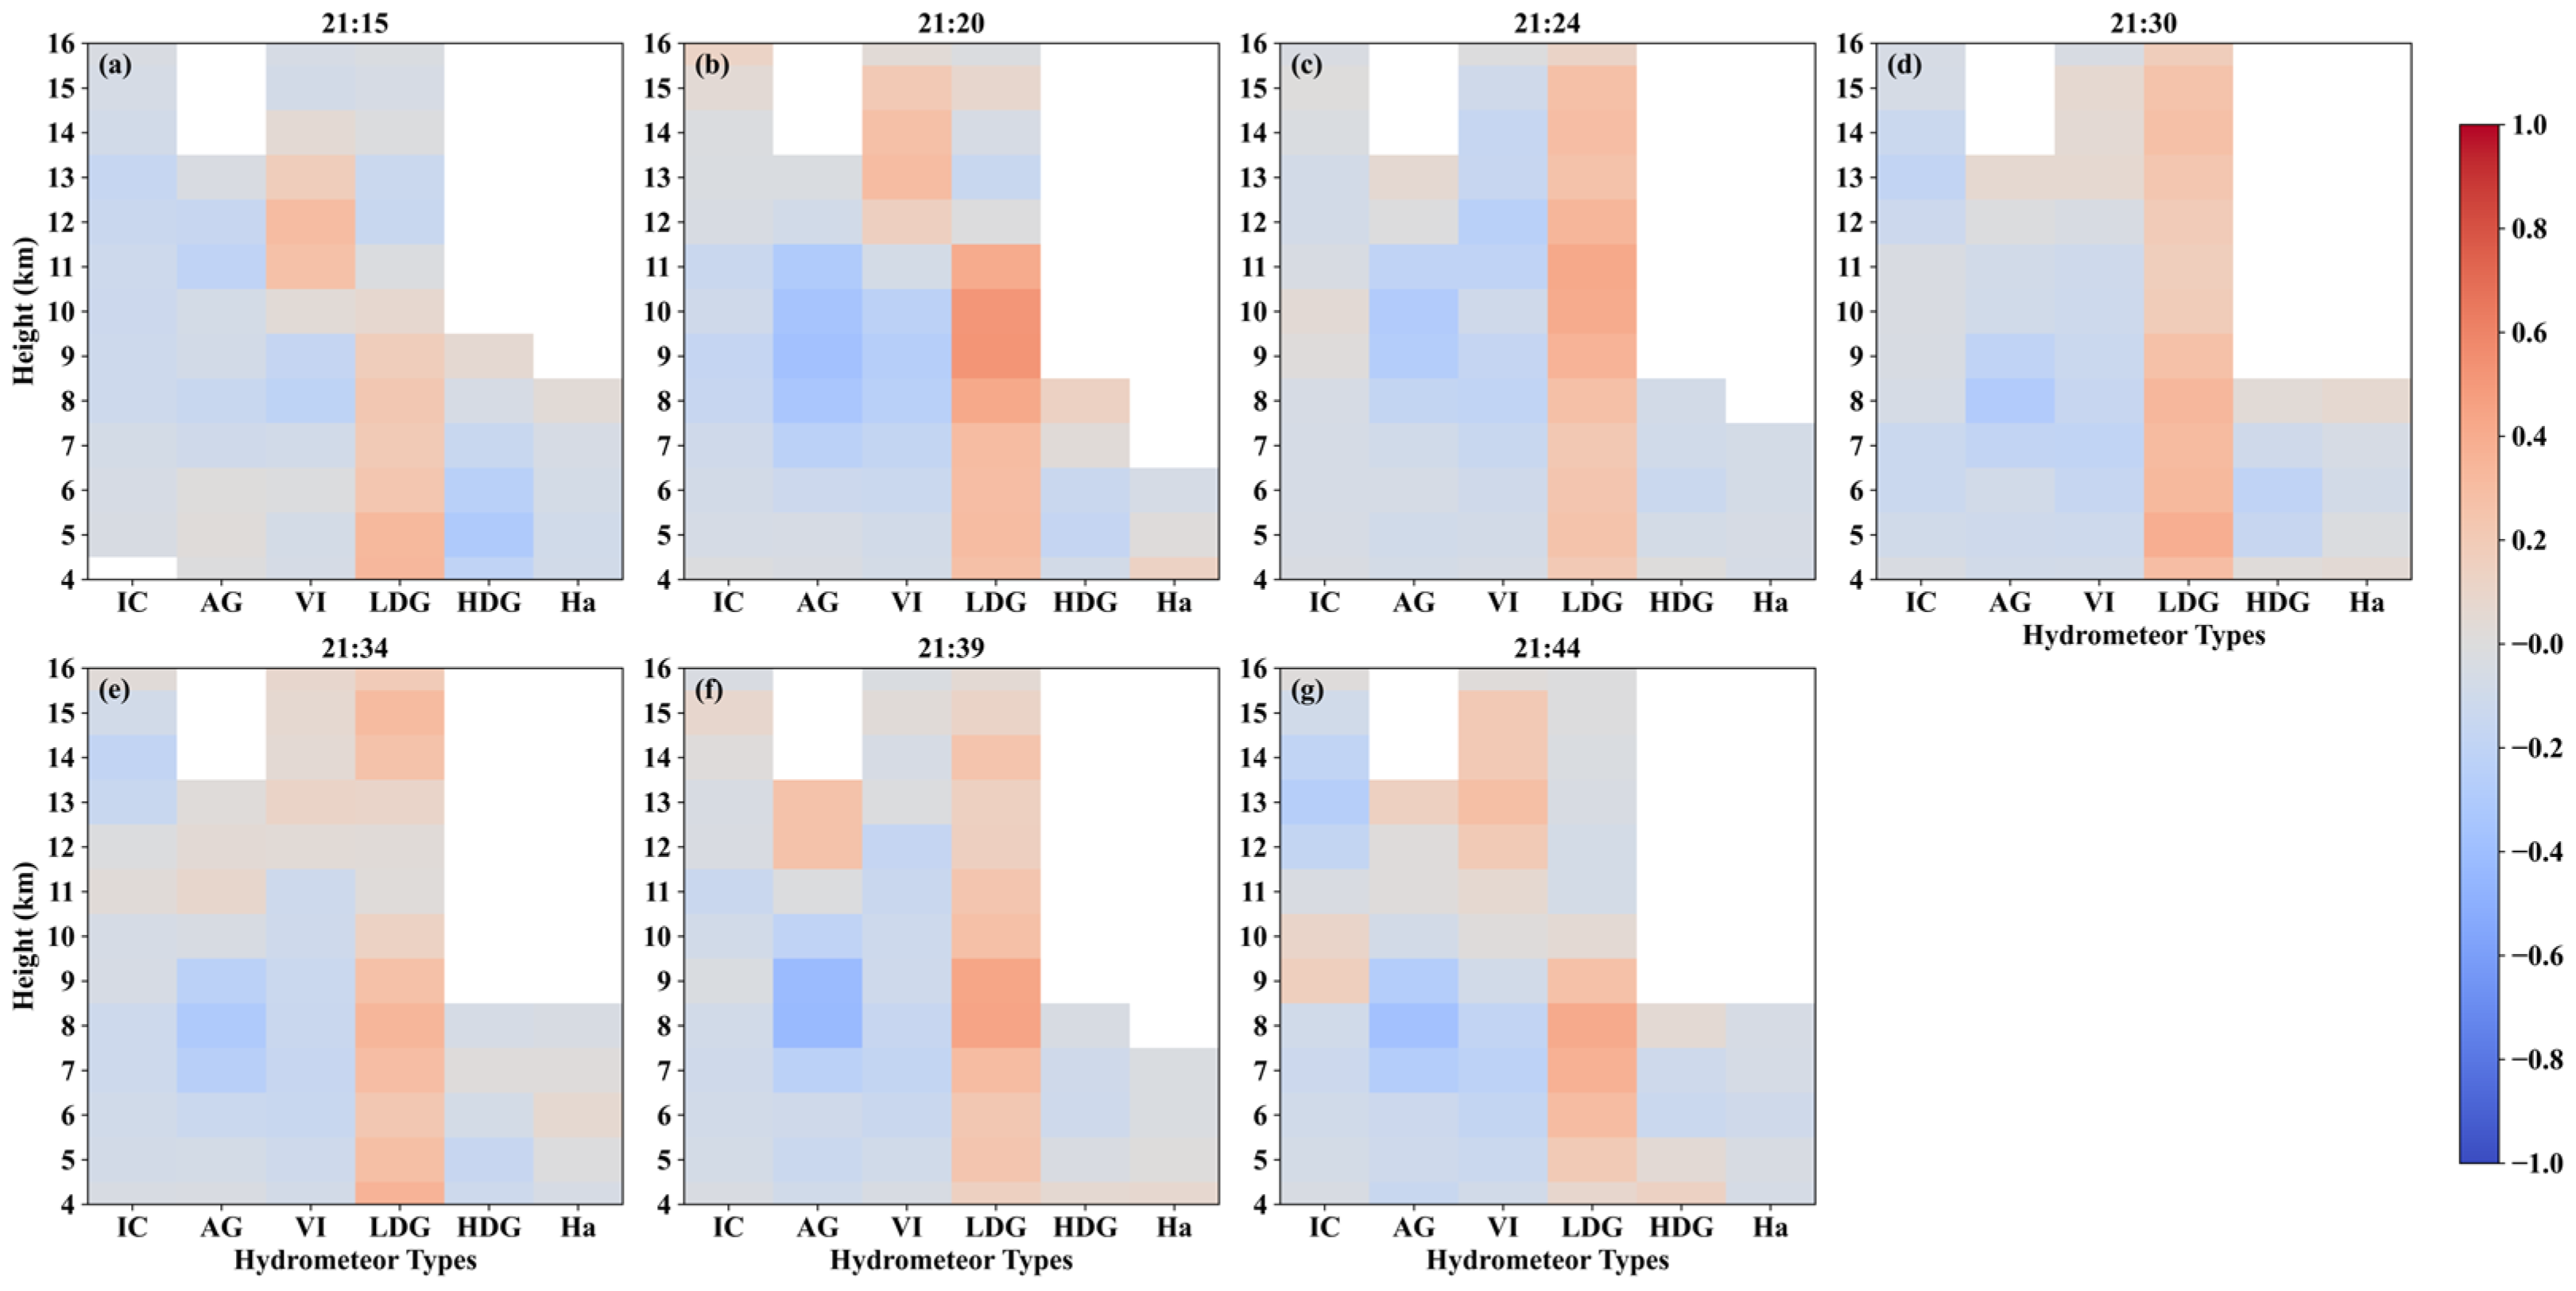
In order to investigate the relationship between lightning discharges and hydrometeors, the LF lightning sources and hydrometeors were analyzed using a grid resolution of 1.0 × 1.0 × 1.0   k m 3 , as described in Section 2.3. Figure 9 illustrates the correlations between LF lightning sources and six types of ice-phase particles above the 0 °C isotherm (about 4 km). The results show that LDG and VI had a positive correlation with LF lightning sources. The strongest correlation between LDG and LF lightning sources was observed at heights ranging from 5 to 11 km, with the peak correlation coefficient of 0.52 occurring at 9 km at 21:20 UTC. Between 21:15 and 21:24 UTC, the heights with the highest correlation coefficient increased from 5 to 11 km, then gradually decreased to 5 km by 21:34 UTC, subsequently stabilizing at 8 km from 21:39 to 21:44 UTC. It is worth emphasizing that the HID assigns a specific hydrometeor type to each grid point based on polarization parameters, which are primarily determined by the dominant hydrometeor type. As the correlation was calculated between the 2D matrix of lightning sources and that of each hydrometeor type at each height level, this approach can reveal positive spatial correlations with certain hydrometeor types, while simultaneously resulting in negative correlations with others. However, the classification does not imply that only this type of hydrometeor is present within the grid point. Therefore, this study focuses only on hydrometeor types that exhibit positive correlations with lightning sources.

3.2.2. Convective Core B

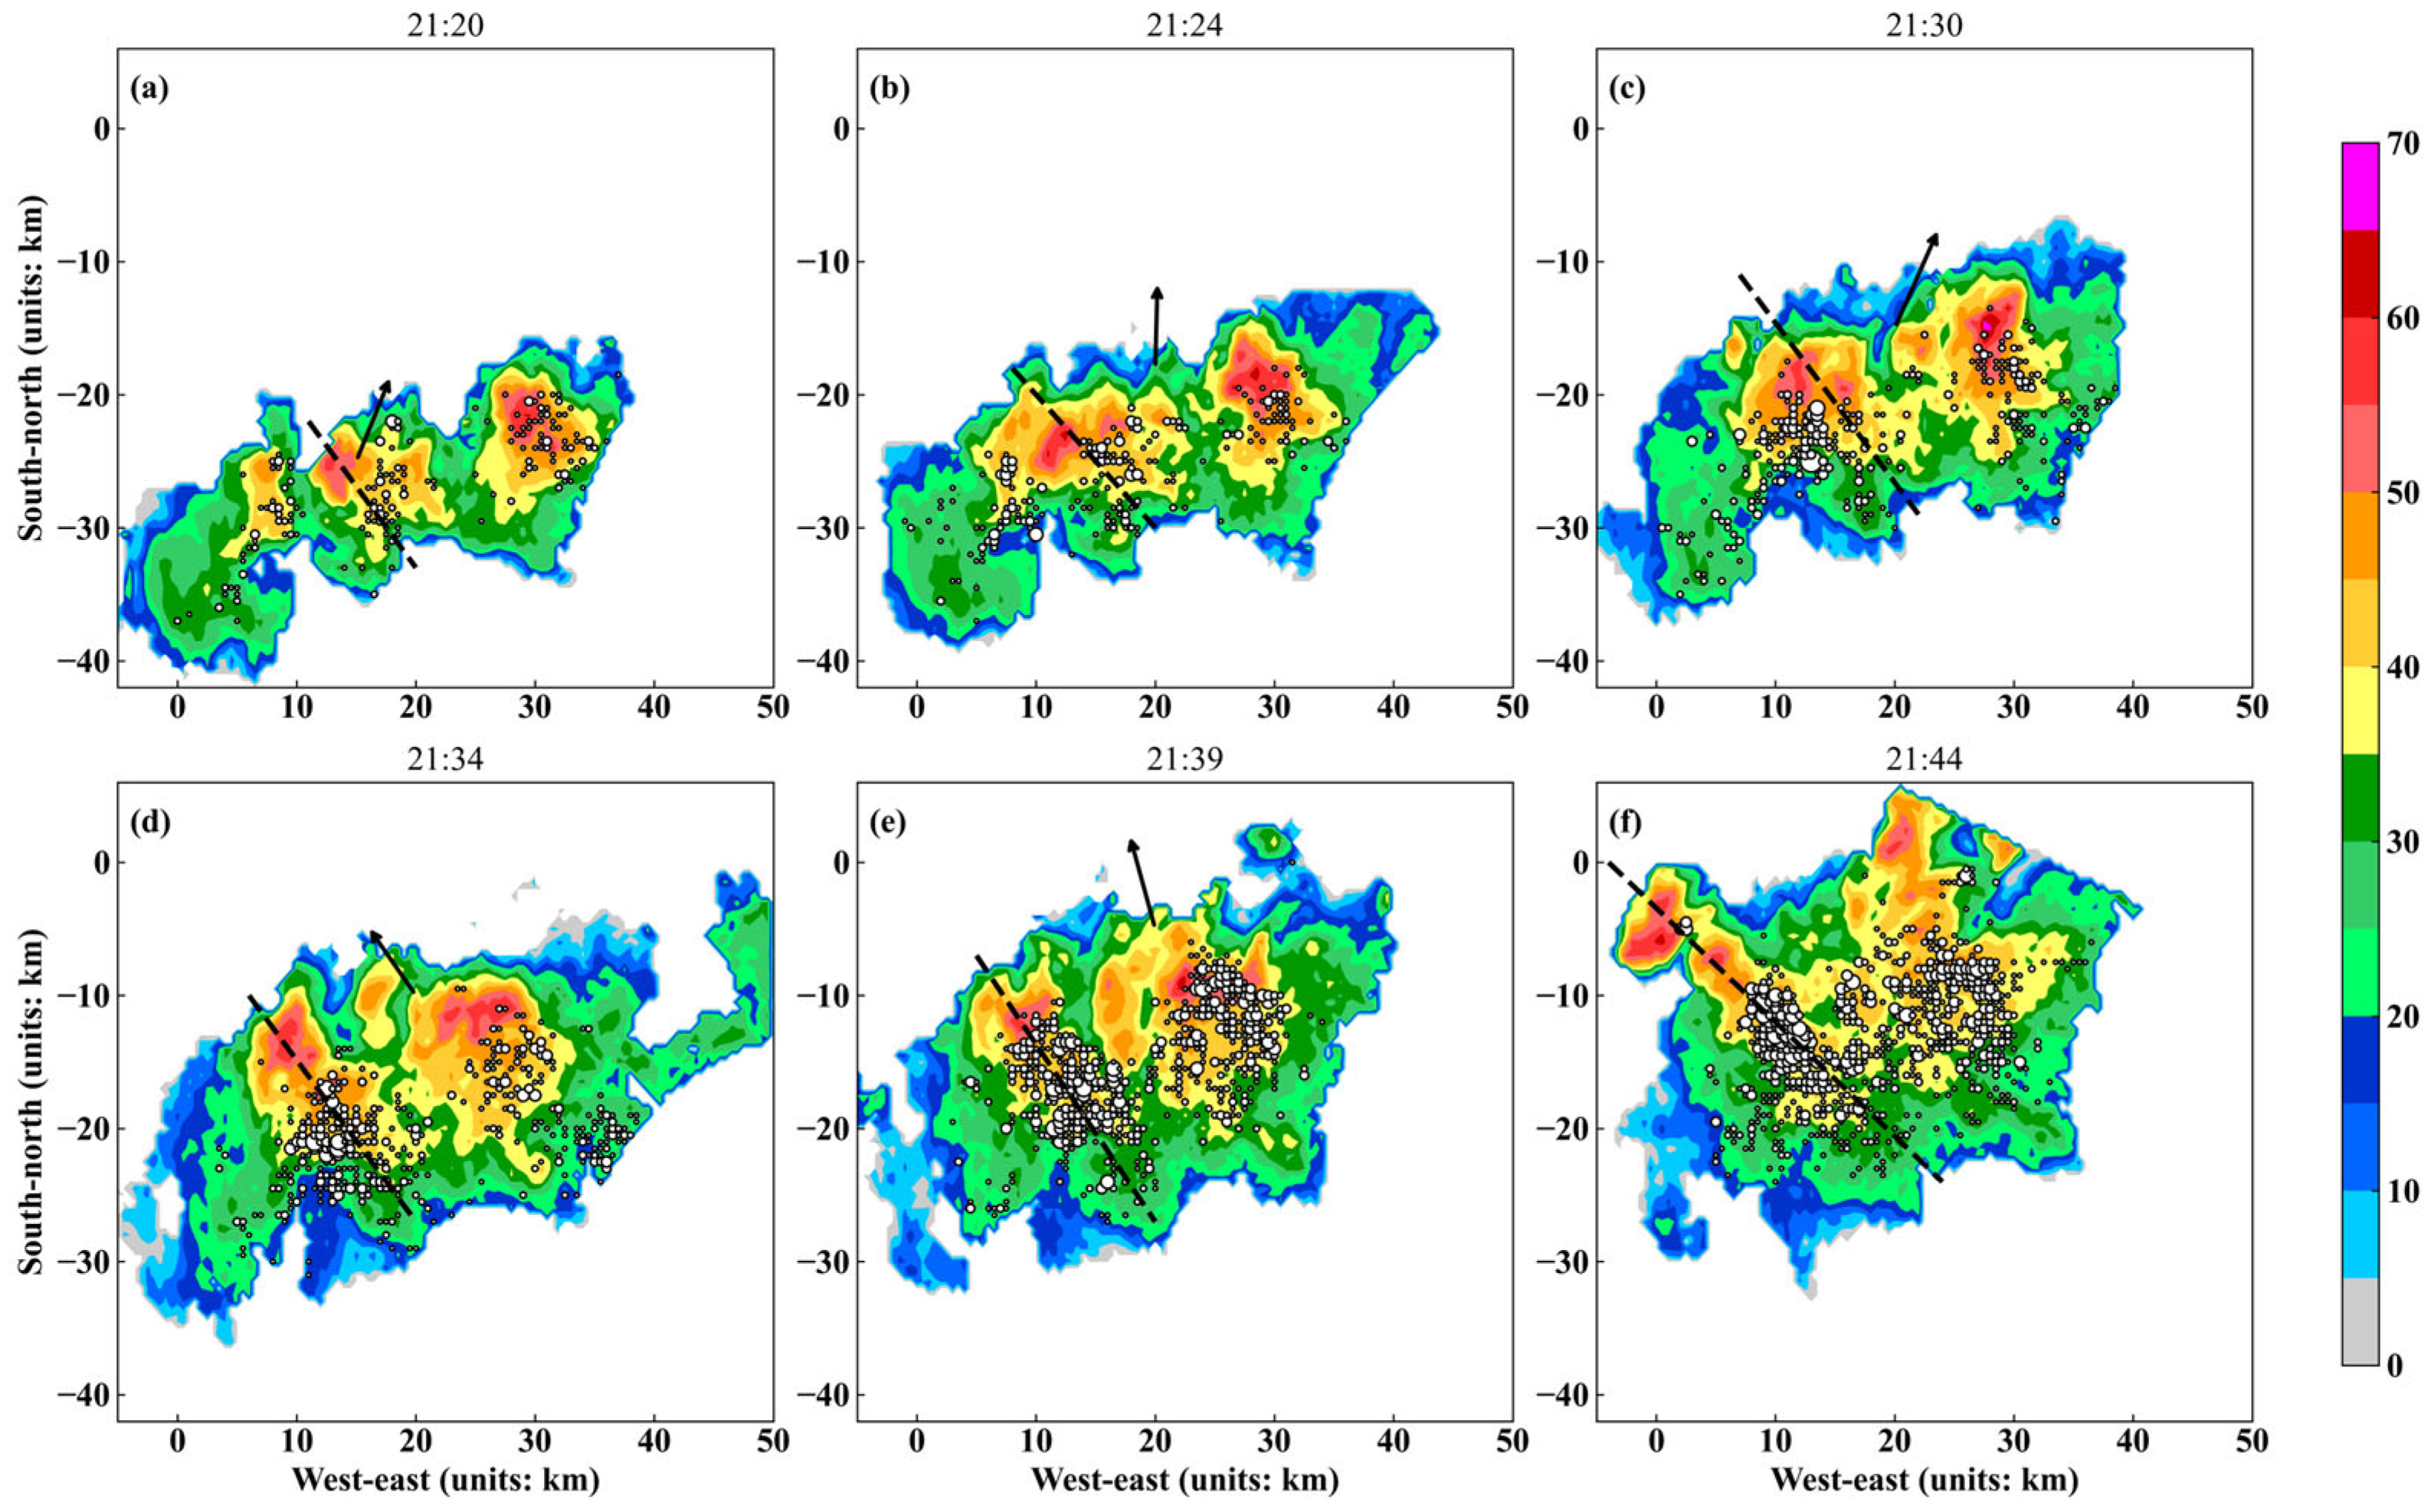
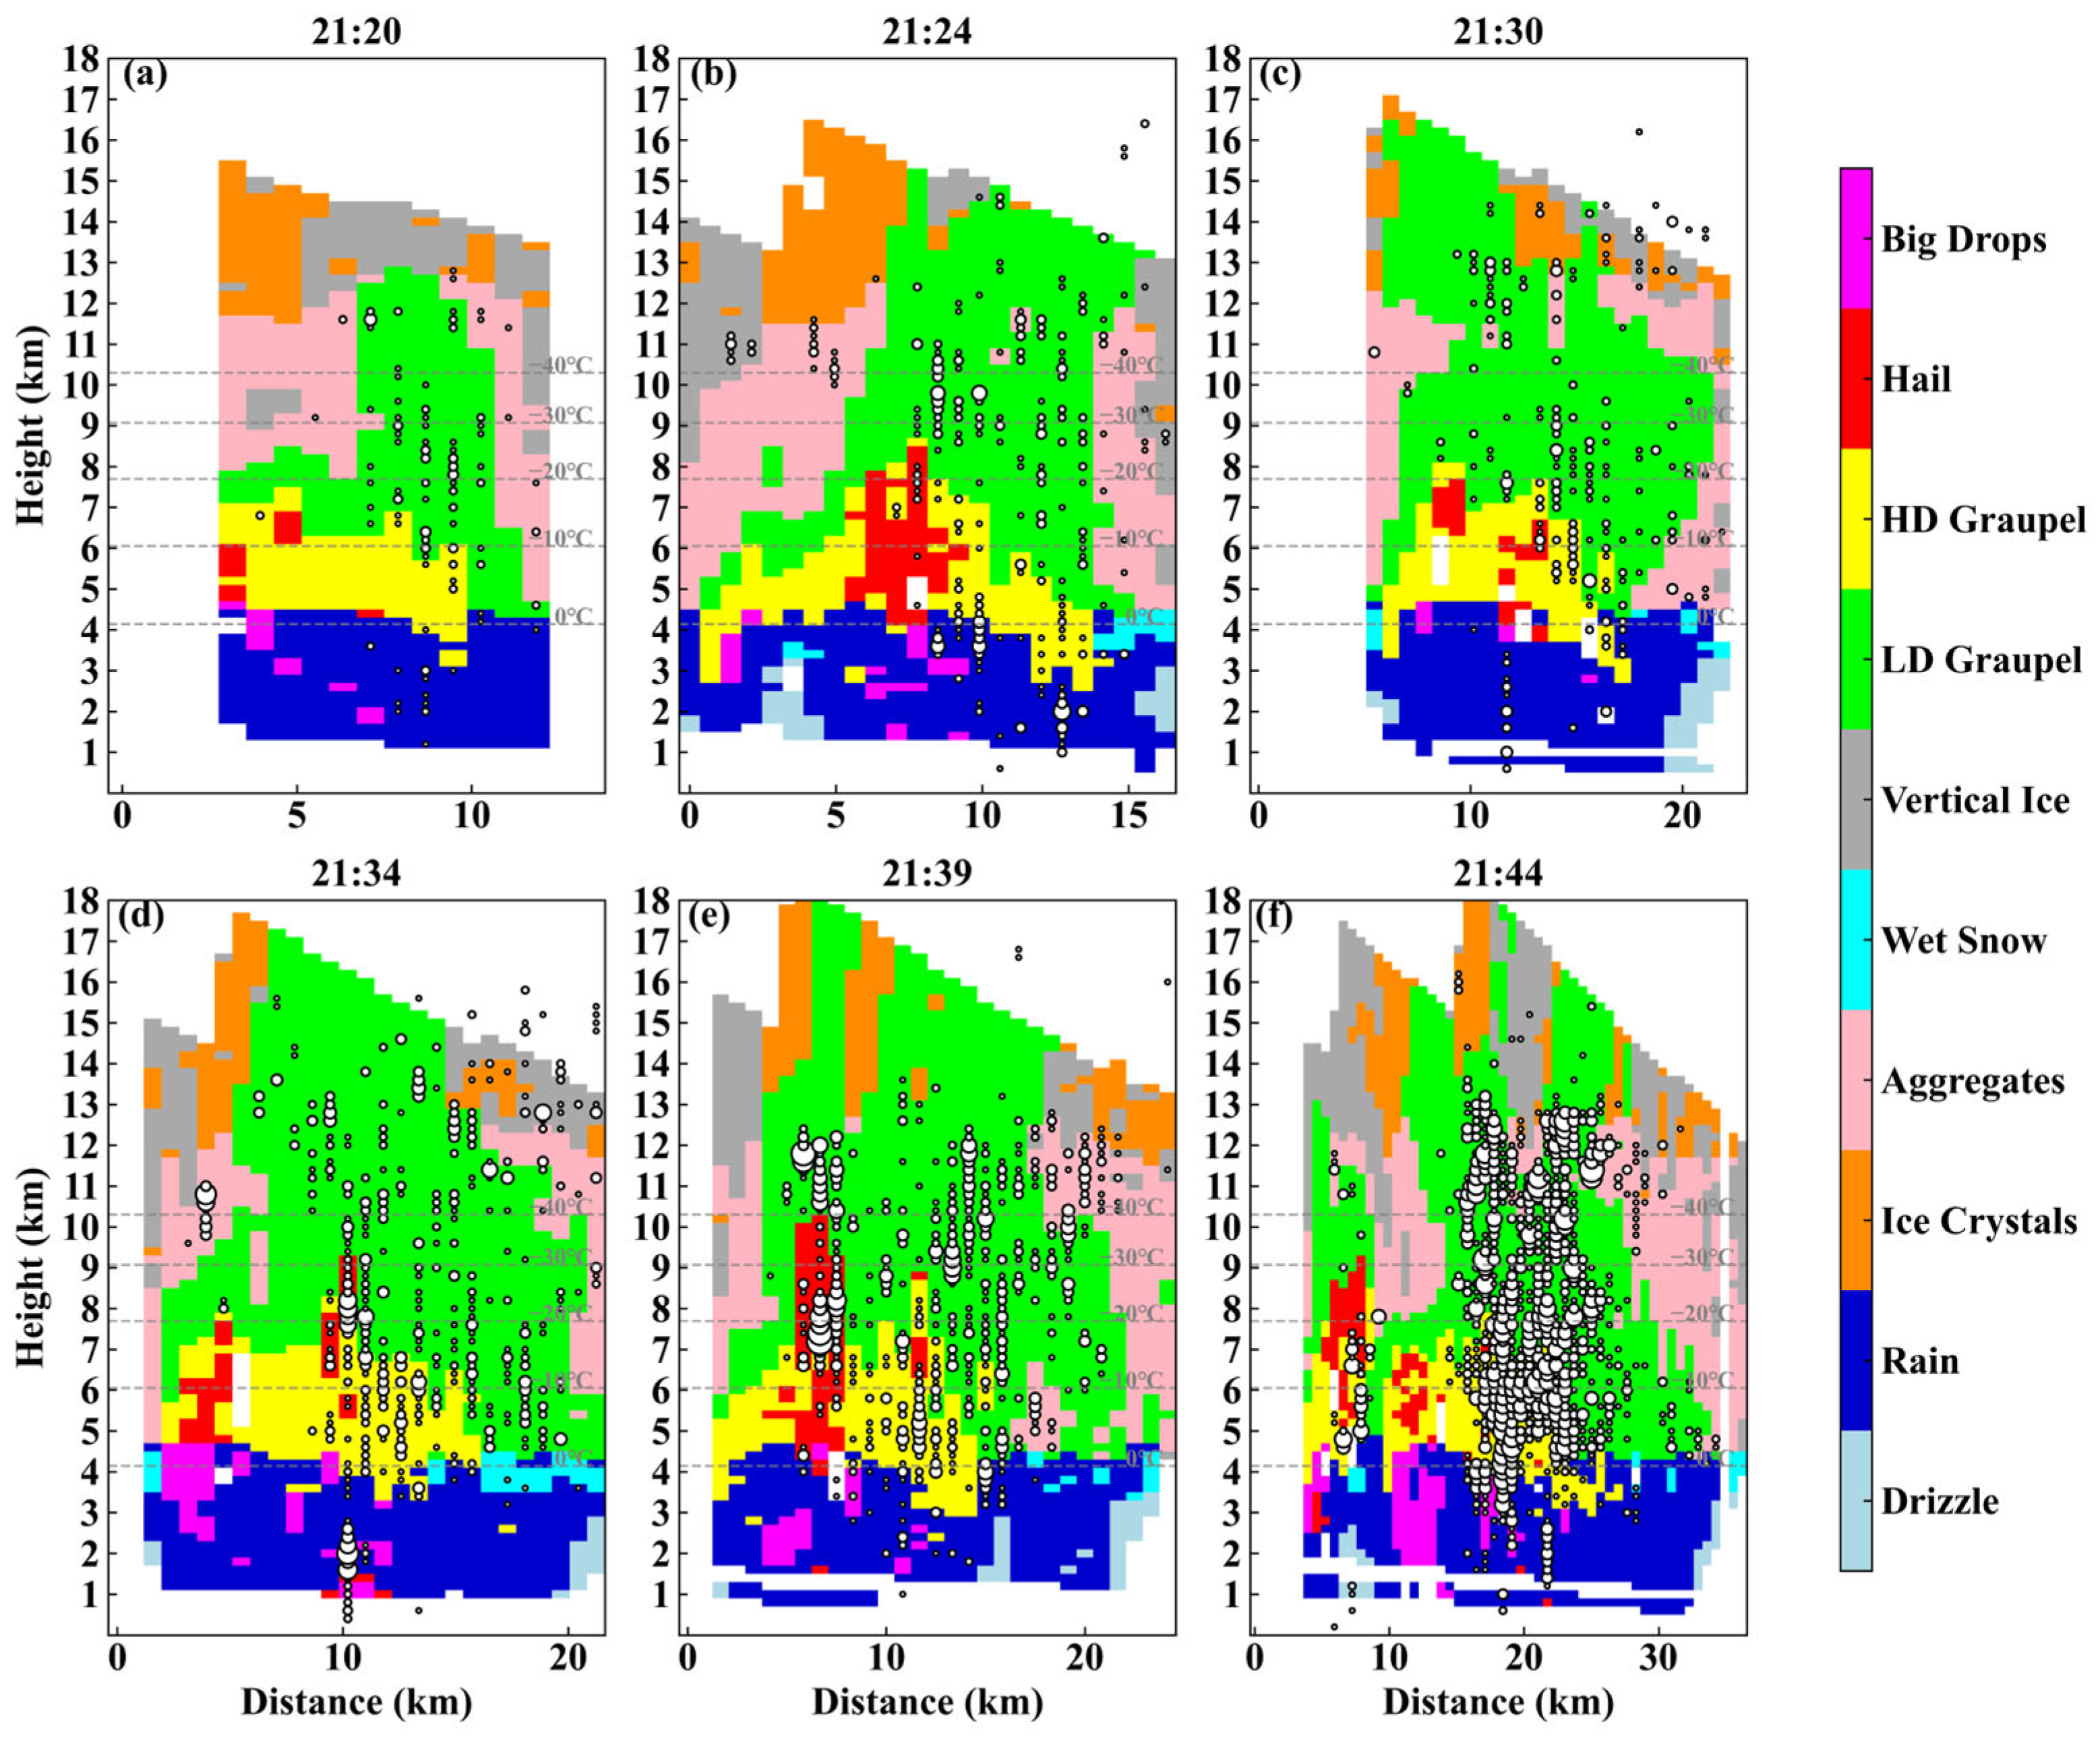
Convective core B (21:20–21:44 UTC) exhibited more vigorous development, nearly synchronized with convective core A (21:15–21:44 UTC), as shown in Figure 10. Both cores showed a continuous increase in source count and horizontal extent, accompanied by strong radar echoes. Compared to convective core A, convective core B displayed a higher echo top, stronger reflectivity, and more active lightning. Its maximum echo intensity ranged from 63 to 68 dBZ, the 40 dBZ echo top height increased from 10.8 km to 15.2 km, and the source count every 5 min increased from 10,505 to 79,810.
Figure 11 shows the cross-sections of hydrometeors and lightning sources in convective core B. Ha particles appeared in notably higher counts, reaching greater heights compared to convective core A. HDG and Ha particles developed above the −20 °C level, and even approached the −40 °C level at 21:39 UTC. The top height of LDG particles remained above 12 km during this period. The lightning sources were concentrated mainly in regions with LDG, HDG, and Ha particles, suggesting a close link between these hydrometeor types and lightning activity. These processes are driven by more intense and sustained updrafts in convective core B, which facilitate the lifting of solid hydrometeors to greater heights and promote vigorous microphysical processes, thereby enhancing lightning activity.
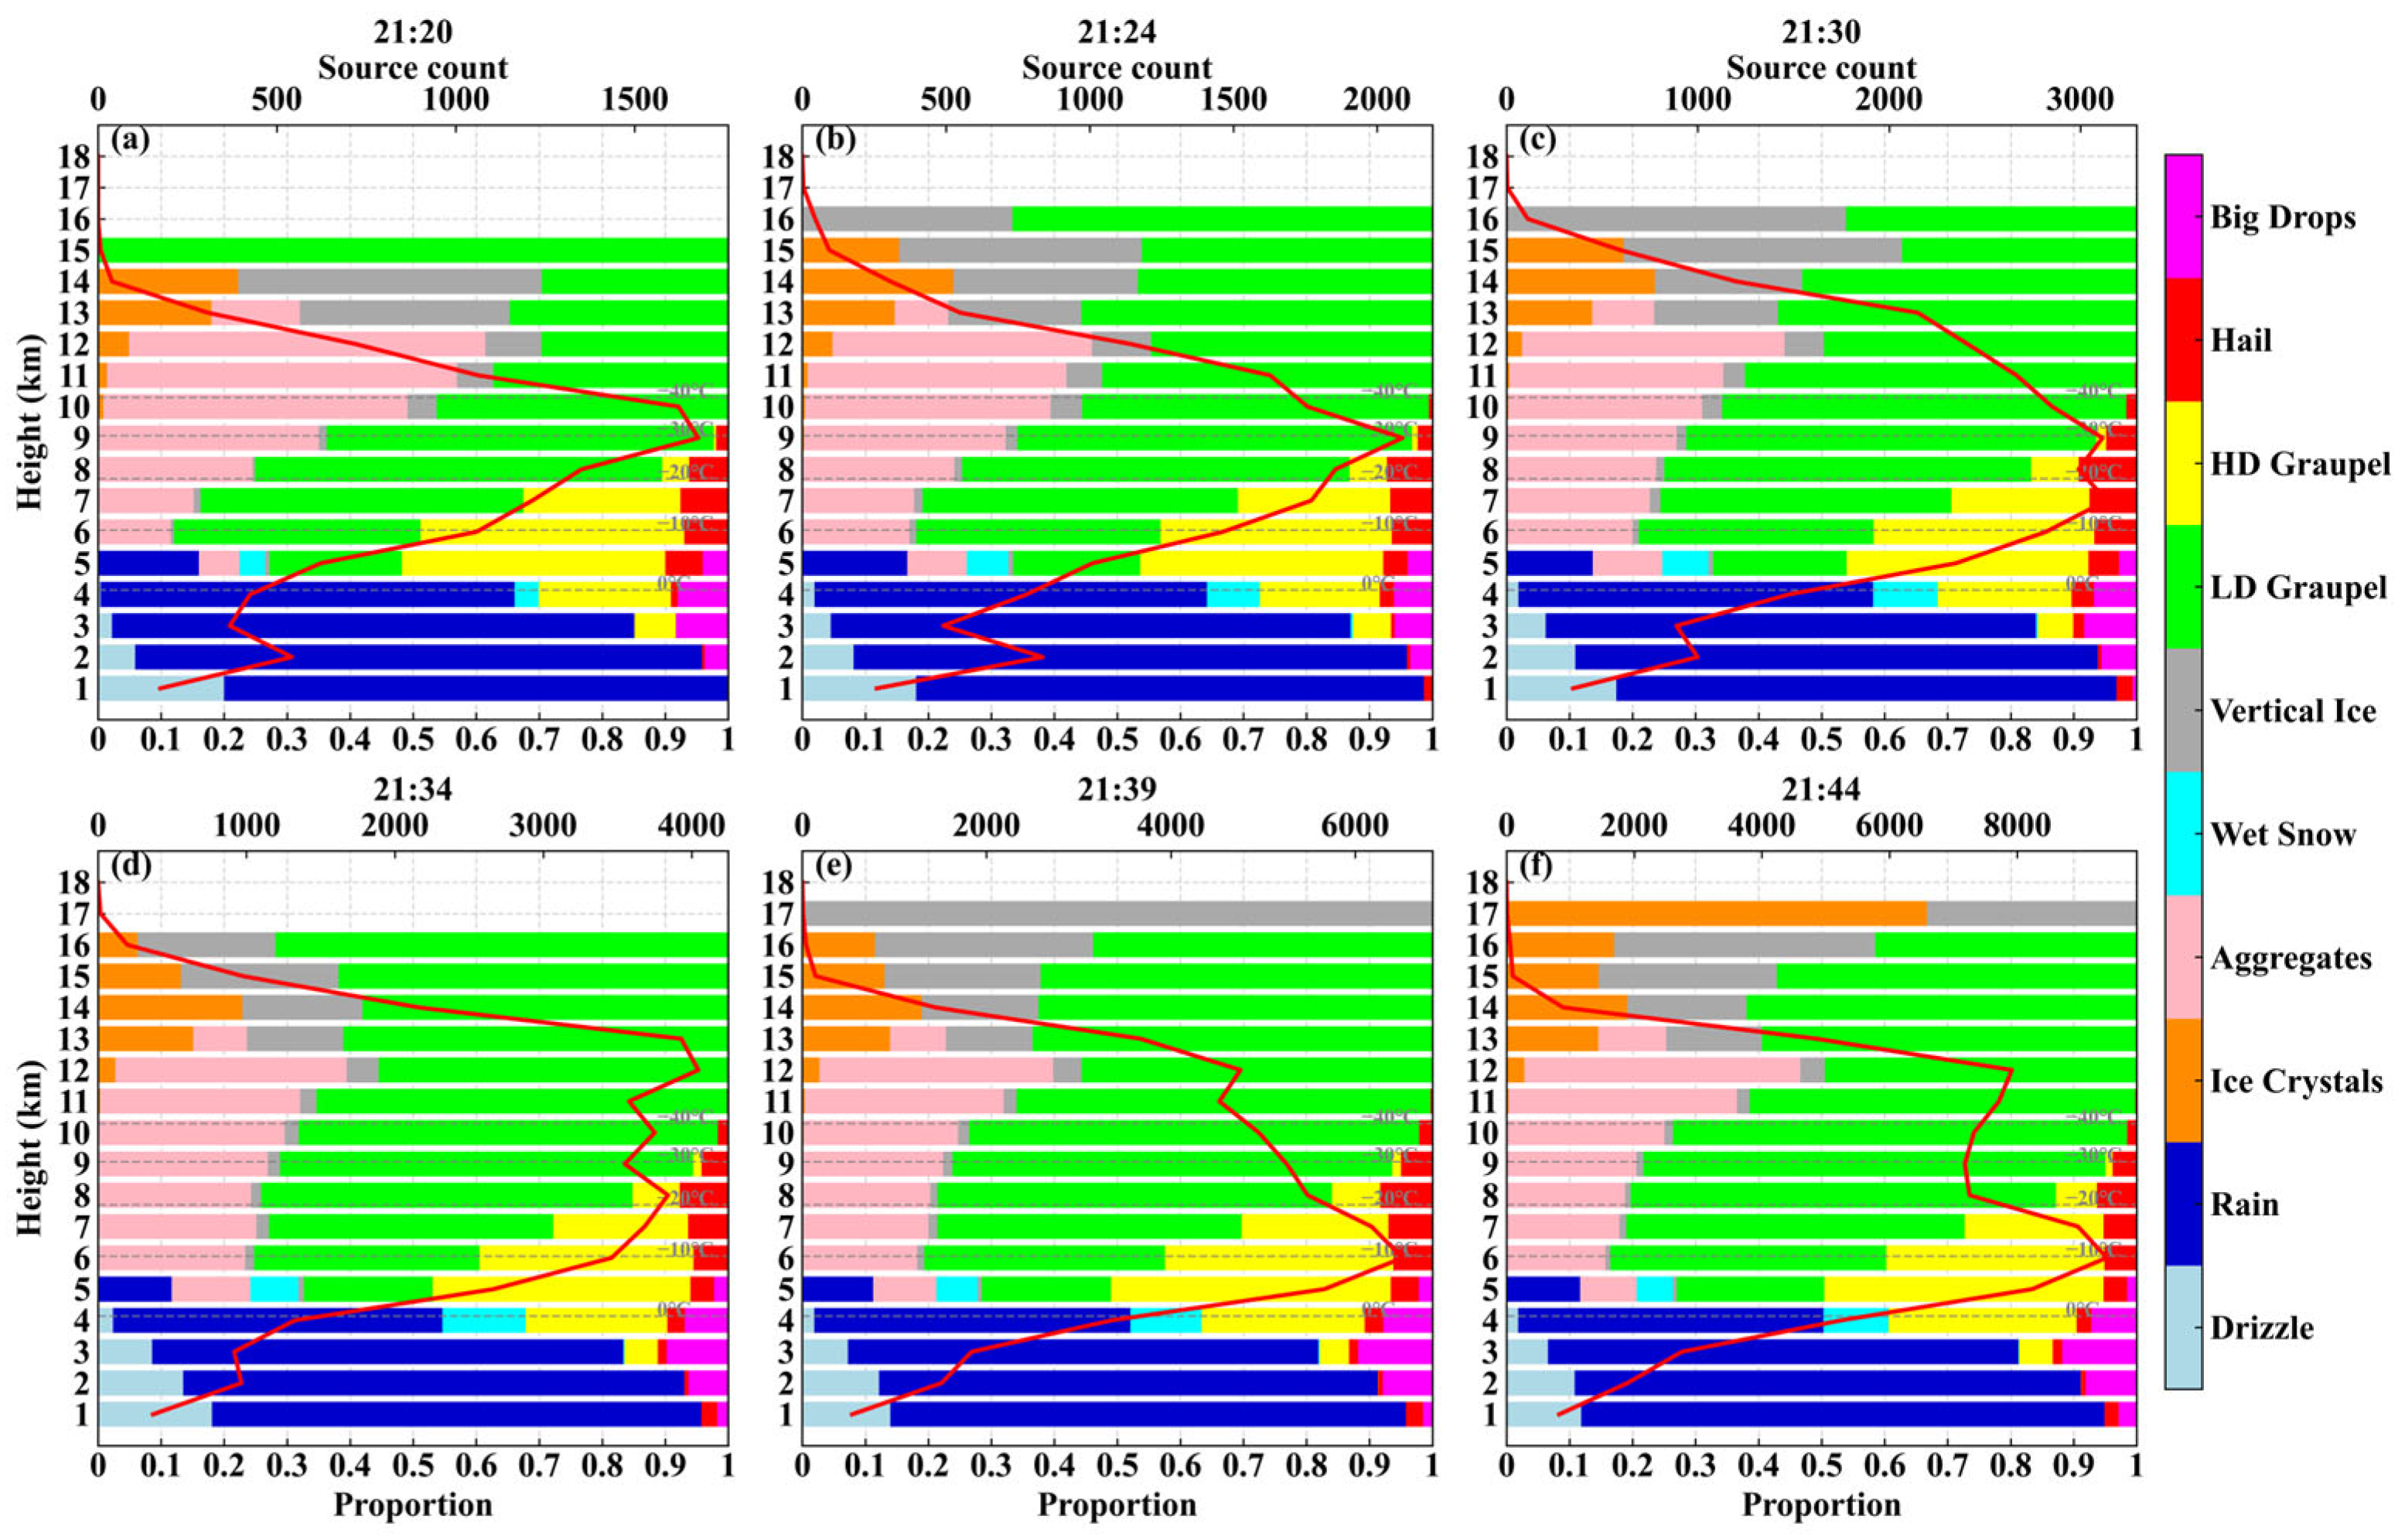
In convective core B, the proportions of LDG, HDG, and Ha at lightning source locations were significantly higher than those in convective core A, whereas the proportions of AG, IC, and VI decreased, as Figure 12 shows. Lightning sources were primarily distributed in the LDG, AG, HDG, and RN regions, with respective proportions of 48%, 18%, 14%, and 11%. The vertical distribution of lightning sources also exhibited noticeable changes during this period.
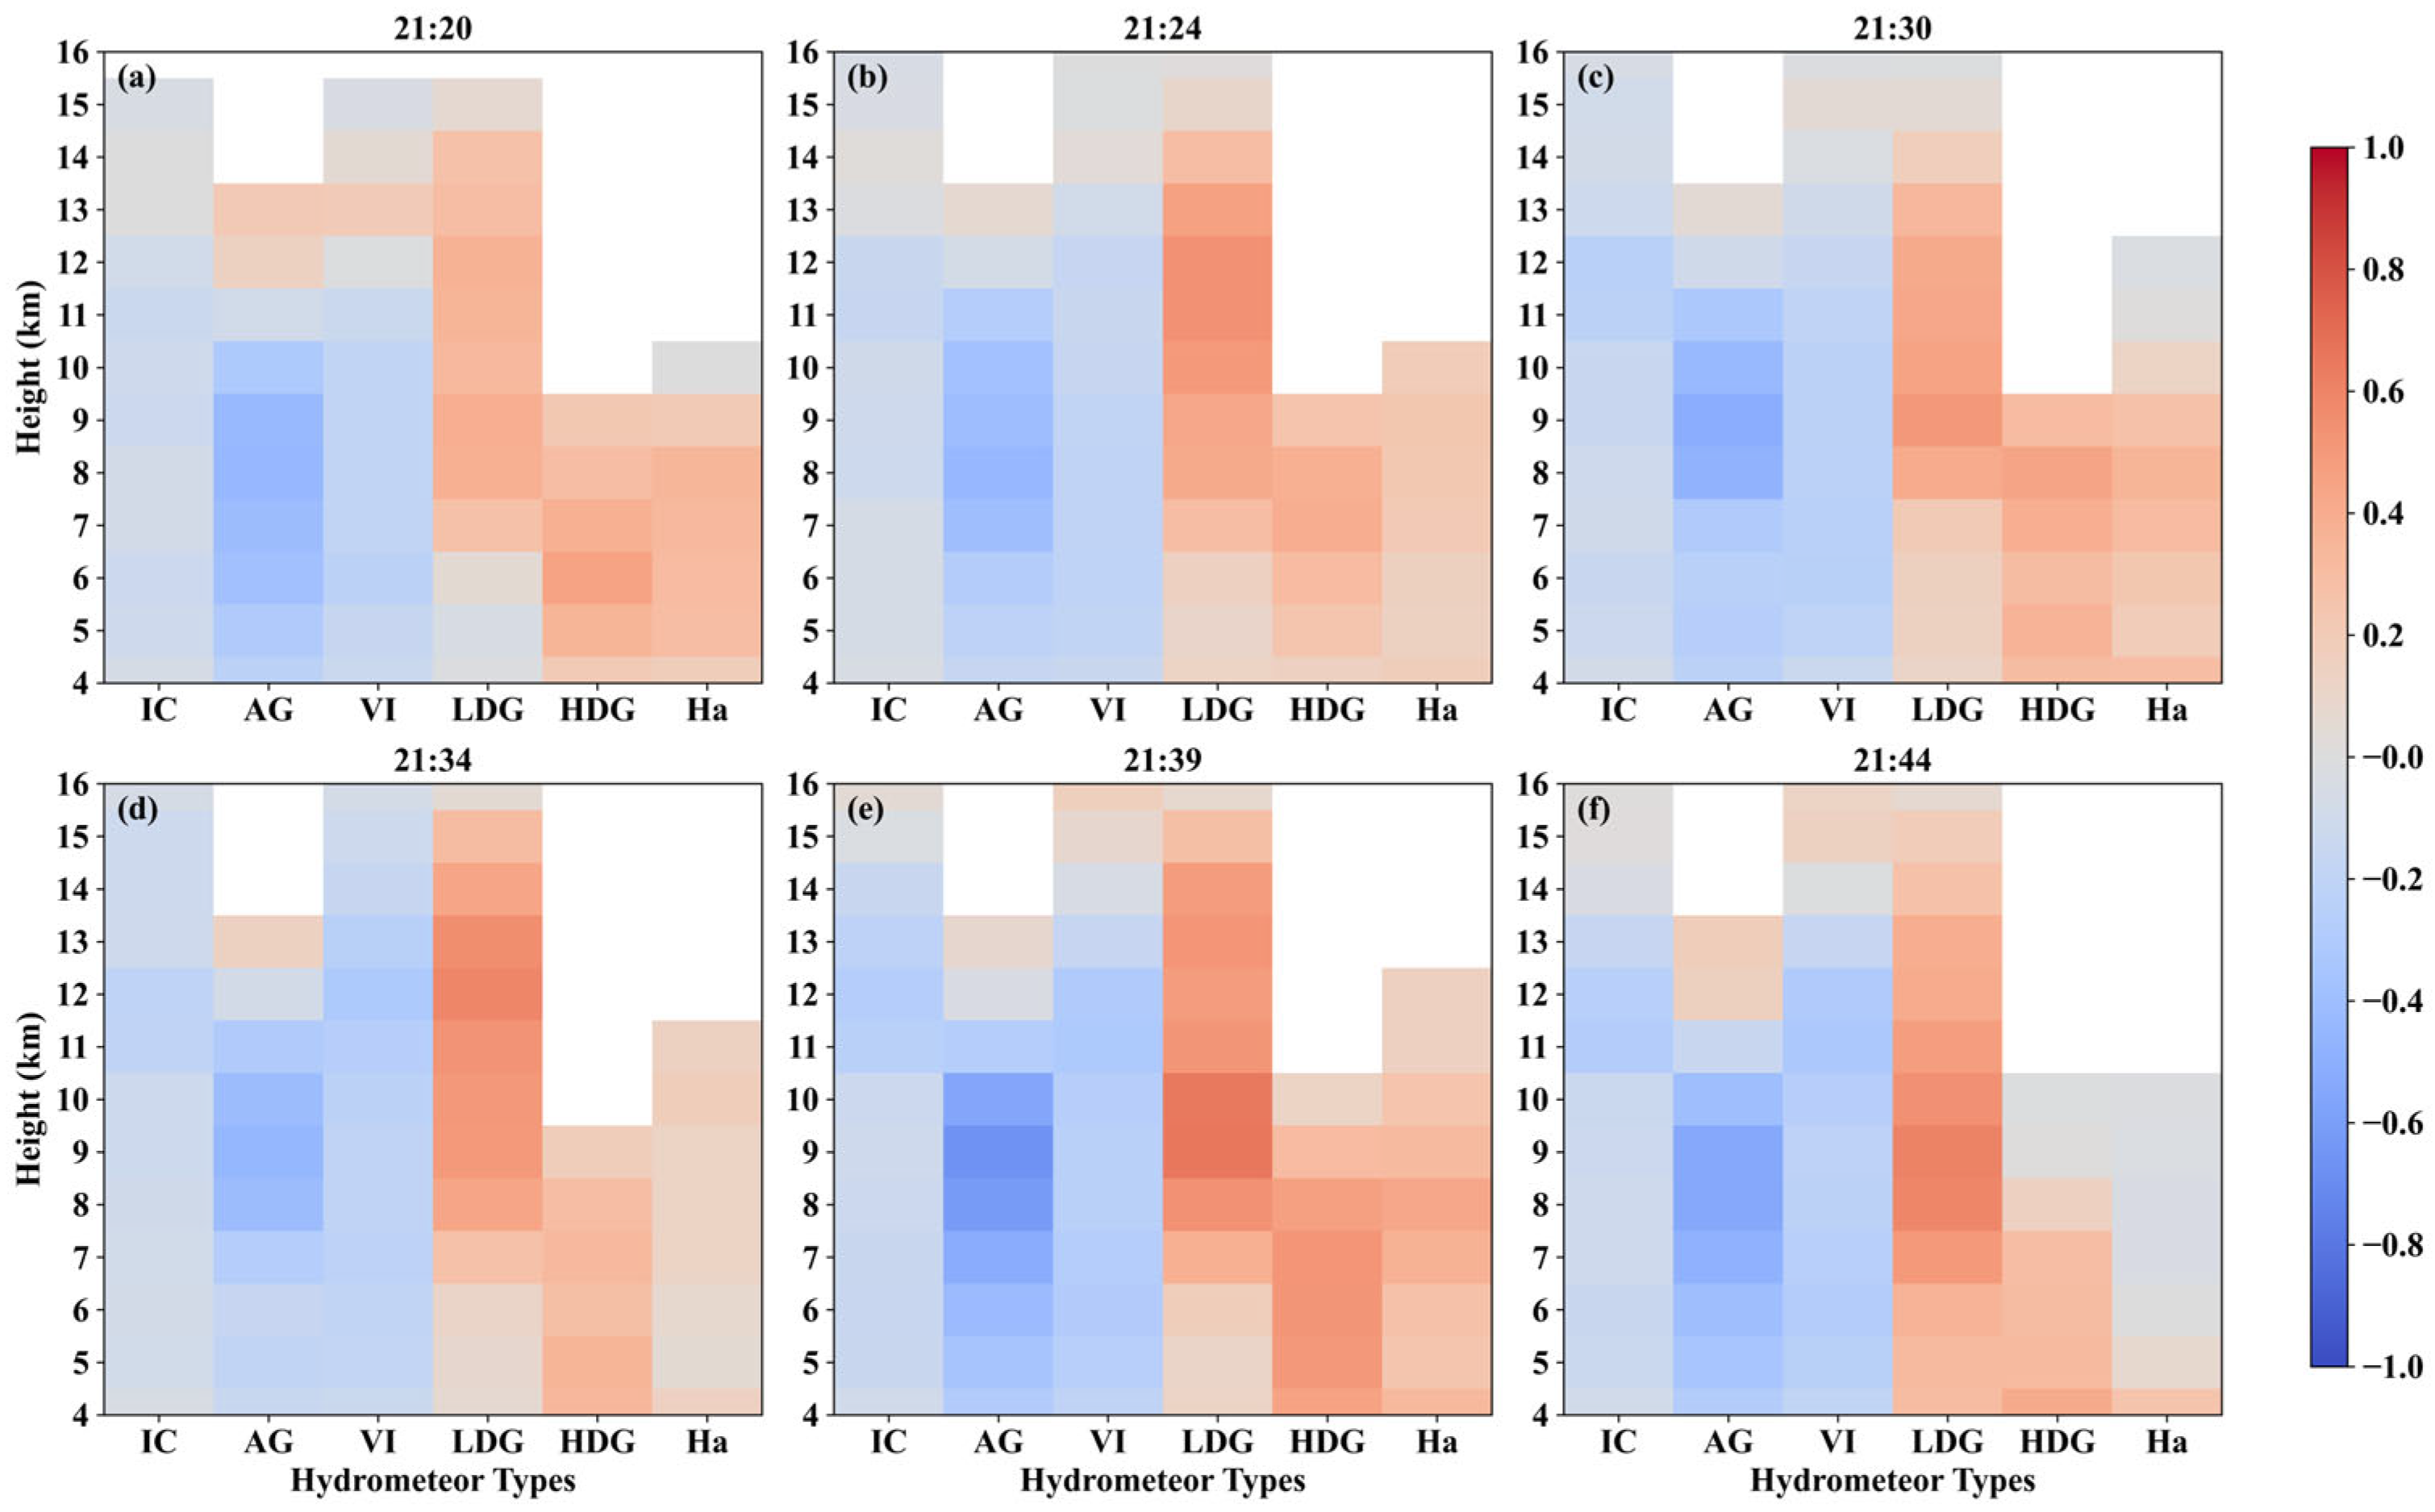
Figure 13 illustrates a stronger positive correlation between lightning sources and ice-phase particles in convective core B. LDG, HDG, and Ha all showed a positive correlation with lightning sources, and the highest correlation coefficients were observed at height ranges of 9–12 km, 5–8 km, and 7–9 km, respectively. LDG exhibited the strongest positive correlation, with a peak correlation coefficient of 0.65 at 9 km, followed by HDG and Ha, which reached 0.52 at 7 km and 0.42 at 8 km, all occurring at 21:39 UTC. Stronger convective development enhances the role of LDG, HDG, and Ha in charge separation and lightning activity, resulting in a more pronounced positive correlation. Additionally, compared to convective core A, where the highest correlation coefficient between LDG and LF lightning sources occurred at heights of 5–11 km, this range shifted upward to 9–12 km in convective core B.

3.2.3. Convective Core C

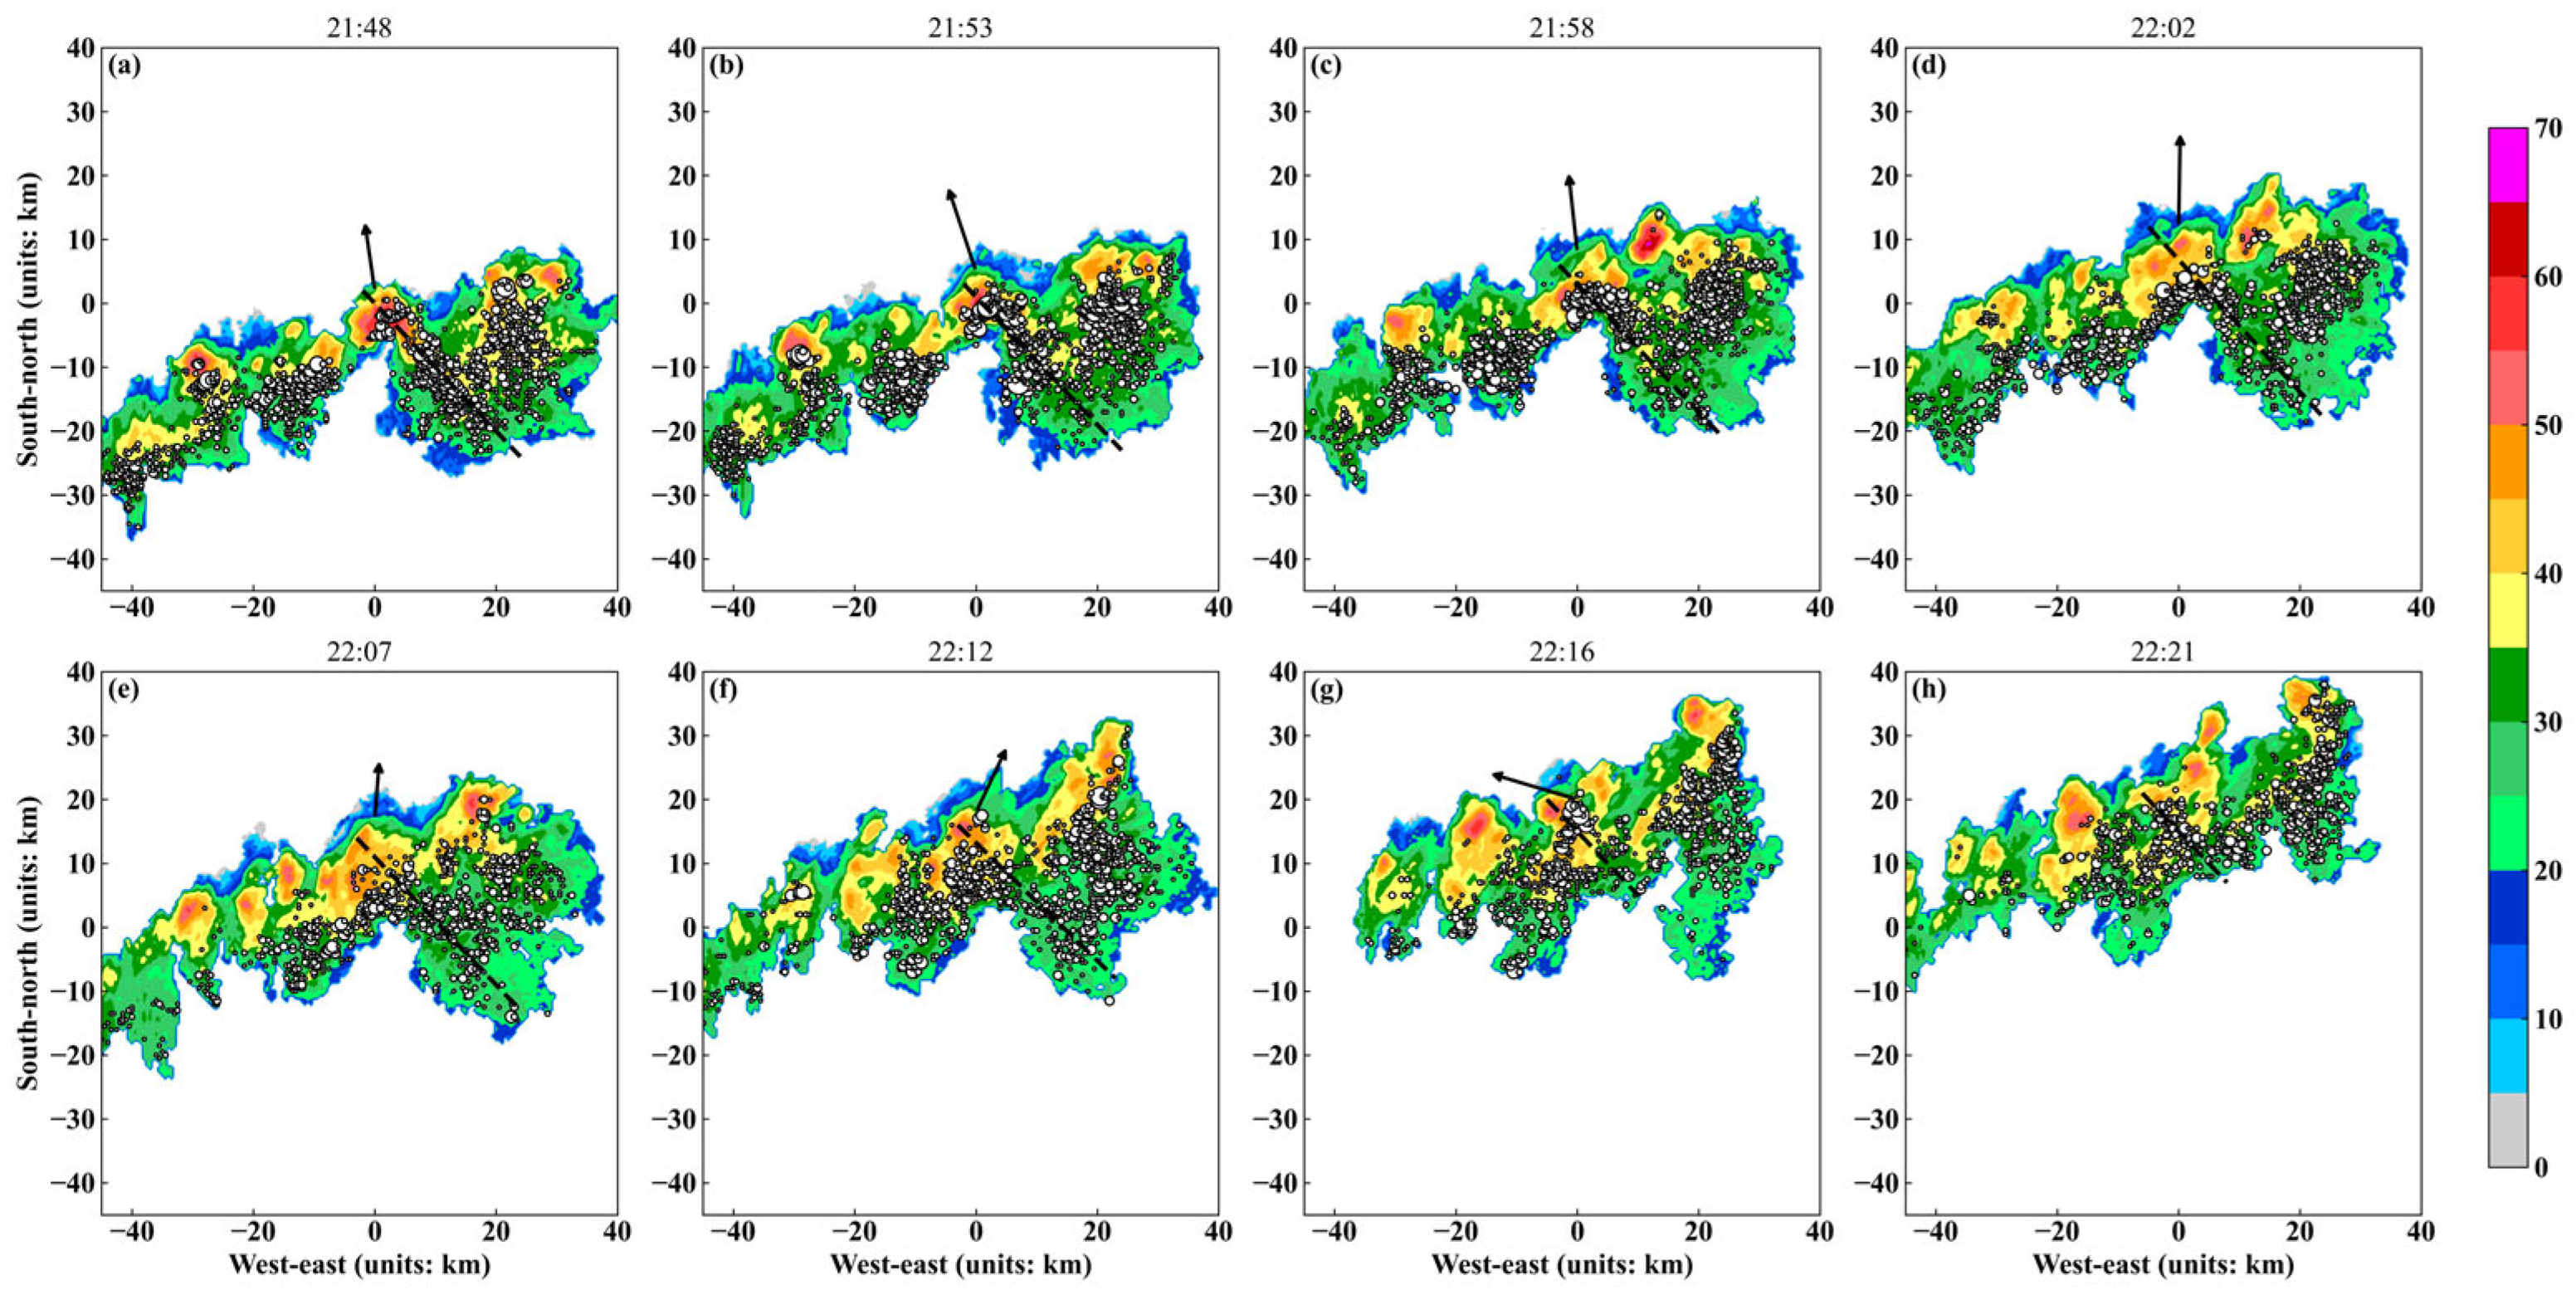
At 21:48 UTC, convective cores A and B merged into convective core C, as Figure 14 shows. During its evolution, the source count every 5 min decreased from 127,849 to 43,152. The 40 dBZ echo top height increased from 12.2 to 15.6 km by 21:58 UTC, then decreased to 9.4 km. The horizontal scale of convective core C began to decrease after 22:02 UTC. The maximum echo intensity ranged from 63 to 70 dBZ. The convective core C underwent a transition from the mature stage to the dissipation stage. After 22:02 UTC, the 40 dBZ echo top height, source count, and horizontal scale all showed a decreasing trend, reflecting a significant weakening of updrafts and convective activity as the storm entered the dissipation stage.
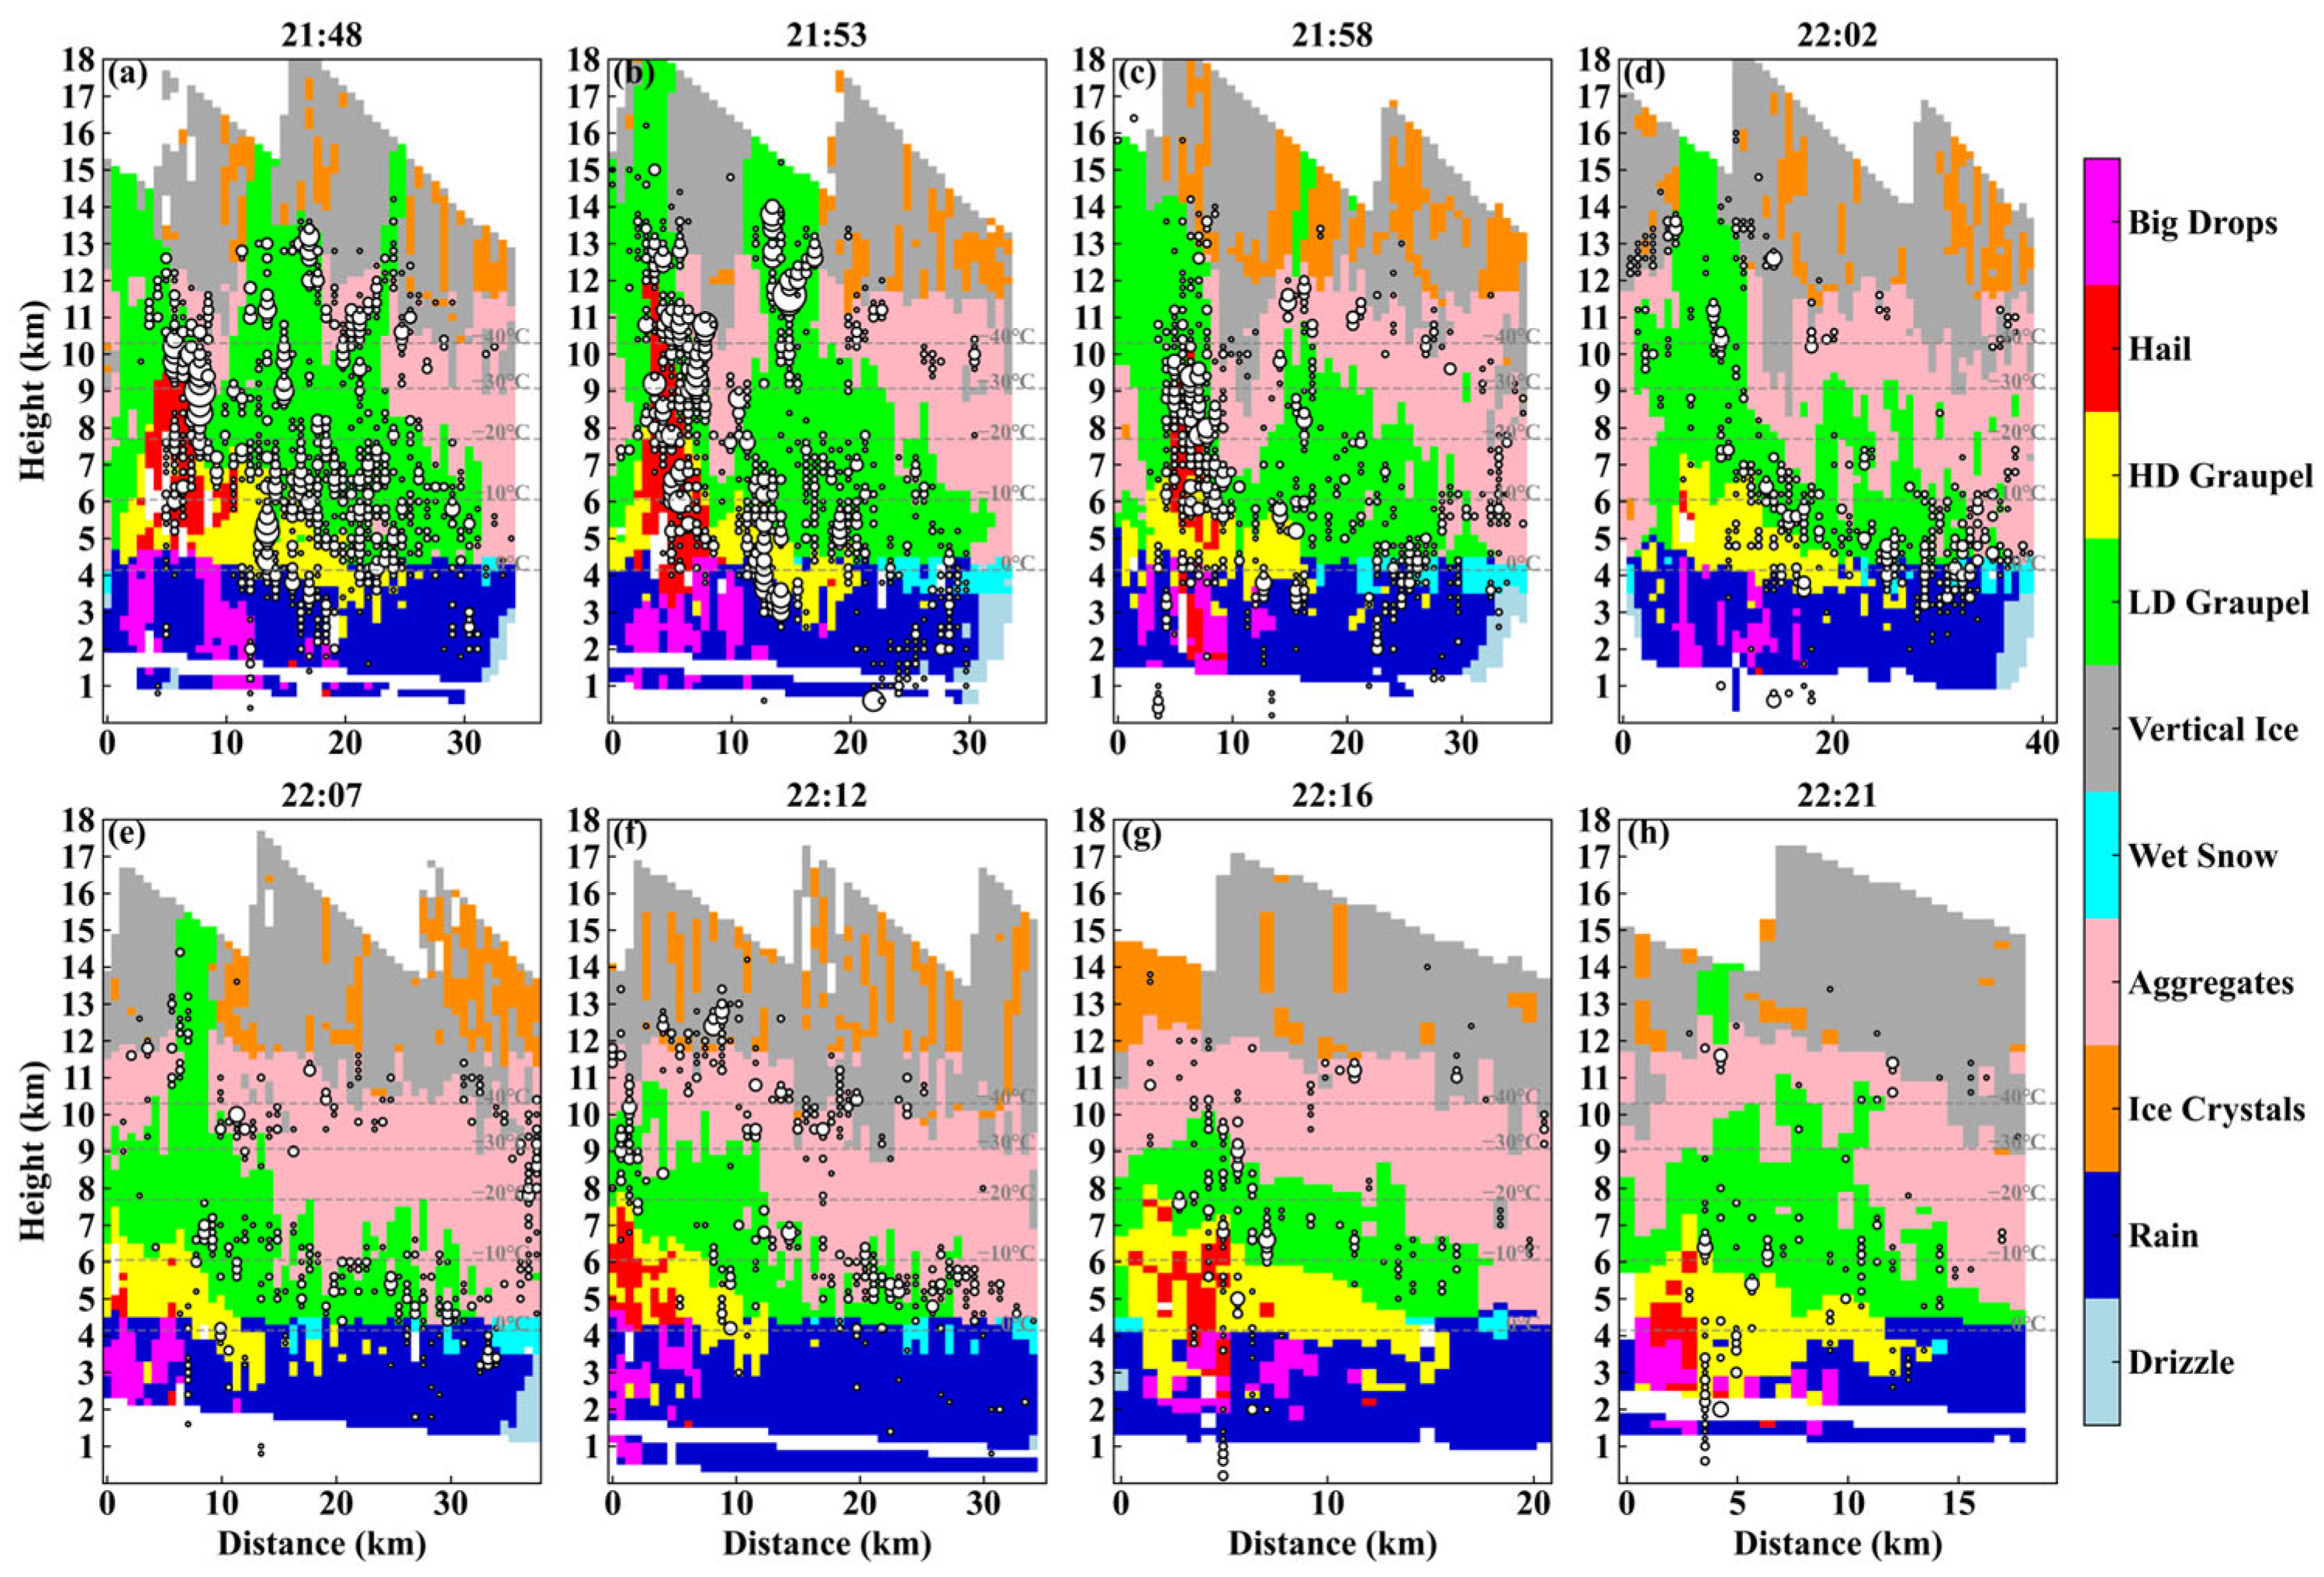
As shown in Figure 15, the top heights of LDG and Ha particles in convective core C initially developed above −40 °C but gradually decreased after 22:02 UTC, and the upper levels were gradually dominated by AG, VI, and IC particles. The distribution of lightning sources exhibited vertical stratification, with most sources concentrated in the LDG, HDG, and Ha regions, while others appeared near the upper boundary of AG-dominated regions.
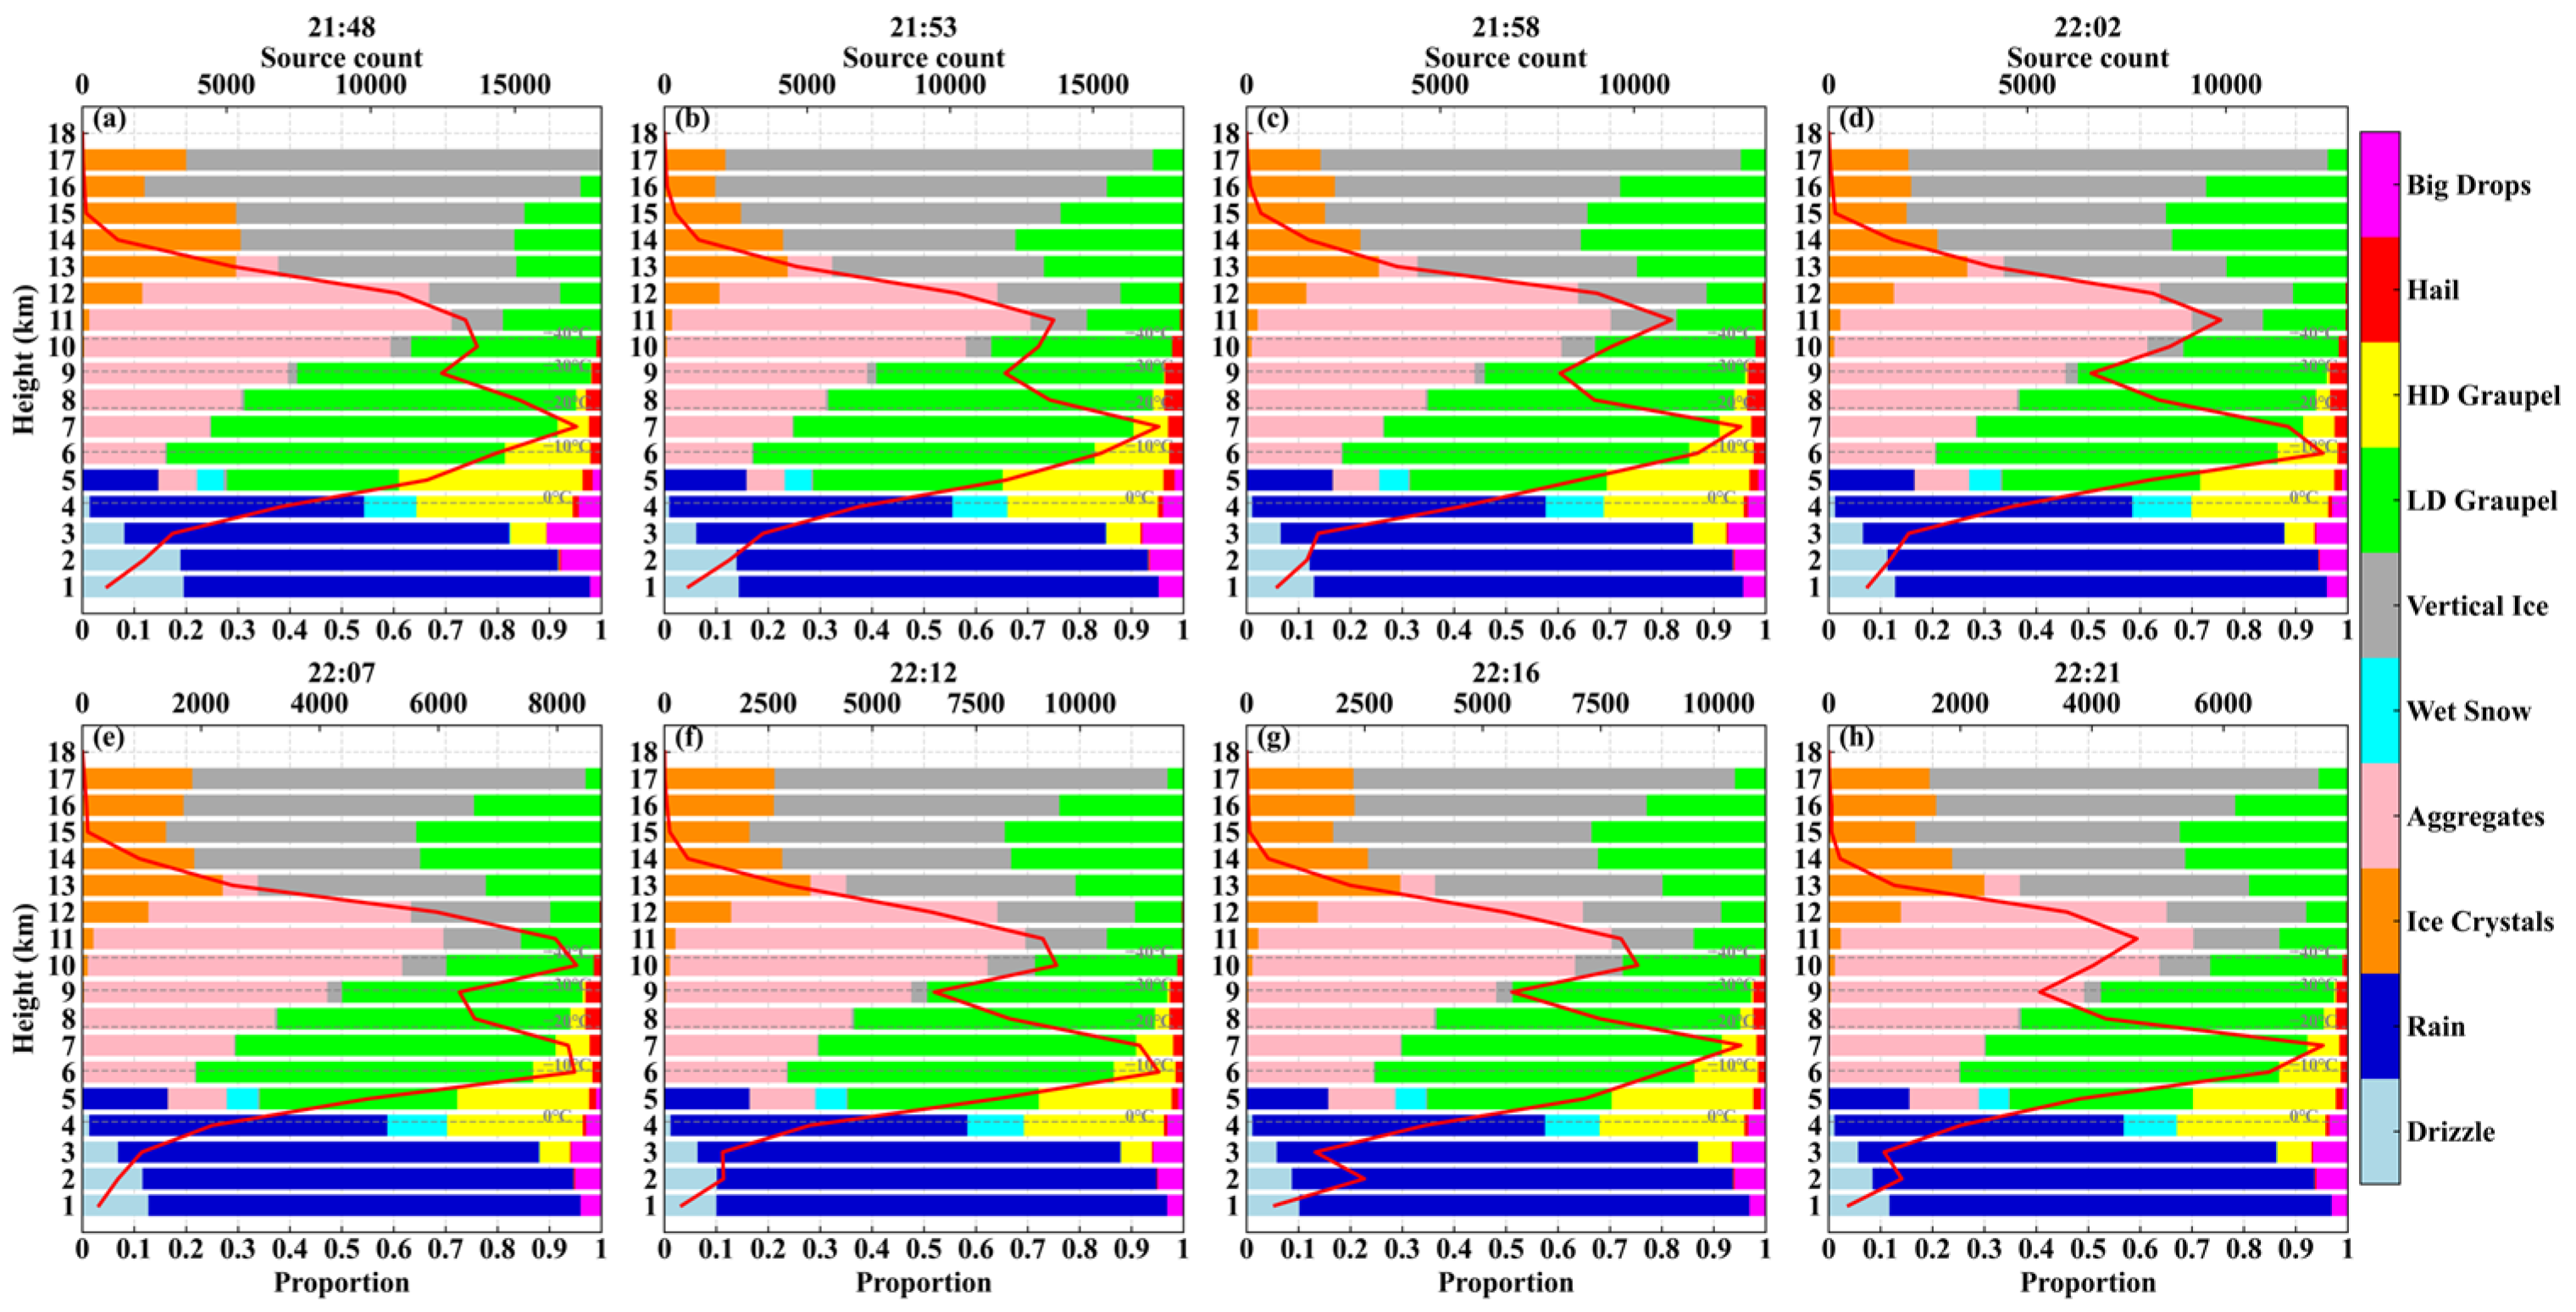
The red curve in Figure 16 shows that the lightning sources maintained a clear bimodal distribution in the vertical, with peaks observed at 6–7 km and 10–11 km. During this period, the proportion of LDG at lightning locations gradually decreased, while that of AG steadily increased. Overall, the proportions of LDG and AG regions were comparable, accounting for 36% and 35%, respectively, followed by IC (8%), RN (8%), and HDG (7%).
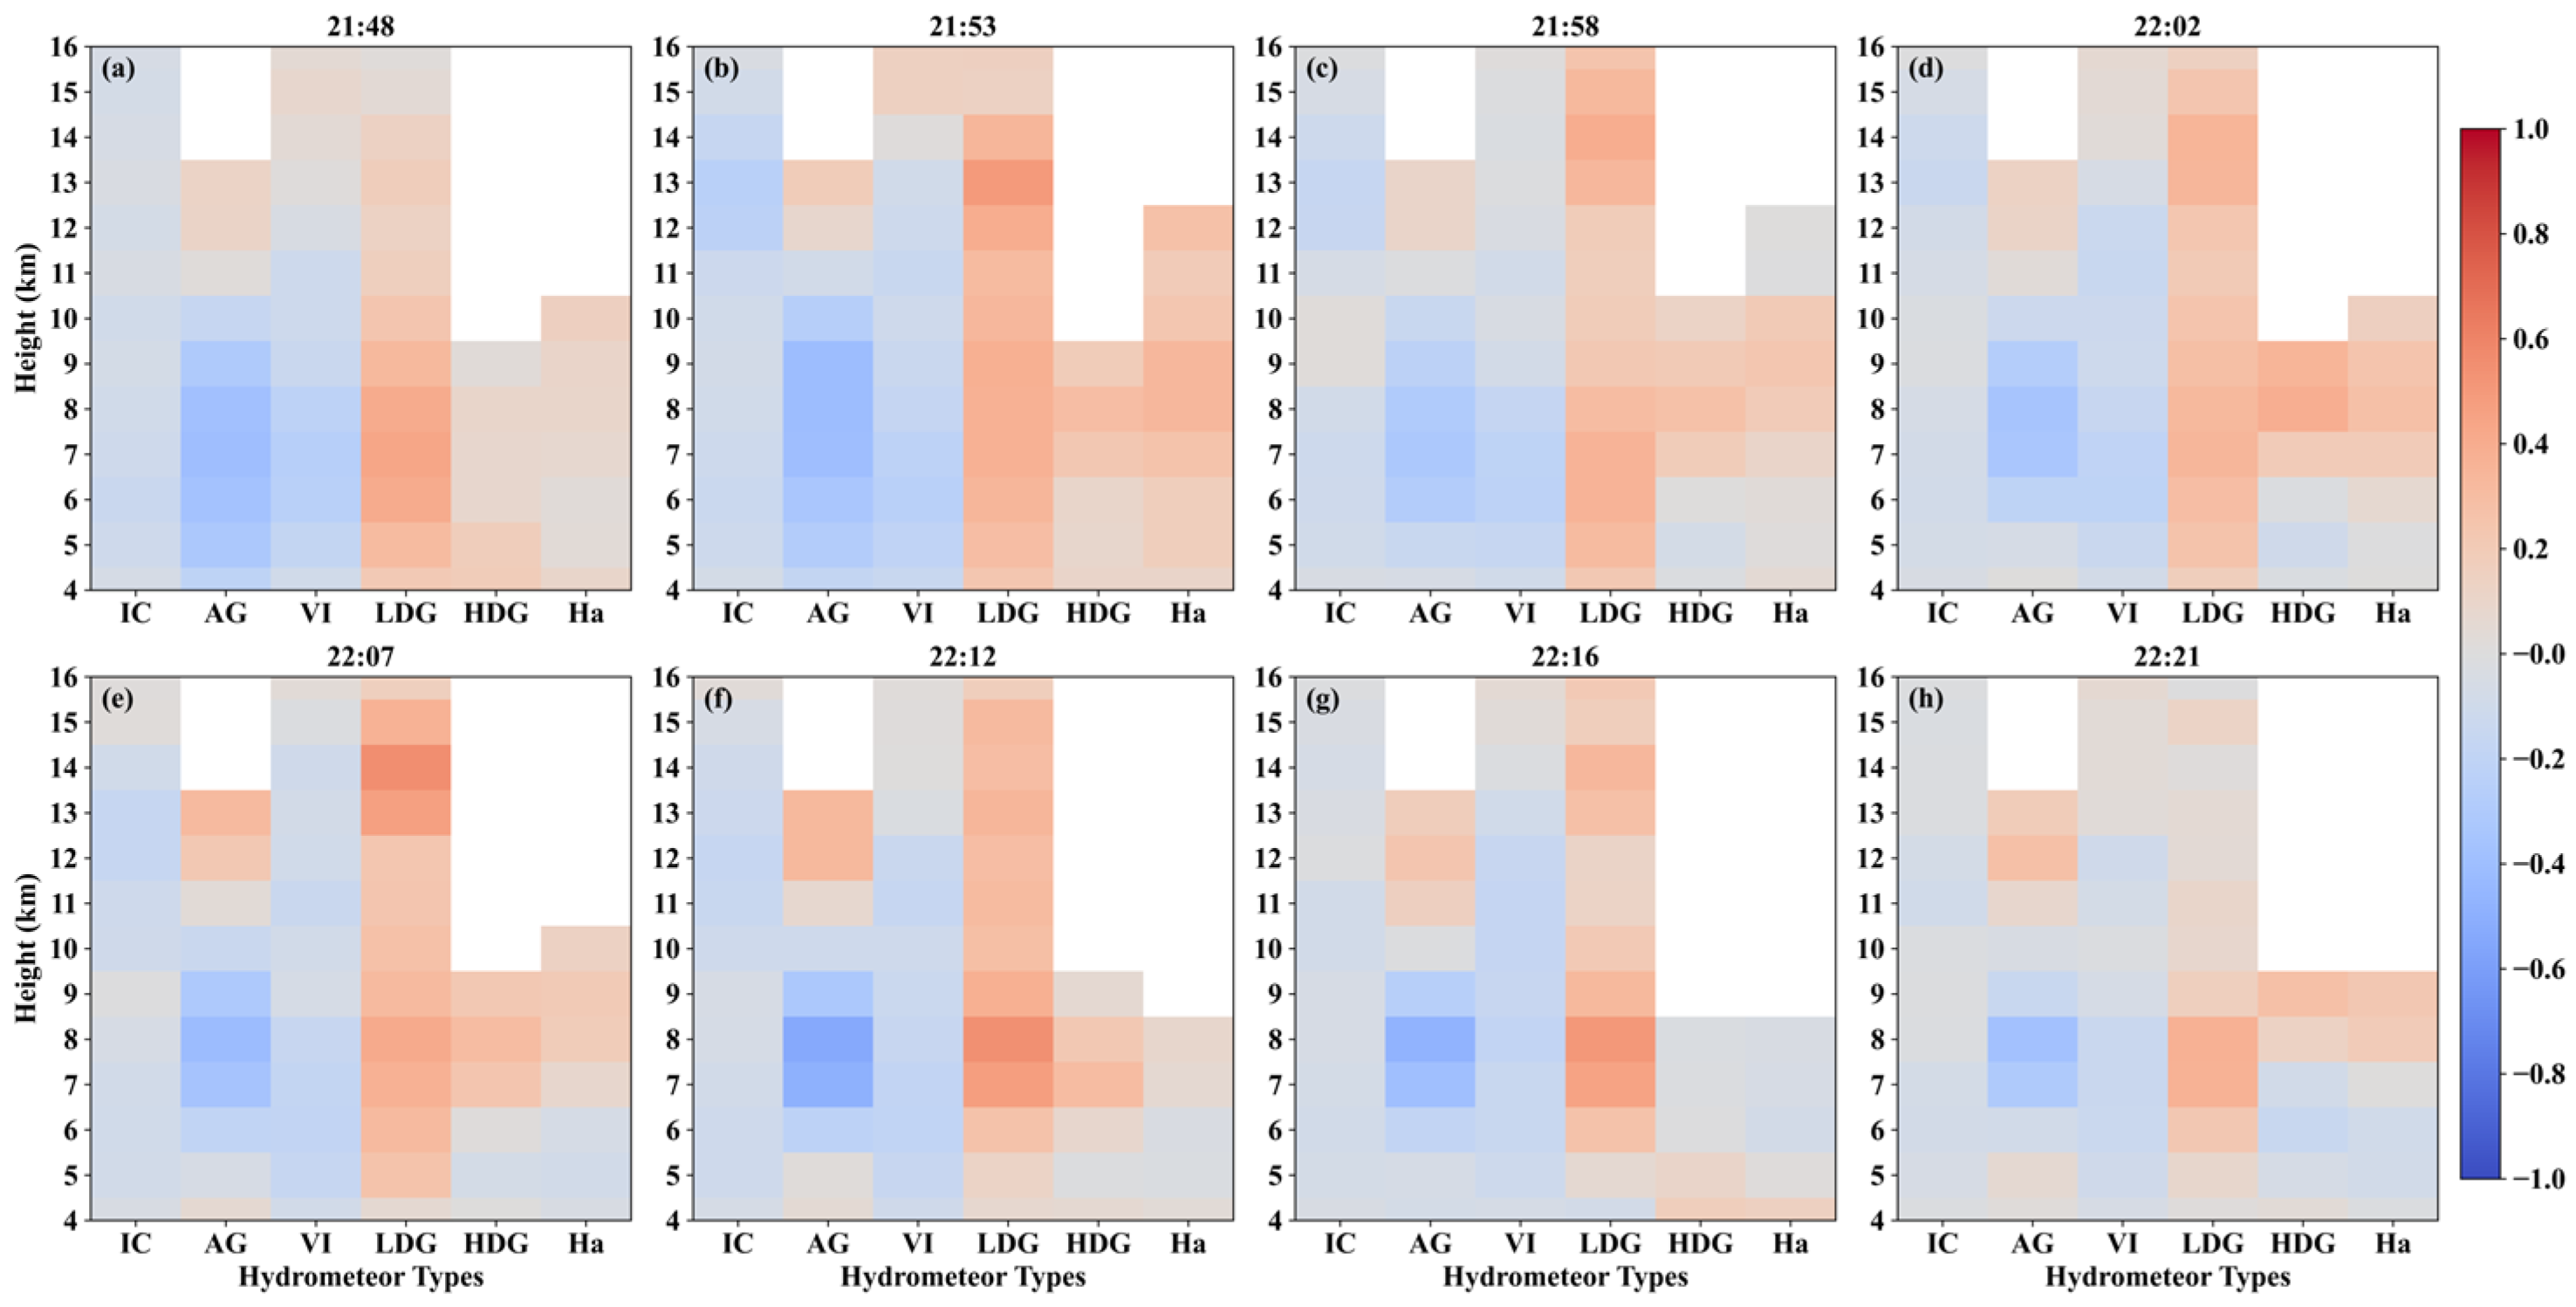
LDG remained the hydrometeor type most correlated with LF lightning sources. The correlation between LDG and lightning sources exhibited a bimodal distribution with peak heights at 7–8 km and 13–14 km, as shown in Figure 17. The highest correlation coefficient occurred at 14 km at 22:07 UTC, after which the height with the highest correlation coefficient shifted downward to 8 km. Lightning sources also showed positive correlations with HDG and Ha at 7–9 km, but these positive correlations gradually weakened after 22:07 UTC. Additionally, after 22:02 UTC, the positive correlation between AG and lightning sources increased at 12–13 km. The production and persistence of HDG and Ha are reduced due to decreased riming efficiency and enhanced sedimentation, resulting from weakened updrafts. This physical evolution leads to a reduction in the positive correlation between lightning sources and both HDG and Ha. Meanwhile, it should also be noted that the HID algorithm only recognizes the dominant hydrometeor type in each grid cell. Therefore, when HDG and Ha are no longer the dominant types at lightning source locations, their statistical correlation with lightning will appear further reduced, even though they may still contribute to electrification as sub-dominant particles, potentially leading to an underestimation of the correlation for these hydrometeor types.

4. Discussion

In this study, S-band dual-polarization radar observations and high-resolution three-dimensional lightning location data from LFILMA during a thunderstorm were utilized to analyze the relationships between lightning activity and microphysical characteristics. LF lightning sources and hydrometeors were processed at the same grid resolution, enabling a detailed investigation of their spatial correlation, especially on the vertical spatial scale. The vertical distributions and correlation relationships between LF lightning sources and hydrometeor particles at each height level, as well as their variations during different stages and different convective cores of the storm, were investigated. The results are as follows.
During the development stage of Storm-0611, lightning sources were predominantly observed above 6 km (about the −10 °C isotherm), with peak heights exhibiting considerable variability. As the storm progressed into the mature and dissipating stages, the vertical distribution of lightning sources stabilized into a dual-peak pattern, with peaks observed at 6–7 km (−10 °C to −15 °C) and 10–11 km (approximately −40 °C). This bimodal structure, consistent with earlier observations [9,43,44], suggests that the maxima in LF source density likely correspond to the two positive charge regions within a well-organized thunderstorm electrification structure.
The hydrometeor composition at lightning source locations within three convective cores (A, B, and C) is analyzed. In convective core A, the proportions of LDG, AG, VI, and IC at lightning locations were 40%, 34%, 11%, and 6%, respectively. In convective core B, the proportions of LDG, AG, HDG, and RN at lightning locations were 48%, 18%, 14%, and 11%, respectively. In convective core C, the proportions of LDG and AG at lightning locations were nearly equal, at 36% and 35%, followed by IC and RN at 8% each, and HDG at 7%. The results demonstrate that LDG and AG are the dominant hydrometeors at lightning source locations, with their proportions varying according to convective intensity. Stronger updrafts correlate with an increased proportion of LDG and HDG, while AG proportion decreases.
Throughout the storm evolution, the positive correlation between lightning sources and LDG was most pronounced, reinforcing the critical role of graupel in non-inductive charging [1,13,45]. The peak correlation coefficient and its corresponding height increased with updraft strength. In convective core A, the peak correlations were primarily within the 5–11 km range, with the maximum correlation of 0.52 observed at 9 km (about −30 °C). In the more intense convective core B, the peak correlation shifted upward to a 9–12 km range, with the maximum correlation of 0.65 observed at 9 km. Lightning sources also showed significant positive correlations with HDG and Ha, with maximum values of 0.52 at 7 km and 0.42 at 8 km, respectively. Since graupel and hail in colder temperature regions are indicative of strong updrafts [12,46,47], and there is a strong correlation between lightning activity and updraft [48], the upward shift in peak correlations suggests that stronger updrafts facilitate the lofting of graupel and hail, enhancing charge separation and lightning activity. Notably, in convective core C, the correlation between lightning sources and LDG exhibited a dual-peak distribution at 7–8 km and 13–14 km. Stolzenburg et al. proposed a conceptual model of MCS charge structure featuring four vertically separated charge layers: a positive charge near 4 km, a negative charge near 6 km, a positive charge near 9 km, and a negative charge near 12 km [49]. Lund et al. found that the charge structure inferred from lightning and electric field data agreed well with the three lowest layers of charge in the conceptual model, with lightning source maxima associated with positive charge regions [11]. The correlation peak at 7–8 km likely corresponds to the mid-level negative charge layer, and the lightning source maxima at 6–7 km and 10–11 km indicate positive charge regions. The correlation peak at 13–14 km may result from the vertical transport of charged hydrometeors by strong updrafts [50]. However, this mechanism cannot be confirmed at present due to the lack of direct observational evidence, such as measurements of vertical advection strength and the charge properties of advected particles. Furthermore, it is also possible that new hydrometeor populations may be involved at these heights. As a result, the specific physical processes responsible for the upper-level correlation peak remain unclear. Our current interpretation is primarily based on the spatial association between lightning sources and hydrometeor distributions. Further in situ observations and high-resolution modeling are needed to clarify the underlying mechanisms.
The dual-polarization weather radar offers additional polarimetric parameters, allowing further exploration of the relationship between lightning activity and microphysical characteristics. Ice phase hydrometeors are found to be well correlated with thunderstorm electrification. However, due to inherent limitations of lightning observation networks, previous studies have primarily focused on correlations between lightning activity and storm-integrated parameters (e.g., flash rate, echo volume, updraft volume, or hydrometeor mass) [38,51,52,53,54]. In this study, we applied a high-resolution, height-resolved, grid-based analysis by integrating 3D LF lightning mapping with dual-polarization radar hydrometeor classification, enabling a more detailed examination of the vertical correlations between lightning sources and hydrometeors at different levels and storm stages.

5. Conclusions

The results indicate that LDG exhibits the strongest correlation with lightning sources, with intensifying updrafts enhancing this relationship and elevating the height at which the peak correlation occurs. A robust dual-peak structure is also identified in both the vertical distribution of lightning sources and their correlation with LDG, which reflects the vertical charge structure in mature convective storms. This approach provides a more refined and in-depth understanding of the vertical distribution of lightning activity and its microphysical environment within thunderstorms. Future studies should incorporate a broader range of thunderstorm cases to investigate the contribution of hydrometeors at different altitudes to lightning activity, thereby advancing our understanding of storm electrification mechanisms.

Author Contributions

Conceptualization, S.J. and F.L.; data curation, S.J. and F.L.; formal analysis, S.J.; funding acquisition, S.J. and F.L.; investigation, F.L. and S.A.C.; methodology, S.J. and F.L.; project administration, F.L., S.A.C., M.W. and W.L.; resources, F.L. and S.A.C.; software, S.J.; supervision, F.L., S.A.C., M.W. and W.L.; validation, S.J., F.L., T.Z. and Y.L.; visualization, S.J.; writing—original draft, S.J.; writing—review and editing, S.J., F.L., M.W. and W.L. All authors have read and agreed to the published version of the manuscript.

Funding

This research was funded by the National Natural Science Foundation of China (Grant 42475097), the Basic Research Fund of the Chinese Academy of Meteorological Sciences (Grants Nos. 2024Z010, 2020R004), the Research Project of Jiangsu Meteorological Bureau (ZD202522), the Basic Research Fund of CAMS (2022Y018), Foundation of Key Laboratory of Big Data & Artificial Intelligence in Transportation (Beijing Jiaotong University), Ministry of Education (No. BATLAB202402), and the Natural Science Basic Research Program of Shanxi Province (2024JC-YBMS-218).

Data Availability Statement

The original contributions presented in this study are included in the article. Further inquiries can be directed to the corresponding author (Fanchao Lyu).

Conflicts of Interest

The authors declare no conflicts of interest.

References

  1. Takahashi, T. Riming electrification as a charge generation mechanism in thunderstorms. J. Atmos. Sci. 1978, 35, 1536–1548. [Google Scholar] [CrossRef]
  2. Saunders, C.P.R.; Keith, W.D.; Mitzeva, R.P. The effect of liquid water on thunderstorm charging. J. Geophys. Res. Atmos. 1991, 96, 11007–11017. [Google Scholar] [CrossRef]
  3. MacGorman, D.R.; Burgess, D.W.; Mazur, V.; Rust, D.W.; Taylor, L.W.; Johnson, B.C. Lightning rates relative to tornadic storm evolution on 22 May 1981. J. Atmos. Sci. 1989, 46, 221–250. [Google Scholar] [CrossRef]
  4. Ribaud, J.-F.; Bousquet, O.; Coquillat, S. Relationships between total lightning activity, microphysics, and kinematics during the 24 September 2012 HyMeX bow-echo system. Q. J. R. Meteorol. Soc. 2016, 142, 298–309. [Google Scholar] [CrossRef]
  5. Zhang, T.; Zhao, G.; Wei, C.; Gao, Y.; Yu, H.; Zhou, F. Relationships between cloud-to-ground flashes and hydrometeors in a thunderstorm in Fujian province. J. Atmos. Sol. Terr. Phys. 2017, 154, 226–235. [Google Scholar] [CrossRef]
  6. Nisi, L.; Hering, A.; Germann, U.; Schroeer, K.; Barras, H.; Kunz, M.; Martius, O. Hailstorms in the Alpine region: Diurnal cycle, 4D-characteristics, and the nowcasting potential of lightning properties. Q. J. R. Meteorol. Soc. 2020, 146, 4170–4194. [Google Scholar] [CrossRef]
  7. Li, Z.; Zhang, T.; Bao, M.; Yu, H.; Su, T.; Lin, H. Relationships between cloud-to-ground flashes and ice-phase hydrometeors in a tropical hailstorm. J. Atmos. Sol. Terr. Phys. 2022, 241, 105978. [Google Scholar] [CrossRef]
  8. Michibata, T. Significant increase in graupel and lightning occurrence in a warmer climate simulated by prognostic graupel parameterization. Sci. Rep. 2024, 14, 3862. [Google Scholar] [CrossRef]
  9. Carey, L.D.; Murphy, M.J.; McCormick, T.L.; Demetriades, N.W.S. Lightning location relative to storm structure in a leading-line, trailing-stratiform mesoscale convective system. J. Geophys. Res. Atmos. 2005, 110, D03105. [Google Scholar] [CrossRef]
  10. Wiens, K.C.; Rutledge, S.A.; Tessendorf, S.A. The 29 June 2000 supercell observed during STEPS. Part II: Lightning and charge structure. J. Atmos. Sci. 2005, 62, 4151–4177. [Google Scholar] [CrossRef]
  11. Lund, N.R.; MacGorman, D.R.; Schuur, T.J.; Biggerstaff, M.I.; Rust, W.D. Relationships between lightning location and polarimetric radar signatures in a small mesoscale convective system. Mon. Weather Rev. 2009, 137, 4151–4170. [Google Scholar] [CrossRef]
  12. Hayashi, S.; Umehara, A.; Nagumo, N.; Ushio, T. The relationship between lightning flash rate and ice-related volume derived from dual-polarization radar. Atmos. Res. 2021, 248, 105166. [Google Scholar] [CrossRef]
  13. Saunders, C.P.R.; Bax-Norman, H.; Emersic, C.; Avila, E.E.; Castellano, N.E. Laboratory studies of the effect of cloud conditions on graupel/crystal charge transfer in thunderstorm electrification. Q. J. R. Meteorol. Soc. 2006, 132, 2653–2673. [Google Scholar] [CrossRef]
  14. Kouketsu, T.; Uyeda, H.; Ohigashi, T.; Tsuboki, K. Relationship between cloud-to-ground lightning polarity and the space-time distribution of solid hydrometeors in isolated summer thunderclouds observed by X-band polarimetric radar. J. Geophys. Res. Atmos. 2017, 122, 8781–8800. [Google Scholar] [CrossRef]
  15. Schultz, C.J.; Carey, L.D.; Schultz, E.V.; Blakeslee, R.J. Kinematic and microphysical significance of lightning jumps versus nonjump increases in total flash rate. Weather Forecast. 2017, 32, 275–288. [Google Scholar] [CrossRef] [PubMed]
  16. Liu, Y.; Lyu, F.; Wang, M.; Xu, W.; Xi, D.; Jiang, S. Lightning characteristics and associated microphysical parameters in a strong thunderstorm with an extreme gale. Nat. Hazards 2024, 120, 12451–12469. [Google Scholar] [CrossRef]
  17. Rison, W.; Thomas, R.J.; Krehbiel, P.R.; Hamlin, T.; Harlin, J. A GPS-based three-dimensional lightning mapping system: Initial observations in central New Mexico. Geophys. Res. Lett. 1999, 26, 3573–3576. [Google Scholar] [CrossRef]
  18. Thomas, R.J.; Krehbiel, P.R.; Rison, W.; Hunyady, S.J.; Winn, W.P.; Hamlin, T.; Harlin, J. Accuracy of the Lightning Mapping Array. J. Geophys. Res. Atmos. 2004, 109, D14207. [Google Scholar] [CrossRef]
  19. Yoshida, S.; Wu, T.; Ushio, T.; Kusunoki, K.; Nakamura, Y. Initial results of LF sensor network for lightning observation and characteristics of lightning emission in LF band. J. Geophys. Res. Atmos. 2014, 119, 12034–12051. [Google Scholar] [CrossRef]
  20. Wang, Y.; Qie, X.; Wang, D.; Liu, M.; Su, D.; Wang, Z.; Liu, D.; Wu, Z.; Sun, Z.; Tian, Y. Beijing Lightning Network (BLNET) and the observation on preliminary breakdown processes. Atmos. Res. 2016, 171, 121–132. [Google Scholar] [CrossRef]
  21. Lyu, F.; Cummer, S.A.; Chen, M.; Qin, Z.; Lyu, W.; Sun, J. Three-dimensional mapping of two coincident flashes—An upward positive flash triggered by the in-cloud activity of a downward negative flash. Atmos. Res. 2021, 250, 105408. [Google Scholar] [CrossRef]
  22. Bruning, E.C.; Rust, W.D.; Schuur, T.J.; MacGorman, D.R.; Krehbiel, P.R.; Rison, W. Electrical and polarimetric radar observations of a multicell storm in TELEX. Mon. Weather Rev. 2007, 135, 2525–2544. [Google Scholar] [CrossRef]
  23. Liu, D.X.; Qie, X.S.; Chen, Y.C.; Sun, Z.L.; Yuan, S.F. Investigating lightning characteristics through a supercell storm by comprehensive coordinated observations over North China. Adv. Atmos. Sci. 2020, 37, 861–872. [Google Scholar] [CrossRef]
  24. Yang, J.; Zhao, K.; Zheng, Y.; Chen, H.; Chen, G. Microphysical structure of thunderstorms and their lightning activity during the mei-yu and post-mei-yu periods over Nanjing, Yangtze River Delta. Geophys. Res. Lett. 2022, 49, e2022GL100952. [Google Scholar] [CrossRef]
  25. Lyu, F.; Cummer, S.A.; Solanki, R.; Weinert, J.; McTague, L.; Katko, A.; Barrett, J.; Zigoneanu, L.; Xie, Y.B.; Wang, W.Q. A low-frequency near-field interferometric-TOA 3-D Lightning Mapping Array. Geophys. Res. Lett. 2014, 41, 7777–7784. [Google Scholar] [CrossRef]
  26. Stock, M.G.; Akita, M.; Krehbiel, P.R.; Rison, W.; Edens, H.E.; Kawasaki, Z.; Stanley, M.A. Continuous broadband digital interferometry of lightning using a generalized cross-correlation algorithm. J. Geophys. Res. Atmos. 2014, 119, 3134–3165. [Google Scholar] [CrossRef]
  27. Lyu, F.; Cummer, S.A.; Lu, G.P.; Zhou, X.; Weinert, J. Imaging lightning intracloud initial stepped leaders by low-frequency interferometric lightning mapping array. Geophys. Res. Lett. 2016, 43, 5516–5523. [Google Scholar] [CrossRef]
  28. Doviak, R.J.; Bringi, V.; Ryzhkov, A.; Zahrai, A.; Zrnić, D. Considerations for polarimetric upgrades to operational WSR-88D radars. J. Atmos. Ocean. Technol. 2000, 17, 257–278. [Google Scholar] [CrossRef]
  29. Ryzhkov, A.V.; Giangrande, S.E.; Schuur, T.J. Rainfall estimation with a polarimetric prototype of WSR-88D. J. Appl. Meteorol. 2005, 44, 502–515. [Google Scholar] [CrossRef]
  30. Qin, Z.; Chen, M.; Lyu, F.; Cummer, S.A.; Zhu, B.; Liu, F.; Du, Y. A GPU-based grid traverse algorithm for accelerating lightning geolocation process. IEEE Trans. Electromagn. Compat. 2020, 62, 489–497. [Google Scholar] [CrossRef]
  31. Wu, T.; Wang, D.H.; Takagi, N. Lightning mapping with an array of fast antennas. Geophys. Res. Lett. 2018, 45, 3698–3705. [Google Scholar] [CrossRef]
  32. Zhu, Y.; Bitzer, P.; Stewart, M.; Podgorny, S.; Corredor, D.; Burchfield, J.; Carey, L.; Medina, B.; Stock, M. Huntsville Alabama Marx Meter Array 2: Upgrade and capability. Earth Space Sci. 2020, 7, e2020EA001111. [Google Scholar] [CrossRef]
  33. Wang, F.; Zhang, Y.J.; Liu, H.Y.; Yao, W.; Meng, Q. Characteristics of cloud-to-ground lightning strikes in the stratiform regions of mesoscale convective systems. Atmos. Res. 2016, 178–179, 207–216. [Google Scholar] [CrossRef]
  34. Liu, D.X.; Sun, M.Y.; Su, D.B.; Xu, W.J.; Yu, H.; Chen, Y.C. A five-year climatological lightning characteristics of linear mesoscale convective systems over North China. Atmos. Res. 2021, 256, 105580. [Google Scholar] [CrossRef]
  35. Ren, Y.S.; Xu, W.X.; Fu, J.L. Characteristics of intracloud lightning to cloud-to-ground lightning ratio in thunderstorms over Eastern and Southern China. Atmos. Res. 2024, 300, 107231. [Google Scholar] [CrossRef]
  36. Ni, X.; Liu, C.T.; Zipser, E. Ice microphysical properties near the tops of deep convective cores implied by the GPM dual-frequency radar observations. J. Atmos. Sci. 2019, 76, 2899–2917. [Google Scholar] [CrossRef]
  37. Brooks, I.M.; Saunders, C.P.R.; Mitzeva, R.P.; Peck, S.L. The effect on thunderstorm charging of the rate of rime accretion by graupel. Atmos. Res. 1997, 43, 277–295. [Google Scholar] [CrossRef]
  38. Barthe, C.; Hoarau, T.; Bovalo, C. Cloud electrification and lightning activity in a tropical cyclone-like vortex. Atmos. Res. 2016, 180, 297–309. [Google Scholar] [CrossRef]
  39. Zhao, C.; Zhang, Y.; Zheng, D.; Li, H.; Du, S.; Peng, X.; Liu, X.; Zhao, P.; Zheng, J.; Shi, J. On the ice microphysics of isolated thunderstorms and non-thunderstorms in southern China—A radar polarimetric perspective. Atmos. Chem. Phys. 2024, 24, 11637–11651. [Google Scholar] [CrossRef]
  40. Ziegler, C.L.; MacGorman, D.R.; Dye, J.E.; Ray, P.S. A model evaluation of noninductive graupel-ice charging in the early electrification of a mountain thunderstorm. J. Geophys. Res. 1991, 96, 12833. [Google Scholar] [CrossRef]
  41. López, R.E.; Aubagnac, J.-P. The lightning activity of a hailstorm as a function of changes in its microphysical characteristics inferred from polarimetric radar observations. J. Geophys. Res. Atmos. 1997, 102, 16799–16813. [Google Scholar] [CrossRef]
  42. Mattos, E.V.; Machado, L.A.T.; Williams, E.R.; Goodman, S.J.; Blakeslee, R.J.; Bailey, J.C. Electrification life cycle of incipient thunderstorms. J. Geophys. Res. Atmos. 2017, 122, 4670–4697. [Google Scholar] [CrossRef]
  43. Lang, T.J.; Rutledge, S.A. Kinematic, microphysical, and electrical aspects of an asymmetric bow-echo mesoscale convective system observed during STEPS 2000. J. Geophys. Res. 2008, 113, D08213. [Google Scholar] [CrossRef]
  44. Wang, F.; Zhang, Y.; Dong, W.; Liu, H.; Feng, L.; Yao, W. Characteristics of negative leader propagation area of lightning flashes initiated in the stratiform regions of mesoscale convective systems. J. Geophys. Res. Atmos. 2021, 126, e2020JD033336. [Google Scholar] [CrossRef]
  45. Wang, S.; Wada, Y.; Hayashi, S.; Ushio, T.; Chandrasekar, V. Observation of electrical alignment signatures in an isolated thunderstorm by dual-polarized phased array weather radar and the relationship with intracloud lightning flash rate. J. Geophys. Res. Atmos. 2024, 129, e2023JD040681. [Google Scholar] [CrossRef]
  46. Heymsfield, A.J. Case study of a hailstorm in Colorado. Part IV: Graupel and hail growth mechanisms deduced through particle trajectory calculations. J. Atmos. Sci. 1983, 40, 1482–1509. [Google Scholar] [CrossRef]
  47. Miller, L.J.; Tuttle, J.D.; Foote, G.B. Precipitation production in a large Montana hailstorm: Airflow and particle growth trajectories. J. Atmos. Sci. 1990, 47, 1619–1646. [Google Scholar] [CrossRef]
  48. Deierling, W.; Petersen, W.A. Total lightning activity as an indicator of updraft characteristics. J. Geophys. Res. 2008, 113, D16210. [Google Scholar] [CrossRef]
  49. Stolzenburg, M.; Rust, W.D.; Smull, B.F.; Marshall, T.C. Electrical structure in thunderstorm convective regions: 1. Mesoscale convective systems. J. Geophys. Res. Atmos. 1998, 103, 14059–14078. [Google Scholar] [CrossRef]
  50. Stough, S.M.; Carey, L.D. Observations of anomalous charge structures in supercell thunderstorms in the Southeastern United States. J. Geophys. Res. Atmos. 2020, 125, e2020JD033012. [Google Scholar] [CrossRef]
  51. Carey, L.D.; Rutledge, S.A. A multiparameter radar case study of the microphysical and kinematic evolution of a lightning producing storm. Meteorol. Atmos. Phys. 1996, 59, 33–64. [Google Scholar] [CrossRef]
  52. Carey, L.D.; Rutledge, S.A. The relationship between precipitation and lightning in tropical island convection: A C-band polarimetric radar study. Mon. Weather Rev. 2000, 128, 2687–2710. [Google Scholar] [CrossRef]
  53. Fehr, T.; Dotzek, N.; Höller, H. Comparison of lightning activity and radar-retrieved microphysical properties in EULINOX storms. Atmos. Res. 2005, 76, 167–189. [Google Scholar] [CrossRef]
  54. Basarab, B.M.; Rutledge, S.A.; Fuchs, B.R. An improved lightning flash rate parameterization developed from Colorado DC3 thunderstorm data for use in cloud-resolving chemical transport models. J. Geophys. Res. Atmos. 2015, 120, 9481–9499. [Google Scholar] [CrossRef]
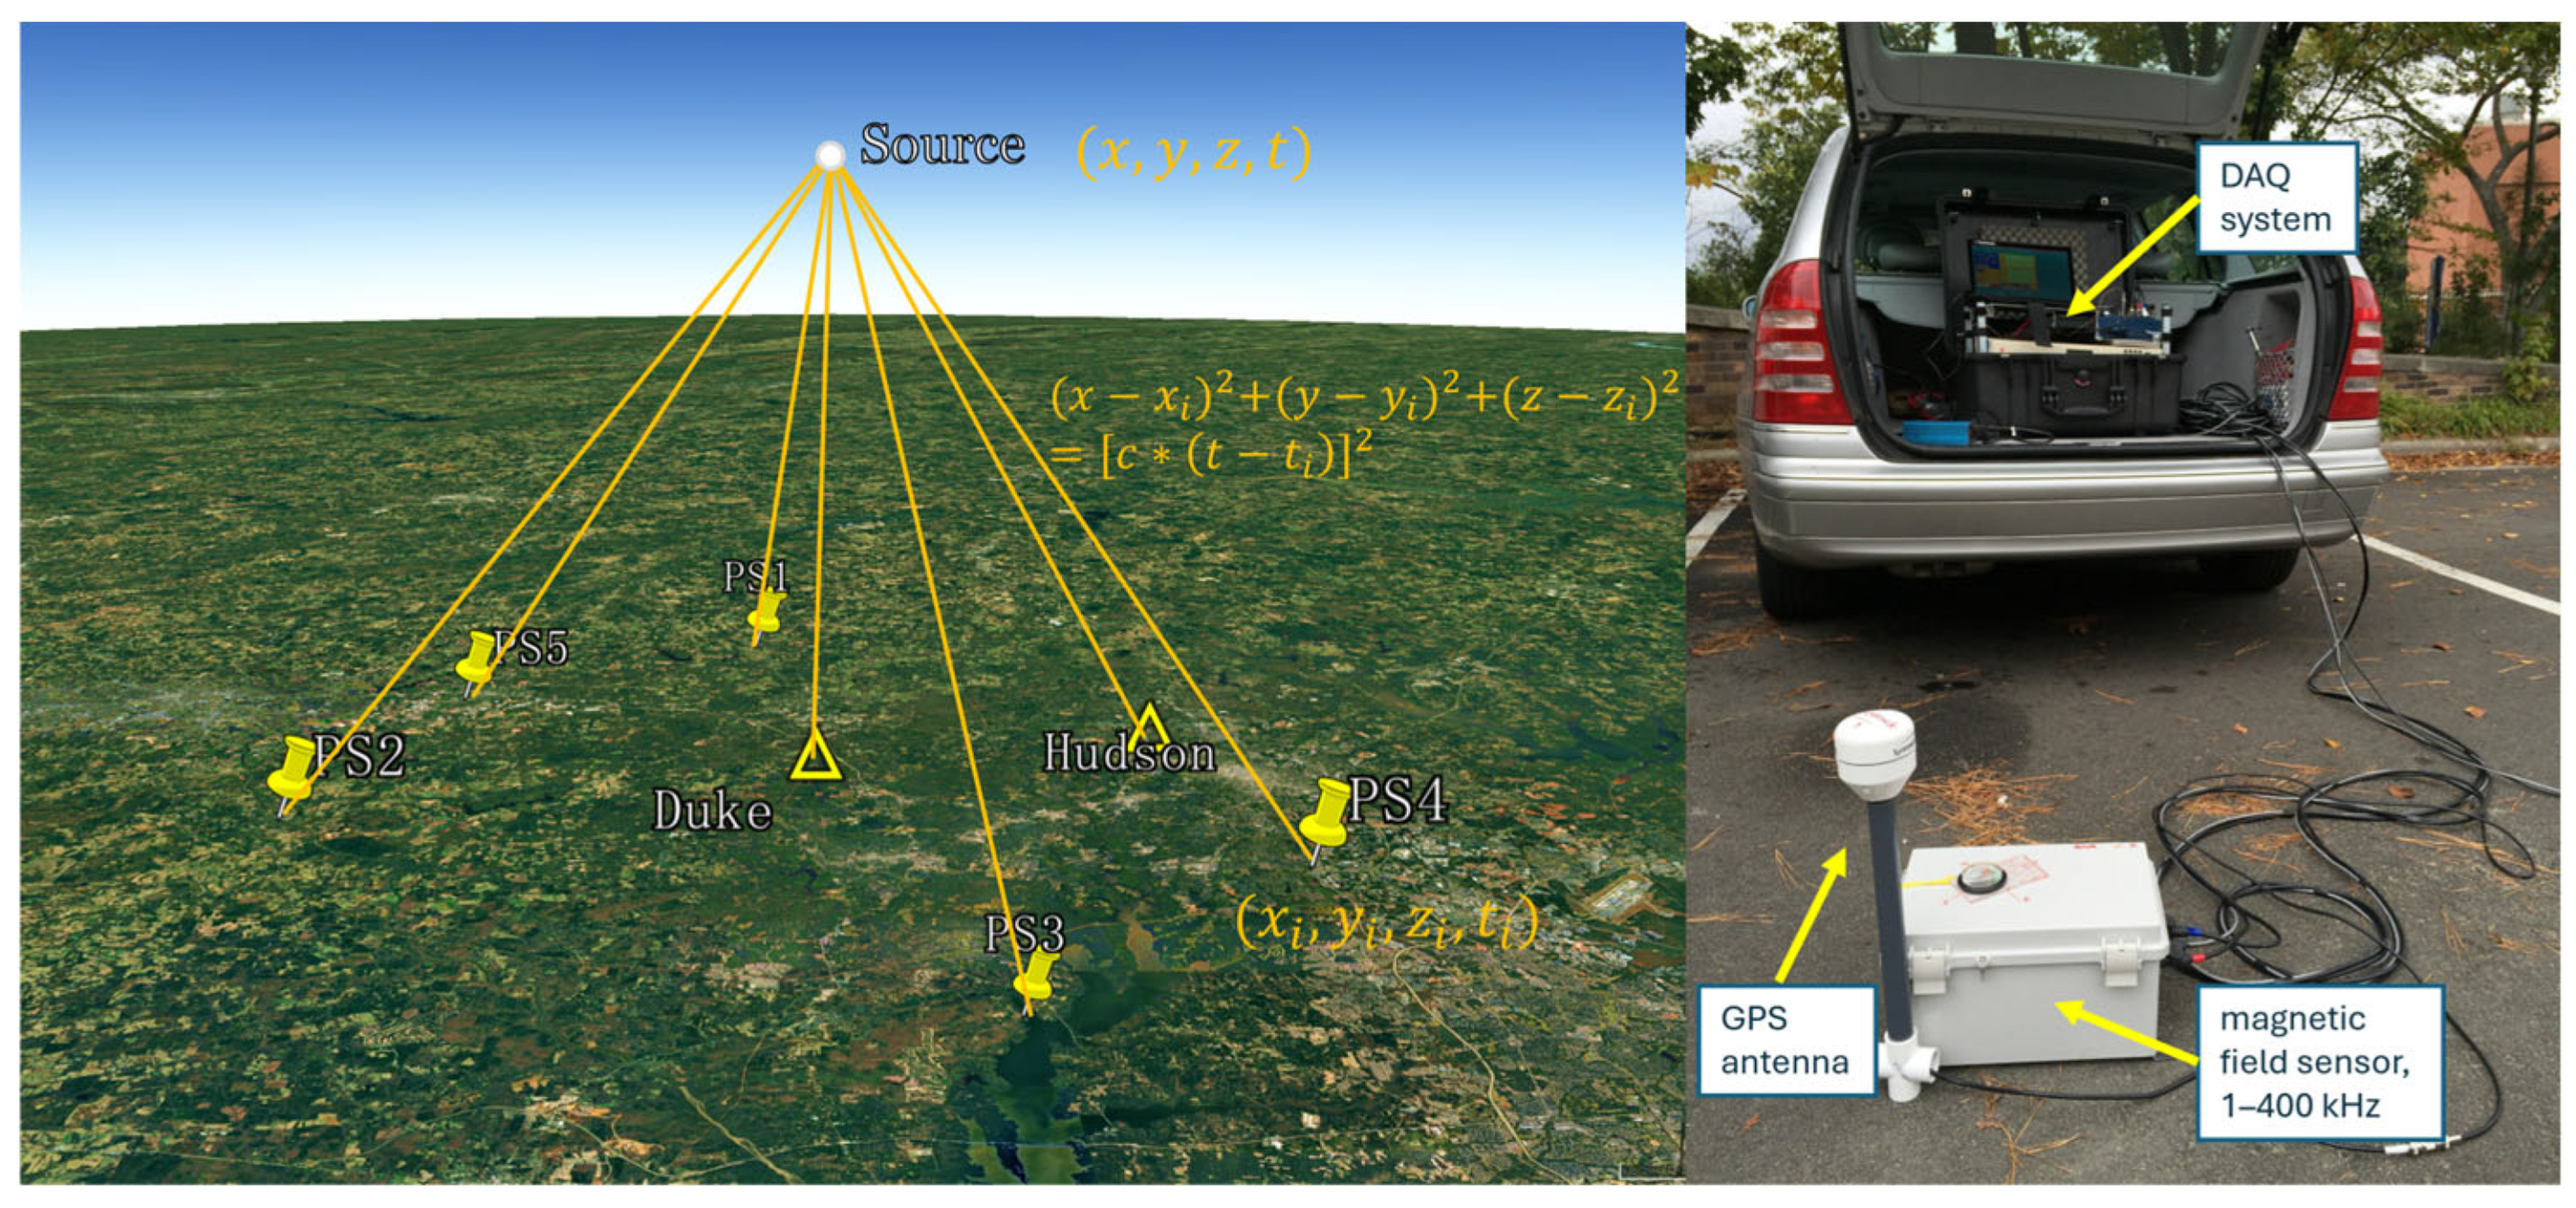
Figure 1. The deployment of the low-frequency (LF) sensors and a photo of mobile LF sensors running in a vehicle. The two triangles mark the two fixed locations (Duke Forest and Hudson) of the permanent LF sensors, and the five pins mark the locations of the mobile sites (PS1 to PS5). Each mobile site consisted of an LF sensor box, a GPS antenna, and the data acquisition system arranged in a portable pelican case running in the trunk of a parked car, as shown by the photo on the right. The variables x , y , z , t represent the spatial location and occurrence time of the lightning source, respectively. The variables x i ,   y i ,   z i ,   t i represent the spatial coordinates of the LF sensor site and the signal arrival time at that site, respectively.
Remotesensing 17 02676 g001
Figure 2. (a) Distribution of lightning source counts at 6 km for different reflectivity intervals. (b) Temporal–vertical distribution of the proportion of lightning sources occurring within the convective core.
Remotesensing 17 02676 g002
Figure 3. The distribution of (af) low-density graupel (LDG), (gl) aggregates (AGs), and (mr) sources within the convective core at 10 km at 21:20 UTC, 21:24 UTC, 21:30 UTC, 21:34 UTC, 21:39 UTC, and 21:44 UTC. The color bar indicates the count at each grid point.
Remotesensing 17 02676 g003
Figure 4. Time series of radar reflectivity at 6 km with 5 min overlapping lightning sources at (a) 21:10 UTC, (b) 21:30 UTC, and (c) 21:53 UTC. The coordinate origin is the center of the low-frequency near-field interferometric-TOA 3D lightning mapping array (LFILMA) network. White dots represent LF sources, with dot size proportional to source counts within a five-minute window of the radar scan. Red contours mark the boundary of convective cores where reflectivity exceeds 20 dBZ above 8 km. Arrows indicate the propagation direction of the identified convective region. A–C denote the identified convective cores.
Remotesensing 17 02676 g004
Figure 5. The height variation in LF lightning source density during the storm. Densities are derived by counting the number of sources in each 1 min time window and 200 m vertical bin. The vertical dashed lines indicate the division of three distinct stages of the thunderstorm.
Remotesensing 17 02676 g005
Figure 6. Time series of radar reflectivity superimposed with the LF lightning sources in convective core A at 6 km at (a) 21:15 UTC, (b) 21:20 UTC, (c) 21:24 UTC, (d) 21:30 UTC, (e) 21:34 UTC, (f) 21:39 UTC, and (g) 21:44 UTC. White dots represent LF lightning sources, with dot size scaling with source count. The black dashed lines denote the locations of the vertical cross-section shown in Figure 7. Arrows indicate the propagation direction of the convective core.
Remotesensing 17 02676 g006
Figure 7. Vertical cross-section of hydrometeor types in convective core A at (a) 21:15 UTC, (b) 21:20 UTC, (c) 21:24 UTC, (d) 21:30 UTC, (e) 21:34 UTC, (f) 21:39 UTC, and (g) 21:44 UTC. The location of the cross-section is indicated by the black dashed line in Figure 6. The horizontal coordinate is the distance along the black dashed line in Figure 6. The horizontal dashed lines represent the 0 °C, −10 °C, −20 °C, −30 °C, and −40 °C temperature levels. White dots represent LF lightning sources, with dot size scaling with source count.
Remotesensing 17 02676 g007
Figure 8. Vertical distribution of hydrometeor types by height in convective core A. (a) 21:15 UTC, (b) 21:20 UTC, (c) 21:24 UTC, (d) 21:30 UTC, (e) 21:34 UTC, (f) 21:39 UTC, and (g) 21:44 UTC. The red curve represents the variation in the source count with height.
Remotesensing 17 02676 g008
Figure 9. Correlation between lightning sources and ice-phase hydrometeors at different height levels. (a) 21:15 UTC, (b) 21:20 UTC, (c) 21:24 UTC, (d) 21:30 UTC, (e) 21:34 UTC, (f) 21:39 UTC, and (g) 21:44 UTC. The x-axis represents ice-phase hydrometeors (IC: Ice Crystals, AG: Aggregates, VI: Vertical Ice, LDG: Low-Density Graupel, HDG: High-Density Graupel, Ha: Hail), and the y-axis represents height.
Remotesensing 17 02676 g009
Figure 10. As in Figure 6, but for convective core B at (a) 21:20 UTC, (b) 21:24 UTC, (c) 21:30 UTC, (d) 21:34 UTC, (e) 21:39 UTC, and (f) 21:44 UTC.
Remotesensing 17 02676 g010
Figure 11. As in Figure 7, but for convective core B at (a) 21:20 UTC, (b) 21:24 UTC, (c) 21:30 UTC, (d) 21:34 UTC, (e) 21:39 UTC, and (f) 21:44 UTC. White dots represent LF lightning sources, with dot size scaling with source count.
Remotesensing 17 02676 g011
Figure 12. As in Figure 8, but for convective core B at (a) 21:20 UTC, (b) 21:24 UTC, (c) 21:30 UTC, (d) 21:34 UTC, (e) 21:39 UTC, and (f) 21:44 UTC.
Remotesensing 17 02676 g012
Figure 13. As in Figure 9, but for convective core B at (a) 21:20 UTC, (b) 21:24 UTC, (c) 21:30 UTC, (d) 21:34 UTC, (e) 21:39 UTC, and (f) 21:44 UTC.
Remotesensing 17 02676 g013
Figure 14. As in Figure 6, but for convective core C at (a) 21:48 UTC; (b) 21:53 UTC; (c) 21:58 UTC; (d) 22:02 UTC; (e) 22:07 UTC; (f) 22:12 UTC; (g) 22:16 UTC; (h) 22:21 UTC.
Remotesensing 17 02676 g014
Figure 15. As in Figure 7, but for convective core C at (a) 21:48 UTC; (b) 21:53 UTC; (c) 21:58 UTC; (d) 22:02 UTC; (e) 22:07 UTC; (f) 22:12 UTC; (g) 22:16 UTC; (h) 22:21 UTC. White dots represent LF lightning sources, with dot size scaling with source count.
Remotesensing 17 02676 g015
Figure 16. As in Figure 8, but for convective core C at (a) 21:48 UTC; (b) 21:53 UTC; (c) 21:58 UTC; (d) 22:02 UTC; (e) 22:07 UTC; (f) 22:12 UTC; (g) 22:16 UTC; (h) 22:21 UTC.
Remotesensing 17 02676 g016
Figure 17. As in Figure 9, but for convective core C at (a) 21:48 UTC; (b) 21:53 UTC; (c) 21:58 UTC; (d) 22:02 UTC; (e) 22:07 UTC; (f) 22:12 UTC; (g) 22:16 UTC; (h) 22:21 UTC.
Remotesensing 17 02676 g017
Disclaimer/Publisher’s Note: The statements, opinions and data contained in all publications are solely those of the individual author(s) and contributor(s) and not of MDPI and/or the editor(s). MDPI and/or the editor(s) disclaim responsibility for any injury to people or property resulting from any ideas, methods, instructions or products referred to in the content.