Article

An Integrated Remote Sensing and Near-Surface Geophysical Approach to Detect and Characterize Active and Capable Faults in the Urban Area of Florence (Italy)

by
Luigi Piccardi
1,*,
Antonello D’Alessandro
1,
Eutizio Vittori
1,
Vittorio D’Intinosante
2 and
Massimo Baglione
2
1
Institute of Geosciences and Earth Resources, National Research Council of Italy, Via G. La Pira n. 4, 50121 Florence, Italy
2
Seismic Sector, Tuscany Region, Via San Gallo n. 34/A, 50129 Florence, Italy
*
Author to whom correspondence should be addressed.
Remote Sens. 2025, 17(15), 2644; https://doi.org/10.3390/rs17152644 (registering DOI)
Submission received: 10 June 2025 / Revised: 23 July 2025 / Accepted: 26 July 2025 / Published: 30 July 2025

Abstract

The NW–SE-trending Firenze-Pistoia Basin (FPB) is an intermontane tectonic depression in the Northern Apennines (Italy) bounded to the northeast by a SW-dipping normal fault system. Although it has moderate historical seismicity (maximum estimated Mw 5.5 in 1895), the FPB lacks detailed characterization of its recent tectonic structures, unlike those of nearby basins that have produced Mw > 6 events. This study focuses on the southeastern sector of the basin, including the urban area of Florence, using tectonic geomorphology derived from remote sensing, in particular LiDAR data, field verification, and high-resolution geophysical surveys such as electrical resistivity tomography and seismic reflection profiles. The integration of these techniques enabled interpretation of the subdued and anthropogenically masked tectonic structures, allowing the identification of Holocene activity and significant, although limited, surface vertical offset for three NE–SW-striking normal faults, the Peretola, Scandicci, and Maiano faults. The Scandicci and Maiano faults appear to segment the southeasternmost strand of the master fault of the FPB, the Fiesole Fault, which now shows activity only along isolated segments and cannot be considered a continuous active fault. From empirical relationships, the Scandicci Fault, the most relevant among the three active faults, ~9 km long within the basin and with an approximate Late Quaternary slip rate of ~0.2 mm/year, might source Mw > 5.5 earthquakes. These findings highlight the need to reassess the local seismic hazard for more informed urban planning and for better preservation of the cultural and architectural heritage of Florence and the other artistic towns located in the FPB.

1. Introduction

Florence is located in the southeastern corner of the northwest–southeast-oriented Firenze–Pistoia Basin (FPB), a tectonic depression approximately 40 km long and 10 km wide, situated within the internal domain of the Northern Apennines, west of the main watershed divide (Figure 1A). The basin is bounded by Neogene–Quaternary faults, whose present activity has not been definitively established yet (e.g., [1,2,3]). The ITHACA Catalogue [3] identifies the master fault of the basin as mapped in the Neotectonic Map of Italy [4], extending continuously from Pistoia to Florence and assigning it a generic Quaternary age for its most recent activity (Figure 1B).
Despite its tectonic setting, the FPB still lacks accurate mapping and detailed characterization of local active faults, which is essential for assessing the seismic and surface rupture (i.e., capable faulting) hazard they may pose. Capable faulting is the potential of a fault to rupture the ground surface during an earthquake, causing permanent displacement that can directly affect infrastructure, lifelines, and critical facilities. Several factors likely contribute to this deficiency. These include the high erodibility of the exposed lithologies, which limits the preservation of fault-related features, the lack of well-documented strong seismic events in the historical record over the past thousand years, and the inherent difficulty of conducting geological investigations in a densely urbanized setting.
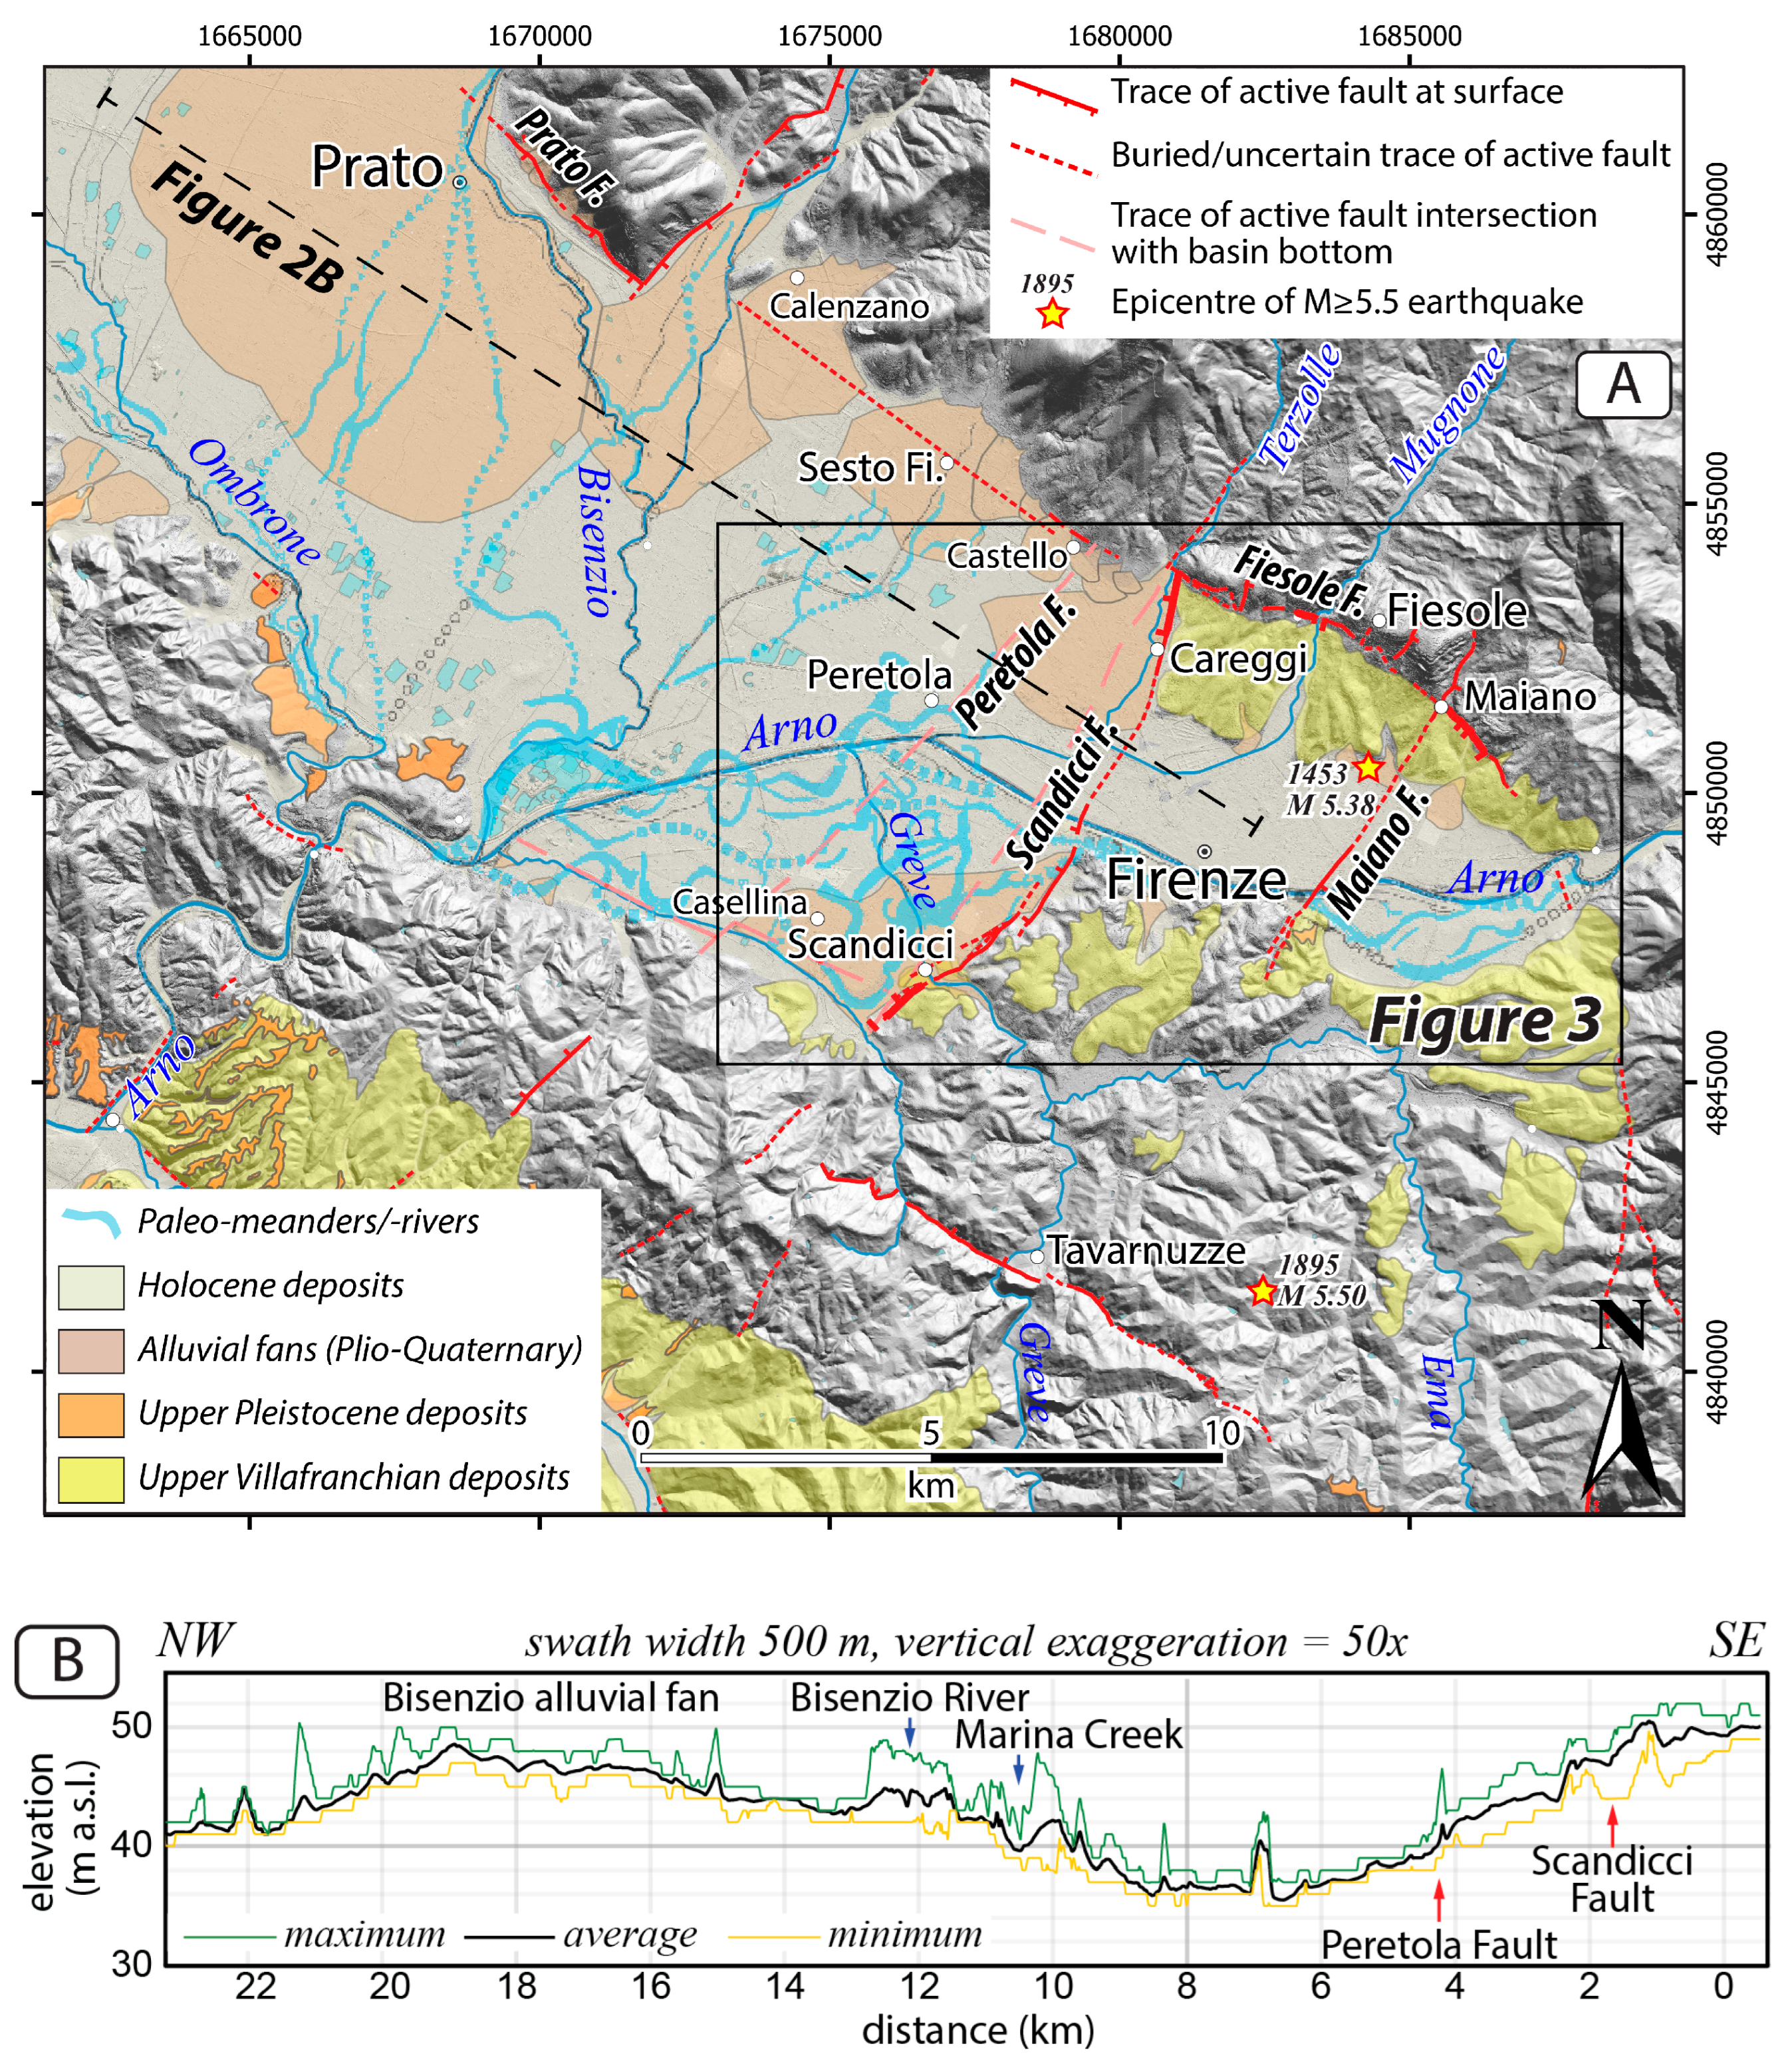
In this study, we present the results of an investigation into Quaternary faults, focusing in particular on the Florence sub-basin, the southeasternmost portion of the FPB, which includes the urban area of Florence (Figure 2A). The primary objective was to provide new data on the Late Quaternary and present-day activity of the faults and to assess the capability of the main structures in the area to rupture the ground surface. These investigations have included segments of the master fault system, such as the Fiesole Fault, and transverse structures such as the Scandicci and Maiano faults (Figure 2B).
The study combined tectonic geomorphology, using remotely sensed data verified through field observations, with high-resolution geophysical surveys. In particular, LiDAR data proved essential for interpreting the subdued and often artificially obscured tectonic geomorphology of this densely urbanized area. Four electrical resistivity tomography (ERT) and nine high-resolution seismic reflection profiles were carried out across faults suspected of recent movement. The identified fault splays are associated with subtle morphological breaks and stratigraphic offsets, consistent with recent fault activity. These features, although partially masked by urban development and anthropogenic modifications, are supported by both LiDAR-derived geomorphological lineaments and subsurface disruptions imaged in the geophysical profiles.
As stated above, the aim of this work is to present new data on Quaternary and active faults in the FPB, where active and capable faults are still poorly defined in national catalogues [2,3], focusing in particular on the urban area of Florence. However, it is beyond the scope of this paper to use of our findings to reassess the current geodynamics of this sector of the Apennine chain, a topic that would require the collection of data over a much wider area within a regional-scale approach.

Seismotectonic Setting

The Firenze–Pistoia Basin (FPB) (Figure 1B) is a NW–SE-oriented tectonic depression, with its plain lying at elevations between 40 and 70 m a.s.l. It is bordered by the Pistoia Mountains to the northwest (up to 1000 m), the Calvana Mountains (916 m) and Mt. Morello (892 m) to the northeast, the Montalbano Ridge to the southwest (627 m), and the Chianti Mountains to the southeast (893 m).
The basin evolved as a semi-graben since the Upper Pliocene [11,12,13,14,15,16], when the extensional front associated with the opening of the Tyrrhenian Sea reached this area, dismembering the pre-existing compressional tectonic stack through a system of SW-dipping normal faults [17,18,19]. A major NW–SE-trending, SW-dipping, normal fault bounds the northeastern margin of the basin for a total length of about 40 km [14,19,20,21], whereas no normal faulting has been documented along its southwestern margin. According to some authors (e.g., [15,16]), this margin may correspond to a buried thrust at the base of the Montalbano Ridge.
The master fault of the basin is characterized by subparallel splays, often buried beneath sediments. This structure is referred to in the literature by various names, such as Fiesole-Prato Fault or simply Fiesole Fault (e.g., [14]), Prato-S. Domenico Fault [15], or Florence-Prato-Pistoia System [1]. Here, we adopt the name Firenze-Pistoia Fault (following [3]) for the entire northeastern margin of the basin, while retaining the more specific names for individual segments of the system. The name Firenze-Prato Fault is used to indicate the segment bounding only the southeastern part of the basin, and Fiesole Fault for the southeasternmost segment of this system, north of the city of Florence (in agreement with [22], with references) (Figure 2A).
The maximum throw occurs in the central part of the basin, near Prato [15,16]. Boccaletti et al. [1] estimate a maximum downthrow of about 995 m at Prato since the onset of the Upper Pliocene (approximately 2 million years ago), suggesting a long-term vertical slip rate of about 0.5 mm/year. In the Florence area, an approximate downthrow of 290 m suggests a long-term slip rate of about 0.14 mm/year for the Fiesole Fault [1]. No evidence of the current activity of the FPB master fault has been confirmed yet.
Faults oriented approximately NE–SW, that is, transverse to the basin have contributed to the shaping of the basin since the Pliocene, constraining its longitudinal extension (e.g., [1,23]) (Figure 1B and Figure 2A). In the northern part of the basin, a main transverse structure delimits it north of Pistoia. In the southernmost part, the principal one of these transverse faults, here referred to as the Scandicci Fault, crosses the urban area of Florence for approximately 9 km, dipping NW. This structure played a significant role as a normal fault, separating the evolution of the southeasternmost portion of the basin, known as the Florence sub-basin and occupied by the urban area of Florence, from the main basin (Figure 2B). It also allowed the deepening of the basin floor toward the NW by more than 300 m (Figure 3). Another transverse structure affecting the urban area, located about 4 km east of the Scandicci Fault and parallel to it, is the SE-dipping Maiano Fault. Slip along the antithetically dipping Scandicci and Maiano faults has created a structural horst, upon which the ancient town of Florence developed during Etruscan and Roman times.
The basin is filled with Pliocene and Pleistocene deposits, which unconformably overlie the bedrock and are overlain by Holocene fluvial and alluvial sediments representing the final stage of basin infill. The bedrock, which also crops out along the basin margins, consists of formations belonging to the Cenozoic Tuscan Units (Macigno Formation), overthrust by Mesozoic to Cenozoic Ligurian Units (Calvana Supergroup, including the Sillano, Pietraforte, and Monte Morello Formations) [15,22,24]. In the Florence sub-basin, the Pliocene–Quaternary sedimentary fill comprises three Synthems [14,22,25]. These are locally preceded by sparse alluvial deposits of the paleo-Mugnone stream, which flowed from the Fiesole area directly into the Pliocene sea near San Casciano Val di Pesa, and by lower Pliocene limno-marsh deposits, up to 20 m thick, formed during the embryonic stages of basin development. From oldest to youngest, the Synthems are:
(A).
Firenze–Pistoia Basin Synthem (Upper Pliocene–Lower Pleistocene): This is the oldest and thickest sedimentary unit in the basin, composed of fine-grained fluvio-lacustrine sediments interfingered with alluvial fan deposits along the basin margins. It reaches its maximum thickness, over 500 m, near the master fault, particularly in front of Prato and Sesto Fiorentino, and thins progressively toward the southwestern edge of the basin [15,16]. In the Florence sub-basin, its thickness varies, reaching up to 120 m near the Fiesole Fault [14,21].
(B).
Florence Synthem (Middle–Upper Pleistocene, “Ancient deposits”): This unit consists of fluvial deposits from the paleo-Arno River and its tributaries, with a thickness that varies and reaches a minimum of approximately 20 m over the city horst. Its deposition was influenced by tectonic uplift of the Florence sub-basin, which led to the formation of a broad alluvial fan northwest of the Scandicci Fault. The fan terminates in onlap against the fault escarpment [14,21,22].
(C).
Arno Synthem (Holocene, “Recent deposits”): Representing the final stage of basin infill, this unit comprises fluvial and alluvial sediments, mainly gravel and sand lenses. In the Florence sub-basin, it lies unconformably on the substrate with a thickness of about 15–20 m. Elsewhere in the basin, it overlies older sediments and varies in thickness from a few meters up to 20–30 m [14,21].
Significant historical seismicity in several Quaternary basins of the Northern Apennines, such as the Mugello Basin (approximately 20 km north of the FPB, Mw 6.3 in 1919) and the Garfagnana and Lunigiana basins (80 and 100 km to the northwest, respectively, Mw 6.5 in 1920), along with geomorphological, stratigraphic, and paleoseismological studies, demonstrate ongoing tectonic activity and associated seismic hazard (e.g., [26]). This suggests that similar behaviour may also characterize the largest tectonic depression in Tuscany
Moderate historical seismicity (Figure 1 and Figure 2A) indicates some degree of tectonic activity in the Florence area and its surroundings. Ground shaking has caused damage in the past, including to the city’s cultural heritage. The earthquake of 18 May 1895 (Intensity VIII, Mw 5.5 ± 0.1) [27,28,29] is the strongest event recorded in Florence, with its epicentre located approximately 8 km south of the city (Figure 1B and Figure 2A). Prior to this, only two other earthquakes are estimated to have exceeded magnitude 5: one in 1148 (Intensity VIII, Mw 5.10), though its intensity and epicentre remain uncertain due to limited historical sources [30], and another in 1453 (Intensity VII–VIII, Mw 5.38 ± 0.37), with an epicentre closer to Florence [6,7,27,28,29]. However, these observed magnitudes cannot be considered a reliable upper bound without a thorough seismotectonic investigation. In fact, the historical seismicity highlights the need for a more precise assessment of the potential seismic hazard from local tectonic sources. This is essential for future land-use and urban planning, as well as for the protection of the population and the existing built environment, including major industrial centres and regional infrastructures.
In the tectonic basins of northern Tuscany mentioned above, paleoseismological investigations (e.g., [26]) have revealed evidence of recent (Holocene) surface faulting, with individual slip events reaching several tens of centimetres. Therefore, in addition to ground shaking, the hazard from capable faulting must also be evaluated, as required by national and international building codes and standards (e.g., [31,32]).

2. Materials and Methods

To investigate local tectonic geomorphology, we analysed satellite imagery, aerial photographs, topographic maps, and digital terrain models (DTMs). In particular, we used DTMs derived from LiDAR acquisitions with a 1 × 1 m resolution, freely available from Tuscany Region [9]. The elevation accuracy of the LiDAR-derived DTM is better than 15 cm (±1σ) at the pixel size of 1 m, while the horizontal accuracy is within 30 cm (±2σ). The observations based on tectonic geomorphology allowed us to identify the possibly active faults, study their relationships, their structural and kinematic style, and select key areas where to perform the various geophysical surveys.
To quantify vertical topographic variations while minimizing the influence of minor surface irregularities, we generated swath profiles on the LiDAR-derived DTMs, oriented as orthogonally as possible to the average trend of the morphological escarpments. The profile traces were created using the QGIS ver. 3.40 platform (GNU General Public License) and subsequently imported into SAGA GIS 7.8.2, along with the Digital Terrain Model used as the base layer. Profiles were computed using swaths of varying widths and vertical exaggerations (relative values are indicated in the figures; where not clearly specified otherwise, vertical exaggeration is = 1), allowing the visualization of maximum, average, and minimum elevation profiles. The resulting data were then exported back to QGIS for graphical representation. Coordinates of the start and end points of the swath profiles are provided in Table 1.
Direct investigation of active and capable faults through boreholes and/or paleoseismological trenching can be extremely difficult, if not impossible, in densely urbanized areas such as the city of Florence. In the area of our investigation, the ground surface is almost entirely covered by urban infrastructure, including buildings, roads, pipelines, and conduits, while the few remaining open spaces are typically small private gardens or environmentally protected green areas. For this reason, to image near-surface fault geometries and the affected stratigraphic units, we employed non-invasive geophysical techniques with varying resolution and penetration depth, including shallow high-resolution seismic reflection and electrical resistivity tomography (ERT) surveys. The combined use of these geophysical techniques represents, in this case, the only viable tools for subsurface investigation aimed at detecting and structurally characterizing the local active faults. Such an approach, in fact, has been proven especially valuable by extensive scientific literature in areas where the geological setting is obscured by anthropogenic structures and inaccessible to direct investigation (e.g., [33,34,35,36,37,38]). In the absence of stratigraphic boreholes, the approximate age of deformed (or undeformed) horizons was estimated by comparing their seismic signatures, or those of underlying layers, with those of stratigraphic units of known age in the area.
ERT surveys are easier to carry out and less expensive than high-resolution near-surface seismic reflection investigations, and are less invasive. They can more readily cover lengths that would be logistically demanding for seismic surveys. However, their resolution in imaging subsurface structures is significantly lower than the high vertical resolution of seismic reflection methods. Moreover, ERT is not affected by mechanical vibration, so they can provide abundant fault information in urban areas, where this kind of background noise can be high. For this reason, in those places where surface geological or geomorphological investigations did not provide sufficiently precise information on the existence and location of potential tectonic structures, an initial ERT profile was carried out in the area of interest. Subsequently, targeted seismic reflection surveys were performed in those sectors where the geoelectrical interpretation revealed anomalies suggestive of tectonic structures. This approach made it possible to obtain detailed seismic sections even in areas where surface conditions did not allow for the precise localization of faults.
The shallow high-resolution seismic reflection data were acquired and processed by GEO-ENERGIZERS S.N.C. (Altopascio, LU, Italy), while the ERT profiles were acquired and processed by TRIGEO S.N.C. (Soci, AR, Italy).
The ERT profiles were acquired using a SYSCAL georesistivimeter (IRIS Instruments, Orléans, France) equipped with 96 electrodes and 10 channels, with a fixed electrode spacing of 10 m. To achieve the best possible imaging results, different electrode array configurations were tested, including Wenner–Schlumberger, Pole–Dipole, and Dipole–Dipole. Data processing was performed using the commercial software Res2DInv® (ver. 3.57, Geotomo Software®), while the merging of different sections was carried out with ViewLab (ver. 2004, ErtLab).
Seismic profiles were acquired using either fixed-line geometry (2D) or the MARW (Multichannel Analysis of Reflected Waves, 1D) technique, with a -seismograph SARA Do.Re.Mi. (SARA electronic instruments s.r.l., Perugia, Italy). Vertical geophones (100 Hz) and horizontal geophones (4.5 Hz) were deployed at spacings of 1–2 m for the 2D method (96 to 120 channels). The energy sources were hammers weighing 10 and 35 kg. Data were recorded over a duration of 1 s, with a sampling interval of 1–2 milliseconds. In some cases, multi-stacking was applied to improve the signal-to-noise ratio. Data wereelaborated with Seismic Unix software (ver. 44 Release 4).
In the figures presented in this article, seismic sections are shown with tectonic interpretations and established seismofacies. In the Supplementary Materials Figures S11–S19, the same sections are also provided in their non-interpreted form, displayed in both point-density and wiggle modes, and with their original depth scale. Due to persistent traffic noise in urbanized areas, signal acquisition was occasionally affected; in such cases, different wave velocities were processed to help filter out local noise. The interpretation of the 2D seismic sections was supported by cross-referencing local stratigraphy derived from geological mapping and nearby borehole data, allowing for the identification of seismofacies characterized by approximately uniform seismic wave velocities.
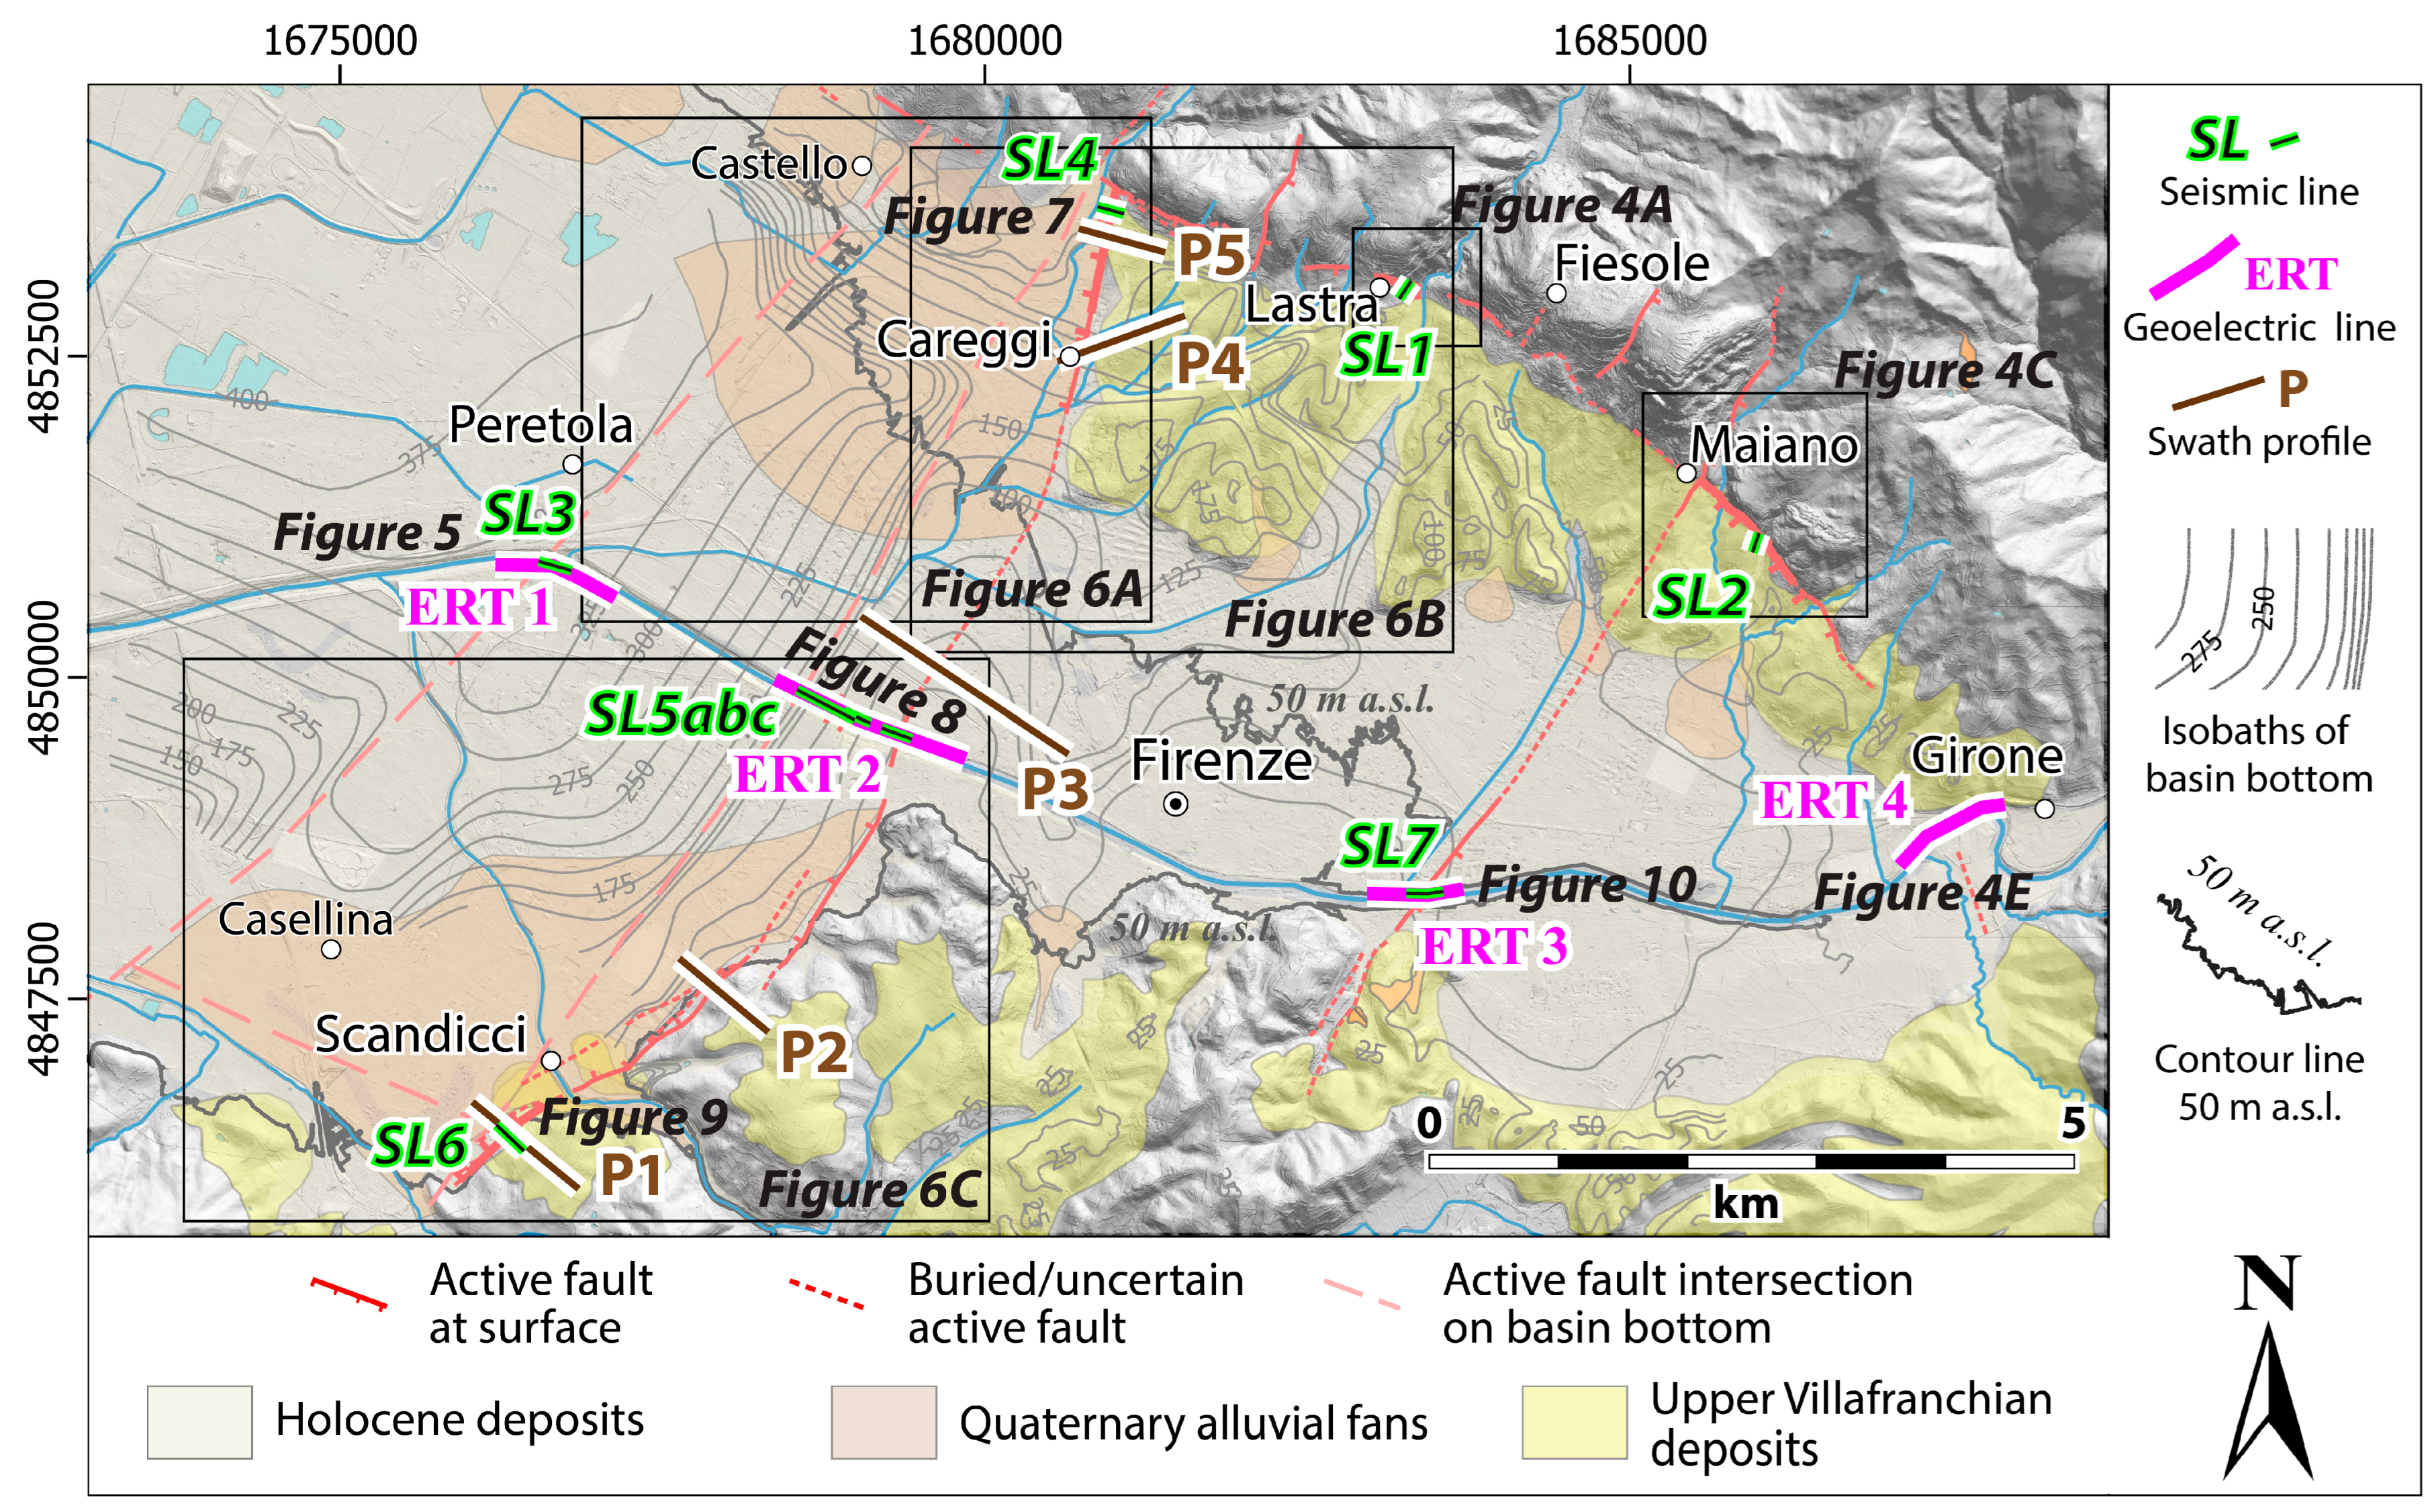
Following the selection of the most promising sites during the geological and geomorphological analysis, nine seismic reflection lines and four ERT profiles were acquired across the most prominent faults within the urbanized area (Figure 2A). The basic parameters of the geophysical investigations, including the coordinates of the starting and ending points, are listed in Table 2 and Table 3.
All data were collected, organized, and processed within the QGIS platform, using the EPSG:3003 Monte Mario/Italy Zone 1 reference system, in which the coordinates shown in the figures are expressed. This reference frame was chosen as it is officially adopted by Tuscany Region.
Apart from using QGIS to organize information and maps on a georeferenced system, the only other use was to generate swath profiles on LiDAR-derived DTMs, as described above.
About the instrumentation utilized to perform ERT (electrical resistivity tomography with resistivity measurements), a SYSCAL Pro 96-electrode 10-channel georesistivimeter was used. Different arrays were adopted depending on the problem to be investigated: in general, the most used were Schlumberger, Wenner and Dipole–Dipole, but we also used the Pole–Dipole array. For section ERT2, Schlumberger and concatenated Dipole–Dipole arrays were used. The Res2DInv® (ver. 3.57, Geotomo Software®) was used for data processing, and the ViewLab software (ver. 2004, ErtLab), used for 2D and 3D inversion, made it possible to obtain a three-dimensional resistivity model for the data gathered from 2D electrical measurements.

3. Results

This section presents the results of the geomorphological and geophysical investigations on the Quaternary faults directly affecting the Florence sub-basin (see Figure 2A and Figure 3). The faults are described beginning with the northernmost one, the Fiesole Fault, as it is considered part of the main master fault of the FPB. This is followed by the transverse faults, described from west to east: the Peretola, Scandicci, and Maiano faults.
Some figures, included for illustration purposes but not essential to the main text, or presented in larger format for improved readability, are provided in the Supplementary Materials, Figures S1 and S2, etc. Non-interpreted versions of the seismic sections, shown both in point-density and wiggle modes, are provided in the Supplementary Materials, Figures S11 and S12, etc.

3.1. The Firenze-Prato Fault

The Firenze–Prato Fault, which borders the southeastern part of the FPB, displays at least two abrupt changes in its trend where it intersects NE–SW-trending transverse structures. The main discontinuity in the basin’s master fault occurs between Prato and Calenzano, where the fault system exhibits an apparent left-stepping offset of approximately 2 km, accompanied by a marked change in relief elevation (Figure 2A).
West of this intersection, the Prato Fault (approximately 4.5 km long) forms a well-defined, fault-controlled mountain slope, with a scarp visible in the LiDAR-derived DTM. In contrast, east of this discontinuity, the fault, referred to here as the Sesto Fiorentino Fault, shows no clear evidence of present-day activity, and its trace is mostly buried beneath Upper Pleistocene–Holocene deposits.
A second significant disruption in the lateral continuity of the master fault system is caused by its intersection with the Scandicci Fault near Careggi (Figure 2A). Southeast of this point, the Fiesole Fault (approximately 8 km long) bounds the Florence sub-basin to the north. Although the Fiesole and Sesto Fiorentino segments have only slightly different orientations, they are clearly distinct in terms of morphological expression, particularly in the height of the fault-related relief and the steepness of the fault-controlled slope.
In summary, among the master fault segments, only the Prato and Fiesole faults show limited geomorphological evidence of Late Quaternary tectonic activity (although discontinuous), whereas the Sesto Fiorentino Fault appears relatively less active. This suggests that the master fault is segmented and does not behave as a single, continuous structure.

Fiesole Fault

As described above, the northern boundary fault of the basin near Florence comprises a system of fault strands arranged in a step-like geometry that has produced the uplift of the Fiesole ridge (Fiesole Fault). The tectonic relief associated with this fault is approximately 150 m. Only the northern part of the flight of fault steps reaches the surface. Most of it is currently buried beneath the Villafranchian fluvio-lacustrine deposits south of Fiesole. However, the presence of the buried fault strands is confirmed by geoelectric surveys [9,10,39] and boreholes that have reached the bedrock [8]. Toward the southeast, the fault is inferred to continue in a roughly N–S direction along the base of the Chianti Mountains [1].
The Fiesole Fault displays geomorphological evidence of recent tectonic activity only along specific segments, such as valleys perched on the footwall (feature h in Figure 4C and Figure S2), or a fault scarp at the base of the slope (Figure S3). These indicators, however, disappear abruptly along adjacent fault segments. The lateral continuity of the Fiesole Fault is, in fact, disrupted by several transverse structures that intersect its trace. Additionally, the widespread erosion and removal of Villafranchian fluvio-lacustrine sediments on the hanging wall, often visible (Figure 4A,C, Figures S1 and S2), further supports the interpretation of an extremely low vertical slip rate in recent times.
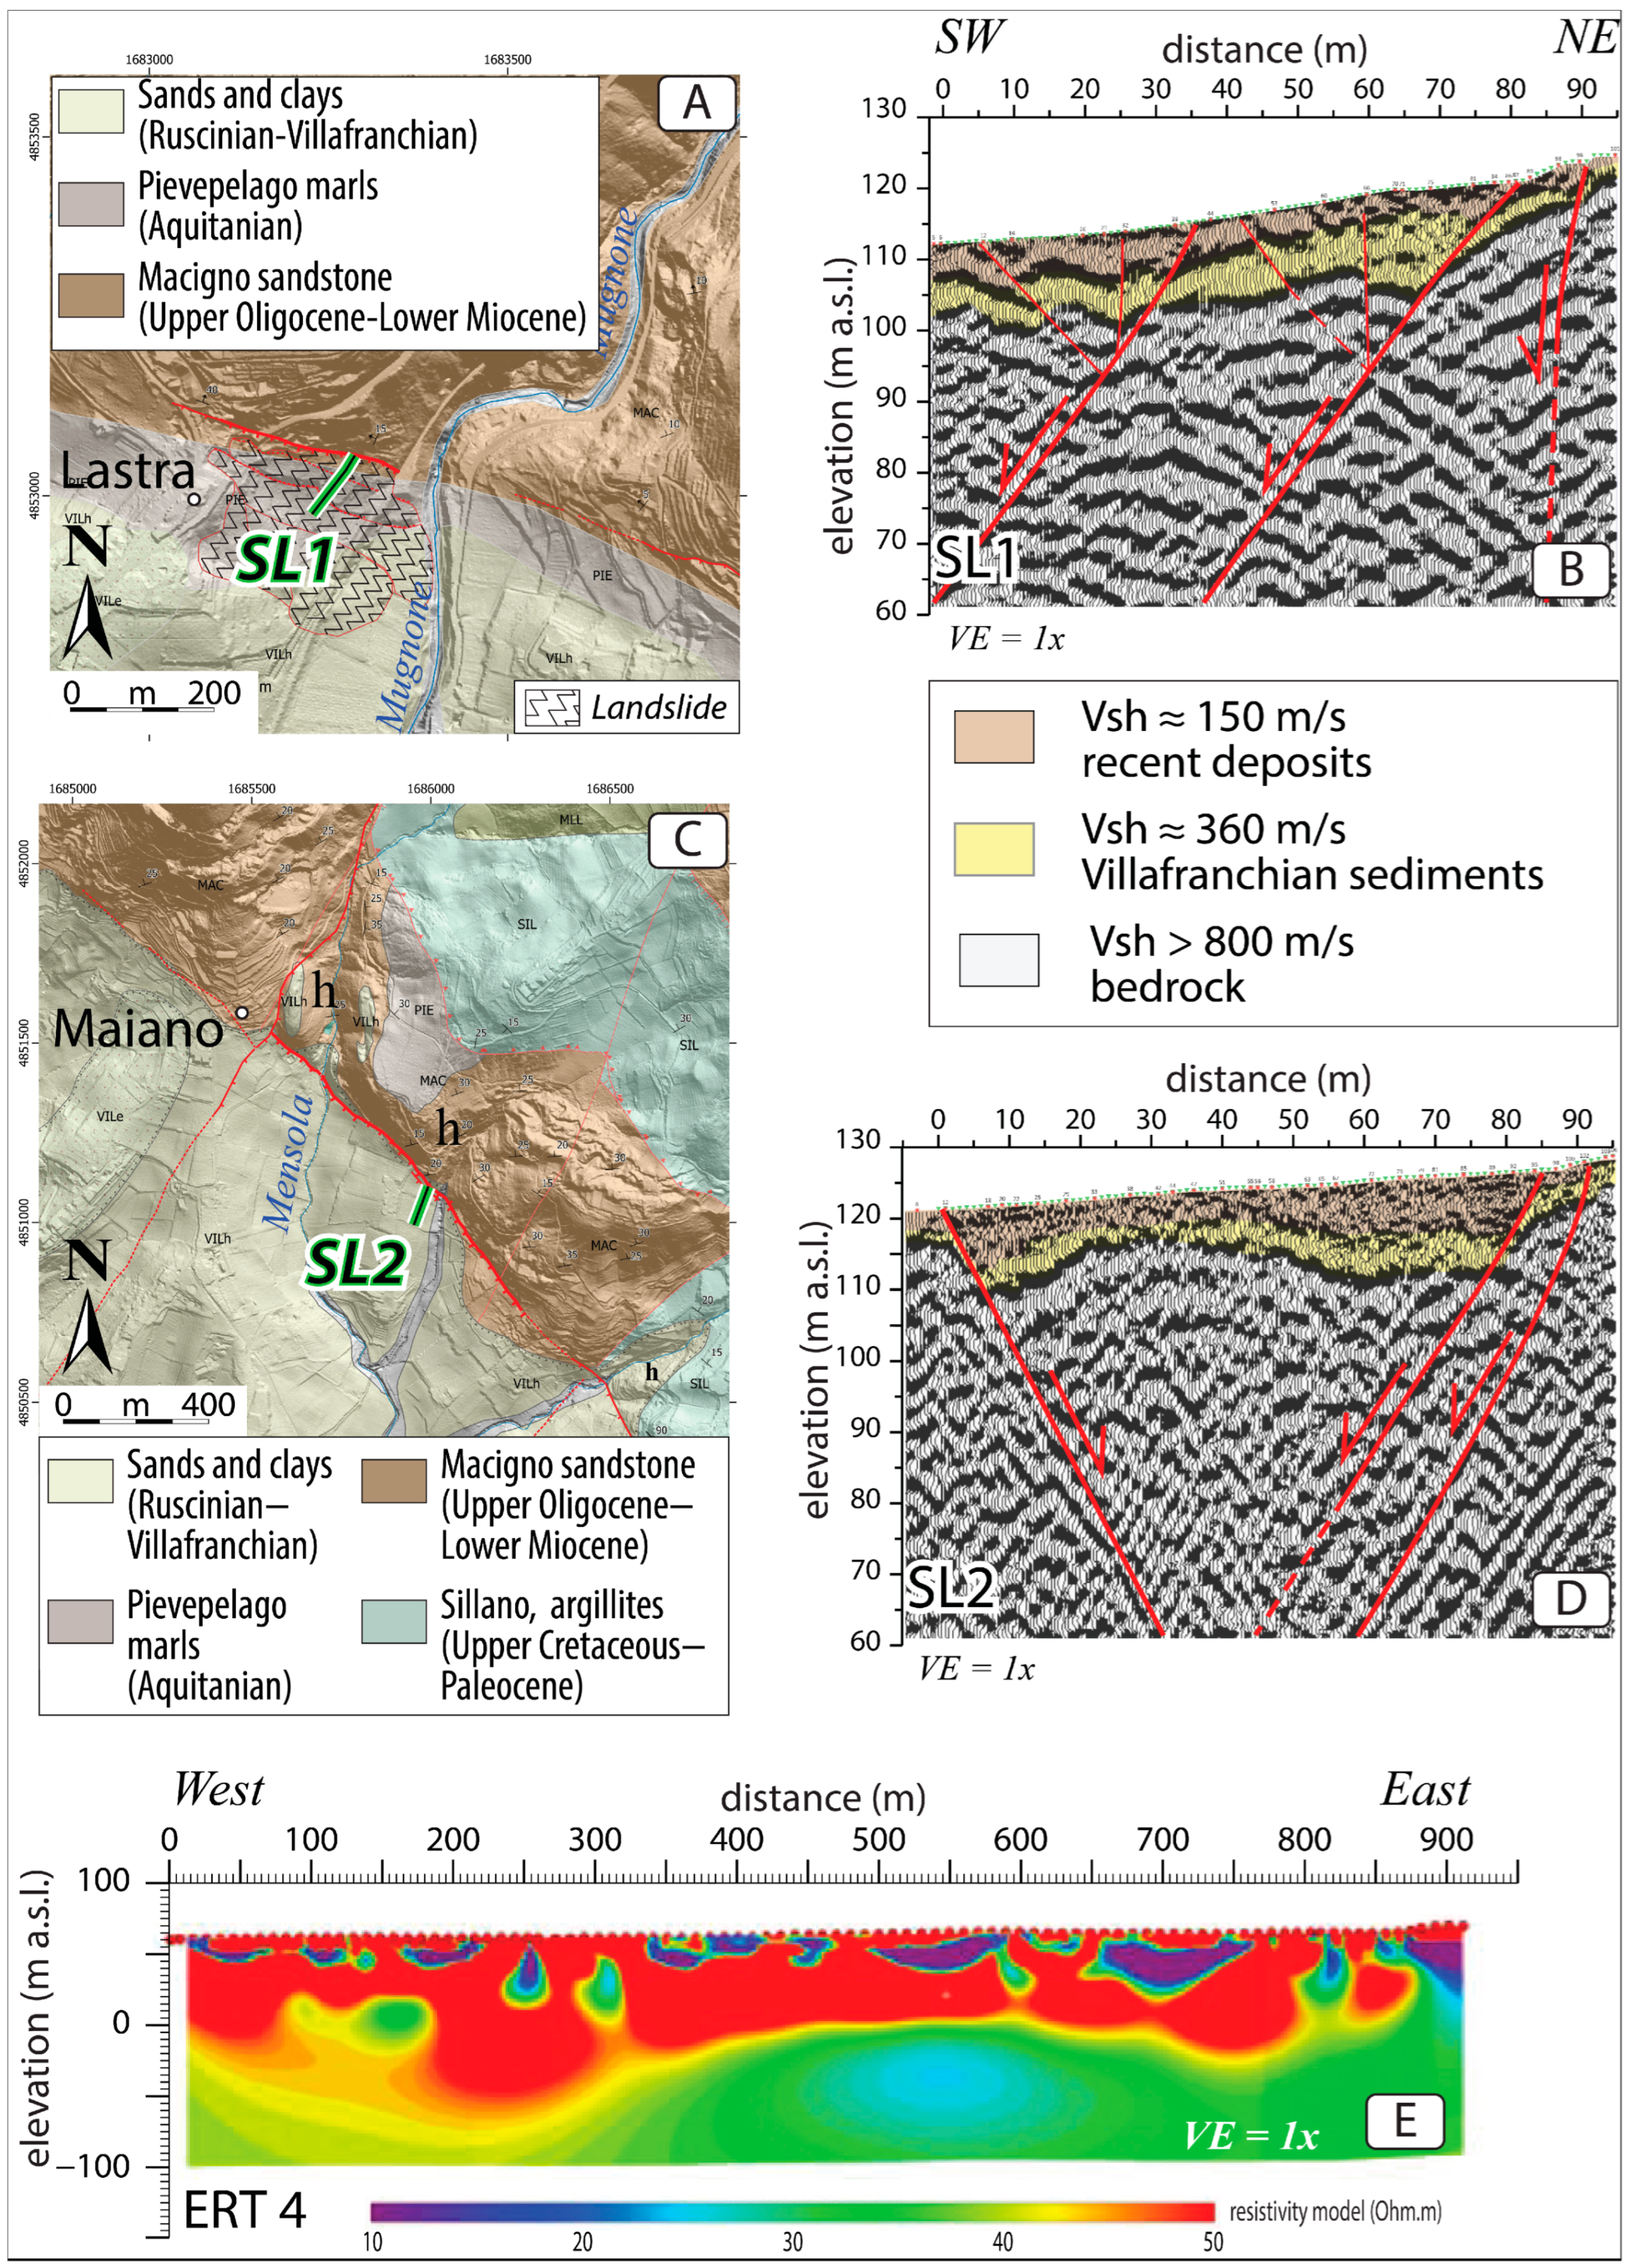
To verify the fault’s location and geometry at depth, to identify the stratigraphic horizons affected by faulting, and to assess any signs of recent activity, we acquired two high-resolution seismic reflection profiles (SL1 and SL2 in Figure 3 and Figure 4), oriented approximately perpendicular to the fault trace. These profiles were located in areas where morphological indicators of recent tectonic deformation are better expressed. Due to logistical constraints, both profiles were acquired exclusively on the hanging wall, starting at the base of the fault scarp, as the footwall consists of a steep, rocky slope that was inaccessible for survey deployment.
  • Seismic profile SL1
At the locality of La Lastra (Figure 4A,B), the main fault plane is clearly identifiable, forming a distinct morphological step at the surface. Its coincidence with a prominent escarpment not attributable to lithological changes initially suggested recent tectonic activity. To investigate this, a seismic profile (SL1) was acquired, oriented perpendicular to the rock escarpment.
The near-surface fault zone appears to span a width of approximately 30 m, with the main fault plane exhibiting a subvertical dip. The profile also reveals the presence of at least two parallel fault planes displacing both the Villafranchian surface deposits and the overlying slope deposits (Figure 4B). These deposits appear significantly disturbed, showing both normal and reverse offsets.
This deformation in the hanging wall deposits is interpreted as the result of a landslide, which likely exploited the fault as a lateral sliding surface. Consequently, we interpret the surface escarpment, initially considered as fully tectonic, and the coexistence of normal and reverse faulting at shallow depth as expressions of gravitational deformation, rather than recent tectonic activity.
  • Seismic profile SL2
West of Maiano (Figure 3), the Fiesole Fault displays its most distinct geomorphological evidence of recent tectonic activity (SL2, Figure 4C,D). The seismic profile acquired at this location confirms that the fault displaces the hanging wall slope deposits and demonstrates that the observed morphological step corresponds to one of the main fault planes, which is clearly imaged at depth. These observations support the interpretation of active slip along this segment of the fault. The near-surface fault zone appears to be approximately 25–30 m thick. Additionally, a minor antithetic fault is visible to the south.
  • Geoelectric tomographic profile ERT4
Toward the southeast, the Fiesole Fault loses a clear morphological expression at the surface. To investigate its potential continuation in this direction, we conducted a 900-m-long 2D geoelectrical tomographic survey along the banks of the Arno River, across the area where the fault’s extension could be expected (Figure 3). The results are presented in Figure 4E.
In the resulting 2D section, the upper resistive layer, ranging between 50 and 100 m in thickness, shows lateral variability, but changes occur gradually, without sharp discontinuities that might indicate the presence of an active fault. Furthermore, the tomography does not appear to have imaged the underlying resistive bedrock. We interpret the observed variations in thickness as the result of normal fluvial deposition over an eroded and smoothed paleosurface.
High-resolution seismic reflection imaging may help determine whether tectonic activity has contributed to these changes, particularly the more pronounced anomaly around chainage 600 m. However, at present, such an interpretation appears unlikely. Taken together, the evidence from tectonic geomorphology and the geoelectrical survey suggests that this southeastern segment of the fault has not been active during at least the Holocene.

3.2. SW-NE Oriented Structures

3.2.1. Peretola Fault

It is a NW-dipping normal fault, parallel to the Scandicci Fault, extending from Castello in the northeast to Casellina in the southwest, and inferred in the bedrock by Coli and Rubellini [15] with its references (Figure 2 and Figure 3).
The marked westward deflection of the paleo-Arno and other drainage channels across this structure [9,10,39] (Figure 2A) suggests that this normal fault may reach the topographic surface. Indeed, the averaged (swath) topographic profile across both the Scandicci and Peretola faults shows an additional offset of 2–4 m along the Peretola Fault, contributing to a total vertical change in elevation of about 6 m between the Florence sub-basin and the central part of the basin (Figure 2B).
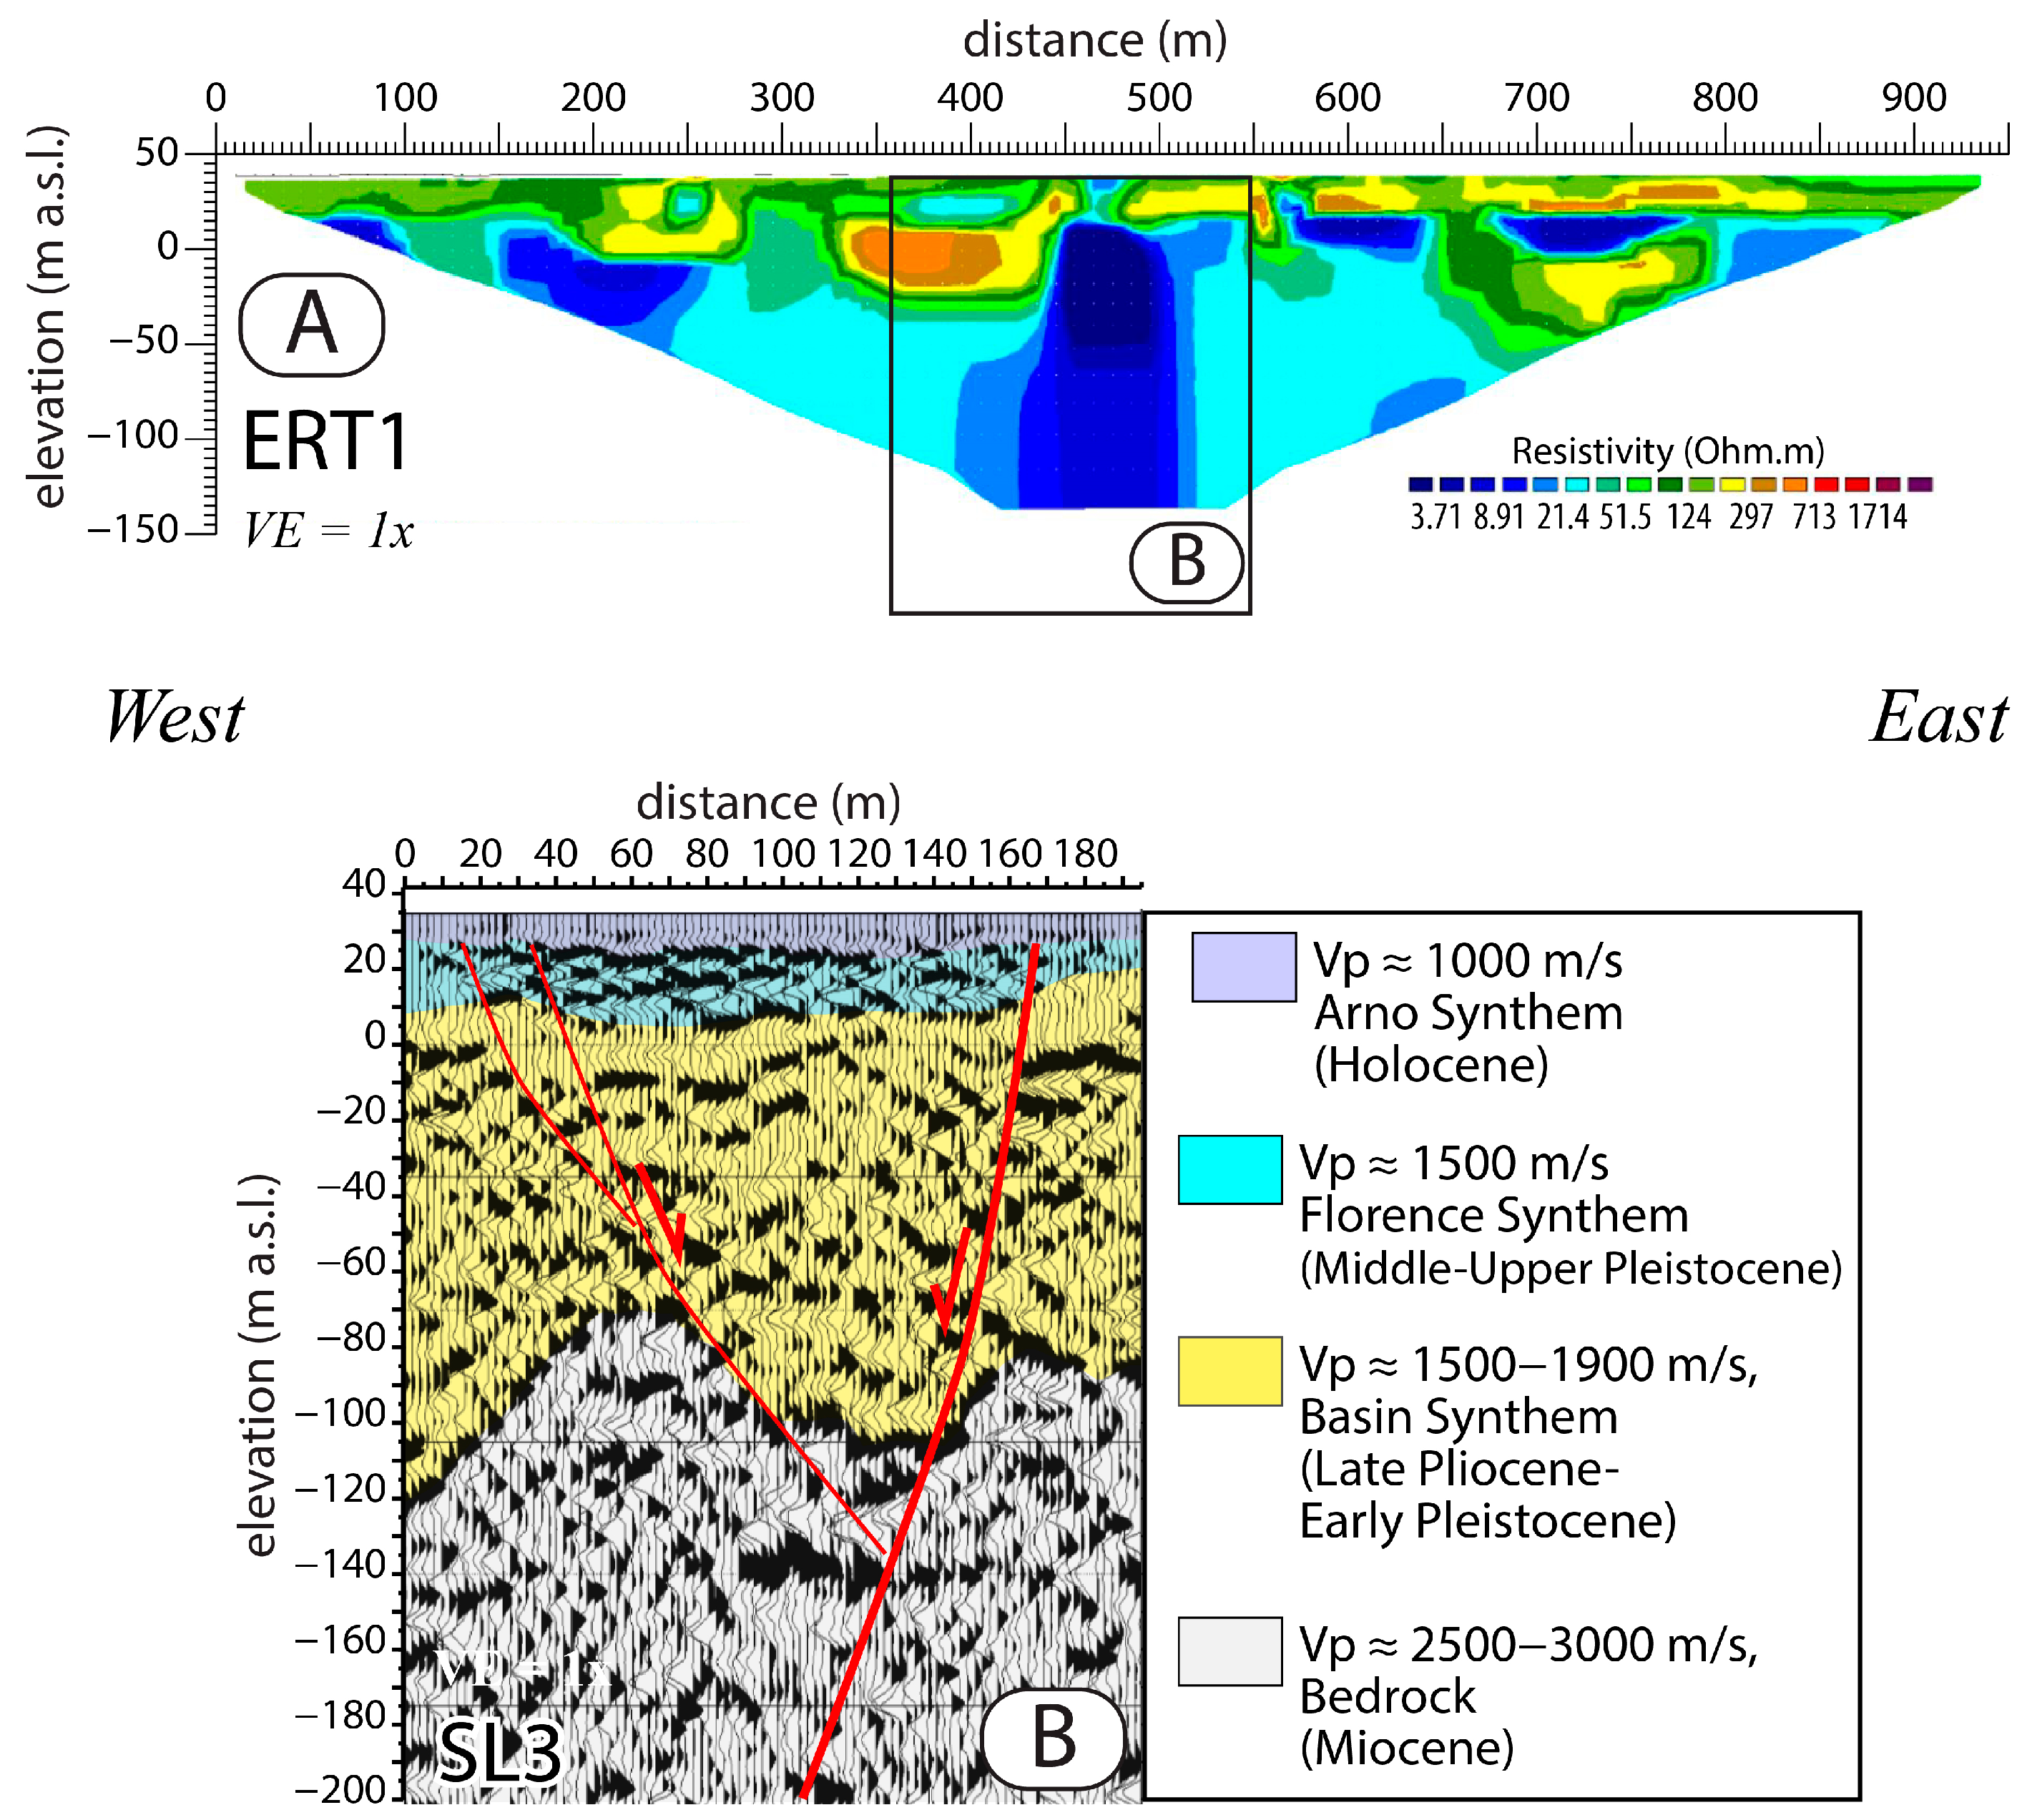
To verify the possibility that this fault is active and capable, we conducted a geophysical survey, including both geoelectrical and seismic lines, across the presumed surface trace of the fault (Figure 3 and Figure 5).
Although the ERT profile is significantly affected by the presence of a large viaduct pillar, visible as a vertical low-resistivity anomaly in the center of Figure 5A, it still reveals a clear variation in the thickness of the resistive upper layers on the two sides of the anomaly. The seismic profile, acquired at the same location (Figure 5B), shows the presence of a NW-dipping normal fault, less prominent than the Scandicci Fault, and associated with an antithetic fault.

3.2.2. Scandicci Fault

The Scandicci Fault is a NW-dipping normal fault that extends across the basin from Careggi in the north to Scandicci in the south, beneath the urban area of Florence (Figure 2 and Figure 3). It likely originated at an early stage of the basin’s growth, during the Late Miocene, prior to the creation and subsidence of the FPB [14,21,22]. This structure is also referred to as the Castello-Scandicci Fault [14,15,21,22] or the Scandicci-Terzolle Fault [1].
The top of the pre-Pliocene bedrock, interpolated based on more than 1900 well logs, shows an abrupt elevation change at the fault trace, where basin sediments deepen sharply towards the northwest [14,15,16,21] (Figure 3). Coli and Rubellini [21] estimate a vertical throw of approximately 300 m since the Early Pliocene, although they do not specify whether the fault is currently active. Notably, the Scandicci Fault is absent from Italian active fault and seismogenic source databases, including ITHACA and DISS 3.3.0 [2,3] (Figure 1B).
Within the basin, the Scandicci Fault produces a geomorphological escarpment in the Holocene deposits of the plain, with the expression of this relief varying depending on the proximity to the Arno River, which continuously erodes the fault-generated landforms (Figure 2, Figure 3 and Figure 6). The intersection between the Scandicci Fault and the master fault north of the basin is complex: the Scandicci Fault clearly interrupts the lateral continuity of the Fiesole Fault toward the northwest, effectively segmenting the master fault. Simultaneously, the Scandicci Fault’s morphological expression changes when crossing the master fault, so that beyond the basin, its continuation lacks clear geomorphological evidence.
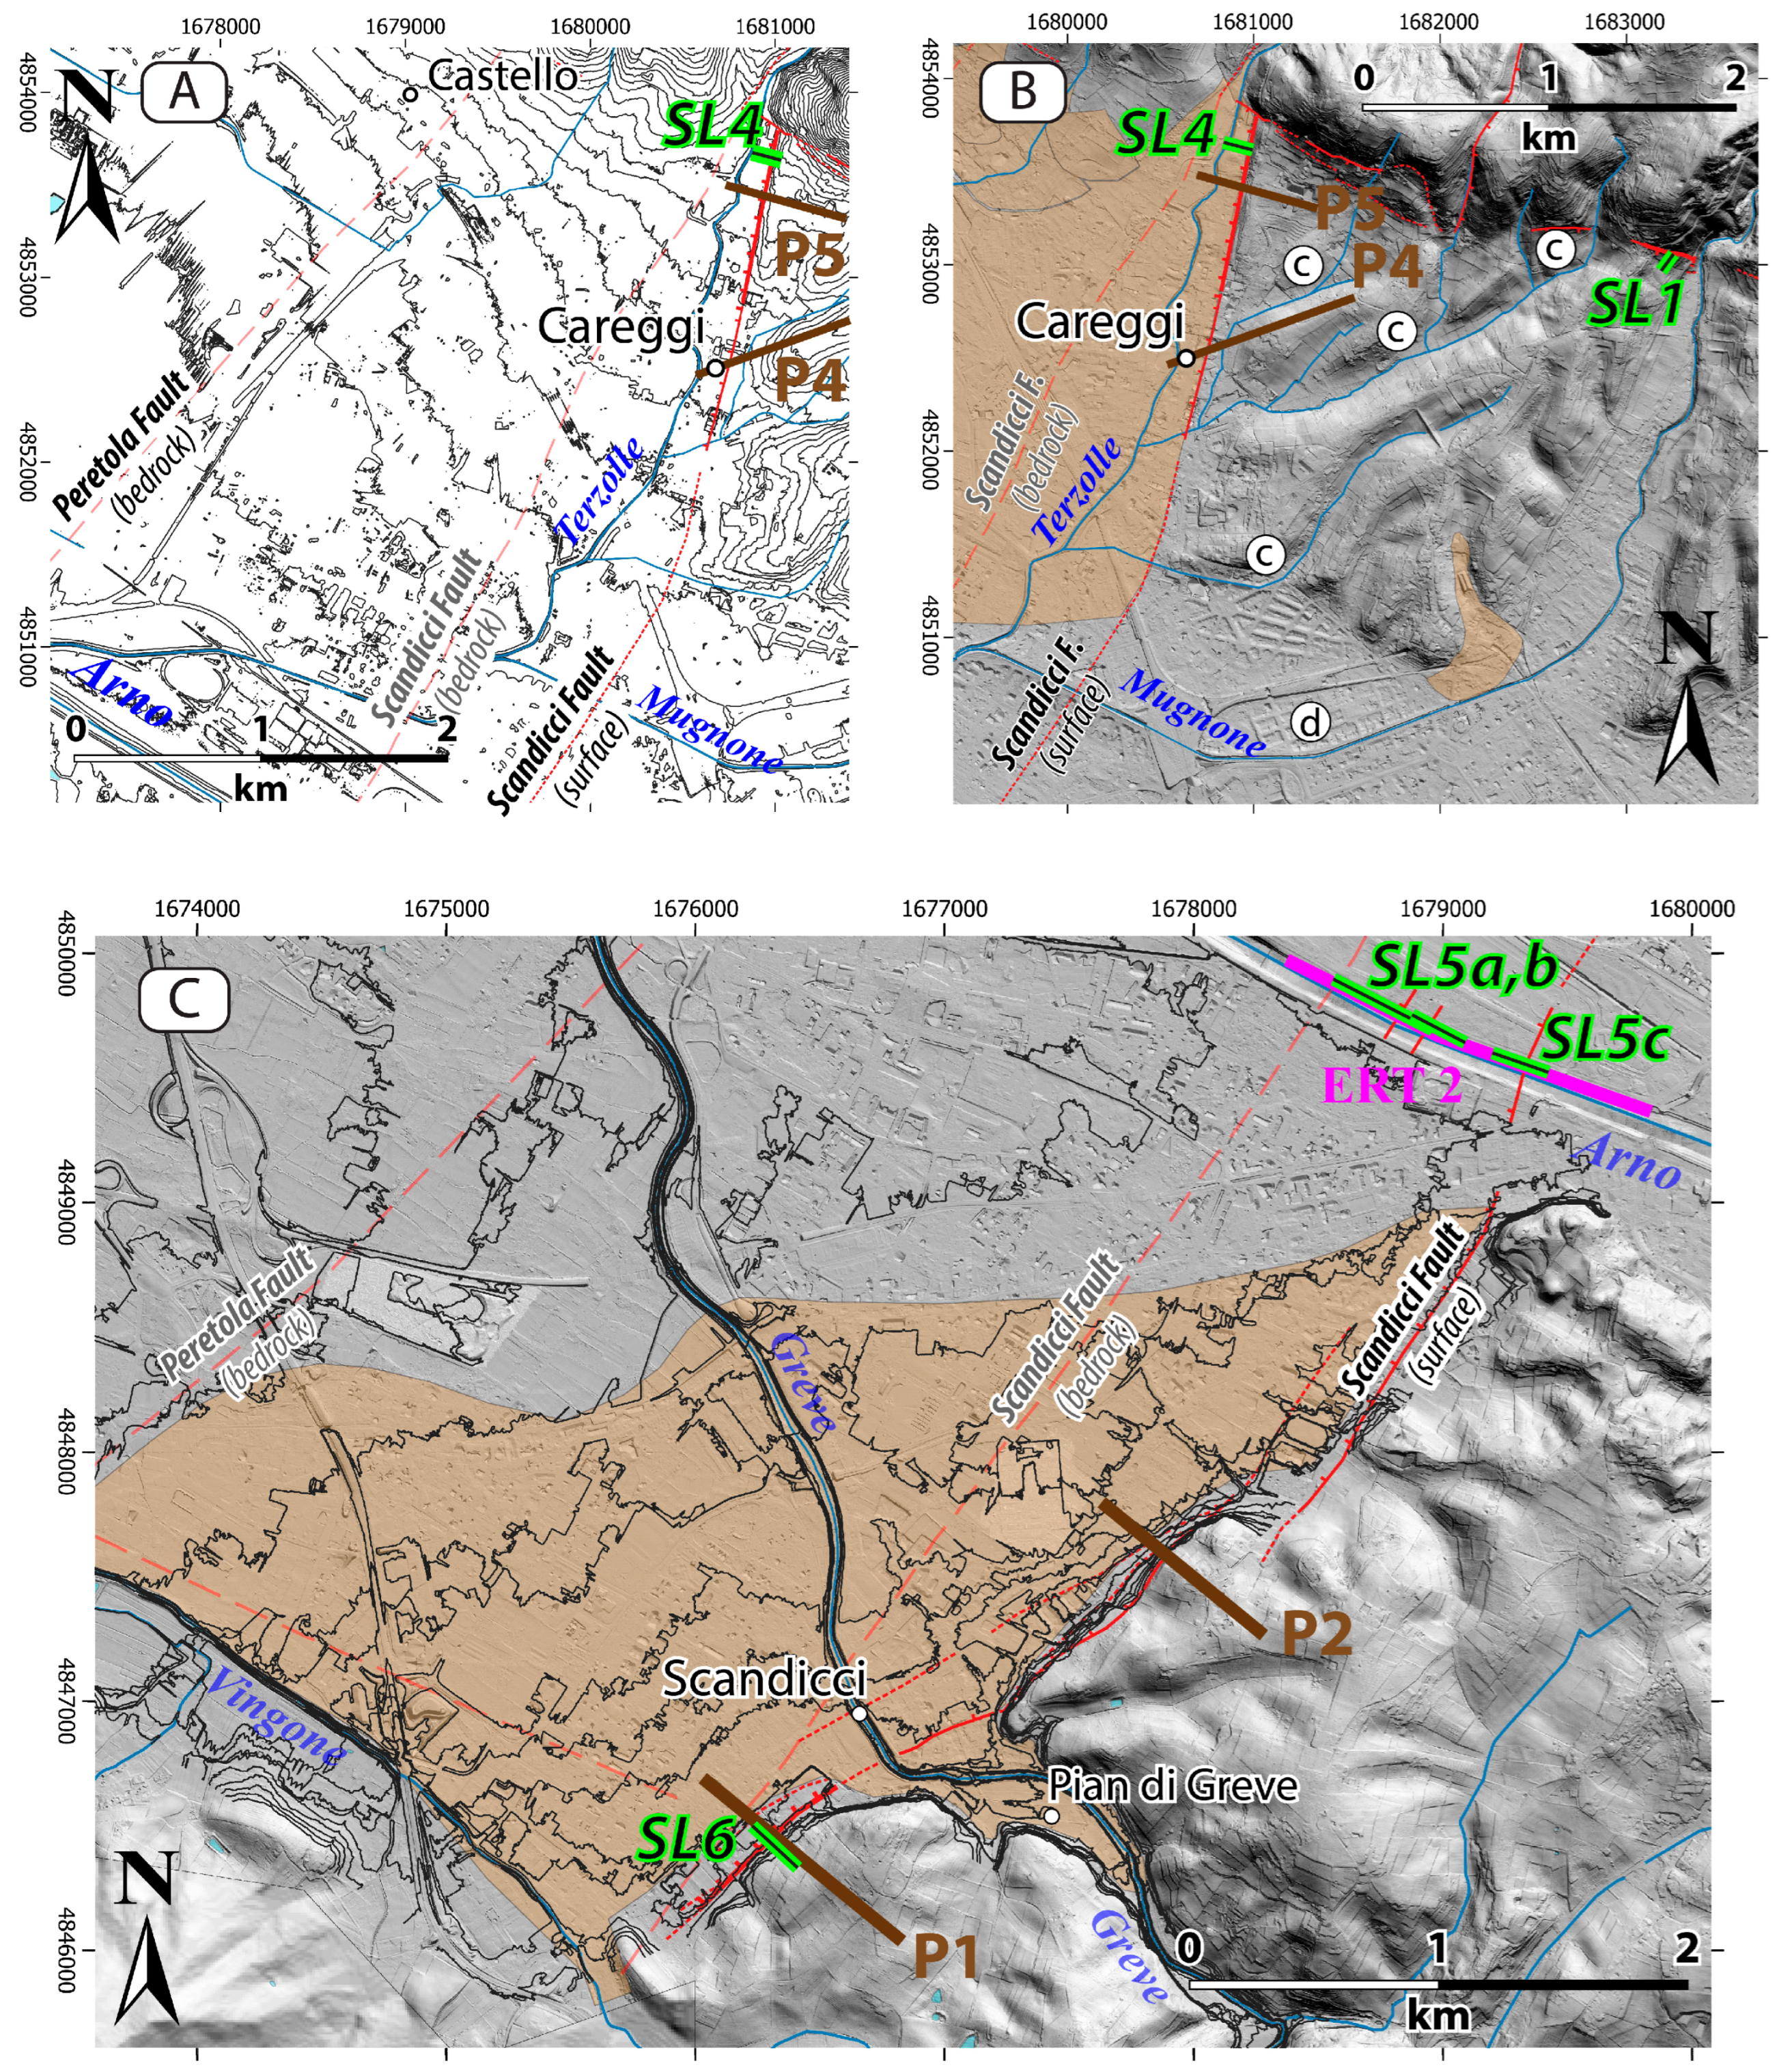
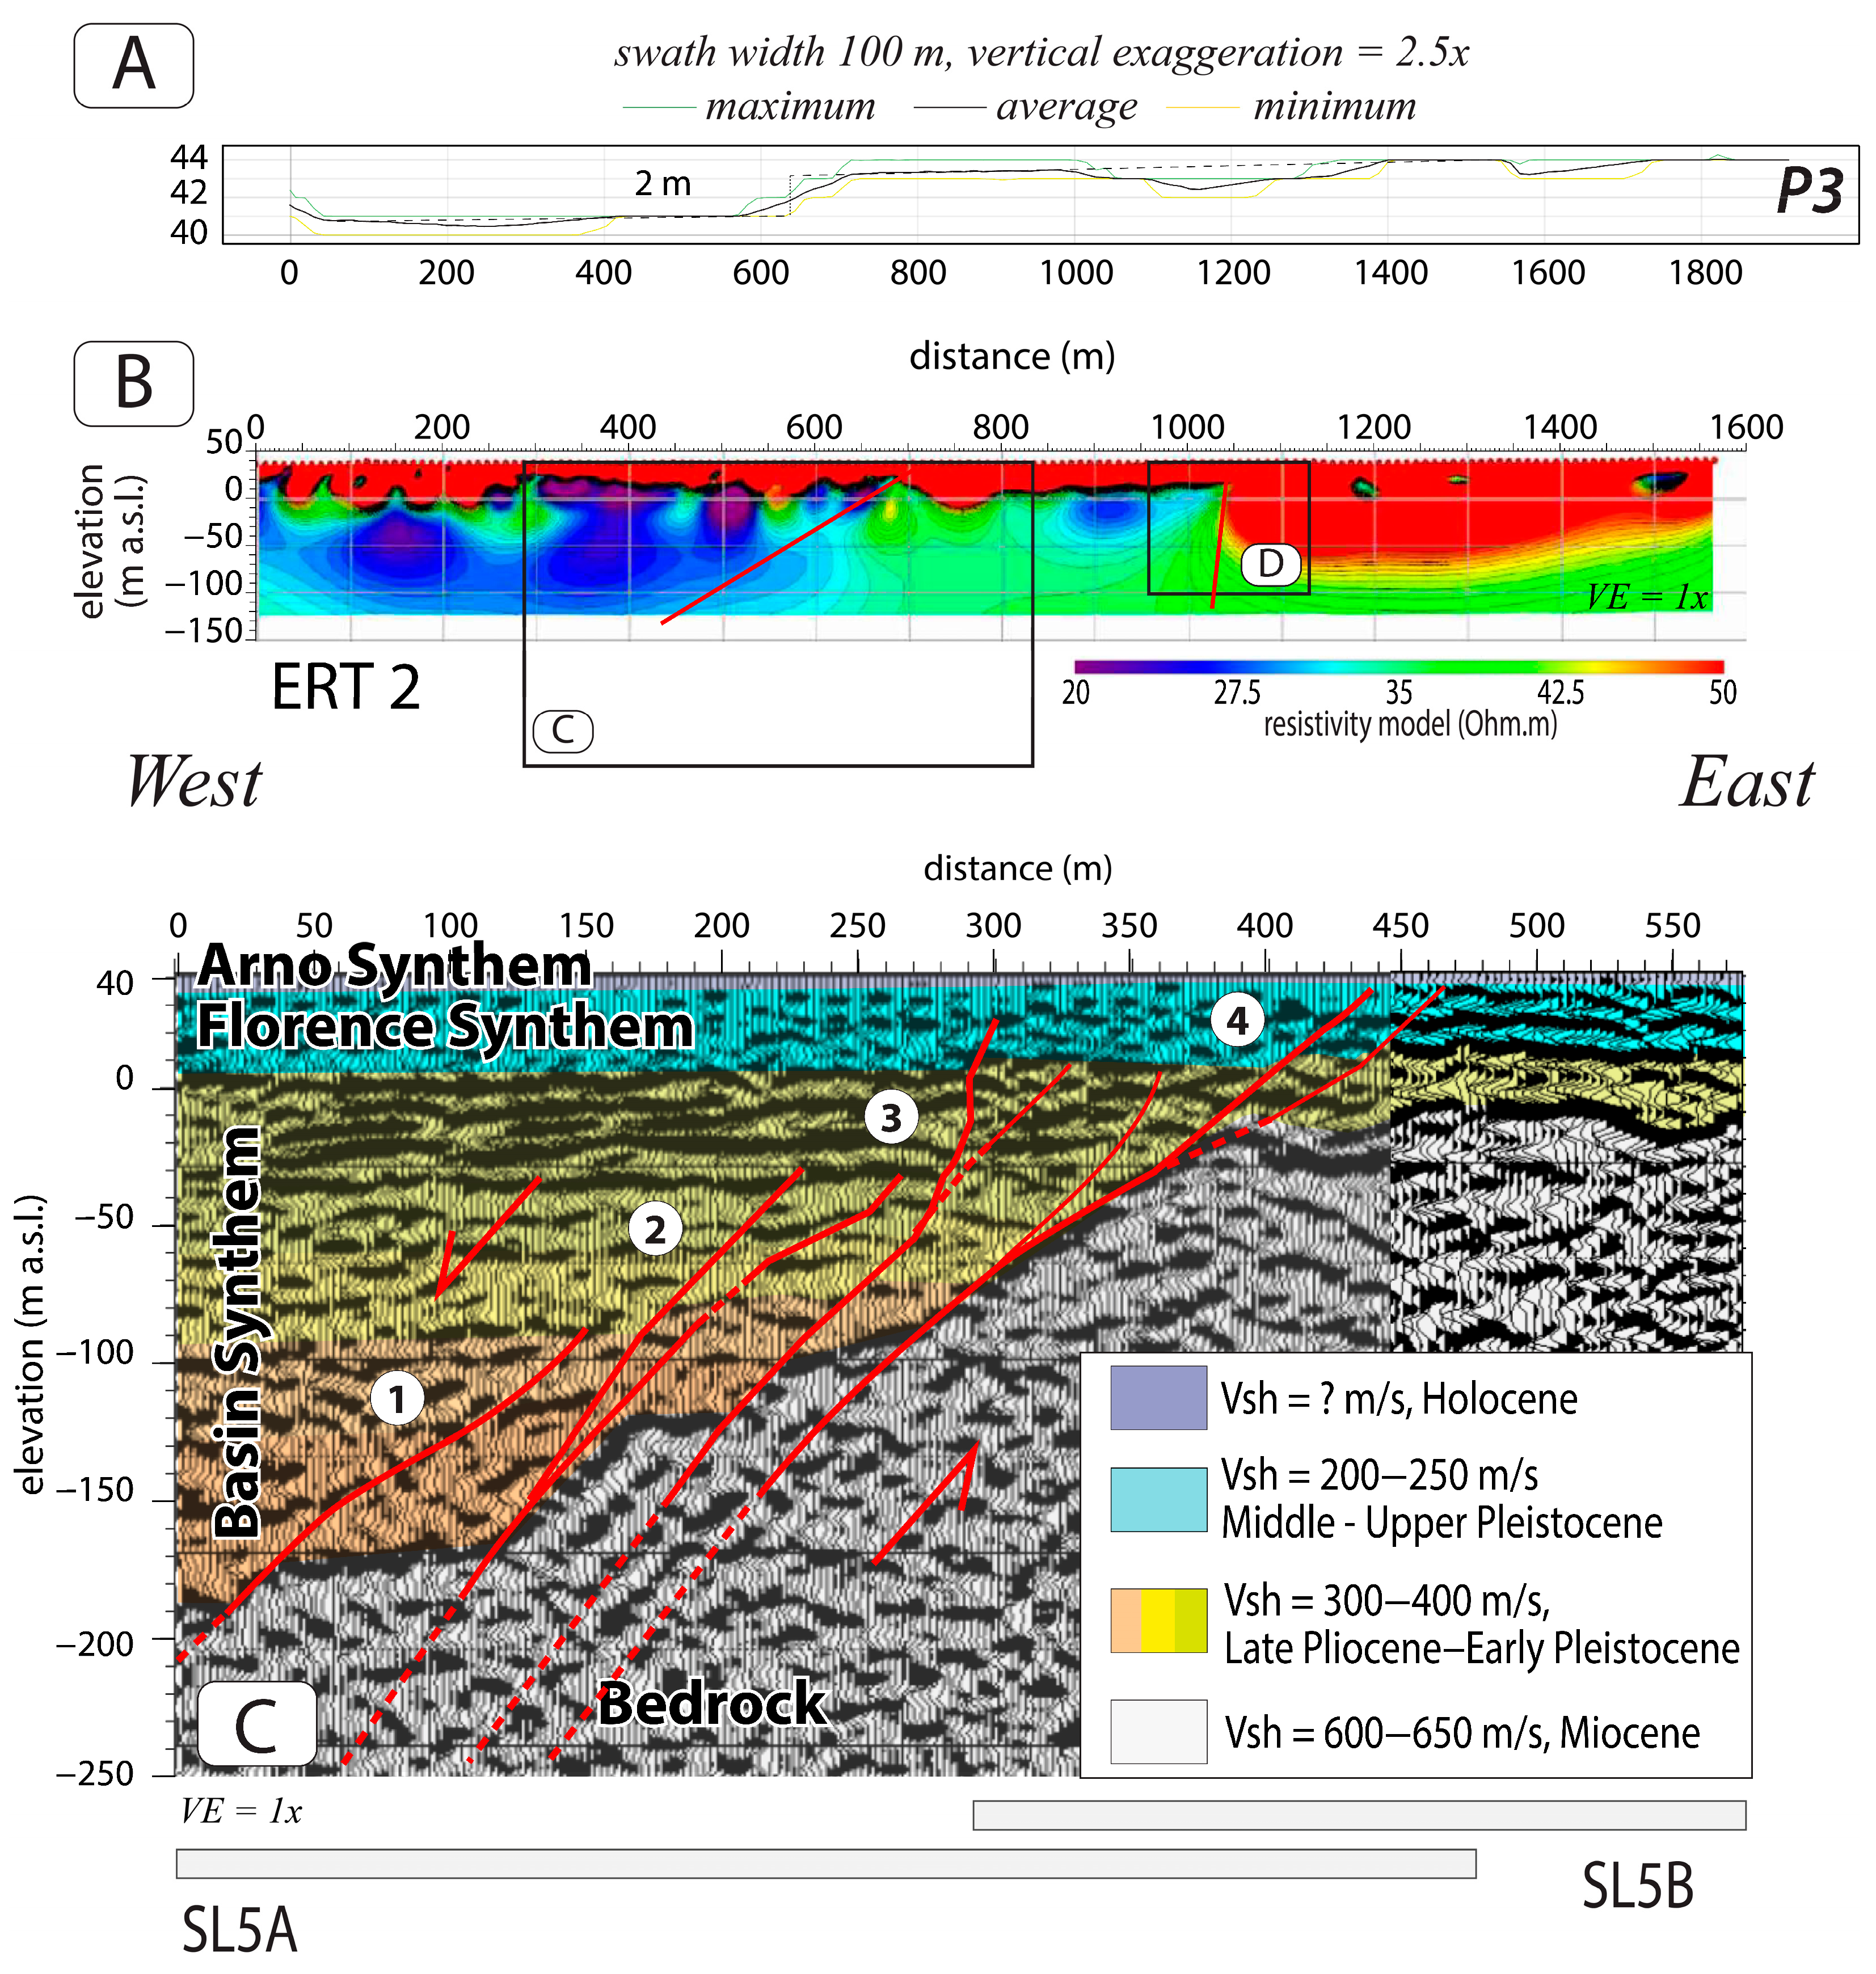
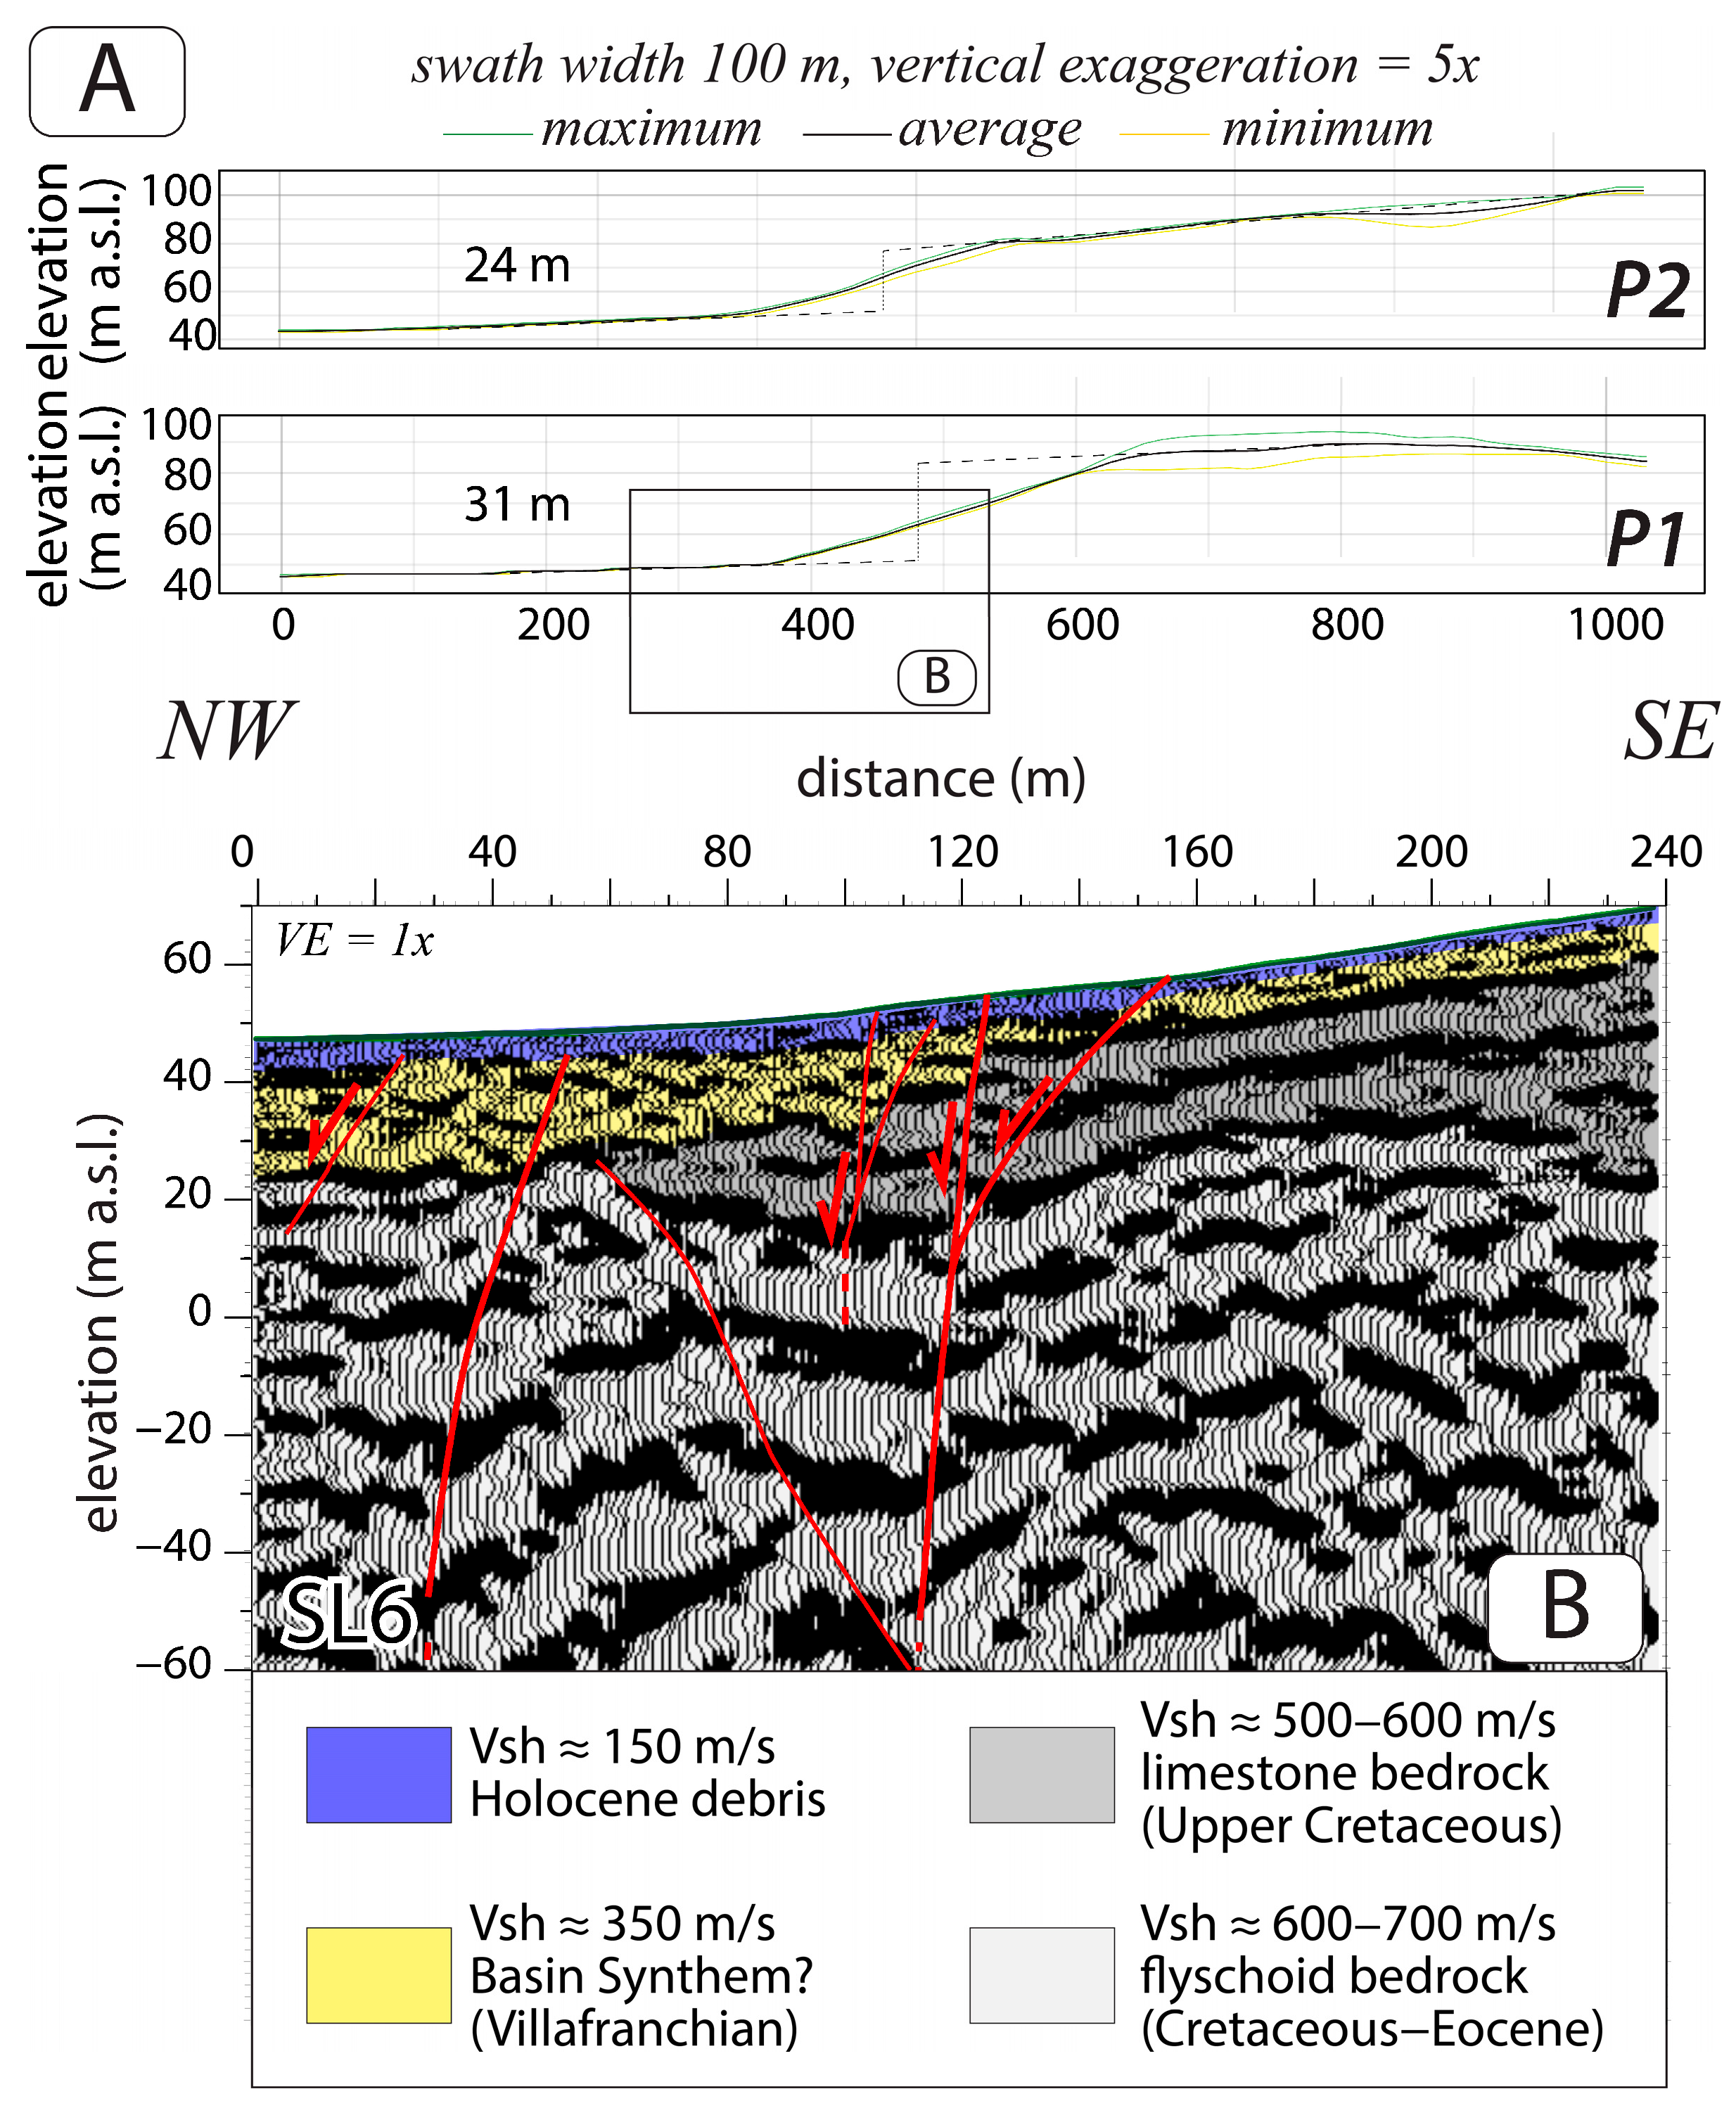
To characterize the morphology and quantify the height of the Scandicci Fault scarp within the basin, five swath profiles were generated at key localities along the fault trace (see locations in Figure 3). These averaged profiles (Figure 6, Figure 7A, Figure 8A and Figure 9A) reveal the minimum cumulative vertical displacement of the fault since the formation of the Upper Villafranchian terraces (considering the Villafranchian ended approximately 1 My ago [40]). The scarp height varies from about 10 m in the northern sector to roughly 30 m in the southern sector, with an average of around 20 m. A similar swath profile was tentatively traced across the presumed fault trace in the urbanized Holocene alluvial plain (profile P3 in Figure 8A). Although less reliable due to numerous anthropogenic modifications, a vertical step of approximately 2 m can still be identified.
Several geophysical surveys were conducted perpendicular to the mapped fault trace, where morphotectonic features were most pronounced. Integrating results from multiple geophysical methods helped reduce ambiguities in the interpretation of subsurface stratigraphy and structures. Specifically, one 2D electrical resistivity tomography and six high-resolution seismic reflection profiles were acquired in three separate areas near the fault terminations and the basin centre (see Figure 3). The results of these investigations are presented in the following sections from north to south, first the geomorphological and then the geophysical ones.
  • Tectonic geomorphology along the Scandicci fault
North of the Arno River, in the Careggi area, the fault displays a well-defined, nearly straight cumulative scarp that gradually diminishes moving southward toward the Arno River (Figure 3 and Figure 6A,B). This scarp separates the terraced Upper Villafranchian paleosurface to the east from the Holocene basin plain to the west. It also marks the southern limit of the Upper Pleistocene–Holocene Terzolle alluvial fan, which presents a regular and well-developed morphological surface (Figure 6A). Regressive erosion caused by footwall uplift has led small creeks to incise into the hanging wall paleosurface, capturing and diverting streams originally flowing southward toward the southwest (points c in Figure 6B). The artificial diversion of the Mugnone River in the 16th century (point d in Figure 6B) likely took advantage of one of these natural flow paths, redirecting it along the lower course of the Terzolle Creek. West of the fault, the course of the Arno River hangs above the surrounding plain, bounded by levees, a further indication of the downthrow of the fault hanging wall during the Holocene.
Near the Arno River, in the basin’s centre, the surface geomorphological expression of the fault is nearly erased due to fluvial processes and extensive urban modifications over time. However, the regressive erosion caused by the vertical slip of the fault is still evident in the morphology (illustrated in Figure 3 by the 50 m a.s.l. contour line). The river deposits within the sub-basin appear beheaded, with the Scandicci fault marking the boundary between an erosional area to the southeast (footwall) and a depositional area to the northwest (hanging wall). West of the fault, the Arno River flows elevated above the surrounding plain, confined by levees, further indicating the downthrow of the fault’s hanging wall during the Holocene.
South of the Arno River, in the Scandicci area, the fault appears at the surface as a cumulative scarp formed by two fault segments arranged in a right-step pattern (Figure 6C). Recent fault movement has influenced the local drainage: the down-slip of the hanging wall created a wetland with anastomosed paleo-meanders and determined the formation of the Greve alluvial fan, and possibly also diverted the paleo-Arno toward the southwest (Figure 2A) [1,10]. Uplift of the footwall triggered regressive erosion of the Greve River, capturing the Ema and other minor streams [39]. The Greve alluvial fan is smaller and less pronounced than the Terzolle fan, with a gentler slope, and is beheaded at its outlet into the plain by the fault between Scandicci and Pian di Greve (Figure 6C). Along the fault’s southwestern margin, a possible additional active fault splay exists on the hanging wall, corresponding to the bedrock fault trace [9,21]. As the bedrock becomes shallower near the basin’s southwestern edge, the bedrock and surface fault traces converge. The wetland on the hanging wall suggests a higher vertical throw rate here than north of the Arno River.
  • Geophysical investigations
  • Careggi area
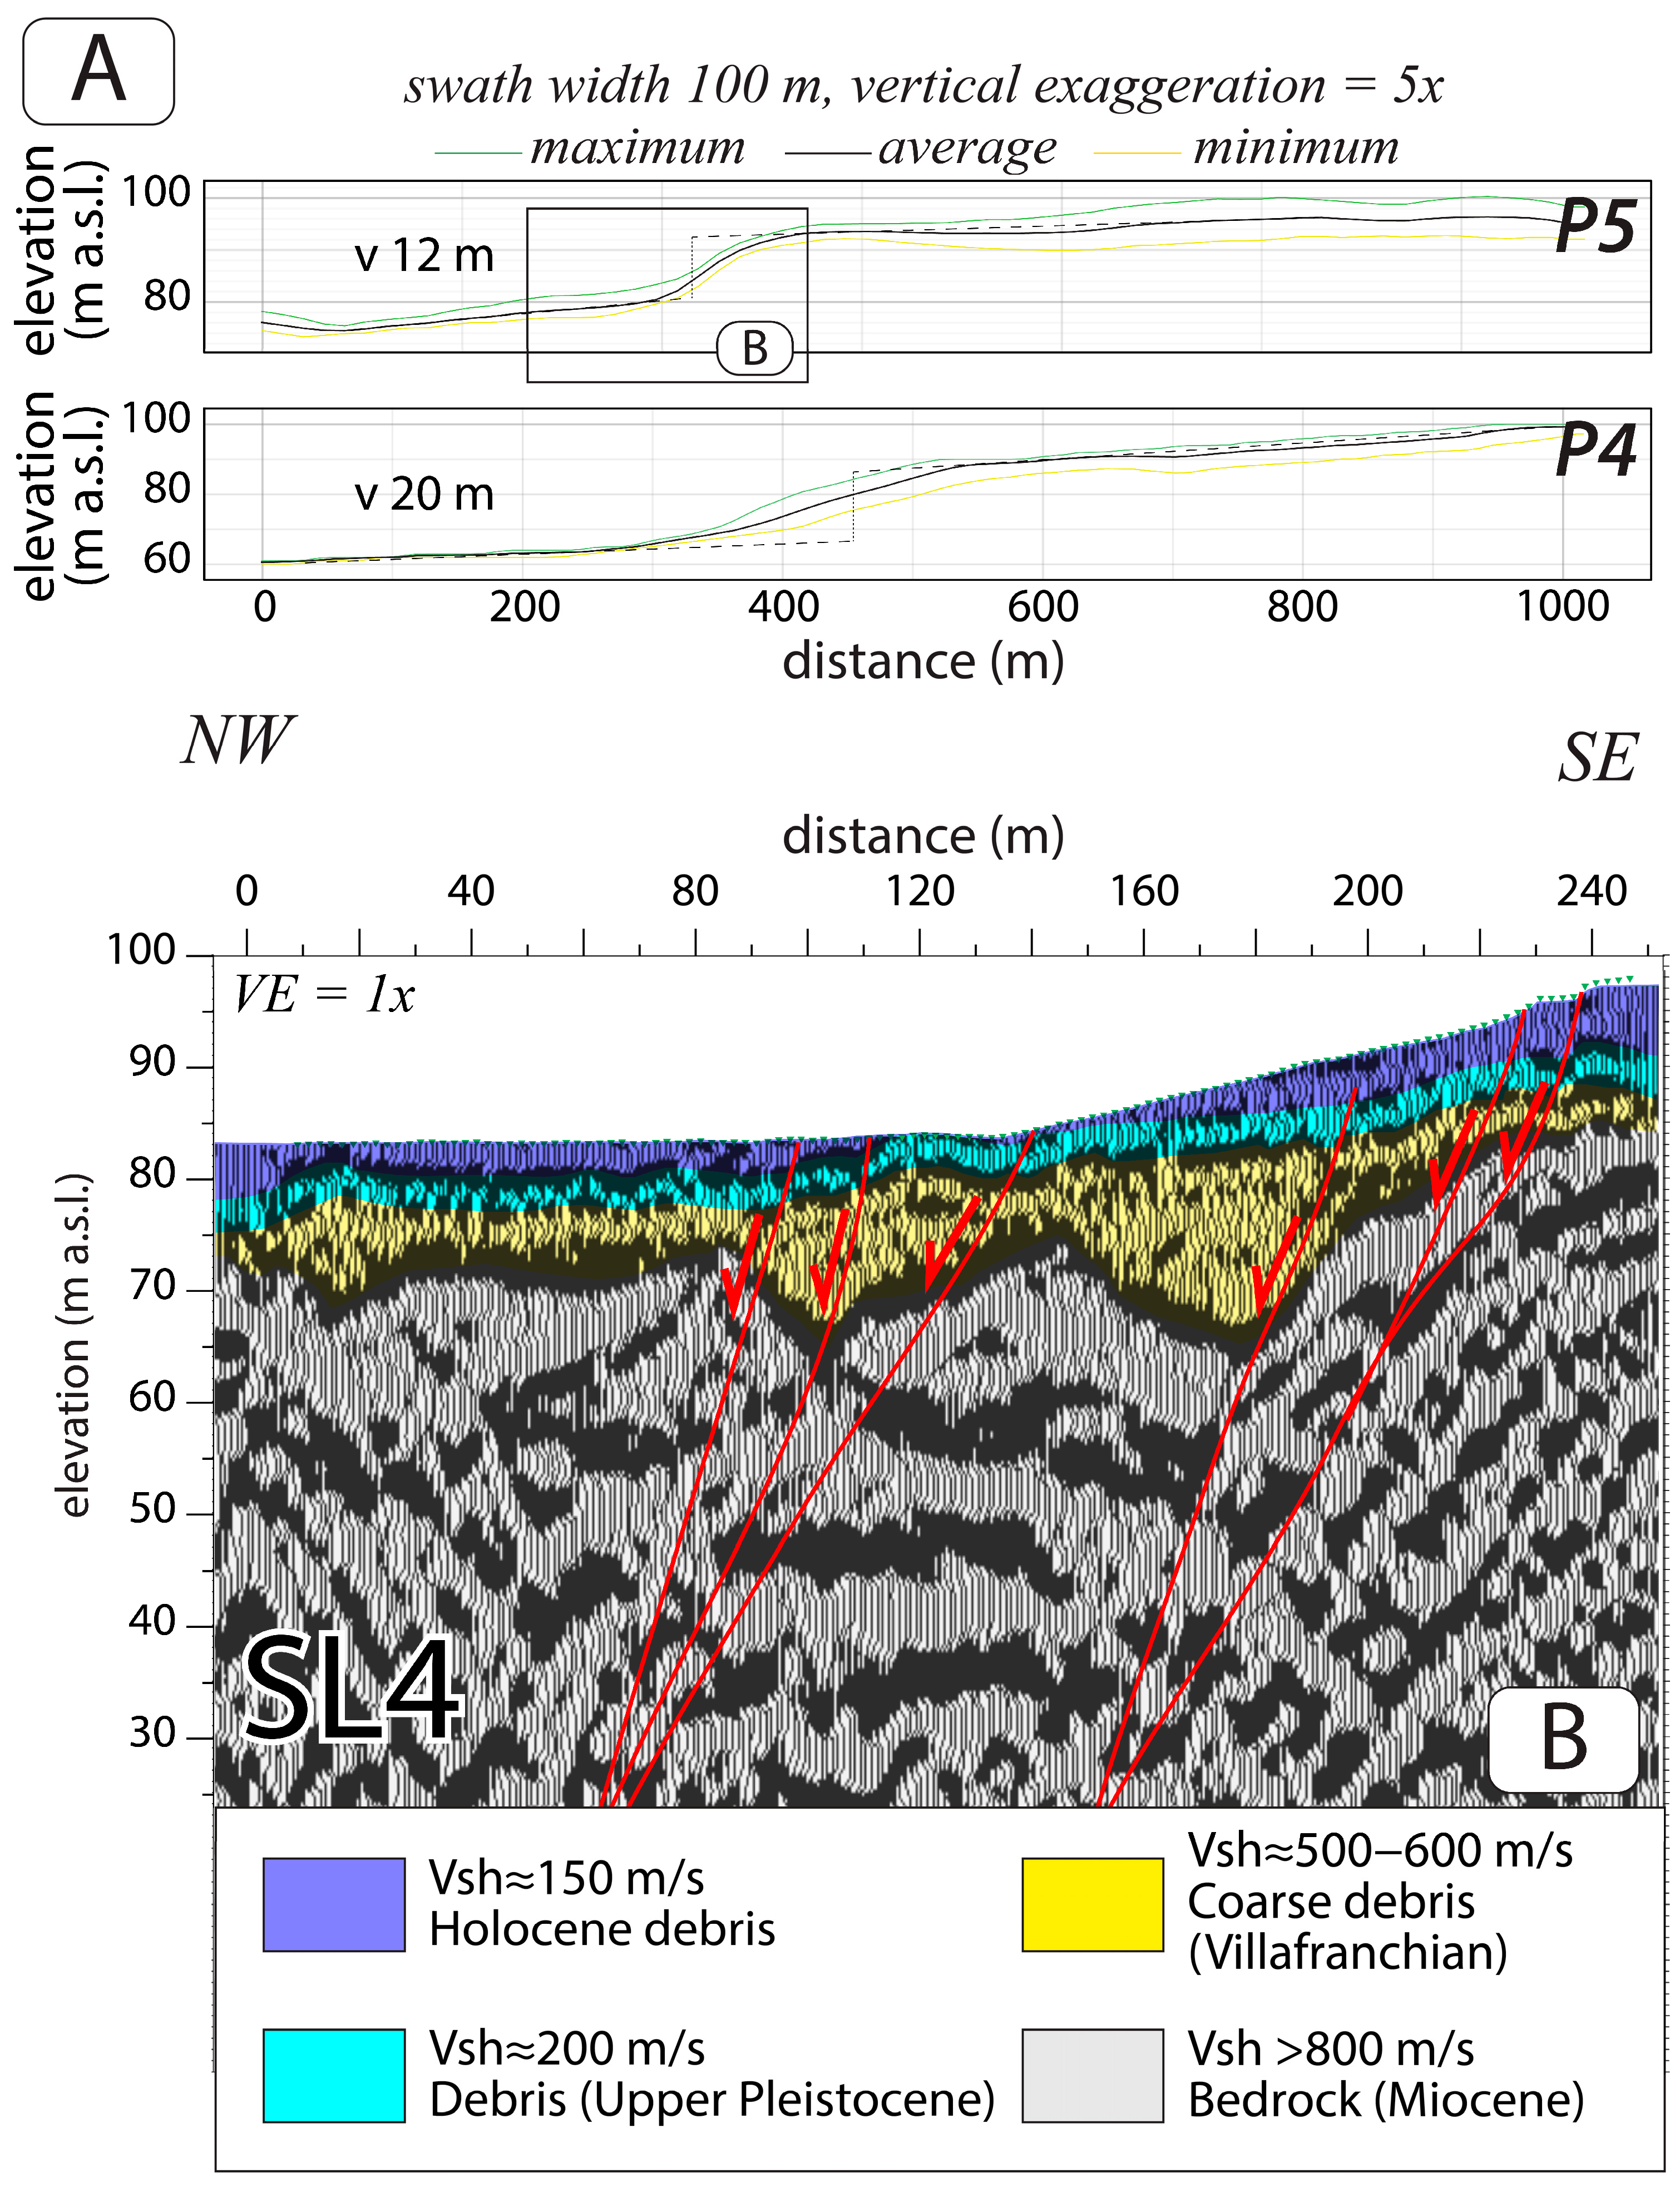
The seismic line SL4 is located in the northern part of the basin, oriented perpendicular to the cumulative escarpment, which is approximately 12 m high (Figure 3 and Figure 7A). The Terzolle stream flows at the base of the scarp, controlled by the downthrow of the fault hanging wall (Figure 6A). The fault juxtaposes the Villafranchian deposits in the footwall against the Upper Pleistocene–Holocene alluvial deposits in the hanging wall.
Interpretation of profile SL4 (Figure 7B) indicates that the surface scarp of the Scandicci Fault results from distributed deformation across a fault zone roughly 70 m wide. Two main splay zones, each about 20 m wide, reach the surface. In the upper part of the profile, these splays produce a step in the morphological surface; however, the lower part of the escarpment is not observable due to artificial excavation for construction purposes.
The stratigraphic reconstruction relies on identifiable seismofacies of the main depositional units in the area. Sediments overlying the bedrock are characterized by wave velocities consistent with the Villafranchian units (Basin Synthem), as observed in other seismic lines. Above these lie deposits attributed to the Terzolle alluvial fan (Middle to Upper Pleistocene). The uppermost sediments, datable to a generic Upper Pleistocene–Holocene, also show evidence of fault offset.
  • Banks of the Arno River
Near the Arno River, the morphotectonic signal has been continuously obscured by the combined effects of fluvial erosion and sedimentation, which locally are stronger than the tectonic signature. This makes it difficult to locate the fault trace through remote sensing and field surveys. For this, near the river, we expected to encounter a sufficiently detailed stratigraphy to identify any evidence of synsedimentary tectonics.
Initially, electrical resistivity tomography (ERT) surveys were conducted along the banks of the Arno River, over a length sufficient to depict the geological structure at a broad scale. Subsequently, the subsurface structure and stratigraphy were further investigated using shorter, high-resolution shallow seismic reflection lines.
The 1575 m-long 2D ERT profile (ERT2), acquired orthogonal to the inferred fault along the Arno River banks (Figure 3 and Figure 8B), provided excellent resolution in both horizontal and vertical directions. The survey revealed a cover of approximately 15–20 m of relatively resistive recent alluvial sediments, underlain by medium-conductive deposits consisting of gravel and clay with silt. Lateral transitions to more resistive materials, observed near chainage about 700 m and 1050 m, were interpreted as indicative of the presence of the fault. These areas were then investigated in detail with high-resolution seismic reflection surveys to verify this interpretation.
The seismic reflection investigation followed the trace of ERT2 (Figure 3 and Figure 8B,C). A first seismic line (SL5A) was recorded, followed by a second line to the east (SL5B), partially overlapping the first one and extending over the fault footwall. The second line employed denser geophone spacing to better image the more recent, superficial layers, particularly the Upper Pleistocene Florence Synthem, and to assess their involvement in faulting (the two acquisitions are shown in Figures S5–S7).
Figure 8C shows the merged result of both acquisitions, covering a total length of 575 m. Seismic section SL5A images distributed faulting down to a depth of approximately 290 m below the ground surface (about –250 m below sea level). Distinctive elements of the local stratigraphy are clearly recognizable. Beneath, the deposits of the Basin Synthem are visible, consisting of three distinct units with different internal organizations: a lowermost, rather chaotic layer; an intermediate layer characterized by several well-defined reflectors; and overlying well-stratified deposits that onlap the fault footwall. These Basin deposits are overlain by the deposits of the Florence Synthem (Middle–Upper Pleistocene), whose stratification is especially evident in the higher-resolution seismic section SL5B, located to the east of the merged section. Additionally, a thinner uppermost layer corresponding to Holocene deposits (Arno Synthem) is also detectable.
The merged seismic surveys SL5A and SL5B reveal the complex structure of the fault zone, indicating at least four successive phases of activity (labeled 1 to 4 in Figure 8C), with faulting progressively migrating eastward. The westernmost faulting affects the lower part of the Upper Pliocene–Lower Pleistocene Basin Synthem, while the more stratified upper portion of the same Synthem does not appear to be involved in this initial phase (phase 1 in Figure 8C). This upper portion is instead affected by a subsequent phase (phase 2 in Figure 8C), which does not seem to cut through the overlying layers. A similar pattern is observed in the well-stratified overlying unit (phase 3 in Figure 8C). Further east, faulting also affects the Middle–Upper Pleistocene Florence Synthem (phase 4 in Figure 8C). Although the resolution of the uppermost Arno Synthem is limited due to the highly heterogeneous fluvial deposits, characterized by alternating fine and coarse sediments, the observed thickening of this layer toward the west may reflect recent fault slip. At the surface, the fault zone is approximately 100–150 m wide, with two main fault splays, each about 30 m wide.
A third seismic profile (SL5C), acquired slightly east of the previous ones to image the eastern fault suggested by the ERT2 line (Figure 8C and Figure S7), was unfortunately affected by subsurface disturbances, likely due to buried structures, so that local interference patterns complicated the interpretation of reflectors. For these reasons, although the presence of the fault can be somehow inferred from the section, we chose not to discuss this profile in detail here and instead include it for completeness in Supplementary Materials, Figure S7. Nevertheless, the presence of the fault at this location is also supported by basic geological evidence, as it crops out in alignment with the profile just 500 m to the south (Figure 6C).
  • Scandicci area
Seismic line SL6 was acquired south of the Arno River (Figure 3 and Figure 9). In this area, the fault brings the Miocene Pietraforte and Monte Morello Formations (Ligurian Units) into contact with the overlying Villafranchian continental deposits and the Holocene sediments of the Arno Synthem. The cumulative escarpment produced by fault slip reaches a height of 31 m (Figure 9A).
The seismic data show that near the surface, the fault zone is approximately 35 m wide, although the broader zone potentially affected by deformation may extend up to 60 m if including other minor faults. Above the bedrock, the Middle–Upper Pleistocene to Holocene cover deposits appear significantly affected by faulting. This deformation also results in surface offsets, visible along the easternmost splay of the main fault zone and along a parallel fault at the base of the slope to the west. The seismic line intersects only the easternmost splay of the broader Scandicci Fault Zone. Faulting observed in the seismic section at the base of the slope (Figure 9B), together with evidence from LiDAR-derived digital topography (Figure 6C), suggests the presence of an additional fault splay emerging slightly west of the seismic line.

3.2.3. Maiano Fault

The northeast-dipping Maiano Fault is a normal-slip structure, parallel to the Scandicci Fault approximately 4 km east of it. It affects the eastern sector of the city of Florence, extending for about 4 km within the basin [15,16,21,22,41] (Figure 2, Figure 3 and Figure 10). In the literature, it is referred to as the Maiano Fault [1] or Maiano–Bagno a Ripoli Fault [14,21,22].
Within the plain, the fault trace is obscured by sediment cover and urban development, but it can be traced for approximately 2 km both to the south and north beyond the extent of the Quaternary deposits. At Maiano, this transverse fault intersects and displaces the longitudinal continuity of the Fiesole Fault, producing a left-lateral step of about 60 m. This displacement is evidenced by a marked change in the morphological expression of the Fiesole Fault: to the east of the intersection, the fault scarp forms a steep range front with rejuvenated small creeks, while to the west, it appears more subdued and eroded. In the plain, prior to the construction of artificial levees, the Maiano Fault influenced the paleo-course of the Arno River by creating a local depression, which marked the western boundary of an area more prone to flooding (Figure 2A).
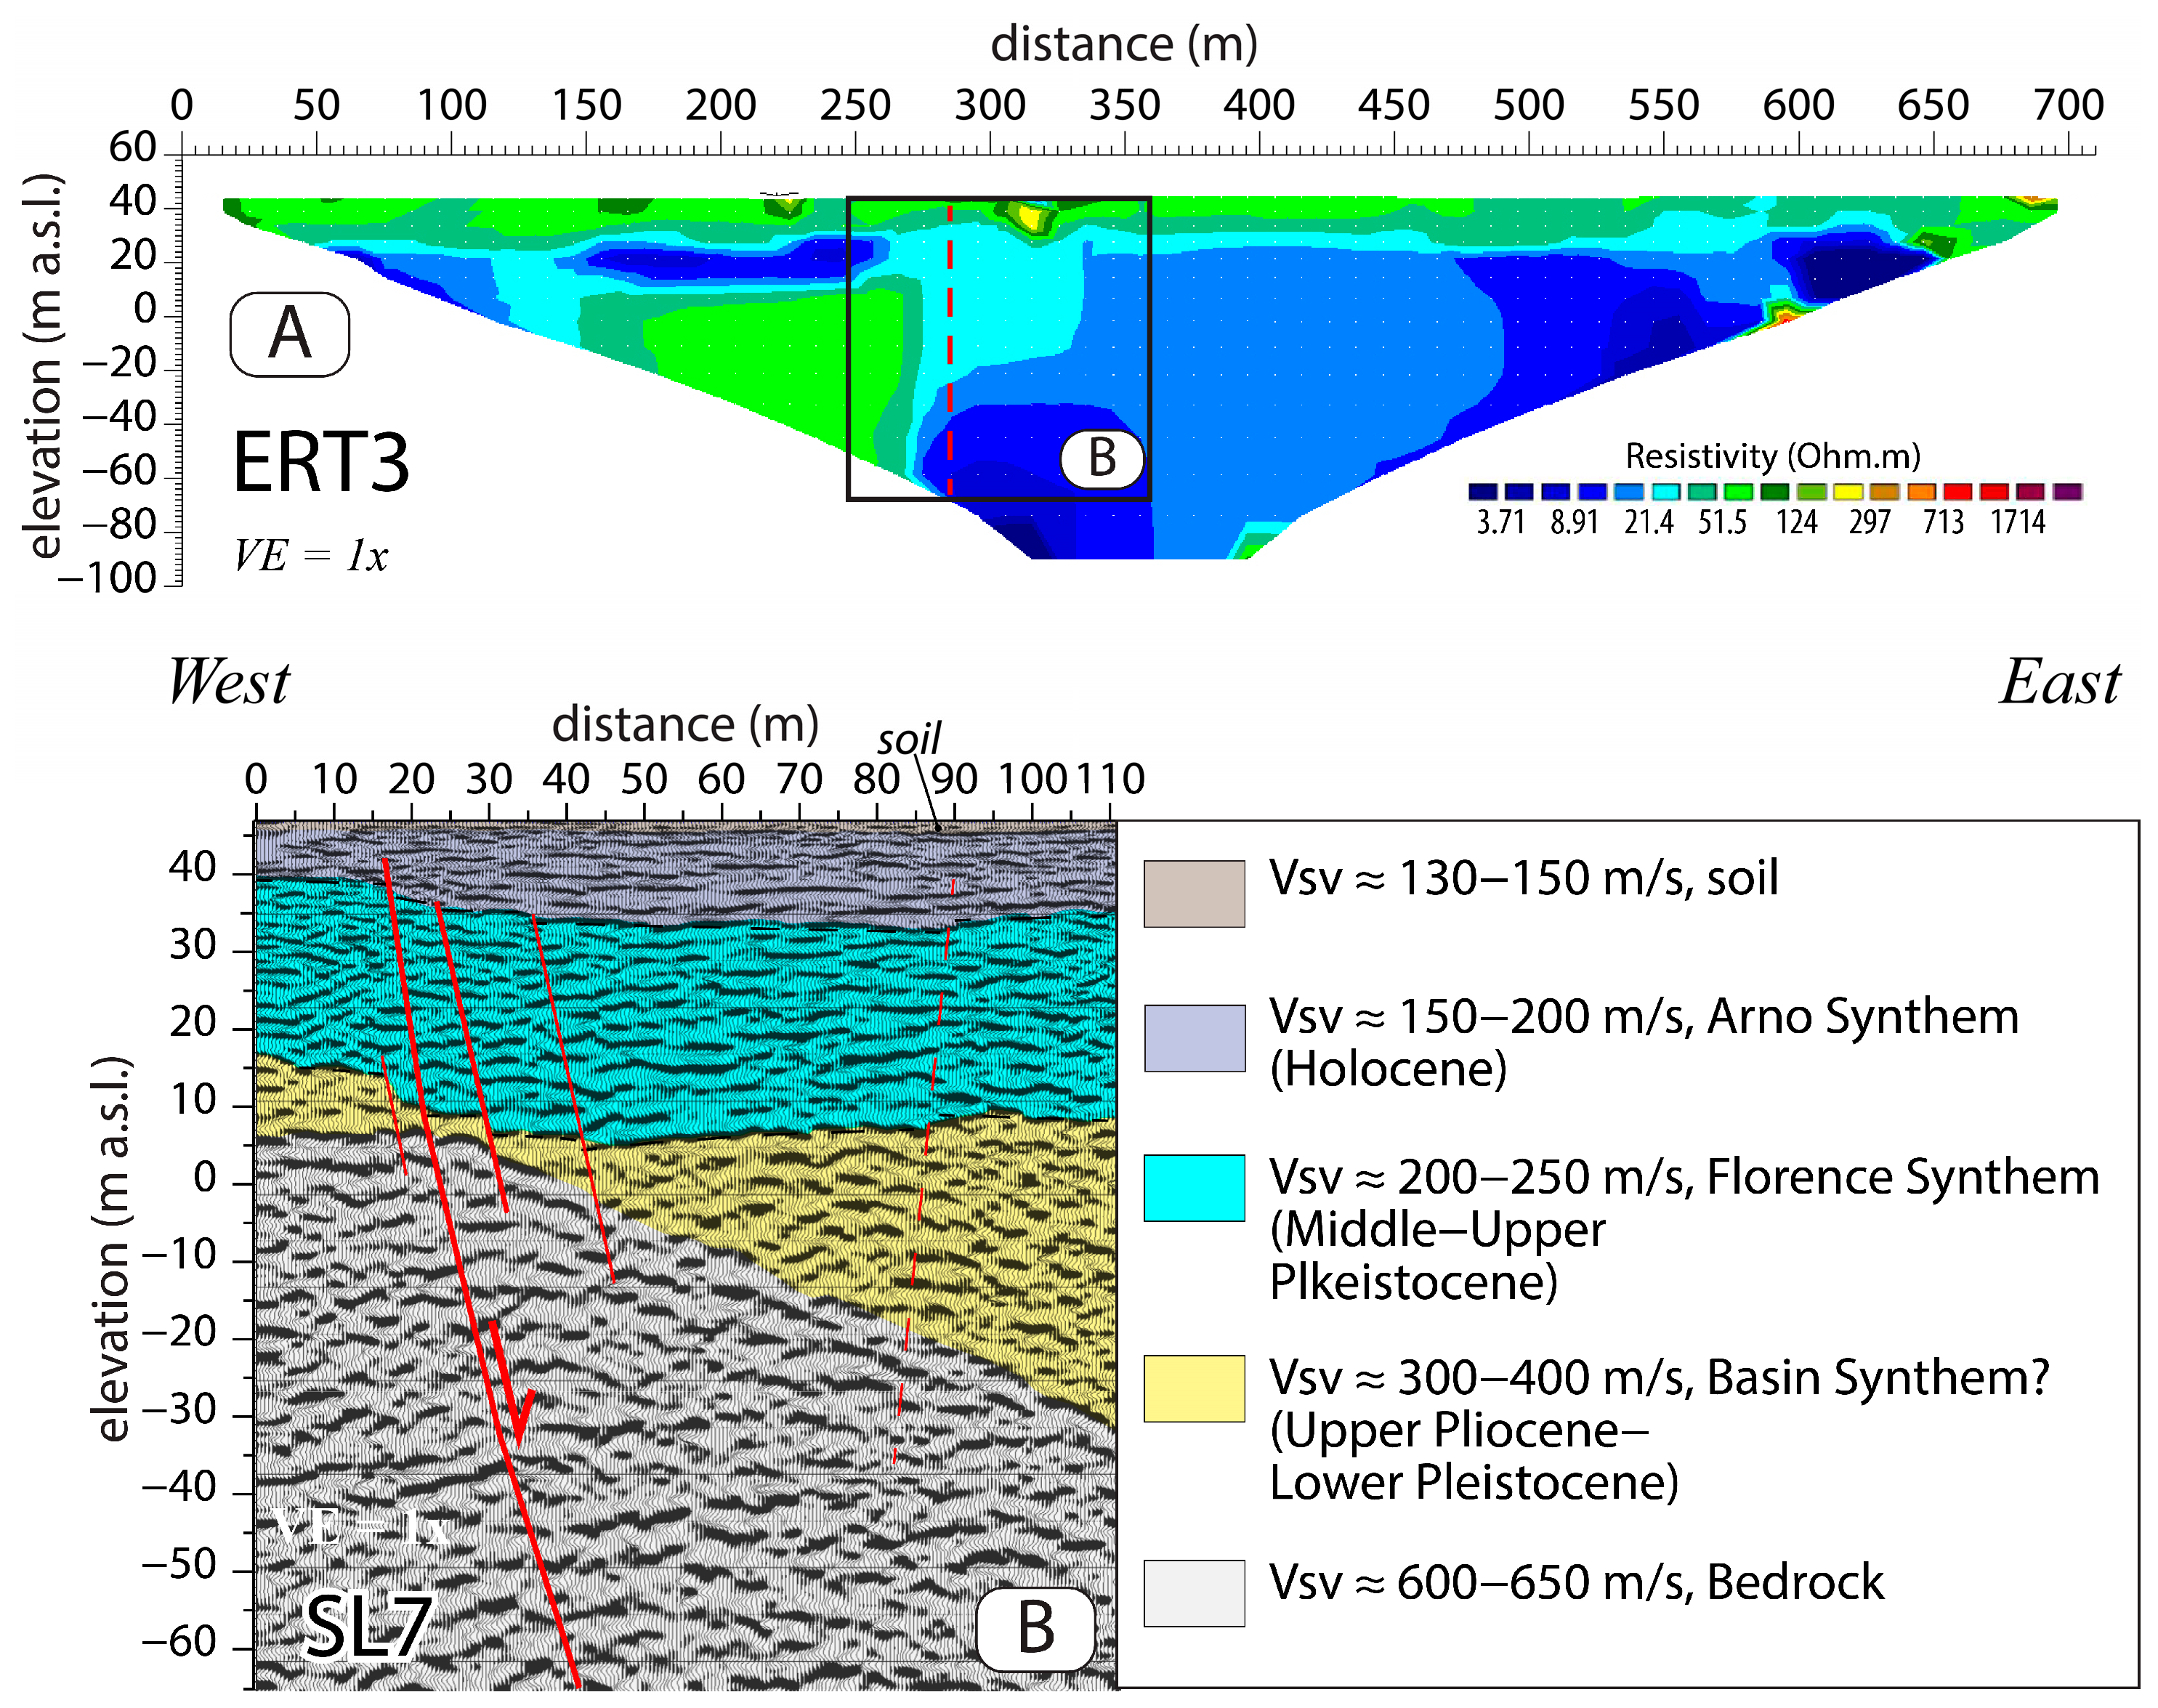
A 2D geoelectric tomography survey (ERT3) was conducted perpendicular to the fault trace at the confluence of the Arno River and the Affrico stream (Figure 3 and Figure 10A). Both Wenner and pole–dipole array profiles reveal an abrupt resistivity change between 250 and 300 m, which is interpreted as corresponding to the fault trace.
To further investigate this structure, seismic profile SL7 was acquired across the fault identified by the geoelectric survey. The processed seismic data clearly show that the fault affects the entire succession of stratified deposits, from units likely belonging to the Basin Synthem to the Holocene deposits of the Arno Synthem (Figure 10B). The profile also reveals the cumulative throw of the main fault, with greater displacement observed in the Lower Pleistocene deposits compared to the Holocene ones, indicating repeated fault activity during the Late Quaternary. The fault is visible in the subsurface up to approximately 5 m below ground level, supporting its classification as an active and capable fault.

4. Discussion

The master fault bounding the northeastern margin of the FPB appears segmented. In the southeastern sector of the basin (Figure 2A), three distinct fault segments were identified. Among these, only portions of the easternmost segment, the Fiesole Fault (approximately 8 km long), and the Prato Fault (approximately 4.5 km long) show evidence of Late Quaternary activity. The Fiesole Fault lacks lateral continuity and exhibits abrupt changes in its morphotectonic expression where it is intersected by transverse, SW–NE-oriented faults, particularly the Maiano and Scandicci faults.
Morphologically, the length of the Fiesole Fault appears inconsistent with the height of the associated mountain front, which exceeds 200 m, suggesting that the relief likely formed during an earlier phase of tectonic activity. Although two seismic reflection profiles (Figure 3 and Figure 4A–D) show tectonic offsets in recent fluvial and slope deposits, this deformation is limited only to certain segments of the fault. Moreover, recent sediments on the hanging wall are thin and, in some cases, have been entirely removed by erosion. These features indicate very low Late Quaternary slip rates, even along those fault segments where deformation is documented in seismic sections.
In summary, current evidence suggests that the master fault has not acted as a continuous structure since at least the Middle Pleistocene. Furthermore, at the moment, no conclusive evidence supports a southeast-ward continuation of the Fiesole Fault.
The analyses and tectonic offsets observed in geomorphological features and in Upper Pleistocene and Holocene deposits from seismic sections confirm the activity and capability of the Scandicci and Maiano faults. The combined action of these faults led to the formation of a horst, upon which the city of Florence was originally established. The NE–SW-oriented Scandicci Fault, in particular, forms a prominent morphological scarp that cuts across the FPB, separating it from the Florence sub-basin. Today, the Arno River carves its course within the uplifted footwall, while being perched above the subsiding plain on the hanging wall.
Seismic profiles across the central portion of the Scandicci Fault (Figure 8C) reveal syntectonic deposition at depths of at least 250 m, indicating that this fault has been active since the formation of the basin in the Upper Pliocene. Continued movement along the fault, accompanied by subsidence of the western basin, contributed to the development of extensive swampy areas and alluvial fans.
The Scandicci and Maiano faults also appear to disrupt the lateral continuity of the master fault, north of Careggi (Figure 3 and Figure 6A) and at Maiano (Figure 4D), introducing left-stepping offsets. A similar offset is also inferred west of Calenzano, where another transverse structure interrupts the lateral continuity of the master fault (Figure 2A). Although a minor component of left-lateral motion cannot be excluded, normal faulting appears to be the dominant kinematic mechanism of these SW–NE-oriented structures.
In the absence of precise paleoseismological constraints, only a preliminary estimate of the vertical slip rate of the Scandicci Fault can be inferred from its morphotectonic expression, which suggests relatively low activity, and from visible displaced reflectors in one seismic section. In seismic section SL4, the fault vertically offsets deposits whose broadly estimated stratigraphic ages can be attributed to Upper Pleistocene deposits by at least 4 m. It also displaces by about 2 m the normalized topographic profile, presumably of Holocene age (Figure 7B and Figure S9). Assuming an age of 14 ± 4 kyr for the Upper Pleistocene–Holocene boundary, the observed displacements correspond to average slip rates of approximately 0.28 mm/year and 0.14 mm/year, respectively. These values yield a mean slip rate of about 0.21 mm/year. In addition, a short-term slip rate of ~0.14 mm/year is inferred from the 2-m displacement affecting Holocene alluvial deposits along the fault trace (profile P3 in Figure 3 and Figure 8A). Averaging of these three estimates provides a first-order approximation of the vertical slip rate of nearly 0.2 mm/year for the Scandicci Fault.
The mapped surface trace of the Scandicci Fault extends approximately 9 km within the basin. Assuming a coseismic rupture along its entire length (Surface Rupture Length, SRL = 9 km), the associated earthquake could have a moment magnitude greater than 5.5 (potentially up to Mw 5.9, according to [42]) with expected average surface displacements in the range of 10–20 cm. Although no such event has been historically recorded in the Florence Basin [6,7,27,28,29], the possibility cannot be excluded based on the results of this study. The 1453 earthquake (epicentral intensity VII–VIII, Mw 5.38 ± 0.37) caused significant damage in Florence and surrounding areas. However, the scarcity of macroseismic data prevents a reliable estimate of its source location and fault geometry. The much better documented 1895 event likely occurred on a different tectonic structure, either on the southwestern margin of the basin or, as proposed by [43], along a not-better-identified NE–SW striking transcurrent fault.
The Late Quaternary activity of the NE–SW-trending faults, characterized by predominantly normal kinematics, may appear to contrast with the current regional stress field. According to the IPSI database [44], the minimum horizontal stress axis is oriented parallel to these faults, which would instead favour the reactivation of the NW–SE-oriented master fault. However, it is important to note that no such direct stress indicators are from within the FPB itself. The stress orientation reported in the IPSI database is based on five focal mechanisms, associated with only three moderate earthquakes (2008, Mw 4.7; 2014, Mw 4.3; and 2019, Mw 4.5), along with a single borehole breakout measurement. All of these data points are located 20 to 35 km from the FPB and span a relatively short time window of 11 years. Consequently, the regional stress field inferred from these data might not accurately represent the local stress regime within the Florence sub-basin. Local variations in stress orientation could be influenced by complex interactions between tectonic blocks or by fault segmentation, potentially resulting in distinct kinematic behavior at the basin scale.
The Tertiary and Quaternary evolution of the Apennines occurred primarily within an intraplate deformation setting, driven by the convergence between the African and European plates. Over time, the direction of convergence shifted from N–S to NNW–SSE [45]. Within this geodynamic framework, the Apennine chain is interpreted as a second-order orogenic belt formed through lateral extrusion processes (e.g., [46,47,48]). Minor stress components associated with compression along the belt axis may therefore contribute to the varying tectonic behaviour observed at the local scale. Variations in the stress field are evidenced by focal mechanisms within localized domains of the Northern Apennines, as well as in other regions (e.g., [49,50]). SW–NE- and SE–NW-oriented normal faults have been simultaneously active since the Upper Pliocene throughout the formation of the FPB, a pattern that is not unique to this basin (e.g., [18]). Similar structural configurations are observed in other Apennine basins affected by a dominant SW–NE extensional stress regime. Examples include the North Apuan Fault in the Garfagnana Basin [26], the Vicchio Fault in the Mugello Basin [19,49], the Rognosi Mountains Fault in the Upper Valtiberina Basin [51,52], and the Tre Monti Fault in the Fucino Basin [53].
Regarding the hazard from coseismic surface displacement (capable faulting), the historical record does not document earthquakes within the Florence sub-basin that have caused this phenomenon or meet the criteria for generating capable faulting, since this event is generally observed for crustal earthquakes with magnitudes greater than 5.5 [42]. According to the Italian guidelines [31], a fault is classified as active and capable if it has moved in the past 40,000 years. Therefore, the geological evidence gathered in this study suggests that the potential hazard from capable faulting cannot be ruled out.
As previously noted, the Database of Italian Seismogenic Sources [2] (Figure 1) includes the Fiesole–Prato Fault System (referred to as Prato–Fiesole) as a “debated seismogenic source,” based on [1], and it does not provide any estimate of its seismogenic potential. Similarly, the Catalogue of Italian Capable Faults [3] includes the same fault system, again referencing [1], but currently omits both the Scandicci and Maiano faults.

5. Conclusions

In this study, a multidisciplinary approach based on the integration of data from high-resolution geomorphological analyses, electrical resistivity tomography, and high-resolution seismic reflection profiling provided valuable insights into the active tectonics of the Firenze–Pistoia Basin (FPB), particularly within the Florence sub-basin, where the city of Florence is located. Despite the challenges posed by anthropogenic disturbances in the urban environment, these methods have successfully enabled the identification and imaging of faults affecting the Holocene deposits, revealing their activity and structural architecture from the surface down to several tens or even hundreds of meters.
At the surface, faulting does not occur along a single discrete plane; rather, slip is accommodated by multiple fault splays, each ranging in width from approximately 10 to 40 m. These splays collectively affect a surface zone that may span a total width between 70 and 200 m. This understanding highlights the importance of detailed geophysical investigations of fault zones prior to defining susceptibility buffers around potentially hazardous faults.
Evidence of Late Quaternary faulting along the northeastern master fault of the FPB is scarce and discontinuous. The main fault system is segmented and shows evidence of Late Quaternary activity only in limited sections. Its structural discontinuity and weak deformation in recent deposits suggest a secondary role in the current tectonic regime.
Instead, the Scandicci and Maiano faults are active and capable, according to [31], with clear evidence of tectonic deformation in Holocene and Pleistocene deposits. However, a more detailed characterization, particularly through direct methods such as borehole investigations and paleoseismological trenching, is still required to better constrain their activity and their paleoseismological parameters. This is especially necessary for the Scandicci Fault, which represents the major active fault affecting the urban area of Florence and that, despite its significance, is not currently listed in the Italian databases of active faults (ITHACA) or seismogenic sources (DISS 3.3.0) [2,3]. Notwithstanding the lack of direct chronological constraints in trenches and boreholes, we tentatively made preliminary estimates of a mean vertical slip rate for this structure, which, as discussed, results in approximately 0.2 mm/year. This value is consistent with the observed displacements in seismic and geomorphological profiles and supports the fault’s potential as a seismogenic source. It is consistent with slip-rates estimated for other faults in the Northern Apennines, and falls between the values calculated by [1] for the master fault of the FPB at Prato (0.5 mm/year) and at Fiesole (0.14 mm/year) (see Chapter 1: Introduction). According to scale relationships, a full-length rupture of the Scandicci Fault (9 km) could generate an earthquake of up to Mw 5.9, with surface displacements of 10–20 cm. Although no such events are historically documented, this scenario cannot be excluded.
Finally, the extensional activity of the SW–NE-oriented faults, apparently in contrast with the SW–NE extension, indicates that a model assuming a completely homogeneous stress field in this sector of the Apennines cannot fully account for the active tectonic deformation at a more local scale. The influence of shallow stress fields, shaped by more localized tectonic interactions, such as block extrusion and/or rotation, should therefore be considered for a more accurate understanding of the specific local settings.
In conclusion, the demonstrated capability of the Scandicci Fault and other transverse faults in the southeastern part of the FPB has significant implications for both seismic and surface faulting hazards in the city of Florence. In light of these findings, future research should prioritize direct investigations, such as trenching and borehole studies, along these transverse structures. These efforts are essential to refine seismic hazard models and inform risk mitigation strategies for the densely urbanized Florence region.

Supplementary Materials

The following supporting information can be downloaded at: https://www.mdpi.com/article/10.3390/rs17152644/s1, Figure S1: Geological map of the Fiesole fault in the La Lastra area overlaid on LI-DAR-derived DTM, with location of seismic line SL1; Figure S2: Geological map of the Maiano area overlaid on LIDAR-derived DTM, with location of the seismic line SL2; Figure S3: View of the fault scarp toward the north (location in Figure S2). Person gives scale. Figure S4: Geophysical surveys across the Peretola and Scandicci faults in the centre of the basin (location and legend in Figure 3); Figure S5: Seismic lines SL5A, with seismofacies; Figure S6: Detail of the more superficial stratigraphy of section SL5B, stack section, with seismofacies, discontinuous and parallel reflector geometries, and tentative tectonic interpretation; Figure S7: Seismic section SL5C, at Le Cascine, Firenze. Although the presence of the fault between 800 and 850 m is somehow appreciable, a sensible disturbance of the signal is evident in the round signal reflection in the superficial layer in the same zone (likely due to some kind of non-documented substructure). The section is not considered enough indicative of the subsoil geology and for this it is not shown in the article; Figure S8: Perspective view of the Scandicci fault southwest of the outlet of Terzolle Creek, with the location of the SL4 seismic line and swath profile P5. Orthophoto draped over LiDAR-derived DTM; Figure S9: Detail of the upper layer of seismic section SL4, showing the displacement of the top of the Upper Pleistocene deposits (≈4 m offset) and the height of the morphological scarplet (≈2 m) near the top of the cumulated tectonic escarpment. In lack of paleoseismological trenching, we can try a very rough estimate of the slip rates based on these values. Assuming the end of Upper Pleistocene beginning of Holocene to be at 14 ± 4 ky, and the normalized morphology to be Holocene, the relative slip rates would result to be between 0.28 and 0.14 mm/year, average 0.21 mm/year; Figure S10: Perspective view of the Scandicci fault southwest of the outlet of Greve River, with the location of the SL6 seismic line and swath profile P1. Orthophoto draped over Li-DAR-derived DTM. Figure S11: Section SL1; Figure S12: Section SL2; Figure S13: Section SL3; Figure S14: Section SL4. This section was originally acquired with east on the left side; in the article it has been flipped for coherence of presentation; Figure S15: Section SL5A; Figure S16: Section SL5B; Figure S17: Section SL5C; Figure S18: Section SL6; Figure S19: Section SL7.

Author Contributions

Conceptualization, L.P., E.V. and M.B.; Methodology, M.B.; Validation, L.P., E.V., V.D. and M.B.; Formal analysis, A.D. and V.D.; Investigation, L.P. and A.D.; Data curation, L.P., A.D. and E.V.; Writing—original draft, L.P., A.D. and E.V.; Writing—review & editing, V.D. and M.B.; Supervision, L.P. and M.B.; Funding acquisition, L.P. and M.B. All authors have read and agreed to the published version of the manuscript.

Funding

This research was funded within the framework of the Scientific Collaboration Agreement between the Seismic Sector of Tuscany Region and the Institute of Geosciences and Georesources of the National Research Council of Italy for the period 2023–2025 (Tuscany Region DD 22075, 02/11/2022; CUP D13C22002650002).

Data Availability Statement

The original contributions presented in this study are included in the article/Supplementary Materials. Further inquiries can be directed to the corresponding author.

Acknowledgments

We are grateful to Geo-Energizers S.n.c. (Altopascio, LU, Italy) and Trigeo S.n.c. (Soci, AR, Italy) for their meticulous acquisition and processing of geophysical data, as well as for their valuable input during discussions. We also thank the five anonymous reviewers, whose comments over three successive rounds of review significantly improved the quality of the manuscript. Finally, we gratefully acknowledge the Editors for their constant and constructive support and comments.

Conflicts of Interest

The authors declare no conflict of interest.

References

  1. Boccaletti, M.; Corti, G.; Gasperini, P.; Piccardi, L.; Vannucci, G.; Clemente, S. Active tectonics and seismic zonation of the urban area of Florence, Italy. Pure Appl. Geophys. 2001, 158, 2313–2332. [Google Scholar] [CrossRef]
  2. Database of Individual Seismogenic Sources (DISS). Version 3.3.0: A Compilation of Potential Sources for Earthquakes Larger than M 5.5 in Italy and Surrounding Areas; Istituto Nazionale di Geofisica e Vulcanologia (INGV): Rome, Italy. [CrossRef]
  3. ITHACA (Italy Hazard from Capable Faulting), A Database of Active Capable Faults of the Italian Territory. Version December 2019. ISPRA Geological Survey of Italy. Available online: https://sgi.isprambiente.it/ithacaweb/Default.aspx# (accessed on 12 December 2024).
  4. Ambrosetti, P.; Bosi, C.; Carraro, F.; Ciaranfi, N.; Panizza, M.; Papani, G.; Vezzani, L.; Bartolini, C.; Zanferrari, A. Neotectonic Map of Italy. Progetto Finalizzato Geodinamica, Scale 1:500.000. Quad. Ric. Sci. CNR 1987, 4, 1–6. [Google Scholar]
  5. Pondrelli, S. European-Mediterranean Regional Centroid-Moment Tensors Catalog (RCMT) [Data Set]; Istituto Nazionale di Geofisica e Vulcanologia (INGV): Rome, Italy, 2002. [Google Scholar] [CrossRef]
  6. Rovida, A.; Locati, M.; Camassi, R.; Lolli, B.; Gasperini, P. The Italian earthquake catalogue CPTI15. Bull. Earthq. Eng. 2020, 18, 2953–2984. [Google Scholar] [CrossRef]
  7. Rovida, A.; Locati, M.; Camassi, R.; Lolli, B.; Gasperini, P.; Antonucci, A. Catalogo Parametrico dei Terremoti Italiani (CPTI15), Versione 4.0 [Data Set]; Istituto Nazionale di Geofisica e Vulcanologia (INGV): Rome, Italy, 2022. [Google Scholar] [CrossRef]
  8. Conti, P.; Cornamusini, G.; Carmignani, L.; Pirro, A.; Pizziolo, M.; Daniele, G.; Lavorini, G.; Motti, A.; Natali, N.; Bettucci, C. Geological Map of the Northern Apennines (Emilia-Romagna, Marche, Tuscany, Umbria), Scale 1:250.000, 2 Sheets; Servizio Geologico, Sismico e dei Suoli, Regione Emilia-Romagna: Bologna, Italy, 2019. [Google Scholar]
  9. Regione Toscana. Geoscopio. Cartoteca. Geological Map Scale 1:10,000. Available online: https://www502.regione.toscana.it/geoscopio/cartoteca.html (accessed on 30 November 2024).
  10. Conedera, C.; Ercoli, A. Elementi geomorfologici della Piana di Firenze dedotti dalla fotointerpretazione. L’ Universo 1973, 53, 255–262. [Google Scholar]
  11. Dainelli, G. Il bacino di Firenze e il suo antico lago. In Mélange de Géographie; Mariano Ricei Ed.: Florence, Italy, 1936; 13p. [Google Scholar]
  12. Azzaroli, A.; Cita, M.B. Geologia Stratigrafica, 3rd ed.; Cisalpino Goliardica Ed.: Milan, Italy, 1967; 406p. [Google Scholar]
  13. Merla, G.; Bortolotti, V. Note Illustrative Della Carta Geologica d’Italia. Foglio 106, Firenze; Min. Ind. Comm. e Art.: Rome, Italy, 1967; 61p. [Google Scholar]
  14. Briganti, R.; Ciufegni, S.; Coli, M.; Polimeni, S.; Pranzini, G. Plio-Quaternary Evolution of the Firenze Area. Boll. Soc. Geol. Ital. 2003, 122, 435–445. Available online: https://pubs.geoscienceworld.org/sgi/italianjgeo/article/122/3/435/74862/Underground-Florence-Plio-Quaternary-geological (accessed on 12 December 2024).
  15. Capecchi, F.; Guazzone, G.; Pranzini, G. Il bacino lacustre di Firenze-Prato-Pistoia. Geologia del sottosuolo e ricostruzione evolutiva. Boll. Soc. Geol. Ital. 1975, 94, 637–660. [Google Scholar]
  16. Capecchi, F.; Guazzone, G.; Pranzini, G. Ricerche geologiche ed idrogeologiche nel sottosuolo della pianura di Firenze. Boll. Soc. Geol. Ital. 1975, 94, 661–692. [Google Scholar]
  17. Elter, P.; Giglia, G.; Tongiorgi, M.; Trevisan, L. Tensional and compressional areas in the recent (Tortonian to Present) evolution of the Northern Apennines. Boll. Geof. Teor. Appl. 1975, 65, 3–18. [Google Scholar]
  18. Boccaletti, M.; Coli, M.; Eva, G.; Ferrari, G.; Giglia, G.; Lazzarotto, A.; Merlanti, F.; Nicolich, H.R.; Papani, G.; Postpischl, D. Considerations on the seismotectonics of the northern Apennines. Tectonophysics 1985, 117, 7–38. [Google Scholar] [CrossRef]
  19. Piccardi, L.; Sani, F.; Bonini, M.; Boccaletti, M.; Moratti, G.; Gualtierotti, A. Deformazioni Quaternarie nell’Appennino centro-settentrionale: Evidenze ed implicazioni. Alp. Mediterr. Quat. 1997, 10, 273–280. [Google Scholar]
  20. Giannini, L.M.; Varone, C.; Esposito, C.; Scarascia Mugnozza, G.; Schilirò, L. The potential of spatial statistics for the reconstruction of a subsoil model: A case study for the Firenze-Prato-Pistoia Basin, Central Italy. J. Appl. Geophys. 2021, 194, 104466. [Google Scholar] [CrossRef]
  21. Coli, M.; Rubellini, P. Geological anamnesis of the Florence area, Italy. Z. Dtsch. Ges. Geowiss. 2013, 164, 581–589. [Google Scholar] [CrossRef]
  22. Coli, M. Inquadramento geologico e geomorfologico. In La Microzonazione Sismica e le Analisi Delle Condizioni Limite per L’emergenza del Comune di Firenze; Coli, M., Ripepe, M., Lacanna, G., Iandelli, N., De Stefano, M., Tanganelli, M., Paoletti, B., Baglione, M., D’Intinosante, V., Giomarelli, D., et al., Eds.; Regione Toscana, Direzione Ambiente ed Energia, Settore Sismica, Comune di Firenze, Università Degli Studi di Firenze: Florence, Italy, 2022; pp. 27–42. [Google Scholar]
  23. Abbate, E.; Sagri, M. Development of the Northern Apennines Eugeosinclinal sequence. Sediment. Geol. 1970, 4, 203–647. [Google Scholar]
  24. Boccaletti, M.; Coli, M. (Eds.) Carta Geologico Strutturale Dell’appennino Settentrionale, Scala 1:250.000; CNR, Progetto Finalizzato Geodinamica: Florence, Italy, 1982; 4p. [Google Scholar]
  25. Abbate, E.; Castellucci, P.; Ferrini, G.L.; Pandeli, E. I dintorni di Firenze. In Appennino Tosco-Emiliano; Bortolotti, V., Ed.; Guide Geologiche Regionali 1990, n. 4; Società Geologica Italiana: Rome, Italy; 329p.
  26. Nirta, G.; Vittori, E.; Blumetti, A.M.; Di Manna, P.; Benvenuti, M.; Montanari, D.; Perini, M.; Fiera, F.; Moratti, G.; Baglione, M.; et al. Geomorphological and paleoseismological evidence of capable faulting in the Northern Apennines (Italy): Insights into active tectonics and seismic hazard of the Lunigiana basin. Geomorphology 2021, 374, 107486. [Google Scholar] [CrossRef]
  27. Guidoboni, E.; Ferrari, G.; Mariotti, D.; Comastri, A.; Tarabusi, G.; Sgattoni, G.; Valensise, G. CFTI5Med, Catalogo dei Forti Terremoti in Italia (461 a.C.-1997) e Nell’area Mediterranea (760 a.C.-1500); Istituto Nazionale di Geofisica e Vulcanologia (INGV): Rome, Italy, 2018. [Google Scholar] [CrossRef]
  28. Guidoboni, E.; Ferrari, G.; Tarabusi, G.; Sgattoni, G.; Comastri, A.; Mariotti, D.; Ciuccarelli, C.; Bianchi, M.G.; Valensise, G. CFTI5Med, the new release of the catalogue of strong earthquakes in Italy and in the Mediterranean area. Sci. Data 2019, 6, 80. [Google Scholar] [CrossRef] [PubMed]
  29. Locati, M.; Camassi, R.; Rovida, A.; Ercolani, E.; Bernardini, F.; Castelli, V.; Caracciolo, C.H.; Tertulliani, A.; Rossi, A.; Azzaro, R.; et al. Database Macrosismico Italiano (DBMI15), Versione 4.0 [Data Set]; Istituto Nazionale di Geofisica e Vulcanologia (INGV): Rome, Italy, 2022. [Google Scholar] [CrossRef]
  30. Castelli, V.; Stucchi, M.; Moroni, A.; Monachesi, G. (Eds.) Revisione dei Principali Terremoti D’interesse per il Territorio Toscano Vol. 1: Dall’anno 1000 al 1731; Gruppo Naz. per la Dif. dai Terremoti, Rapporto Interno, Milano; Consiglio Nazionale delle Ricerche: Rome, Italy, 1996; pp. 6–7. [Google Scholar]
  31. Commissione Tecnica per la Microzonazione Sismica (Technical Committee for Microzonation), Microzonazione Sismica—Linee Guida per la Gestione del Territorio in Aree Interessate da Faglie Attive e Capaci (FAC), Versione 1.0. Conferenza Delle. Regioni e Delle Province Autonome—Dip. Protezione Civile, Roma, 2015, 66p. (In Italian). Available online: https://www.protezionecivile.gov.it/it/pubblicazione/microzonazione-sismica--linee-guida-per-la-gestione-del-territorio-in-aree-interessate-da-faglie-attive-e-capaci--fac-/ (accessed on 22 April 2025).
  32. IAEA (International Atomic Energy Agency). Seismic Hazards in Site Evaluation for Nuclear Installations; Specific Safety Guide. In IAEA Safety Standards Series, No. SSG-9 (Rev. 1); International Atomic Energy Agency: Vienna, Austria, 2022; 78p, Available online: https://www-pub.iaea.org/MTCD/Publications/PDF/PUB1950_web.pdf (accessed on 8 November 2024).
  33. Drahor, M.; Berge, M.A. Integrated geophysical investigations in a fault zone located on southwestern part of İzmir city, Western Anatolia, Turkey. J. Appl. Geophys. 2017, 136, 114–133. [Google Scholar] [CrossRef]
  34. Gabàs, A.; Macau, A.; Benjumea, B.; Bellmunt, F.; Figueras, S.; Vilà, M. Combination of geophysical methods to support urban geological mapping. Surv. Geophys. 2014, 35, 983–1002. [Google Scholar] [CrossRef]
  35. Galli, P.; Giocoli, A.; Peronace, E. Integrated near surface geophysics across the active Mount Marzano fault system (Southern Italy): Seismogenic hints. Int. J. Earth Sci. 2014, 103, 315–325. [Google Scholar] [CrossRef]
  36. Liberty, L.; Hemphill-Haley, M.A.; Madin, I.P. The Portland Hills Fault: Uncovering a hidden fault in Portland, Oregon using high-resolution geophysical methods. Tectonophysics 2003, 368, 89–103. [Google Scholar] [CrossRef]
  37. Villani, F.; Pucci, S.; Civico, R.; De Martini, P.M.; Nicolosi, I.; Caracciolo, F.D.; Carluccio, R.; Di Giulio, G.; Vassallo, M.; Smedile, A.; et al. Imaging the structural style of an active normal fault through multidisciplinary geophysical investigation: A case study from the mw 6.1, 2009 l’Aquila earthquake region (Central Italy). Geophys. J. Int. 2015, 200, 1676–1691. [Google Scholar] [CrossRef]
  38. Wang, Z.; Cai, X.; Yan, J.; Wang, J.; Liu, Y.; Zhang, L. Using the integrated geophysical methods detecting active faults: A case study in Beijing, China. J. Appl. Geophys. 2017, 156, 1–92. [Google Scholar] [CrossRef]
  39. Bartolini, C.; Pranzini, G. Plio-Quaternary evolution of the Arno basin drainage. Z. Geomorphol. 1981, 40, 77–91. [Google Scholar]
  40. Gradstein, F.M.; Ogg, J.G.; Schmitz, M.D.; Ogg, G.M. (Eds.) The Geologic Time Scale 2020; Elsevier: Amsterdam, The Netherlands, 2020. [Google Scholar] [CrossRef]
  41. Coli, M.; Agili, F.; Pini, G.; Coli, N. Firenze: Il suo impatto sull’evoluzione geomorfica dell’area. Alp. Mediterr. Quat. 2004, 17, 195–211. [Google Scholar]
  42. Wells, D.L.; Coppersmith, K.J. New empirical relationships among magnitude, rupture length, rupture width, rupture area, and surface displacement. Bull. Seismol. Soc. Am. 1994, 84, 974–1002. [Google Scholar] [CrossRef]
  43. Mirabella, F.; Braun, T.; Brogi, A.; Capezzuoli, E. Pliocene–Quaternary seismogenic faults in the inner Northern Apennines (Valdelsa Basin, southern Tuscany) and their role in controlling the local seismicity. Geol. Mag. 2022, 159, 853–872. [Google Scholar] [CrossRef]
  44. Mariucci, M.T.; Montone, P. Database of Italian present-day stress indicators, IPSI 1.4. Sci. Data 2020, 7, 298. Available online: https://ipsi.rm.ingv.it/ (accessed on 22 April 2025). [CrossRef]
  45. McKenzie, D. Active tectonics of the Mediterranean region. Geophys. J. Int. 1972, 30, 109–185. [Google Scholar] [CrossRef]
  46. Boccaletti, M.; Conedera, C.; Dainelli, P.; Gocev, P. The recent (Neogene-Quaternary) regmatic system of the Western Mediterranean region. J. Petrol. Geol. 1982, 5, 31–49. [Google Scholar] [CrossRef]
  47. Tapponnier, P. Évolution tectonique du système alpin en Méditerranée: Poinçonnement et écrasement rigide-plastique. Bull. Soc. Géol. Fr. 1977, 7, 437–460. [Google Scholar] [CrossRef]
  48. Mantovani, E.; Albarello, D.; Babbucci, D.; Tamburelli, C. Evolution of the Tyrrhenian basin and surrounding regions as a result of the Africa-Eurasia convergence. J. Geodynam. 1996, 21, 35–72. [Google Scholar] [CrossRef]
  49. Sani, F.; Bonini, M.; Piccardi, L.; Vannucci, G.; Delle Donne, D.; Benvenuti, M.; Moratti, G.; Corti, G.; Montanari, D.; Sedda, L.; et al. Late Pliocene-Quaternary evolution of outermost hinterland basins of the Northern Apennines (Italy), and their relevance to active tectonics. Tectonophysics 2009, 476, 336–356. [Google Scholar] [CrossRef]
  50. Elter, F.M.; Elter, P.; Eva, C.; Eva, E.; Kraus, R.K.; Padovano, M.; Solarino, S. Strike-slip geometry inferred from the seismicity of the Northern-Central Apennines (Italy). J. Geodyn. 2011, 52, 379–388. [Google Scholar] [CrossRef]
  51. Delle Donne, D.; Piccardi, L.; Odum, J.K.; Stephenson, W.J.; Williams, R.A. High-resolution shallow reflection seismic image and surface evidence of the Upper Tiber Basin active faults (Northern Apennines, Italy). Boll. Soc. Geol. Ital. 2007, 126, 323–331. [Google Scholar]
  52. Benvenuti, M.; Bonini, M.; Moroni, A. Tectonic control on the Late Quaternary hydrography of the Upper Tiber Basin (Northern Apennines, Italy). Geomorphology 2016, 269, 85–103. [Google Scholar] [CrossRef]
  53. Piccardi, L.; Gaudemer, Y.; Tapponnier, P.; Boccaletti, M. Active oblique extension in the central Apennines (Italy): Evidence from the Fucino basin. Geophys. J. Int. 1999, 139, 499–530. [Google Scholar] [CrossRef]
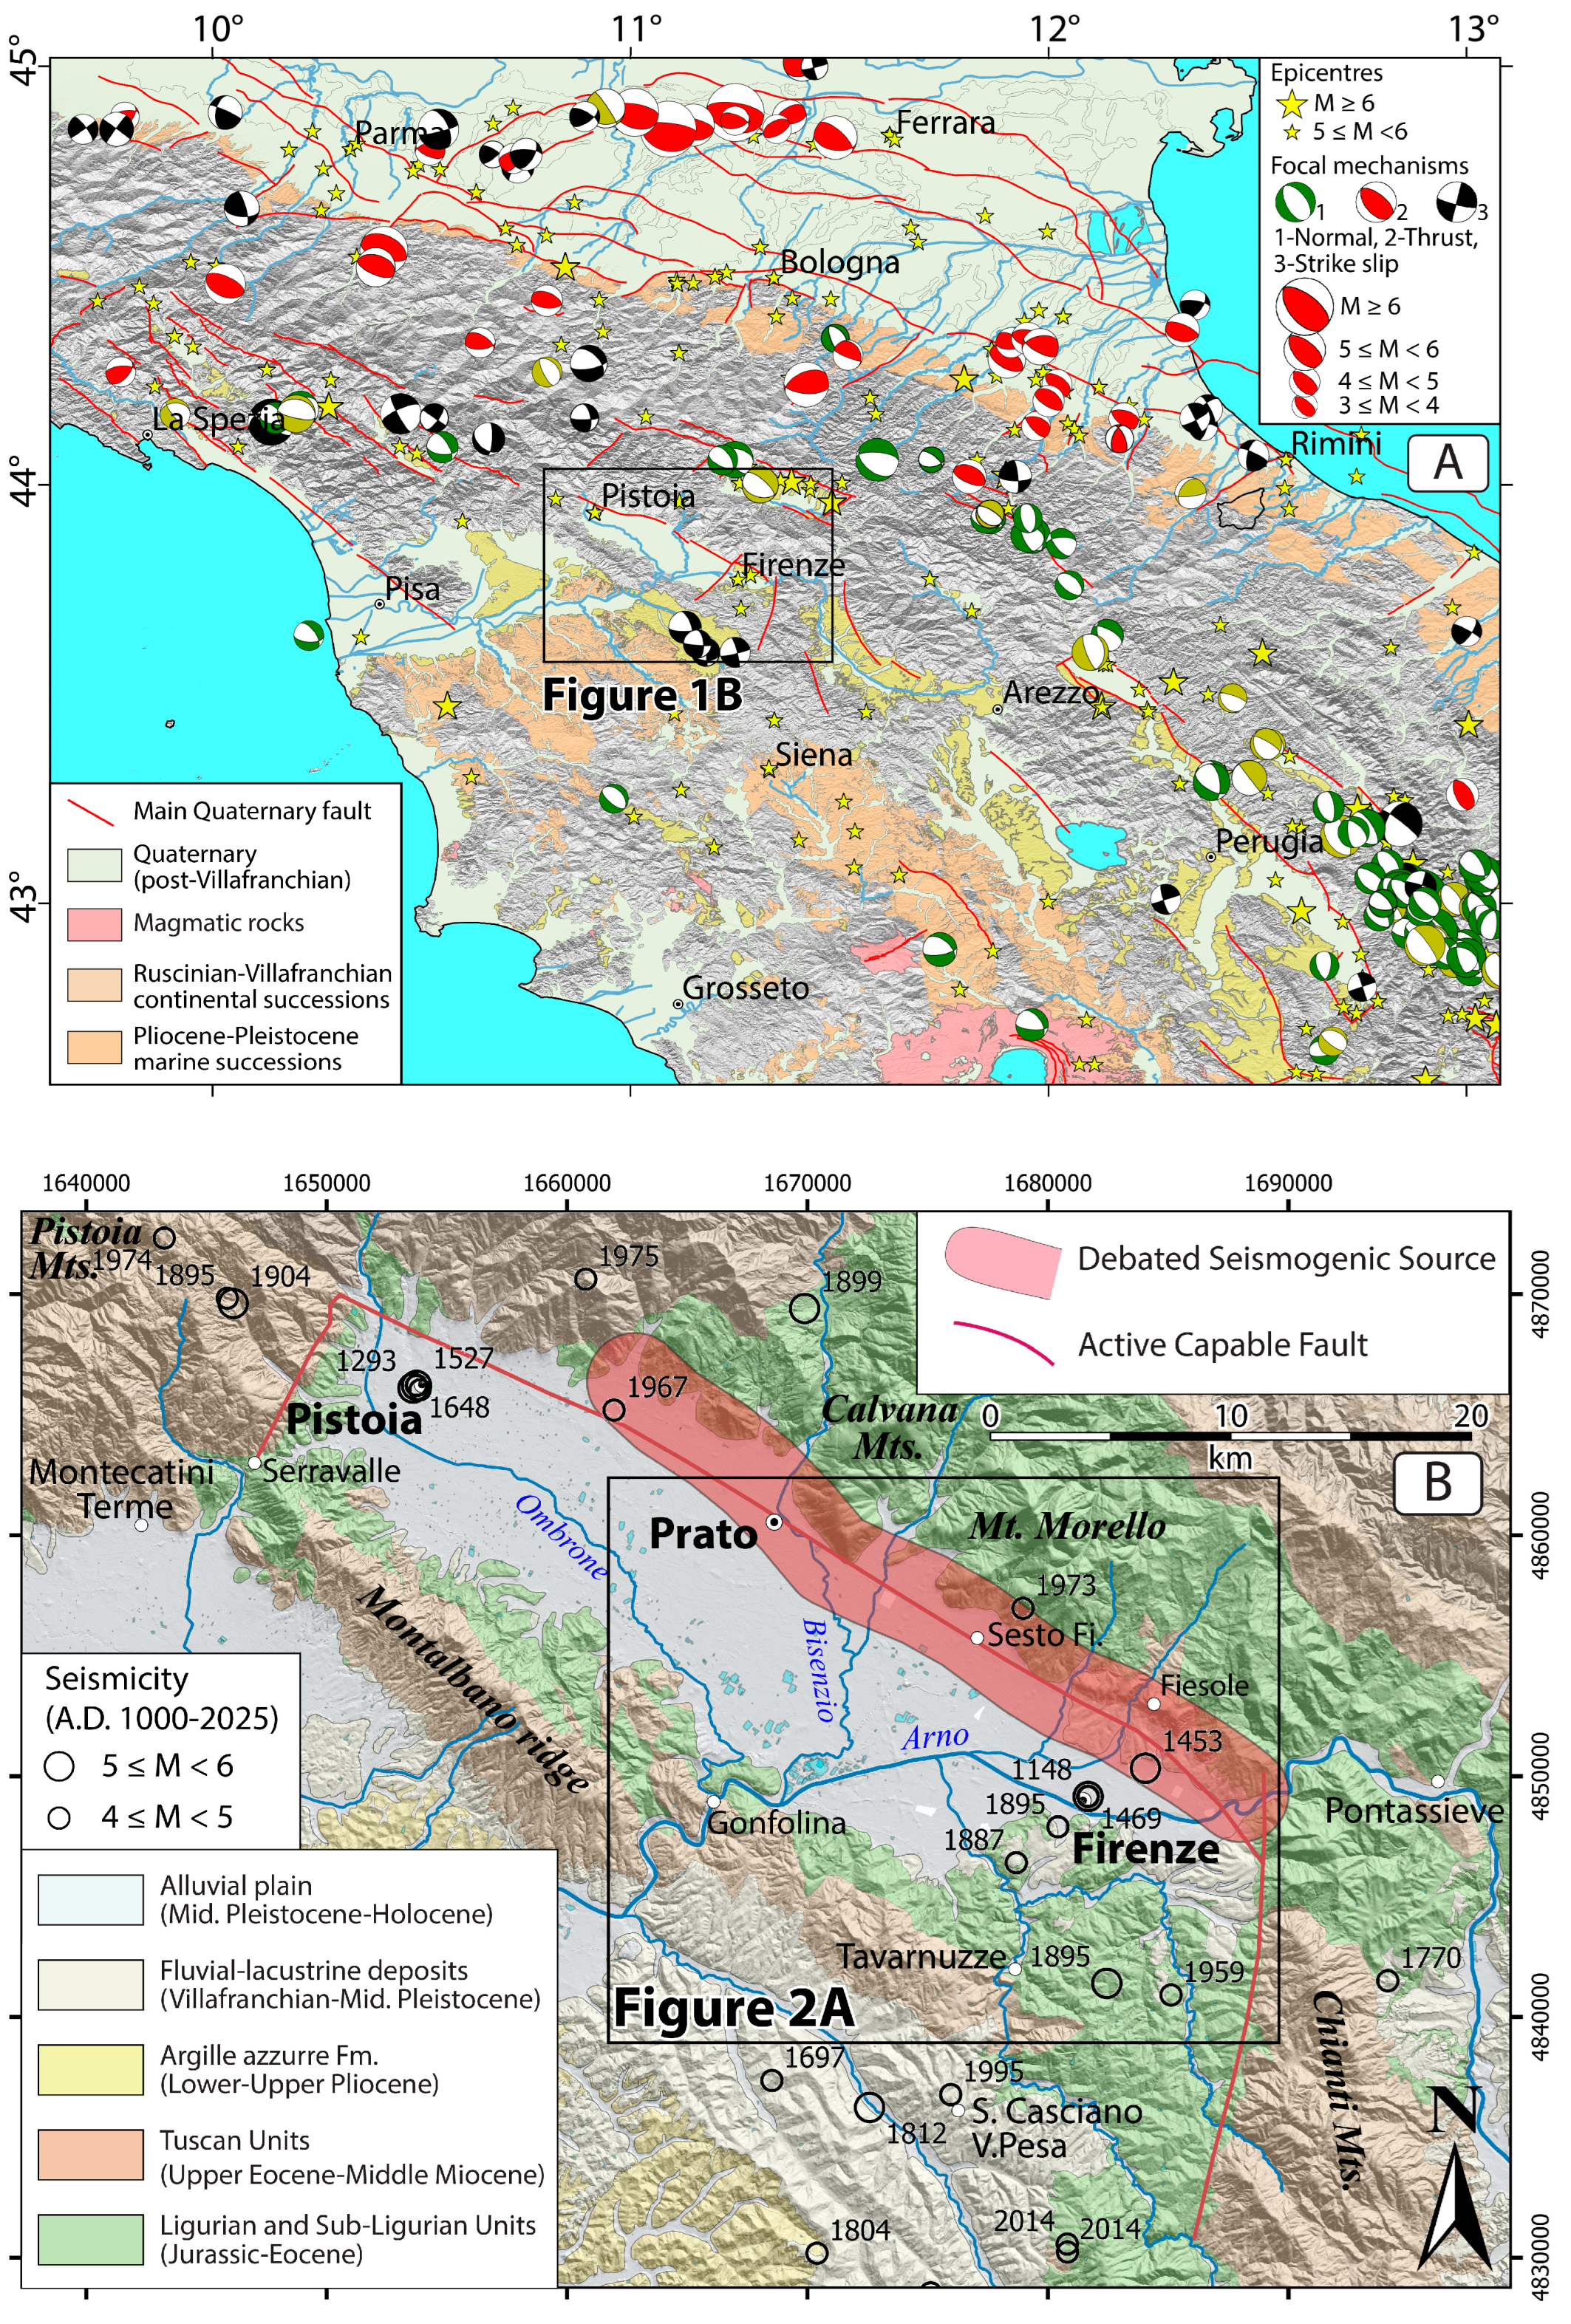
Figure 1. Location of the study area. (A) Schematic seismotectonic map of the Northern Apennines. Focal mechanisms are from [5]; earthquake epicentres from [6,7]. Faults are revised from [3] and from this study. Reference system is WGS84 (EPSG 4326). (B) Geological map of the Firenze–Pistoia Basin and surrounding areas. Seismogenic Sources are from [2], Active Capable Faults are from [3]. Geology redrawn from [8]. Reference system is Monte Mario/Italy Zone 1 (EPSG:3003).
Remotesensing 17 02644 g001
Figure 2. Main tectonic and geomorphological features in the southeastern part of the Firenze–Pistoia Basin. (A) Digital Terrain Model (DTM) derived from LiDAR data. Geological data from [9]; ancient meanders and river courses are redrawn from [10]. Mapping of Quaternary alluvial fans has been refined in the present study. (B) Swath profile illustrating vertical displacement across the basin plain caused by the Scandicci and Peretola faults.
Remotesensing 17 02644 g002
Figure 3. Location of geomorphological/geophysical investigations, with indication of figures cited in text.
Remotesensing 17 02644 g003
Figure 4. Data from geological and geophysical investigations on the Fiesole Fault (locations in Figure 3). (A) Geological map of the La Lastra area, with geology from [9] draped over a LiDAR-derived DTM. (B) Stacked seismic profile SL1, showing interpreted seismofacies. (C) Geological map of the Maiano area, with geology from [9] draped over a LiDAR-derived DTM. (D) Stacked seismic profile SL2, with interpreted seismofacies. (E) Electrical resistivity tomographic profile ERT4.
Remotesensing 17 02644 g004
Figure 5. Data from geophysical acquisitions in the central sector of the Peretola Fault (locations in Figure 3). (A) Electrical resistivity tomography profile ERT1, processed using Res2DINV software. (B) High-resolution seismic reflection profile SL3.
Remotesensing 17 02644 g005
Figure 6. Geomorphological features of the Scandicci Fault (locations of figures and investigations in Figure 3). (A) Alluvial fan of the Terzolle Creek, with contour lines at 5 m intervals derived from LiDAR DTM. (B) Hydrography east of Terzolle Creek, highlighting capture (c) and diversion (d) features. (C) Alluvial fan of the Greve and Vingone streams, with contour lines at 2.5 m intervals from LiDAR-derived DTM.
Remotesensing 17 02644 g006
Figure 7. Geomorphological and geophysical data acquired along the Scandicci Fault in the Careggi area (see locations in Figure 3). (A) Swath profiles P4 and P5. (B) Section stack SL4, showing the identified seismofacies.
Remotesensing 17 02644 g007
Figure 8. Geomorphological and geophysical data acquired along the Scandicci Fault on the banks of the Arno River (see locations in Figure 3). (A) Swath profile P3. (B) ERT2 section, processed using ViewLab software. (C) Merged seismic sections SL5A and SL5B, with a schematic line drawing presenting a tentative tectonic interpretation based on seismofacies and reflector patterns. (D) Location of seismic line SL5C: the section is shown in the Supplementary Materials, Figure S7.
Remotesensing 17 02644 g008
Figure 9. Geomorphological and geophysical data were acquired along the Scandicci Fault in the Scandicci area (see locations in Figure 3). (A) Swath profiles P1 and P2. (B) Section stack SL6, showing the identified seismofacies.
Remotesensing 17 02644 g009
Figure 10. Geophysical data acquired along the Maiano Fault on the bank of the Arno River (see locations in Figure 3). (A) 2D ERT3 profile processed using Res2DINV software. (B) High-resolution seismic reflection profile SL7, showing identified seismofacies.
Remotesensing 17 02644 g010
Table 1. Coordinates of swath profiles. Reference system is WGS84 (EPSG 4326).
CodeLongitude
Start
Latitude
Start
Longitude
End
Latitude
End
Figure 2B11.022543.893411.264443.7756
P111.186243.752211.195843.7461
P211.206443.761811.214243.7569
P311.224743.785511.244143.7756
P411.244543.803111.256443.8059
P511.246843.812211.254643.8104
Table 2. Summary of the main parameters of the geophysical prospections. Reference system is WGS84 (EPSG 4326).
CodeLong/Lat
Start
Long/Lat
End
Length
(m)
Depth
(m)
Geophones Distance
Shot Dist.
# Geoph.
/Electrodes
WavesMultifold
%
Method
SL111.2776
43.8070
11.2783
43.8077
100701 mtransv.4800PDM and WM
1 m
96
SL211.3108
43.7886
11.3113
43.7894
105801 mtransv.4800PDM and WM
1 m
96
SL311.1941
43.7899
11.1966
43.7893
1904402 mcompr.2400PDM and WM
2 m
96
SL411.2488
43.8137
11.2504
43.8134
119801 mtransv.3000PDM and WM
2 m
120
SL5a11.2187
43.7804
11.2239
43.7784
4754405 mcompr.1600PDM and WM
15 m
96
Sl5b11.2219
43.7792
11.2250
43.7780
2854403 mcompr.4800PDM and WM
3 m
96
SL5c11.2265
43.7776
11.2291
43.7769
190 2 mcompr.2400PDM and WM
2 m
96
SL611.1886
43.7504
11.1907
43.7489
2401703 mtransv.2000PDM and WM
6 m
80
SL711.2768
43.7651
11.2797
43.7651
1191201 mcompr.6000PDM and WM
2 m
120
ERT 111.1900
43.7898
11.2009
43.7874
95014010 m SDCA
96
ERT 211.2164
43.7812
11.2342
43.7755
157514010 m
156
SDCA
ERT 311.2729
43.7651
11.2816
43.7653
71010010 m Array Wenner
72
ERT 411.3242
43.7662
11.3341
43.7702
95014010 m Array Wenner
96
PDM: Point Density Mode; WM: Wiggle Mode; SDCA: Schlumberger and Dipole–Dipole concatenated arrays.
Table 3. Instrumentation used to capture field data for active seismic analysis.
Energiser1250 gr. Instrumented Hammer
10 kg Seismic Hammer
35 kg Hammer
Signal Generation
Horizontal geophones3.4 kOhm 4.5 HzConversion of seismic signal into electrical signal
Vertical geophones4 kOhm 100 HzConversion of seismic signal into electrical signal
SARA Do.Re.Mi. seismographDigitizers—24 bitA/D signal conversion and registration
Disclaimer/Publisher’s Note: The statements, opinions and data contained in all publications are solely those of the individual author(s) and contributor(s) and not of MDPI and/or the editor(s). MDPI and/or the editor(s) disclaim responsibility for any injury to people or property resulting from any ideas, methods, instructions or products referred to in the content.