Article

Urban Expansion and the Loss of Agricultural Lands and Forest Cover in Limbe, Cameroon

1
School of Geosciences, University of South Florida, Tampa, FL 33620, USA
2
Center of Urban Ecology and Sustainability, Suffolk University, Boston, MA 02108, USA
3
Plant and Environmental Sciences, New Mexico State University, Las Cruces, NM 88003, USA
4
Department of Education, University of Yaoundé 1, Yaoundé 00237, Cameroon
*
Author to whom correspondence should be addressed.
Remote Sens. 2025, 17(15), 2631; https://doi.org/10.3390/rs17152631
Submission received: 29 April 2025 / Revised: 30 June 2025 / Accepted: 8 July 2025 / Published: 29 July 2025

Abstract

Using LULC change detection analysis, it is possible to identify changes due to urbanization, deforestation, or a natural disaster in an area. As population growth and urbanization increase, real-time solutions for the effects of urbanization on land use are required to assess its implications for food security and livelihood. This study seeks to identify and quantify recent LULC changes in Limbe, Cameroon, and to measure rates of conversion between agricultural, forest, and urban lands between 1986 and 2020 using remote sensing and GIS. Also, there is a deficiency of research employing these data to evaluate the efficiency of LULC satellite data and a lack of awareness by local stakeholders regarding the impact on LULC change. The changes were identified in four classes utilizing maximum supervised classification in ENVI and ArcGIS environments. The classification result reveals that the 2020 image has the highest overall accuracy of 94.6 while the 2002 image has an overall accuracy of 89.2%. The overall gain for agriculture was approximately 4.6 km2, urban had an overall gain of nearly 12.7 km2, while the overall loss for forest was −16.9 km2 during this period. Much of the land area previously occupied by forest is declining as pressures for urban areas and new settlements increase. This study’s findings have significant policy implications for sustainable land use and food security. It also provides a spatial method for monitoring LULC variations that can be used as a framework by stakeholders who are interested in environmentally conscious development and sustainable land use practices.

1. Introduction

The United Nations projects that virtually all the world’s population growth between now and the middle of this century will emerge in cities of the developing world [1]. According to [2], urban expansion is driven both by natural population increases in rural areas and continued migration of people from rural to urban areas in search of economic opportunities [3,4]. Accordingly, urbanization is a socio-economic and physical spatiotemporal process that alters the rural landscape into urban form [5,6]. Urban and residential area expansion causes losses in agricultural lands and forest cover through processes that consume both land and timber resources [7]. As urban areas expand, they tend to grow into adjacent agricultural areas, affecting rural livelihoods [8]. Likewise, the need for both land and timber resources can also lead to losses in forest cover in and around cities [9], negatively affecting agroforestry production, biodiversity, and ecosystem services [10,11]. Consequently, agricultural and forest losses associated with urbanization directly affect the quality of the lives of people residing in cities [12,13,14]. In general, the extent of urbanization and/or its growth propels changes in the land use/land cover (LULC) pattern across many cities in sub-Saharan Africa (SSA) [15,16].
To better understand the dynamics of urbanization and its challenges, digital change detection techniques using multi-temporal satellite imagery can be helpful in monitoring land conversion [17,18,19]. Time-series remotely sensed data provides options to analyze the temporal dynamics of urban attributes or processes, which are important for identifying drivers of change over time [20,21]. Because of their availability and long-term archive, Landsat images have been widely employed in land use/cover classification and change detection at regional scales [22,23,24], particularly in areas where newer, higher-resolution imagery is unobtainable, like SSA [25,26,27].
Remote sensing/GIS change detection analyses of multi-temporal satellite imagery help in understanding landscape LULC dynamics [28]. Several studies have been conducted concerning LULC changes using GIS and remote sensing classification to comprehend and investigate the dynamics of urbanization and the prediction of change as well as its consequences on other LULC [26,29,30,31,32]. In addition, the current progress, challenges, and opportunities of LULC change analysis have been reviewed, and this has remarkably enhanced and accelerated the evolution and growth of LULC mapping [32,33]. Despite technological advancements, accurate LUCL classification and prediction remain a challenge to many researchers. Machine learning (ML) and artificial intelligence (AI) have gained prominence in a wide range of scientific applications, including land cover monitoring [34,35]. For example, Google Earth Engine (GEE), with its multiple machine learning algorithms, is now the most powerful open-source global platform for quick and accurate LULC classification, and this has served as a fundamental basis for efficient monitoring of urban land use change and planning [36].
Cameroon, like many countries in SSA, has been experiencing urbanization over the past decades, and this has led to urban sprawl in major cities [37]. Data from the [38] reveal that there has been an increase in the percentage of the total population residing in urban areas in Cameroon from 2010 to 2020. For instance, in 2020, the proportion of the population of Cameroon living in urban areas was 57.6%, approximately a 6% increase in a decade. In 2015, agriculture contributed approximately 22.82% to Cameroon’s GDP [39]. Agriculture alone involves as much as 70% of the economically active population and generates a third of foreign exchange earnings and 15% of budgetary resources [39]. Although studies have explored urbanization in Cameroon [40,41,42] LULC dynamics have been little studied in smaller, coastal cities.
Limbe, a coastal city in Cameroon, has experienced rapid urban growth over the years, creating significant pressures on forest and agricultural lands [43,44]. Thus, this study seeks to identify and quantify recent LULC changes in Limbe, Cameroon, using remote sensing (RS) and geographic information systems (GISs). The goal is to measure rates of conversion between agricultural, forest, and urban lands between 1986 and 2020 for the purposes of unravelling LULC dynamics and the drivers of urbanization in Limbe. The deployment of LULC classification methods and the implications of present land use change on livelihoods and food security have not been explored in smaller coastal cities in Cameroon, and this is the gap that this study seeks to fill.

1.1. Background Literature

1.1.1. Historical Patterns of Land Use Change in Limbe

Land use patterns in Limbe can be traced back well before the colonial era. According to [45], shifting cultivation and indigenous farms of sedentary/permanent agriculture were the primary land uses across SSA before colonization. LULC such as forest and agriculture systems, which supported food security, manufacturing, and trade in Africa, existed before the arrival of Europeans [46]. In addition, the Limbe area was dominantly rural, and agricultural land and forest cover were predominantly the LULC types before the arrival of the colonialists [47]. Historically, the dynamics and pattern of LULC change is linked to Cameroon’s land tenure and policy implementation systems. Before the age of exploration and colonization, there was communal land ownership. Hence, chiefs, traditional authorities, and family heads executed land ownership, distribution, and development [47,48].
The exportation of slaves and goods like palm kernels from the Limbe area during colonization led to a number of changes in land administration. The Germans initially established land concessions for agricultural purposes, assuming ownership of customary land and forest. This land grabbing simultaneously positioned and consolidated a system of trade based on maximizing capital in the city [49]. The Germans also introduced plantation agriculture, which led to the development of a seaport, residential quarters, commercial trading centers, and social amenities for their workers. The Germans also built smaller railways and roads connecting their plantations as well as developed low-density, medium-density, and high-density residential areas for their workers [50].
The colonial rulers were the initiators of land use change, particularly urban planning and development, transportation infrastructures, housing, and spatial organization, during the colonial period [47]. Under the subsequent British colonial administration (1919–1960), the Cameroon Development Corporation (CDC) was created from the amalgamation of German plantations around Mount Fako in 1947 [51,52]. The CDC consolidated these plantations into a large, parastatal agribusiness, further changing land ownership and agricultural practices in the area [53]. The main aim of the CDC was to develop tropical crop plantations like banana, rubber, and oil palms for exportation and the national market [54]. Colonial effects still shape the pattern of LULC in modern-day Limbe. In particular, the policy of CDC land surrendering.
Another historical practice, which has persisted and contributed to the pattern of LULC change in Limbe, is CDC land surrendering. Ordinance No. 39 of 1946 led to the development of the CDC in 1947 through certificates of occupancy for sixty years, where these lands would be developed for the good of all people [52,55]. By surrender’s deed, the CDC surrendered all its rights, titles, and responsibilities under the previous occupancy certificates to the Bakweris. By the same deed, the Southern Cameroon government agreed to lease all those lands to the CDC for a term of ninety-nine years. These powers were capitulated to the West Cameroon government, and it was agreed that at the end of the 99 years after the lease expires, both the government and the CDC would surrender the land to the rightful owners, which are the natives [52]. Increasingly, these surrendered lands have facilitated the mechanism of transformation and growth of Limbe from a primarily underdeveloped rural and agricultural-oriented community to an urban community in the latter half of the 20th century [52].

1.1.2. Contemporary Drivers of Land Use in Limbe

The city of Limbe is presently responding to the change in cultural, social, and economic conditions, and this in effect has changed LULC pattern over time. Many of these changes are executed by the city council, private landowners, and land managers [47]. In addition, drivers such as human population growth, with additional food needs and increased consumption, a rise in wealth and urbanization levels, and increased transportation and road connections have contributed significantly to land use change in Limbe. Population growth in terms of natural increase and an increase in migration have also contributed remarkably to the expansion of this city. However, it is crucial to examine these factors acting as a population trap to the growth of Limbe from political, environmental, economic, and socio-cultural perspectives.
Politically, Limbe is the administrative headquarters of Fako Division, one of the seven administrative divisions in the southwest region (SWR) of Cameroon [43,56]. The city of Limbe is and was one of the most stable municipalities in the SWR that attracted displaced people during periods of unrest in the country, leading to changes in LULC. From an economic standpoint, fishing activities, and the CDC’s vast agro-industrial palm, rubber, cocoa, plantations around the Limbe area [57], dating as far back as the German and British colonial period, have encouraged the migration of people from western regions of the country and also from neighboring Nigeria [58,59]. In addition to the CDC plantations, which account for the second highest employer of persons in the nation, the National Oil Refining Company Limited, generally referred to as SONARA. This company was created in 1973 and has operated as the only crude oil refinery in the country, has also pulled in immigrants in this area beginning from the late 1970s and early 1980s [60].
Socially, the introduction of schools during and after the colonial periods has served as a pulling force for migrants to Limbe. Furthermore, improvements in accessibility (road network) and the provision of socio-economic services, as well as its hosting of interesting cultural events and touristic potentials, have resulted in a massive influx of migrants, particularly those from Cameroon’s grassland regions seeking better economic opportunities [61].
From an environmental viewpoint, the coastal zones of Limbe and their surroundings have high rainfall, ocean, forest, and fertile volcanic land, which support plantation agriculture and small-scale farming. These forces of LULC changes have increased the conversion of viable agricultural lands to residential quarters and forest cover to residential areas and agricultural land, thus leading to the rapid urbanization in Limbe. About 50% of land in Limbe was classified as having either high or very high vulnerability to flooding, while about 9% of Limbe was classified as very low risk, suggesting that most of the land area is susceptible to flooding [62].

2. Material and Methods
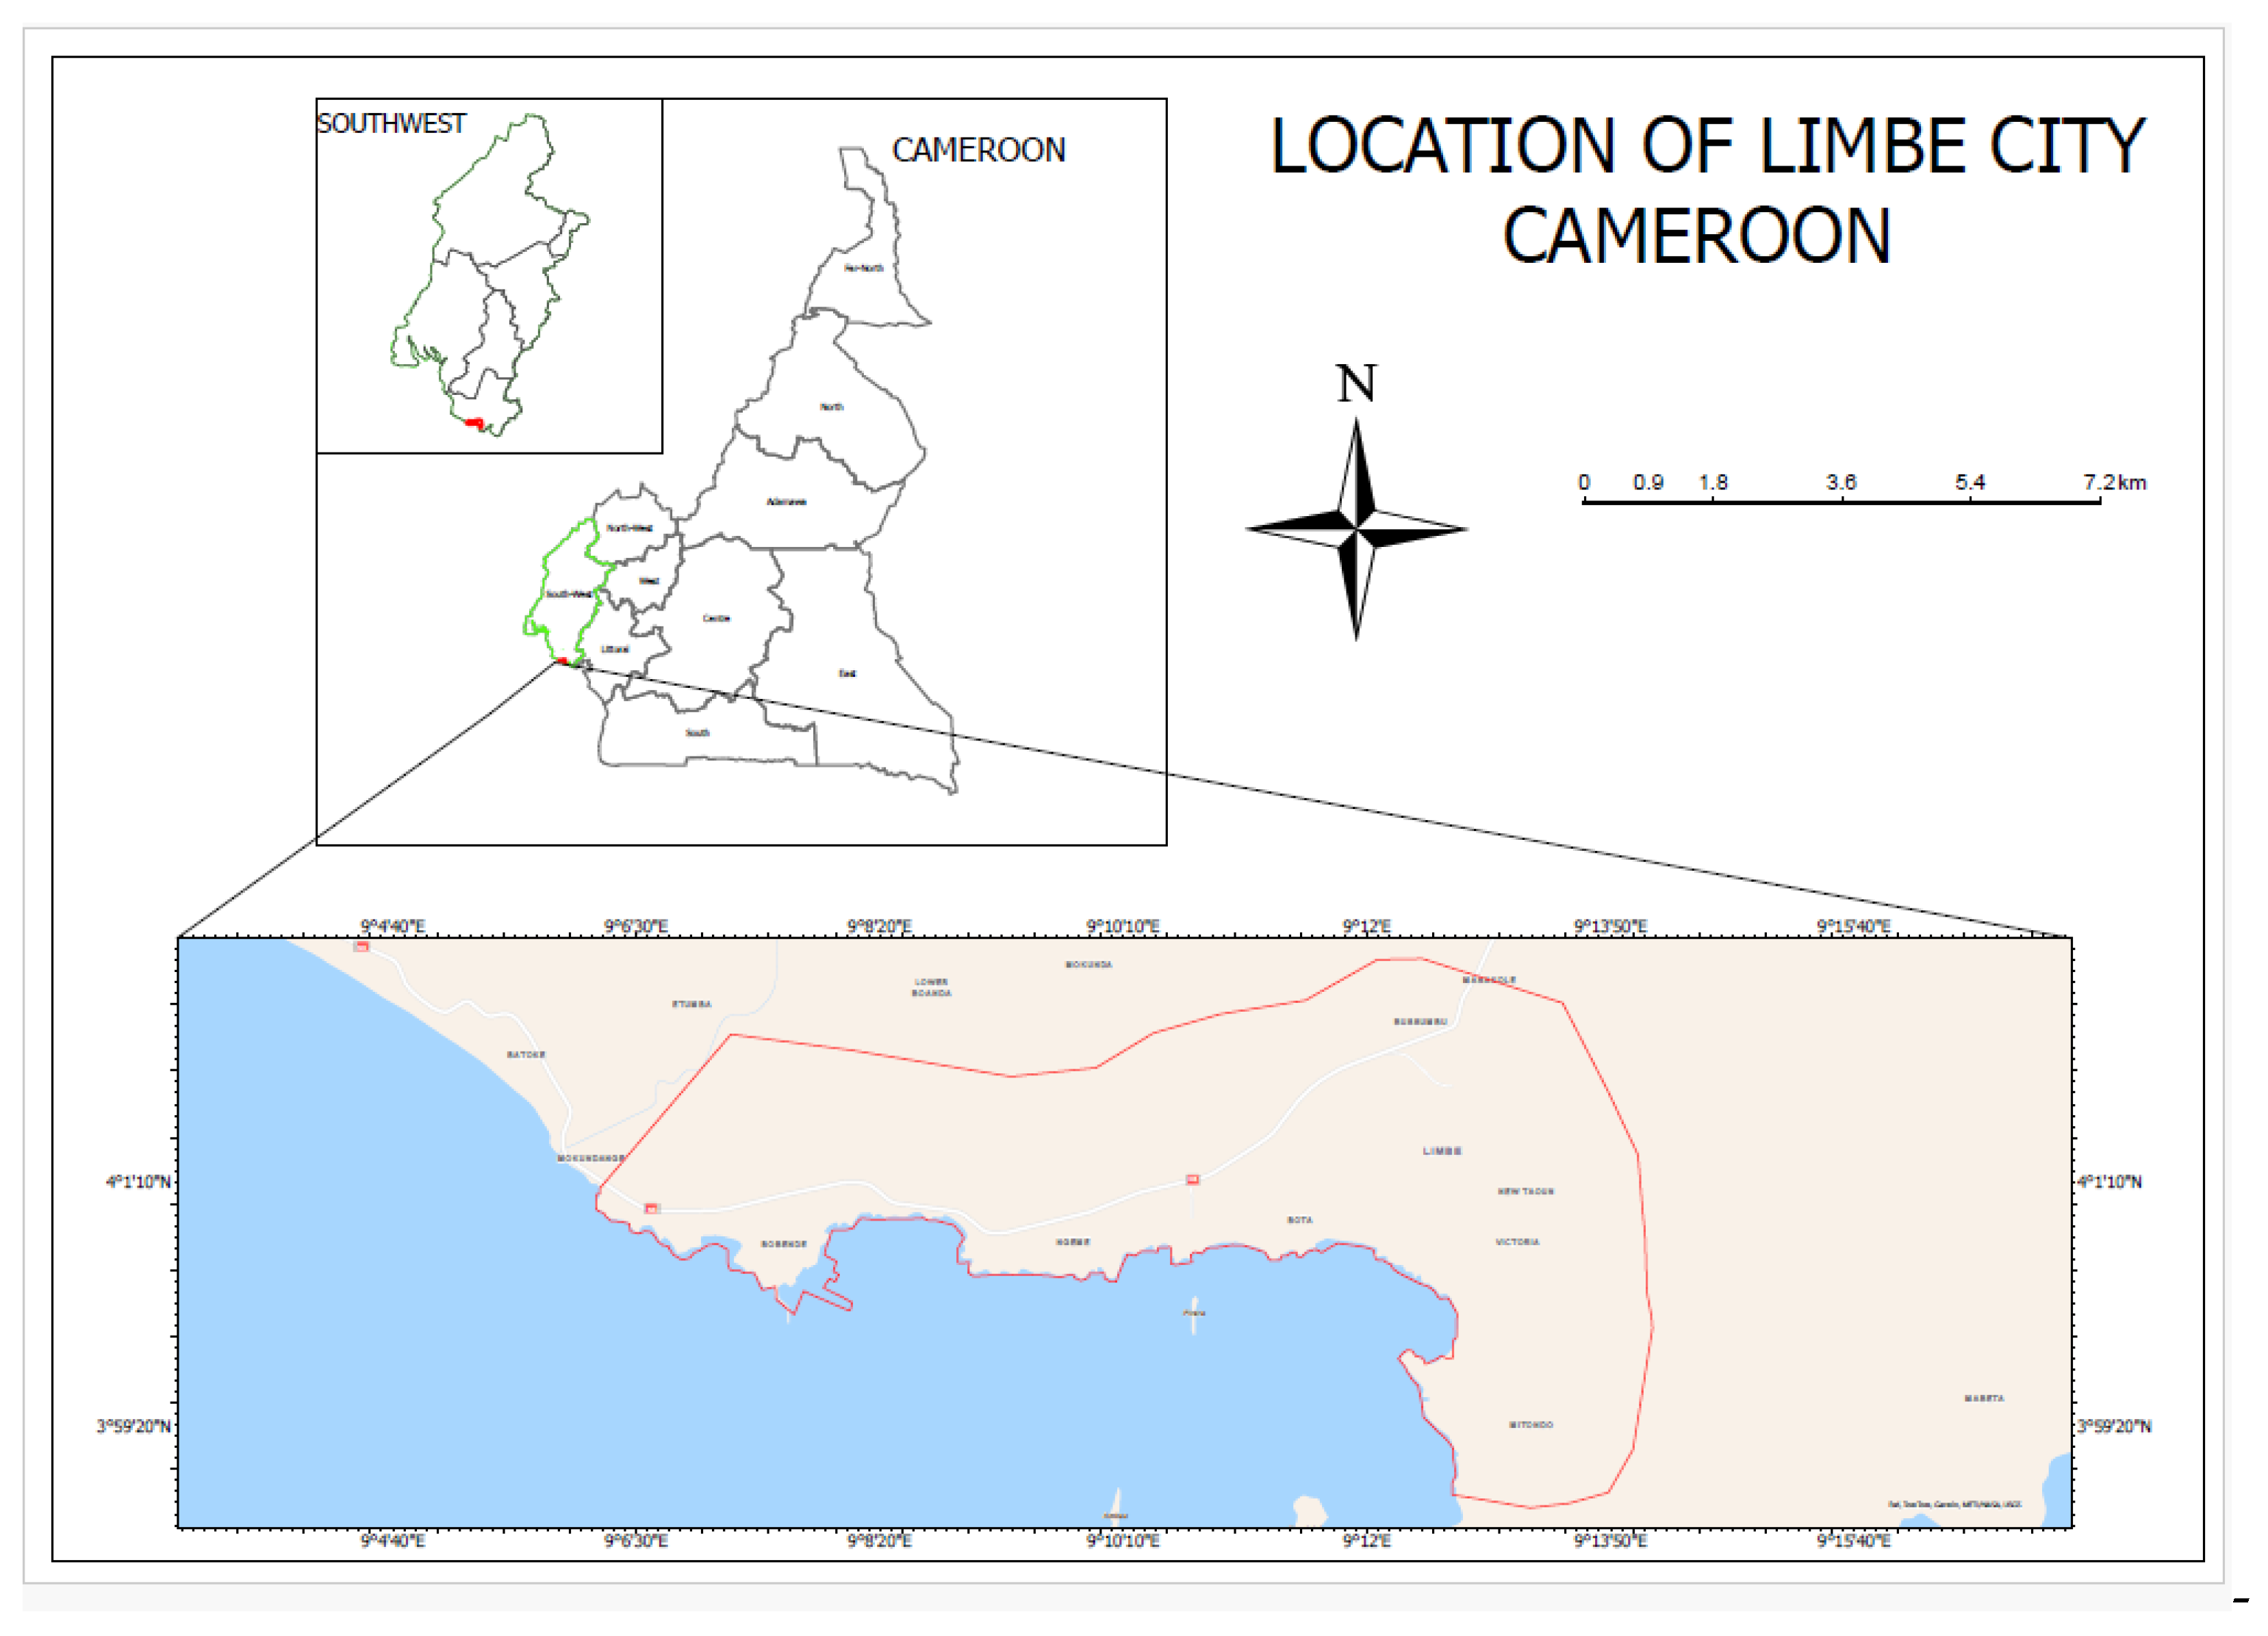
2.1. Study Area

Limbe is a small coastal city located in Fako Division, southwest region of Cameroon, around the periphery of Mount Cameroon. The city has a population of approximately 250,000 inhabitants [63] within a 671 km2 area. It is one of the fastest-growing cities in the country and also one of the densest, with 220 people per km2 [64], and the Bakweri, Isubu, and Wovia make up the indigenous people [65]. Limbe is a beautiful city with historic monuments, a botanical garden, coastal beaches, and a wildlife center. This city not only harbors international tourists but is the major petroleum and agricultural center of Cameroon. The National Oil Refinery (SONARA) and a vast majority of the CDC’s banana, palm, and rubber plantations are located around the city [47]. Plantations are distributed over a majority of the most favorable lands for settlement around the city. The location of Limbe City is depicted in Figure 1.

2.2. Image Classification

Image classification involves assigning pixels in an image to one or several classes. A thematic map is generated during image classification [66,67]. During the process, each pixel is treated as an individual unit, and by comparing pixels of unknown and pixels of known identity, it is possible to assemble groups of pixels into classes. The detail of each class depends upon the spectral and spatial resolution properties of the image. Landsat TM imagery is usually considered adequate for creating general thematic maps with a spatial resolution of 30 m. Supervised maximum likelihood classification (MLC), which has the capability to attain high accuracy and more detailed information, was used for this study [68]. According to [68], MLC has been the most widely utilized classification method from the past to the present and has attained great accuracy in all locations when compared with other techniques. The supervised classification method includes procedures for using samples or training areas of known identity determined by analysts to tell the software to classify pixels of unknown identity (unclassified pixels) [69,70]. However, other methods like unsupervised classification methods were tested and supervised MLC yielded better accuracy and efficiency for the selected datasets and the research objectives.
In this case, the training and test data for regions of interest (ROIs) were delineated using Google Earth imagery and historical data and information from peer-reviewed articles [47,71]. The training data for 1986 and 2002 were selected based on the 1986 Google Earth images as well as information and data from studies [47,61]. The training and test data for the 2013 image was gathered by visually interpreting the raw data from the 2013 Landsat images. The 2020 training data were chosen based solely on 2020 Google Earth imagery, which had a better resolution than the previous years. The specific images were selected because their cloud cover over the study area ranged from 0 to 15%. In addition, the training data were randomly selected throughout the entire image, and these were spectrally homogenous areas. The general rule is that the training data were extracted from a number of spectral bands (n) and then more than 10n pixels of training data were collected for each class [72]. Each class has a minimum sample size of 10 ∗ n and thus the total minimum training class size is as follows:
10 ∗ n ∗ c,
where c is number of classes.
Since the Landsat imagery were relatively moderate-resolution images [73], pixels were assigned to one of only four LULC classes: urban, forest, agriculture, or water. The urban area is composed of residential and industrial areas, commercial and transportation services, bared and paved surfaces, beaches, and communication and utilities. The agriculture area is made of farmlands under cultivation or harvested, agroforestry, cropland, and mixed cropping. Furthermore, mixed forestland and oil palm plantation make up forest, while water consists of ocean, rivers, and lakes.
The accuracy of the LULC classification was computed using standard metrics in RS. First, a confusion matrix was used to assess the accuracy of the image classification. This process involves comparing two classified images either using the classification and the truth image or a classified image and ROIs [74,75]. This method compares the classified map to a reference map to determine the accuracy of image classification. The confusion matrix (ground truth as ROIs) was employed due to the absence of a truth image or aerial photo. Second, another set of ROIs (test data) were used to compute the classification accuracy. Lastly, the assessment of classification accuracy was measured and expressed in terms of the kappa coefficient, overall accuracy, and users’ and producers’ accuracy. The kappa coefficient measures the agreement between classified images and truth values. A kappa value of 1 shows perfect agreement, while a value of 0 indicates no agreement [76]. The overall accuracy is computed by adding the number of correctly classified values and dividing by the total number of values of the reference data [74,77]. Furthermore, the user’s accuracy is calculated by dividing the number of correctly classified pixels in each class by the total number of pixels classified in that class [78]. This accuracy essentially informs us how often the class on the map will be represented on the ground. Meanwhile, the producer’s accuracy is calculated by dividing the number of reference pixels in one class by the total number of pixels obtained from reference data [74]. The accuracy measures how well a certain land cover on the ground has been classified.

2.3. Data Collection and Description

Image data was obtained from the United States Geological Survey (USGS) website using the Earth Explorer (Table 1) (https://www.usgs.gov). The images used are Landsat imagery from four different years: 1986, 2002, 2013, and 2020. Landsat data were used because their spatial resolution is suitable for land use change detection analysis, as they are a reliable data source on urban area change and potential triggers of landscape transformation [73]. The 1986 data is from the Landsat Thematic Mapper ™ 4 and 5 sensors carried on Landsat 4 and Landsat 5, and images consist of six spectral bands with a high spatial resolution of 30 m for Bands 1–5 and 7, and one thermal band (Band 6). The Landsat images for 2002 and 2013 are from the Landsat Enhanced Thematic Mapper Plus (ETM+) sensor carried on Landsat 7, and these images are made of seven spectral bands with a spatial resolution of 30 m for Bands 1–5 and 7 [79]. The 2020 images are from Landsat 8 OLI/TIRS (Operational Land Imager/Thermal Infrared Sensor). As described by [79], the images consist of eleven bands with nine spectral bands, with a spatial resolution of 30 m for Bands 1 to 7 and 9. The other bands can be used for different purposes. For example, Band 1, which is ultra-blue, is useful for coastal and aerosol studies, and Band 9 is useful for cirrus cloud detection. The images have 6 bands, with Bands 1, 2, and 3 in the visible spectrum of light and Bands 4 and 5 in the near-infrared and middle-infrared spectrum, respectively.
In addition, the population statistics for each of the years were obtained from the literature (Table 1). The downloaded images were processed using the ENVI Classic environment, a digital image processing software package. The images were pre-registered, and there was no need for atmospheric correction. As stated on the USGS website, these images are Landsat Collection 2-level 1 data that has undergone several data processing, geometric, and radiometric improvements, along with a new data distribution process. The study area was extracted for analysis using a delineated boundary file for the city of Limbe.

2.4. LULC Change Detection Analysis

Change detection is a technique used to determine the state of a particular region at different time periods. This process involves comparing changes across images of the same geographic location taken over two or more time periods. These techniques encompass a broad range of methods used to identify, describe, and quantify differences between images of the same scene at different times [81,82]. Change detection using the post-classification comparison technique was used in this study to determine how LULC were converted into one another over time. LULC change detection was also performed in ArcMap 10.7.1 using the Intersect tool, which involves overlaying two or more LULC datasets from distinct time periods to identify places where land cover has changed. This technique generates a new dataset that includes the attributes of the original datasets, allowing for change analysis by evaluating the attribute table for differences in LULC classifications. According to [83], this is the most evident form of change detection, and it necessitates the comparison of images that have been identified independently. Furthermore, using the post-classification distribution summary, the change detection of each class or land use type was computed. In addition, the LULC maps were converted into vector formats to analyze the direction of change over these years. Figure 2 represents the workflow of the methodology used for land use change detection analysis in this study.

3. Results

3.1. Classification Accuracy and Results

Results of the accuracy assessment for each of the multi-temporal satellite images (1986, 2002, 2013, and 2020) are reported in Table 2. From the Table, 2020 images have the highest overall accuracy of 94.6 while 2002 images have an overall accuracy of 89.2%. In this analysis, the producer’s accuracy (PA) and user’s accuracy (UA) range from 74.2% to 100% and 76.5% to 100%, respectively, from 2002 to 2020. In 2002, agriculture PA had slightly low accuracy due to poor image quality and cloud cover, which hindered the acquisition of precise training data for agriculture.
The classification maps for the four years of study illustrate how the spatial distribution of LULC in Limbe has changed over time. Figure 3 shows a diagrammatic representation of classification findings acquired from multi-temporal satellite images and also depicts the pattern of land use/cover over time. It shows that the LULC changes take two forms: the conversion of one class into another and the modification of the condition within one class. As seen in Figure 3, there is the conversion of forest into urban areas as well as the encroachment of urban activities in agricultural areas. Water has remained constant over time, and these changes have been consistent over the period of study. There is also the loss of forestland as a result of increased agricultural activities.

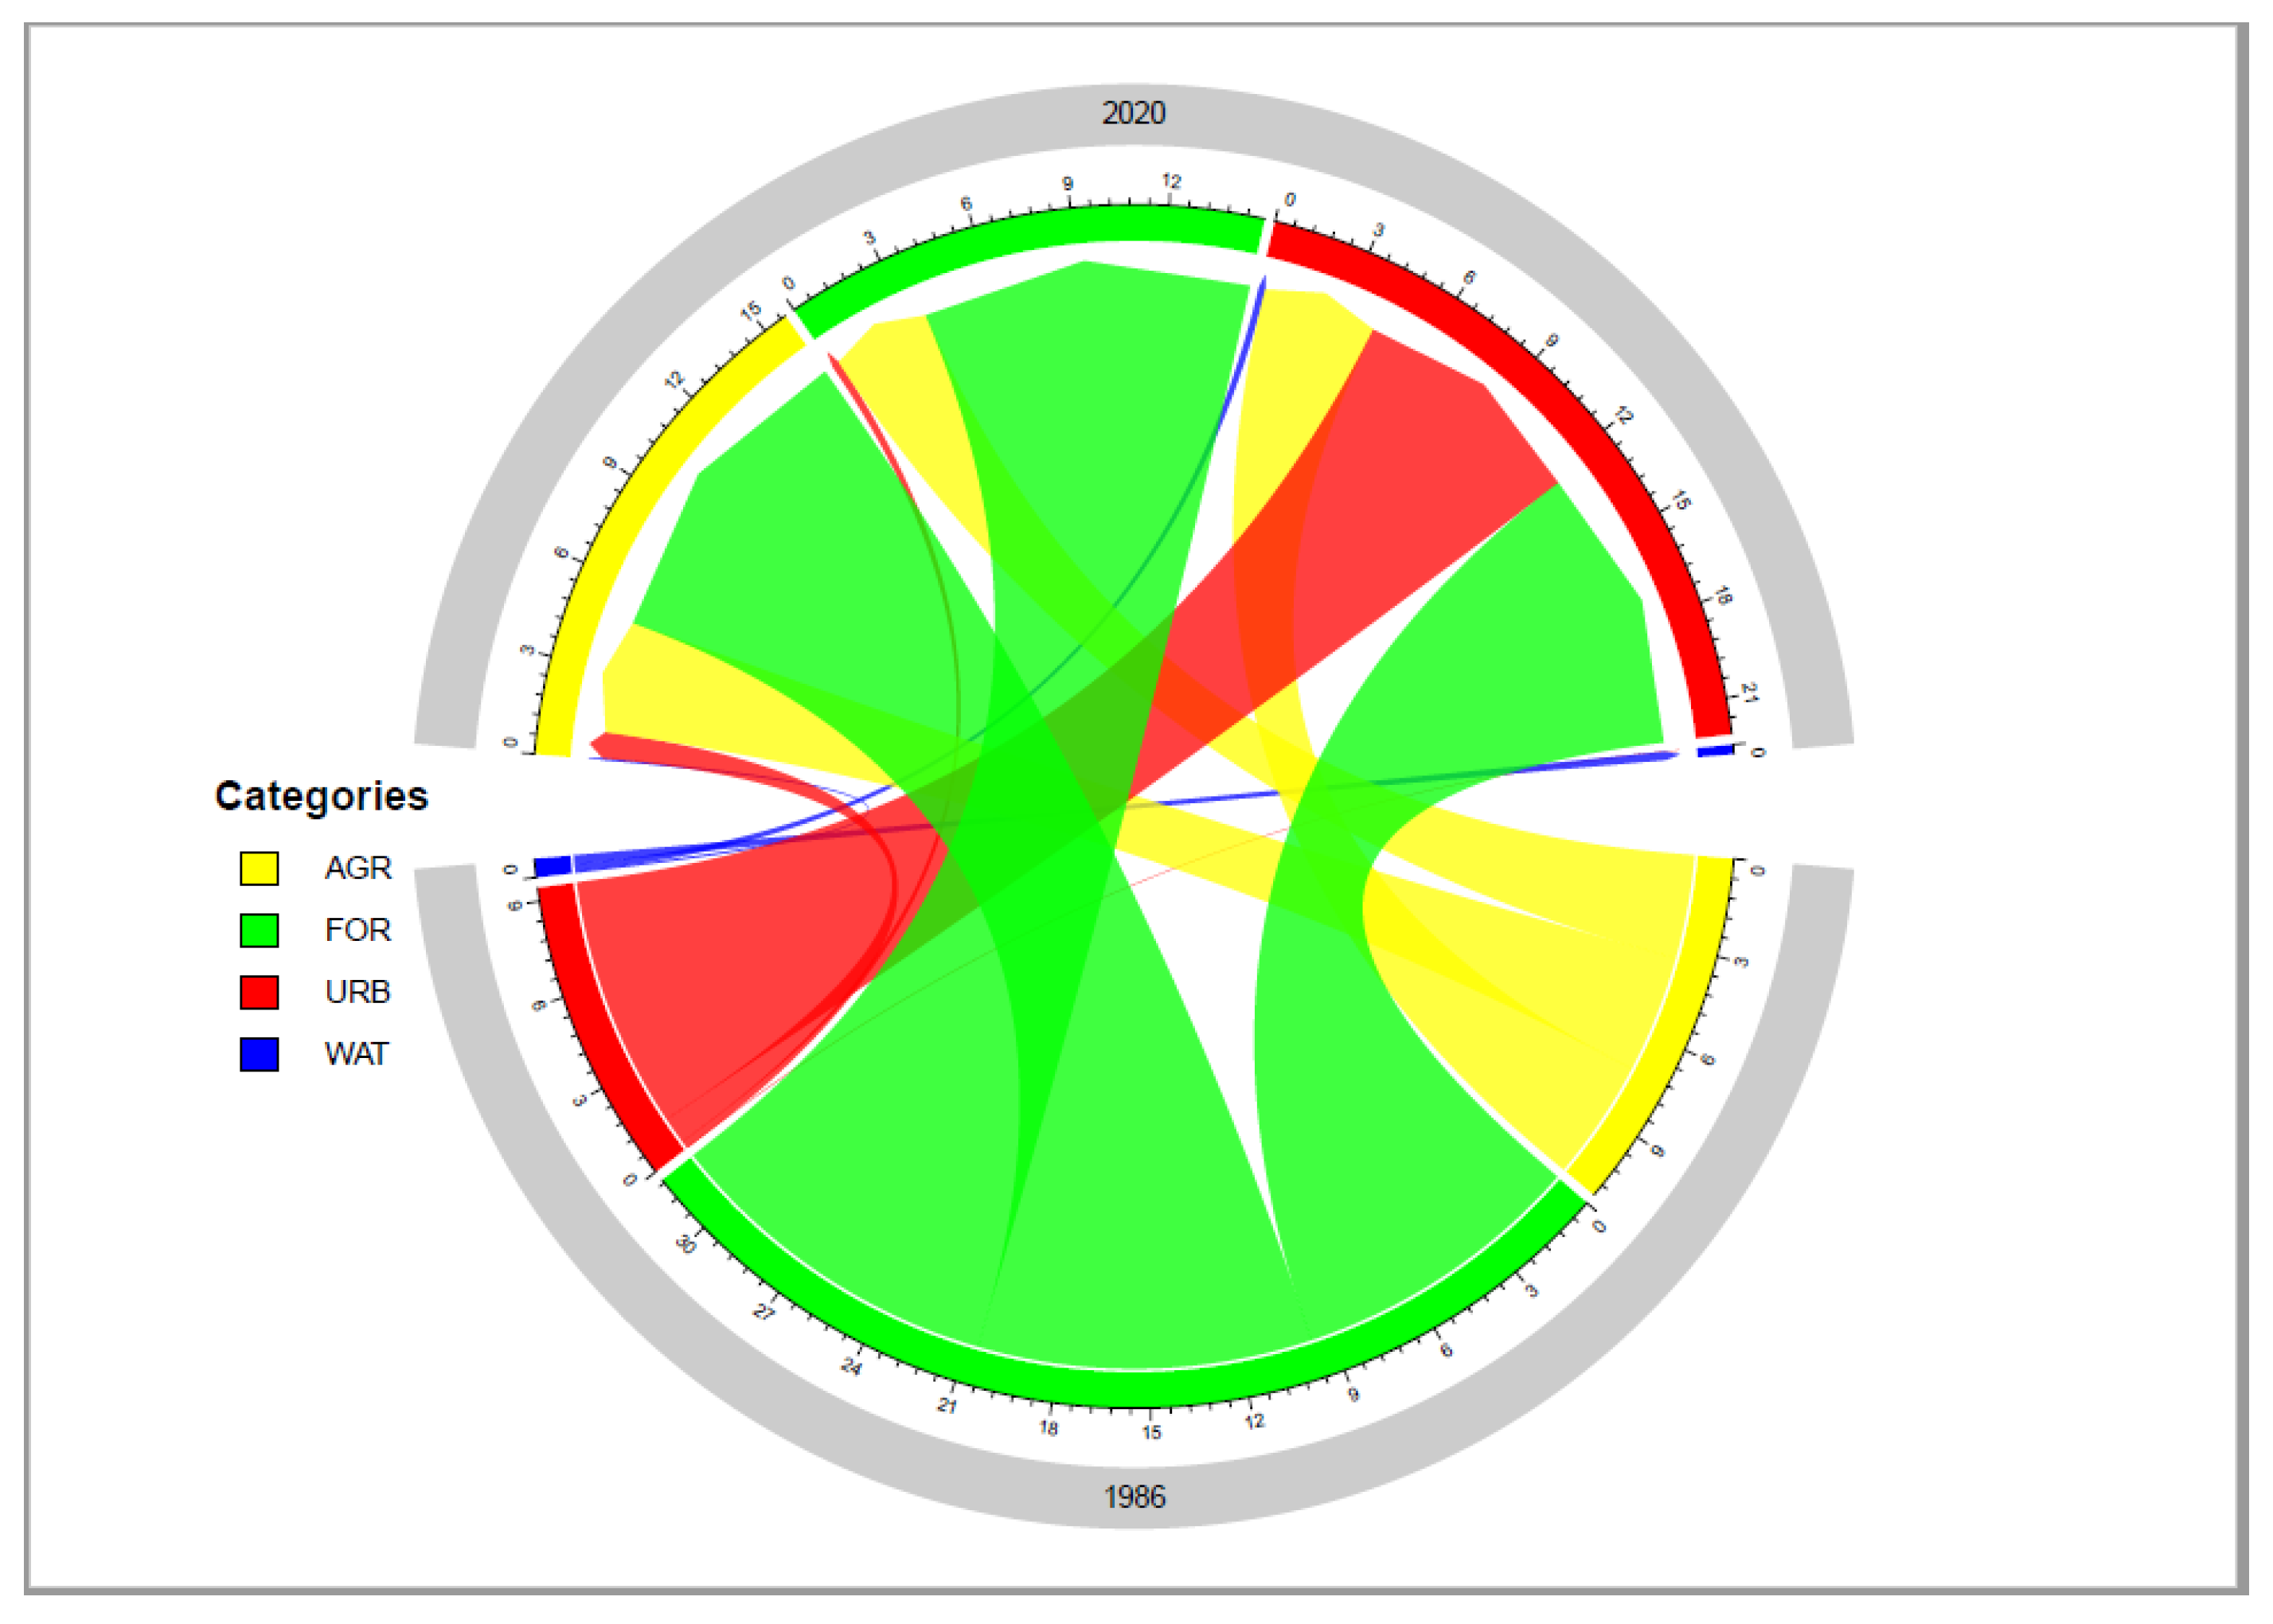
3.2. Change Detection Analysis

Results obtained from the classified images in Table 3 indicate the areas occupied by the four classes. From Table 3, agriculture increased in 2002 by approximately 7.8% and in 2013 by about 6.7%. There was a decrease in agriculture by approximately 6% in 2020. A significant decrease was recorded in forest from 2002 to 2013 by 18.5% while forest slightly decreased from 1986 to 2002. Furthermore, the classification results reveal that urban area increased only slightly from 1986 (17.6%) to 2002 (18.9%) but increased to 30.4% by 2013 and 41.5% by 2020.

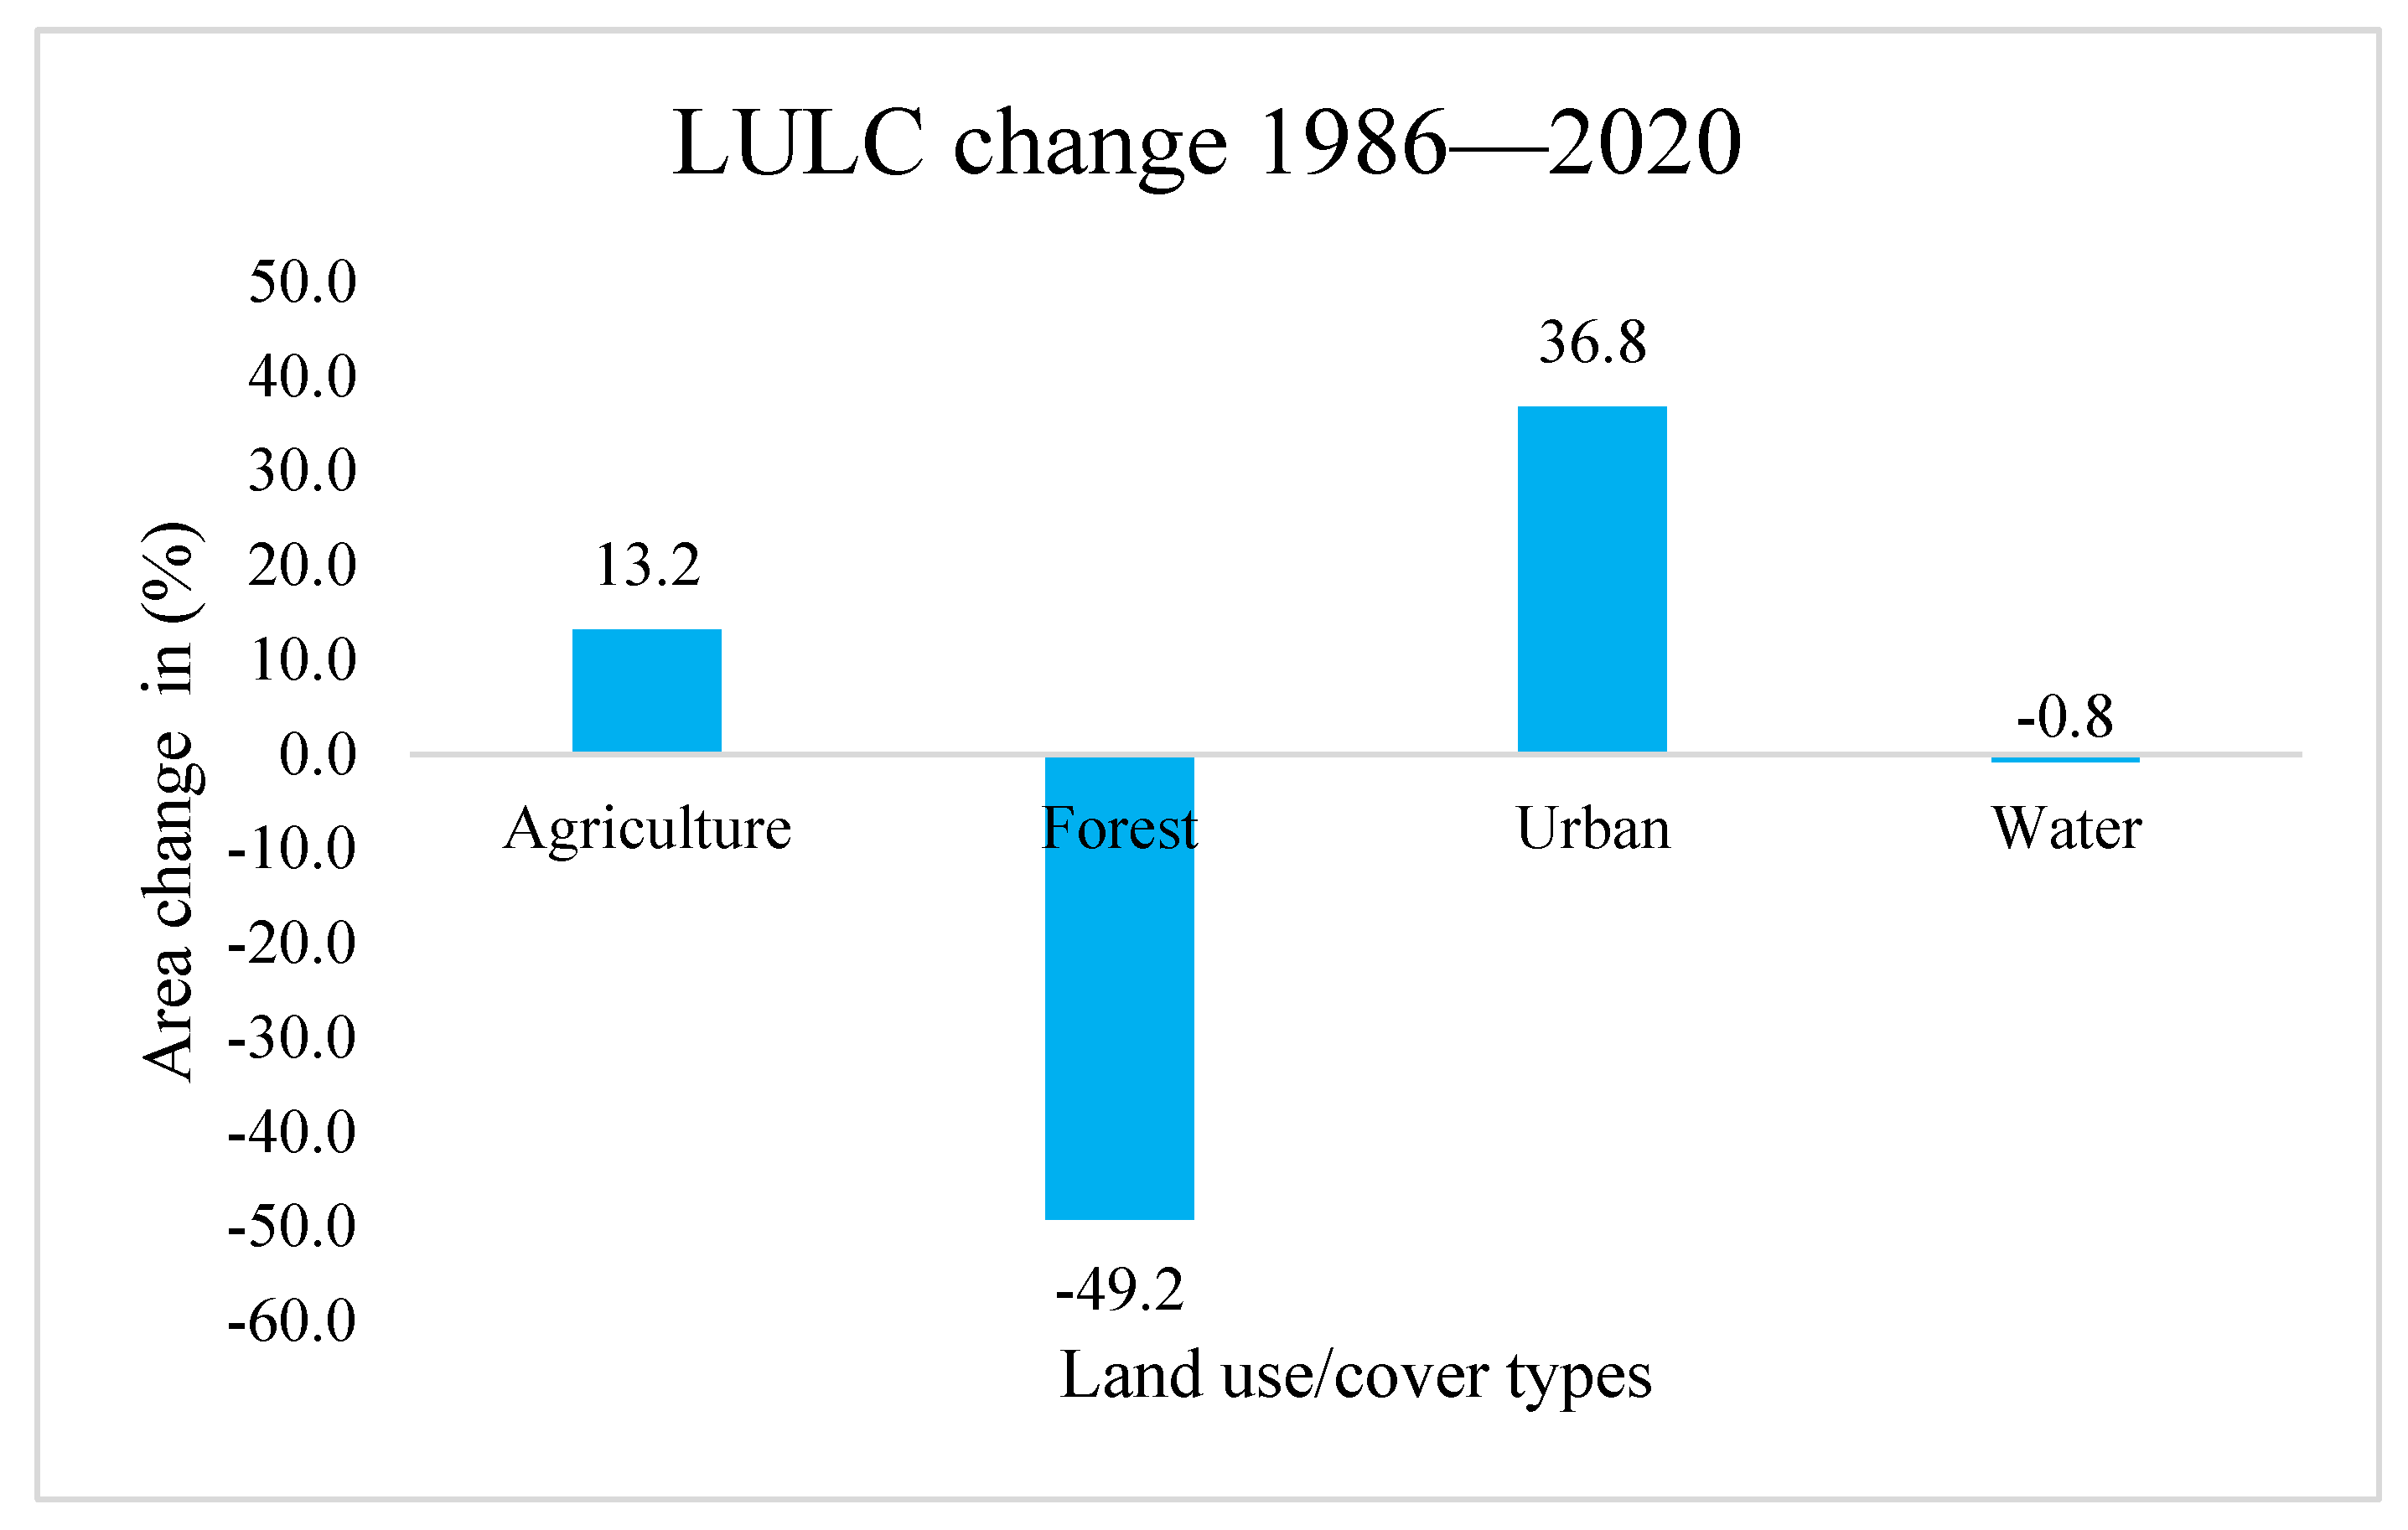
Overall Gain and Loss from 1986 to 2020

Table 4 displays the extent of change in various LULC classes from 1986 to 2020 as well as the intermediary years. Figure 4, Figure 5 and Figure 6 depict the magnitude of land change associated with each indicated LULC type in this study, both in diagrammatic and graphic formats. In addition, the specific direction of these changes is shown in Table 4. A virtual analysis of these images indicates that there has been a significant change in LULC type in this study area. For instance, the urban area significantly increased from 1986 to 2020. On the contrary, the forest area reduced remarkably over the same period.
From the results above, except for the water area, which experienced only minor changes over the study period, all other LULCs have undergone significant changes. Both agriculture and urban space increased in the first 14-year (1986–2002) and the second 11-year (2002–2013) periods of this study. The forest area is the only LULC type to have suffered great reduction during these study periods. It can also be deduced from the findings that, since 2013, only urban area has increased, while agriculture and forest areas have decreased.

3.3. LULC Change Pattern

Table 5 indicates the LULC change matrix in the study periods of 1986–2001, 2001–2013, 2013–2020, and 1980–2020. The table demonstrates significant land cover changes in Limbe City. The following sections discuss the dynamics and patterns of LULC change and some of the driving forces responsible for these changes in Limbe City over the study periods. The numbers in bold letters show no change in LULC categories over the specified period.

3.3.1. LULC Change Pattern from 1986 to 2002

Between the 1986 and 2002 study period in Table 5, there were significant shifts from agriculture to forest. A total of 6.9 km2 of agriculture was changed to forest. About 0.7 km2 of agriculture was converted to urban areas during this period. In addition, nearly 1.5 km2 of urban areas were changed to agriculture. The results in Table 5 reveal that while about 2.2 km2 of forest areas in 1986 were changed to urban, about 10.3 km2 was converted to agriculture in 2002. Much of the land area previously occupied by forest is declining as pressures for urban areas and new settlements increase.

3.3.2. LULC Change Patterns from 2002 to 2013

During this time, the change rate of agriculture and urban areas increased, while the change rate of forest continually decreased. Similar to the changes observed between 1986 and 2002, the amount of agriculture that was converted to urban increased to nearly 4.3 km2 while the conversion of agriculture to forest was 4.1 km2, partially due to agroforestry and the continuation of reforestation programs. Additionally, almost the same amount of about 11.0 km2 and 2.8 km2 of forest was changed to agriculture and urban area, respectively, in this period, as presented in Table 5. The change of agriculture to urban far exceeds the change from urban to agriculture.

3.3.3. LULC Pattern from 2013 to 2020

As seen in Table 5, about 5.1 km2 of agriculture changed to forest for the same reasons cited in the other study periods. Contrary to this, about 6.2 km2 of forest was lost to agriculture again, mostly due to traditional farming and the increase in agroforestry systems. In addition, about 6.1 km2 of agriculture was transformed into urban areas because of population growth (Table 1). Even though the same forces are responsible for these changes, cultural tourism contributed greatly to the dynamics of LULC in Limbe City during this period.

4. Discussion

In this study, the image classification was assessed, and the overall accuracy was considered acceptable when compared with the subjective kappa coefficient scales suggested by [84]. The author suggested different degrees of agreement for the kappa value as follows: <40 percent very poor to poor, 40–54 percent fair, 55–70 percent good, 70–85 percent very good, 85 percent excellent, and 99 percent as perfect. Using these levels of agreement, classification accuracy indicates very good to excellent agreement. The same scales of agreement have been applied by several authors to evaluate their classification accuracy results [85,86,87,88]. Although the classification results’ accuracy was very good, the images could not precisely distinguish the different types of agricultural land, which is a limitation in this study. In addition, the inability to differentiate agroforestry from natural forests is another limitation because medium-resolution images can only generate rough estimates of forest loss in an area.
The images of this study go as far back as the 1980s; hence, any land use change before the 1980s is not included in the analysis due to the lack of satellite data. Another limitation of this study is the persistent cloud cover that can obscure the surface of the land, making it difficult to obtain good-quality images for the change detection analysis. However, many studies have assessed the changes in broad LULC and, to a certain extent, the driving forces of the dynamics and pattern of LULC in Limbe [47,61,89] due to the scarcity of information and data on changes in spatiotemporal patterns of LULC, especially the transition from one land use to another, current driving forces, and their implications for sustainable development.

4.1. LULC Pattern from 1986 to 2020

The conversion of agriculture to forest from 1986 to 2002 can be associated with the Cameroonian government’s efforts to fight climate change and implement the clean development mechanism (CDM) of the Kyoto Protocol. Cameroon created the 1994 New Forest, Wildlife and Fisheries Law, which was a revision of the Forest Law of 1981 [90]. This law led to the creation of community forests such as Bakingili Community Forest, Mount Cameroon Forests, among others. The Mount Cameroon Forest Project was created in the early 1990s to incorporate the renovation of the Limbe Botanic Garden as well as conserve the forest and biodiversity around Mount Cameroon [91]. These forest cover initiatives have contributed to the dynamics of land use in Limbe.
From these observations and the population statistics in Table 1, it can be explained that the shift from forest and agriculture to urban land use was a result of population growth from 2002 to 2013. This can be associated with the effect of independence, which has grown alongside land subdivisions or parceling in direct correlation with rising human populations, leading to land use variations [47]. As a result, forest and agriculture areas continued to dwindle in favor of more competitive urban land uses such as residential areas, commercial centers, administrative buildings, and even industries like SONARA. In addition, commercial land uses including clubs, banks, credit unions, and hotels also increased during this period [43,47]. In addition, the increase in plantations can be linked to the corresponding increase in urban areas. The creation of more plantations by the CDC in the 1980s led to the occupation of enormous areas of land and provided a pathway for immigrants from across the country to seek job opportunities in Limbe [89]. As a result, there was an increase in residential quarters and social amenities like hospitals and schools by the corporation for their workers.
Based on these observations and the population data of 2013, urban uses had a significant impact on forest cover and agriculture from 2002 to 2013. Population growth, increased demand for land, irregular land subdivisions, and CDC land surrendering were the major driving forces influencing these conversions during this period. As noted by [47], the CDC land surrendering, as well as the declining state lands, have paved the way for new residential and commercial developments via New Layouts (NLOs). In addition, the annual Limbe Festival of Arts and Culture (FESTAC) event, which started in 2014 [92], has influenced the pattern of LULC, as more land is needed for commerce during this period.
One remarkable dynamic of the LULC change pattern observed in this study is that not all of the forest-to-urban land use transition seen between 1986 and 2020 was due to direct conversion; a majority of this land use was changed to agricultural land. From these observations, one will agree with [61] that deforestation in Limbe is primarily linked to the cutting of forest for crop cultivation. Furthermore, an increased trend in the urban/residential was observed, as more urban activities continued to be unmitigated and encroached into forest and agriculture areas during the entire study period. This trend is similar to a study undertaken by [93], which shows that the rate of deforestation caused directly by cropland displacement far exceeds direct forest losses from urban growth. According to this author, urban growth can induce cropland displacement, which tends to lead to potential deforestation elsewhere.

4.2. Implications of Present Land Use Change for Livelihoods and Food Security

Many of the environmental and socio-economic concerns that society faces today revolve around land use. LULC information is a powerful determinant of sustainable development. Agriculture and forestry products are essential to human well-being and have significant implications for livelihoods and food security. In Limbe, the vast spatial and societal reorganization that has been going on for several years is only getting worse as a result of the ongoing socio-political conflicts in the nation of Cameroon and the economic opportunities offered by the CDC and SONARA, as already highlighted by many scholars. Uncontrolled urban development into forest and agriculture areas is responsible for these observed changes in LULC in Limbe [47].
This study supports the rapid urbanization that is occurring in this coastal city. This research is limited by the spatial resolution of the analysis. Even though higher-resolution data would yield more precise insights into this research, these findings provide a local evaluation of likely forest and agriculture loss patterns due to urban growth. Our findings reveal that agriculture has been directly lost to urban land uses since 2002, which is more than half of the loss that has occurred over the past fourteen years. In addition, agriculture was directly lost to urban areas from 2013 to 2020. This trend is expected to continue, as agriculture areas in the peri-urban zones are the main regions where new urban activities can be developed.
The amount of agriculture and forest that are currently being lost to urban area has immediate ramifications on the local people who rely on farming and the oil palm plantation for their income and livelihoods. As the city’s population expands, urban settlements increase and agriculture and forest lands become scarcer, putting more pressure on limited available land resources. The loss of income and displacement of peri-urban livelihoods contribute to urban land expansion [26,94]. It is important to note that the deterioration of agroecosystems and degradation of forests considerably influence food accessibility and livelihood alternatives for local communities [26]. Livelihood and food insecurity could become a challenge for the households that lose their jobs because of the disappearance of oil palm plantations and are unable to find other employment opportunities. In general, urban food security is determined not just by the availability of foods in the markets, but also by the ability of households to obtain food based on their income [95]. However, there are numerous variables to consider when determining whether locals would be prosperous or poorer, and such investigations are beyond the scope of this research.

5. Conclusions

This study produced a new set of maps that quantify the extent to which urbanization has impacted agriculture and forest areas over a 34-year period using GIS extraction and remote sensing supervised and post-classification techniques. The integration of supervised classification methods with expertise based on visual interpretation of Landsat images reveals observable disturbances and human infrastructures and activities. The visual evaluation also indicates that urbanization has replaced agricultural and forest land areas over these years. One of the main driving forces of land use/cover change in Limbe is population growth, as seen in this analysis. This paper has proven that urbanization coupled with population growth led to the loss of agriculture and forest areas in Limbe City, even though there was severe deforestation as result of agricultural activities. In addition, the use of RS/GIS in land use change detection is very reliable when performing multi-temporal land cover classification of large areas. Results suggest that RS/GIS can represent a useful and reliable method for identifying multi-temporal LULC change over a long period of time.
These results should encourage Limbe City Council urban planners and policies makers to add distribution or LULC modeling to their toolbox during the decision-making process. This study’s findings and analyses have significant policy implications for sustainable land use and cover practices. Finally, these findings suggest that urbanization will continue to increase and agricultural land will decrease if land use policies are not well implemented by the city officials. The results offer significant perspectives for researchers and decision makers who are interested in environmentally conscious development and sustainable land use. Without expansion of agricultural production in other cities or villages, or without enforcing forest and agricultural policies, total agricultural production in the areas will decline as a result of reductions in agricultural land areas and land use intensity. Findings also suggest creating holistic, multi-level plans to deal with the difficult problems in similar circumstances.

Author Contributions

Conceptualization, L.D.E.; data curation, L.D.E., Q.Y. and S.T.; formal analysis, L.D.E.; investigation, S.T.; methodology, L.D.E.; software, L.D.E. and Q.Y.; supervision, L.D.E.; validation, J.D.; visualization, M.A.; writing—original draft, L.D.E.; writing—review and editing, J.D. and M.A. All authors have read and agreed to the published version of the manuscript.

Funding

This research received no external funding.

Data Availability Statement

The image data that support this study’s findings are available in the United States Geological Survey (USGS) at https://www.usgs.gov. The population data were derived from the following resources available in the public domain and also within the article: https://citeseerx.ist.psu.edu/viewdoc/download?doi=10.1.1.452.1256&rep=rep1&type=pdf, http://www.bucrep.cm/, https://data.worldbank.org/indicator/SP.URB.TOTL.IN.ZS?locations=CM, and https://limbe.cm/presentation-of-the-city-of-limbe.html, accessed on 1 June 2025.

Acknowledgments

The authors would especially like to thank one of the two anonymous reviewers for her insightful feedback on a previous version of this manuscript.

Conflicts of Interest

The authors declare no conflicts of interest.

References

  1. United Nations Population Division. World Population Prospects: The 2012 Revision; United Nations: New York, NY, USA, 2012. [Google Scholar]
  2. Lee, K.N. An Urbanizing World. State of the World 2007: Our Urban Future; W. W. Norton Company: New York, NY, USA, 2007; pp. 3–22. [Google Scholar]
  3. Benza, M.; Weeks, J.R.; Stow, D.A.; Lopez-Carr, D.; Clarke, K.C. A pattern-based definition of urban context using remote sensing and GIS. Remote Sens. Environ. 2016, 183, 250–264. [Google Scholar] [CrossRef]
  4. Litsardopoulos, N.; Saridakis, G.; Hand, C. The Effects of Rural and Urban Areas on Time Allocated to Self-Employment: Differences between Men and Women. Sustainability 2020, 12, 7049. [Google Scholar] [CrossRef]
  5. Han, J.; Hayashi, Y.; Cao, X.; Imura, H. Application of an integrated system dynamics and cellular automata model for urban growth assessment: A case study of Shanghai, China. Landsc. Urban Plan. 2009, 91, 133–141. [Google Scholar] [CrossRef]
  6. Thapa, R.B.; Murayama, Y. Drivers of urban growth in the Kathmandu valley, Nepal: Examining the efficacy of the analytic hierarchy process. Appl. Geogr. 2010, 30, 70–83. [Google Scholar] [CrossRef]
  7. Del Mar López, T.; Aide, T.M.; Thomlinson, J.R. Urban expansion and the loss of prime agricultural lands in Puerto Rico. AMBIO A J. Hum. Environ. 2001, 30, 49–54. [Google Scholar] [CrossRef]
  8. Deng, X. Urbanization and Impacts on Agricultural Land in China. In The Routledge Handbook of Urbanization and Global Environmental Change; Routledge: New York, USA, 2016; pp. 66–73. [Google Scholar]
  9. Lacerda, L.I.D.A.; da Silveira, J.A.R.; Santos, C.A.G.; da Silva, R.M.; Silva, A.M.; do Nascimento, T.V.M.; Ribeiro, E.L.; de Freitas, P.V.N. Urban forest loss using a GIS-based approach and instruments for integrated urban planning: A case study of João Pessoa, Brazil. J. Geogr. Sci. 2021, 31, 1529–1553. [Google Scholar] [CrossRef]
  10. Seto, K.C.; Reenberg, A.; Boone, C.G.; Fragkias, M.; Haase, D.; Langanke, T.; Simon, D. Urban land teleconnections and sustainability. Proc. Natl. Acad. Sci. USA 2012, 109, 7687–7692. [Google Scholar] [CrossRef]
  11. Muchelo, R.O. Urban Expansion and Loss of Prime Agricultural Land in Sub-Saharan Africa: A Challenge to Soil Conservation and Food Security. 2017. Available online: https://ses.library.usyd.edu.au/bitstream/handle/2123/18116/Muchelo_RO_thesis_1.pdf?sequence=1 (accessed on 20 October 2021).
  12. Sallustio, L.; Quatrini, V.; Geneletti, D.; Corona, P.; Marchetti, M. Assessing land take by urban development and its impact on carbon storage: Findings from two case studies in Italy. Environ. Impact Assess. Rev. 2015, 54, 80–90. [Google Scholar] [CrossRef]
  13. Jiang, L.; Zhang, Y. Modeling Urban Expansion and Agricultural Land Conversion in Henan Province, China: An Integration of Land Use and Socioeconomic Data. Sustainability 2016, 8, 920. [Google Scholar] [CrossRef]
  14. Veach, V.; Moilanen, A.; Di Minin, E. Threats from urban expansion, agricultural transformation and forest loss on global conservation priority areas. PLoS ONE 2017, 12, e0188397. [Google Scholar] [CrossRef]
  15. Haregeweyn, N.; Fikadu, G.; Tsunekawa, A.; Tsubo, M.; Meshesha, D.T. The dynamics of urban expansion and its impacts on land use/land cover change and small-scale farmers living near the urban fringe: A case study of Bahir Dar, Ethiopia. Landsc. Urban Plan. 2012, 106, 149–157. [Google Scholar] [CrossRef]
  16. Kukkonen, M.O.; Muhammad, M.J.; Käyhkö, N.; Luoto, M. Urban expansion in Zanzibar City, Tanzania: Analyzing quantity, spatial patterns and effects of alternative planning approaches. Land Use Policy 2018, 71, 554–565. [Google Scholar] [CrossRef]
  17. Jeykumar, R.K.C.; Chandran, S. Impact of urbanization on climate change and geographical analysis of physical land use land cover variation using RS-GIS. Glob. Nest J. 2019, 21, 141–152. [Google Scholar]
  18. Hou, K.; Wen, J. Quantitative analysis of the relationship between land use and urbanization development in typical arid areas. Environ. Sci. Pollut. Res. 2020, 27, 38758–38768. [Google Scholar] [CrossRef] [PubMed]
  19. Mishra, P.K.; Rai, A.; Rai, S.C. Land use and land cover change detection using geospatial techniques in the Sikkim Himalaya, India. Egypt. J. Remote Sens. Space Sci. 2020, 23, 133–143. [Google Scholar] [CrossRef]
  20. Liu, T.; Yang, X. Monitoring land changes in an urban area using satellite imagery, GIS and landscape metrics. Appl. Geogr. 2015, 56, 42–54. [Google Scholar] [CrossRef]
  21. Lin, L.; Di, L.; Zhang, C.; Guo, L.; Zhao, H.; Islam, D.; Liu, Z.; Li, H.; Middleton, G. Modeling urban redevelopment: A novel approach using time-series remote sensing data and machine learning. Geogr. Sustain. 2024, 5, 211–219. [Google Scholar] [CrossRef]
  22. Vogelmann, J.E.; Howard, S.M.; Yang, L.M.; Larson, C.R.; Wylie, B.K.; Van Driel, N. Completion of the 1990s national land cover data set for the conterminous United States from Landsat thematic mapper data and ancillary data sources. Photogram. Eng. Remote Sens. 2001, 67, 650–662. [Google Scholar]
  23. Yang, X.; Liu, Z. Using satellite imagery and GIS for land-use and land cover change mapping in an estuarine watershed. Int. J. Remote Sens. 2005, 26, 5275–5296. [Google Scholar] [CrossRef]
  24. Liu, T.; Yang, X. Mapping vegetation in an urban area with stratified classification and multiple endmember spectral mixture analysis. Remote Sens. Environ. 2013, 133, 251–264. [Google Scholar] [CrossRef]
  25. Fanan, U.; Dlama, K.I.; Oluseyi, I.O. Urban expansion and vegetal cover loss in and around Nigeria’s Federal Capital City. J. Ecol. Nat. Environ. 2011, 3, 1–10. [Google Scholar]
  26. Acheampong, M.; Yu, Q.; Enomah, L.D.; Anchang, J.; Eduful, M. Land use/cover change in Ghana’s oil city: Assessing the impact of neoliberal economic policies and implications for sustainable development goal number one–A remote sensing and GIS approach. Land Use Policy 2018, 73, 373–384. [Google Scholar] [CrossRef]
  27. Oladehinde, G.; Fatusin, A.F.; Ojo, V. Urban Expansion and Loss of Agricultural Land in Osogbo, Osun State Nigeria, using Multi-Temporal Imageries. J. Afr. Real Estate Res. 2019, 4, 139–156. [Google Scholar] [CrossRef]
  28. Abebe, G.; Getachew, D.; Ewunetu, A. Analysing land use/land cover changes and its dynamics using remote sensing and GIS in Gubalafito district, Northeastern Ethiopia. SN Appl. Sci. 2021, 4, 30. [Google Scholar] [CrossRef]
  29. Ritu, S.M.; Sarkar, S.K.; Zonaed, H. Prediction of Padma river bank shifting and its consequences on LULC changes. Ecol. Indic. 2023, 156, 111104. [Google Scholar] [CrossRef]
  30. Selmy, S.A.; Kucher, D.E.; Mozgeris, G.; Moursy, A.R.; Jimenez-Ballesta, R.; Kucher, O.D.; Fadl, M.E.; Mustafa, A.R.A. Detecting, analyzing, and Predicting Land Use/Land Cover (LULC) changes in arid regions using landsat images, CA-Markov Hybrid Model, and GIS techniques. Remote Sens. 2023, 15, 5522. [Google Scholar] [CrossRef]
  31. Zhu, W.; Jiang, Z.; Cen, L.; Wu, H. Evaluation, simulation, and optimization of land use spatial patterns for high-quality development: A case study of Zhengzhou city, China. J. Geogr. Sci. 2023, 33, 266–288. [Google Scholar] [CrossRef]
  32. Lou, C.; Al-qaness, M.A.; AL-Alimi, D.; Dahou, A.; Abd Elaziz, M.; Abualigah, L.; Ewees, A.A. Land use/land cover (LULC) classification using hyperspectral images: A review. Geo-Spat. Inf. Sci. 2025, 28, 345–386. [Google Scholar] [CrossRef]
  33. Wu, H.; Li, Y.; Lin, A.; Fan, H.; Fan, K.; Xie, J.; Luo, W. A review of crowdsourced geographic information for land-use and land-cover mapping: Current progress and challenges. Int. J. Geogr. Inf. Sci. 2024, 38, 2183–2215. [Google Scholar] [CrossRef]
  34. Al-Dousari, A.E.; Mishra, A.; Singh, S. Land use land cover change detection and urban sprawl prediction for Kuwait metropolitan region, using multi-layer perceptron neural networks (MLPNN). Egypt. J. Remote Sens. Space Sci. 2023, 26, 381–392. [Google Scholar] [CrossRef]
  35. Aryal, J.; Sitaula, C.; Frery, A.C. Land use and land cover (LULC) performance modeling using machine learning algorithms: A case study of the city of Melbourne Australia. Sci. Rep. 2023, 13, 1351. [Google Scholar] [CrossRef]
  36. Tesfaye, W.; Elias, E.; Warkineh, B.; Tekalign, M.; Abebe, G. Modeling of land use and land cover changes using google earth engine and machine learning approach: Implications for landscape management. Environ. Syst. Res. 2024, 13, 31. [Google Scholar] [CrossRef]
  37. Tiafack, O.; Chrétien, N.; Emmanuel, N.N. Development Polarisation in Limbe and Kribi (Littoral Cameroon): Growth Challenges, Lessons from Douala and Options. Curr. Urban Stud. 2014, 2, 361. [Google Scholar] [CrossRef]
  38. World Bank. Urban Population (% of Total Population)—Cameroon. 2020. Available online: https://data.worldbank.org/indicator/SP.URB.TOTL.IN.ZS?locations=CM (accessed on 5 October 2021).
  39. Martin, L.; Hanafi, A.; Mc Grenra, D.; Hurley, J. Republic of the Congo Country Strategic Opportunities Programme. 2019. Available online: https://www.gtai.de/resource/blob/153862/282d1431a8f615691627b464990e6f59/pro201909035039-data.pdf (accessed on 2 October 2021).
  40. Sally, Z.; Gaskin, S.J.; Folifac, F.; Kometa, S.S. The effect of urbanization on community-managed water supply: Case study of Buea, Cameroon. Community Dev. J. 2014, 49, 524–540. [Google Scholar] [CrossRef]
  41. Ngoran, S.D.; Xue, X.; Ngoran, B.S. The dynamism between urbanization, coastal water resources and human health: A case study of Douala, Cameroon. J. Econ. Sustain. Dev. 2015, 6, 167–181. [Google Scholar]
  42. Jaligot, R.; Kemajou, A.; Chenal, J. Cultural ecosystem services provision in response to urbanization in Cameroon. Land Use Policy 2018, 79, 641–649. [Google Scholar] [CrossRef]
  43. Mbatu, R. Deforestation in the Buea-Limbe and Bertoua regions in southern Cameroon (1984–2000): Modernization, world-systems, and neo-Malthusian outlook. GeoJournal 2010, 75, 443–458. [Google Scholar] [CrossRef]
  44. Asmare, B.; Neculina, A.; Wubie, A.; Egbe, A.M.; Charleine, D.S.; Ambo, F.B. The impact of land use and land cover change on the stream water quality in Limbe I municipality, Cameroon. Environ. Qual. Manag. 2024, 34, e22254. [Google Scholar] [CrossRef]
  45. Kajoba, G.M. Land Use and Land Tenure in Africa: Towards an Evolutionary Conceptual Framework; Council for the Development of Social Science Research in Africa: Dakar, Senegal, 2002. [Google Scholar]
  46. Bjornlund, V.; Bjornlund, H.; Van Rooyen, A.F. Why agricultural production in sub-Saharan Africa remains low compared to the rest of the world—A historical perspective. Int. J. Water Resour. Dev. 2020, 36 (Suppl. 1), S20–S53. [Google Scholar] [CrossRef]
  47. Nguh, B.S. Land tenure and land use dynamics in Limbe City, Southwest Region of Cameroon. Agric. Sci. Dev. 2013, 2, 14–24. [Google Scholar]
  48. Njoh, A.J. The land use policy implementation system in Cameroon: Historical/contemporary perspectives and implications for national development. Habitat Int. 1994, 18, 81–98. [Google Scholar] [CrossRef]
  49. Oyono, P.R. The Narratives of Capitalist Land Accumulation and Recognition in Coastal Cameroon. The Hague. 2013. Available online: https://www.iss.nl/sites/corporate/files/LDPI_WP_29 (accessed on 8 August 2020).
  50. Njoh, A.J. Planning in Contemporary Africa: The State, Town Planning and Society in Cameroon, 1st ed.; Routledge: England, UK, 2003; pp. 90–97. [Google Scholar] [CrossRef]
  51. Nkongho, R.N.; Ndjogui, T.E.; Levang, P. History of partnership between agro-industries and oil palm smallholders in Cameroon. OCL 2015, 22, A301. [Google Scholar] [CrossRef]
  52. Eno, C.O.; Fombe, L.F. Development Implications of Ceded Lands by the Cameroon Development Corporation on Fako Division-Southwest Region of Cameroon from 1960 to 2010. Adv. Soc. Sci. Res. J. 2016, 3, 11. [Google Scholar]
  53. Dinsi, S.C.; Eyebe, S.A.; Endamana, D. Agri-Business and Logging Investment, Great Ape Conservation and Poverty in Cameroon. 2016. Available online: https://www.povertyandconservation.info/en/pages/cameroon-pclg (accessed on 5 October 2021).
  54. Makoge, V.; Vaandrager, L.; Maat, H.; Koelen, M. Poverty and health among CDC plantation labourers in Cameroon: Perceptions, challenges and coping strategies. PLoS Neglected Trop. Dis. 2017, 11, e0006100. [Google Scholar] [CrossRef]
  55. Kofele-Kale, N. Asserting Permanent Sovereignty over Ancestral Lands: The Bakweri Land Litigation against Cameroon. Annu. Surv. Int. Comp. Law 2007, 13, 1. [Google Scholar]
  56. Awum, D.; Bayie, K.; Fonda, N.L. Mainstreaming Potentials for Sustainable Development in the Limbe Urban Municipality. Yaounde: PAFP. 2001. Available online: https://citeseerx.ist.psu.edu/viewdoc/download?doi=10.1.1.452.1256&rep=rep1&type=pdf (accessed on 21 August 2020).
  57. Kimengsi, J.N.; Lambi, J.N.; Gwan, S.A. Reflections on the Role of Plantations in Development: Lessons from the Cameroon Development Corporation (CDC). Reflections, 1. Sustain. Environ. 2016, 1, 1. Available online: www.scholink.org/ojs/index.php/se (accessed on 8 June 2021). [CrossRef]
  58. Kimengsi, J.N.; Gwan, S.A.; Elinge, L.E. Buea, Cameroon and the Planning Challenges of Peri-Urban Settlements. UGEC Viewpoints 2016. Available online: https://ugecviewpoints.wordpress.com/2016/03/08/buea-cameroon-and-the-planning-challenges-of-peri-urban-settlements/ (accessed on 23 August 2020).
  59. Anaka, R.E.N. Forest Conservation and Management Practices in Cameroon: Case Study of Bimbia-Bonadikombo Community Forest and Takamanda National Park (Doctoral dissertation, BrandenburgischeTechnische Universität Cottbus-Senftenberg). 2019. Available online: https://core.ac.uk/download/pdf/232185668.pdf (accessed on 28 July 2020).
  60. Alemagi, D. The oil industry along the Atlantic coast of Cameroon: Assessing impacts and possible solutions. Resour. Policy 2007, 32, 135–145. [Google Scholar] [CrossRef]
  61. Tata, E.S.; Lambi, C.M. Challenges and opportunities of the Mount Cameroon Forest Region as a national park. J. Int. Wildl. Law Policy 2014, 17, 197–212. [Google Scholar] [CrossRef]
  62. Enomah, L.D.; Downs, J.; Mbaigoto, N.; Fonda, B.; Umar, M. Flood risk assessment in Limbe (Cameroon) using a GIS weighed sum method. Environ. Dev. Sustain. 2024, 26, 29725–29744. [Google Scholar] [CrossRef]
  63. BUCREP (Central Bureau of the Census and Population Studies, Cameroon). 2020. Available online: http://www.bucrep.cm/ (accessed on 5 May 2022).
  64. Ndille, R.; Belle, J.A. Managing the Limbe floods: Considerations for disaster risk reduction in Cameroon. Int. J. Disaster Risk Sci. 2014, 5, 147–156. [Google Scholar] [CrossRef]
  65. Limbe City Council-Presentation of the city of Limbe 2022. Available online: https://limbe.cm/presentation-of-the-city-of-limbe.html (accessed on 9 August 2022).
  66. Shinozuka, M.; Mansouri, B. Synthetic aperture radar and remote sensing technologies for structural health monitoring of civil infrastructure systems. In Structural Health Monitoring of Civil Infrastructure Systems; Woodhead Publishing: Sawston, CA, USA, 2009; pp. 113–151. [Google Scholar] [CrossRef]
  67. Al-Doski, J.; Mansorl, S.B.; Shafri, H.Z.M. Image classification in remote sensing. J. Environ. Earth Sci. 2013, 3, 10. [Google Scholar]
  68. Chughtai, A.H.; Abbasi, H.; Karas, I.R. A review on change detection method and accuracy assessment for land use land cover. Remote Sens. Appl. Soc. Environ. 2021, 22, 100482. [Google Scholar] [CrossRef]
  69. Erbek, F.S.; Özkan, C.; Taberner, M. Comparison of maximum likelihood classification method with supervised artificial neural network algorithms for land use activities. Int. J. Remote Sens. 2004, 25, 1733–1748. [Google Scholar] [CrossRef]
  70. Muavhi, N. Evaluation of effectiveness of supervised classification algorithms in land cover classification using ASTER images-A case study from the Mankweng (Turfloop) Area and its environs, Limpopo Province, South Africa. S. Afr. J. Geomat. 2020, 9, 61–74. [Google Scholar] [CrossRef]
  71. Buh, G.W. Geographic information systems-based demarcation of risk zones: The case of the Limbe Sub-Division-Cameroon. Jàmbá: J. Disaster Risk Stud. 2009, 2, 54–70. [Google Scholar]
  72. Crowther, P.; Hartnett, J.; Williams, R.; Pendelbury, S. Developing quality training data for a statistical decision Tree classifier in a spatial environment. In Proceedings of the 4th International Conference on GeoComputation’99, Fredericksburg, VA, USA, 25–28 July 1999; p. 1. [Google Scholar]
  73. Quantum High-Res vs Mid-Res vs Low-Res: What Type of Satellite Imagery Fits the Bill? 2021. Available online: https://medium.datadriveninvestor.com/high-res-vs-mid-res-vs-low-res-what-type-of-satellite-imagery-fits-the-bill-78cbd45f5d79 (accessed on 6 October 2021).
  74. Hasmadi, M.; Pakhriazad, H.Z.; Shahrin, M.F. Evaluating supervised and unsupervised techniques for land cover mapping using remote sensing data. Geogr. Malays. J. Soc. Space 2009, 5, 1–10. [Google Scholar]
  75. Pistorius, T.; Poona, N. Accuracy assessment of game-based crowdsourced land-use/land cover image classification. In Proceedings of the 2014 IEEE Geoscience and Remote Sensing Symposium, Quebec City, QC, Canada, 13–18 July 2014; IEEE: New York, NY, USA, 2014; pp. 4780–4783. [Google Scholar]
  76. Ukrainski Pavel. Classification Accuracy Assessment. Confusion Matrix Method. 2016. Available online: http://www.50northspatial.org/classification-accuracy-assessment-confusion-matrix-method/ (accessed on 7 October 2021).
  77. Tewabe, D.; Fentahun, T. Assessing land use and land cover change detection using remote sensing in the Lake Tana Basin, Northwest Ethiopia. Cogent Environ. Sci. 2020, 6, 1778998. [Google Scholar] [CrossRef]
  78. Patel, N.; Kaushal, B.K. Improvement of user’s accuracy through classification of principal component images and stacked temporal images. Geo-Spat. Inf. Sci. 2010, 13, 243–248. [Google Scholar] [CrossRef]
  79. Barsi, J.A.; Lee, K.; Kvaran, G.; Markham, B.L.; Pedelty, J.A. The Spectral Response of the Landsat-8 Operational Land Imager. Remote Sens. 2014, 6, 10232–10251. [Google Scholar] [CrossRef]
  80. World Bank Group. “Cameroon City Competitiveness Diagnostic,” World Bank Publications—Reports 30164, the World Bank Group 2018. Available online: https://ideas.repec.org/p/wbk/wboper/30164.html (accessed on 17 February 2021).
  81. Forkuo, E.K.; Frimpong, A. Analysis of Forest Cover Change Detection. Int. J. Remote Sens. Appl. 2012, 2, 82–92. [Google Scholar]
  82. Dutta, K.; Reddy, C.S.; Sharma, S.; Jha, C.S. Quantification and monitoring of forest cover changes in Agasthyamalai Biosphere Reserve, Western Ghats, India (1920–2012). Curr. Sci. 2016, 110, 508–520. [Google Scholar] [CrossRef]
  83. Singh, A. Review article digital change detection techniques using remotely sensed data. Int. J. Remote Sens. 1989, 10, 989–1003. [Google Scholar] [CrossRef]
  84. Monserud, R.A. Methods for Comparing Global Vegetation Maps. 1990. Available online: http://pure.iiasa.ac.at/id/eprint/3413/1/WP-90-040.pdf (accessed on 6 November 2021).
  85. Ismail, M.H.; Jusoff, K. Satellite data classification accuracy assessment based on reference dataset. Int. J. Comput. Inf. Sci. Eng. 2008, 2, 96–102. [Google Scholar]
  86. Rientjes, T.H.M.; Haile, A.T.; Kebede, E.; Mannaerts, C.M.M.; Habib, E.; Steenhuis, T.S. Changes in land cover, rainfall and stream flow in Upper Gilgel Abbay catchment, Blue Nile basin–Ethiopia. Hydrol. Earth Syst. Sci. 2011, 15, 1979–1989. [Google Scholar] [CrossRef]
  87. Gashaw, T.; Tulu, T.; Argaw, M.; Worqlul, A.W. Evaluation and prediction of land use/land cover changes in the Andassa watershed, Blue Nile Basin, Ethiopia. Environ. Syst. Res. 2017, 6, 1–15. [Google Scholar] [CrossRef]
  88. Zhang, F.; Yushanjiang, A.; Jing, Y. Assessing and predicting changes of the ecosystem service values based on land use/cover change in Ebinur Lake Wetland National Nature Reserve, Xinjiang, China. Sci. Total Environ. 2019, 656, 113. [Google Scholar] [CrossRef]
  89. Simon, L.N.; Ernesta, N.N. Land Use Patterns and Vegetation Cover Changes in Coastal Precinct of the Mount Cameroon Landscape. J. Environ. Sci. Toxicol. Food Technol. 2018, 12, 2319–2399. [Google Scholar]
  90. Minang, P.A. Implementing Global Environmental Policy at Local Level: Community Carbon Forestry Perspectives in Cameroon. ITC. 2007. Available online: https://ris.utwente.nl/ws/files/6084846/thesis_Minang.pdf (accessed on 28 July 2020).
  91. Watts, J.; Akogo, G.M. Biodiversity assessment and developments towards participatory forest management on Mount Cameroon. Commonwealth. For. Rev. 1994, 73, 221–230. [Google Scholar]
  92. Abam, E.N.; Prince, G.T.T. Showcasing the Cultural Potential of its Municipality A Case Study of the Limbe City Council, Southwest Region; Cameroon. Ann. Soc. Sci. Manag. Stud. 2018, 1, 67–69. [Google Scholar]
  93. Van Vliet, J. Direct and indirect loss of natural area from urban expansion. Nat. Sustain. 2019, 2, 755–763. [Google Scholar] [CrossRef]
  94. Simon, D. Urban environments: Issues on the peri-urban fringe. Annu. Rev. Environ. Resour. 2008, 33, 167–185. [Google Scholar] [CrossRef]
  95. Cohen, M.J.; Garrett, J.L. The food price crisis and urban food (in) security. Environ. Urban. 2010, 22, 467–482. [Google Scholar] [CrossRef]
Figure 1. Location of the city of Limbe in the southwest of Cameroon.
Remotesensing 17 02631 g001
Figure 2. The workflow of the land use/cover change detection analysis.
Remotesensing 17 02631 g002
Figure 3. LULC in Limbe City between 1986 and 2020 (classification maps).
Remotesensing 17 02631 g003
Figure 4. Diagrammatic presentation of land use/cover change in Limbe City from 1986 to 2020.
Remotesensing 17 02631 g004
Figure 5. Change in LULC categories (AGR—Agriculture; FOR—Forest; URB—Urban; and WAT—Water) in Limbe City between 1986 and 2020.
Remotesensing 17 02631 g005
Figure 6. Magnitude and transformation of the different LULC types (AGR—Agriculture; FOR—Forest; URB—Urban; and WAT—Water) change in Limbe City from 1986 to 2020.
Remotesensing 17 02631 g006
Table 1. Summary of remote sensing images.
DatasetYearSourcesPopulationSources
Landsat 4 and 5 Thematic Mapper1986USGS44,561[65]
Landsat 7 Enhanced Thematic Mapper Plus (ETM+)2002USGS105,681[56]
Landsat 7 Enhanced Thematic Mapper Plus (ETM+)2013USGS139,320[80]
Landsat 8 OLI/TIRS2020USGS247,321[65]
Table 2. Land use/cover classification accuracy results.
1986 2002 2013 2020
Overall
Accuracy (%)
93.4 89.2 91.7 94.6
Kappa
Coefficient
0.9 0.8 0.9 0.9
LULC PA UAPAUAPAUAPAUA
Agriculture9583.874.276.58595.795.986.2
Forest8292.693.883.596.880.697.794.3
Urban10098.410010010093.810096.1
Water96.710096.31009510090.3100
Table 3. Area (Km2) and percentages of four LULC types in Limbe, Cameroon.
LULC1986200220132020
Area%Area%Area%Area%
Agriculture11.221.115.429.018.935.615.829.7
Forest31.960.227.251.317.432.815.028.2
Urban9.417.610.018.916.230.422.041.5
Water0.61.00.40.80.61.10.30.5
Table 4. Net gain and loss of LULC types in each period (km2).
LULC1986–20022002–20132013–20201986–2020
Agriculture4.23.5−3.14.6
Forest−4.7−9.8−2.4−17.0
Urban0.76.15.912.7
Water−0.10.2−0.3−0.3
Table 5. Change detection matrix table showing direction of change.
FinalInitial
1986
AgricultureForestUrbanWater
2002Agriculture3.710.31.5
Forest6.919.40.80.1
Urban0.72.27.10.0
Water 0.00.4
2002
2013Agriculture7.011.00.9
Forest4.113.30.1
Urban4.32.89.00.0
Water0.00.20.00.4
2013
2020Agriculture7.86.21.80.1
Forest5.09.50.4
Urban6.11.714.00.3
Water 0.00.3
Disclaimer/Publisher’s Note: The statements, opinions and data contained in all publications are solely those of the individual author(s) and contributor(s) and not of MDPI and/or the editor(s). MDPI and/or the editor(s) disclaim responsibility for any injury to people or property resulting from any ideas, methods, instructions or products referred to in the content.

