Article

Optical and SAR Image Registration in Equatorial Cloudy Regions Guided by Automatically Point-Prompted Cloud Masks

1
Key Laboratory of Smart Earth, Beijing 100094, China
2
School of Remote Sensing and Information Engineering, Wuhan University, Wuhan 430079, China
3
Nanjing Research Institute of Surveying, Mapping & Geotechnical Investigation, Co. Ltd., Nanjing 210019, China
4
Key Laboratory of Space Photoelectric Detection and Perception (Nanjing University of Aeronautics and Astronautics), Ministry of Industry and Information Technology, Nanjing 211106, China
*
Author to whom correspondence should be addressed.
Remote Sens. 2025, 17(15), 2630; https://doi.org/10.3390/rs17152630
Submission received: 21 June 2025 / Revised: 14 July 2025 / Accepted: 25 July 2025 / Published: 29 July 2025

Abstract

The equator’s unique combination of high humidity and temperature renders optical satellite imagery highly susceptible to persistent cloud cover. In contrast, synthetic aperture radar (SAR) offers a robust alternative due to its ability to penetrate clouds with microwave imaging. This study addresses the challenges of cloud-induced data gaps and cross-sensor geometric biases by proposing an advanced optical and SAR image-matching framework specifically designed for cloud-prone equatorial regions. We use a prompt-driven visual segmentation model with automatic prompt point generation to produce cloud masks that guide cross-modal feature-matching and joint adjustment of optical and SAR data. This process results in a comprehensive digital orthophoto map (DOM) with high geometric consistency, retaining the fine spatial detail of optical data and the all-weather reliability of SAR. We validate our approach across four equatorial regions using five satellite platforms with varying spatial resolutions and revisit intervals. Even in areas with more than 50 percent cloud cover, our method maintains sub-pixel edging accuracy under manual check points and delivers comprehensive DOM products, establishing a reliable foundation for downstream environmental monitoring and ecosystem analysis.

1. Introduction

The equatorial region plays a pivotal role in global heat and water exchange, making continuous satellite remote sensing observations essential for regional environmental monitoring and ecosystem research [1,2,3]. However, the region’s high temperatures and humidity lead to frequent cloud cover, which is more persistent throughout the year compared to mid-latitude and high-latitude regions [4,5,6]. This persistence complicates the acquisition of cloud-free optical imagery, necessitating the use of cloud-affected images in many applications, even though clouds frequently obscure surface features in optical data [7,8]. In contrast, synthetic aperture radar (SAR) utilizes microwave imaging, which can penetrate clouds and other atmospheric disturbances [9,10]. Therefore, SAR data provide a valuable supplementary source for cloud-covered areas in optical imagery, facilitating timely, interpretable, and comprehensive remote sensing observations of the equatorial region.
Although both optical and SAR remote sensing images inherently possess a certain level of geometric accuracy [11,12], substantial inconsistencies arise between the two due to differences in their imaging techniques and subsequent processing methods [13]. These discrepancies prevent the guarantee of geometric consistency in the resulting digital ortho map (DOM) [14,15]. As a result, the production of DOMs assisted by SAR data requires that optical and SAR images be aligned within a unified geometric framework to ensure seamless integration [16,17]. In the context of equatorial cloud-covered regions, two primary challenges must be addressed for successful image matching: modal inconsistencies and cloud interference.
Due to the differences in temporal acquisition and imaging modes between optical and SAR imagery, significant nonlinear geometric and radiometric discrepancies arise, rendering conventional matching techniques ineffective [18,19]. Consequently, advanced multimodal image-matching methods are required to overcome these discrepancies [20]. While many multimodal image-matching methods have achieved promising results in the registration of optical and SAR images [21,22,23], most of these methods are designed for optimal imaging conditions, typically with little or no cloud cover. They often fail to account for scenarios where large portions of the image are obscured by clouds. Consequently, their effectiveness in registering optical and SAR images in equatorial regions with extensive cloud coverage requires further investigation.
Moreover, the high cloud cover frequently present in equatorial regions severely disrupts the matching process, as cloud-obscured areas significantly interfere with feature correspondence, reducing matching accuracy [24]. Therefore, it is crucial to accurately identify and extract cloud-covered regions from the optical imagery to mitigate their impact on the matching process and improve the effectiveness of the alignment [25,26]. Traditional threshold-based cloud detection algorithms often exhibit limited generalization capabilities, making it challenging to effectively address cloud detection tasks under complex radiometric conditions [26,27]. While deep learning-based methods can extract more advanced image features, they typically require a large volume of manually annotated samples for model training [15]. In recent years, prompt-driven visual segmentation models, exemplified by the segment anything model (SAM), have emerged as a promising solution, enabling highly generalized cloud detection with zero annotated samples [28,29]. However, the performance of these models heavily relies on the quality of the prompt, making the design of scene-specific prompts a critical issue that needs to be addressed [30].
To address the aforementioned challenges, this paper integrates optical and SAR imagery to produce a comprehensive DOM with high geometric consistency for the equatorial, multi-cloud region. Given the input optical and SAR images, we first detect clouds in the optical imagery using a prompt-driven visual segmentation model, guided by a tailored automatic prompt strategy, to generate binary cloud masks. We then use these masks to guide cross-modal feature-matching and joint adjustment of both datasets. Finally, we apply the refined positioning parameters from this combined adjustment, together with open-source digital elevation data, to orthorectify the imagery. The main contributions are as follows:
(1)
We introduce an optical and SAR image-matching framework specifically designed for equatorial cloudy regions, enhancing the geometric alignment accuracy by addressing the challenges posed by cloud interference in optical imagery;
(2)
We propose a cloud detection method based on a prompt-driven visual segmentation model with automatic prompt point generation, achieving matching performance comparable to that of manual prompts;
(3)
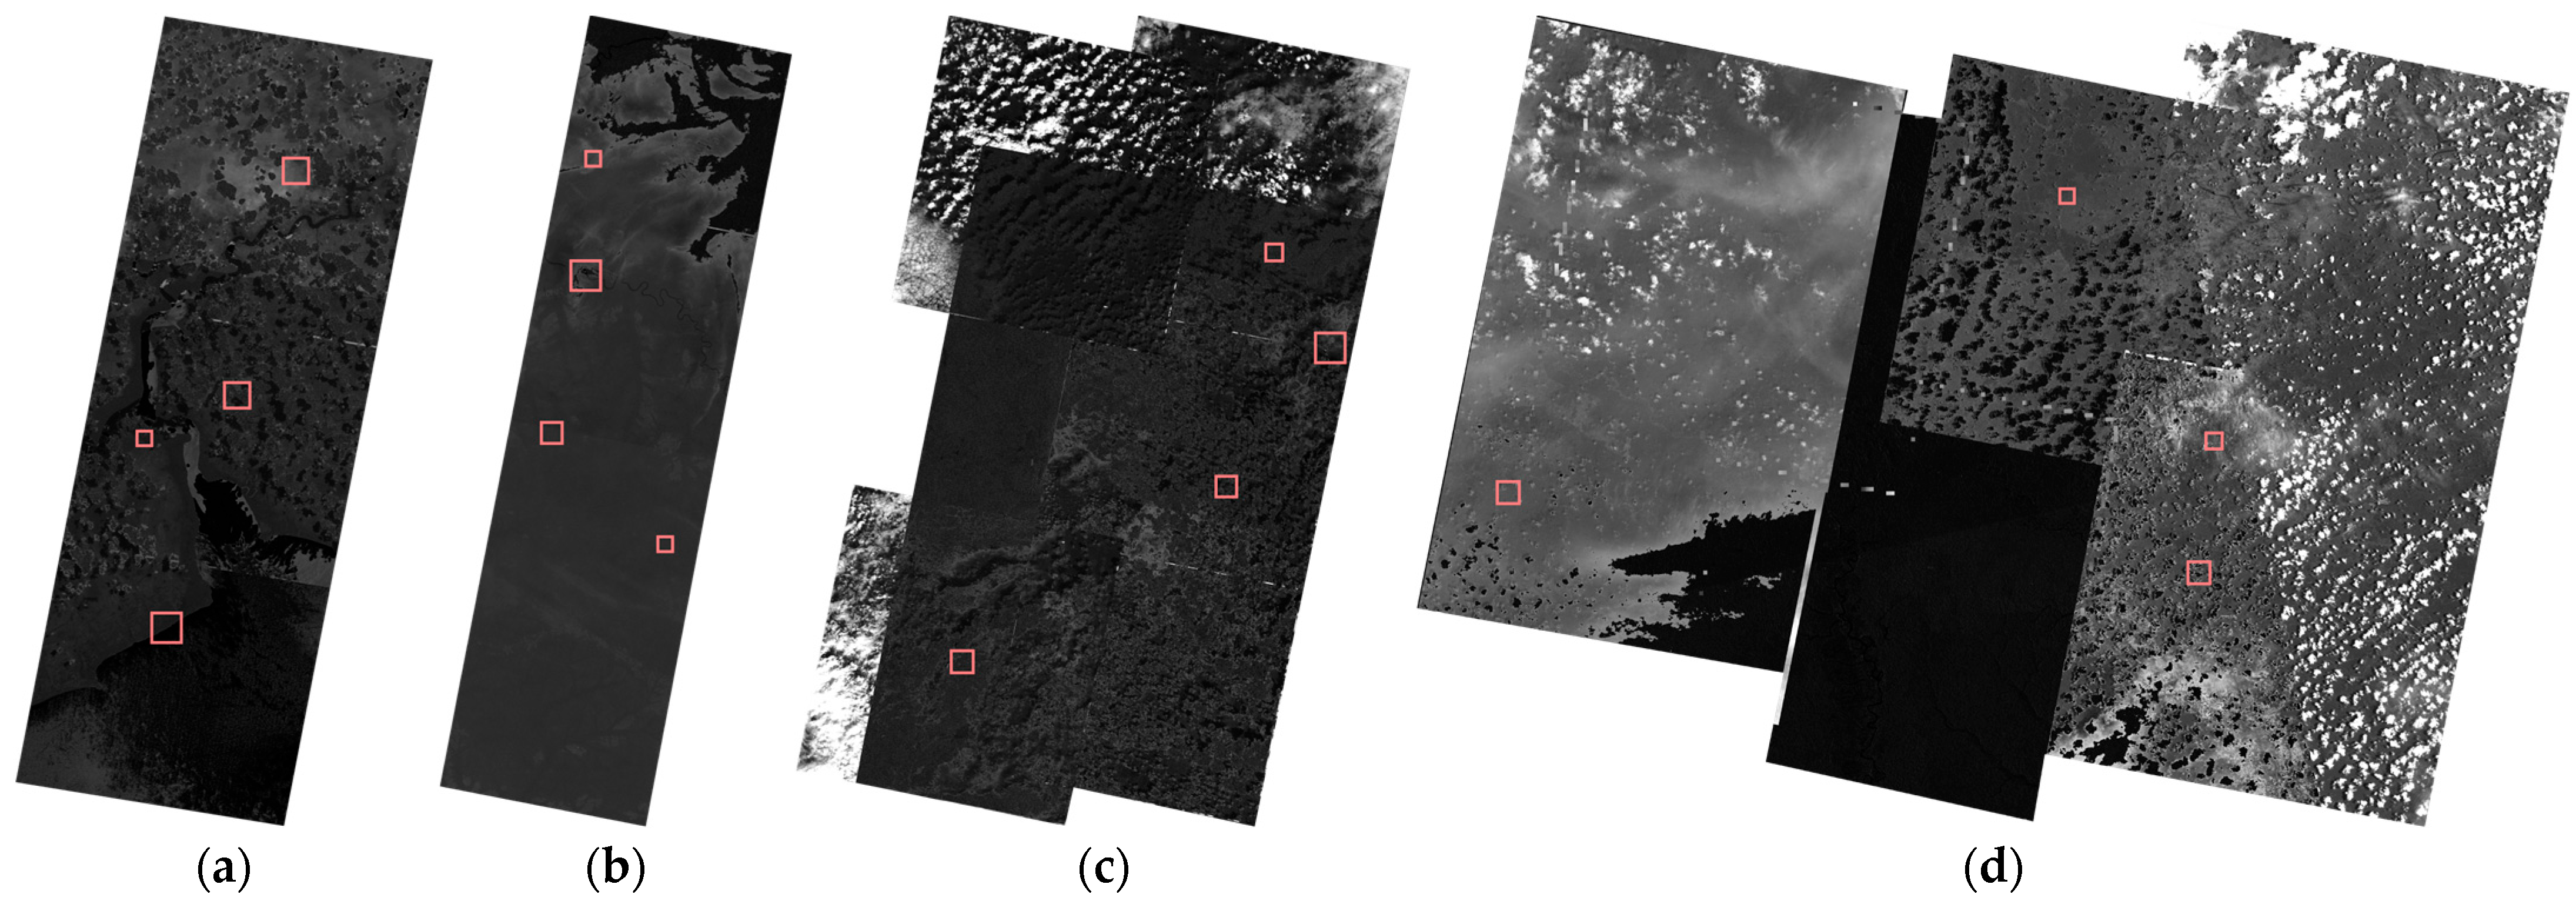
We conduct experiments in four equatorial regions using five different satellite images, demonstrating that the proposed method maintains sub-pixel alignment accuracy, even when cloud coverage in the optical images exceeds 50%.

2. Related Works

2.1. Multimodal Remote Sensing Image-Matching

Existing studies on multimodal remote sensing image-matching primarily focus on three key areas: the extraction of radiation-invariant features, robust matching estimation and the optimization of geometric consistency [20,31,32].
Radiation-invariant features are primarily extracted as cross-modal invariant features through either artificial design or deep self-supervised networks, aiming to construct representation models with low sensitivity to radiation differences. Specifically, RIFT [33,34] and CoFSM [35] construct descriptors based on the Log Gabor filter [36,37] and co-occurrence filter structure [38], respectively. CMM-NET [39] generates cross-modal remote sensing image features by learning modal-invariant feature representations, while AMES [40] enhances image sketch features by combining multiscale moment analysis and principal component analysis. Gao et al. developed a SAM-guided attention network for multimodal image-matching [28,41].
For optical-SAR image matching, Cui et al. employed convolutional neural networks with attention mechanisms and spatial-pyramid pooling to achieve accurate registration [23]. Li et al. developed a deep learning framework that exploits semantic-location probability distributions to guide SAR-optical matching [21]. Xiang et al. proposed a two-stage registration algorithm for large optical and SAR images [42]. Ye et al. proposed a hybrid approach that combines handcrafted and learning-based methods, using attention enhanced structural features to boost matching accuracy between optical and SAR images [43]. Xiang et al. integrated multidirectional anisotropic Gaussian derivative features into confidence-aware local matching with a geometry-invariant mask to reduce geometric discrepancies [44].
Robust matching estimation primarily employs optimal transmission theory or deep networks to establish homologous matching relationships between feature points and eliminate mismatches. Specifically, LPR [45] and GMS [46] detect mismatches by assessing local consistency between corresponding points, while AdaLAM [47] utilizes local affine transformations for mismatch detection. LightGlue [48] facilitates fast and efficient local feature-matching between images. Liu et al. integrate sparse self-attention and focused cross-attention modules for self-supervised image-matching [49]. Xia et al. extend an initial small set of reliable matches using smooth function estimation and Bayesian match expansion, iteratively refining the match set to ensure precise point correspondences [50]. Huang et al. employ a probabilistic graphical model to effectively eliminate mismatches by considering both local topology and global motion consistency [51]. Lu et al. combine a robust graph interaction model with a topology-aware relationship to efficiently filter outliers, modeling the interactions between correspondences while preserving geometric consistency [52]. Wu et al. integrate a dual-graph neural network with semantic information to improve the robustness and accuracy of the matching process [53].
Geometric consistency optimization primarily focuses on iteratively refining the locations of matching points through parametric projection transformations or local deformation models to achieve sub-pixel level alignment accuracy. Specifically, techniques, such as FED-HOPC [54] and CFOG [55] integrate feature points from the left image with a priori geometric information to optimize the matching point locations in the right image. Liao et al. designed a radiation-invariant similarity function to further refine the matching points based on initial matches [56].
For remote sensing images in the cloudy equatorial region, cloud occlusion can significantly impact the matching process [26]. Therefore, the effect of cloud occlusion must be thoroughly considered when matching optical and SAR images.

2.2. Cloud Detection from Optical Remote Sensing Imagery

Cloud detection in visible remote sensing imagery consists of two principal categories: traditional threshold-based methods and contemporary learning-based approaches [57,58]. Traditional techniques determine cloud cover by applying empirically derived thresholds to spectral measurements [26,27]. For example, researchers established specific cutoff values for apparent reflectance or brightness temperature in relevant channels to discriminate clouds from underlying surfaces [59]. Gupta et al. implemented thresholds within RGB and HSV color spaces to detect cloud pixels [60], while Tian et al. exploited the statistical variability of fractal dimension to identify cloudy regions [61]. Liu et al. further combined image gradient metrics with the HIS color model to refine pixel-level cloud classification [62].
The advancements of computing hardware have enabled learning-based methods to become the predominant approach [15]. Specifically, Jeppesen et al. employed a U-Net convolutional network to fuse spatial and spectral features, yielding substantial improvements in detection accuracy for visible satellite data [63]. Aybar et al. designed lightweight convolutional neural networks capable of real-time, on-orbit inference, thereby supporting operational cloud monitoring [58]. Li et al. introduced a hybrid algorithm that extracts grey-level covariance matrix descriptors and fed them into a light gradient-boosting machine classifier for reliable nighttime cloud detection [64,65]. Shang et al. combined traditional threshold tests with a random tree classifier to perform both cloud detection and cloud-phase classification, achieving robust performance across diurnal cycles and a range of surface backgrounds [25].
In recent years, the development of prompt-driven visual segmentation models, such as SAM [28,66], Mask DINO [29], and SEEM [67], has led to the emergence of more effective solutions for cloud detection in remote sensing imagery [68]. While these models demonstrate impressive segmentation capabilities, they often rely on manually provided keypoints as prompts to achieve optimal segmentation results. This reliance presents a significant challenge for fully automating cloud extraction processes. Consequently, the design of an automatic method for generating keypoints to serve as prompts for cloud extraction has become a critical route for advancing fully automated cloud detection in remote sensing imagery, leveraging the potential of these advanced visual models.

3. Materials and Methods
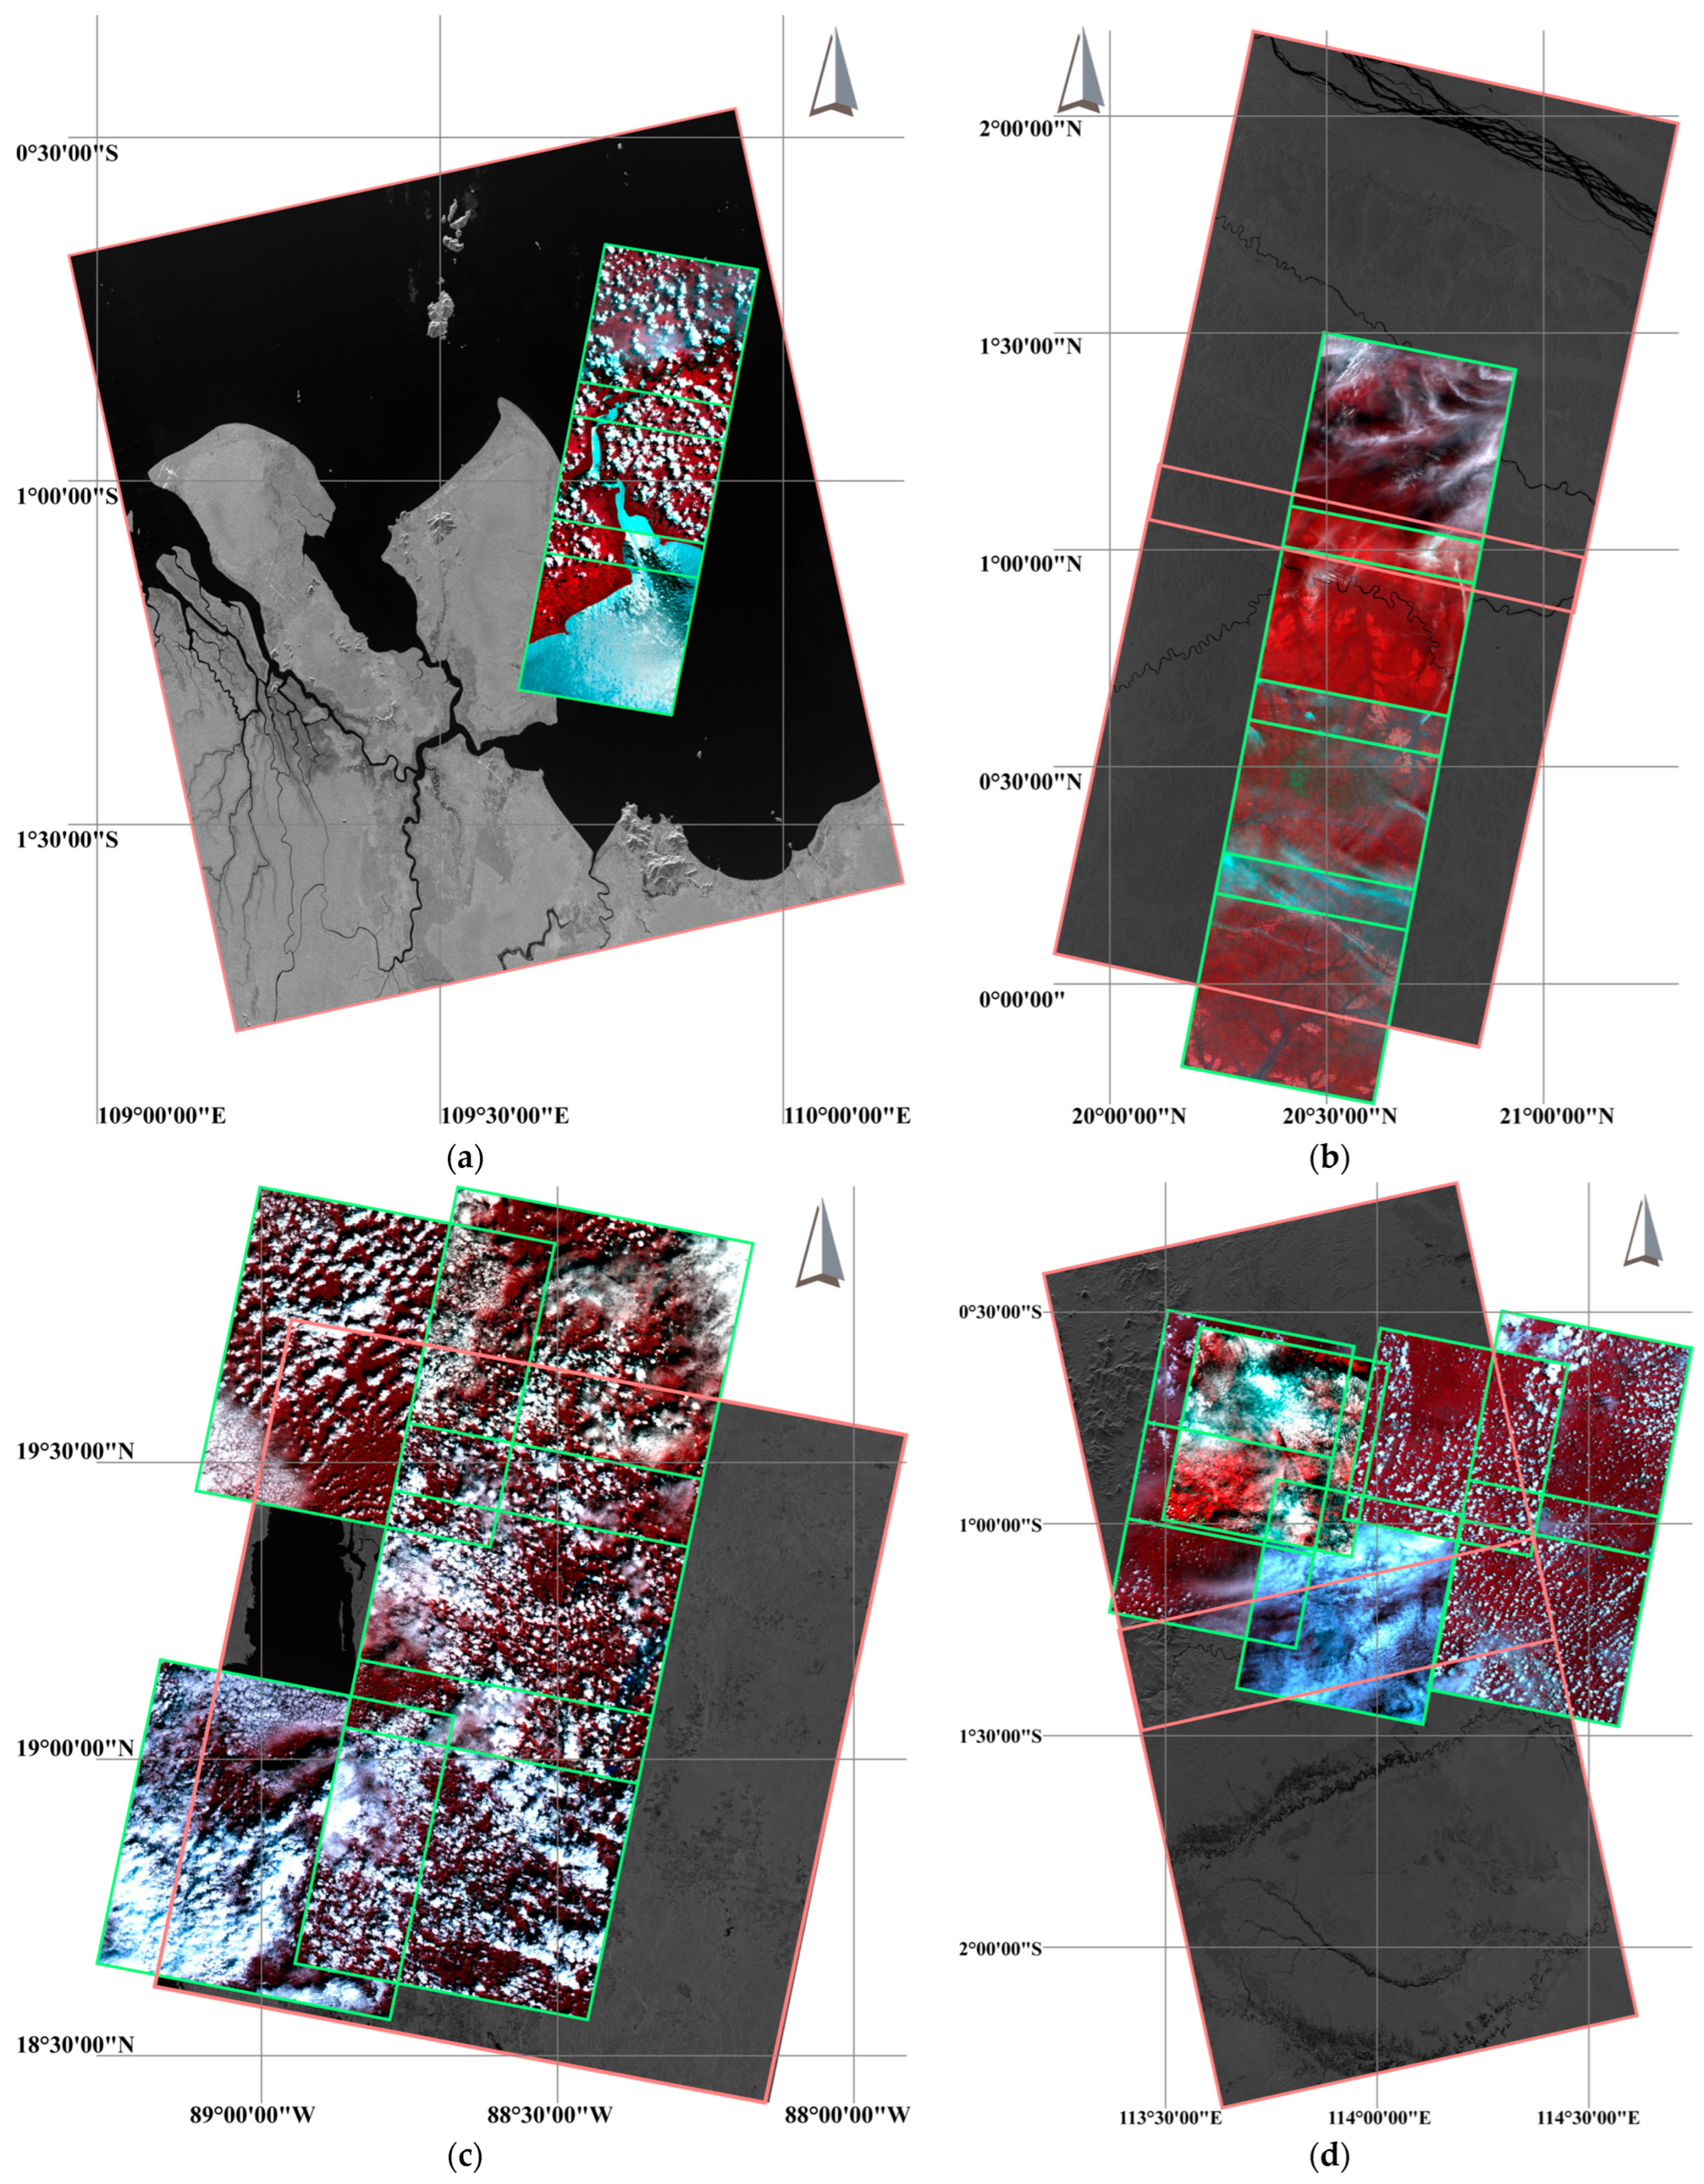
3.1. Datasets

Four regions near the equator were selected for this study. The optical datasets comprised Gaofen-07 (GF-07) and Ziyuan-3 (ZY-3) imagery, while SAR input was derived from Gaofen-03 (GF-03) acquisitions. Table 1 summarizes the key parameters for each dataset, including spatial resolution, acquisition dates, and sensor characteristics. By analyzing these complementary data sources across diverse equatorial locales, we assessed our framework’s capacity to integrate high-resolution optical details with all-weather SAR coverage for robust DOM generation under persistent cloud conditions.
From Table 1, it is evident that all four study areas lie within the equatorial belt, spanning both eastern and western longitudes along with northern and southern latitudes. Optical and SAR acquisitions were timed closely to reduce temporal discrepancies; nevertheless, the spatial resolutions vary considerably, with the greatest disparity reaching nearly a factor of seven in Region 1. Cloud cover across the test sites generally exceeds 30 percent, peaking above 50 percent in Region 3. These characteristics underscore the need for a multimodal approach to achieve uninterrupted DOM production under persistent cloud conditions.
To illustrate the spatial relationship between optical and SAR coverage, we mapped the footprints of both data types for all four study regions, as shown in Figure 1. Each region’s optical scenes (shown in blue) and SAR swaths (shown in red) are overlaid on a geographic basemap, revealing the extent of their overlap and the areas where SAR data must compensate for cloud-obscured optical imagery. This visualization underscores the complementary nature of the two sensors and provided a clear reference for subsequent alignment and ortho-rectification processes.
Figure 1 depicts the spatial overlap between optical and SAR imagery for each region. In most cases, the SAR footprint extends well beyond the optical coverage, providing crucial compensatory data where clouds obscure the optical view. Indeed, nearly every optical scene exhibits substantial cloud masking; in Region 4, two optical images are completely occluded. This visual evidence highlights the indispensability of SAR data when generating comprehensive orthophotos in equatorial, multi-cloud environments.

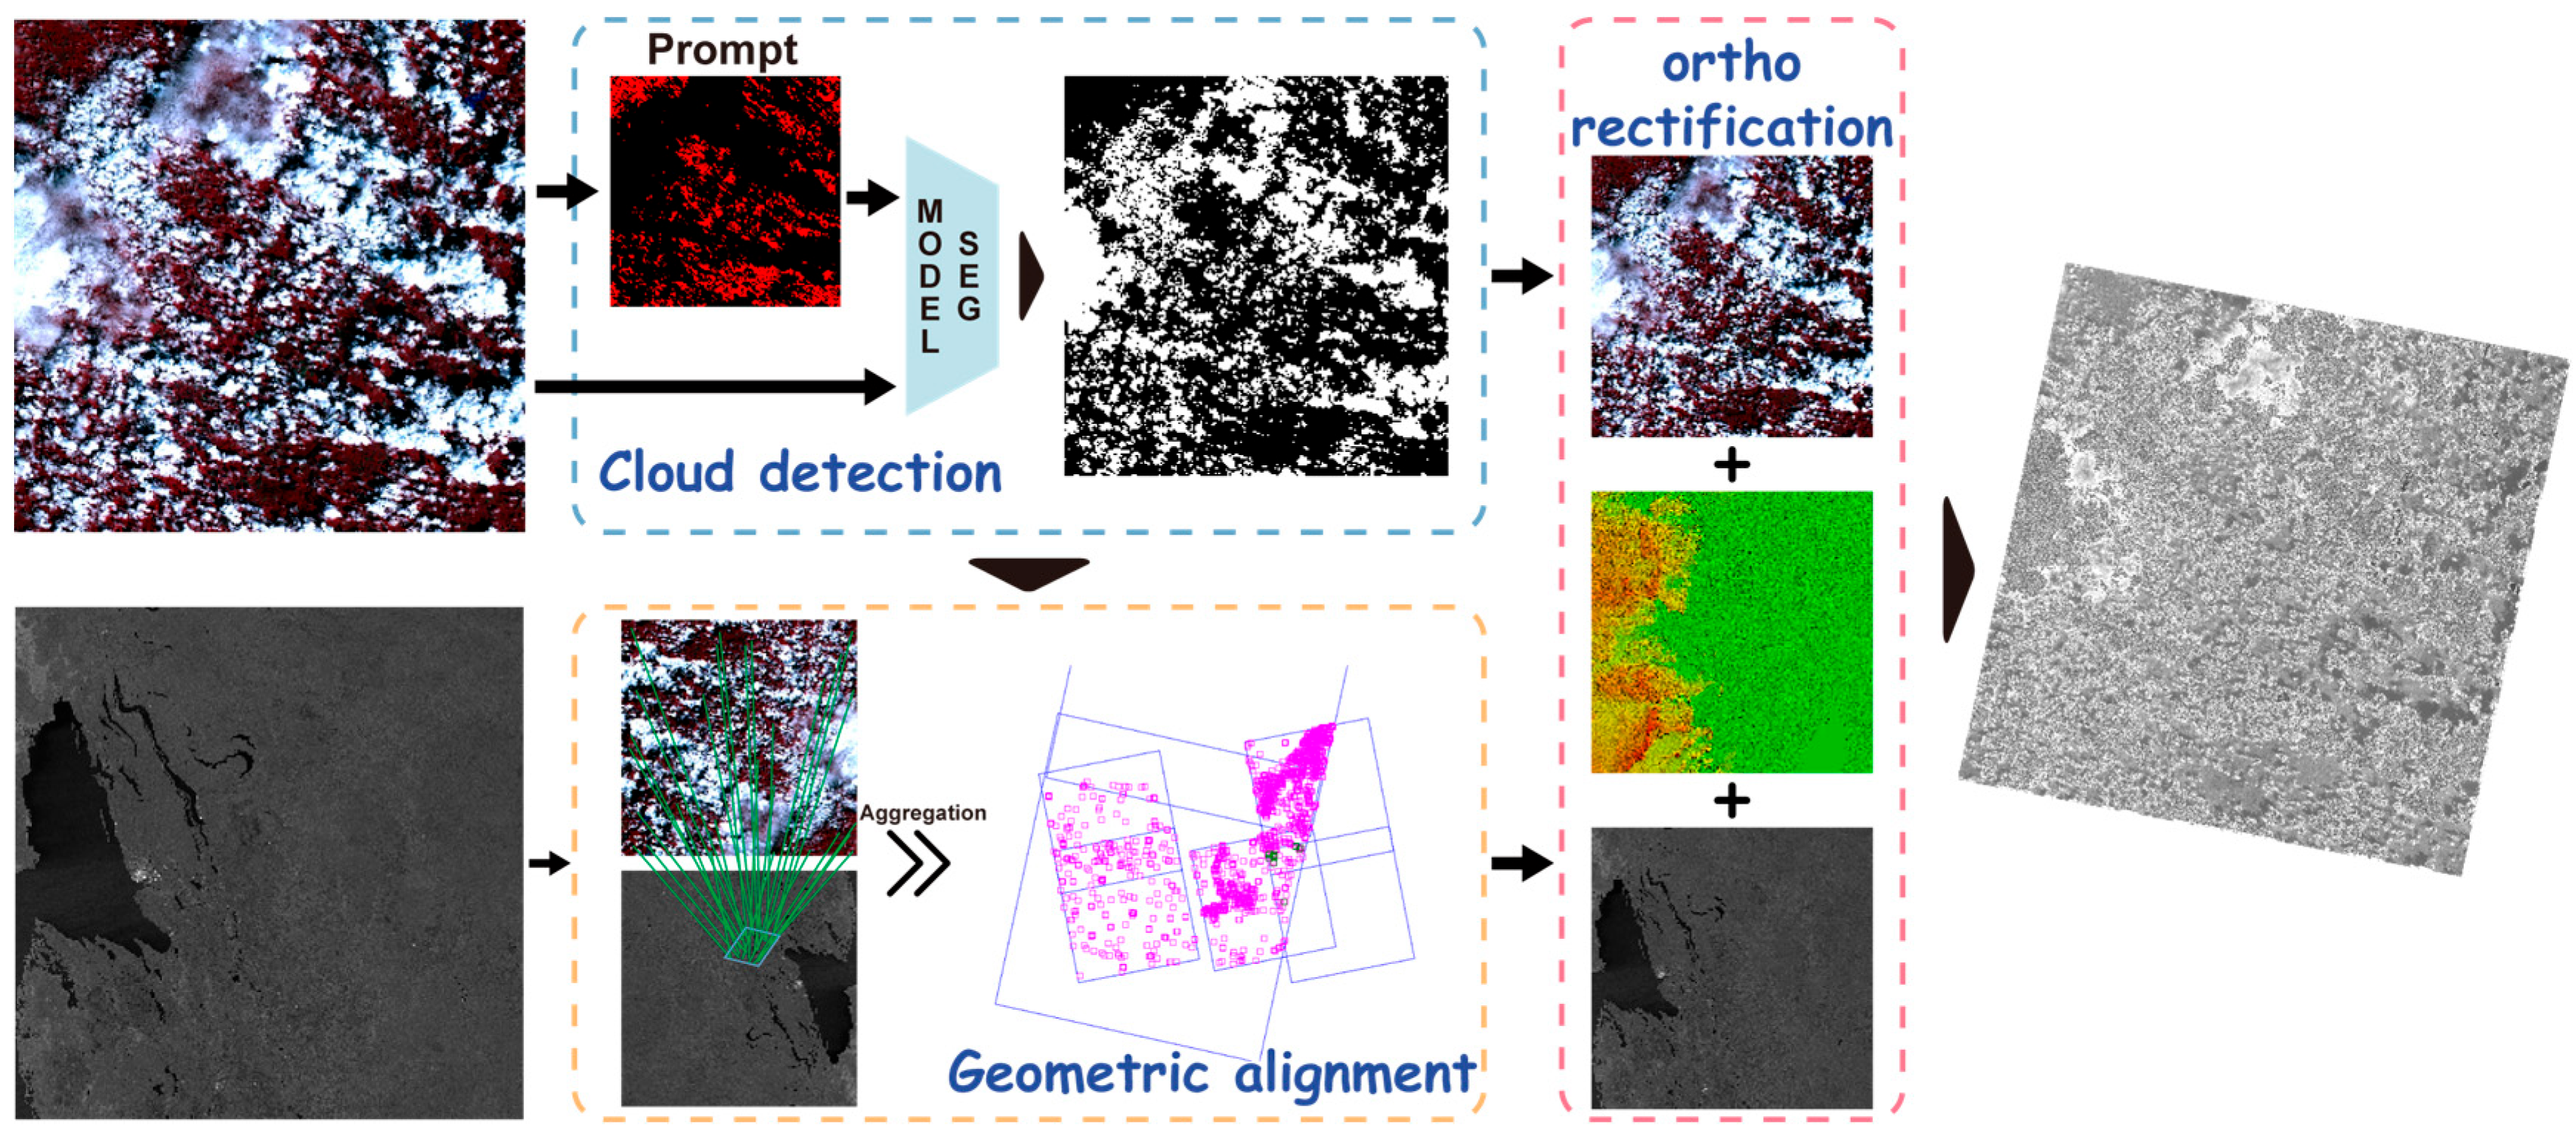
3.2. The Proposed Framework

As illustrated in Figure 2, our process for combined optical and SAR orthophoto mapping in the equatorial region consists of two core modules: optical image cloud detection and multi-source image geometric datum unification.
In particular, cloud detection was performed on optical imagery using advanced visual segmentation models. Crucially, we automated the generation of prompt key points by extracting matching feature points, thereby eliminating the need for manual input. Then, we conducted cross-modal image-matching using the cloud-mask data and achieved geometric spatial alignment through joint optical-SAR image adjustment. Finally, we complete the ortho-correction process guided by the cloud mask and produce cloud-free orthophoto products from the mosaics of optical and SAR images.

3.2.1. Cloud Detection with Prompt-Driven Segmentation

We employed open-source prompt-driven segmentation models for cloud detection in optical imagery. Because the performance of these pre-trained models hinges on well-chosen spatial prompts, we used the feature points obtained during optical-SAR matching as candidate prompts. Specifically, we identified those feature points that coincided with cloud-covered areas and submitted them to the segmentation modal. To determine whether a feature point lies on a cloud, we adopted a physical-radiometric criterion, computing the normalized difference vegetation index (NDVI) and normalized difference water index (NDWI) within a local neighborhood around each point [69,70]:
N D V I = B N I R B R B N I R + B R N D W I = B G B N I R B G + B N I R
where B R , B G , and B N I R represent the red, green, and near-infrared band intensities, respectively. Points where NDVI and NDWI values fell within predefined cloud thresholds were designated as cloud prompts for the segmentation model.
Considering that thin clouds generally retain surface interpretability, this study focused primarily on detecting thick clouds. According to Huang et al. [27], in tropical and subtropical regions, NDVI and NDWI values in thick cloud-covered areas typically fall within the intervals [ 0.08 , 0.3 ) and [ 0.17 , 0.08 ) , respectively. Thus, we selected feature points where NDVI and NDWI indices fell within these specified ranges, assuming these points to represent cloud-covered areas. After performing spatial clustering and non-maximum suppression [71], the selected feature points served as spatial prompts for cloud detection.

3.2.2. Geometric Alignment of Optical-SAR Images with Cloud-Mask Weighting

Geometric alignment of optical and SAR images begins with cross-modal matching of the image pairs. Given that the initial localization parameters of both images are relatively precise and that the optical image is susceptible to cloud interference, we first extracted feature points from the SAR image using the AMES method [40]. These points were then projected onto the optical image coordinate system based on the initial localization parameters to form the initial matching point set for subsequent optimization.
To address the nonlinear radiation differences between optical and SAR images, we established a radiation-invariant optimization model [56] that accounts for cloud interference:
a r g min Γ R I S F ( I S A R x , y , I O P T T r a n s Γ ( x , y ) ) · P ( T r a n s Γ ( x , y ) )
where R I S F ( · ) is the radiation-invariant similarity function, Γ is the parameter to be solved, and T r a n s Γ ( · ) is the inter-image geometric transformation model, which we adopted as a polynomial function based on prior research [56,72]. The term P ( x , y ) denotes the cloud-mask penalty, defined as:
P x , y = 1 2 r r < η 0 r η
Here, r represents the proportion of cloud-covered area centered on the matching point within the surrounding neighborhood (which can be obtained from the previous cloud detection module). When cloud coverage exceeds a certain percentage (i.e., r η ), the matching point is eliminated. After iterative optimization of this model, the final geometric alignment of the optical and SAR images was achieved through block adjustment.

3.3. Implementation Details

The above work was implemented and compiled using C/C++ in the Visual Studio 2015 environment. The related experiments were conducted on a workstation running Windows 10 X64, equipped with an Intel Xeon E5-2697 v3 CPU (2.60 GHz) and 128 GB of RAM. The official pre-trained SAM model (https://segment-anything.com/, accessed on 15 April 2025) was employed as our segmentation model, with inference performed on an NVIDIA A6000 GPU.

4. Results

4.1. Parameter Study

To assess the influence of the inclusion threshold η on geometric accuracy, we conducted experiments with η set to 0.25, 0.50, 0.75, and 1.00. For each setting, we computed the unit-weighted median error of the tie points. The resulting adjustment accuracies are summarized in Table 2, demonstrating how stricter or more permissive inclusion criteria affect the overall precision of the alignment.
Table 2 indicates that Region 2, characterized by minimal and mostly thin cloud cover, achieves the best adjustment accuracy at η   =   0.25 . As cloud cover increases, accuracy declines substantially, reaching its lowest level in Region 4, where some images are nearly entirely obscured. When η exceeds 0.50, adjustment accuracy in heavily clouded images varies slightly and remains generally constant. To balance performance across both low and high cloud cover scenarios, we selected η   =   0.50 for all subsequent experiments.

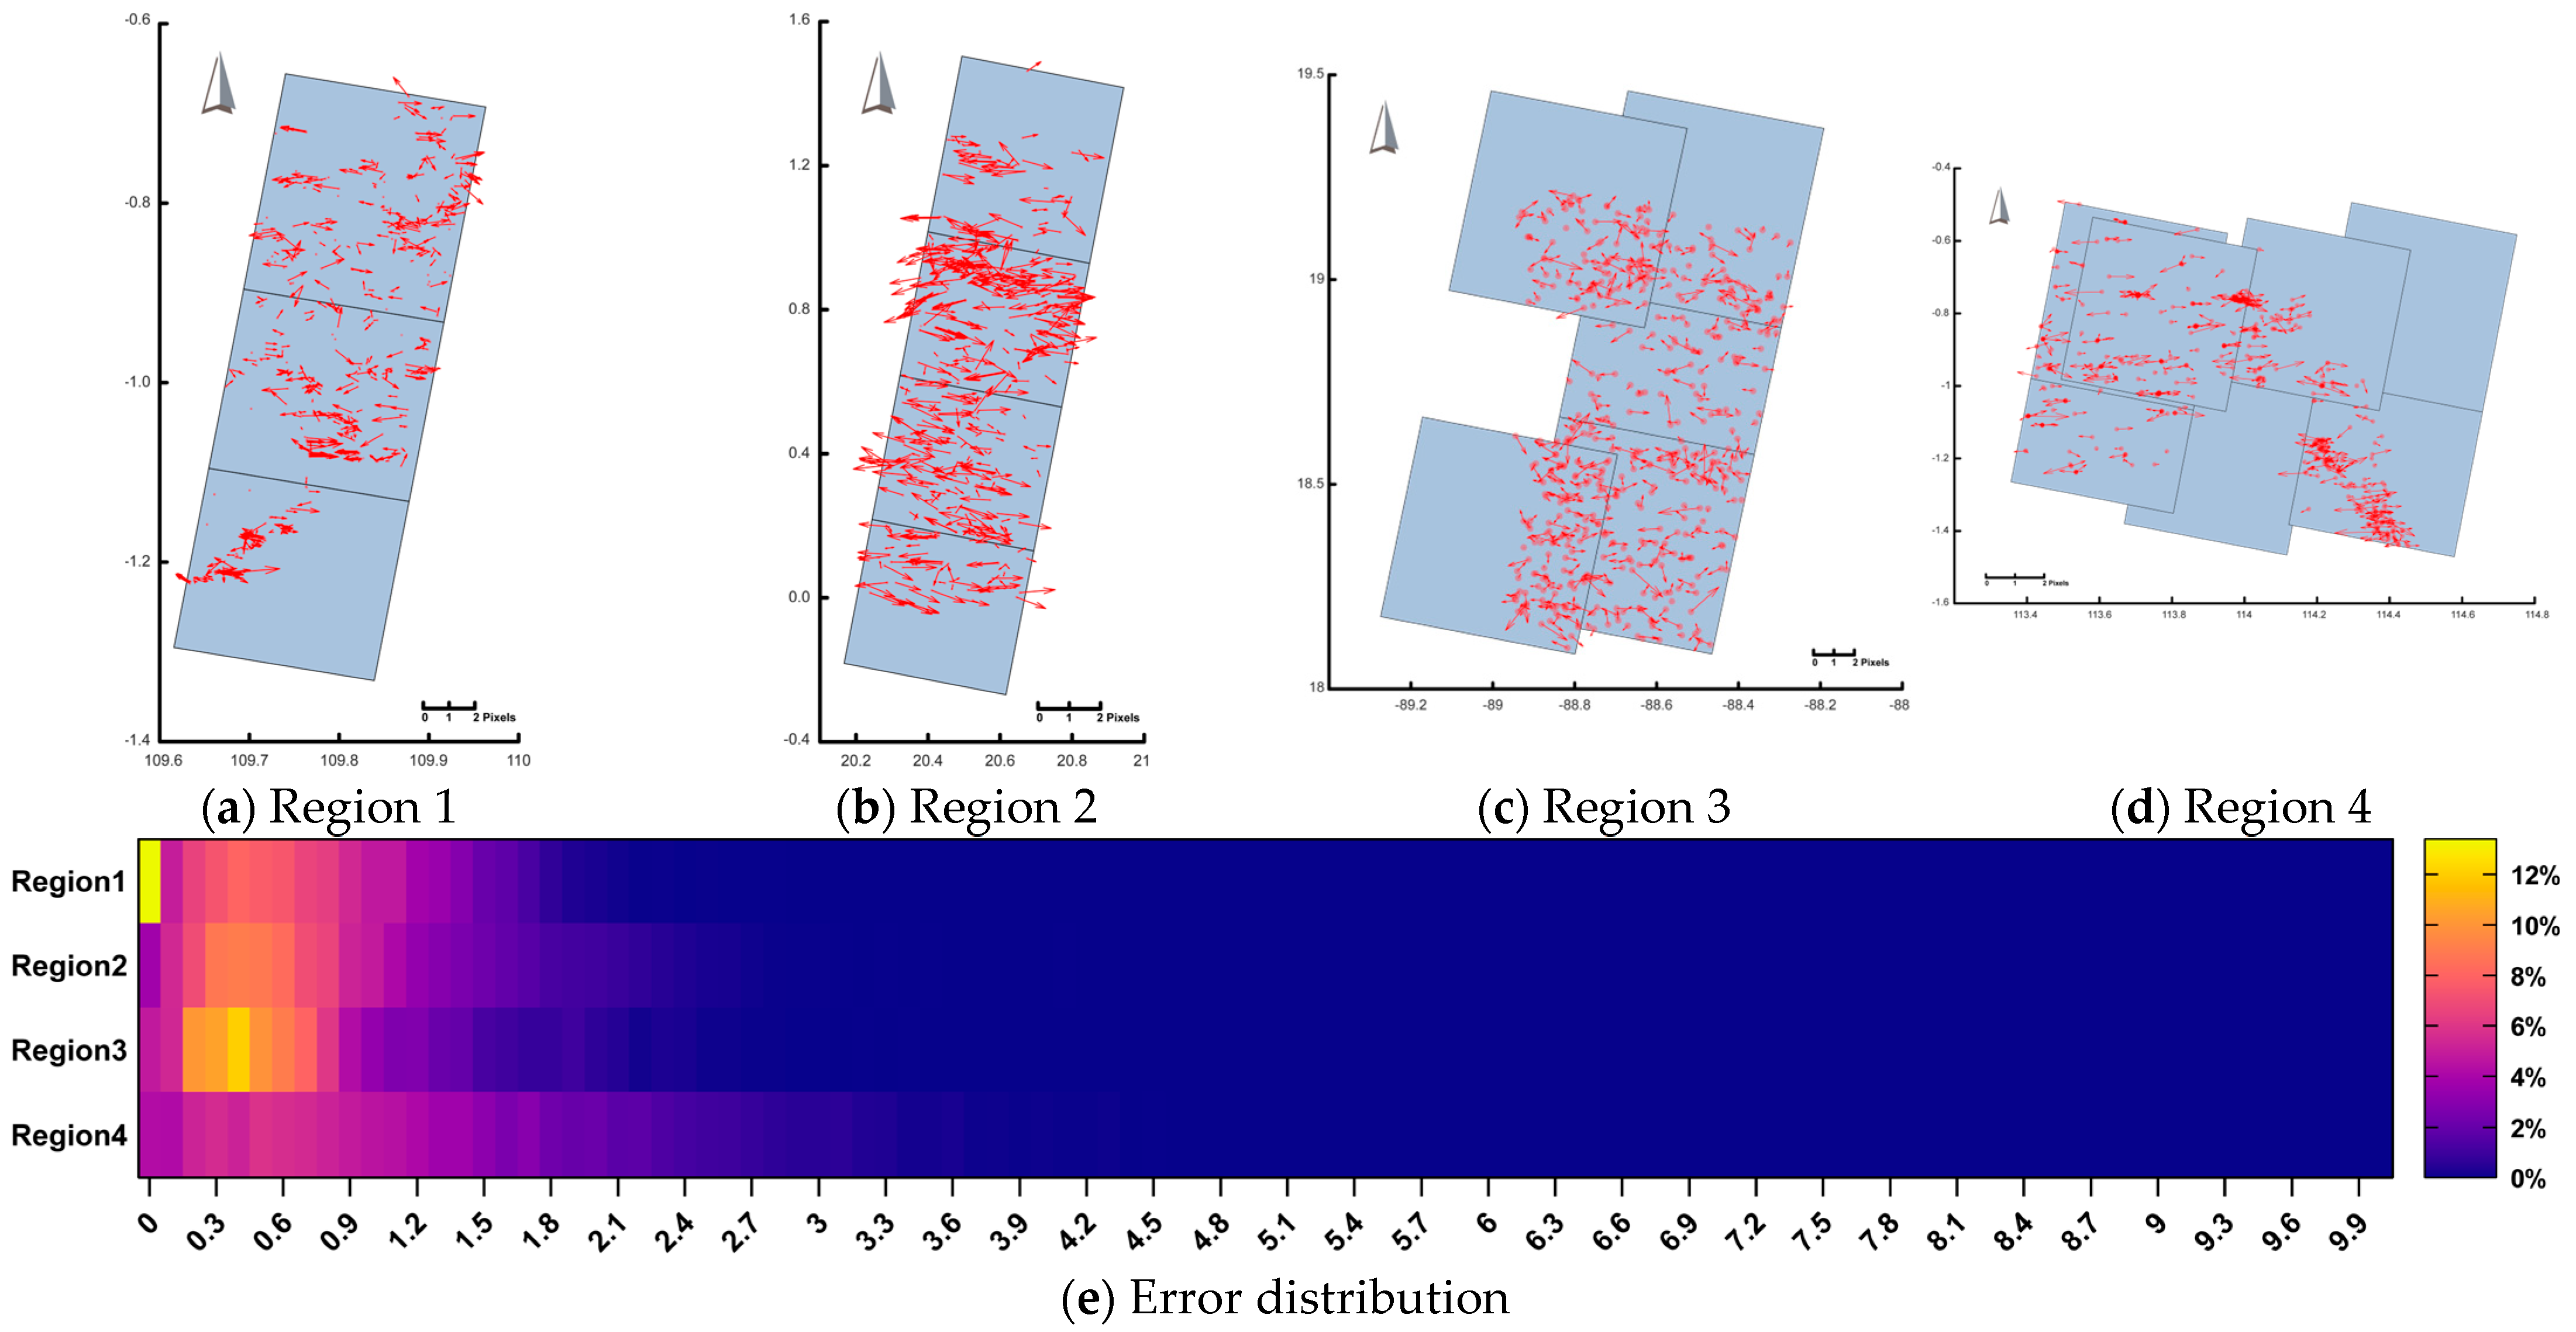
4.2. Quantitative Analysis

For the quantitative analysis, we evaluated the quality of the orthorectification of the optical images assisted by SAR from two perspectives: combined adjustment accuracy and ortho-edging error. Adjustment accuracy is measured using the unit-weighted median error of the tie points, while edging error is assessed by manually measuring at least six uniformly distributed checkpoints in each region. The detailed results are presented in Table 3.
From Table 3, it is evident that all four regions have a sufficient number of points for adjustment. However, Regions 1 and 3 have relatively fewer tie points. This is primarily due to the smaller coverage of the GF-07 optical images in Region 1, compared to the larger coverage of ZY-03 images. Additionally, the cloud cover in Region 3 exceeds 50%, which complicates the acquisition and matching of tie points. Despite this, the number of tie points in these regions remains adequate to ensure a substantial scale.
Regarding the unit-weighted median error of the tie points, it is evident that the error in Region 1 is significantly larger than in the other three regions. This is primarily due to the higher resolution of the GF-07 image compared to the GF-03 image (0.67 m vs. 4.45 m), which amplifies the error in the statistical analysis. Additionally, the error in Region 4 is larger than in Regions 2 and 3, which is attributable to two factors. First, the overlap between the optical and SAR images in Region 4 is smaller than in the other regions. Second, the presence of two images with nearly 100% cloud cover in Region 4 divides the area into two independent blocks. This reduces the redundancy of tie-point observations, consequently decreasing the accuracy.
Regarding edging accuracy, Region 1 exhibits significantly higher accuracy than Regions 3 and 4, which can be attributed to the higher resolution of the optical images in Region 1. Furthermore, Region 2 achieves the highest accuracy among the four regions. This can be explained by the lower cloud cover in Region 2 compared to the other regions, which facilitates the task.
To further assess the adjustment effect, we randomly selected 500 tie points from each region and plotted their 2D residual distributions, as shown in Figure 3a–d.
The spatial distribution of randomly sampled tie points in each experimental region reveals several important characteristics. In cloud-free areas, tie points exhibit near-uniform distribution, ensuring that most overlapping regions between optical and SAR imagery contribute effectively to the adjustment procedure. However, in cloud-covered zones, the tie points are largely absent. For instance, the lower-right quadrant of Figure 3a, the upper section of Figure 3b, and the central area of Figure 3e show a nearly complete absence of tie points. This strategic exclusion of tie points in cloud-affected regions prevents unreliable correspondences from affecting the block adjustment, thereby enhancing the accuracy of the final alignment.
In contrast, there are regions where the lack of tie points is not due to cloud cover but rather a result of insufficient SAR coverage. Notably, the lower part of Figure 3b and the right side of Figure 3e exhibit gaps in tie-point distribution caused by the absence of SAR overlap in these areas.
Each tie point’s planar residual is depicted by an arrow, with the length of the arrow corresponding to the magnitude of the residual (measured in pixels) and the orientation representing the direction of the residual. In Figure 3a–d, the arrows are distributed in a seemingly random pattern, with no obvious clusters of large-magnitude vectors. This randomness in the orientation of the residuals, along with the absence of significant outliers, indicates that erroneous or misaligned tie points have been effectively filtered out during the alignment process. Consequently, this ensures a robust and reliable geometric alignment across the study regions. This outcome further supports the effectiveness of our methodology in achieving accurate and precise orthorectification, even in regions with challenging environmental conditions.
Additionally, Figure 3e presents a heat map that visualizes the planar residuals for all SAR-derived tie points across the four experimental regions. In this display, each horizontal band corresponds to a specific residual range; its brightness encodes the number of tie points within that interval, with brighter bands indicating larger counts. To ensure statistical consistency, we based this analysis solely on tie points obtained from SAR imagery, given the uniform SAR resolution compared with the varied resolutions of the optical datasets.
The distribution pattern in Figure 3e closely mirrors the trend observed for the 500 randomly sampled tie points in Figure 3a through Figure 3d. This close correspondence confirms that our sampling approach accurately represents the full residual distribution and reinforces the validity of our geometric alignment evaluation.
A detailed inspection of the heat map reveals that, in each region, the vast majority of residuals cluster within a one-pixel band on the left side of the scale. Notably, Region 1 exhibits an even denser clustering of residuals around zero, indicating superior tie-point accuracy compared to the other regions. This finding provides an independent validation of the higher unit-weighted median error observed in Region 1′s adjustment results. In this instance, the elevated error metric arises not from poorer alignment but from the amplification of sub-pixel deviations when converting from the finer optical image resolution to the coarser SAR grid.
Figure 4 illustrates the planar residual distributions of the manually selected checkpoints for each of the four regions. In each subplot, a horizontal bar illustrates the spread of residuals along the x-axis (lateral error) and a vertical bar depicts the spread along the y-axis (longitudinal error). The mean residual for both directions is marked by a black dot. Additionally, each bar includes three markers indicating the minimum, median, and maximum residual values, respectively. Together, these elements convey both the central tendencies and ranges of checkpoint errors, facilitating a clear assessment of geometric consistency across regions.
As shown in Figure 4, the residual vectors are evenly dispersed among the four quadrants of the coordinate system, demonstrating that no directional bias persists after orthorectification. Both the x-direction and y-direction residuals occupy similar numeric ranges, with their mean values clustering close to the axes. This pattern confirms that systematic geometric errors between the orthorectified optical and SAR images have been effectively removed, yielding equivalent horizontal and vertical accuracies.
Additionally, Region 1 demonstrates the highest edging precision, attributable to the GF-07 optical data’s superior spatial resolution and geometric fidelity. Region 2 attains improved edging accuracy, owing to its relatively low cloud cover, which enhances feature-matching reliability. These observed regional disparities align with the quantitative metrics presented above. Moreover, since the SAR image resolutions in all four study areas uniformly exceed 4 m, the proposed cloud mask-guided cross-modal alignment framework consistently achieves sub-pixel-level geometric congruence under equatorial cloudy conditions.

4.3. Qualitative Analysis

The results of our orthorectification procedure for optical images assisted by SAR across the four experimental regions are depicted in Figure 5. Given that each SAR scene covers a larger area than its optical counterpart and no repeat observations exist outside the optical footprint, our analysis concentrated on regions where both SAR and optical images overlap. Consequently, Figure 5 illustrates the orthorectified mosaic restricted to the spatial extent of the optical images.
A detailed inspection of Figure 5 demonstrates that, under our proposed framework, SAR-derived surface information supplants cloud-obscured segments of the optical imagery, producing a continuous orthophoto free of data gaps. In Region 4, where two optical scenes are entirely occluded by clouds, the orthophoto is generated exclusively from SAR inputs. Despite the absence of optical data in these sections, the resulting map preserves a high degree of geometric consistency with adjacent, optically sourced areas. These findings confirm that our method effectively exploits the complementary strengths of each sensor; it retains the fine spatial detail characteristic of optical imagery while leveraging SAR’s all-weather acquisition capability to ensure uninterrupted, high-fidelity orthophoto production in equatorial, cloudy environments.
To further assess geometric consistency, we identified four representative image blocks within each experimental region and marked them with pink boxes in Figure 5. These blocks encompass a diverse set of conditions, including clear sky expanses, partially cloud-shaded areas, and intricate land-water boundaries, to rigorously challenge our alignment algorithm. By selecting regions that vary in surface texture, feature density, and occlusion extent, we ensure that the evaluation captures performance under both ideal and adverse imaging scenarios. This block-level analysis provides a detailed view of how well the orthorectification preserves spatial coherence across heterogeneous terrain and variable atmospheric conditions.
Figure 6 presents the results. Each subplot’s left panel shows separate ortho-rectification outputs for the optical and SAR images. The right panel displays the orthorectification results. This direct comparison highlights the combined approach’s effectiveness in enhancing edge alignment, preserving fine spatial detail, and ensuring seamless geometric consistency across sensor modalities.
As shown in Figure 6, in Region 1, the high spatial resolution and geometric fidelity of the GF-07 imagery produce only minor edging errors, with small discrepancies confined to a few blocks. By contrast, Regions 2–4, which were acquired by the lower-resolution ZY-03 sensor, display more pronounced edging errors before fusion. The orthorectification process effectively resolved these mismatches, bringing optical and SAR boundaries into close alignment. This level of geometric consistency persisted even in cloud-covered zones. For example, the second block in Figure 6b and the fourth block in Figure 6d maintain coherent, well-aligned edges between the ortho-rectified optical and SAR outputs, despite heavy cloud obscuration.

5. Discussion

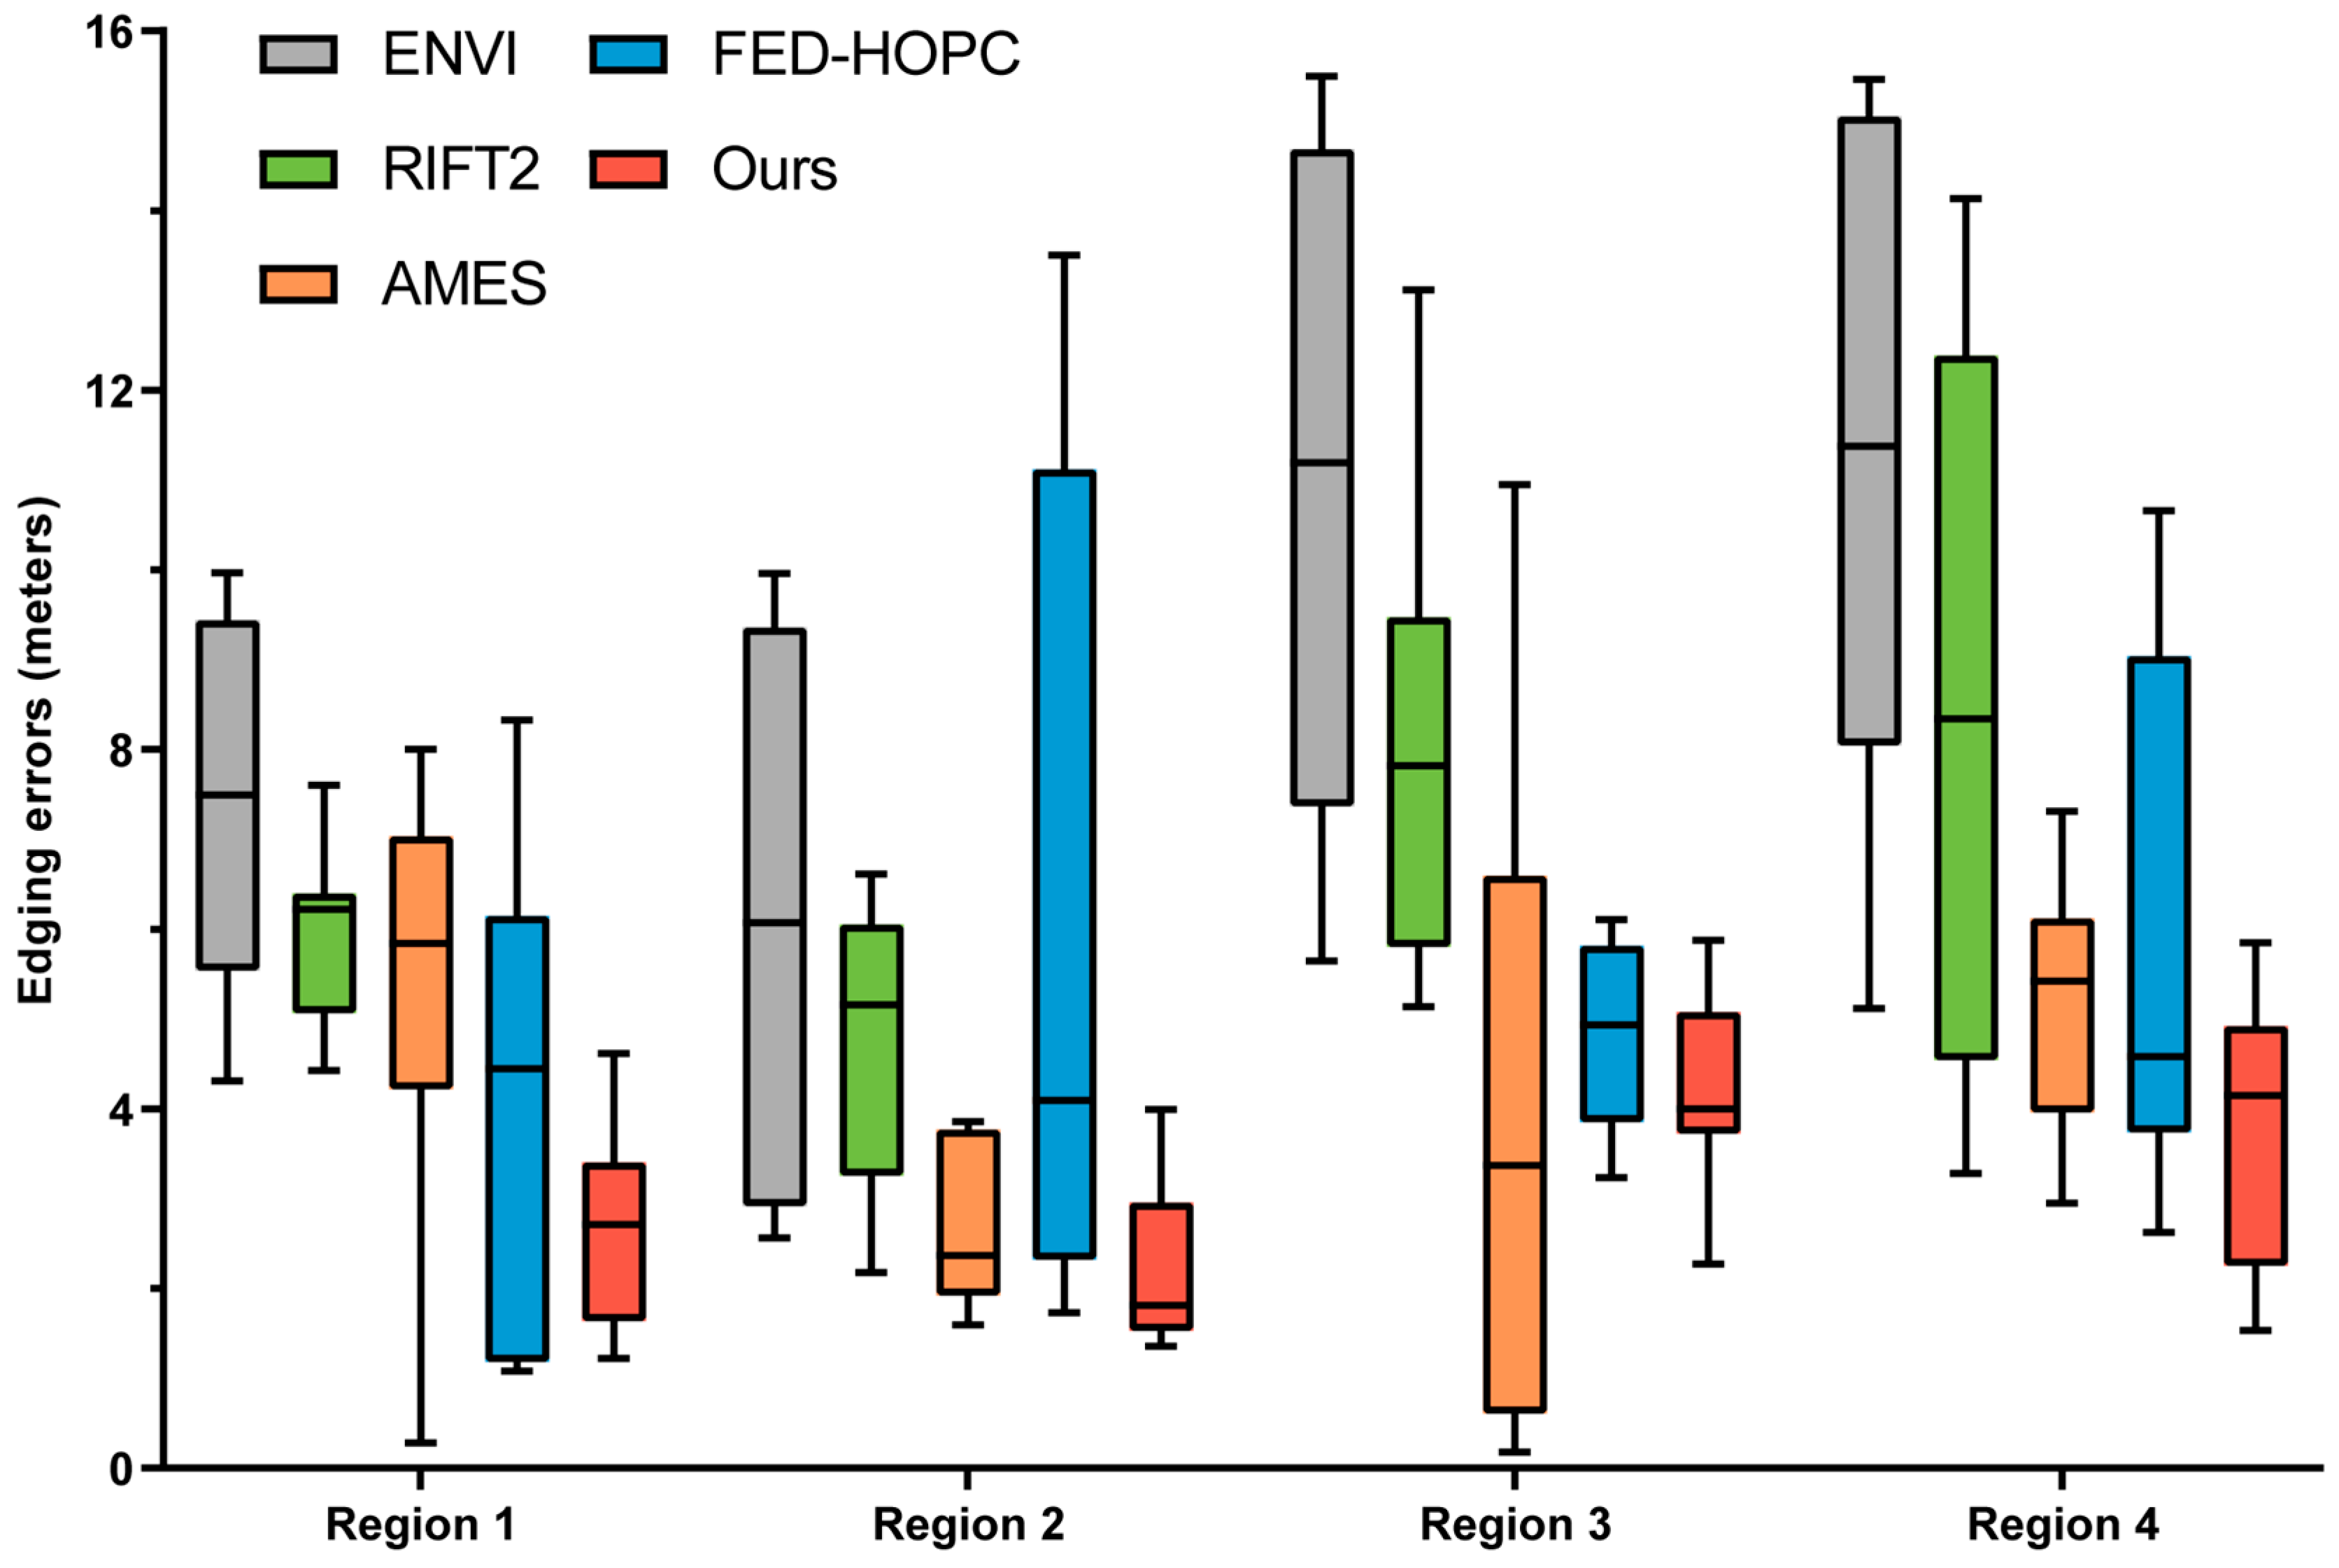
5.1. Comparison with Other Matching Strategies

To evaluate our approach in equatorial cloudy regions, we compared it with three SOTA multimodal matching algorithms: FED HOPC; AMES; and RIFT2 [33,34,40,54], along with ENVI’s (version: 5.3) automatic geometric correction module (https://envi.geoscene.cn/installhelp/, accessed on 25 April 2025), a widely used practical tool. We assessed each method’s edging accuracy by transferring the manually measured checkpoints from Section 4.2 onto the corresponding orthorectified outputs and computing their positional errors. Figure 7 presents the distribution of these checkpoint errors.
Figure 7 offers a comprehensive statistical summary of edging errors for each region. In every bar, the highest horizontal tick marks the maximum edging error, the central tick indicates the mean error, and the lowest tick corresponds to the minimum error. The colored rectangle extends from the 25th percentile to the 75th percentile, thereby representing the interquartile range of the errors. Together, these elements convey both the variability and the central tendency of boundary misalignments across the four study areas.
Across all four regions, the orthophotos produced by ENVI exhibited markedly larger edging errors than those generated by the other methods. This outcome likely stems from ENVI’s reliance on mutual information-based matching, which lacks robustness against the nonlinear radiometric differences inherent to optical and SAR imagery. ENVI also employs a much smaller set of tie points. Our cloud mask-guided matching framework achieves higher and more consistent accuracy. By directing feature-matching away from cloud-obscured areas, our approach minimizes radiometric disturbances during image registration and delivers superior edging alignment.

5.2. Ablation Experiments
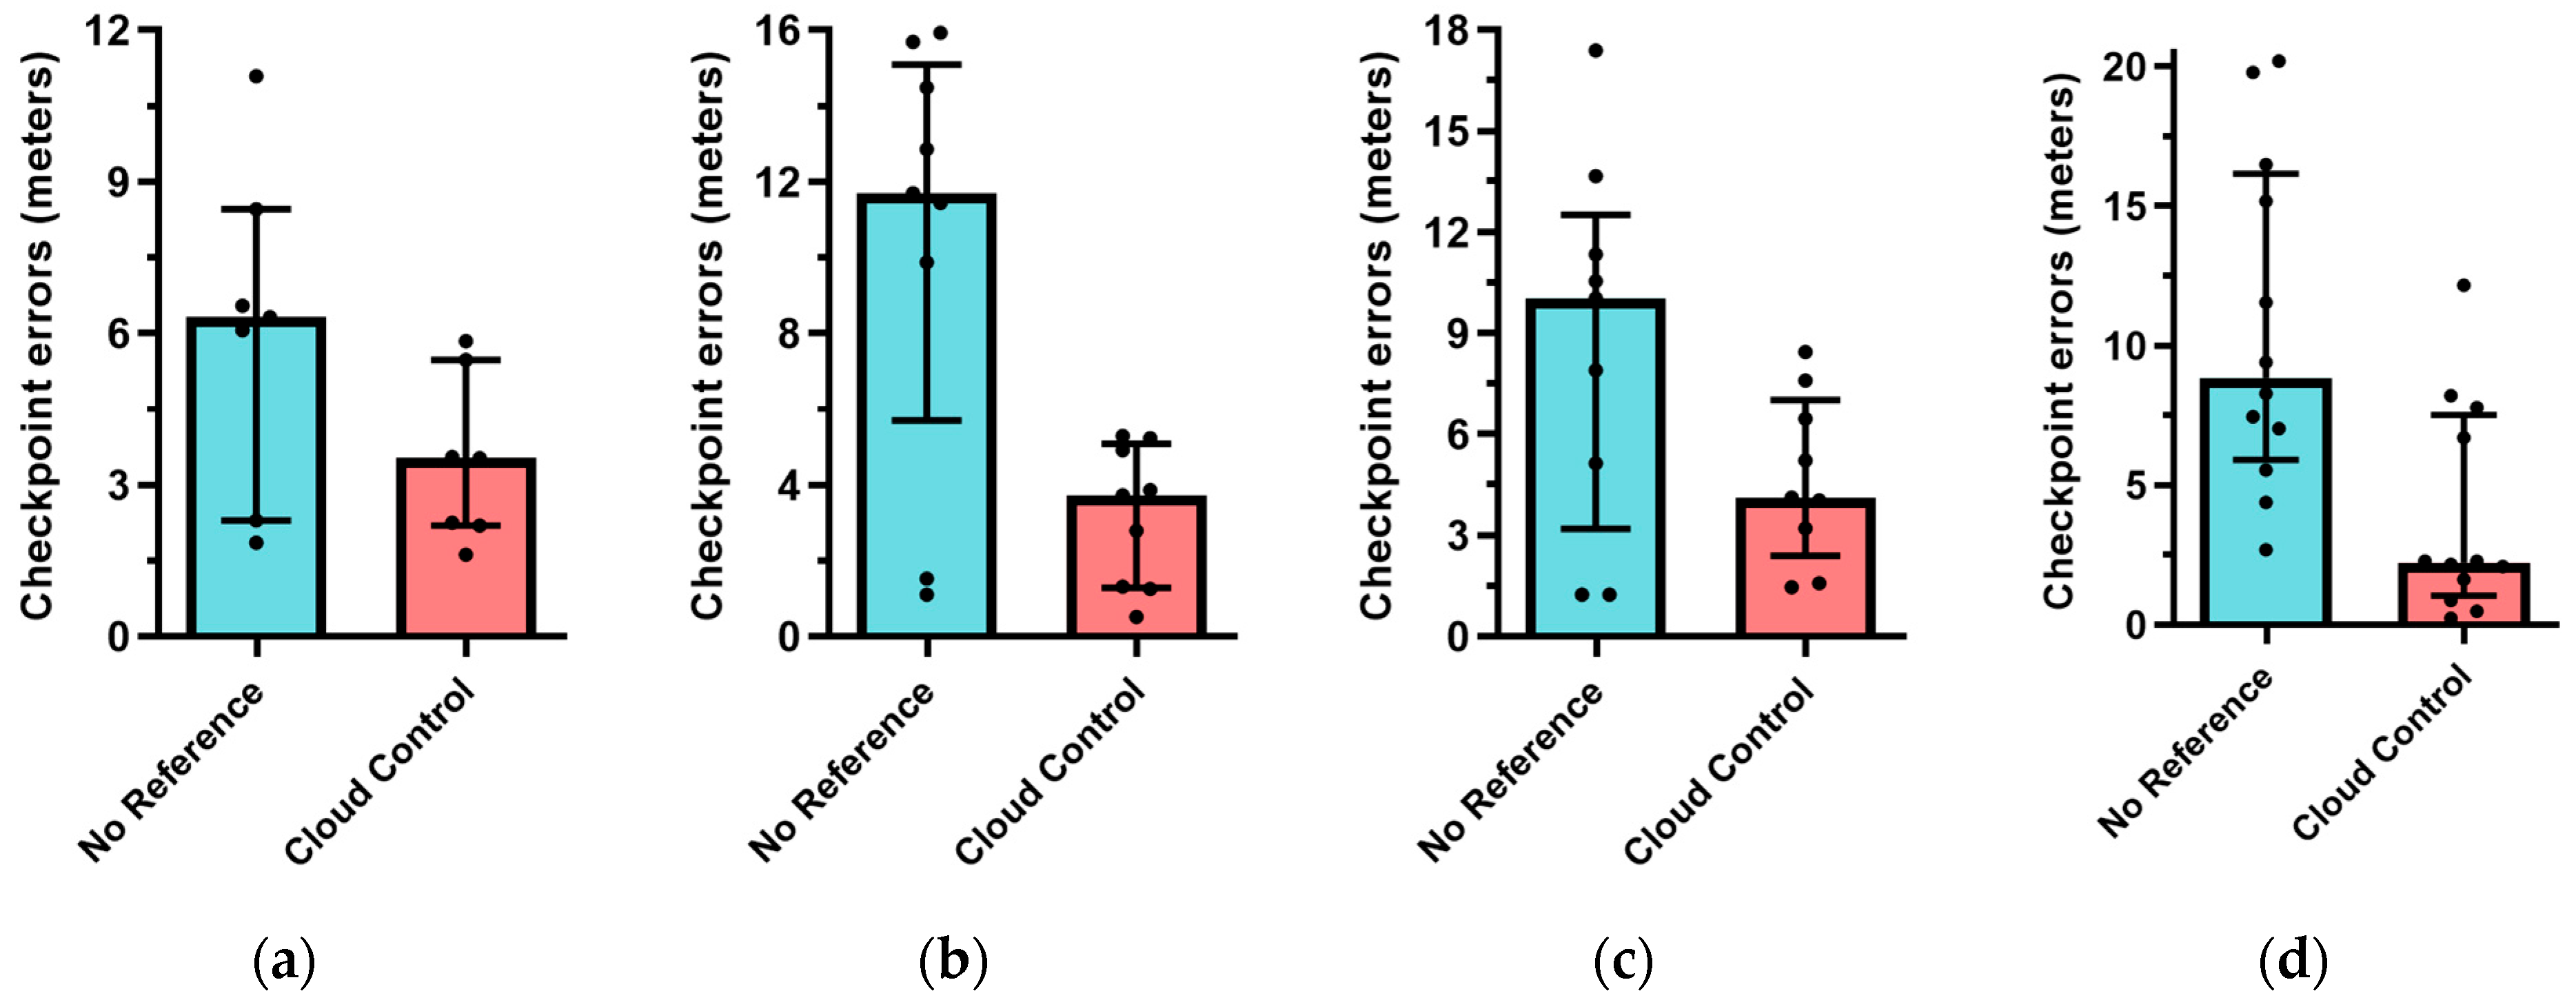
Our optical-SAR image registration framework for equatorial cloudy regions features two key innovations. The first innovation lies in the workflow; by incorporating a cloud mask to guide feature matching, we effectively avoid cloud interference and achieve enhanced geometric consistency. The second innovation concerns cloud-mask generation; we integrate the SAM segmentation model with an automatic prompt-generation strategy to produce cloud masks without manual intervention. To validate both the overall workflow and the effectiveness of the automatic cloud-mask generation, we designed two ablation experiments as follows.
(a)
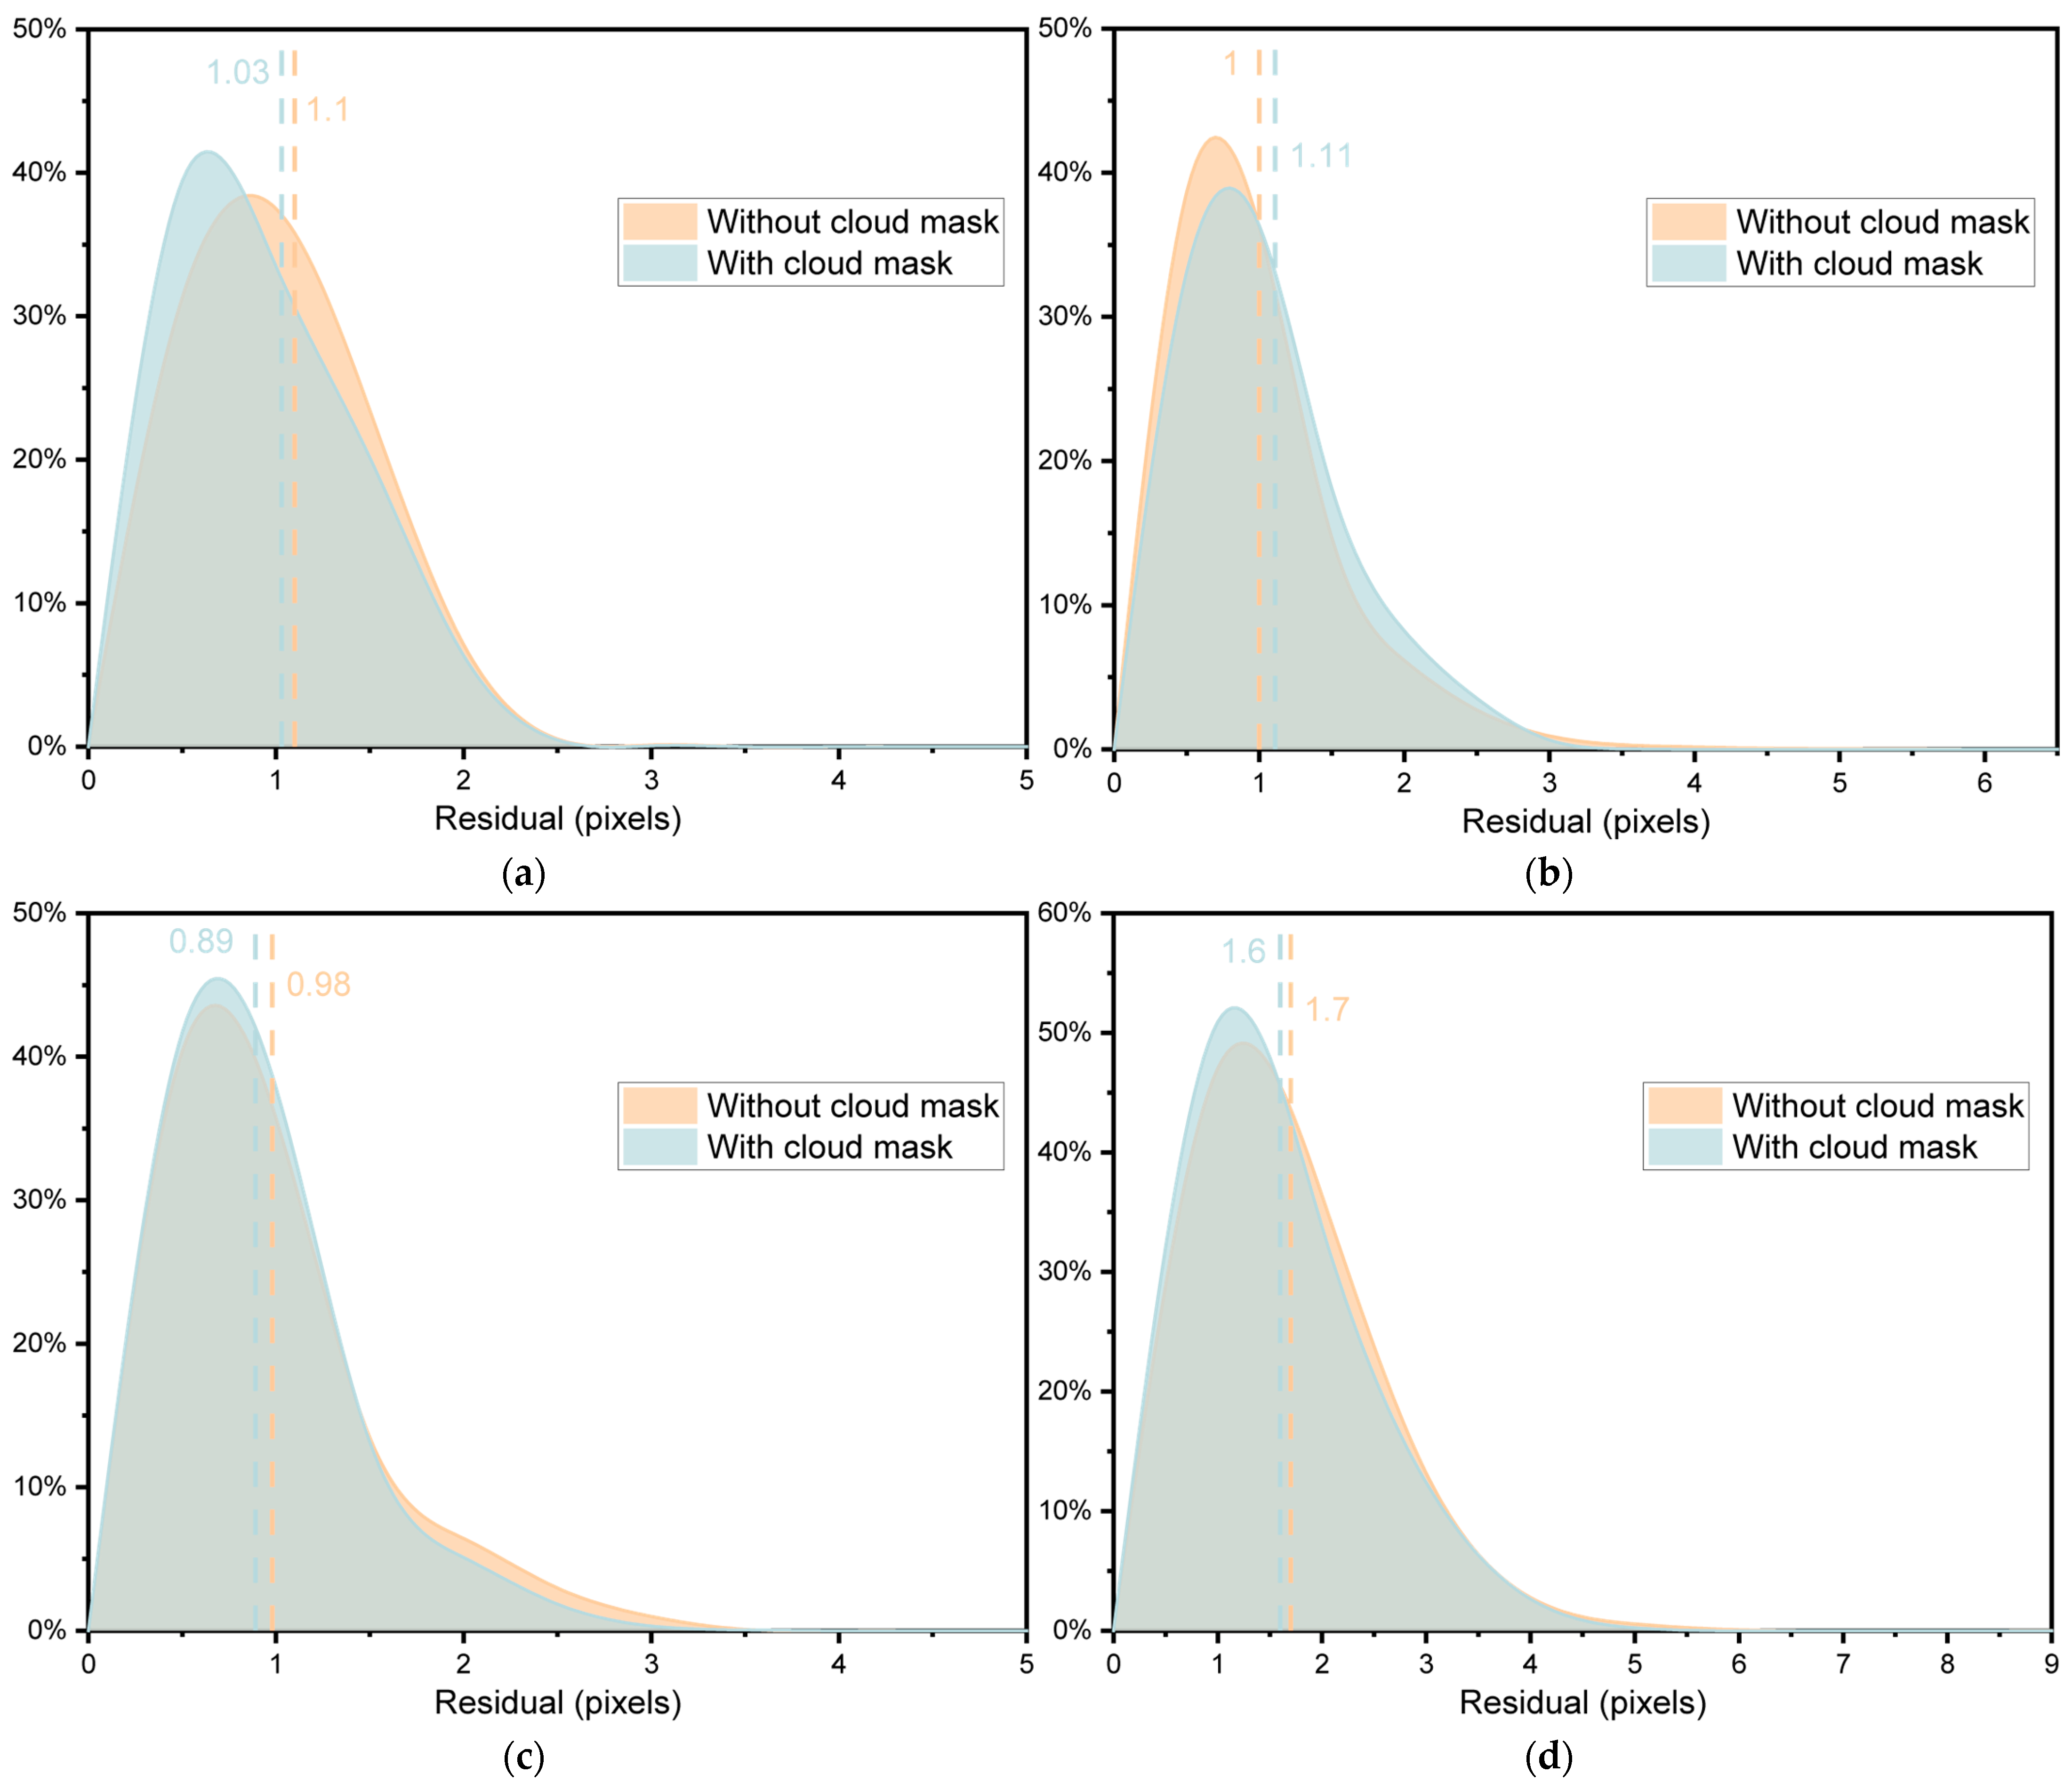
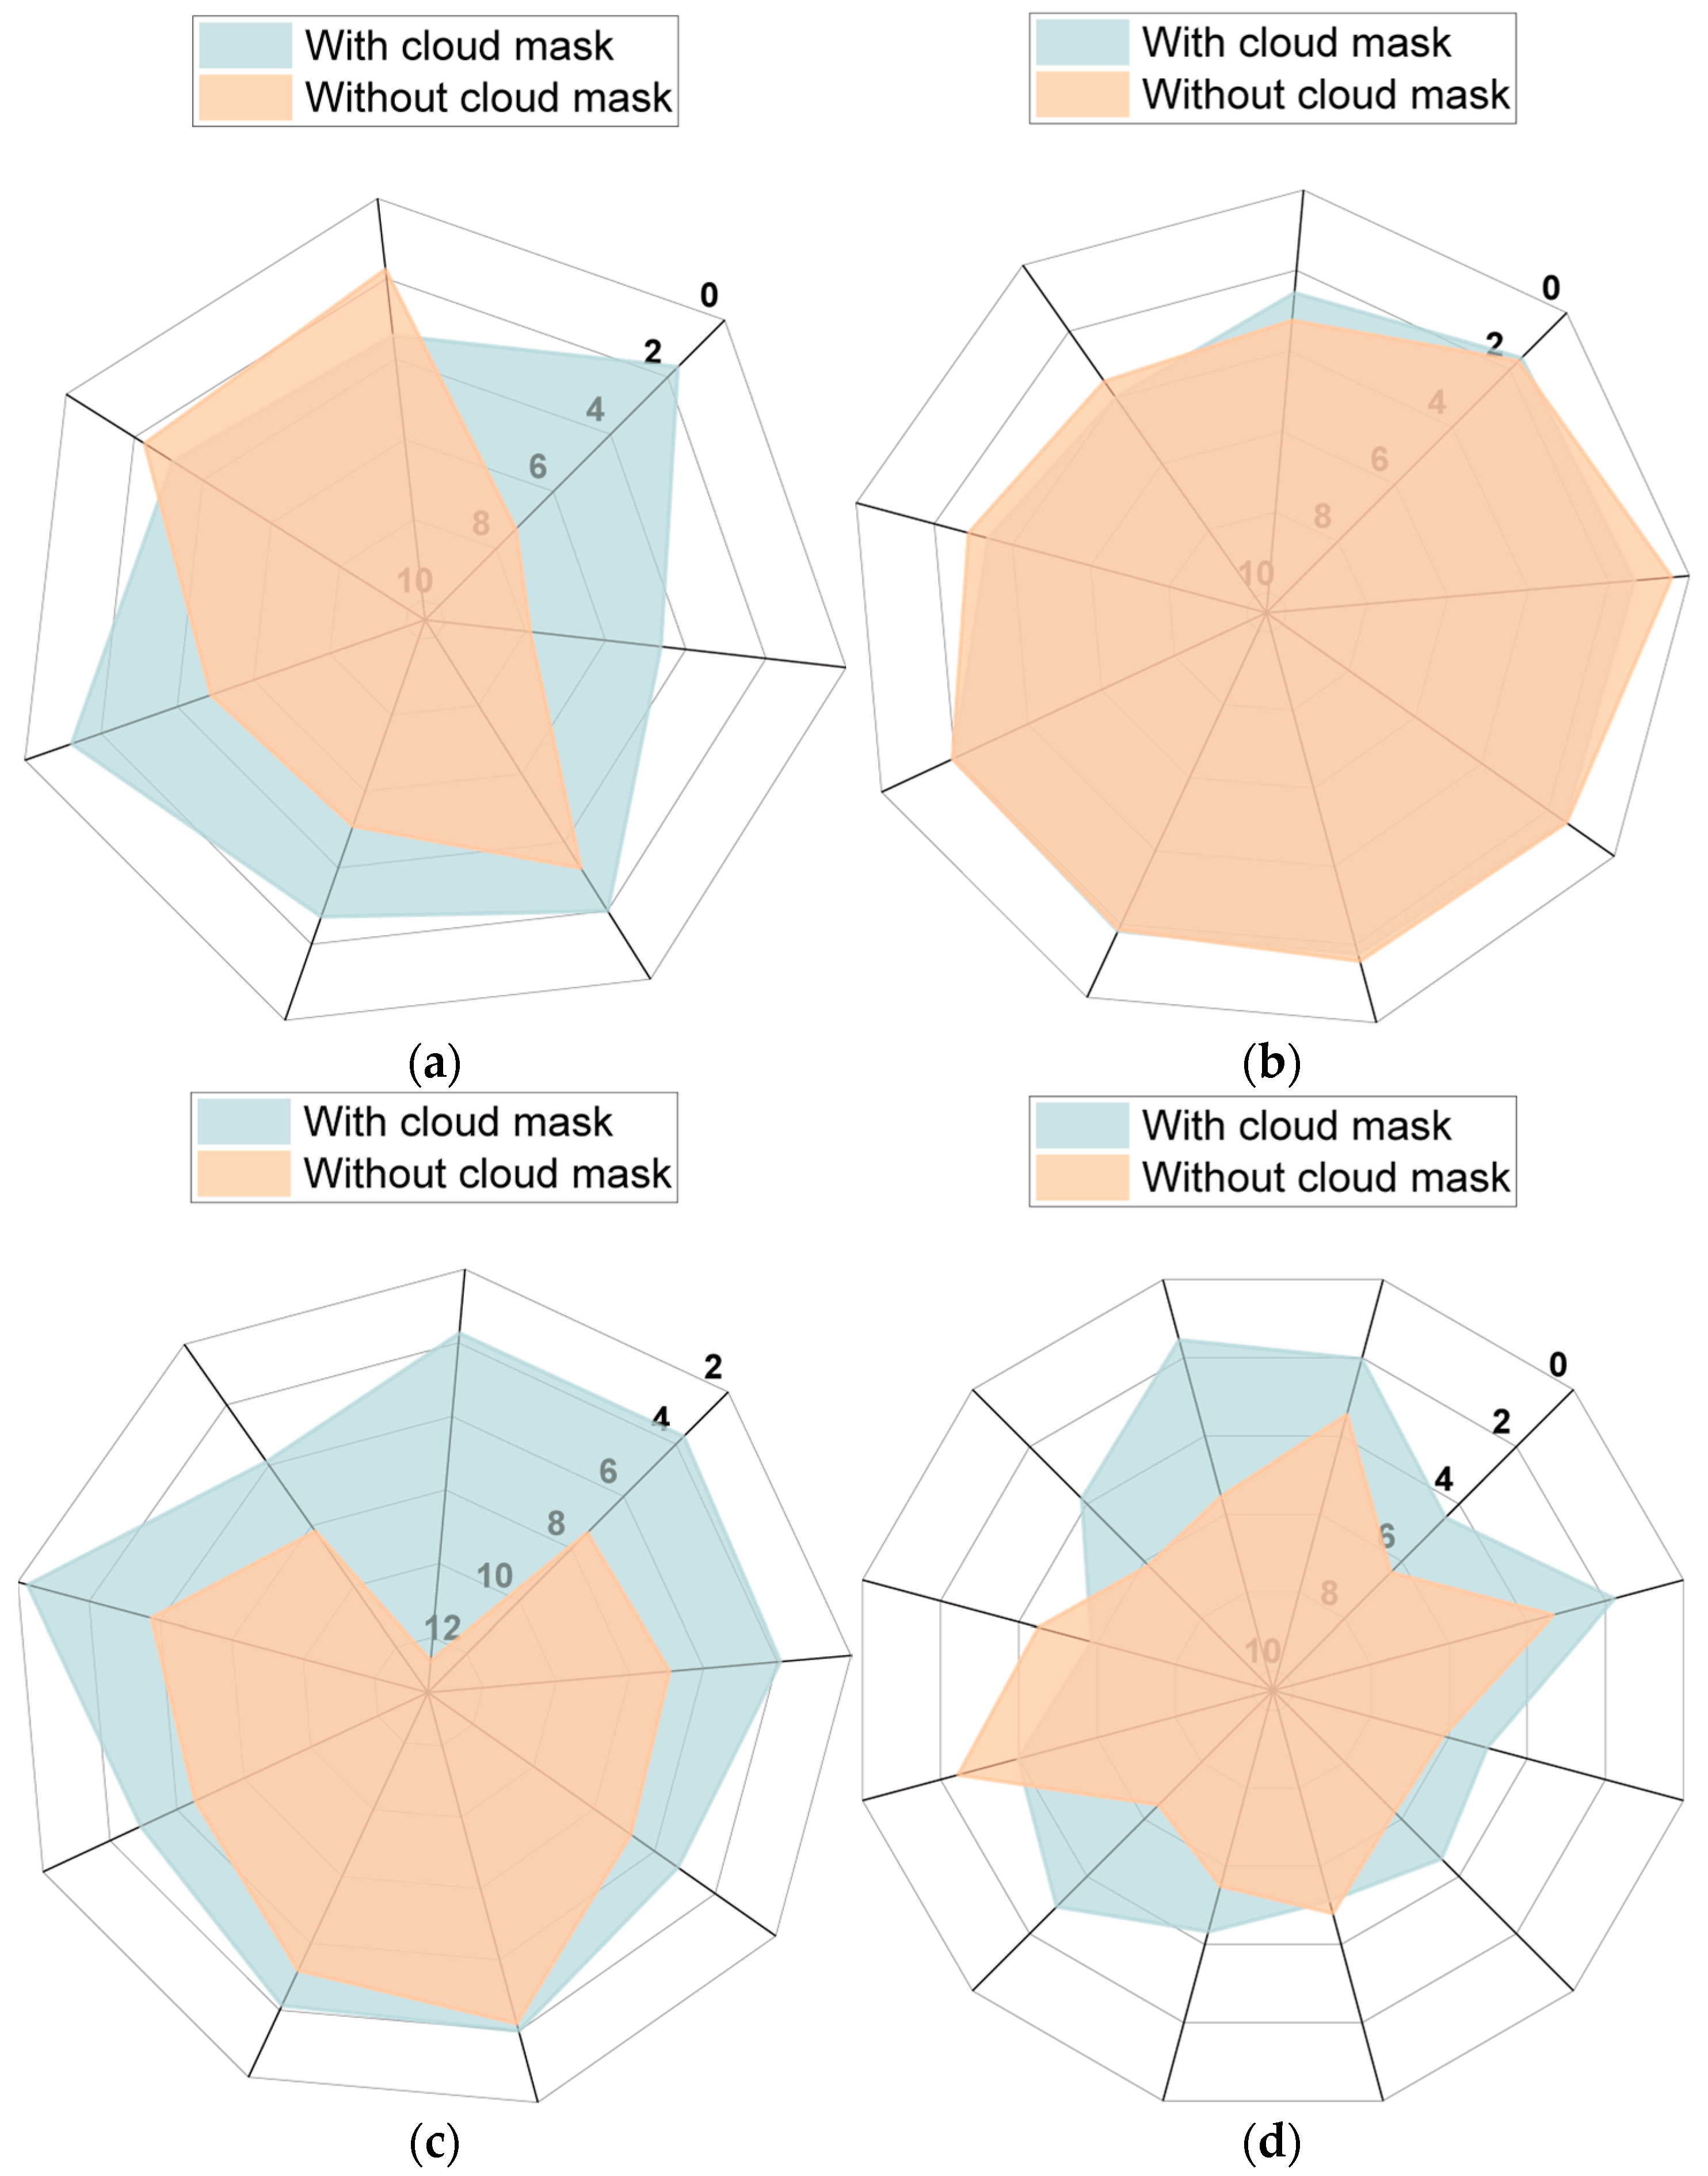
To quantify the contribution of cloud masks on final results, we repeated the entire workflow across all four experimental regions, deliberately omitting the cloud-mask constraint. By comparing tie-point distributions, residual statistics, and ortho-edging errors between masked and unmasked runs, this experiment isolates the cloud mask’s effect on alignment precision and overall orthophoto quality.
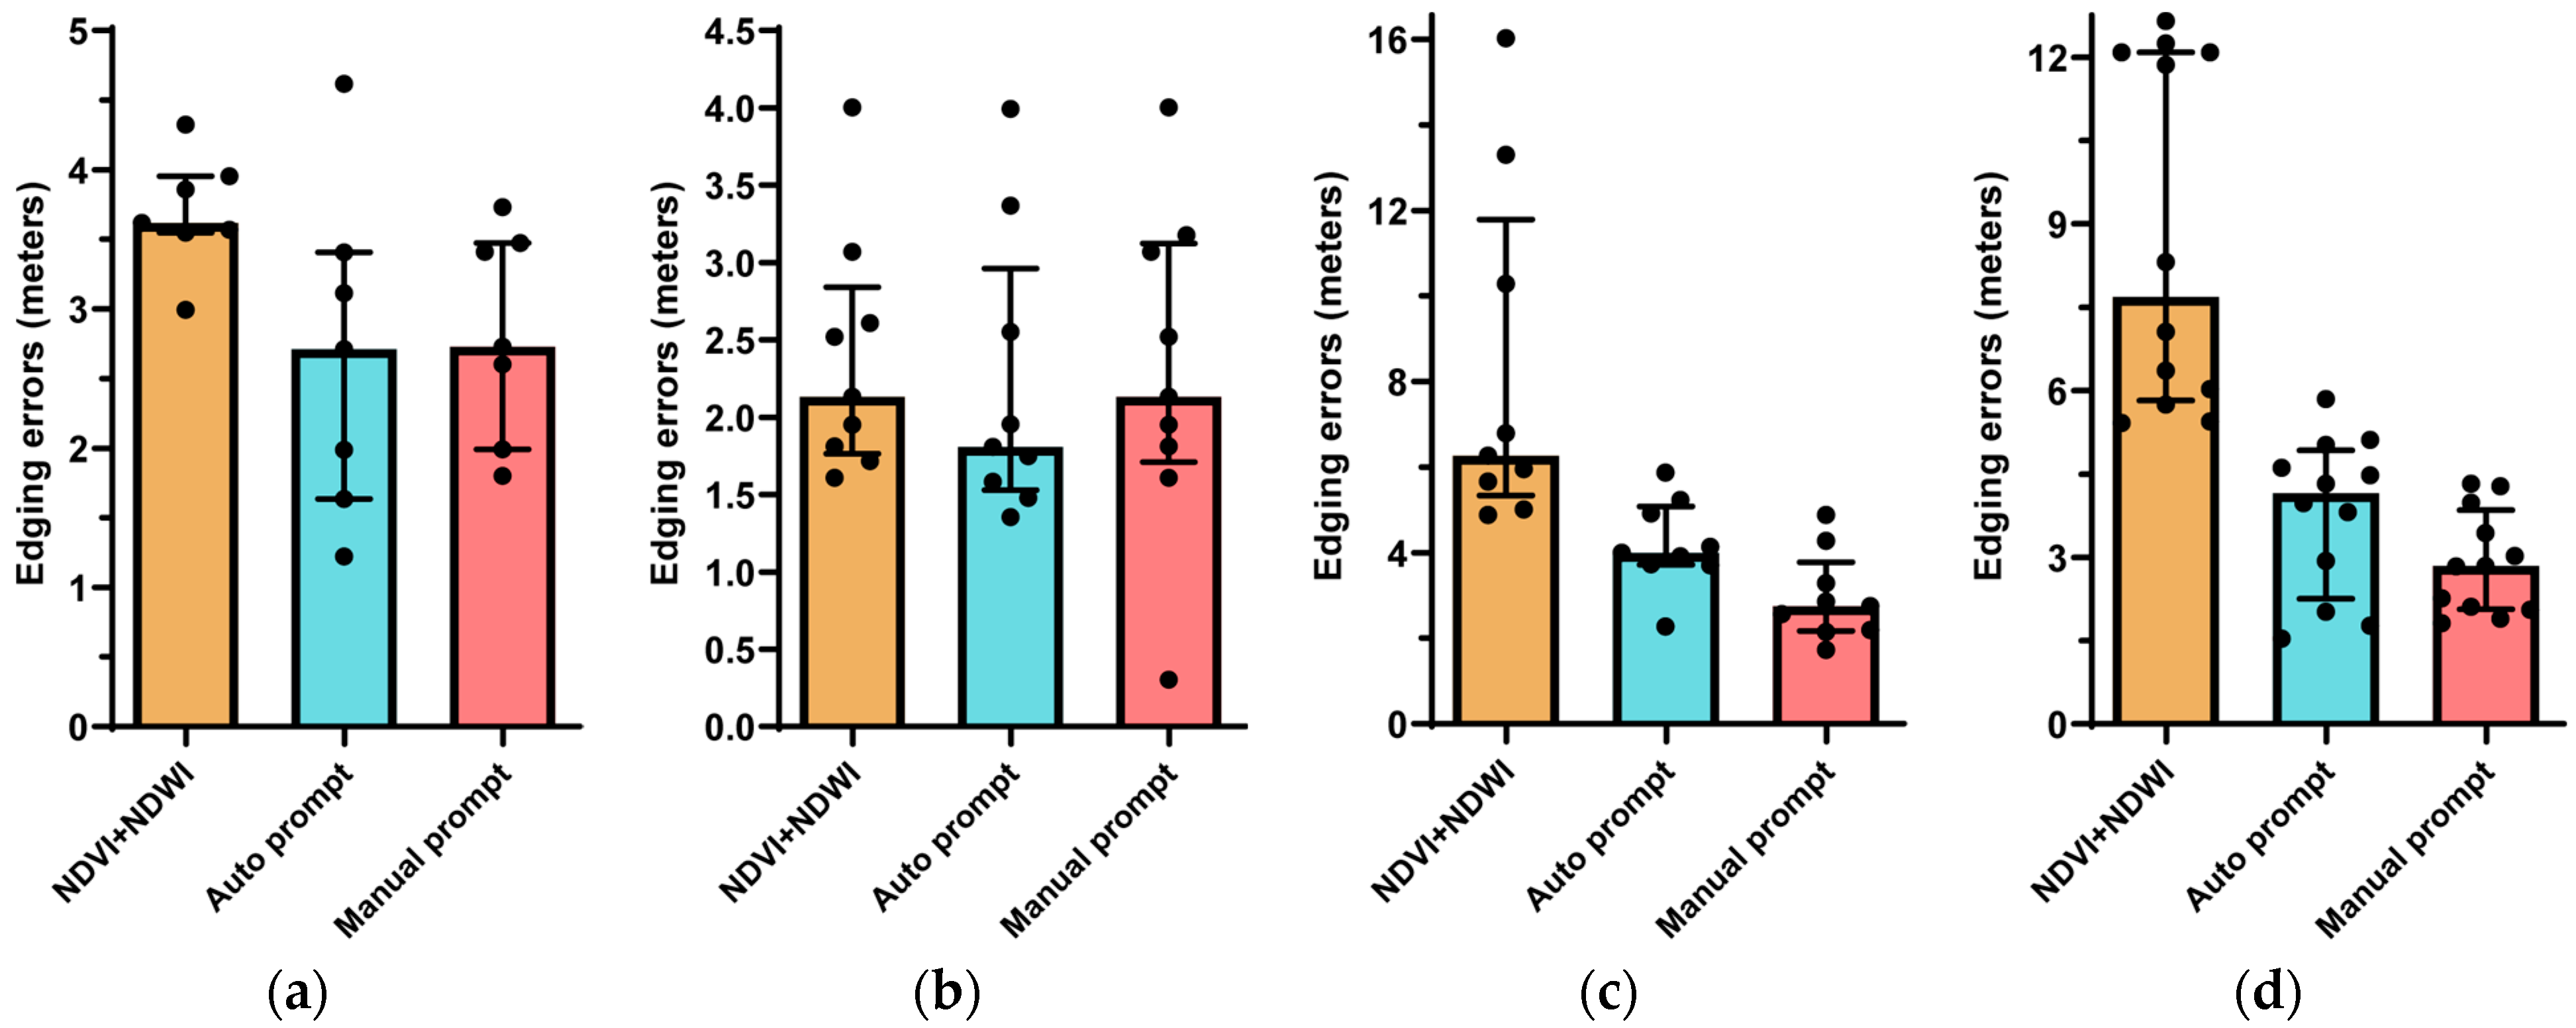
The resulting orthophotos were then evaluated using the same set of manual checkpoints and adjustment metrics described in Section 4.1. Table 4 summarizes the comparative results, including the tie-point number, unit-weighted median adjustment error, and ortho-edging accuracy, thereby isolating the contribution of cloud-mask guidance to overall performance.
Analysis of Table 4 reveals that, when the cloud mask is omitted, most regions exhibit a slight increase in tie-point count. This increase results from the inclusion of false correspondences in cloud-covered areas, where false tie points contribute little to block adjustment and may even introduce mismatches that degrade overall accuracy. Both the unit-weighted median adjustment error and ortho-edging accuracy metrics confirm this decline in performance.
Conversely, the application of the cloud mask markedly improves geometric precision in Regions 1, 3, and 4, which are characterized by substantial cloud cover. By excluding cloud-obscured tie points, our method ensures that only reliable ground features inform the alignment, yielding lower adjustment errors and tighter edging results. Region 2 presents an exception: its low and predominantly thin cloud cover allows for the extraction of high-quality, uniformly distributed tie points even without masking. In this case, the cloud mask’s exclusion criteria slightly reduce tie-point density and introduce minor misdetections, causing a modest drop in accuracy.
To quantify adjustment accuracy under both strategies, we analyzed the residual distributions of tie points in each of the four experimental regions. Figure 8 presents these distributions, with one subplot per region. Within each subplot, residuals for the two strategies are displayed in parallel. The upper quartile of each distribution is indicated by a vertical dashed line in the corresponding color.
Figure 8 presents overlaid residual histograms for each region, comparing masked and unmasked strategies. In Regions 1, 3, and 4, application of the cloud mask produces a clear redistribution of errors. The modal residual bin moves closer to zero and the entire histogram exhibits a pronounced leftward skew toward smaller error values.
The 75th-percentile residuals for tie points also shift noticeably toward smaller error magnitudes in Regions 1, 3, and 4 once the cloud mask is applied. This leftward displacement confirms that masking reduces residual dispersion and strengthens geometric alignment under cloud cover.
By contrast, Region 2 displays a modest shift of its residual distribution toward larger error ranges when masked. This exception reflects Region 2’s low cloud cover and predominance of thin clouds, conditions in which the mask may inadvertently exclude valid tie points. Overall, these results demonstrate that cloud mask-guided matching delivers the greatest benefit in areas characterized by dense, optically thick cloud cover.
Additionally, we quantified ortho-edging errors for the orthophotos produced under each strategy. Accordingly, we projected the manual checkpoints defined in Section 4.1 onto each orthophoto output and calculated the two-dimensional displacement between their nominal and measured positions. This procedure ensured a consistent basis for comparing edging performance across modalities.
Figure 9 displays the checkpoint residuals on a radial plot, with each branch representing an individual checkpoint. The branch length corresponds to residual magnitude, with shorter branches indicating greater edging errors. By visualizing all checkpoints in this format, Figure 9 highlights the reduction in residual magnitude achieved by cloud mask-guided orthographic correction, thus demonstrating enhanced boundary alignment and overall geometric consistency.
Figure 9 illustrates a marked change in residual patterns following cloud-mask application. The radial plot coverage for each region expands significantly, signifying a substantial decrease in checkpoint edging errors. This effect is most pronounced in Region 3, where every checkpoint’s error is noticeably reduced, underscoring the mask’s efficacy under heavy cloud cover. Region 2, by comparison, exhibits only a modest improvement, likely because its initial edging accuracy was already high prior to masking. Overall, the consistent contraction of residual lengths across all regions confirms that cloud-mask guidance exerts a beneficial constraint on orthophoto alignment, enhancing geometric consistency in equatorial, cloudy environments.
Combining the metrics for the four regions with and without cloud masks, the results demonstrate that the use of cloud masks significantly enhances geometric consistency between optical and SAR imagery when extensive cloud cover is present. For instance, in Region 1, the maximum edging error decreased substantially from 5.13 m to 2.88 m (an improvement of approximately 44%). In Region 2, characterized by low and predominantly thin cloud coverage, the accuracy with or without a cloud mask remained comparable. The accuracy without a cloud mask was slightly higher, likely reflecting the current limitations in cloud detection precision. Nevertheless, considering the prevalence of high cloud coverage in equatorial regions, we recommend incorporating cloud masks when processing such imagery to ensure robust geometric alignment.
(b)
To assess the impact of our cloud-mask generation method on matching performance, we first generated masks for each experimental region using the detection approach NDVI and NDWI, proposed by Huang et al. [27]. We then selected keypoints located over thick clouds to serve as prompts for SAM-based mask creation. Each set of masks guided the matching and subsequent orthorectification processes. The resulting performance metrics are presented in Table 5.
Table 5 demonstrates that using cloud masks derived from NDVI and NDWI thresholds leads to reduced adjustment accuracy and lower edging precision compared with our SAM-based segmentation method. This effect is most pronounced in Regions 3 and 4, where the threshold-based masks yield a markedly smaller number of matched tie points and produce edging errors that exceed those obtained without any mask. The root cause of these failures is the complex radiometric variability in densely clouded areas, where a uniform spectral threshold cannot reliably distinguish thick clouds from bright ground surfaces. In contrast, our SAM-guided approach uses learned visual features to adaptively differentiate clouds from background, resulting in more accurate tie-point selection. Consequently, the cloud masks generated by this method support a higher density of valid correspondences and enable more precise geometric alignment, thereby enhancing the overall fidelity of the DOM outputs.
In contrast, the cloud masks generated by our automatic prompt strategy achieve geometric alignment accuracy comparable to those produced with manually defined prompts across all four experimental regions. Notably, in Region 1, the edging precision attained using automatic prompts slightly exceeds that obtained with manual prompts, underscoring the reliability of our prompt-generation method. Furthermore, in Region 2, despite its relative low cloud cover, manually generated prompts still improve alignment metrics compared with unguided registration. This result indicates that the incorporation of high-quality, automatically derived cloud masks can further enhance the registration accuracy between optical and SAR imagery, even under minimal cloud interference.
We computed residuals at each manually surveyed checkpoint for each method across all regions. The results are presented in Figure 10.
Figure 10 compares checkpoint edging errors for each guidance strategy using bar charts supplemented by individual error markers. In each panel, the vertical bar’s height denotes the median edging error for that method, while the whisker-like lines extending above and below the bar indicate the 75th and 25th percentile values, respectively. Individual circular markers overlay the bars to show the full distribution of errors at each manual checkpoint.
Analysis of these charts reveals that the NDVI + NDWI thresholder masks consistently produce higher median errors and broader interquartile ranges than the segmentation-based masks derived from SAM, with the disparity most pronounced in Regions 3 and 4. The automatic prompt strategy yields median errors comparable to those achieved by manual prompts, but with slightly larger variability, as evidenced by the wider spread of error markers. Notably, in Region 1, the automatic prompts occasionally generate maximum pointing errors that exceed those attained by all other methods. This outcome underscores the need for further refinement of prompt selection to achieve consistently superior alignment performance.

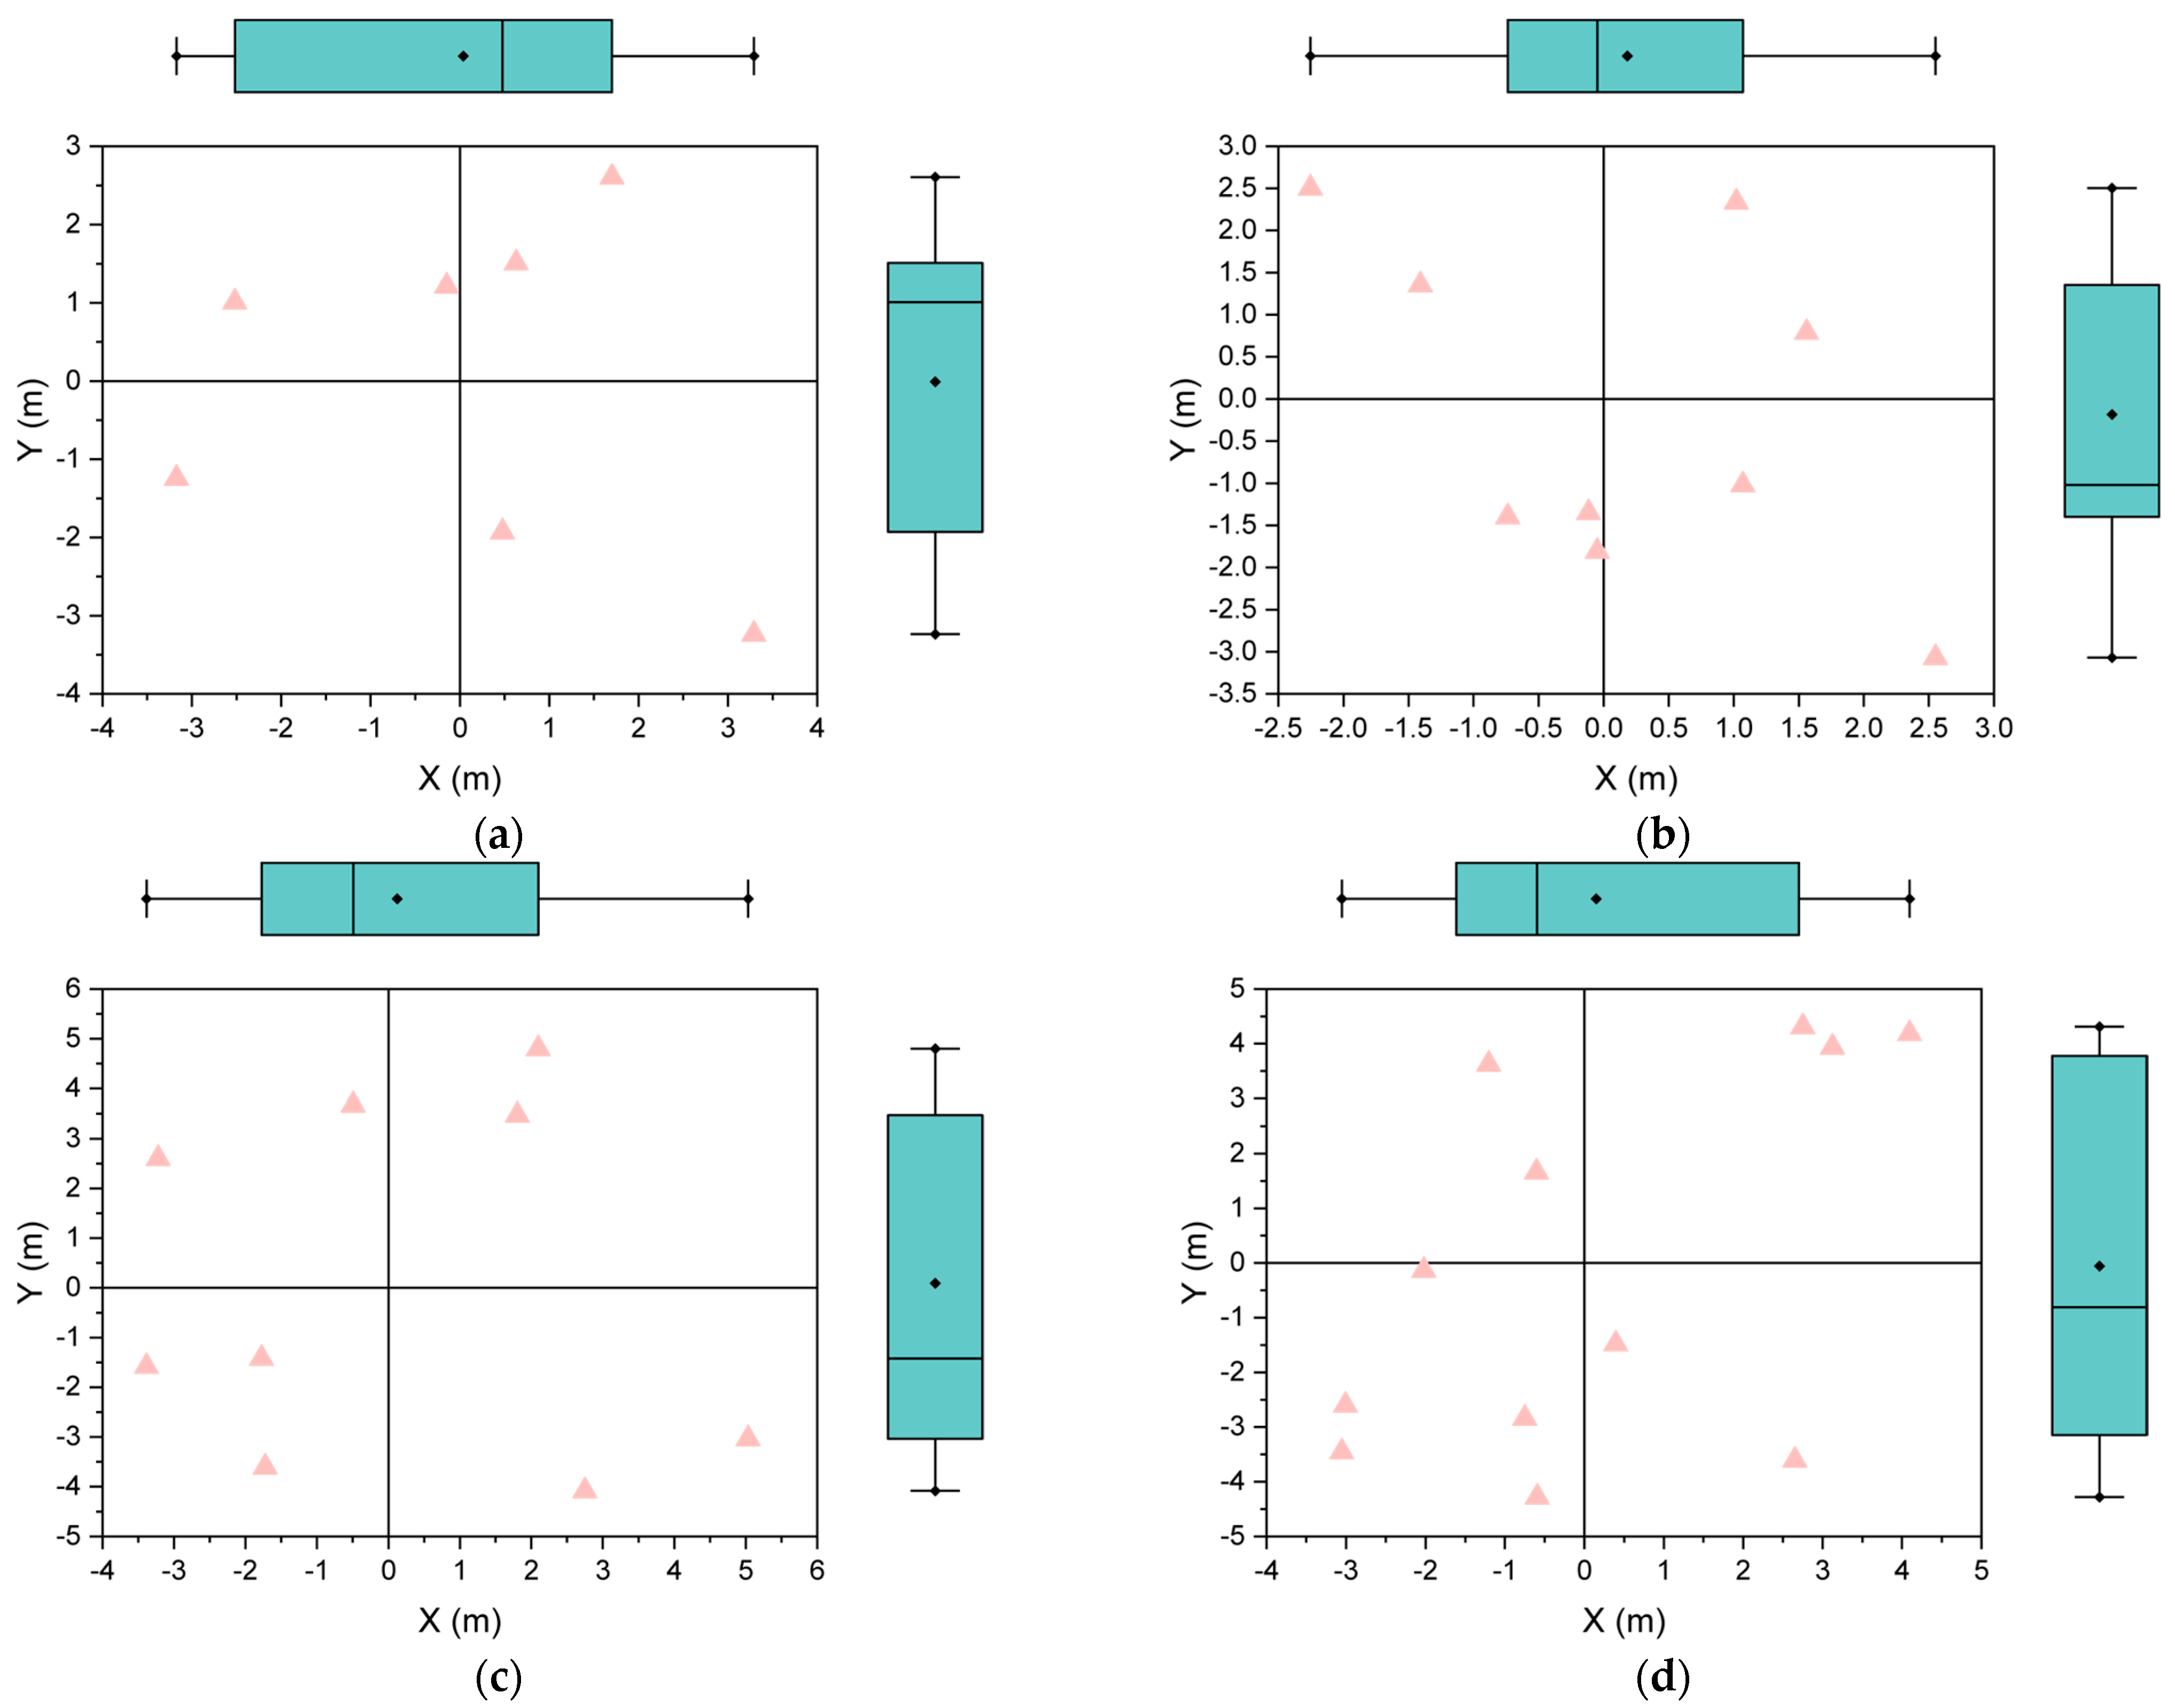
5.3. Evaluation of Absolute Positioning Accuracy

In prior experiments, we assumed that the optical and SAR images were well aligned, with high absolute geometric accuracy. Consequently, our analysis emphasized their relative consistency. To assess the absolute accuracy of the DOM, we adopted the “cloud control” framework, which employs historically or publicly available georeferenced datasets as control sources to impose absolute geometric constraints on the imagery [73]. Manual checkpoints from each region were transferred onto this reference map to quantify positioning errors independent of control-point constraints. The reference map then served as a ground-control source in a combined block adjustment of the optical and SAR datasets, achieving joint geometric positioning under cloud control. Figure 11 presents the resulting checkpoint accuracies for each region.
Figure 11 shows that, without external control, Region 1 exhibits a mean positioning error of approximately 6 m, while Regions 2 to 4 display errors in the range of 10–12 m. Given the spatial resolution of the imagery, these results confirm sufficient geometric localization accuracy. Incorporating the reference map as a control during adjustment reduced these errors across all regions. The most pronounced improvement occurred in Region 2, where lower cloud cover allowed for a greater number of tie points to anchor the adjustment to the reference map.

5.4. Limitations and Prospects

While our experiments demonstrate that high-quality cloud masks enhance optical-SAR registration accuracy in low cloud cover areas, the proposed automatic registration framework for equatorial cloudy regions can still improve performance under these conditions. Future work will explore methods for automatically generating superior cloud masks, with targeted fine-tuning of the SAM model as a promising avenue. Additionally, our algorithm achieves robustness to geometric nonlinearities by employing nonlinear transformation models during registration. If a linear transformation model is used instead, the ability to correct nonlinear distortions will be substantially reduced. Moreover, our evaluation focused on relative alignment accuracy between optical and SAR datasets. Although well-calibrated images inherently exhibit strong absolute accuracy, uncalibrated scenes may require the integration of a georeferenced benchmark, such as a high-precision reference image, to ensure robust absolute positioning.

6. Conclusions

Obtaining consistently low-cloud optical imagery in the equatorial region is challenging. Combining SAR data with cloud-affected optical images increases observation frequency. To address the resulting alignment requirements, we propose a cloud mask-guided framework for optical-SAR image-matching and joint adjustment in this study, enabling sub-pixel geometric alignment despite persistent cloud cover. By incorporating cloud masks into the feature-matching process and applying a unified block adjustment algorithm, the method ensures that only reliable, cloud-free tie points contribute to rectification. We also introduced a cloud detection approach with automatic prompt point generation, achieving matching performance comparable to manual prompts. Validation across four equatorial regions with varying sensor resolutions, terrain complexity, and cloud densities demonstrated consistent improvements in tie-point residuals, adjustment accuracy, and checkpoint edging errors. These results confirm the robustness of the proposed strategy and its ability to produce high-consistency DOMs under challenging atmospheric conditions, supporting environmental monitoring, land-cover analysis, and ecosystem modeling in equatorial zones.

Author Contributions

Conceptualization, P.T.; Data curation, S.L. (Shuo Li), M.G. and W.Q.; Formal analysis, Y.L., M.G. and Q.X.; Funding acquisition, Q.C. and P.T.; Investigation, Y.L., S.L. (Shuo Li), W.Q. and Q.X.; Methodology, Y.L., Q.X. and P.T.; Project administration, S.L. (Shuo Li), S.L. (Shizhong Li), C.L. and P.T.; Resources, S.L. (Shuo Li) and S.L. (Shizhong Li); Software, M.G. and P.T.; Supervision, S.L. (Shizhong Li), C.L. and P.T.; Validation, Y.L., M.G., W.Q. and Q.X.; Visualization, Y.L. and M.G.; Writing—original draft, Y.L.; Writing—review and editing, Q.X., C.L. and P.T. All authors have read and agreed to the published version of the manuscript.

Funding

This study was funded by Key Laboratory of Smart Earth (No. KF2023ZD02-01) and supported by Open Project Funds for the Key Laboratory of Space Photoelectric Detection and Perception (Nanjing University of Aeronautics and Astronautics), Ministry of Industry and Information Technology (No. NJ2024027-5), and Fundamental Research Funds for the Central Universities (No. NJ2024027).

Data Availability Statement

The original contributions presented in the study are included in the article, further inquiries can be directed to the corresponding author.

Acknowledgments

The authors gratefully acknowledge the China Centre for Resources Satellite Data and Application, whose satellite datasets were essential to this work.

Conflicts of Interest

Author Cong Lin was employed by the company Nanjing Research Institute of Surveying, Mapping & Geotechnical Investigation, Co. Ltd. The remaining authors declare that the research was conducted in the absence of any commercial or financial relationships that could be construed as a potential conflict of interest.

References

  1. Slough, T.; Kopas, J.; Urpelainen, J. Satellite-Based Deforestation Alerts with Training and Incentives for Patrolling Facilitate Community Monitoring in the Peruvian Amazon. Proc. Natl. Acad. Sci. USA 2021, 118, e2015171118. [Google Scholar] [CrossRef] [PubMed]
  2. Li, L.; Dong, J.; Njeudeng Tenku, S.; Xiao, X. Mapping Oil Palm Plantations in Cameroon Using PALSAR 50-m Orthorectified Mosaic Images. Remote Sens. 2015, 7, 1206–1224. [Google Scholar] [CrossRef]
  3. Yin, T.; Guo, W.; Zhu, J.; Wu, Y.; Zhang, B.; Zhou, Z. Underwater Broadband Target Detection by Filtering Scanning Azimuths Based on Features of Subband Peaks. IEEE Sens. J. 2025, 25, 13601–13609. [Google Scholar] [CrossRef]
  4. Young, A.H.; Knapp, K.R.; Inamdar, A.; Hankins, W.; Rossow, W.B. The International Satellite Cloud Climatology Project H-Series Climate Data Record Product. Earth Syst. Sci. Data 2018, 10, 583–593. [Google Scholar] [CrossRef]
  5. Mao, K.; Yuan, Z.; Zuo, Z.; Xu, T.; Shen, X.; Gao, C. Changes in Global Cloud Cover Based on Remote Sensing Data from 2003 to 2012. Chin. Geogr. Sci. 2019, 29, 306–315. [Google Scholar] [CrossRef]
  6. Liu, H.; Koren, I.; Altaratz, O.; Chekroun, M.D. Opposing Trends of Cloud Coverage over Land and Ocean under Global Warming. Atmos. Chem. Phys. 2023, 23, 6559–6569. [Google Scholar] [CrossRef]
  7. Zhu, J.; Yin, T.; Guo, W.; Zhang, B.; Zhou, Z. An Underwater Target Azimuth Trajectory Enhancement Approach in BTR. Appl. Acoust. 2025, 230, 110373. [Google Scholar] [CrossRef]
  8. King, M.D.; Platnick, S.; Menzel, W.P.; Ackerman, S.A.; Hubanks, P.A. Spatial and Temporal Distribution of Clouds Observed by MODIS Onboard the Terra and Aqua Satellites. IEEE Trans. Geosci. Remote Sens. 2013, 51, 3826–3852. [Google Scholar] [CrossRef]
  9. Ausherman, D.A.; Kozma, A.; Walker, J.L.; Jones, H.M.; Poggio, E.C. Developments in Radar Imaging. IEEE Trans. Aerosp. Electron. Syst. 1984, AES-20, 363–400. [Google Scholar] [CrossRef]
  10. Huang, Z.; Zhang, X.; Tang, Z.; Xu, F.; Datcu, M.; Han, J. Generative Artificial Intelligence Meets Synthetic Aperture Radar: A Survey. IEEE Geosci. Remote Sens. Mag. 2025, 62, 2–44. [Google Scholar] [CrossRef]
  11. Xu, Z.; Tang, B.; Ai, W.; Xie, Z.; Zhu, J. Radar Transceiver Design for Extended Targets Based on Optimal Linear Detector. IEEE Trans. Aerosp. Electron. Syst. 2025, 61, 6070–6082. [Google Scholar] [CrossRef]
  12. Zhu, J.; Song, Y.; Jiang, N.; Xie, Z.; Fan, C.; Huang, X. Enhanced Doppler Resolution and Sidelobe Suppression Performance for Golay Complementary Waveforms. Remote Sens. 2023, 15, 2452. [Google Scholar] [CrossRef]
  13. Zhang, Y.; Wu, P.; Yao, Y.; Wan, Y.; Zhang, W.; Li, Y.; Yan, X. Multimodal Remote Sensing Image Robust Matching Based on Second-Order Tensor Orientation Feature Transformation. IEEE Trans. Geosci. Remote Sens. 2025, 63, 4701314. [Google Scholar] [CrossRef]
  14. Wang, S.; Han, W.; Huang, X.; Zhang, X.; Wang, L.; Li, J. Trustworthy Remote Sensing Interpretation: Concepts, Technologies, and Applications. ISPRS J. Photogramm. Remote Sens. 2024, 209, 150–172. [Google Scholar] [CrossRef]
  15. Ma, L.; Liu, Y.; Zhang, X.; Ye, Y.; Yin, G.; Johnson, B.A. Deep Learning in Remote Sensing Applications: A Meta-Analysis and Review. ISPRS J. Photogramm. Remote Sens. 2019, 152, 166–177. [Google Scholar] [CrossRef]
  16. Huang, M.; Xu, Y.; Qian, L.; Shi, W.; Zhang, Y.; Bao, W.; Wang, N.; Liu, X.; Xiang, X. The QXS-SAROPT Dataset for Deep Learning in SAR-Optical Data Fusion. arXiv 2021, arXiv:2103.08259. [Google Scholar]
  17. Zhu, J.; Xie, Z.; Jiang, N.; Song, Y.; Han, S.; Liu, W.; Huang, X. Delay-Doppler Map Shaping through Oversampled Complementary Sets for High-Speed Target Detection. Remote Sens. 2024, 16, 2898. [Google Scholar] [CrossRef]
  18. Lei, Z.; Feng, Y.; Xi, M.; Tong, X.; Wang, J.; Xie, H.; Xu, X.; Wang, C.; Jin, Y.; Liu, S. High-Precision Geometric Calibration Model for Spaceborne SAR Using Geometrically Constrained GCPs. IEEE Trans. Geosci. Remote Sens. 2024, 62, 1–12. [Google Scholar] [CrossRef]
  19. Xu, Z.; Tang, B.; Ai, W.; Zhu, J. Relative Entropy Based Jamming Signal Design against Radar Target Detection. IEEE Trans. Signal Process. 2025, 73, 1200–1215. [Google Scholar] [CrossRef]
  20. Jiang, X.; Ma, J.; Xiao, G.; Shao, Z.; Guo, X. A Review of Multimodal Image Matching: Methods and Applications. Inf. Fusion 2021, 73, 22–71. [Google Scholar] [CrossRef]
  21. Li, L.; Han, L.; Liu, M.; Gao, K.; He, H.; Wang, L.; Li, J. SAR–Optical Image Matching with Semantic Position Probability Distribution. IEEE Trans. Geosci. Remote Sens. 2023, 61, 1–15. [Google Scholar] [CrossRef]
  22. Dellinger, F.; Delon, J.; Gousseau, Y.; Michel, J.; Tupin, F. SAR-SIFT: A SIFT-Like Algorithm for SAR Images. IEEE Trans. Geosci. Remote Sens. 2015, 53, 453–466. [Google Scholar] [CrossRef]
  23. Cui, S.; Ma, A.; Zhang, L.; Xu, M.; Zhong, Y. MAP-Net: SAR and Optical Image Matching via Image-Based Convolutional Network With Attention Mechanism and Spatial Pyramid Aggregated Pooling. IEEE Trans. Geosci. Remote Sens. 2022, 60, 1–13. [Google Scholar] [CrossRef]
  24. Ma, J.; Jiang, X.; Fan, A.; Jiang, J.; Yan, J. Image Matching from Handcrafted to Deep Features: A Survey. Int. J. Comput. Vis. 2021, 129, 23–79. [Google Scholar] [CrossRef]
  25. Shang, H.; Letu, H.; Xu, R.; Wei, L.; Wu, L.; Shao, J.; Nagao, T.M.; Nakajima, T.Y.; Riedi, J.; He, J.; et al. A Hybrid Cloud Detection and Cloud Phase Classification Algorithm Using Classic Threshold-Based Tests and Extra Randomized Tree Model. Remote Sens. Environ. 2024, 302, 113957. [Google Scholar] [CrossRef]
  26. Ni, Z.; Wu, M.; Lu, Q.; Huo, H.; Wu, C.; Liu, R.; Wang, F.; Xu, X. A Review of Research on Cloud Detection Methods for Hyperspectral Infrared Radiances. Remote Sens. 2024, 16, 4629. [Google Scholar] [CrossRef]
  27. Huang, F.; Wang, X.; Nie, G.; Yan, J.; Li, X.; Tian, J.; Zhu, C.; Li, Q.; Tian, Q. Optical Remote Sensing Cloud Detection and Extraction Method in Tropical and Subtropical Veg-Etation Region. Remote Sens. Nat. Resour. 2024, 1–10. Available online: https://link.cnki.net/urlid/10.1759.P.20240827.1731.014 (accessed on 25 April 2025).
  28. Kirillov, A.; Mintun, E.; Ravi, N.; Mao, H.; Rolland, C.; Gustafson, L.; Xiao, T.; Whitehead, S.; Berg, A.C.; Lo, W.-Y.; et al. Segment Anything. In Proceedings of the IEEE/CVF International Conference on Computer Vision, Paris, France, 2–6 October 2023. [Google Scholar]
  29. Li, F.; Zhang, H.; Xu, H.; Liu, S.; Zhang, L.; Ni, L.M.; Shum, H.-Y. Mask DINO: Towards a Unified Transformer-Based Framework for Object Detection and Segmentation. In Proceedings of the 2023 IEEE/CVF Conference on Computer Vision and Pattern Recognition (CVPR), Vancouver, BC, Canada, 18–22 June 2023; IEEE: New York, NY, USA, 2023; pp. 3041–3050. [Google Scholar]
  30. Wang, J.; Liu, Z.; Zhao, L.; Wu, Z.; Ma, C.; Yu, S.; Dai, H.; Yang, Q.; Liu, Y.; Zhang, S.; et al. Review of Large Vision Models and Visual Prompt Engineering. Meta-Radiol. 2023, 1, 100047. [Google Scholar] [CrossRef]
  31. Zhu, B.; Zhou, L.; Pu, S.; Fan, J.; Ye, Y. Advances and Challenges in Multimodal Remote Sensing Image Registration. IEEE J. Miniat. Air Space Syst. 2023, 4, 165–174. [Google Scholar] [CrossRef]
  32. Xiong, Q.; Fang, S.; Peng, Y.; Gong, Y.; Liu, X. Feature Matching of Multimodal Images Based on Nonlinear Diffusion and Progressive Filtering. IEEE J. Sel. Top. Appl. Earth Obs. Remote Sens. 2022, 15, 7139–7152. [Google Scholar] [CrossRef]
  33. Li, J.; Hu, Q.; Ai, M. RIFT: Multi-Modal Image Matching Based on Radiation-Variation Insensitive Feature Transform. IEEE Trans. Image Process. 2020, 29, 3296–3310. [Google Scholar] [CrossRef]
  34. Li, J.; Shi, P.; Hu, Q.; Zhang, Y. RIFT2: Speeding-up RIFT with A New Rotation-Invariance Technique. arXiv 2023, arXiv:2303.00319. [Google Scholar]
  35. Yao, Y.; Zhang, Y.; Wan, Y.; Liu, X.; Yan, X.; Li, J. Multi-Modal Remote Sensing Image Matching Considering Co-Occurrence Filter. IEEE Trans. IMAGE Process. 2022, 31, 14. [Google Scholar] [CrossRef]
  36. Fischer, S.; Šroubek, F.; Perrinet, L.; Redondo, R.; Cristóbal, G. Self-Invertible 2D Log-Gabor Wavelets. Int. J. Comput. Vis. 2007, 75, 231–246. [Google Scholar] [CrossRef]
  37. Arróspide, J.; Salgado, L. Log-Gabor Filters for Image-Based Vehicle Verification. IEEE Trans. Image Process. 2013, 22, 2286–2295. [Google Scholar] [CrossRef] [PubMed]
  38. Jevnisek, R.J.; Avidan, S. Co-Occurrence Filter. In Proceedings of the 2017 IEEE Conference on Computer Vision and Pattern Recognition (CVPR), Honolulu, HI, USA, 21 July 2017; pp. 3816–3824. [Google Scholar]
  39. Cui, S.; Ma, A.; Wan, Y.; Zhong, Y.; Luo, B.; Xu, M. Cross-Modality Image Matching Network with Modality-Invariant Feature Representation for Airborne-Ground Thermal Infrared and Visible Datasets. IEEE Trans. Geosci. Remote Sens. 2022, 60, 1–14. [Google Scholar] [CrossRef]
  40. Liao, Y.; Tao, P.; Chen, Q.; Wang, L.; Ke, T. Highly Adaptive Multi-Modal Image Matching Based on Tuning-Free Filtering and Enhanced Sketch Features. Inf. Fusion 2024, 112, 102599. [Google Scholar] [CrossRef]
  41. Gao, T.; Lan, C.; Huang, W.; Wang, S. SFA-Net: A SAM-Guided Focused Attention Network for Multimodal Remote Sensing Image Matching. ISPRS J. Photogramm. Remote Sens. 2025, 223, 188–206. [Google Scholar] [CrossRef]
  42. Xiang, Y.; Jiao, N.; Wang, F.; You, H. A Robust Two-Stage Registration Algorithm for Large Optical and SAR Images. IEEE Trans. Geosci. Remote Sens. 2022, 60, 1–15. [Google Scholar] [CrossRef]
  43. Ye, Y.; Yang, C.; Gong, G.; Yang, P.; Quan, D.; Li, J. Robust Optical and SAR Image Matching Using Attention-Enhanced Structural Features. IEEE Trans. Geosci. Remote Sens. 2024, 62, 1–12. [Google Scholar] [CrossRef]
  44. Xiang, Y.; Wang, X.; Wang, F.; You, H.; Qiu, X.; Fu, K. A Global-to-Local Algorithm for High-Resolution Optical and SAR Image Registration. IEEE Trans. Geosci. Remote Sens. 2023, 61, 1–20. [Google Scholar] [CrossRef]
  45. Ma, J.; Zhao, J.; Jiang, J.; Zhou, H.; Guo, X. Locality Preserving Matching. Int. J. Comput. Vis. 2019, 127, 512–531. [Google Scholar] [CrossRef]
  46. Bian, J.; Lin, W.-Y.; Matsushita, Y.; Yeung, S.-K.; Nguyen, T.-D.; Cheng, M.-M. GMS: Grid-Based Motion Statistics for Fast, Ultra-Robust Feature Correspondence. In Proceedings of the 2017 IEEE Conference on Computer Vision and Pattern Recognition (CVPR), Honolulu, HI, USA, 21 July 2017; IEEE: New York, NY, USA, 2017; pp. 2828–2837. [Google Scholar]
  47. Cavalli, L.; Larsson, V.; Oswald, M.R.; Sattler, T.; Pollefeys, M. AdaLAM: Revisiting Handcrafted Outlier Detection. arXiv 2020, arXiv:2006.04250. [Google Scholar] [CrossRef]
  48. Lindenberger, P.; Sarlin, P.-E.; Pollefeys, M. Lightglue: Local Feature Matching at Light Speed. In Proceedings of the 2023 IEEE/CVF International Conference on Computer Vision (ICCV), Paris, France, 1 October 2023; IEEE: New York, NY, USA, 2023; pp. 17581–17592. [Google Scholar]
  49. Liu, J.; Li, X. Geometrized Transformer for Self-Supervised Homography Estimation. In Proceedings of the 2023 IEEE/CVF International Conference on Computer Vision (ICCV), Paris, France, 1 October 2023; IEEE: New York, NY, USA, 2023; pp. 9522–9531. [Google Scholar]
  50. Xia, Y.; Jiang, J.; Lu, Y.; Liu, W.; Ma, J. Robust Feature Matching via Progressive Smoothness Consensus. ISPRS J. Photogramm. Remote Sens. 2023, 196, 502–513. [Google Scholar] [CrossRef]
  51. Huang, J.; Li, H.; Gong, Y.; Fan, F.; Ma, Y.; Du, Q.; Ma, J. Robust Feature Matching via Graph Neighborhood Motion Consensus. IEEE Trans. Multimed. 2024, 26, 9790–9803. [Google Scholar] [CrossRef]
  52. Lu, Y.; Ma, J.; Mei, X.; Huang, J.; Zhang, X.-P. Feature Matching via Topology-Aware Graph Interaction Model. IEEE/CAA J. Autom. Sin. 2024, 11, 113–130. [Google Scholar] [CrossRef]
  53. Wu, P.; Yao, Y.; Zhang, W.; Wei, D.; Wan, Y.; Li, Y.; Zhang, Y. MapGlue: Multimodal Remote Sensing Image Matching. arXiv 2025, arXiv:2503.16185. [Google Scholar]
  54. Ye, Y.; Wang, Q.; Zhao, H.; Teng, X.; Bian, Y.; Li, Z. Li Fast and Robust Optical-to-SAR Remote Sensing Image Registration Using Region-Aware Phase Descriptor. IEEE Trans. Geosci. Remote Sens. 2024, 62, 1–12. [Google Scholar] [CrossRef]
  55. Ye, Y.; Bruzzone, L.; Shan, J.; Bovolo, F.; Zhu, Q. Fast and Robust Matching for Multimodal Remote Sensing Image Registration. IEEE Trans. Geosci. Remote Sens. 2019, 57, 9059–9070. [Google Scholar] [CrossRef]
  56. Liao, Y.; Xi, K.; Fu, H.; Wei, L.; Li, S.; Xiong, Q.; Chen, Q.; Tao, P.; Ke, T. Refining Multi-Modal Remote Sensing Image Matching with Repetitive Feature Optimization. Int. J. Appl. Earth Obs. Geoinf. 2024, 134, 104186. [Google Scholar] [CrossRef]
  57. Mahajan, S.; Fataniya, B. Cloud Detection Methodologies: Variants and Development—A Review. Complex Intell. Syst. 2020, 6, 251–261. [Google Scholar] [CrossRef]
  58. Aybar, C.; Mateo-García, G.; Acciarini, G.; Růžička, V.; Meoni, G.; Longépé, N.; Gómez-Chova, L. Onboard Cloud Detection and Atmospheric Correction with Efficient Deep Learning Models. IEEE J. Sel. Top. Appl. Earth Obs. Remote Sens. 2024, 17, 19518–19529. [Google Scholar] [CrossRef]
  59. Foga, S.; Scaramuzza, P.L.; Guo, S.; Zhu, Z.; Dilley, R.D.; Beckmann, T.; Schmidt, G.L.; Dwyer, J.L.; Joseph Hughes, M.; Laue, B. Cloud Detection Algorithm Comparison and Validation for Operational Landsat Data Products. Remote Sens. Environ. 2017, 194, 379–390. [Google Scholar] [CrossRef]
  60. Gupta, R.; Panchal, P. Advancement of Cloud Detection Algorithm in Satellite Images with Application to Color Models. In Proceedings of the 2015 International Conference on Computer Communication and Informatics (ICCCI), Coimbatore, India, 8–10 January 2015; IEEE: New York, NY, USA, 2015; pp. 1–6. [Google Scholar]
  61. Tian, P.; Guang, Q.; Liu, X. Cloud Detection from Visual Band of Satellite Image Based on Variance of Fractal Dimension. J. Syst. Eng. Electron. 2019, 30, 485–491. [Google Scholar] [CrossRef]
  62. Liu, K.; Liao, Y.; Yang, K.; Xi, K.; Chen, Q.; Tao, P.; Ke, T. Efficient Radiometric Triangulation for Aerial Image Consistency across Inter and Intra Variances. Int. J. Appl. Earth Obs. Geoinf. 2024, 130, 103911. [Google Scholar] [CrossRef]
  63. Jeppesen, J.H.; Jacobsen, R.H.; Inceoglu, F.; Toftegaard, T.S. A Cloud Detection Algorithm for Satellite Imagery Based on Deep Learning. Remote Sens. Environ. 2019, 229, 247–259. [Google Scholar] [CrossRef]
  64. Li, Y.; Wu, Y.; Li, J.; Sun, A.; Zhang, N.; Liang, Y. A Machine Learning Algorithm Using Texture Features for Nighttime Cloud Detection from FY-3D MERSI L1 Imagery. Remote Sens. 2025, 17, 1083. [Google Scholar] [CrossRef]
  65. Ke, G.; Meng, Q.; Finley, T.; Wang, T.; Chen, W.; Ma, W.; Ye, Q.; Liu, T.-Y. LightGBM: A Highly Efficient Gradient Boosting Decision Tree. In Proceedings of the 31st International Conference on Neural Information Processing Systems, Auckland, New Zealand, 2–6 December 2024; Curran Associates Inc.: Red Hook, NY, USA, 2017; pp. 3149–3157. [Google Scholar]
  66. Ravi, N.; Gabeur, V.; Hu, Y.-T.; Hu, R.; Ryali, C.; Ma, T.; Khedr, H.; Rädle, R.; Rolland, C.; Gustafson, L.; et al. SAM 2: Segment Anything in Images and Videos. arXiv 2024, arXiv:2408.00714. [Google Scholar]
  67. Zou, X.; Yang, J.; Zhang, H.; Li, F.; Li, L.; Wang, J.; Wang, L.; Gao, J.; Lee, Y.J. Segment Everything Everywhere All at Once. arXiv 2023, arXiv:2304.06718. [Google Scholar] [CrossRef]
  68. Zhang, J.; Yang, X.; Jiang, R.; Shao, W.; Zhang, L. RSAM-Seg: A SAM-Based Approach with Prior Knowledge Integration for Remote Sensing Image Semantic Segmentation. Remote Sens. 2025, 17, 590. [Google Scholar] [CrossRef]
  69. Gao, B. NDWI—A Normalized Difference Water Index for Remote Sensing of Vegetation Liquid Water from Space. Remote Sens. Environ. 1996, 58, 257–266. [Google Scholar] [CrossRef]
  70. Carlson, T.N.; Ripley, D.A. On the Relation between NDVI, Fractional Vegetation Cover, and Leaf Area Index. Remote Sens. Environ. 1997, 62, 241–252. [Google Scholar] [CrossRef]
  71. Schubert, E.; Sander, J.; Ester, M.; Kriegel, H.P.; Xu, X. DBSCAN Revisited, Revisited: Why and How You Should (Still) Use DBSCAN. ACM Trans. Database Syst. 2017, 42, 1–21. [Google Scholar] [CrossRef]
  72. Ye, Y.; Shan, J.; Bruzzone, L.; Shen, L. Robust Registration of Multimodal Remote Sensing Images Based on Structural Similarity. IEEE Trans. Geosci. Remote Sens. 2017, 55, 2941–2958. [Google Scholar] [CrossRef]
  73. Zhang, Z.; Tao, P. An Overview on “Cloud Control” Photogrammetry in Big Data Era. J. Geod. Geoinf. Sci. 2017, 46, 1238–1248. [Google Scholar]
Figure 1. Image distribution of the experimental regions with the green and red boxes representing the coverage areas of the optical and SAR images respectively: (a) Region 1; (b) Region 2; (c) Region 3; and (d) Region 4.
Remotesensing 17 02630 g001
Figure 2. Workflow for equatorial region orthophoto mapping.
Remotesensing 17 02630 g002
Figure 3. Residual statistics for tie points: (ad) 2D residual distributions for randomly selected 500 tie points from each region with the magnitude and direction of the residuals represented by the length and orientation of the red arrows; and (e) planar residual statistics of all the tie points.
Remotesensing 17 02630 g003
Figure 4. Residual statistics for check points: (a) Region 1; (b) Region 2; (c) Region 3; and (d) Region 4.
Remotesensing 17 02630 g004
Figure 5. Orthorectification results for the experimental area: (a) Region 1; (b) Region 2; (c) Region 3; and (d) Region 4.
Remotesensing 17 02630 g005
Figure 6. Edging error for typical blocks in each experimental region: (a) Region 1; (b) Region 2; (c) Region 3; and (d) Region 4.
Remotesensing 17 02630 g006
Figure 7. Comparison of ortho-edging accuracy.
Remotesensing 17 02630 g007
Figure 8. Residual statistics of tie points under different strategies: (a) Region 1; (b) Region 2; (c) Region 3; and (d) Region 4.
Remotesensing 17 02630 g008
Figure 9. Residual statistics for checkpoint: (a) Region 1; (b) Region 2; (c) Region 3; and (d) Region 4.
Remotesensing 17 02630 g009
Figure 10. Residual statistics for each method, with residuals at each checkpoint indicated by black dots: (a) Region 1; (b) Region 2; (c) Region 3; and (d) Region 4.
Remotesensing 17 02630 g010
Figure 11. Geometric positioning accuracy, with residuals at each checkpoint indicated by black dots: (a) Region 1; (b) Region 2; (c) Region 3; and (d) Region 4.
Remotesensing 17 02630 g011
Table 1. Dataset details.
Region 1Region 2Region 3Region 4
OpticalSAROpticalSAROpticalSAROpticalSAR
SatelliteGF-07GF-03BZY-303GF-03CZY-302GF-03CZY-303GF-03C
Resolution0.67 m4.45 m2.12 m4.34 m2.12 m4.45 m2.12 m4.34 m
Location109.5°E 1.1°S20.6°E 0.9°N88.6°W 18.6°N114.0°E 1.3°S
Number31425172
Cloud cover33.61%/27.96%/52.77%/43.27%/
Capture time2022-042022-082025-012025-022024-012024-032024-032023-07
Table 2. Adjustment accuracy under different parameter values (pixels), with the highest accuracy for each experimental area highlighted in bold.
Region 1Region 2Region 3Region 4
η = 0.25 3.521.211.352.26
η = 0.50 3.481.521.312.06
η = 0.75 3.501.611.391.97
η = 1.00 3.491.681.381.96
Table 3. Geometric accuracy for image orthorectification.
Region 1Region 2Region 3Region 4
Tie-point number938616,703773410,826
Adjustment accuracy (pixels)3.481.521.312.06
Check points number79912
Edging error (meters)2.882.374.314.02
Table 4. Geometric accuracy of image orthorectification with and without a cloud mask, with the highest performance for each experimental area highlighted in bold.
Without Cloud MaskWith Cloud Mask
Tie-Point NumberAdjustment Accuracy (Pixels)Edging Error (Meters)Tie-Point NumberAdjustment Accuracy (Pixels)Edging Error (Meters)
Region 194903.595.1393863.482.88
Region 224,3201.462.2616,7031.522.37
Region 383161.437.4277341.314.31
Region 410,3712.175.2510,8262.064.02
Table 5. Results under different cloud masks, with the highest performance for each experimental area highlighted in bold.
Region 1Region 2Region 3Region 4
NDVI + NDWITie-point number933423,81225623346
Adjustment accuracy (pixels)3.541.961.502.30
Edging error (meters)3.722.499.089.27
Auto promptTie-point number938616,703773410,826
Adjustment accuracy (pixels)3.481.521.312.06
Edging error (meters)2.882.374.314.02
Manual promptTie-point number949626,709938011,912
Adjustment accuracy (pixels)2.961.171.281.85
Edging error (meters)2.901.983.123.04
Disclaimer/Publisher’s Note: The statements, opinions and data contained in all publications are solely those of the individual author(s) and contributor(s) and not of MDPI and/or the editor(s). MDPI and/or the editor(s) disclaim responsibility for any injury to people or property resulting from any ideas, methods, instructions or products referred to in the content.

