Abstract
In North Carolina (NC), roughly 1 in 4 residents rely on private wells for drinking water. Given the potential for flooding to impact well water quality, which poses serious health hazards to well users, accurate near real-time precipitation estimates are vital for guiding outreach and mitigation efforts. GPM IMERG precipitation data provides a solution for this need. Previous studies have shown that IMERG version 06 performs well throughout NC for capturing event totals. This study investigates changes in precipitation performance from IMERG version 06 to version 07 in NC and surrounding regions. There was significant improvement pertaining to errors quantifying the magnitude of precipitation events; the mean error in event precipitation decreased 75–85%, bias decreased 65–80%, and the root mean square error decreased 15–30% for Early, Late, and Final products as compared to event totals from in situ precipitation gauges. V07 shows improved performance during events in colder conditions, in mountainous regions, and with higher, prolonged intensities. During Hurricane Florence (September 2018), v07 improved precipitation estimates in regions with higher rainfall totals. These findings demonstrate the potential of the IMERG v07 Early and Late data products for the creation of accurate and timely flood models in emergency response applications.
1. Introduction
Precipitation events consisting of short-duration, high-intensity, or large cumulative rainfall magnitudes are key drivers in fluvial and/or pluvial flooding and the corresponding damages and impacts on human health. For example, the precipitation and resulting flooding associated with Hurricane Florence (September 2018) caused roughly USD 24 billion in damages [1,2] and contaminated private wells used for drinking water [3] throughout Eastern North Carolina (NC). These precipitation-induced flooding events continue to occur statewide, as more recently, the precipitation associated with Hurricane Helene (September 2024) resulted in significant flooding in Western NC. While the resulting impacts are still being quantified, preliminary analysis shows impacts to bridges and other public and private property [4,5], highlighting the risk of widespread, extreme precipitation beyond coastal communities. To monitor pre-event conditions, surveil event evolution, and identify impacted areas for prioritizing response efforts from such storm events, rapid access to reliable, widespread precipitation data is vital.
While precipitation from in situ gauges is generally considered to be the highest quality, with sufficient temporal resolution to characterize within-storm rainfall intensities, these observations do not provide continuous coverage throughout the US [6]. Given that precipitation correlation decreases with distance from the gauge, gridded precipitation datasets derived from gauge data do not always provide accurate rainfall estimations in areas with sparse rain gauges [7]. In situ gauges may also not capture nuances in precipitation between gauges due to factors such as topography [6,8]. To address these shortcomings, remotely sensed precipitation provides a solution for monitoring rainfall and flood modeling in regions with sparse rain gauges [9,10]. In the US, multi-source (gauge and ground-based radar) precipitation products, such as the National Centers for Environmental Prediction stage IV quantitative precipitation estimates, provide an alternative to gauge-only estimates. However, gaps in radar coverage and inconsistent data processing techniques between the River Forecast Centers present challenges for providing near real-time precipitation of uniform quality throughout the US [11,12]. Leveraging recent advancements in space-based observations, near real-time, multi-source (gauge and satellite-based sensors) precipitation data products are available, providing sufficient timeliness and accuracy for estimating the extent and severity of event rainfall and associated flooding [13].
The Tropical Rainfall Measuring Mission (TRMM) was launched in 1997 to provide a more complete spatial–temporal understanding of precipitation over the tropics, with spatial coverage from 35°N to 35°S [14,15]. The TRMM Multisatellite Precipitation Analysis (TMPA) algorithm incorporated data from additional satellites to expand precipitation coverage to 50°N and 50°S, providing precipitation estimates every 3 h at a spatial resolution of 0.25° × 0.25° [16,17,18]. The successor to TRMM was the Global Precipitation Measurement (GPM) satellite, which was launched in 2014, and covered the range 65°N to 65°S [19,20]. The Integrated Multi-satellitE Retrievals for GPM (IMERG) algorithm was developed by NASA to produce remotely sensed precipitation [21] by combining observations from passive microwave observations (PMW), infrared (IR) sensing methods, and a single core precipitation radar providing near global coverage, with half-hourly precipitation estimates at a resolution of 0.1° × 0.1° [22]. PMW precipitation relies on the scattering of radiation by ice particles in the atmosphere, where greater scattering indicates an increased presence of precipitation in clouds [23,24]. IR precipitation is based on an inverse relationship between cloud-top temperature and precipitation intensity [25,26]. While PMW estimates are more accurate than IR, [27] IR estimates have more complete temporal and spatial coverage, and blending these two data sources with GPM radar data is the basis of remotely sensed precipitation estimates [28]. In general, PMW observations from multiple satellites are the primary data source, which are supplemented with IR observations to fill in any resulting data gaps [29].
The GPM IMERG algorithm has three data products with varying data latencies: Early, Late, and Final. The length of time corresponds to the amount of processing undergone by each product. The two near real-time data products are Early, with a latency of 4 h, and Late, with a latency of 14 h, while Final takes several months until its release. Early has the least amount of processing, with forward Lagrangian time interpolation [30]. Late is a continuation of the Early dataset, with backward morphing performed, which incorporates the subsequent 12 h of observation [31]. The Final product undergoes the most processing, with gauge corrections included based on monthly gauge totals [32]. However, given the 3.5-month latency of the Final product, near real-time applications are only possible using the Early and Late products.
GPM IMERG version 07 (v07) is the most recent release of the IMERG algorithm to date, with the upgrade occurring on 10 July 2023 [33]. The average latency of the Final dataset since the release of v07 is 5 months [33]. The v07 algorithm uses the core satellite’s spatial resolution with other satellites in the GPM constellation to provide near global coverage [33]. Notably, v07 implemented improvements for PMW estimates in orographic regions and over frozen surfaces by upgrading both the Combined Radar Radiometer Analysis (CORRA) and Goddard Profiling (GPROF) [34] processing algorithms. The improvement in the CORRA algorithm relates to improvements in the particle size distribution and more accurate reprocessing of the historical data observed by the TRMM-era satellite observations prior to 2014 [35]. The processing of IR estimates was improved by transitioning from the previously used algorithm PERSIANN-CCS to PDIR-NOW, implementing more dynamic correlation between IR brightness temperatures and the precipitation rate [36]. Additional improvements include adjustments to gridding, motion vectors, the addition of the SHARPEN scheme for Kalman filter improvement, and adjustments to the lookup tables of the precipitation phase [37,38]. For the Early and Late products, a climatological adjustment is implemented for bias correction, developed based on the Final data product [35].
Numerous studies have investigated the performance of the previous IMERG version, v06, generally finding that IMERG tends to overestimate light precipitation [39] and underestimate heavy precipitation [40,41,42,43,44,45]. Specific to NC, a previous study investigated the performance of event magnitudes derived from v06 Early, Late, and Final products [41]. Key findings suggested that all three GPM IMERG datasets have a good probability of detection for events, especially for larger magnitude events. However, for larger precipitation events (greater than the 75th percentile), the products tend to have a negative bias relative to gauge data, while events less than the 75th percentile have a positive bias [41].
Given its relatively recent release, few studies have been published examining the performance of v07. The following studies utilize only the Final IMERG dataset in mainland China. One study found an increased accuracy in v07 in high-altitude areas and arid regions, as well as frozen ground [46]. Another study discovered that v06 underestimated precipitation and tended to have higher magnitudes of negative relative bias, while v07 slightly overestimated precipitation, with smaller magnitudes of positive bias [47]. Similarly, others determined that for extreme precipitation events, there was a 25% reduction in relative bias and a 2.3% improvement in the root mean square error between v06 and v07 [48]. V07 has also been used in flood models, showing improved flood peak timing throughout the US as compared to v06 [49]. However, there are limited studies addressing the performance of the Early and Late products. While understanding the improvement in the research-grade Final dataset of IMERG is important, there is a need to examine the accuracy of the earlier released data products for utilization in rapid disaster response.
To address this knowledge gap pertaining to a lack of analysis with respect to the near-real time data products, this study compares IMERG v07 precipitation events derived from the Early, Late, and Final products to precipitation events derived from the IMERG v06 products and 282 in situ gauges throughout NC and surrounding regions. Various error metrics are used to evaluate the two IMERG datasets in relation to ground gauges in terms of event magnitude of errors, estimation bias, and likelihood of event detection (Table A1). This study quantifies the accuracy and precision of the Early and Late v07 products for use in near real-time applications.
2. Methods
2.1. Study Region
The primary study area was comprised of NC (Figure 1) and included watersheds containing rivers that drain into and out of the state based on the MERITHydro river network and catchments dataset [50]. The region consists of watersheds that ultimately drain into the Atlantic Ocean and the Gulf of Mexico. Extreme precipitation events in the summer months are driven by mesoscale convective systems from the Atlantic Ocean and the Gulf of Mexico [51]. During late Summer and early Fall (i.e., Hurricane Season), the region has the potential for tropical depressions, tropical storms, and hurricanes, which originate from the Atlantic Ocean [52]. The region is also impacted by smaller-scale severe convective events in the spring and summer [53].
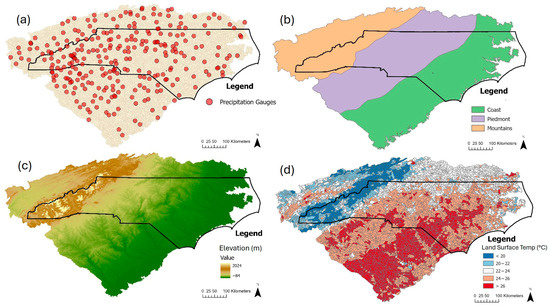
Figure 1.
Study region, with North Carolina boundary and (a) 282 precipitation gauges, (b) physiographic regions, (c) ground elevations, and (d) mean daily MODIS land surface temperature (°C).
2.2. Datasets
GPM IMERG v06 and v07 Early, Late, and Final daily and 30 min precipitation data were downloaded from June 2000 through September 2021 [33]. Daily precipitation gauge observations, from 282 gauge locations, were downloaded from NOAA’s Global Historical Climate Network [54]. The 282 gauges were selected based on their data record containing at least 75% of the total temporal duration of the study. Here, the average temporal coverage for the gauges contained 98% of the study period. Each gauge was matched to its respective IMERG pixel. If two selected gauges fell within the same IMERG 0.1° grid box, both gauges were included, and each was used to evaluate the IMERG grid box separately.
This study builds on an established method for determining individual large-scale precipitation events [41]. For each precipitation dataset, a daily running 5-day sum of precipitation, including 2 days before and 2 days after a given date, was calculated. Using the 5-day cumulative precipitation time series, an event (date and magnitude) was identified based on three criteria: (i) the date of the maximum 5-day cumulative precipitation within a time window of 4 days before and 4 days after a given day (i.e., to eliminate splitting a longer event into two separate 5-day events); (ii) if two consecutive days have the same 5-day cumulative value, the last day is considered the date of the event; and (iii) the event magnitude is greater than 10 mm. Note that this approach does not consider persistence of precipitation within the 5-day time period. Also, for the gauge data, there can be no gaps within the 5-day windows for the gauge event to be included. To calculate error metrics, the ground gauge was the considered the benchmark for comparison and defined the event for matching the IMERG precipitation event. While there are numerous approaches for defining a precipitation event [55,56,57], the important aspect of our event definition is that the same approach is applied to all precipitation datasets, providing consistency for performance assessment.
In this study, the maximum precipitation occurring over a 5-day time window was used to identify events. The number of events selected are sensitive to this time window, but the resulting performance metrics are not, with the exception of POD and FAR which tend to improve slightly with increasing time windows [41]. With the approach used, the challenge for defining events is related to (1) combining periods of precipitation separated by periods of no precipitation, and (2) capturing the full duration of long duration events. As the event time window increases, there is potential to combine shorter duration events (e.g., 1–2 days) into one larger event. As the event time window decreases, there is potential to split longer duration events (e.g., 4–5+ days) into two or more shorter duration events. Therefore, the results in this study are dependent on the time window used in terms of the number of events and total event magnitudes, but given that the approach was used on both gauge and GPM datasets, the resulting performance metrics represent a consistent comparison between the datasets. In addition, the minimum event magnitude was set to 10 mm for two reasons: (1) the focus of this study on GPM performance for events leading to surface or river flooding, and (2) the mean event errors for v06 were roughly 6–7 mm [41] which limits the applicability of GPM IMERG for events less than 10 mm. Again, it is important to note that the 5-day maximum precipitation and minimum threshold of 10 mm to define events impacted the number of events selected (i.e., as this criteria increase, the number of smaller events in the dataset decreases) but did not impact the comparisons between GPM and gauge data, as the same criteria were used for both datasets. Adjusting these criteria will alter the number of events selected, with limited impact on the performance metrics for the selected events, with the exception of POD and FAR, which tend to improve as the criteria increase in magnitude (see Figure 5 in [41]). Using these criteria resulted in roughly 527 events, or 26 events per year, being identified for each gauge, providing a robust dataset for assessing performance.
To compare the data at various precipitation event magnitudes, the gauge data were grouped into four magnitude percentiles of all matched events, <25th, 25th–50th, 50th–75th, and >75th. This was performed for the Early, Late, and Final datasets for both v06 and v07. The gauge data were used to ensure similar percentile groupings for each dataset. Each corresponding satellite event was then matched, separated into the corresponding gauge percentiles, and the errors were calculated.
Land surface 8-day temperatures were obtained from the MODIS Land Surface Temperature/Emissivity 8-Day dataset [58]. The MODIS 1km grid box containing gauge locations were used. For each precipitation event, the day of surface temperature observation closest to the first day of a precipitation event was assigned as the temperature value for the corresponding event. Therefore, any event occurring with a temperature in the upper third of event temperatures was considered as a “warm” event, and any event occurring with the lowest third of event temperatures was considered as a “cold” event.
Physiographic regions of the gauge locations were obtained from the US Geological Survey, and categorized as either Coast, Piedmont, or Mountains, which included features from the Blue Ridge Mountains and Appalachian plateau [59]. The gauges were grouped for error calculations based on their containment in each of these three regions in the state.
For comparisons specific to Hurricane Florence (September 2018), precipitation frequency estimates for the 10-day, 100-year storm were downloaded for the NOAA Atlas 14 grid [60] event.
Physiographic regions of the gauge locations were obtained from the US Geological Survey, and categorized as either Coast, Piedmont, or Mountains, which included features from the Blue Ridge Mountains and Appalachian plateau [59]. The gauges were grouped for error calculations based on their containment in each of these three regions in the state.
For comparisons specific to Hurricane Florence (September 2018), precipitation frequency estimates for the 10-day, 100-year storm were downloaded for the NOAA Atlas 14 grid [60] in North Carolina, and both the GPM IMERG 10-day daily precipitation values (10–20 September 2018) and the precipitation frequency estimates were spatially averaged for each county in the region. The datasets used in the Hurricane Florence event comparison were the Late v06 and v07 daily and 30 min precipitation estimates. Each gauge was compared to the IMERG grid box closest to the centroid of the watershed. Hourly gauge data for the period were largely not available for the time period. To include the cumulative precipitation [41], errors were normalized by several matched events. These included the mean error (ME), which measures the difference between the satellite and gauge precipitation event magnitudes for each event, relative bias (RBias), which normalizes the ME by gauge event magnitude, and the root mean square error (RMSE), which is the square root of the difference in the satellite minus the gauge observations squared. Two additional error metrics were used to examine the likelihood that an event occurred on the same day between the satellite and gauge, where the probability of detection (POD) measures the agreement of gauge observed dates, and the false alarm ratio (FAR) indicates events identified by the satellite but not by the gauge. For the error metrics ME, RBias, and RMSE, only the events matched by both the satellite and gauge were used. For POD and FAR, a count of events observed separately by the gauge and satellite and by both were utilized. Various groupings of characteristics were utilized to analyze the occurrence of various errors, including examination by precipitation event magnitude, temperature of the land surface during the event, and physiographic region of the state.
3. Results
3.1. Overall Event Errors for IMERG v06 and v07
IMERG v07 showed significant improvement in errors capturing magnitude characteristics of individual events but showed minimal improvement in errors evaluating event detection (Figure A1). The average ME for Early, Late, and Final v06 events were 6.0 mm, 6.8 mm, and 1.7 mm, which improved in v07 to 1.5 mm, 1.0 mm, and 0.3 mm, respectively (Table A2). The average RBias for Early, Late, and Final v06 were 0.14, 0.16, and 0.04, which improved in v07 to 0.04, 0.03, and 0.02. The decrease in ME and RBias indicates that the tendency to overestimate event precipitation in v06 was corrected in v07.
The RMSEs between the gauge and IMERG events for Early, Late, and Final were 40 mm, 39 mm, and 28 mm in v06, which improved in v07 to 29 mm, 28 mm, and 24 mm. While ME and RBias can mask the absolute magnitudes of errors due to summing positive and negative errors, the RMSE is based on the absolute magnitude of the errors between the satellite and gauge. The decrease in the RMSE from v06 to v07 indicates that the 5-day event magnitudes were more similar to the gauge values in v07.
The mean POD values were 0.83, 0.83, and 0.85 in v06 and 0.84, 0.84, and 0.86 in v07, while the mean FAR values were 0.20, 0.18, and 0.18 in v06 and 0.20, 0.18, and 0.18 in v07 for Early, Late, and Final. These metrics evaluated the likelihood that an event was detected by both the gauge and satellite, which indicates that the detection of events did not change between the versions, despite the quantitative errors showing significant improvement in event magnitudes. Overall, the change from v06 to v07 decreased the ME by 76%, 86%, and 85%; the RBias by 71%, 80%, and 64%, and the RMSE by 27%, 30%, and 14% for Early, Late, and Final, respectively. The Late dataset had the largest decrease in error for these three metrics.
The mean of matched events for version 07 was, on average, greater than the matched event mean for version 06. Comparing the IMERG data products to the ground gauge values, v07 performed better for 51% of events, while v06 performed better for 38% of events. Here, if both v06 and v07 event totals were within ±20% of the gauge total, the two products were classified as having a similar performance. In total, 11% of events were similar. Further performance metrics with varying “similar” classifications are included in Table A3.
3.2. Grouped Errors for IMERG v06 and v07
In this section, errors are grouped based on event magnitude percentiles, physiographic regions, and land surface temperature at the start of an event. The intention of using these groupings is to quantify the performance characteristics for a range of event magnitudes, topographic settings, temperature-related surface conditions, and to some degree, time of year (i.e., season).
For event magnitudes, v07 showed significant improvement from v06 for lower magnitude events <75th percentile. Note that the percentiles were based on gauge magnitudes at each location. For the smaller magnitude events included in the <25th, 25–50th, and 50–75th percentiles, the Early product showed an improved RBias from 0.89 in v06 to 0.04 in v07; Late RBias improved from 0.89 in v06 to 0.02 in v07, and Final from 0.73 to 0.05 (Figure 2). Improvement was shown in all three datasets, with the RBias approaching the ideal value of 0, as well as having a narrower variance. The RMSE, which represents absolute error magnitudes between the satellite and gauge observations, reflected the same pattern between the percentiles from v06 to v07, but with smaller magnitudes of error in v07.
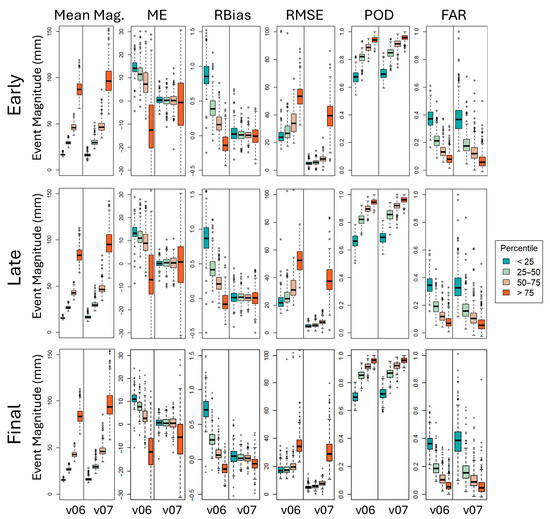
Figure 2.
Comparison of average event magnitude by percentile (mm), ME (mm), RBias, RMSE (mm), POD, and FAR, for the Early, Late, and Final datasets, separated by the 25th, 50th, and 75th gauge percentiles for IMERG v06 and IMERG v07.
Errors separated by daily land surface temperature (LST) classes (Figure 1d) at each gauge location showed improvement in performance for v07 over v06 at all temperatures for error metrics quantifying margins of error, notably for the upper and lower temperature groups (Figure 3a). The average temperature classification threshold was >36 °C for the greater-than-95th percentile warm temperature quantification, and <9.6 °C for the less-than-5th percentile cold temperatures. For the 5th percentile threshold, 58 gauges had a threshold below 7.5 °C, 29 below 5 °C, 9 below 2.5 °C, and 3 below 0 °C. Concerning the 95th percentile threshold, 204 gauges had a threshold above 35 °C, 98 above 37.5 °C, and 28 had a threshold above 40 °C. Note that LST is not air temperature and can be warmer or colder than air temperature based on surface and atmospheric conditions [61,62]. Therefore, the percentile values presented are specific to LST and cannot be used with air temperature values. In v06, events occurring during colder temperatures were overestimated in terms of ME and RBias, while the warmer events tended to have underestimated magnitudes. In v07, the average errors were 0.3–1.8 for ME and 0.04–0.05 for RBias. For RMSE, events occurring during colder temperatures had the largest errors in v06 and the lowest errors in v07. A summary of all mean error metrics in v06 and v07 overall, as well as based upon percentile, region, and temperature separations, is included in Table A2.
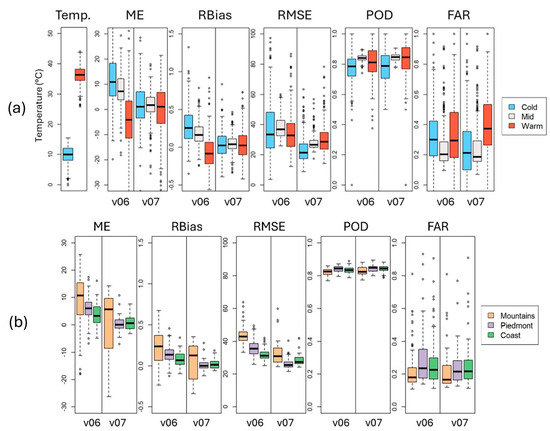
Figure 3.
(a) IMERG Late temperature thresholds of the 5th (cold) and 95th (warm) percentiles and errors based on MODIS eight-day land surface temperature for ME (mm), RBias, RMSE (mm), POD, and FAR, and (b) GPM IMERG Late errors separated based upon gauge location within physiographic provinces of North Carolina.
Figure 3b shows regional results separated by the three major physiographic regions in NC. The mountain regions showed the largest variances in error magnitude for ME and RBias, which may be attributed to precipitation caused by orographic lifting and the variance of topographic features in this region. However, the mean ME decreased from 8.6 mm in v06 to 0.21 mm in v07, and the mean RBias decreased from 0.21 to 0.05 in the change from v06 to v07. Table A2 represents mean values, where the mountainous region shows the smallest average mean error out of all the regions. However, the boxplot in Figure 3b shows the median of the mean errors, where the mountainous region shows the largest of out of all the regions despite showing the largest decrease from v06 to v07.
3.3. Event Errors for IMERG v06 and v07—Case Study: Hurricane Florence
Hurricane Florence made landfall in North Carolina on 14 September 2018, as a Category 1 hurricane [63,64]. In situ precipitation gauges recorded over 900 mm of precipitation in multiple gauges along the southern region, near the eastern coast of the state [65]. The 10-day Late precipitation sum was for the period 10–19 September 2018. In general, v07 produced larger precipitation magnitudes over the region (Figure 4a). Version 07 Late was closer to the gauge observations for 62% of gauges in NC for the 10-day sum, while v06 was more similar at 38% of gauges. Within the 10-day period, v07 was more accurate for 71% of days with gauge precipitation >50 mm, and 85% of days >100 mm. For each day, the mean difference between the satellite and gauge was 3.3 mm for v06 and −0.6 mm for v07. Of the 142 gauges where v07 performed better than v06, 30 showed an IMERG overestimation and 112 show an underestimation of the 10-day precipitation. The inclusion of a “similar” category, in which both the v06 and v07 10-day sums were within ±20% of the gauge magnitude, showed that 52% of gauges (n = 130) were more accurate for v07, 40% for v06, and 8% were similar (Figure 4a). Of these locations, the satellite observations overestimated precipitation at 105 gauges and underestimated it at 25 gauges. For all events, version 07 consistently performed better than version 06 for 13% of events, regardless of the classification of events considered as similar. However, in the case of Hurricane Florence, the greatest discrepancies between v06 and v07 took place, with few to no events considered similar. Ultimately, 20% similarity was chosen to highlight gauge locations where both v06 and v07 were similar to the gauge observations. Other percentages considering varying similar definitions are shown in Table A3.
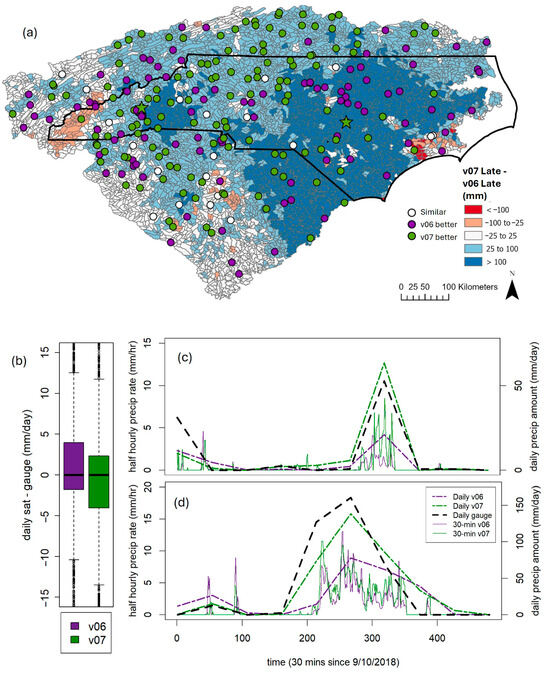
Figure 4.
(a) Ten-Day GPM IMERG precipitation accumulation (mm) for Hurricane Florence, 10–19 September 2018, displaying v07–v06. The performance of the two datasets compared to each gauge (n = 249) is shown, with the time series of the starred gauges shown in (c,d). (b) Satellite—gauge daily precipitation values (mm/day) for each day of gauge observation during the 10-day time period. (c) The time series for the western starred gauge, with v07 errors better than those of v06 but resulting in slightly overestimated event precipitation. (d) The time series for the eastern starred gauge, where v07 is better than v06, with both underestimating event precipitation.
Finally, when examining the half-hourly data over the 10-day period, the 30 min data were similar in timing for peak precipitation intensities, yet differed for the 30 min magnitudes, as shown in Figure 4c,d. The time series in Figure 4c is for a gauge location shown with the green star to the west in Figure 4a, while the time series in Figure 4d is for a gauge location in the eastern starred gauge. The eastern gauge in Figure 4d received a greater magnitude of precipitation from the hurricane, and both IMERG precipitation versions underestimated values compared to the gauge but showed similar timing in precipitation peaks. The western gauge received less event precipitation and had greater discrepancies in the timing of the half-hourly peaks.
According to the FEMA’s disaster declaration Hurricane Florence DR-4393-NC (2018), 28 counties in North Carolina required individual assistance and public assistance (categories A-G). Here, the NOAA Atlas 14’s map of partial duration series-based precipitation frequency estimates with a 90% confidence interval was used as an index of an area being impacted by a disaster. Specifically, the precipitation frequency for a 10-day duration, 100-year return period was used as an index of disaster quantification. Using this index, v07 more closely matched FEMA’s county declarations (counties shown with bold outline and red diagonal hash in Figure 5). Using v07 precipitation, a total of 26 counties in North Carolina exceeded the index (shown in blue and purple in Figure 5), while v06 showed that only 7 counties in North Carolina exceeded the index (shown in red and purple in Figure 5). Twenty of the counties were uniquely identified by v07 (blue counties in Figure 5), while only one was uniquely identified by v06 (red county), with both versions exceeding the index in six counties (purple counties). Also note that the five counties in NC that did not exceed the event index had county-averaged event precipitation of roughly 82% of the index in v07 and 67% for v06 in each county, which could account for differences between satellite and gauge-based statistics for defining a disaster index. This analysis suggests that v07 has the potential to be used for assessing impacts from major storm events and helping initial storm response efforts by state and local municipalities.
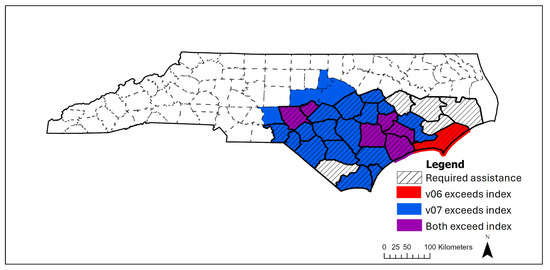
Figure 5.
Map of North Carolina counties with FEMA required assistance declaration and counties exceeding the precipitation frequency estimate for a 10-day, 100-year storm when using 10-day precipitation accumulation for GPM IMERG v06 and v07.
4. Discussion
In the version upgrade, the ME for all percentiles lower than the 75th, including observations lower than the 25th, 25th to 50th, and 50th to 75th, no longer indicated overestimation by IMERG, and the >75th percentiles were more distributed between overestimation and underestimation for the larger events. This improvement can likely be attributed to the implemented constraints on particle sizes in the CORRA algorithm and improved dynamic relationships in IR observations by the implementation of PDIR-Now [66]. However, there was not a significant change between the two versions in POD and FAR, indicating that v07 did not alter the ability to observe events (i.e., both v06 and v07 capture event occurrence reasonably well). In terms of near real-time application, the Early and Late datasets showed significant improvement. The larger events, >75th percentile, still showed the greatest discrepancies between satellite and gauge observations as compared to the smaller events but now showed less systematic satellite underestimation. This enhancement in near real-time extreme event observation will provide valuable inputs into developing more accurate flood models.
The greatest improvement, regarding the physiographic regions of the state, occurred in the mountain regions in the western portion of the state. This improvement was likely attributed to the new mountainous classes in the GPROF algorithm [35]. From v06 to v07, ME, RBias, and RMSE all showed improvement in each of their respective regions, although the most significant improvement of these errors occurred primarily in the Piedmont region, with coastal regions also showing considerable improvement. Improvement across all regions of the state will allow for a better understanding of precipitation in the rural areas, such as the mountains, where the inundation of private drinking wells through flooding is an area of concern.
The most significant precipitation observation enhancement with regard to land surface temperature percentiles occurred during events taking place in the more extreme temperatures, occurring in either warmer or colder conditions. For observations during colder events, which have been noted to be less accurate [67], the noted improvement was likely attributed to advancements made concerning PMW sensing over frozen ground. While there is minimal frozen ground within NC, this demonstrates an advantage to precipitation observations in more extreme latitudes. The warm temperatures saw an improvement from v06 to v07, but the opposite trend for FAR. This was likely due to the climatological adjustment for bias correction implemented in v07 for the Early and Late products [35].
The northeastern counties requiring FEMA assistance but not flagged as exceeding the precipitation frequency analysis in v06 or v07 (Pitt, Beaufort, Hyde, and Pamlico Counties) experienced flooding due to coastal storm surge and downriver flooding [68]. Therefore, this could be one limitation of the utilization of precipitation as an indicator of flooding and damages due to extreme precipitation.
In the case of Hurricane Florence, the NC counties that exceeded the precipitation frequency estimates were better indicators of a declared disaster in v07, rather than v06. This has important implications for the future supply of GPM IMERG data products in disaster relief. Since the release of v07, Hurricane Helene occurred in the mountainous regions of NC, and therefore, in conjunction with improvements in rapid observation across all regions and temperatures in the state. The improvements in the Hurricane Florence observations demonstrate the usefulness of precipitation observations for future hurricanes.
5. Conclusions
This study compares versions 06 and 07 of GPM IMERG Early, Late, and Final precipitation products in NC. Performance metrics were determined using in situ precipitation gauges (n = 282) for the period June 2000–December 2021. The upgrade from IMERG v06 to v07 showed significant improvements in event bias, mean error, and root mean square error. The Late data product had the largest improvement from v06 to v07, which is critical for near-real-time applications. The Late v07 data product performed better than the v06 data product for the majority of gauges. In colder land surface temperatures, such as those less than the 5th percentile, there was significant improvement in the ME, RBias, RMSE, and FAR. There were no additional significant improvements in the POD or FAR based on gauge event magnitude percentiles, region, or land surface temperature groupings. Improvements are still needed in the mountainous regions of the state, which showed some improvement but still had a wide variance of attributed error magnitudes, likely due to precipitation caused by orographic lifting. For Hurricane Florence, the days with higher precipitation resulted in better accuracy with the v07 Late product, as compared to the v06 Late. These improvements solidify the IMERG v07 Late product as a vital tool for flood risk assessment and emergency response, offering better support for real-time monitoring and hazard forecasting in regions vulnerable to extreme weather events. Further work is recommended to explore v07’s performance across varying climatic and topographic conditions globally.
Author Contributions
Conceptualization, R.E.B., K.J.P. and C.N.J.; methodology, E.B. and R.E.B.; software, E.B.; validation, E.B. and R.E.B.; formal analysis, E.B.; investigation, E.B.; resources, E.B. and R.E.B.; data curation, E.B.; writing—original draft preparation, E.B.; writing—review and editing, R.E.B., K.J.P. and C.N.J.; visualization, E.B.; supervision, R.E.B., C.N.J. and K.J.P.; project administration, R.E.B., C.N.J. and K.J.P.; funding acquisition, R.E.B., C.N.J. and K.J.P. All authors have read and agreed to the published version of the manuscript.
Funding
This work was funded by NASA’s Precipitation Measurement Mission Science Team Grant No. 80NSSC22K0606 and NASA’s Earth Science Applications Water Resources Program Grant No. 80NSSC22K0921.
Data Availability Statement
Further elaboration on methodologies and data analysis processes and included in [41]. Additional processing files unique to this study are included in a custom Hydroshare resource [69].
Conflicts of Interest
The authors declare no conflicts of interest.
Abbreviations
The following abbreviations are used in this manuscript:
| GPM | Global Precipitation Measurement |
| IMERG | Integrated Multi-satellitE Retrievals for GPM |
| TRMM | Tropical Rainfall Measuring Mission |
| TMPA | TRMM Multi-Satellite Precipitation Analysis |
| MODIS | Moderate Resolution Imaging Spectroradiometer |
| v06 | Version 06 |
| v07 | Version 07 |
| PMW | Passive microwave |
| IR | Infrared |
| ME | Mean error |
| RBias | Relative bias |
| RMSE | Root mean square error |
| POD | Probability of detection |
| FAR | False alarm ratio |
| LST | Land surface temperature |
| FEMA | Federal Emergency Management Agency |
| NOAA | National Oceanic and Atmospheric Administration |
| GPROF | Goddard Profiling |
| CORRA | Combined Radar Radiometer Analysis |
| SHARPEN | Scheme for Histogram Adjustment with Ranked Precipitation Estimates in the Neighborhood |
| PERSIANN-CCS | Precipitation Estimation from Remotely Sensed Information using Artificial Neural Networks—Cloud Classification System |
| PDIR-Now | PERSIANN Dynamic Infrared–Rain Rate—Now |
Appendix A

Table A1.
Equations for error evaluation utilized in satellite and gauge analysis. “Sat” represents an event observed by the satellite, and “Gauge” indicates an event observed by the gauge. “CSG” means both the gauge and satellite observe an event, “CGMS” is an event captured by the gauge and missed by satellite, and “CSMG” indicates an event missed by the gauge but captured by the satellite.
| Error Metric | Abbreviation | Formula | Range | Ideal Value |
|---|---|---|---|---|
| Mean Error | ME | −∞ to +∞ | 0 | |
| Relative Bias | RBias | −∞ to +∞ | 0 | |
| Root Mean Square Error | RMSE | 0 to +∞ | 0 | |
| Probability of Detection | POD | 0 to 1 | 1 | |
| False Alarm Ratio | FAR | 0 to 1 | 0 |
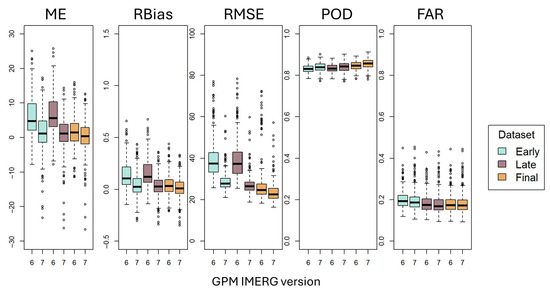
Figure A1.
Comparison of ME, RBias, RMSE, POD, and FAR, for the Early, Late, and Final datasets for IMERG v06 and IMERG v07.
Table A2.
Summary statistics for all Early, Late, and Final events; Early, Late, and Final broken by gauge percentiles <25, 25–50, 50–75, and >75; Late errors separated by temperature percentile; and Late errors separated by physiographic province.
Table A2.
Summary statistics for all Early, Late, and Final events; Early, Late, and Final broken by gauge percentiles <25, 25–50, 50–75, and >75; Late errors separated by temperature percentile; and Late errors separated by physiographic province.
| ME | RBias | RMSE | POD | FAR | ||
|---|---|---|---|---|---|---|
| Overall | Early, v06 | 6.0 | 0.14 | 39.6 | 0.83 | 0.20 |
| Early, v07 | 1.5 | 0.04 | 28.9 | 0.84 | 0.20 | |
| Late, v06 | 6.8 | 0.16 | 39.3 | 0.83 | 0.18 | |
| Late, v07 | 0.95 | 0.03 | 27.5 | 0.84 | 0.18 | |
| Final, v06 | 1.7 | 0.04 | 27.7 | 0.85 | 0.18 | |
| Final, v07 | 0.26 | 0.02 | 23.7 | 0.86 | 0.18 | |
| Early | <25, v06 | 14.8 | 0.89 | 25.9 | 0.67 | 0.37 |
| <25, v07 | 0.50 | 0.04 | 5.1 | 0.70 | 0.39 | |
| 25–50, v06 | 12.0 | 0.41 | 28.6 | 0.81 | 0.22 | |
| 25–50, v07 | 0.25 | 0.01 | 5.6 | 0.85 | 0.19 | |
| 50–75, v06 | 8.3 | 0.19 | 36.1 | 0.89 | 0.14 | |
| 50–75, v07 | 0.32 | 0.01 | 8.2 | 0.91 | 0.14 | |
| >75, v06 | −10.8 | −0.11 | 55.9 | 0.94 | 0.09 | |
| >75, v07 | −2.0 | 0.00 | 40.4 | 0.96 | 0.07 | |
| Late | <25, v06 | 13.8 | 0.89 | 24.3 | 0.67 | 0.35 |
| <25, v07 | 0.22 | 0.02 | 5.1 | 0.69 | 0.35 | |
| 25–50, v06 | 11.8 | 0.44 | 26.8 | 0.82 | 0.20 | |
| 25–50, v07 | 0.34 | 0.02 | 5.6 | 0.85 | 0.18 | |
| 50–75, v06 | 9.6 | 0.23 | 34.4 | 0.90 | 0.13 | |
| 50–75, v07 | 0.19 | 0.01 | 8.0 | 0.92 | 0.12 | |
| >75, v06 | −5.1 | −0.05 | 54.6 | 0.95 | 0.08 | |
| >75, v07 | −1.2 | 0.01 | 38.9 | 0.96 | 0.07 | |
| Final | <25, v06 | 11.3 | 0.73 | 18.9 | 0.70 | 0.37 |
| <25, v07 | 0.63 | 0.05 | 5.1 | 0.72 | 0.39 | |
| 25–50, v06 | 7.8 | 0.29 | 18.7 | 0.85 | 0.19 | |
| 25–50, v07 | 0.76 | 0.03 | 5.5 | 0.87 | 0.17 | |
| 50–75, v06 | 3.4 | 0.08 | 22.1 | 0.92 | 0.11 | |
| 50–75, v07 | 0.60 | 0.02 | 8.0 | 0.92 | 0.11 | |
| >75, v06 | −11.9 | −0.13 | 38.1 | 0.96 | 0.07 | |
| >75, v07 | −7.4 | −0.06 | 32.0 | 0.96 | 0.06 | |
| Late—Temperature | Cold, v06 | 13.5 | 0.30 | 38.5 | 0.77 | 0.33 |
| Cold, v07 | 1.8 | 0.04 | 23.8 | 0.78 | 0.25 | |
| Mid, v06 | 7.8 | 0.18 | 37.9 | 0.84 | 0.26 | |
| Mid, v07 | 1.6 | 0.05 | 27.8 | 0.85 | 0.25 | |
| High, v06 | −4.4 | −0.06 | 34.4 | 0.81 | 0.32 | |
| High, v07 | 0.26 | 0.04 | 30.3 | 0.83 | 0.40 | |
| Late—Regions | Mountain, v06 | 8.6 | 0.21 | 43.8 | 0.82 | 0.23 |
| Mountain, v07 | 0.21 | 0.05 | 33.2 | 0.83 | 0.24 | |
| Piedmont, v06 | 6.2 | 0.14 | 35.7 | 0.84 | 0.30 | |
| Piedmont, v07 | 0.34 | 0.01 | 26.3 | 0.84 | 0.26 | |
| Coast, v06 | 3.7 | 0.08 | 32.0 | 0.83 | 0.28 | |
| Coast, v07 | 1.0 | 0.03 | 28.8 | 0.84 | 0.28 |
Table A3.
Summary table of v06 and v07 precipitation events relative to gauge events for 10-day daily sum of Hurricane Florence and average of all events.
Table A3.
Summary table of v06 and v07 precipitation events relative to gauge events for 10-day daily sum of Hurricane Florence and average of all events.
| 10-Day Hurricane Florence | All Matched Events | |||||
|---|---|---|---|---|---|---|
| Percent of Gauge Event Considered Similar | v06 Better | v07 Better | Similar | Mean v06 Better | Mean v07 Better | Mean Similar |
| 5 | 43.0 | 57.0 | 0.0 | 42.7 | 56.6 | 0.7 |
| 10 | 42.6 | 56.2 | 1.2 | 41.7 | 55.5 | 2.8 |
| 15 | 41.0 | 55.0 | 4.0 | 40.1 | 53.7 | 6.2 |
| 20 | 39.8 | 52.2 | 8.0 | 37.7 | 51.5 | 10.8 |
| 25 | 36.1 | 47.4 | 16.5 | 35.1 | 48.9 | 16.1 |
| 30 | 35.7 | 44.6 | 19.7 | 32.1 | 45.8 | 22.1 |
| 35 | 32.5 | 41.4 | 26.1 | 29.1 | 42.5 | 28.4 |
| 40 | 30.1 | 36.6 | 33.3 | 26.0 | 39.1 | 34.9 |
| 45 | 26.9 | 28.9 | 44.2 | 23.0 | 35.6 | 41.4 |
| 50 | 25.3 | 24.9 | 49.8 | 20.2 | 32.3 | 47.5 |
References
- Costliest U.S. Tropical Cyclones. National Center for Environmental Information. 2024. Available online: https://www.ncei.noaa.gov/access/billions/dcmi.pdf (accessed on 19 August 2024).
- Paul, S.; Ghebreyesus, D.; Sharif, H.O. Brief Communication: Analysis of the Fatalities and Socio-Economic Impacts Caused by Hurricane Florence. Geosciences 2019, 9, 58. [Google Scholar] [CrossRef]
- Drewry, K.R.; Jones, C.N.; Hayes, W.; Beighley, R.E.; Wang, Q.; Hochard, J.; Mize, W.; Fowlkes, J.; Goforth, C.; Pieper, K.J. Using Inundation Extents to Predict Microbial Contamination in Private Wells after Flooding Events. Environ. Sci. Technol. 2024, 58, 5220–5228. [Google Scholar] [CrossRef] [PubMed]
- Federal Emergency Management Agency. 4827-DR-NC Public Notice Amendment 003. 2024. Available online: http://fema.gov/disaster-federal-register-notice/4827-dr-nc-public-notice-amendment-003-0 (accessed on 4 June 2025).
- Lin, S.; Chen, S.; Rasanen, R.A.; Zhao, Q.; Chavan, V.; Tang, W.; Shanmugam, N.; Allan, C.; Braxtan, N.; Diemer, J. Landslide Prediction Validation in Western North Carolina After Hurricane Helene. Geotechnics 2024, 4, 1259–1281. [Google Scholar] [CrossRef]
- Marra, F.; Nikolopoulos, E.I.; Creutin, J.D.; Borga, M. Radar Rainfall Estimation for the Identification of Debris-Flow Occurrence Thresholds. J. Hydrol. 2014, 519, 1607–1619. [Google Scholar] [CrossRef]
- Habib, E.; Krajewski, W.F.; Ciach, G. Estimation of Rainfall Interstation Correlation. J. Hydrometeorol. 2001, 2, 621–629. [Google Scholar] [CrossRef]
- Nikolopoulos, E.I.; Borga, M.; Creutin, J.D.; Marra, F. Estimation of Debris Flow Triggering Rainfall: Influence of Rain Gauge Density and Interpolation Methods. Geomorphology 2015, 243, 40–50. [Google Scholar] [CrossRef]
- Masood, M.; Naveed, M.; Iqbal, M.; Nabi, G.; Kashif, H.M.; Jawad, M.; Mujtaba, A. Evaluation of Satellite Precipitation Products for Estimation of Floods in Data-Scarce Environment. Adv. Meteorol. 2023, 2023, 1685720. [Google Scholar] [CrossRef]
- Vieux, B.; Vieux, J. Rainfall Accuracy Considerations Using Radar and Rain Gauge Networks for Rainfall-Runoff Monitoring. J. Water Manag. Model. 2005, 13, 333–352. [Google Scholar] [CrossRef]
- NOAA Science Advisory Board Environmental Information Services Working Group (EISWG). NOAA Science Advisory Board Report on Radar Gaps. 2023. Available online: https://sab.noaa.gov/wp-content/uploads/SAB_Report_Nov2023_EISWG_Radar-Gaps-1.pdf (accessed on 15 October 2024).
- Houston, A.L.; PytlikZillig, L.M.; Walther, J.C. National Weather Service Data Needs for Short-Term Forecasts and the Role of Unmanned Aircraft in Filling the Gap: Results from a Nationwide Survey. Bull. Am. Meteorol. Soc. 2021, 102, E2106–E2120. [Google Scholar] [CrossRef]
- Wang, Z.; Zhong, R.; Lai, C.; Chen, J. Evaluation of the GPM IMERG Satellite-Based Precipitation Products and the Hydrological Utility. Atmos. Res. 2017, 196, 151–163. [Google Scholar] [CrossRef]
- Precipitation Processing System. File Specification for TRMM Products, Tropical Rainfall Measuring Mission; NASA: Washington, DC, USA, 2017. Available online: https://gpm.nasa.gov/sites/default/files/2020-02/filespec.TRMM_.V7.pdf (accessed on 15 August 2024).
- Le, H.; Sutton, J.; Bui, D.; Bolten, J.; Lakshmi, V. Comparison and Bias Correction of TMPA Precipitation Products over the Lower Part of Red–Thai Binh River Basin of Vietnam. Remote Sens. 2018, 10, 1582. [Google Scholar] [CrossRef]
- Kummerow, C.; Barnes, W.; Kozu, T.; Shiue, J.; Simpson, J. The Tropical Rainfall Measuring Mission (TRMM) Sensor Package. J. Atmos. Ocean Technol. 1998, 15, 809–817. [Google Scholar] [CrossRef]
- Huffman, G.J.; Bolvin, D.T.; Nelkin, E.J.; Wolff, D.B.; Adler, R.F.; Gu, G.; Hong, Y.; Bowman, K.P.; Stocker, E.F. The TRMM Multisatellite Precipitation Analysis (TMPA): Quasi-Global, Multiyear, Combined-Sensor Precipitation Estimates at Fine Scales. J. Hydrometeorol. 2007, 8, 38–55. [Google Scholar] [CrossRef]
- Wang, J.; Petersen, W.A.; Wolff, D.B. Validation of Satellite-Based Precipitation Products from TRMM to GPM. Remote Sens. 2021, 13, 1745. [Google Scholar] [CrossRef]
- Tan, J.; Huffman, G.J.; Bolvin, D.T.; Nelkin, E.J. IMERG V06: Changes to the Morphing Algorithm. J. Atmos. Ocean Technol. 2019, 36, 2471–2482. [Google Scholar] [CrossRef]
- Draper, D.W.; Newell, D.A.; Wentz, F.J.; Krimchansky, S.; Skofronick-Jackson, G.M. The Global Precipitation Measurement (GPM) Microwave Imager (GMI): Instrument Overview and Early On-Orbit Performance. IEEE J. Sel. Top. Appl. Earth Obs. Remote Sens. 2015, 8, 3452–3462. [Google Scholar] [CrossRef]
- Smith, E.A.; Asrar, G.; Furuhama, Y.; Ginati, A.; Mugnai, A.; Nakamura, K.; Adler, R.F.; Chou, M.-D.; Desbois, M.; Durning, J.F.; et al. International Global Precipitation Measurement (GPM) Program and Mission: An Overview. In Measuring Precipitation From Space; Springer: Dordrecht, The Netherlands, 2007; pp. 611–653. [Google Scholar] [CrossRef]
- Pradhan, R.K.; Markonis, Y.; Vargas Godoy, M.R.; Villalba-Pradas, A.; Andreadis, K.M.; Nikolopoulos, E.I.; Papalexiou, S.M.; Rahim, A.; Tapiador, F.J.; Hanel, M. Review of GPM IMERG Performance: A Global Perspective. Remote Sens. Environ. 2022, 268, 112754. [Google Scholar] [CrossRef]
- Kidd, C.; Levizzani, V. Status of Satellite Precipitation Retrievals. Hydrol. Earth Syst. Sci. 2011, 15, 1109–1116. [Google Scholar] [CrossRef]
- Berg, W.; Bilanow, S.; Chen, R.; Datta, S.; Draper, D.; Ebrahimi, H.; Farrar, S.; Jones, W.L.; Kroodsma, R.; McKague, D.; et al. Intercalibration of the GPM Microwave Radiometer Constellation. J. Atmos. Ocean Technol. 2016, 33, 2639–2654. [Google Scholar] [CrossRef]
- Tan, J.; Huffman, G.J. Computing Morphing Vectors for Version 06 IMERG. NASA/GSFC Code 612, 9p. Available online: https://gpm.nasa.gov/sites/default/files/2020-10/MorphingInV06IMERG_201006.pdf (accessed on 19 August 2024).
- Joyce, R.J.; Xie, P. Kalman Filter–Based CMORPH. J. Hydrometeorol. 2011, 12, 1547–1563. [Google Scholar] [CrossRef]
- Sutton, J.R.P.; Kirschbaum, D.; Stanley, T.; Orland, E. Evaluating Precipitation Events Using GPM IMERG 30-Minute Near-Real-Time Precipitation Estimates. J. Hydrometeorol. 2024, 25, 991–1006. [Google Scholar] [CrossRef]
- Turk, F.J.; Arkin, P.; Sapiano, M.R.P.; Ebert, E.E. Evaluating High-Resolution Precipitation Products. Bull. Am. Meteorol. Soc. 2008, 89, 1911–1916. [Google Scholar] [CrossRef]
- Gebregiorgis, A.S.; Kirstetter, P.; Hong, Y.E.; Gourley, J.J.; Huffman, G.J.; Petersen, W.A.; Xue, X.; Schwaller, M.R. To What Extent Is the Day 1 GPM IMERG Satellite Precipitation Estimate Improved as Compared to TRMM TMPA-RT? J. Geophys. Res. Atmos. 2018, 123, 1694–1707. [Google Scholar] [CrossRef]
- Huffman, G.J.; Bolvin, D.T.; Nelkin, E.J.; Tan, J. Integrated Multi-SatellitE Retrievals for GPM (IMERG) Technical Documentation. NASA/GSFC Code 612, 83p. Available online: https://gpm.nasa.gov/sites/default/files/2020-10/IMERG_doc_201006.pdf (accessed on 1 October 2024).
- Skofronick-Jackson, G.; Kirschbaum, D.; Petersen, W.; Huffman, G.; Kidd, C.; Stocker, E.; Kakar, R. The Global Precipitation Measurement (GPM) Mission’s Scientific Achievements and Societal Contributions: Reviewing Four Years of Advanced Rain and Snow Observations. Q. J. R. Meteorol. Soc. 2018, 144, 27–48. [Google Scholar] [CrossRef] [PubMed]
- Tang, G.; Clark, M.P.; Papalexiou, S.M.; Ma, Z.; Hong, Y. Have Satellite Precipitation Products Improved over Last Two Decades? A Comprehensive Comparison of GPM IMERG with Nine Satellite and Reanalysis Datasets. Remote Sens. Environ. 2020, 240, 111697. [Google Scholar] [CrossRef]
- Huffman, G.J.; Bolvin, D.T.; Joyce, R.; Nelkin, E.J.; Tan, J.; Braithwaite, D.; Hsu, K.; Kelley, O.A.; Nguyen, P.; Sorooshian, S.; et al. NASA Global Precipitation Measurement (GPM) Integrated Multi-SatellitE Retrievals for GPM (IMERG) Version 07; NASA/GSFC: Greenbelt, MD, USA, 2023. Available online: http://disc.sci.gsfc.nasa.gov/ (accessed on 18 August 2024).
- Ramadhan, R.; Marzuki, M.; Suryanto, W.; Sholihun, S.; Yusnaini, H.; Muharsyah, R. Validating IMERG Data for Diurnal Rainfall Analysis across the Indonesian Maritime Continent Using Gauge Observations. Remote Sens. Appl. 2024, 34, 101186. [Google Scholar] [CrossRef]
- Huffman, G.J.; Bolvin, D.T.; Joyce, R.; Kelley, O.A.; Nelkin, E.J.; Portier, A.; Stocker, E.F.; Tan, J.; Watters, D.C.; West, B.J. IMERG V07 Release Notes. NASA/GSFC Code 612, 23p. Available online: https://gpm.nasa.gov/sites/default/files/2024-02/IMERG_V07_ReleaseNotes_240221.pdf (accessed on 1 August 2024).
- Nguyen, P.; Ombadi, M.; Gorooh, V.A.; Shearer, E.J.; Sadeghi, M.; Sorooshian, S.; Hsu, K.; Bolvin, D.; Ralph, M.F. PERSIANN Dynamic Infrared–Rain Rate (PDIR-Now): A Near-Real-Time, Quasi-Global Satellite Precipitation Dataset. J. Hydrometeorol. 2020, 21, 2893. [Google Scholar] [CrossRef] [PubMed]
- Tan, J.; Huffman, G.J.; Bolvin, D.T.; Nelkin, E.J.; Rajagopal, M. SHARPEN: A Scheme to Restore the Distribution of Averaged Precipitation Fields. J. Hydrometeorol. 2020, 22, 2105–2116. [Google Scholar] [CrossRef]
- Huffman, G.J.; Bolvin, D.T.; Joyce, R.; Kelley, O.A.; Nelkin, E.J.; Tan, J.; Watters, D.C.; West, B.J. Integrated Multi-SatellitE Retrievals for GPM (IMERG) Technical Documentation. 2023; NASA/GSFC Code 612, 97p. Available online: https://gpm.nasa.gov/sites/default/files/2023-07/IMERG_TechnicalDocumentation_final_230713.pdf (accessed on 2 October 2024).
- Wang, Y.; You, Y.; Kulie, M. Global Virga Precipitation Distribution Derived From Three Spaceborne Radars and Its Contribution to the False Radiometer Precipitation Detection. Geophys. Res. Lett. 2018, 45, 4446–4455. [Google Scholar] [CrossRef]
- Fan, N.; Lin, X.; Guo, H. An Analysis for the Applicability of Global Precipitation Measurement Mission (GPM) IMERG Precipitation Data in Typhoons. Atmosphere 2023, 14, 1224. [Google Scholar] [CrossRef]
- Bartuska, E.; Beighley, R.E. Assessing Precipitation Event Characteristics throughout North Carolina Derived from GPM IMERG Data Products. Front. Water 2024, 6, 1296586. [Google Scholar] [CrossRef]
- Chen, M.; Nabih, S.; Brauer, N.S.; Gao, S.; Gourley, J.J.; Hong, Z.; Kolar, R.L.; Hong, Y. Can Remote Sensing Technologies Capture the Extreme Precipitation Event and Its Cascading Hydrological Response? A Case Study of Hurricane Harvey Using EF5 Modeling Framework. Remote Sens. 2019, 12, 445. [Google Scholar] [CrossRef]
- Shi, J.; Yuan, F.; Shi, C.; Zhao, C.; Zhang, L.; Ren, L.; Zhu, Y.; Jiang, S.; Liu, Y. Statistical Evaluation of the Latest GPM-Era IMERG and GSMaP Satellite Precipitation Products in the Yellow River Source Region. Water 2020, 12, 1006. [Google Scholar] [CrossRef]
- Derin, Y.; Kirstetter, P.-E.; Brauer, N.; Gourley, J.J.; Wang, J. Evaluation of IMERG Satellite Precipitation over the Land–Coast–Ocean Continuum. Part II: Quantification. J. Hydrometeorol. 2022, 23, 1297–1314. [Google Scholar] [CrossRef]
- Sun, W.; Sun, Y.; Li, X.; Wang, T.; Wang, Y.; Qiu, Q.; Deng, Z. Evaluation and Correction of GPM IMERG Precipitation Products over the Capital Circle in Northeast China at Multiple Spatiotemporal Scales. Adv. Meteorol. 2018, 2018, 4714173. [Google Scholar] [CrossRef]
- Guo, H.; Tian, Y.; Li, J.; Guo, C.; Meng, X.; Wang, W.; De Maeyer, P. Has IMERG_V07 Improved the Precision of Precipitation Retrieval in Mainland China Compared to IMERG_V06? Remote Sens. 2024, 16, 2671. [Google Scholar] [CrossRef]
- Lyu, X.; Li, Z.; Li, X. Evaluation of GPM IMERG Satellite Precipitation Products in Event-Based Flood Modeling over the Sunshui River Basin in Southwestern China. Remote Sens. 2024, 16, 2333. [Google Scholar] [CrossRef]
- Wang, Y.; Li, Z.; Gao, L.; Zhong, Y.; Peng, X. Comparison of GPM IMERG Version 06 Final Run Products and Its Latest Version 07 Precipitation Products across Scales: Similarities, Differences and Improvements. Remote Sens. 2023, 15, 5622. [Google Scholar] [CrossRef]
- Zhu, S.; Li, Z.; Chen, M.; Wen, Y.; Gao, S.; Zhang, J.; Wang, J.; Nan, Y.; Ferraro, S.C.; Tsoodle, T.E.; et al. How Has the Latest IMERG V07 Improved the Precipitation Estimates and Hydrologic Utility over CONUS against IMERG V06? J. Hydrol. 2024, 645, 132257. [Google Scholar] [CrossRef]
- Yamazaki, D.; Ikeshima, D.; Sosa, J.; Bates, P.D.; Allen, G.H.; Pavelsky, T.M. MERIT Hydro: A High-Resolution Global Hydrography Map Based on Latest Topography Dataset. Water Resour. Res. 2019, 55, 5053–5073. [Google Scholar] [CrossRef]
- Zhou, Y.; Nelson, K.; Mohr, K.I.; Huffman, G.J.; Levy, R.; Grecu, M. A Spatial-Temporal Extreme Precipitation Database from GPM IMERG. J. Geophys. Res. Atmos. 2019, 124, 10344–10363. [Google Scholar] [CrossRef]
- Kehoe, J.; Raman, S.; Boyles, R. Characteristics of Landfalling Tropical Cyclones in North Carolina. Mar. Geod. 2010, 33, 394–411. [Google Scholar] [CrossRef]
- Kunkel, K.E.; Easterling, D.R.; Ballinger, A.; Bililign, S.; Champion, S.M.; Corbett, D.R.; Dello, K.D.; Dissen, J.; Lackmann, G.M.; Luettich, R.A., Jr.; et al. North Carolina Climate Science Report. North Carolina Institute for Climate Studies. 2020. Available online: https://ncics.org/wp-content/uploads/2020/10/NC_Climate_Science_Report_Findings_ExecSummary_Final_revised_September2020.pdf (accessed on 15 October 2024).
- Menne, M.J.; Durre, I.; Vose, R.S.; Gleason, B.E.; Houston, T.G. An Overview of the Global Historical Climatology Network-Daily Database. J. Atmos. Ocean Technol. 2012, 29, 897–910. [Google Scholar] [CrossRef]
- Pendergrass, A.G. What Precipitation Is Extreme? Science 2018, 360, 1072–1073. [Google Scholar] [CrossRef] [PubMed]
- Yin, C.; Wang, J.; Yu, X.; Li, Y.; Yan, D.; Jian, S. Definition of Extreme Rainfall Events and Design of Rainfall Based on the Copula Function. Water Resour. Manag. 2022, 36, 3759–3778. [Google Scholar] [CrossRef]
- Gimeno, L.; Sorí, R.; Vázquez, M.; Stojanovic, M.; Algarra, I.; Eiras-Barca, J.; Gimeno-Sotelo, L.; Nieto, R. Extreme Precipitation Events. WIREs Water 2022, 9, e1611. [Google Scholar] [CrossRef]
- Wan, Z.; Hook, S.; Hulley, G. MODIS/Terra Land Surface Temperature/Emissivity 8-Day L3 Global 6km SIN Grid V061 [Data Set]; NASA Land Processes Distributed Active Archive Center: Sioux Falls, SD, USA, 2021. [CrossRef]
- Fenneman, N.M.; Johnson, D.W. Physiographic Divisions of the Conterminous U. S.; U.S. Geologic Survey: Reston, VA, USA, 2023. [CrossRef]
- Bonnin, G.M.; Martin, D.; Lin, B.; Parzybok, T.; Yekta, M.; Riley, D. NOAA Atlas 14 Precipitation-Frequency Atlas of the United States; U.S. Department of Commerce: Silver Spring, MD, USA, 2004. Available online: https://www.weather.gov/media/owp/oh/hdsc/docs/Atlas14_Volume2.pdf (accessed on 5 May 2025).
- do Nascimento, A.C.L.; Galvani, E.; Gobo, J.P.A.; Wollmann, C.A. Comparison between Air Temperature and Land Surface Temperature for the City of São Paulo, Brazil. Atmosphere 2022, 13, 491. [Google Scholar] [CrossRef]
- Naserikia, M.; Hart, M.A.; Nazarian, N.; Bechtel, B.; Lipson, M.; Nice, K.A. Land Surface and Air Temperature Dynamics: The Role of Urban Form and Seasonality. Sci. Total Environ. 2023, 905, 167306. [Google Scholar] [CrossRef] [PubMed]
- Callaghan, J. Extreme Rainfall and Flooding from Hurricane Florence. Trop. Cyclone Res. Rev. 2020, 9, 172–177. [Google Scholar] [CrossRef]
- Roberson, M.W.; Bell, A.E.; Roberson, L.; Walker, T.A. Geospatial Analytics of Hurricane Florence Flooding Effects Using Overhead Imagery. In Proceedings of the Geospatial Informatics IX, Baltimore, MD, USA, 15–16 April 2019; Palaniappan, K., Seetharaman, G., Doucette, P.J., Eds.; SPIE: Bellingham, WA, USA, 2019; p. 8. [Google Scholar] [CrossRef]
- Kunkel, K.E.; Champion, S.M. An Assessment of Rainfall from Hurricanes Harvey and Florence Relative to Other Extremely Wet Storms in the United States. Geophys. Res. Lett. 2019, 46, 13500–13506. [Google Scholar] [CrossRef]
- Dao, V.; Arellano, C.J.; Nguyen, P.; Almutlaq, F.; Hsu, K.; Sorooshian, S. Bias Correction of Satellite Precipitation Estimation Using Deep Neural Networks and Topographic Information Over the Western U.S. J. Geophys. Res. Atmos. 2025, 130, e2024JD042181. [Google Scholar] [CrossRef]
- Wang, X.; Xu, M.; Kang, S.; Li, X.; Han, H.; Li, X. Comprehensive Applicability Evaluation of Four Precipitation Products at Multiple Spatiotemporal Scales in Northwest China. J. Arid Land 2024, 16, 1232–1254. [Google Scholar] [CrossRef]
- Burkhartt, M. Hurricane Florence Hits Coast with Heavy Rain, Storm Surge. Citizen Times, 16 September 2018. Available online: https://www.citizen-times.com/picture-gallery/news/local/2018/09/11/incoming-hurricane-florence-forces-evacuations-and-preparation/1264595002/ (accessed on 22 April 2025).
- Bartuska, E. Quantifying Improvements in Derived Storm Events from Version 7 of GPM IMERG. 2025. Available online: http://www.hydroshare.org/resource/b34b47a11a744651878954e56129309a (accessed on 4 February 2025).
Disclaimer/Publisher’s Note: The statements, opinions and data contained in all publications are solely those of the individual author(s) and contributor(s) and not of MDPI and/or the editor(s). MDPI and/or the editor(s) disclaim responsibility for any injury to people or property resulting from any ideas, methods, instructions or products referred to in the content. |
© 2025 by the authors. Licensee MDPI, Basel, Switzerland. This article is an open access article distributed under the terms and conditions of the Creative Commons Attribution (CC BY) license (https://creativecommons.org/licenses/by/4.0/).